2- metamorphic evolution of the sa’al–zaghra complex in sinai
TRANSCRIPT

ME
Ma
b
c
d
e
f
a
ARR2AA
KSLSAGR
1
lEwG7HccHoioca
0h
Precambrian Research 241 (2014) 104– 128
Contents lists available at ScienceDirect
Precambrian Research
journa l h om epa ge : www.elsev ier .com/ locate /precamres
etamorphic evolution of the Sa’al–Zaghra Complex in Sinai:vidence for Mesoproterozoic Rodinia break-up?
. Hassana,e,f,∗, T.S. Abu-Alama,b,e, K. Stüwea, A. Fowlerc, I. Hassend
Institut für Erdwissenschaften, Universität Graz, Universitätsplatz 2, A-8010 Graz, AustriaGeology Department, Faculty of Science, Tanta University, Tanta, EgyptGeology Department, Faculty of Science, United Arab Emirates University, United Arab EmiratesSciences Department, College of Basic Education, PAAET, KuwaitEgyptian Institute of Geodynamic, Cairo, EgyptGeology Department, Faculty of Science, Suez Canal University, Ismailia, Egypt
r t i c l e i n f o
rticle history:eceived 14 March 2013eceived in revised form5 November 2013ccepted 28 November 2013vailable online 7 December 2013
eywords:a’al–Zaghraow-grade metamorphism
a b s t r a c t
Recently published age data indicate that the Sa’al–Zaghra metamorphic complex in Sinai, Egypt con-tains the oldest rocks found in the northernmost Arabian-Nubian Shield, preserving evidence for a1110–1030 Ma rift-related volcanic system formed during Rodinia break-up (Be’eri-Shlevin et al., 2012).As such, its metamorphic evolution provides evidence for an important part of the geological historyof the shield. Here we use petrographic, mineral chemistry and thermodynamic modeling, in combi-nation with structural data from the field, to derive a P–T–D–t path for the complex. It is shown thatthe metamorphic rock of the complex equilibrated during an early deformation event that involves aflat lying fabric and is interpreted as an extensional event. P–T conditions attained during this eventare between 370–420 ◦C and around 3 kbar. These conditions correspond to a geothermal gradient of
◦
inairabian-Nubian Shieldondwana collisionodinia38–41 C/km which is much higher than that documented elsewhere in the metamorphic complexesof Sinai (i.e. 25–27 ◦C/km). We suggest that this is because metamorphism in the Sa’al–Zaghra complexrecords an earlier stage of metamorphism and deformation during breakup of Rodinia, whereas the lowergradients documented elsewhere is related to the Gondwana collision. During the subsequent East-West-Gondwana collision, the Sa’al–Zaghra complex remained at shallow crustal levels (<9 km), and therefore
al me
it escaped the deep crust. Introduction
The Arabian-Nubian Shield is considered to be one of theargest exposures of Neoproterozoic juvenile continental crust onarth (Patchett and Chase, 2002; Stern et al., 2004). The shieldas cratonized during the collision between East- and West-ondwana following the closure of the Mozambique Ocean around50–630 Ma (Stern, 1994; Cox et al., 2011; Abu-Alam et al., 2013).owever, there have been reports of older (Pre-Pan-African)rustal material that exists as reworked fragments of an earlierontinent, namely Rodinia (Johnson and Woldehaimanot, 2003;argrove et al., 2006). Today, the shield includes vast sequencesf oceanic rocks and is pervasively intruded by late stage gran-tes, but metamorphic rocks of apparently continental origin do
ccur. Typically, these metamorphic rocks are high-grade gneissomplexes that are exhumed from underneath the oceanic rockslong crustal scale shear zones (Abu-Alam et al., 2013), but some∗ Corresponding author. Tel.: +43 3163805680.E-mail address: [email protected] (M. Hassan).
301-9268/$ – see front matter © 2013 Elsevier B.V. All rights reserved.ttp://dx.doi.org/10.1016/j.precamres.2013.11.013
tamorphism of the Pan-African event.© 2013 Elsevier B.V. All rights reserved.
metamorphic complexes differ in that they are much lower gradeand potentially much older. The Sa’al–Zaghra complex in centralSinai peninsula, Egypt is one of these.
This study investigates the metamorphic evolution of theSa’al–Zaghra complex of Sinai to constrain its metamorphic evolu-tion. The complex is one of four metamorphic complexes exposedin the Sinai Peninsula (Fig. 1). Be’eri-Shlevin et al. (2012) providedU–Th–Pb data of 1.02–1.03 Ga for the metavolcanics and maficintrusions from the Sa’al–Zaghra complex. These data suggest thatthe geology of the complex may bear information on the connec-tion between the latest Mesoproterozoic fragmentation of Rodiniaand the later buildup of Gondwana. As such, the Sa’al–Zaghra com-plex may hold a key position for the early stages of the tectonicevolution of the Arabian-Nubian shield.
This study investigates the metamorphic evolution of theSa’al–Zaghra complex in order to constrain the metamorphic con-ditions associated with what may prove to be the first deformation
event in the history of the Arabian-Nubian Shield. A mineralequilibria approach is used with petrogenetic pseudosections. Ourderived metamorphic conditions are then correlated with indepen-dent field evidence and existing geochronological ages from the
M. Hassan et al. / Precambrian Research 241 (2014) 104– 128 105
N
Zaghraformation
El-Rayan formation
2km
28º 39´
(b)
34º 04´
El-Fringametagabbro
Agramyia formation
Syn- and post-tectonic granitoids
39º
24º
28º
Red Sea
Hafafit
Meatiq
Sibai
Kid
TabaSa'al
Feiran-Solaf
Qazaz
HamadatWajiyah
MarsaAlam
Hurghada
Quseir
Jiddah
Arabian-Nubian Shield
(a)
36º33º
Gneiss complexStrike-slip
East-Africanvolcanic system
N
Arabian-Nubian Shield
F , the( ay notS l., 199
STt
2
vta2ToSaEm(
aeMtcTEt(Adu
mtvdEit
ig. 1. (a) Geometry of the Arabian-Nubian Shield showing the volcanic-arc systemmodified after Abu-Alam and Stüwe, 2009). Sinai is shown in white indicating it mimplified geological map of the Sa’al–Zaghra complex (modified after Shimron et a
a’al–Zaghra complex and other complexes elsewhere in the shield.he results are discussed in the context of the tectonic evolution ofhe Arabian-Nubian Shield.
. Geological setting and lithologies
The Arabian-Nubian Shield is mostly composed of low-gradeolcano-sedimentary associations referred to as arc-assemblagehat contain some metamorphic complexes in between this arc-ssemblage (e.g. Meatiq and Migif-Hafafit; Fritz et al., 1996, 2000,002) (Fig. 1). In Sinai four such complexes are known: Kid,aba, Feiran–Solaf and Sa’al–Zaghra with the former three beingf amphibolite and granulite facies metamorphic grade and thea’al–Zaghra being much lower grade. The arc-assemblage is char-cterized by brittle-ductile deformation (Noweir et al., 2006; Abdl-Wahed and Kamh, 2010; Johnson et al., 2011) that meta-orphosed at lower greenschist facies metamorphic conditions
Noweir et al., 2006; Abu-Alam et al., unpublished data).The evolution of the Arabian-Nubian Shield probably involved
t least four main deformation events (Sultan, 2003; Hegazit al., 2004; Fowler and Hassen, 2008; Fowler et al., 2010a,b;oghazi et al., 2012). D1 deformation phase is synchronous with
he prograde metamorphism in both Kid and Taba metamorphicomplexes and D2 occurs during peak metamorphism in bothaba and Kid complexes (Abu El-Enen et al., 2003a,b; Abu El-nen et al., 2004; Eliwa et al., 2004; Abu El-Enen, 2008). Forhe Feiran–Solaf metamorphic complex, the deformation eventsD2–D4) have been correlated with other parts of the shield (Abu-lam and Stüwe, 2009; Abu-Alam et al., 2010), but the firsteformation event D1 and its relevance for the shield are not wellnderstood.
The Sa’al–Zaghra complex of southern Sinai (Fig. 1) includesainly low-grade metamorphosed volcano-sedimentary associa-
ions referred to as the “Sa’al Group” that are surrounded by largeolumes of syn- and post-tectonic granites. The Sa’al Group is
ivided into three formations (Shimron et al., 1993) (Fig. 2). (a)l-Rayan Formation occupies a rugged terrain extending ENE-WSWn the northern part of the complex. The El-Rayan Formation inhe west consists of a thickly layered sequence of basaltic andesiteamphibolite facies gneiss complexes, Najd Fault system and sutures of the shield have been exclusively part of the Arabian-Nubian Shield during the formation. (b)3; Fowler, unpublished data).
and andesite at its base, followed by layered felsic tuffs, rhyolitelava flows, rhyolite crystal tuffs and ash tuffs. In the eastern partof Wadi Sa’al, it is represented by layered felsic tuffs. In the cen-tral upper part of the complex, around the junction of Wadi Sa’aland Wadi El-Rayan, there were wide exposure of phyllite extendingnorthward (Fig. 3a).
(b) Agramyia Formation occupies the central part of the belt andis dominated by volcano-sedimentary rocks (Fig. 2). It is composedof a ∼2300 m thick interbedded sequence of tuffs and lapili tuffs(Fig. 3b) succeeded by rhyolitic ignimbrite (Fig. 3c) intercalatedwith fine tuffs, other pyroclastics and sedimentary beds of silt-stone, sandstone, and conglomerates with some sheets and layersof andesitic lava (Shimron et al., 1993). (c) Finally, Zaghra Forma-tion in the south of the belt is composed of conglomerates (Fig. 3d),sandstones, slates with minor calc-silicates bands, metamorphosedvolcanogenic litharenite and arkoses. There is a localized zone ofconcordant, foliated red granite sheets intruded along the sand-stone and slate bands of Zaghra Formation (Fig. 3e). These threeformations are separated by two steep ENE-WSW trending thrusts.
The Sa’al–Zaghra area has been intruded by intrusive rocksranging in the composition from gabbro, diorites, granodioriteto alkali-granites that cross-cut the foliation. A NW–SE strikinggabbro-diorite complex “El-Fringa metagabbro” intruded the phyl-lite and metavolcanics of El-Rayan Formation in the NW part of themapped area (Fig. 2). Minor gabbroic intrusions are also found else-where in the complex. Quartz-diorites crop out at the eastern side ofthe study area have crystallization age of 819 ± 4 Ma (Be’eri-Shlevinet al., 2012). These rocks are rich in amphiboles, coarse-grained,dark gray in color and enclose xenoliths (metasediments, metavol-canics and metagabbro) up to 1 m long. Granodiorite which cropsout in the central and southwestern sectors of the area is light gray,coarse-grained and has plagioclase with amphiboles and quartz andencloses abundant ovoid enclaves and elongated xenoliths of olderrock types (Fig. 3f). Similar granodiorite to the east of Feiran–Solafcomplex gives a U–Pb zircon age of 782 ± 7 Ma (Stern and Manton,
1987). Alkali-granite is exposed in the central and the westernpart of the map area and has a Pan-African age (635–580 Ma; Eyalet al., 2010). Biotite granite intrudes and shares sharp contacts withthe quartz-diorite and the granodiorites. Weak deformation can be
106 M. Hassan et al. / Precambrian Research 241 (2014) 104– 128
F st plae meta
oc
cvScain
3
plpdeao
ig. 2. Geological map of the Sa’al–Zaghra complex. Thick lines are faults and thrut al. (2012) are shown as stars. Dashed line outlines the region where higher grade
bserved in these intrusive only at their contact with the metavol-anics and metasediments of the Sa’al–Zaghra complex.
Post-tectonic dykes and sills form local swarms of variousomposition, grain-size, thickness, and trends. They dissect theolcano-sedimentary succession and the intrusive rocks of thea’al–Zaghra complex (Fig. 3g). Similar dykes in the Feiran–Solafomplex yield Rb–Sr age of 591 ± 9 Ma (Stern and Manton, 1987)nd are affected by later NNE trending faults. Phanerozoic sed-ments cover the metavolcanics and the phyllitic rocks in theorthern part of the Sa’al–Zaghra Complex.
. Structural evolution
Structurally, the Sa’al–Zaghra complex shows evidence for threehases of deformation (Fowler et al., unpublished data). The ear-
iest structures are locally well-developed foliations (S1) that liearallel to layering. The S1 foliation (well seen in Fig. 3e) is best
eveloped in El-Rayan Formation phyllites and schists but are alsovident in the volcanics of Agramiya Formation and the conglomer-tes of Zaghra Formation. The foliation is accompanied by a NW–SEriented stretching lineation defined by stretched objects (lithicnes. Samples locations are shown as circles, while dated samples of Be’eri-Shlevinmorphic rocks were found.
particles and porphyroblasts) in the S1 foliation planes. The foli-ation is overprinted by all later folding especially as kink foldsthat pass directly into more rounded D2 and D3 mesoscopic folds.The S1 foliations are clearly the earliest tectonic structures in theSa’al–Zaghra complex.
Measurements of strain using folded quartz veins on the meso-scopic and microscopic scale show shortenings normal to S1 ofat least −50% in El-Rayan phyllites (Figs. 3h and 4a). This is alsoreflected in the boudinage of quartz veins and dykes along theS1 foliations. Even higher strains are associated with metamor-phosed pyroclastics at Wadi Mughafa (see Fig. 2) where deformedlapilli particles give RXZ values up to 15, which correspond to −75%shortening normal to S1 and 285% extension in a NW–SE direc-tion, assuming no dilatation. The fact that the S1 foliation is parallelto bedding is interpreted that S1 formed while the beds wereoriginally horizontal. This means that the maximum shorteningstrain was vertical and (together with the stretching lineation) the
maximum extension was NW–SE. Vertical shortening and horizon-tal extension are consistent with D1 extensional tectonic setting.These foliations clearly predated any significant folding in thearea.
M. Hassan et al. / Precambrian Research 241 (2014) 104– 128 107
Fig. 3. Representative field photographs of the Sa’al–Zaghra complex. (a) Biotite phenocrysts in wide phyllite exposure at junction of Wadi Sa’al and Wadi El-Rayan. (b)Pumicious agglomerate in thick interbedded sequence of tuffs and lapili tuffs. (c) Large extended rhyolitic ignimbrite sequence in Agramyia Formation. (d) Metaconglomeratesas representative beds of Zaghra Formation. (e) Primary bedding parallel to foliation invaded by thin sheets of red granites. (f) Metasedimentary enclaves of the Sa’al–Zaghracomplex in later intruded granodiorite. (g) Post-tectonic dykes swarms dissect intrusive rocks of the Sa’al–Zaghra complex. (h) Abundant folded quartz veins with the foliationas axial plane as a result of vertical shortening.

1 an Res
f(tttaac
EbRSFratectta
Nstkf
4
lcaa(mga
ie5nagaip
gaoMsgpg
mvs((
08 M. Hassan et al. / Precambri
The existence of an earliest extensional deformation pre-datingolding of beds is similar to that described by Fowler and Hassen2008) for the Feiran–Solaf metamorphic complex. In both caseshe bulk strain consisted of vertical shortening, with extension inhe plane of the foliation, principally in the NW–SE direction. Inhe Feiran–Solaf metamorphic complex, Fowler and Hassen (2008)rgued for a continental rift setting for the Feiran gneisses, andgainst other extensional tectonic settings, such as gravitationalollapse, core complex or mantled gneiss dome.
The second deformation event D2 is mainly represented byNE–WSW trending folds associates with thrusting. Discordancesetween thrust planes and bedding planes are common. In El-ayan Formation, D2 is mainly recorded in folds with localizedSE-ward thrusting contemporaneous with intrusion of the El-iringa metagabbro along the thrust planes. The D2 event is aesult of NW–SE shortening which was partitioned between foldingnd thrusting. El-Rayan Formation phyllites show open ENE–WSWrending F2 folds that pass into more common F2 kink fold geom-try. The thick volcanic units in the center of the Sa’al–Zaghraomplex (Agramiya Formation) show minimal D2 folding, whereashe thinner layered units in the SE of the complex (Zaghra Forma-ion) show common mesoscopic F2 folds. There are generally noxial planar foliation associated with F2 folds.
The third deformation event D3 is represented mainly by N–S toW–SE trending steeply plunging open folds as a result of NE–SW
hortening. The F2 folds are overprinted by this phase, and haveheir axial planes and hinges deformed by the D3 deformation. F3ink folds are found in El-Rayan Formation phyllites. These kinkolds overprint the earlier F2 kink folds.
. Petrography
The Sa’al metamorphic complex is generally known for beingargely composed of low-grade (greenschist facies) metavol-anic and metasedimentary rocks. However, some rocks ofmphibolite facies are also present. Low-grade metamorphicssemblages are found in both main types of metavolcanic rocksmafic-intermediate and felsic) and also in the majority of the
etasedimentary rocks. In contrast, rocks of amphibolite faciesrade are only found in felsic metapyroclastic rocks in a limitedrea near Wadi Muqafa (Fig. 2).
The low-grade mafic-intermediate metavolcanics are character-zed by uniform primary texture of interlocking plagioclase laths oruhedral (0.8 mm in length) plagioclase phenocrysts (Figs. 4b anda). The groundmass is made up of fine-grained plagioclase, acti-olite needles, chlorite, biotite, opaques and/or sphene (Figs. 4cnd 5b). Clinozoisite granules concentrate at the plagioclase mar-ins. There are amygdales filled by polycrystalline quartz. Quartznd epidote veinlets may be found. The foliation, where present,s defined by the preferred orientation of chlorite, biotite and inlaces actinolite.
The felsic metavolcanics are represented as thinly banded low-rade meta-tuffs or flow banded lava composed mainly of quartznd plagioclase phenocrysts (up to 3 mm) with a groundmassf finer quartz, fine lamellar-twinned plagioclase and K-feldspar.icas define a weak foliation in addition to specks of chlorite and
ericite. Granules of clinozoisite and small secondary plagioclaserains are common. Ignimbrites have well preserved plagioclasehenocrysts that are overgrown by microcline. There are also fine-rained lithic particles rich in opaques.
Low-grade metasedimentary rocks are commonly metapsam-ites that contain ellipsoidal, rather angular quartz grains with
ariable grain size (less than 1 mm in diameter) and detritalericitized plagioclase and microcline grains in addition to micaFig. 5c). Foliation is defined by substantial amounts of fine-grainedless than 0.3 mm) biotite, white mica, clinozoisite, chlorite and
earch 241 (2014) 104– 128
amphiboles (Fig. 4d). Important is the occurrence of up to 1 mmsized aggregates of fine-grained mica are interpreted as alterationproducts replacing former cordierite porphyroblasts (Fig. 5d).Opaque granules are found as porphyroclasts or tiny grains alonggrain boundaries. In some places, the metasedimentary rockscontain minor impure carbonate interlayers within the metap-sammites. In these metacarbonates, a calcsilicate assemblage ofepidote, garnet and diopside occurs (Fig. 5e).
Amphibolite facies assemblages were found only in some rocksof Zaghra Formation, in particular near Wadi Muqafa (dashed linein Fig. 2). In this area, rocks of pelitic bulk composition have a por-phyroblastic texture with andalusite or garnet porphyroblasts. Insample 215b (Figs. 4e and 5f), garnet porphyroblasts (up to 2 mm)lie randomly within a foliated groundmass made of muscovite,chlorite, albite, K-feldspar and quartz (0.1 mm). The porphyroblastscontain inclusions of quartz and muscovite. These inclusions areoriented parallel to the external foliation indicating post-tectonicorigin of the porphyroblasts. In sample 273a (Fig. 5g), anhedralandalusite porphyroblasts (less than 1 mm) have grown over a foli-ated matrix of biotite, muscovite, plagioclase, K-feldspar and quartz(up to 0.2 mm) also indicating a post-tectonic origin for the porphy-roblasts. It is worth mentioning that small euhedral to subhedralsillimanite crystals (0.2 mm in length) grow obliquely to the foli-ation and surrounding the andalusite porphyroblasts (Figs. 4f and5h). A rim of muscovite surrounds the alumino silicates and sepa-rates them from the biotite in the groundmass. K-feldspar grains incontact with the muscovite and andalusite porphyroblasts are finerthan the feldspar and quartz grains of the groundmass. Muscoviteand quartz inclusions can be found in the porphyroblasts.
In summary, we conclude that there is low-grade equilibriumassemblage of actinolite, chlorite, feldspar, clinozoisite, opaquesand quartz for the metavolcanic rocks, in addition to mica in themetasedimentary rocks. Thin section studies show that the S1 foli-ation is defined by metamorphic layer silicates chlorite, muscoviteand biotite. Pressure shadows adjacent to resistant lithic particlesand phenocrysts are also filled with these metamorphic phases.Brittly segmented grains are healed by fibrous growths of thesemetamorphic phases. The S1 foliation thus formed during the mainmetamorphic event in the area that we term M1.
The apparently higher grade assemblages found in selectedlocations inside Zaghra Formation are made up of either (a)biotite, muscovite, feldspar and quartz forming a foliated (S1)matrix around andalusite-sillimanite porphyroblasts or (b) mus-covite, chlorite, feldspar and quartz foliated groundmass enclosinggarnet porphyroblasts. These porphyroblasts are not perceptiblydeformed and overgrow S1. The spatial association of these highertemperature assemblages with S1 foliation-concordant red gran-ite sheets that also show a tectonic gneissosity parallel to S1 isinterpreted to indicate a role of contact metamorphism in the for-mation of the higher grade phase assemblage. This higher grademetamorphism occurs either late in D1 or between D1 and D2.
5. Mineral chemistry
Mineral analyses were carried out for 27 rock samples(total 866 spot analysis) at the Institute of Earth Science, Karl-Franzens-Universität Graz, Austria, using a JEOL JSM-6310 scanningelectron microscope following standard procedures, operating inEDS/WDS mode at 5 nA beam current, accelerating voltage of15 kV and counting time of 100 s. Mineral formula were cal-culated using AX program (http://www.esc.cam.ac.uk/research/
research-groups/holland/ax) and based on 8 oxygen atoms for thefeldspar, 12 oxygen atoms for the garnet, 11 oxygen atoms andignoring H2O for mica, 23 oxygen atoms and ignoring H2O foramphiboles and 14 oxygen atoms and ignoring H2O for chlorite. The
M. Hassan et al. / Precambrian Research 241 (2014) 104– 128 109
Fig. 4. Photomicrographs of petrographic features in metavolcanic and metasedimentary rocks of the Sa’al–Zaghra complex. (a) Folded quartz veins as a result of verticalshortening. (b) Subhedral plagioclase phenocryst surrounded by fine-grained groundmass contains plagioclase, chlorite, opaques. (c) Weak foliation in the low-grade mafic-i lagiocm lasts.
o f) Sma
ma
miOs
ntermediate metavolcanics, defined by the preferred orientation of chlorite. The petasedimentary rocks. Note micas grow in the strain shadow of opaque porphyroc
f quartz oriented parallel to the external foliation indicating post-tectonic origin. (
ineral abbreviations, which will be used in the following sections,re from Holland and Powell (1998).
Plagioclase is mostly andesine in the mafic-intermediate
etavolcanic showing a small range in composition with lim-ted zonation and has Xan [Ca/(Ca + Na)] = 0.30–0.40 (Table 1).ligoclase is the dominant plagioclase in the felsic metavolcanic
howing a small range in composition and has Xan = 0.10–0.22.
lase phenocryst is slightly altered to epidote. (d) Micas define a weak foliation in(e) Garnet porphyroblast cutting the metamorphic foliation and contains inclusionsll euhedral to subhedral sillimanite crystals grow obliquely to the foliation.
In metasedimentary rocks, plagioclase composition is variableand chemical compositions of albite, oligoclase and andesinewere analyzed (Tables 2–5). Potassium feldspar is absent in the
mafic metavolcanics, abundant in the intermediate and the felsicmetavolcanics, and is the dominant feldspar in the metasedimen-tary rocks. Intrusive granitic rocks have andesine plagioclase witha small range in composition Xan = 0.26–0.44.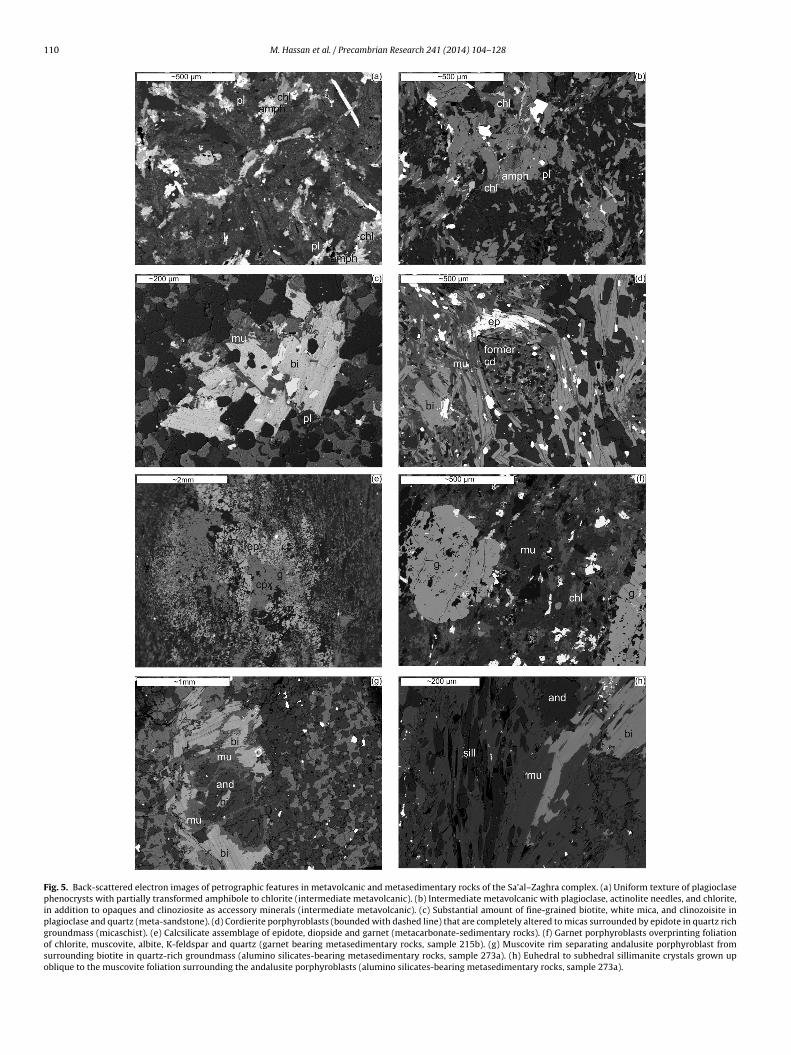
110 M. Hassan et al. / Precambrian Research 241 (2014) 104– 128
Fig. 5. Back-scattered electron images of petrographic features in metavolcanic and metasedimentary rocks of the Sa’al–Zaghra complex. (a) Uniform texture of plagioclasephenocrysts with partially transformed amphibole to chlorite (intermediate metavolcanic). (b) Intermediate metavolcanic with plagioclase, actinolite needles, and chlorite,in addition to opaques and clinoziosite as accessory minerals (intermediate metavolcanic). (c) Substantial amount of fine-grained biotite, white mica, and clinozoisite inplagioclase and quartz (meta-sandstone). (d) Cordierite porphyroblasts (bounded with dashed line) that are completely altered to micas surrounded by epidote in quartz richgroundmass (micaschist). (e) Calcsilicate assemblage of epidote, diopside and garnet (metacarbonate-sedimentary rocks). (f) Garnet porphyroblasts overprinting foliationof chlorite, muscovite, albite, K-feldspar and quartz (garnet bearing metasedimentary rocks, sample 215b). (g) Muscovite rim separating andalusite porphyroblast fromsurrounding biotite in quartz-rich groundmass (alumino silicates-bearing metasedimentary rocks, sample 273a). (h) Euhedral to subhedral sillimanite crystals grown upoblique to the muscovite foliation surrounding the andalusite porphyroblasts (alumino silicates-bearing metasedimentary rocks, sample 273a).

M.
Hassan
et al.
/ Precam
brian R
esearch 241 (2014) 104– 128
111
Table 1Representative electron microprobe analyses of mineral assemblages of the basic-intermediate metavolcanic rock samples (<0.01, calculated values less than 0.005; BDL, below detection limit).
Sample 1c1hb2a 1c1hb3 1c1hb4 1c1hb5 19s1hb2 19s2hb1 19s2hb3 19s3hb2 101hb2 101hb4a 101hb5 101hb6 199hb2 199hb1 70A2hb5 70A2hb6
SiO2 47.11 47.36 46.73 48.59 48.72 48.87 44.52 45.97 50.07 53.45 49.12 49.55 49.91 48.43 49.06 51.28TiO2 0.35 0.38 0.57 0.34 0.22 0.17 0.32 0.26 0.62 0.11 0.75 0.51 0.39 0.56 0.24 0.17Al2O3 6.23 6.94 7.02 5.27 7.03 7.06 10.60 9.85 5.43 3.59 6.33 6.00 5.97 6.94 7.73 5.10Cr2O3 0.05 0.02 0.04 0.04 BDL 0.03 0.01 0.05 0.04 0.09 0.02 0.01 0.04 0.08 0.02 0.08Fe2O3 7.02 6.84 6.85 6.07 2.45 1.48 3.82 3.99 3.46 2.55 3.44 3.17 3.31 3.43 3.61 3.15FeO 10.88 11.43 11.75 11.19 12.17 13.09 12.90 12.32 9.13 8.30 9.85 9.26 9.01 9.73 9.52 10.03MnO 0.63 0.52 0.62 0.57 0.31 0.25 0.38 0.35 0.34 0.21 0.30 0.37 0.64 0.48 0.44 0.99MgO 12.59 12.46 11.98 13.42 12.98 12.68 10.36 11.51 15.37 17.17 14.69 15.03 15.02 14.12 14.18 16.14CaO 11.48 11.34 11.34 11.36 12.43 12.53 12.54 12.11 12.05 12.64 12.11 12.25 11.94 12.38 11.73 9.34Na2O 0.72 0.76 0.76 0.60 0.74 0.72 1.25 1.09 0.64 0.38 0.78 0.67 0.65 0.65 0.83 0.93K2O 0.49 0.49 0.55 0.34 0.09 0.14 0.25 0.17 0.29 0.07 0.31 0.22 0.25 0.23 0.11 0.06Totals 97.54 98.55 98.22 97.79 97.14 97.02 96.94 97.67 97.44 98.56 97.69 97.04 97.13 97.03 97.47 97.28
On basis of 23 oxygensSi 6.97 6.93 6.89 7.13 7.15 7.18 6.65 6.77 7.24 7.54 7.12 7.19 7.23 7.07 7.09 7.38Ti 0.04 0.04 0.06 0.04 0.02 0.02 0.04 0.03 0.07 0.01 0.08 0.06 0.04 0.06 0.03 0.02Al 1.09 1.20 1.22 0.91 1.22 1.22 1.87 1.71 0.93 0.60 1.08 1.03 1.02 1.19 1.32 0.87Cr 0.01 <0.01 0.01 0.01 – <0.01 <0.01 0.01 0.01 0.01 <0.01 <0.01 0.01 0.01 <0.01 0.01Fe3+ 0.78 0.75 0.76 0.67 0.27 0.16 0.43 0.44 0.38 0.27 0.38 0.35 0.36 0.38 0.39 0.34Fe2+ 1.35 1.40 1.45 1.37 1.49 1.619 1.61 1.52 1.10 0.98 1.19 1.12 1.09 1.19 1.15 1.21Mn 0.08 0.06 0.08 0.07 0.04 0.03 0.05 0.04 0.04 0.03 0.04 0.05 0.09 0.06 0.05 0.12Mg 2.78 2.72 2.63 2.94 2.84 2.78 2.31 2.53 3.31 3.61 3.17 3.25 3.24 3.07 3.05 3.46Ca 1.82 1.78 1.79 1.79 1.95 1.97 2.01 1.91 1.87 1.91 1.88 1.91 1.85 1.94 1.82 1.44Na 0.21 0.22 0.22 0.17 0.21 0.21 0.36 0.31 0.18 0.10 0.22 0.19 0.18 0.18 0.23 0.26K 0.09 0.09 0.10 0.06 0.02 0.03 0.05 0.03 0.05 0.01 0.06 0.04 0.05 0.04 0.02 0.01
Tr 0.212 0.19 0.16 0.22 0.21 0.17 0.16 0.20 0.26 0.31 0.24 0.28 0.26 0.26 0.28 0.24Fact <0.01 <0.01 <0.01 <0.01 <0.01 <0.01 – <0.01 <0.01 <0.01 <0.01 <0.01 <0.01 <0.01 <0.01 <0.01Ts – <0.01 – – <0.01 <0.01 <0.01 <0.01 <0.01 <0.01 <0.01 <0.01 <0.01 <0.01 <0.01 <0.01Parg <0.01 <0.01 <0.01 <0.01 0.01 0.01 0.01 <0.01 0.01 0.01 0.01 0.01 0.01 0.01 0.01 <0.01Gl – <0.01 <0.01 – – – <0.01 <0.01 <0.01 – <0.01 <0.01 – <0.01 – –
Sample 1c1chl2 1c1chl3 1c1chl4 1c1chl5 19s1chl2 19s2chl1 19s2chl3 19s3chl2 101chl2 101chl4 101chl5 101chl6 199chl1 199chl2 70A1chl1 70A2chl7
SiO2 27.43 27.63 27.73 27.59 26.43 27.85 26.44 27.07 29.66 29.21 28.26 31.08 28.88 28.68 28.09 29.76TiO2 0.02 BDL 0.19 0.07 0.06 0.04 0.09 0.01 0.35 0.08 0.16 0.55 BDL 0.21 0.04 0.02Al2O3 17.13 16.65 17.23 16.86 19.24 19.24 19.74 18.73 17.99 17.1 17.97 17.21 17.48 16.88 18.99 19.26Cr2O3 0.03 BDL 0.06 0.08 0.06 0.05 0.03 0.05 0.10 BDL 0.03 0.08 0.03 0.05 0.01 0.04Fe2O3 2.12 0.78 0.48 1.88 BDL BDL BDL BDL BDL BDL BDL BDL BDL BDL BDL BDLFeO 23.75 23.86 23.79 23.17 19.88 18.69 19.7 19.57 21.16 21.43 21.64 20.78 19.22 20.54 19.68 19.76MnO 0.59 0.52 0.53 0.53 0.34 0.34 0.34 0.34 0.19 0.19 0.34 0.20 0.32 0.51 0.28 0.29MgO 17.37 17.34 17.41 17.92 18.35 18.74 18.76 19.17 19.3 18.74 19.11 17.85 19.89 18.56 20.66 19.04CaO 0.08 0.04 0.14 0.08 0.14 0.20 0.14 0.09 0.13 0.11 0.10 0.21 0.03 0.06 0.05 0.14Na2O 0.02 0.01 BDL 0.01 BDL 0.08 0.03 0.01 0.01 BDL 0.01 0.06 0.01 0.03 0.01 0.28K2O 0.07 0.06 0.19 0.05 0.03 0.07 0.01 0.03 0.83 0.14 0.08 0.95 0.07 BDL 0.03 0.21Totals 88.61 86.89 87.75 88.24 84.53 85.30 85.28 85.07 89.72 87.00 87.70 88.97 85.93 85.52 87.84 88.80
On basis of 14 oxygensSi 2.87 2.93 2.91 2.88 2.81 2.91 2.79 2.86 2.99 3.03 2.92 3.14 3.00 3.02 2.86 2.99Ti <0.01 – 0.02 0.01 <0.01 <0.01 <0.01 <0.01 0.03 0.01 0.01 0.04 – 0.02 <0.01 <0.01Al 2.11 2.08 2.13 2.08 2.42 2.37 2.45 2.33 2.14 2.09 2.19 2.05 2.14 2.10 2.28 2.28Cr <0.01 – 0.01 0.01 <0.01 <0.01 <0.01 <0.01 <0.01 – <0.01 <0.01 <0.01 <0.01 <0.01 <0.01Fe3+ 0.17 0.06 0.04 0.15 – – – – – – – – – – – –Fe2+ 2.08 2.12 2.09 2.03 1.77 1.63 1.74 1.73 1.78 1.86 1.87 1.76 1.67 1.81 1.68 1.66Mn 0.05 0.05 0.05 0.05 0.03 0.03 0.03 0.03 0.02 0.02 0.03 0.02 0.03 0.05 0.02 0.03

112M
. H
assan et
al. /
Precambrian
Research
241 (2014) 104– 128
Table 1 (Continued)
Sample 1c1chl2 1c1chl3 1c1chl4 1c1chl5 19s1chl2 19s2chl1 19s2chl3 19s3chl2 101chl2 101chl4 101chl5 101chl6 199chl1 199chl2 70A1chl1 70A2chl7
Mg 2.70 2.74 2.72 2.79 2.91 2.92 2.95 3.01 2.90 2.90 2.94 2.69 3.08 2.91 3.14 2.85Ca 0.01 0.01 0.02 0.01 0.02 0.02 0.02 0.01 0.01 0.01 0.01 0.02 <0.01 0.01 0.01 0.02Na <0.01 <0.01 – <0.01 – 0.02 0.01 <0.01 <0.01 – <0.01 0.01 <0.01 0.01 <0.01 0.06K 0.01 0.01 0.05 0.01 <0.01 0.01 <0.01 <0.01 0.11 0.02 0.01 0.12 0.01 – <0.01 0.03
Clin 0.05 0.05 0.05 0.05 0.08 0.08 0.08 0.09 0.07 0.07 0.08 0.05 0.10 0.07 0.10 0.07Daph 0.01 0.02 0.01 0.01 0.01 0.01 0.01 0.01 0.01 0.01 0.01 0.01 0.01 0.01 0.01 0.01Ames 0.02 0.01 0.02 0.02 0.06 0.05 0.06 0.06 0.03 0.03 0.04 0.02 0.04 0.03 0.06 0.04
Sample 1c1plg2 1c1plg3 1c1plg4 1c1plg5 19s1plg2 19s2plg1 19s2plg3 19s3plg2 101plg2 101plg4 101plg5 101plg6 199plag3 199plag1 70A1plg3 70A1plg4
SiO2 63.06 63.94 59.22 63.35 55.89 59.58 59.18 59.6 59.96 61.43 59.91 59.99 59.61 58.84 59.26 63.91TiO2 BDL 0.03 0.02 BDL BDL 0.05 0.01 0.01 0.03 0.03 0.04 0.11 0.03 0.04 0.01 0.01Al2O3 23.73 23.25 25.36 23.11 26.82 25.85 25.67 25.98 25.79 25.53 25.79 25.96 25.59 25.16 26.77 23.86Cr2O3 0.06 0.01 0.04 0.02 0.06 BDL BDL 0.03 0.07 0.01 0.01 0.06 0.02 BDL 0.03 0.01Fe2O3 0.14 0.22 0.33 0.43 0.32 0.21 0.13 0.44 0.25 0.38 0.32 0.36 0.12 0.68 0.28 0.50MnO 0.04 0.04 0.01 0.01 0.03 0.01 0.02 BDL 0.06 0.05 0.10 0.01 BDL 0.05 0.01 0.02MgO 0.20 0.18 0.03 0.03 0.20 0.01 0.05 0.05 0.21 0.13 0.04 0.09 0.09 0.51 0.05 0.05CaO 5.02 4.73 7.44 4.57 10.68 8.15 8.17 8.23 6.59 6.11 6.56 6.91 7.95 8.30 8.92 4.61Na2O 8.34 8.57 6.98 8.66 5.98 7.26 7.29 7.17 7.44 7.76 7.71 7.52 6.78 6.55 6.23 8.16K2O 0.07 0.08 0.20 0.08 0.03 0.07 0.14 0.09 0.05 0.15 0.08 0.02 0.14 0.08 0.06 0.49Totals 100.66 101.05 99.63 100.26 100.01 101.19 100.66 101.6 100.45 101.57 100.56 101.02 100.33 100.21 101.62 101.62
On basis of 8 oxygensSi 2.77 2.80 2.65 2.79 2.52 2.63 2.63 2.63 2.66 2.69 2.65 2.65 2.65 2.63 2.61 2.78Ti – <0.01 <0.01 – – <0.01 <0.01 <0.01 <0.01 <0.01 <0.01 <0.01 <0.01 <0.01 <0.01 <0.01Al 1.23 1.20 1.34 1.20 1.43 1.35 1.35 1.35 1.35 1.32 1.35 1.35 1.34 1.33 1.39 1.22Cr <0.01 <0.01 <0.01 <0.01 <0.01 – – <0.01 <0.01 <0.01 <0.01 <0.01 <0.01 – <0.01 <0.01Fe3+ 0.01 0.01 0.01 0.01 0.01 0.01 <0.01 0.02 0.01 0.01 0.01 0.01 <0.01 0.02 0.01 0.02Mn <0.01 <0.01 <0.01 <0.01 <0.01 <0.01 <0.01 – <0.01 <0.01 <0.01 <0.01 – <0.01 <0.01 <0.01Mg 0.01 0.01 <0.01 <0.01 0.01 <0.01 <0.01 <0.01 0.01 0.01 <0.01 0.01 0.01 0.03 <0.01 <0.01Ca 0.24 0.22 0.36 0.22 0.52 0.39 0.39 0.39 0.31 0.29 0.31 0.33 0.38 0.40 0.42 0.22Na 0.71 0.73 0.61 0.74 0.52 0.62 0.63 0.61 0.64 0.66 0.66 0.64 0.58 0.57 0.53 0.69K <0.01 <0.01 0.01 <0.01 <0.01 <0.01 0.01 0.01 <0.01 0.01 <0.01 <0.01 0.01 0.01 <0.01 0.03
An 0.41 0.39 0.59 0.37 0.72 0.62 0.61 0.62 0.53 0.49 0.52 0.55 0.63 0.66 0.70 0.38Ab 0.75 0.77 0.63 0.78 0.56 0.63 0.63 0.62 0.68 0.70 0.69 0.67 0.62 0.60 0.58 0.75

M.
Hassan
et al.
/ Precam
brian R
esearch 241 (2014) 104– 128
113
Table 2Representative electron microprobe analyses of mineral assemblages of the studied amphibole-bearing metasedimentary rock samples.
Sample 122D!hb1 122D!hb2 122D!hb3 122D2hb1 140b1hb1 140b2hb4 140b2hb5 140b2hb6 188hb1 188hb3 188hb4 188hb5 189 × 4hb2 189 × 4hb3 189 × 2hb1 189 × 2hb7
SiO2 48.90 47.87 49.13 48.18 48.50 48.25 46.59 48.15 49.37 48.49 48.01 47.57 50.61 50.38 49.85 50.07TiO2 0.42 0.65 0.53 0.61 0.68 0.79 3.84 0.86 0.44 0.80 0.45 1.03 0.40 0.60 0.68 0.44Al2O3 3.49 4.36 3.76 4.32 7.09 7.17 6.57 8.02 5.56 5.95 6.36 6.77 5.27 5.53 5.56 5.82Cr2O3 0.05 0.15 0.02 0.04 0.07 0.11 0.03 0.09 0.01 0.01 0.10 0.03 0.01 0.02 0.01 0.03Fe2O3 2.09 2.77 2.20 2.58 3.92 4.49 12.28 4.65 3.30 4.32 3.75 3.33 1.04 2.42 3.47 2.24FeO 9.23 9.60 9.33 9.91 9.20 8.77 BDL 9.17 10.24 9.97 10.26 11.35 11.44 9.71 8.36 10.51MnO 0.97 0.81 0.90 0.96 0.63 0.50 0.50 0.59 0.46 0.49 0.44 0.50 0.56 0.66 0.68 0.70MgO 14.76 14.7 14.82 14.34 14.63 14.67 13.37 14.33 14.61 14.45 14.09 13.58 14.47 15.04 15.6 14.34CaO 10.85 10.78 10.88 10.94 12.16 12.16 14.23 11.97 12.61 12.33 12.51 12.32 12.73 12.51 12.42 12.45Na2O 1.03 1.18 1.08 1.17 0.87 0.69 0.53 0.80 0.63 0.76 0.77 0.90 0.58 0.53 0.63 0.50K2O 0.40 0.47 0.39 0.44 0.47 0.55 0.34 0.64 0.45 0.53 0.54 0.65 0.23 0.23 0.28 0.24Totals 92.19 93.34 93.04 93.50 98.22 98.15 98.28 99.27 97.68 98.09 97.28 98.02 97.34 97.63 97.54 97.34
On basis of 23 oxygensSi 7.48 7.28 7.44 7.32 7.00 6.97 6.66 6.89 7.18 7.05 7.05 6.97 7.35 7.27 7.19 7.27Ti 0.05 0.07 0.06 0.07 0.08 0.09 0.41 0.09 0.05 0.09 0.05 0.11 0.04 0.07 0.07 0.05Al 0.63 0.78 0.67 0.77 1.21 1.22 1.11 1.35 0.95 1.02 1.1 1.17 0.90 0.94 0.95 1.00Cr 0.01 0.02 <0.01 0.01 0.01 0.01 <0.01 0.01 <0.01 <0.01 0.01 <0.01 <0.01 <0.01 <0.01 <0.01Fe3+ 0.24 0.32 0.25 0.30 0.43 0.49 1.32 0.50 0.36 0.47 0.41 0.37 0.11 0.26 0.38 0.25Fe2+ 1.18 1.22 1.18 1.26 1.11 1.06 – 1.10 1.25 1.21 1.26 1.39 1.39 1.17 1.01 1.28Mn 0.13 0.10 0.12 0.12 0.08 0.06 0.06 0.07 0.06 0.06 0.06 0.06 0.07 0.08 0.08 0.09Mg 3.36 3.33 3.35 3.25 3.15 3.16 2.85 3.06 3.17 3.13 3.08 2.96 3.13 3.24 3.36 3.10Ca 1.78 1.76 1.77 1.78 1.88 1.88 2.18 1.84 1.97 1.92 1.97 1.93 1.98 1.94 1.92 1.94Na 0.31 0.35 0.32 0.34 0.24 0.19 0.15 0.22 0.18 0.21 0.22 0.26 0.16 0.15 0.18 0.14K 0.08 0.09 0.08 0.09 0.09 0.10 0.06 0.12 0.08 0.10 0.10 0.12 0.04 0.04 0.05 0.04
Tr 0.20 0.19 0.20 0.19 0.26 0.25 0.21 0.22 0.23 0.23 0.23 0.16 0.02 0.23 0.30 0.20Fact <0.01 <0.01 <0.01 <0.01 <0.01 <0.01 – <0.01 <0.01 <0.01 <0.01 <0.01 <0.01 <0.01 <0.01 <0.01Ts <0.01 <0.01 <0.01 – <0.01 <0.01 <0.01 <0.01 <0.01 – <0.01 <0.01 <0.01 <0.01 <0.01 <0.01Parg 0.02 0.01 0.02 0.01 0.01 0.01 – 0.01 0.01 0.01 0.01 0.01 0.02 0.01 0.01 0.01Gl – – – – <0.01 <0.01 – <0.01 – – – – – – <0.01 –
Sample 122D!chl1 122D!chl2 122D!chl3 122D2chl3 140b1chl1 140b1chl1a 140b1chl2 140b1chl2a 188 × 1chl1 188chl2 188chl3 188chl4 189 × 4chl9 189 × 2chl7 189chl2 189chl1
SiO2 27.4 26.08 26.53 28.42 31.88 33.03 25.98 29.42 26.66 28.42 28.07 28.42 27.81 29.61 29.86 30.07TiO2 0.01 0.05 0.02 0.25 BDL 0.05 0.01 0.08 0.07 0.03 0.01 0.03 0.18 0.02 0.96 0.14Al2O3 16.46 16.99 16.47 15.2 15.46 15.37 16.43 19.08 18.36 17.93 19.09 17.93 19.76 17.95 17.3 16.78Cr2O3 0.04 0.09 0.09 0.02 0.05 0.09 0.05 0.01 0.06 0.23 0.23 0.23 0.07 0.08 0.01 0.07Fe2O3 BDL BDL BDL BDL BDL BDL BDL BDL 0.16 BDL BDL BDL BDL BDL BDL BDLFeO 16.96 19.39 18.67 16.50 1.41 1.45 17.93 19.50 18.37 18.04 19.00 18.04 18.32 18.38 18.67 18.62MnO 1.89 1.71 1.80 1.56 0.32 0.25 0.75 0.65 0.58 0.52 0.68 0.52 0.72 1.12 0.96 0.85MgO 18.30 17.54 17.42 18.85 27.73 29.02 17.85 19.90 19.58 21.11 20.35 21.11 19.88 20.25 19.37 20.72CaO 0.07 0.05 0.07 0.19 0.50 0.79 0.18 0.11 0.39 0.43 0.28 0.43 0.25 0.16 1.27 0.10Na2O 0.01 0.01 0.02 0.04 0.03 0.11 0.02 0.01 0.01 BDL 0.01 BDL 0.04 BDL 0.01 0.01K2O 0.05 0.02 0.04 0.25 0.02 0.05 0.02 0.01 0.01 0.02 0.01 0.02 0.03 0.05 0.04 0.09Totals 81.19 81.93 81.13 81.28 77.40 80.21 79.22 88.77 84.25 86.73 87.73 86.73 87.06 87.62 88.45 87.45
On basis of 14 oxygensSi 3.02 2.89 2.96 3.12 3.32 3.33 2.94 2.96 2.84 2.92 2.86 2.92 2.85 3.01 3.02 3.06Ti <0.01 <0.01 <0.01 0.02 – <0.01 <0.01 0.01 0.01 <0.01 <0.01 <0.01 0.01 <0.01 0.07 0.01Al 2.14 2.22 2.17 1.96 1.90 1.82 2.20 2.26 2.30 2.17 2.30 2.17 2.38 0.01 2.06 2.02Cr <0.01 0.01 0.01 <0.01 <0.01 0.01 <0.01 <0.01 0.01 0.02 0.02 0.02 0.01 0.01 <0.01 0.01Fe3+ – – – – – – – – 0.013 – – – – – – –Fe2+ 1.56 1.80 1.74 1.51 0.12 0.12 1.70 1.64 1.63 1.55 1.62 1.55 1.57 1.56 1.58 1.59Mn 0.18 0.16 0.17 0.15 0.03 0.02 0.07 0.06 0.05 0.05 0.06 0.05 0.06 0.10 0.08 0.07

114M
. H
assan et
al. /
Precambrian
Research
241 (2014) 104– 128
Table 2 (Continued)
Sample 122D!chl1 122D!chl2 122D!chl3 122D2chl3 140b1chl1 140b1chl1a 140b1chl2 140b1chl2a 188 × 1chl1 188chl2 188chl3 188chl4 189 × 4chl9 189 × 2chl7 189chl2 189chl1
Mg 3.00 2.90 2.90 3.08 4.30 4.36 3.02 2.98 3.10 3.23 3.09 3.23 3.03 3.07 2.92 3.15Ca 0.01 0.01 0.01 0.02 0.06 0.09 0.02 0.01 0.04 0.05 0.03 0.05 0.03 0.02 0.14 0.01Na <0.01 <0.01 <0.01 0.01 0.01 0.02 <0.01 <0.01 <0.01 – <0.01 – 0.01 – <0.01 <0.01K 0.01 <0.01 0.01 0.04 <0.01 0.01 <0.01 <0.01 <0.01 <0.01 <0.01 <0.01 <0.01 0.01 0.01 0.01
Clin 0.09 0.07 0.07 0.09 0.47 0.47 0.09 0.09 0.10 0.12 0.10 0.12 0.09 0.10 0.10 0.10Daph <0.01 0.01 0.01 <0.01 – – 0.01 <0.01 <0.01 <0.01 <0.01 <0.01 <0.01 <0.01 <0.01 <0.01Ames 0.04 0.04 0.03 0.02 0.08 0.07 0.04 0.05 0.06 0.05 0.06 0.05 0.06 0.04 0.03 0.03
Sample 122D!plg4 122D2plg2 122D2plag3 122D2plg4 140b2plg5 140b2plg6 142–2plg3 142plg4 188plg1 188plg2 188plg3 188plg4 189 × 2plag2 189 × 2plag3 189 × 3plag1 189 × 3plag2
SiO2 64.44 64.47 64.60 64.70 60.84 69.78 66.32 65.87 68.88 65.78 59.89 68.77 45.55 47.03 46.45 48.28TiO2 0.09 0.07 0.02 0.03 0.03 BDL 0.01 0.02 0.03 BDL BDL 0.02 0.05 0.04 0.01 0.04Al2O3 20.48 20.77 21.20 21.22 26.68 21.63 21.45 21.28 20.67 20.94 25.35 20.32 34.31 33.19 33.95 32.88Cr2O3 0.04 0.04 0.01 0.01 0.05 BDL 0.04 0.08 0.04 0.01 BDL 0.05 0.03 0.02 0.04 BDLFe2O3 0.23 0.17 0.17 0.21 0.26 0.16 0.03 0.01 0.12 1.02 0.31 0.38 0.37 0.54 0.10 0.23MnO 0.04 0.06 0.04 BDL 0.01 0.03 0.06 0.01 0.04 0.06 0.06 0.04 0.09 0.03 0.01 BDLMgO 0.22 0.16 0.03 0.03 0.26 0.01 0.06 0.16 0.02 0.95 0.15 0.01 0.18 0.04 0.02 0.24CaO 2.32 2.57 2.65 2.62 7.25 0.59 2.38 2.50 1.16 3.41 7.46 1.23 18.11 17.1 17.58 16.32Na2O 10.11 9.54 10.13 10.39 7.34 10.14 9.13 8.84 10.70 9.47 7.86 11.35 1.11 1.68 1.39 2.00K2O 0.25 0.19 0.36 0.16 0.14 0.61 0.22 0.21 0.03 0.04 0.11 0.72 BDL 0.01 0.03 BDLTotals 98.22 98.04 99.21 99.37 102.86 102.95 99.70 98.98 101.69 101.68 101.19 102.89 99.80 99.68 99.58 99.99
On basis of 8 oxygensSi 2.89 2.89 2.87 2.87 2.64 2.96 2.91 2.91 2.96 2.86 2.65 2.95 2.11 2.17 2.14 2.21Ti <0.01 <0.01 <0.01 <0.01 <0.01 – <0.01 <0.01 <0.01 – – <0.01 <0.01 <0.01 <0.01 <0.01Al 1.08 1.10 1.11 1.11 1.36 1.08 1.11 1.11 1.05 1.07 1.32 1.03 1.87 1.80 1.85 1.77Cr <0.01 <0.01 <0.01 <0.01 <0.01 – <0.01 <0.01 <0.01 <0.01 – <0.01 <0.01 <0.01 <0.01 –Fe3+ 0.01 0.01 0.01 0.01 0.01 0.01 <0.01 <0.01 <0.01 0.03 0.01 0.01 0.01 0.02 <0.01 0.01Mn <0.01 <0.01 <0.01 – <0.01 <0.01 <0.01 <0.01 <0.01 <0.01 <0.01 <0.01 <0.01 <0.01 <0.01 –Mg 0.02 0.01 <0.01 <0.01 0.02 <0.01 <0.01 0.01 <0.01 0.06 0.01 <0.01 0.01 <0.01 <0.01 0.02Ca 0.11 0.12 0.13 0.13 0.34 0.03 0.11 0.12 0.05 0.16 0.35 0.06 0.90 0.85 0.87 0.80Na 0.88 0.83 0.87 0.89 0.62 0.83 0.78 0.76 0.89 0.80 0.67 0.94 0.10 0.15 0.12 0.18K 0.01 0.01 0.02 0.01 0.01 0.03 0.01 0.01 <0.01 < 0.01 0.01 0.04 – < 0.01 < 0.01 –
An 0.19 0.22 0.21 0.21 0.57 0.05 0.21 0.23 0.10 0.28 0.56 0.10 0.91 0.88 0.89 0.86Ab 0.88 0.86 0.86 0.87 0.65 0.93 0.86 0.86 0.94 0.84 0.66 0.91 0.27 0.34 0.3 0.38
M.
Hassan
et al.
/ Precam
brian R
esearch 241 (2014) 104– 128
115
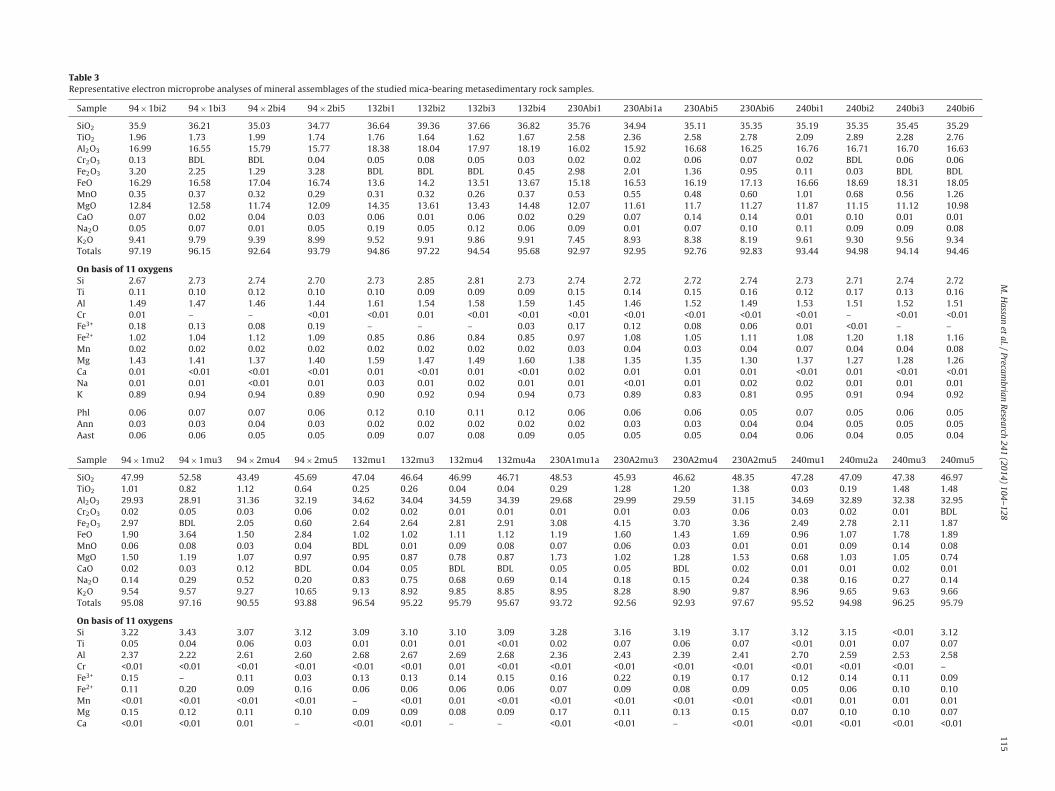
Table 3Representative electron microprobe analyses of mineral assemblages of the studied mica-bearing metasedimentary rock samples.
Sample 94 × 1bi2 94 × 1bi3 94 × 2bi4 94 × 2bi5 132bi1 132bi2 132bi3 132bi4 230Abi1 230Abi1a 230Abi5 230Abi6 240bi1 240bi2 240bi3 240bi6
SiO2 35.9 36.21 35.03 34.77 36.64 39.36 37.66 36.82 35.76 34.94 35.11 35.35 35.19 35.35 35.45 35.29TiO2 1.96 1.73 1.99 1.74 1.76 1.64 1.62 1.67 2.58 2.36 2.58 2.78 2.09 2.89 2.28 2.76Al2O3 16.99 16.55 15.79 15.77 18.38 18.04 17.97 18.19 16.02 15.92 16.68 16.25 16.76 16.71 16.70 16.63Cr2O3 0.13 BDL BDL 0.04 0.05 0.08 0.05 0.03 0.02 0.02 0.06 0.07 0.02 BDL 0.06 0.06Fe2O3 3.20 2.25 1.29 3.28 BDL BDL BDL 0.45 2.98 2.01 1.36 0.95 0.11 0.03 BDL BDLFeO 16.29 16.58 17.04 16.74 13.6 14.2 13.51 13.67 15.18 16.53 16.19 17.13 16.66 18.69 18.31 18.05MnO 0.35 0.37 0.32 0.29 0.31 0.32 0.26 0.37 0.53 0.55 0.48 0.60 1.01 0.68 0.56 1.26MgO 12.84 12.58 11.74 12.09 14.35 13.61 13.43 14.48 12.07 11.61 11.7 11.27 11.87 11.15 11.12 10.98CaO 0.07 0.02 0.04 0.03 0.06 0.01 0.06 0.02 0.29 0.07 0.14 0.14 0.01 0.10 0.01 0.01Na2O 0.05 0.07 0.01 0.05 0.19 0.05 0.12 0.06 0.09 0.01 0.07 0.10 0.11 0.09 0.09 0.08K2O 9.41 9.79 9.39 8.99 9.52 9.91 9.86 9.91 7.45 8.93 8.38 8.19 9.61 9.30 9.56 9.34Totals 97.19 96.15 92.64 93.79 94.86 97.22 94.54 95.68 92.97 92.95 92.76 92.83 93.44 94.98 94.14 94.46
On basis of 11 oxygensSi 2.67 2.73 2.74 2.70 2.73 2.85 2.81 2.73 2.74 2.72 2.72 2.74 2.73 2.71 2.74 2.72Ti 0.11 0.10 0.12 0.10 0.10 0.09 0.09 0.09 0.15 0.14 0.15 0.16 0.12 0.17 0.13 0.16Al 1.49 1.47 1.46 1.44 1.61 1.54 1.58 1.59 1.45 1.46 1.52 1.49 1.53 1.51 1.52 1.51Cr 0.01 – – <0.01 <0.01 0.01 <0.01 <0.01 <0.01 <0.01 <0.01 <0.01 <0.01 – <0.01 <0.01Fe3+ 0.18 0.13 0.08 0.19 – – – 0.03 0.17 0.12 0.08 0.06 0.01 <0.01 – –Fe2+ 1.02 1.04 1.12 1.09 0.85 0.86 0.84 0.85 0.97 1.08 1.05 1.11 1.08 1.20 1.18 1.16Mn 0.02 0.02 0.02 0.02 0.02 0.02 0.02 0.02 0.03 0.04 0.03 0.04 0.07 0.04 0.04 0.08Mg 1.43 1.41 1.37 1.40 1.59 1.47 1.49 1.60 1.38 1.35 1.35 1.30 1.37 1.27 1.28 1.26Ca 0.01 <0.01 <0.01 <0.01 0.01 <0.01 0.01 <0.01 0.02 0.01 0.01 0.01 <0.01 0.01 <0.01 <0.01Na 0.01 0.01 <0.01 0.01 0.03 0.01 0.02 0.01 0.01 <0.01 0.01 0.02 0.02 0.01 0.01 0.01K 0.89 0.94 0.94 0.89 0.90 0.92 0.94 0.94 0.73 0.89 0.83 0.81 0.95 0.91 0.94 0.92
Phl 0.06 0.07 0.07 0.06 0.12 0.10 0.11 0.12 0.06 0.06 0.06 0.05 0.07 0.05 0.06 0.05Ann 0.03 0.03 0.04 0.03 0.02 0.02 0.02 0.02 0.02 0.03 0.03 0.04 0.04 0.05 0.05 0.05Aast 0.06 0.06 0.05 0.05 0.09 0.07 0.08 0.09 0.05 0.05 0.05 0.04 0.06 0.04 0.05 0.04
Sample 94 × 1mu2 94 × 1mu3 94 × 2mu4 94 × 2mu5 132mu1 132mu3 132mu4 132mu4a 230A1mu1a 230A2mu3 230A2mu4 230A2mu5 240mu1 240mu2a 240mu3 240mu5
SiO2 47.99 52.58 43.49 45.69 47.04 46.64 46.99 46.71 48.53 45.93 46.62 48.35 47.28 47.09 47.38 46.97TiO2 1.01 0.82 1.12 0.64 0.25 0.26 0.04 0.04 0.29 1.28 1.20 1.38 0.03 0.19 1.48 1.48Al2O3 29.93 28.91 31.36 32.19 34.62 34.04 34.59 34.39 29.68 29.99 29.59 31.15 34.69 32.89 32.38 32.95Cr2O3 0.02 0.05 0.03 0.06 0.02 0.02 0.01 0.01 0.01 0.01 0.03 0.06 0.03 0.02 0.01 BDLFe2O3 2.97 BDL 2.05 0.60 2.64 2.64 2.81 2.91 3.08 4.15 3.70 3.36 2.49 2.78 2.11 1.87FeO 1.90 3.64 1.50 2.84 1.02 1.02 1.11 1.12 1.19 1.60 1.43 1.69 0.96 1.07 1.78 1.89MnO 0.06 0.08 0.03 0.04 BDL 0.01 0.09 0.08 0.07 0.06 0.03 0.01 0.01 0.09 0.14 0.08MgO 1.50 1.19 1.07 0.97 0.95 0.87 0.78 0.87 1.73 1.02 1.28 1.53 0.68 1.03 1.05 0.74CaO 0.02 0.03 0.12 BDL 0.04 0.05 BDL BDL 0.05 0.05 BDL 0.02 0.01 0.01 0.02 0.01Na2O 0.14 0.29 0.52 0.20 0.83 0.75 0.68 0.69 0.14 0.18 0.15 0.24 0.38 0.16 0.27 0.14K2O 9.54 9.57 9.27 10.65 9.13 8.92 9.85 8.85 8.95 8.28 8.90 9.87 8.96 9.65 9.63 9.66Totals 95.08 97.16 90.55 93.88 96.54 95.22 95.79 95.67 93.72 92.56 92.93 97.67 95.52 94.98 96.25 95.79
On basis of 11 oxygensSi 3.22 3.43 3.07 3.12 3.09 3.10 3.10 3.09 3.28 3.16 3.19 3.17 3.12 3.15 <0.01 3.12Ti 0.05 0.04 0.06 0.03 0.01 0.01 0.01 <0.01 0.02 0.07 0.06 0.07 <0.01 0.01 0.07 0.07Al 2.37 2.22 2.61 2.60 2.68 2.67 2.69 2.68 2.36 2.43 2.39 2.41 2.70 2.59 2.53 2.58Cr <0.01 <0.01 <0.01 <0.01 <0.01 <0.01 0.01 <0.01 <0.01 <0.01 <0.01 <0.01 <0.01 <0.01 <0.01 –Fe3+ 0.15 – 0.11 0.03 0.13 0.13 0.14 0.15 0.16 0.22 0.19 0.17 0.12 0.14 0.11 0.09Fe2+ 0.11 0.20 0.09 0.16 0.06 0.06 0.06 0.06 0.07 0.09 0.08 0.09 0.05 0.06 0.10 0.10Mn <0.01 <0.01 <0.01 <0.01 – <0.01 0.01 <0.01 <0.01 <0.01 <0.01 <0.01 <0.01 0.01 0.01 0.01Mg 0.15 0.12 0.11 0.10 0.09 0.09 0.08 0.09 0.17 0.11 0.13 0.15 0.07 0.10 0.10 0.07Ca <0.01 <0.01 0.01 – <0.01 <0.01 – – <0.01 <0.01 – <0.01 <0.01 <0.01 <0.01 <0.01

116M
. H
assan et
al. /
Precambrian
Research
241 (2014) 104– 128
Table 3 (Continued)
Sample 94 × 1mu2 94 × 1mu3 94 × 2mu4 94 × 2mu5 132mu1 132mu3 132mu4 132mu4a 230A1mu1a 230A2mu3 230A2mu4 230A2mu5 240mu1 240mu2a 240mu3 240mu5
Na 0.02 0.04 0.07 0.03 0.11 0.10 0.09 0.09 0.02 0.02 0.02 0.03 0.05 0.02 0.04 0.02K 0.82 0.80 0.84 0.93 0.76 0.76 0.75 0.75 0.77 0.73 0.78 0.83 0.75 0.82 0.81 0.82
Mu 0.56 0.46 0.61 0.66 0.67 0.68 0.70 0.70 0.58 0.64 0.59 0.56 0.73 0.68 0.63 0.66Cel 0.03 0.06 0.02 0.02 0.01 0.01 – – 0.04 0.01 0.02 0.03 – 0.01 0.02 0.01Fcel 0.02 0.10 0.01 0.03 <0.01 <0.01 – – 0.01 0.01 0.01 0.02 – 0.01 0.02 0.01Pa 0.06 0.27 0.19 0.13 0.21 0.19 0.15 0.15 0.05 0.04 0.04 0.08 0.09 0.05 0.10 0.05
Sample 94 × 1chl2 94 × 1chl3 94 × 2chl4 94 × 2chl5 132chl1 132chl2 132chl3 132chl5 230A1chl1 230A1chl1a 230A2chl3 230A2chl5 240chl1 240chl2 240chl4 240chl6
SiO2 32.81 29.04 26.79 29.57 29.48 27.72 27.06 28.53 26.86 27.11 29.75 34.27 28.66 32.70 31.43 28.04TiO2 0.96 0.08 0.09 0.95 0.16 0.14 0.12 0.05 0.20 0.75 0.43 0.12 0.24 0.14 0.37 0.30Al2O3 16.54 17.63 19.01 16.19 19.06 21.26 20.99 20.43 18.64 19.51 18.36 17.35 17.79 12.00 16.31 16.62Cr2O3 0.01 0.09 0.05 0.06 0.14 0.02 0.06 0.08 0.06 0.02 0.01 0.04 0.03 0.08 0.02 0.06Fe2O3 BDL BDL 1.57 BDL BDL BDL BDL BDL BDL BDL BDL BDL BDL BDL BDL BDLFeO 20.21 21.35 19.43 21.03 13.70 12.82 13.19 14.16 22.37 22.38 24.50 18.82 24.01 19.29 21.19 23.71MnO 0.30 0.49 0.68 0.42 0.26 0.25 0.29 0.22 0.92 0.73 0.31 0.29 0.89 0.31 1.18 1.12MgO 16.86 18.78 19.38 17.00 24.24 24.19 23.29 24.08 17.21 16.71 12.19 15.59 16.49 17.53 16.08 15.51CaO 0.98 0.02 0.10 0.61 0.04 0.02 0.02 0.02 0.12 0.63 0.35 0.35 0.09 0.48 0.05 0.12Na2O 0.02 0.01 0.06 0.03 0.02 0.01 0.02 0.04 0.01 0.01 BDL 0.03 0.01 0.24 0.02 0.03K2O 1.04 0.39 0.04 0.88 0.10 0.02 BDL 0.20 0.20 0.25 0.39 0.52 0.39 0.30 1.92 0.98Totals 89.73 87.88 87.21 86.74 87.20 86.45 85.04 87.81 86.59 88.10 86.29 87.38 88.60 83.07 88.57 86.49
On basis of 14 oxygensSi 3.27 2.99 2.78 3.09 2.93 2.77 2.76 2.82 2.84 2.81 3.15 3.44 2.97 3.51 3.23 3.00Ti 0.07 0.01 0.01 0.08 0.01 0.01 0.01 <0.01 0.02 0.06 0.03 0.01 0.02 0.01 0.03 0.02Al 1.95 2.14 2.32 2.00 2.23 2.50 2.52 2.38 2.32 2.39 2.29 2.05 2.18 1.52 1.98 2.10Cr <0.01 0.01 <0.01 0.01 0.01 <0.01 0.01 0.01 0.01 <0.01 <0.01 <0.01 <0.01 0.01 <0.01 0.01Fe3+ – – 0.12 – – – – – – – – – – – – –Fe2+ 1.69 1.84 1.69 1.84 1.14 1.07 1.12 1.17 1.98 1.94 2.17 1.58 2.08 1.73 1.82 2.13Mn 0.03 0.04 0.06 0.04 0.02 0.02 0.03 0.02 0.08 0.06 0.03 0.03 0.08 0.03 0.10 0.10Mg 2.51 2.88 2.99 2.65 3.59 3.60 3.53 3.55 2.71 2.58 1.92 2.33 2.55 2.81 2.46 2.48Ca 0.11 <0.01 0.011 0.07 <0.01 <0.01 <0.01 <0.01 0.01 0.07 0.04 0.04 0.01 0.06 0.01 0.01Na <0.01 <0.01 0.01 0.01 <0.01 <0.01 <0.01 0.01 <0.01 <0.01 – 0.01 <0.01 0.05 <0.01 0.01K 0.13 0.05 0.01 0.12 0.01 <0.01 – 0.03 0.03 0.03 0.05 0.07 0.05 0.04 0.25 0.13
Clin 0.04 0.07 0.08 0.04 0.20 0.22 0.20 0.20 0.05 0.04 0.01 0.03 0.04 0.04 0.03 0.03Daph 0.01 0.01 <0.01 0.01 <0.01 <0.01 <0.01 <0.01 0.01 0.01 0.03 0.01 0.02 <0.01 0.01 0.02Ames 0.01 0.03 0.06 0.02 0.09 0.14 0.14 0.12 0.04 0.03 0.01 0.01 0.02 <0.01 0.01 0.02

M.
Hassan
et al.
/ Precam
brian R
esearch 241 (2014) 104– 128
117
Table 4Representative electron microprobe analyses of mineral assemblages of the studied garnet-bearing samples.
Sample50A 1 × 1drk 1grt1 1grt2 1grt3 2grt4 1augt1 1agt2 1agt1in 2agt5i 3agt1 3agt2 1plg1in 2plg5i 3plg1 1epd1 1epd2 1kfs2i 1kfs3i 3kfs1 3ox1 3ox2
SiO2 37.79 38.49 38.40 37.93 38.10 51.65 52.61 56.12 54.96 54.20 54.20 70.82 69.42 66.24 36.07 35.64 67.22 65.38 66.55 0.49 0.35TiO2 0.03 0.02 0.03 0.01 0.07 0.02 0.01 0.02 BDL 0.21 0.23 0.02 0.05 0.02 1.15 0.22 0.19 0.11 0.13 0.02 0.53Al2O3 22.10 23.93 24.23 21.55 22.66 1.33 1.05 0.19 0.25 2.71 2.42 20.42 21.57 23.04 4.52 3.89 18.64 18.42 18.22 0.19 0.12Cr2O3 0.07 0.01 0.01 0.04 0.04 0.07 0.05 0.01 0.08 0.06 0.07 0.04 0.02 0.01 0.06 0.07 0.09 0.02 0.04 0.11 0.09Fe2O3 BDL BDL BDL BDL BDL BDL BDL BDL BDL BDL BDL 0.39 0.24 0.21 BDL BDL 0.11 0.46 0.17 97.65 98.22FeO 12.96 10.67 10.07 13.26 11.73 10.22 10.52 3.74 3.48 11.27 10.16 BDL BDL BDL 21.24 23.57 BDL BDL BDL 0.89 0.89MnO 0.17 0.12 0.62 0.16 0.07 0.70 0.52 0.98 0.71 0.35 0.35 0.01 0.03 0.03 0.71 0.49 0.05 0.08 0.01 0.05 0.02MgO 0.06 0.08 0.10 0.06 0.07 11.36 11.50 16.51 16.29 17.50 17.97 0.35 0.17 0.26 0.23 0.2 0.23 0.20 0.13 0.08 0.11CaO 22.32 22.54 22.18 22.10 22.15 22.27 22.74 24.50 24.30 12.04 11.77 0.74 1.86 3.68 31.37 30.31 0.04 0.20 0.01 0.06 0.25Na2O 0.03 0.03 0.02 BDL 0.13 0.26 0.22 0.26 0.10 0.44 0.62 11.48 10.53 9.44 BDL 0.01 0.14 0.30 0.67 0.01 0.04K2O 0.01 0.01 BDL 0.01 0.06 0.01 0.01 0.02 0.01 0.23 0.23 0.06 0.10 0.17 BDL 0.01 16.08 16.14 15.95 0.07 0.03Totals 95.54 95.90 95.66 95.12 95.08 97.89 99.23 102.35 100.18 99.01 98.02 104.33 103.99 103.10 95.35 94.41 102.79 101.31 101.88 99.61 100.65
Oxygens 12 12 12 12 12 6 6 6 6 6 6 8 8 8 12.5 12.5 8 8 8 3 3Si 3.03 3.03 3.02 3.05 3.04 1.99 2.00 2.01 2.01 2.00 2.01 2.97 2.92 2.83 3.36 3.39 3.01 2.99 3.01 0.01 0.01Ti <0.01 <0.01 <0.01 <0.01 <0.01 <0.01 0.00 <0.01 – 0.01 0.01 <0.01 <0.01 <0.01 0.08 0.02 0.01 <0.01 <0.01 0.00 0.01Al 2.09 2.22 2.25 2.06 2.13 0.06 0.05 0.01 0.01 0.11 0.11 1.01 1.07 1.16 0.50 0.44 0.98 0.99 0.97 0.01 <0.01Cr <0.01 <0.01 <0.01 <0.01 <0.01 <0.01 <0.01 <0.01 <0.01 <0.01 <0.01 <0.01 <0.01 <0.01 <0.01 0.01 <0.01 <0.01 <0.01 <0.01 <0.01Fe3+ – – – – – – – – – – – 0.01 0.01 0.01 – – <0.01 0.02 0.01 1.956 1.95Fe2+ 0.87 0.70 0.66 0.89 0.78 0.33 0.33 0.11 0.11 0.35 0.32 – – – 1.65 1.87 – – – 0.02 0.02Mn 0.01 0.01 0.04 0.01 0.01 0.02 0.02 0.03 0.02 0.01 0.01 0.00 <0.01 <0.01 0.06 0.04 <0.01 <0.01 <0.01 <0.01 <0.01Mg 0.01 0.01 0.01 0.01 0.01 0.65 0.65 0.88 0.89 0.96 0.99 0.02 0.01 0.02 0.03 0.03 0.02 0.01 0.01 <0.01 <0.01Ca 1.92 1.90 1.87 1.91 1.90 0.92 0.93 0.94 0.95 0.48 0.47 0.03 0.08 0.17 3.13 3.09 <0.01 0.01 <0.01 <0.01 0.01Na 0.01 0.01 <0.01 – 0.02 0.02 0.02 0.02 0.01 0.03 0.05 0.93 0.86 0.78 – <0.01 0.01 0.03 0.06 <0.01 <0.01K <0.01 <0.01 – <0.01 0.01 <0.01 <0.01 <0.01 <0.01 0.01 0.01 <0.01 0.01 0.01 – <0.01 0.92 0.94 0.92 <0.01 <0.01
py – – – – – di 0.66 0.66 0.85 0.86 – – an 0.06 0.15 0.30 Cz 1.00 1.00 san 0.99 0.96 0.94 ilm – <0.01gr 0.26 0.25 0.24 0.26 0.25 hed 0.33 0.34 0.14 0.13 0.24 0.21 ab 0.96 0.91 0.82 ep – – ab 0.10 0.19 0.04 hem 0.96 0.95alm 0.02 0.01 0.01 0.03 0.02 cats 0.08 0.08 0.02 0.02 0.18 0.16 prh – –spss – – – – – jd – – – – – – gei – –
Sample215 b 1grt1 1agrt6 2grt4 2grt5 gar2 2mus1 2amus2 mu3 mu4 mu6 mu5 2chl1 chlin chl5 chl6 chl2 2fld1 kfsin ksp6 oxin ox6
SiO2 36.20 36.83 36.88 35.77 36.36 48.09 46.14 53.28 50.58 48.38 49.55 25.54 25.72 26.45 26.39 27.95 65.18 66.08 65.28 0.98 3.81TiO2 0.35 0.25 1.04 0.40 0.53 0.72 0.65 0.20 0.43 0.08 1.03 0.13 0.07 0.07 0.25 0.09 0.05 0.19 0.17 0.25 0.10Al2O3 20.57 20.18 19.26 19.86 18.83 30.59 28.80 27.28 29.76 30.27 27.36 19.95 18.63 18.96 18.75 18.93 19.02 18.58 18.19 0.22 0.37Cr2O3 0.08 0.07 0.03 0.06 0.01 0.11 0.10 0.02 0.01 0.02 0.05 0.05 0.05 0.01 0.07 0.02 0.04 BDL 0.01 0.03 0.02Fe2O3 1.76 0.10 0.35 3.36 2.47 0.36 5.45 BDL 1.35 4.05 2.03 BDL BDL BDL BDL BDL 1.22 0.36 0.47 93.35 89.38FeO 6.53 8.48 7.28 2.75 4.59 3.57 2.10 3.92 2.77 1.56 3.30 27.38 26.75 26.2 26.59 26.29 BDL BDL BDL 0.85 3.17MnO 30.76 30.03 30.05 32.15 30.73 0.11 0.20 0.19 0.18 0.12 0.38 2.68 2.89 2.39 2.34 2.21 0.03 0.41 0.06 0.36 0.05MgO 0.56 0.10 0.37 0.52 0.17 1.54 2.36 1.31 1.69 1.54 1.65 11.80 11.87 11.97 12.05 11.73 0.11 0.09 0.05 0.16 0.38CaO 3.78 3.93 5.14 5.21 6.10 0.18 0.08 0.19 0.07 0.02 0.01 BDL 0.07 0.06 0.09 0.10 0.05 0.06 0.09 0.11 0.15Na2O 0.01 0.02 0.01 0.02 BDL BDL 0.15 0.14 0.09 0.11 0.04 0.02 0.01 BDL 0.01 0.03 0.38 0.34 0.23 BDL 0.06K2O 0.01 0.02 0.01 0.04 0.04 10.89 10.63 11.26 9.64 9.82 9.55 BDL 0.08 0.21 0.35 0.15 15.58 15.83 16.3 0.05 0.09Totals 100.61 100.01 100.41 100.14 99.83 96.17 96.66 97.79 96.58 95.97 94.95 87.55 86.14 86.32 86.89 87.5 101.66 101.94 100.85 96.36 97.58
Oxygens 12 12 12 12 12 11 11 11 11 11 11 14 14 14 14 14 8 8 8 3 3Si 2.94 3.01 3.00 2.92 2.98 3.22 3.12 3.49 3.33 3.22 3.34 2.76 2.83 2.88 2.87 2.99 2.96 2.99 3.00 0.03 0.10Ti 0.02 0.02 0.06 0.03 0.03 0.04 0.03 0.01 0.02 <0.01 0.05 0.01 0.01 0.01 0.02 0.01 <0.01 0.01 0.01 0.01 <0.01Al 1.97 1.94 1.85 1.91 1.82 2.41 2.29 2.11 2.31 2.38 2.18 2.55 2.42 2.44 2.40 2.38 1.02 0.99 0.98 0.01 0.01Cr 0.01 0.01 <0.01 <0.01 <0.01 0.01 0.01 <0.01 <0.01 <0.01 <0.01 <0.01 <0.01 <0.01 0.01 <0.01 <0.01 – <0.01 <0.01 <0.01Fe3+ 0.11 0.01 0.02 0.21 0.15 0.02 0.28 – 0.07 0.20 0.10 – – – – – 0.04 0.01 0.02 1.92 1.79Fe2+ 0.44 0.58 0.50 0.19 0.32 0.20 0.12 0.22 0.15 0.09 0.19 2.48 2.46 2.39 2.42 2.35 – – – 0.02 0.07Mn 2.12 2.08 2.07 2.22 2.14 0.01 0.01 0.01 0.01 0.01 0.02 0.25 0.27 0.22 0.22 0.20 <0.01 0.02 <0.01 0.01 <0.01Mg 0.07 0.01 0.05 0.06 0.02 0.15 0.24 0.13 0.17 0.15 0.17 1.90 1.95 1.94 1.95 1.87 0.01 0.01 <0.01 0.01 0.02Ca 0.33 0.34 0.45 0.46 0.54 0.01 0.01 0.01 0.01 <0.01 <0.01 – 0.01 0.01 0.01 0.01 <0.01 <0.01 <0.01 <0.01 <0.01Na <0.01 <0.01 <0.01 <0.01 – – 0.02 0.02 0.01 0.01 0.01 <0.01 <0.01 – <0.01 0.01 0.03 0.03 0.02 – <0.01K <0.01 <0.01 <0.01 <0.01 <0.01 0.93 0.92 0.94 0.81 0.84 0.82 – 0.01 0.03 0.05 0.02 0.90 0.91 0.95 <0.01 <0.01
py <0.01 – <0.01 <0.01 – mu 0.6 0.46 0.45 0.53 0.58 0.50 clin 0.01 0.01 0.01 0.01 0.01 san 0.96 0.97 0.98 ilm – <0.01gr <0.01 <0.01 <0.01 <0.01 <0.01 cel 0.04 0.02 0.10 0.05 0.03 0.05 daph 0.04 0.04 0.03 0.03 0.03 ab 0.25 0.22 0.15 hem 0.92 0.79alm <0.01 0.01 <0.01 <0.01 fcel 0.05 0.01 0.17 0.04 0.02 0.05 ames 0.01 0.01 0.01 0.01 0.01 prh – –spss 0.34 0.31 0.28 0.38 0.33 pa – 0.04 0.24 0.06 0.04 – gei – –andr – – – <0.01 0.02

118M
. H
assan et
al. /
Precambrian
Research
241 (2014) 104– 128Table 5Representative electron microprobe analyses of mineral assemblages of the studied alumino silicates-bearing samples.
Sample123c 1bt1 1bt3 2bt2 3bt1 1mus3 2mus2 3mus2 3mus3 3mus5 1fld1 3fld1 3ill1 1and1 1and2 2and1 2and2
SiO2 38.00 38.73 37.99 37.85 46.98 46.51 51.28 46.90 46.92 66.12 66.12 0.47 37.33 37.37 37.22 37.17TiO2 1.67 1.42 1.84 1.67 0.20 0.92 0.01 0.14 0.63 0.12 0.11 16.78 0.02 0.02 BDL BDLAl2O3 17.82 20.03 17.23 17.41 33.47 33.39 31.33 36.24 33.49 19.01 18.69 0.37 60.46 60.46 60.75 60.43Cr2O3 0.08 0.07 0.09 0.03 0.04 BDL 0.03 0.10 0.01 0.02 0.05 0.04 BDL 0.05 0.02 0.01Fe2O3 0.00 0.00 0.00 0.00 0.00 1.12 0.00 0.95 0.00 0.01 0.07 63.93 BDL BDL BDL BDLFeO 15.2 13.38 15.04 15.12 3.48 2.28 3.18 1.87 3.68 0.00 0.00 13.76 2.17 2.11 1.95 2.06MnO 0.71 0.49 0.51 0.46 0.05 0.04 0.01 0.04 0.02 0.09 0.02 1.77 0.03 BDL 0.05 BDLMgO 12.58 11.58 13.35 13.25 0.71 0.99 0.46 0.47 0.53 0.16 0.11 0.00 0.26 0.13 0.09 0.43CaO 0.00 0.07 0.01 0.24 0.01 0.04 0.02 0.08 0.03 0.02 0.09 0.05 BDL 0.04 0.02 BDLNa2O 0.14 0.14 0.09 0.12 0.49 0.59 0.50 0.46 0.47 1.11 0.62 0.00 BDL BDL BDL BDLK2O 10.23 10.10 10.10 9.71 10.80 10.01 9.83 10.41 10.45 15.32 15.22 0.01 BDL BDL 0.01 0.01Totals 96.44 96.01 96.25 95.86 96.23 95.89 96.65 97.65 96.23 101.98 101.10 97.18 100.09 100.17 100.11 100.07
Oxygens 11 11 11 11 11 11 11 11 11 8 8 3Si 2.81 2.83 2.81 2.81 3.13 3.10 3.36 3.06 3.13 2.98 3.00 0.01Ti 0.09 0.08 0.10 0.09 0.01 0.05 – 0.01 0.03 <0.01 <0.01 0.34Al 1.55 1.73 1.50 1.52 2.63 2.62 2.42 2.79 2.63 1.01 1.00 0.01Cr 0.01 <0.01 0.01 <0.01 <0.01 – <0.01 0.01 <0.01 <0.01 <0.01 <0.01Fe3+ – – – – – 0.06 – 0.05 – – <0.01 1.29Fe2+ 0.94 0.82 0.93 0.94 0.19 0.13 0.17 0.10 0.21 – – 0.31Mn 0.05 0.03 0.03 0.03 <0.01 <0.01 <0.01 <0.01 <0.01 <0.01 <0.01 0.04Mg 1.39 1.26 1.47 1.46 0.07 01.0 0.05 0.05 0.05 0.01 0.01 –Ca – 0.01 <0.01 0.02 <0.01 <0.01 <0.01 0.01 <0.01 <0.01 <0.01 <0.01Na 0.02 0.02 0.01 0.02 0.06 0.08 0.06 0.06 0.06 0.10 0.06 –K 0.97 0.94 0.95 0.92 0.92 0.85 0.82 0.87 0.89 0.88 0.88 –
Phl 0.09 0.08 0.10 0.10 Mu 0.66 0.62 0.55 0.74 0.64 San 0.91 0.94 Ilm 0.10Ann 0.03 0.02 0.02 0.02 Cel 0.02 0.02 0.03 <0.01 0.01 Ab 0.61 0.39 Hem 0.41Aast 0.06 0.06 0.07 0.06 Fcel 0.05 0.03 0.10 0.00 0.05 Prh 0.01
Pa 0.34 0.26 0.46 0.19 0.29 Gei 0.00
Sample 142-1bi1 142-1bi2 142-2bi2 142-2bi3 142-1mu1 142-1mu2 142-1mu3 142-2mu1 142-2mu4 142-1kfs3 142-2kfs2 142-ilinc1 142-and1 142-and2 142-1and1 142-1and3
SiO2 37.03 36.87 37.37 36.85 47.88 47.03 48.48 46.99 47.01 64.47 64.55 0.44 36.82 36.50 36.50 36.80TiO2 0.75 0.12 1.10 1.24 0.04 0 0.21 0.63 0.43 0.25 0.31 11.16 0.04 0.08 0.06 0.05Al2O3 19.57 19.78 19.55 19.27 35.21 34.52 36.59 33.26 34.46 18.59 18.69 0.26 61.79 61.02 60.89 60.73Cr2O3 0.01 0.02 0.01 0.03 0.04 0.04 0.03 0.05 0.04 0.02 0.06 0.07 0.02 0.05 BDL 0.01Fe2O3 0.00 2.11 0.25 0.00 2.72 2.6 2.06 3.31 2.46 0.13 0.19 74.48 BDL BDL BDL BDLFeO 15.55 13.72 16.24 16.63 1.05 1 0.8 1.28 0.95 0 0 8.78 1.47 1.68 1.89 2.28MnO 0.34 0.30 0.38 0.38 0.03 0.08 0.04 0.02 0.01 0.03 0.03 1.45 0.04 0.01 0.03 0.02MgO 12.62 13.49 12.35 11.97 0.85 0.85 0.44 1.13 0.92 0.12 0.09 0.03 0.15 0.10 BDL 0.18CaO 0.01 0.02 0.03 0.04 0.02 0.01 0 0.06 0.06 0.02 0.05 0.02 0.03 0.02 0.03 0.05Na2O 0.15 0.06 0.07 0.10 0.42 0.35 0.36 0.33 0.32 0.65 0.62 0.03 0.01 0.00 0.01 BDLK2O 9.97 9.68 9.11 9.77 9.04 8.72 9.12 9.17 8.26 15.18 15.36 0.03 0.04 0.01 0.06 BDLTotals 96.00 96.17 96.46 96.28 97.3 95.2 98.13 96.23 94.92 99.46 99.95 96.75 100.28 99.43 99.32 100.03
Oxygens 11 11 11 11 11 11 11 11 11 8 8 3Si 2.74 2.72 2.75 2.74 3.11 3.11 3.10 3.10 3.11 2.98 2.98 0.01Ti 0.04 0.01 0.06 0.07 <0.01 – 0.01 0.03 0.02 0.01 0.01 0.23Al 1.71 1.72 1.70 1.69 2.69 2.69 2.76 2.59 2.69 1.01 1.02 0.01Cr <0.01 <0.01 <0.01 <0.01 <0.01 <0.01 <0.01 <0.01 <0.01 <0.01 <0.01 <0.01Fe3+ – 0.12 0.01 – 0.13 0.13 0.10 0.17 0.122 0.01 0.01 1.52Fe2+ 0.96 0.84 1.00 1.03 0.06 0.06 0.04 0.07 0.05 – – 0.20Mn 0.02 0.02 0.02 0.02 <0.01 <0.01 <0.01 <0.01 <0.01 <0.01 <0.01 0.03Mg 1.39 1.48 1.36 1.33 0.08 0.08 0.04 0.11 0.09 0.01 0.01 <0.01

M.
Hassan
et al.
/ Precam
brian R
esearch 241 (2014) 104– 128
119
Table 5 (Continued)
Sample 142-1bi1 142-1bi2 142-2bi2 142-2bi3 142-1mu1 142-1mu2 142-1mu3 142-2mu1 142-2mu4 142-1kfs3 142-2kfs2 142-ilinc1 142-and1 142-and2 142-1and1 142-1and3
Ca <0.01 <0.01 – <0.01 <0.01 <0.01 – <0.01 <0.01 <0.01 <0.01 <0.01Na 0.02 0.01 0.01 0.02 0.05 0.05 0.05 0.04 0.04 0.06 0.06 <0.01K 0.94 0.91 0.86 0.93 0.75 0.74 0.75 0.77 0.70 0.90 0.90 <0.01
Phl 0.10 0.10 0.08 0.08 Mu 0.73 0.75 0.78 0.66 0.77 San 0.94 0.94 Ilm 0.05Ann 0.03 0.02 0.03 0.03 Cel – – – 0.01 – Ab 0.41 0.39 Hem 0.57Aast 0.08 0.09 0.07 0.07 Fcel – – – <0.01 – Prh 0.01
Pa 0.09 0.07 0.09 0.07 0.06 Gei 0.00
Sample273A 2bt2 2bt4 3bt2 1bi3 1muin 1mu1 1mu2 1mu3 4mu2 1Xkfs3 4kfs3 1ill1 1and1 1and2 2and1 2and2
SiO2 37.60 36.49 36.39 40.17 46.26 47.22 49.12 48.58 47.15 65.88 65.63 0.43 36.50 36.75 36.90 36.66TiO2 1.85 1.94 2.51 2.01 0.09 0.01 0.04 0.05 0.09 0.09 0.01 14.28 0.10 BDL BDL BDLAl2O3 17.41 17.60 16.04 15.57 34.96 35.46 34.97 34.55 34.53 18.52 18.50 0.02 62.57 61.76 62.65 61.77Cr2O3 0.02 0.02 0.01 0.07 0.05 0.01 0.02 0.02 0.04 0.07 0.07 0.05 BDL 0.09 0.07 BDLFe2O3 0.00 0.00 0.00 0.00 0.00 0.00 2.34 2.36 2.57 0.12 0.03 69.06 BDL BDL BDL BDLFeO 16.37 16.91 16.42 18.59 2.94 1.83 0.90 0.98 0.99 BDL BDL 12.56 1.23 1.79 1.43 1.50MnO 0.57 0.68 0.67 0.64 0.04 0.02 0.02 0.11 BDL 0.01 0.07 0.52 0.01 BDL 0.02 0.04MgO 10.56 10.23 11.82 10.69 0.42 0.21 0.77 0.60 0.55 0.07 0.23 0.08 0.06 0.11 0.29 BDLCaO 0.02 0.04 0.01 0.05 0.10 0.06 BDL BDL 0.06 BDL 0.04 0.00 0.06 0.04 BDL 0.09Na2O 0.14 0.13 0.06 0.04 0.35 0.28 0.33 0.30 0.36 0.86 1.33 0.02 0.01 0.01 0.01 0.01K2O 9.91 9.99 9.94 7.53 10.84 10.98 8.81 9.21 9.06 15.19 14.69 0.01 BDL 0.02 BDL 0.02Totals 94.45 94.03 93.87 95.36 96.05 96.08 97.32 96.77 95.41 100.81 100.6 97.03 100.53 100.54 101.27 99.85
Oxygens 11 11 11 11 11 11 11 11 11 8 8 3Si 2.85 2.80 2.79 2.99 3.08 3.12 3.17 3.16 3.12 3.00 3.00 0.01Ti 0.11 0.11 0.15 0.11 0.01 0.00 <0.01 <0.01 <0.01 <0.01 0.00 0.29Al 1.56 1.59 1.45 1.37 2.75 2.76 2.66 2.65 2.69 1.00 1.00 <0.01Cr <0.01 <0.01 <0.01 <0.01 <0.01 <0.01 <0.01 <0.01 <0.01 <0.01 <0.01 <0.01Fe3+ 0.00 0.00 0.00 0.00 0.00 0.00 0.11 0.12 0.13 <0.01 <0.01 1.40Fe2+ 1.04 1.08 1.05 1.16 0.16 0.10 0.05 0.05 0.06 0.00 0.00 0.28Mn 0.04 0.04 0.04 0.04 <0.01 <0.01 <0.01 0.01 0.00 0.00 <0.01 0.01Mg 1.19 1.17 1.35 1.19 0.04 0.02 0.07 0.06 0.05 0.01 0.02 <0.01Ca <0.01 <0.01 <0.01 <0.01 0.01 <0.01 0.00 0.00 <0.01 0.00 <0.01 0.00Na 0.02 0.02 0.01 0.01 0.05 0.04 0.04 0.04 0.05 0.08 0.12 <0.01K 0.96 0.98 0.97 0.72 0.92 0.93 0.72 0.77 0.77 0.88 0.86 0.00
Phl 0.06 0.06 0.07 0.05 Mu 0.74 0.80 0.74 0.73 0.73 San 0.93 0.89 Ilm 0.08Ann 0.04 0.04 0.04 0.04 Cel 0.01 0.01 – – – Ab 0.51 0.71 Hem 0.50East 0.04 0.05 0.05 0.03 Fcel 0.03 0.03 – – – Prh <0.01
Pa 0.22 0.21 0.08 0.09 0.10 Gei <0.01

120 M. Hassan et al. / Precambrian Research 241 (2014) 104– 128
Fig. 6. Mineral chemistry. (a) Si versus Mg/(Mg + Fe2+) for the studied amphiboles. Classification is after Leake et al. (1997). (b) Chlorite chemistry of metavolcanics andmetasediments showing its distribution with respect to end members and XFe content. (c) Chlorite chemistry of metavolcanics and metasediments showing differences inMnO, MgO and FeO contents. (d) Garnet chemistry of metasedimentary rocks and metacarbonates in terms of Mn, Ca and Fe2+ end members. (e) Profile illustrating the changeo tempea
wANmn2o
f garnet chemistry across a garnet crystal in metasedimentary rock. (f) Pressure–rea represents the composition of the studied white micas.
The amphiboles of the studied samples are calcic amphibolesith a homogenous composition of magnesio hornblende (Fig. 6a).mphiboles in all studied rocks have a total number of cations ofa + K less than 0.50 and low Ti content (0.01–0.13). Total alu-
inum contents Alt of the amphiboles of metavolcanic rocks areormally higher than those in metasedimentary rocks (Tables 1 and). There is no significant differences in Alt content of the amphibolef the intrusive granitoids.
rature plot with Si isopleths for white mica, Si content per formula unit. The gray
Chlorite is common to all rock types except the aluminosilicates-bearing metasedimentary rocks. The chlorite in themetavolcanics has XFe = 0.31–0.54, while in the metasedimentaryrocks (Table 3), it has a wide range of XFe = 0.18–0.62 (Fig. 6b).
Large difference in composition of chlorite in the same sample isdistinguishable in some of the metasedimentary rocks. Mn-richchlorite is characteristic of the garnet-bearing metasedimentaryrocks (Fig. 6c).
M. Hassan et al. / Precambrian Research 241 (2014) 104– 128 121
F ic andC
iGegr
ig. 7. Estimated pressure and temperature conditions of the low-grade metavolcanalculation done using THERMOCALC (Powell and Holland, 1988).
Garnet is observed just in two lithologies as grossular garnetn metacarbonate sediments with end-members activity of Alm0.30
rs0.70 (Fig. 6d) and as spessartine in the metapelitic rocks withnd-member activity of Sps0.67 Alm0.20 Grs0.12 Prp0.01 (Table 4). Thearnet of the metapelitic rocks exhibits chemical zonation as a Ca-ich rim (Fig. 6e) with XCa = [Ca/(Fe + Mg + Mn + Ca)] in the range ofmetasedimentary rocks based on the reactions between the mineral end-members.
0.14–0.16. The XFe = [Fe/(Fe + Mg + Mn)] of the garnet is 0.12, 0.21and 0.29 for the core, intermediate and rim zones, respectively
(Fig. 6e).Biotite is absent in the mafic metavolcanics, abundant inthe intermediate and the felsic metavolcanics, while it is dom-inant in the metasedimentary rocks. Biotite has low Ti content
1 an Research 241 (2014) 104– 128
icXSmu
ulcwpctog
6
(ocdtsubpa
pwTftrdwafb
wsisbcbtasmtmasbbTM3
r
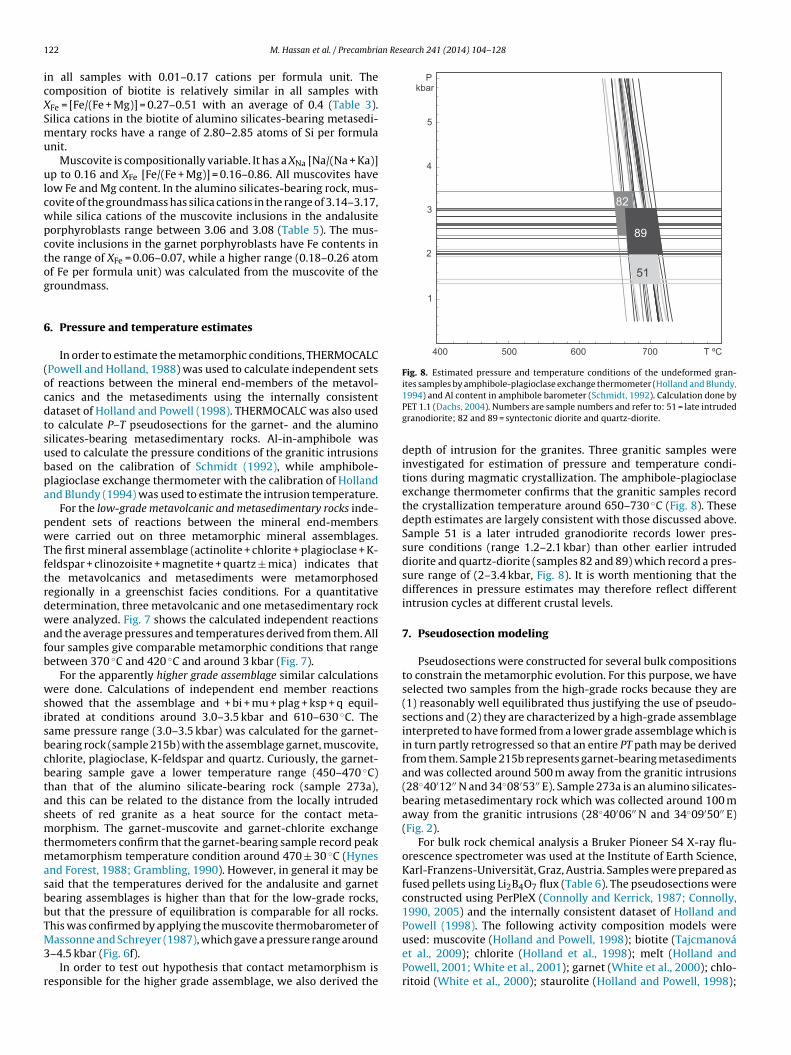
Fig. 8. Estimated pressure and temperature conditions of the undeformed gran-ites samples by amphibole-plagioclase exchange thermometer (Holland and Blundy,
22 M. Hassan et al. / Precambri
n all samples with 0.01–0.17 cations per formula unit. Theomposition of biotite is relatively similar in all samples withFe = [Fe/(Fe + Mg)] = 0.27–0.51 with an average of 0.4 (Table 3).ilica cations in the biotite of alumino silicates-bearing metasedi-entary rocks have a range of 2.80–2.85 atoms of Si per formula
nit.Muscovite is compositionally variable. It has a XNa [Na/(Na + Ka)]
p to 0.16 and XFe [Fe/(Fe + Mg)] = 0.16–0.86. All muscovites haveow Fe and Mg content. In the alumino silicates-bearing rock, mus-ovite of the groundmass has silica cations in the range of 3.14–3.17,hile silica cations of the muscovite inclusions in the andalusiteorphyroblasts range between 3.06 and 3.08 (Table 5). The mus-ovite inclusions in the garnet porphyroblasts have Fe contents inhe range of XFe = 0.06–0.07, while a higher range (0.18–0.26 atomf Fe per formula unit) was calculated from the muscovite of theroundmass.
. Pressure and temperature estimates
In order to estimate the metamorphic conditions, THERMOCALCPowell and Holland, 1988) was used to calculate independent setsf reactions between the mineral end-members of the metavol-anics and the metasediments using the internally consistentataset of Holland and Powell (1998). THERMOCALC was also usedo calculate P–T pseudosections for the garnet- and the aluminoilicates-bearing metasedimentary rocks. Al-in-amphibole wassed to calculate the pressure conditions of the granitic intrusionsased on the calibration of Schmidt (1992), while amphibole-lagioclase exchange thermometer with the calibration of Hollandnd Blundy (1994) was used to estimate the intrusion temperature.
For the low-grade metavolcanic and metasedimentary rocks inde-endent sets of reactions between the mineral end-membersere carried out on three metamorphic mineral assemblages.
he first mineral assemblage (actinolite + chlorite + plagioclase + K-eldspar + clinozoisite + magnetite + quartz ± mica) indicates thathe metavolcanics and metasediments were metamorphosedegionally in a greenschist facies conditions. For a quantitativeetermination, three metavolcanic and one metasedimentary rockere analyzed. Fig. 7 shows the calculated independent reactions
nd the average pressures and temperatures derived from them. Allour samples give comparable metamorphic conditions that rangeetween 370 ◦C and 420 ◦C and around 3 kbar (Fig. 7).
For the apparently higher grade assemblage similar calculationsere done. Calculations of independent end member reactions
howed that the assemblage and + bi + mu + plag + ksp + q equil-brated at conditions around 3.0–3.5 kbar and 610–630 ◦C. Theame pressure range (3.0–3.5 kbar) was calculated for the garnet-earing rock (sample 215b) with the assemblage garnet, muscovite,hlorite, plagioclase, K-feldspar and quartz. Curiously, the garnet-earing sample gave a lower temperature range (450–470 ◦C)han that of the alumino silicate-bearing rock (sample 273a),nd this can be related to the distance from the locally intrudedheets of red granite as a heat source for the contact meta-orphism. The garnet-muscovite and garnet-chlorite exchange
hermometers confirm that the garnet-bearing sample record peaketamorphism temperature condition around 470 ± 30 ◦C (Hynes
nd Forest, 1988; Grambling, 1990). However, in general it may beaid that the temperatures derived for the andalusite and garnetearing assemblages is higher than that for the low-grade rocks,ut that the pressure of equilibration is comparable for all rocks.his was confirmed by applying the muscovite thermobarometer of
assonne and Schreyer (1987), which gave a pressure range around–4.5 kbar (Fig. 6f).In order to test out hypothesis that contact metamorphism is
esponsible for the higher grade assemblage, we also derived the
1994) and Al content in amphibole barometer (Schmidt, 1992). Calculation done byPET 1.1 (Dachs, 2004). Numbers are sample numbers and refer to: 51 = late intrudedgranodiorite; 82 and 89 = syntectonic diorite and quartz-diorite.
depth of intrusion for the granites. Three granitic samples wereinvestigated for estimation of pressure and temperature condi-tions during magmatic crystallization. The amphibole-plagioclaseexchange thermometer confirms that the granitic samples recordthe crystallization temperature around 650–730 ◦C (Fig. 8). Thesedepth estimates are largely consistent with those discussed above.Sample 51 is a later intruded granodiorite records lower pres-sure conditions (range 1.2–2.1 kbar) than other earlier intrudeddiorite and quartz-diorite (samples 82 and 89) which record a pres-sure range of (2–3.4 kbar, Fig. 8). It is worth mentioning that thedifferences in pressure estimates may therefore reflect differentintrusion cycles at different crustal levels.
7. Pseudosection modeling
Pseudosections were constructed for several bulk compositionsto constrain the metamorphic evolution. For this purpose, we haveselected two samples from the high-grade rocks because they are(1) reasonably well equilibrated thus justifying the use of pseudo-sections and (2) they are characterized by a high-grade assemblageinterpreted to have formed from a lower grade assemblage which isin turn partly retrogressed so that an entire PT path may be derivedfrom them. Sample 215b represents garnet-bearing metasedimentsand was collected around 500 m away from the granitic intrusions(28◦40′12′′ N and 34◦08′53′′ E). Sample 273a is an alumino silicates-bearing metasedimentary rock which was collected around 100 maway from the granitic intrusions (28◦40′06′′ N and 34◦09′50′′ E)(Fig. 2).
For bulk rock chemical analysis a Bruker Pioneer S4 X-ray flu-orescence spectrometer was used at the Institute of Earth Science,Karl-Franzens-Universität, Graz, Austria. Samples were prepared asfused pellets using Li2B4O7 flux (Table 6). The pseudosections wereconstructed using PerPleX (Connolly and Kerrick, 1987; Connolly,1990, 2005) and the internally consistent dataset of Holland andPowell (1998). The following activity composition models were
used: muscovite (Holland and Powell, 1998); biotite (Tajcmanováet al., 2009); chlorite (Holland et al., 1998); melt (Holland andPowell, 2001; White et al., 2001); garnet (White et al., 2000); chlo-ritoid (White et al., 2000); staurolite (Holland and Powell, 1998);
M. Hassan et al. / Precambrian Res
Table 6Bulk rock chemical analysis of studied garnet- or alumino silicates-bearingmetasedimentary rocks of Sa’al–Zaghra metamorphic complex (major oxides arerepresented in wt.% and trace elements in ppm; LOI, loss of ignition; BDL, belowdetection limit).
Sample 215b 273a 142 123c
SiO2 (wt%) 54.20 69.99 72.77 77.65TiO2 1.41 0.17 0.30 0.14Al2O3 17.81 14.73 14.54 11.43Fe2O3 11.37 3.15 2.20 1.84MnO 2.32 0.04 0.04 0.04MgO 2.16 0.26 0.86 0.25CaO 1.09 0.40 0.52 0.99Na2O 0.19 3.04 3.26 3.37K2O 5.60 5.97 3.12 2.75P2O3 0.45 0.01 0.03 0.02LOI 3.35 0.56 1.46 0.54Totals 99.95 98.62 99.48 99.33
Ba (ppm) 416 104 802 326Ce 41 133 66 102Co 43 159 177 209Cr 75 BDL BDL BDLCs BDL BDL BDL BDLCu 843 62 132 56Ga 39 25 20 16La 96 72 43 52Nb 25 27 15 21Nd 107 53 37 49Ni BDL BDL BDL BDLPb 48 BDL BDL BDLPr BDL BDL BDL BDLRb 277 174 77 86Sc 20 BDL BDL BDLSr 39 29 118 70Th BDL 20 BDL BDLU BDL BDL BDL BDLV 158 BDL BDL BDLY 103 37 28 46
pHtapq
7
ttasfiwa4
nismigtmsiw
Zn 1794 41 83 50Zr 204 664 271 169
lagioclase (Newton et al., 1980); and K-feldspar (Thompson andovis, 1979). For cordierite we assumed ideal mixing. In addi-
ion, the following phases were used without solution models:ndalusite, kyanite, sillimanite, kaolinite, pyrophyllite, diaspora,umpellyite, lawsonite, prehnite, wairakite, analcite, laumontite,uartz and H2O.
.1. Garnet-bearing sample
The P–T pseudosection for this sample was calculated in the sys-em MnNCKFMASH since these components represent 98.12% ofhe XRF-derived bulk composition of sample 215b (Table 6). Quartznd H2O are assumed to be in excess. The P–T pseudosection ofample 215b is characterized by a series of mineral assemblageelds with steep boundaries (Fig. 9). Garnet is a stable phase over aide P–T range. The garnet-in reactions occur as isothermal bound-
ries in a temperature range of 250–270 ◦C. Chlorite is stable below60 ◦C.
The stable minerals of sample 215b are chlorite, muscovite, gar-et, albite, K-feldspar and quartz. This mineral assemblage appears
n Fig. 9 in a quadrivariant field in the region (280–355 ◦C and pres-ure is <3.2 kbar). However the garnet chemistry and that of theuscovite inclusions in garnet show that part of the rock equil-
brated at higher temperatures. The muscovite inclusions in thearnet crystals have XFe in the range of 0.06–0.07 (pfu) and most ofhe garnet has an XFe between 0.12 and 0.19. The Fe isopleths of the
uscovite intersect the XFe contours for the garnet roughly in theame PT range in Fig. 9 as derived from the average PT calculations,.e. roughly around 450 ◦C and 3 kbar. This indicates that plagioclase
as a stable mineral during garnet nucleation process. The garnet
earch 241 (2014) 104– 128 123
crystals have Ca-rich rims (i.e. XCa is in the range of 0.14–0.16).These rims are in equilibrium with the muscovite of the externalfoliation thus intersections between the XCa isopleths and the Fecontent (0.18–0.26 pfu) of the muscovite may be used to constraina point along the retrograde path of this sample, consistent with anisobaric cooling path.
In summary, the easiest interpretation of the compositionalvariations is to suggest that the rock equilibrated at about 300 ◦Cand 3 kbar with a limited excursion (and partial re-equilibration) to450–480 ◦C and similar pressure, followed by cooling to 300–350 ◦Cat the same crustal level. This interpretation is consistent with boththe thermobarometric calculations and the pseudosection in Fig. 9and suggests contact metamorphic heating and subsequent coolingto a low-grade regional metamorphic event.
7.2. Alumino silicates-bearing sample
In contrast to sample 215b, the MnO content of sample273a is only 0.038 wt.% (Table 6). Therefore the thermo-dynamic system was reduced to be NCKFMASH (Fig. 10).The P–T pseudosection is characterized by a relative sim-ple topology at temperature conditions �660 ◦C. Foursillimanite-bearing assemblages (sill + bi + pl + ksp + q + H2O;sill + bi + pl + ksp + q + H2O + liq; sill + cd + bi + pl + ksp + q + H2O + liq;sill + bi + pl + ksp + H2O + liq) and four andalusite-bearing assemblages (and + cd + bi + pl + ksp + q + H2O;and + bi + mu + pl + ksp + q + H2O; and + bi + pl + ksp + q + H2O;and + cd + bi + pl + ksp + q + H2O + liq) are stable below3.9 kbar and in a temperature range of 560–660 ◦C.Three univariant reactions appear in the pseudosection,two of them (bi + mu + chl + ab + ksp + lmt + pre + q + H2O;bi + mu + chl + ab + ksp + wrk + pre + q + H2O) at low tempera-ture (290–340 ◦C), while an alumino silicate-bearing univariantreaction appears at higher temperature (650–655 ◦C). Clinozoisiteis stable over a wide range of pressure (1.3–6 kbar) but in a narrowtemperature window (345–460 ◦C).
The inferred equilibrium mineral assemblage of sample 273ais alumino silicate–biotite–plagioclase–K-feldspar and quartz withboth andalusite and sillimanite occurring as alumino silicatesphases and pervasive late muscovite replacing most of it (seepetrography section). This assemblage is stable between 2.9 and3.5 kbar and in a temperature range of 630–650 ◦C (Fig. 10). Thepost-peak conditions can be identified using the Si content of themica in the groundmass surrounding the porphyroblasts. The Siisopleths of biotite and muscovite intersect in a temperature rangeof 425–500 ◦C and in a pressure range of 2.3–4.4 kbar. Muscovitethermobarometer (Fig. 6f) indicates that the post-peak micas arestable in a P–T range of 3–4.5 kbar and 440–510 ◦C (P and T rangebars of Fig. 10). Muscovite inclusions may be used to get some infor-mation about the pre-peak conditions. The two black bold lines ofFig. 10 show the limiting content of the Si in the chemical formulaof the muscovite inclusions. The Si contents indicate that the pre-peak assemblage can be at any condition between 450 and 630 ◦Cand in a pressure range below 4 kbar. All of this evidence confirmsthe interpretation of the garnet-bearing sample discussed in Fig. 9.It shows that the rock equilibrated between 400 and 450 ◦C andaround 3 kbar and that it also partially equilibrated at higher tem-peratures and comparable pressures. As for sample 215b, both isconsistent with an interpretation of low-grade regional metamor-phism overprinted by a contact metamorphic event.
8. Discussion
The majority of the metavolcanic-metasedimentary associa-tions of the Sa’al–Zaghra Complex show good preservation of

124 M. Hassan et al. / Precambrian Research 241 (2014) 104– 128
Fig. 9. P–T pseudosection for the garnet-bearing sample number 215b. The two white dashed lines represent the garnet composition of the intermediate zone. The redp of the
t
ptidttedSttgmmetm6
D4nm9Tq
olygons indicate conditions constrained by mineral isopleths. (For interpretation
he article.)
rimary volcanic and sedimentary microstructures (e.g. porphyriticexture; Fig. 4b) and have been affected by only low-strain typicallynvolving a weakly developed foliation parallel to layering and bed-ing planes. The P–T history of the Sa’al–Zaghra Complex showshat most of the rocks equilibrated at similar temperature condi-ions around 370–420 ◦C and pressures around 2.5–3.2 kbar. This isquivalent to a crustal depth variation of 9–11.5 km (for an overbur-en density 2850 kg m−3 and assuming lithostatic conditions). Thea’al–Zaghra area was later intruded by granitoids, which cut acrosshe foliations. The pressure conditions for the granodiorite andhe diorite intrusions (earlier) are 2.5–3.4 kbar, whereas the laterranitic intrusions have pressures of 1.4–2 kbar attending mag-atic crystallization. These differences in the pressure conditionsay reflect distinct crustal levels of intrusion relating to differ-
nt intrusion phases. The early syntectonic intrusions (in particularhe red gneissic granite sheets, Fig. 3g) caused local contact meta-
orphism, resulting in partial equilibration of the assemblages at30–650 ◦C.
For the Sa’al–Zaghra complex we suggest that the flat lying1 fabric in association with the metamorphic conditions around00 ◦C and 3 kbar indicate metamorphism during a crustal thin-ing event that occurred during an extension regime. The peak
etamorphism of the M1 in the study area occurred at a depth of–11.5 km corresponding to a geothermal gradient of 38–41 ◦C/km.his is much higher than the geothermal gradients for the subse-uent event as derived for the Feiran–Solaf region (25–27 ◦C/km
reference to color in this figure legend, the reader is referred to the web version of
for the Pan-African event at ca. 632 Ma; Abu-Alam and Stüwe,2009) or the Gabal Samra metapelites from the same general region(27 ◦C/km; Abu El-Enen, 2011). Although the local remarked highergeothermal gradient in Sinai (43–50 ◦C/Km) which is related toheat flow transferred from nearby granite intrusions (Eliwa et al.,2008; Abu El-Enen, 2011), we suggest that the higher geother-mal gradients during the earlier M1 event in the Sa’al–Zaghracomplex may be interpreted as additional evidence for an exten-sional setting and crustal thinning during D1. In the remainder ofthis paper an attempt is made to derive a metamorphic evolutionfor the Sa’al–Zaghra complex and compare this with metamor-phic histories of other complexes of Sinai. The implications ofthese discussions for the tectonic evolution of the Arabia-NubianShield at the stage between Rodinia rifting and East- and West-Gondwanaland collision will then be considered.
8.1. Age and origin of the Sa’al–Zaghra complex
Recently published zircon U–Pb analyses of volcanic ash-flowyielded concordia ages of 1030 ± 5 Ma interpreted to representcrystallization ages of their magma chambers, while calc-alkalinevolcanic and intrusive rocks of Wadi Sa’al area yielded ages of ca.
1030–1020 Ma (Be’eri-Shlevin et al., 2012). Nevertheless, timingof volcanic activity, sedimentation, deformation and metamor-phism of the metavolcanics and metasedimentary associations inthe Sa’al–Zaghra complex are unclear. Abu Anbar et al. (2009)
M. Hassan et al. / Precambrian Research 241 (2014) 104– 128 125
es-be
cbaaaAwwtFmsca
pap6uZetx
Fig. 10. P–T pseudosection for the alumino silicat
oncluded that the age of the rhyolitic-dacitic parents that laterecame deformed and metamorphosed to form the schists of Sa’alrea was 873 ± 16 Ma, while the metavolcanics unconformablybove the schists were dated at 736 ± 22 Ma. Bielski (1982) gaven average Rb–Sr age of 734 ± 17 Ma for the metavolcanic rocks.bu Anbar et al. (2009) noted that schists were associated onlyith the metasediments, but the schists found to be associated alsoith the metavolcanics, and no evidence of unconformity between
he schists (El-Rayan phyllites) and the metavolcanics (Agramiyam). This casts some doubt on the idea that the schistosity andetamorphism formed before the metavolcanics, and therefore the
ignificant age difference between schists (873 Ma) and metavol-anics (736 Ma) may reflect isotopic disturbance rather than realge differences.
Sa’al Conglomerate pebble ages by Priem et al. (1984) apparentlylaced a maximum age of 757 ± 28 Ma on conglomerate deposition,nd may be revised to 672 Ma according to recent data (Andresen,ers. commun.). A zircon population dated by Stern et al. (2010) at06 ± 10 Ma was also found to accompany a second zircon pop-lation dated at 931 ± 14 Ma in diorite boulders from the Wadi
aghra conglomerates. Stern et al. (2010) offered two possiblexplanations for the ∼605 Ma zircons. The first was that they datedhe diorite magma, and that the older population (∼930 Ma) wasenocrysts in the diorite magma. The second explanation was thataring sample for the phases that cited in the text.
both populations define a discordia giving a magmatic age for thediorite of 1045 ± 55 Ma (upper intercept) and a Pb-loss event affect-ing the zircons at about 569 ± 55 Ma. These data do not conclusivelyshow either an old (∼1 Ga) or young (∼600 Ma) age for the WadiZaghra conglomerates.
El-Gaby et al. (2002) concluded that the Sa’al–Zaghra complexis a relatively undeformed, unmetamorphosed succession relatedto the younger Dokhan volcanics and can also be correlated toHammamat molasse sediments of the Eastern Desert of Egypt. Incontrast to this, detrital zircon from the Sa’al andalusite-bearingschist gave concordant ages of 1029 ± 7 Ma and 1110 ± 8 Ma (Be’eri-Shlevin et al., 2012). In addition, El-Rayan pelitic sedimentaryrocks yielded a bimodal age pattern of 1003 and 1110 Ma (Be’eri-Shlevin et al., 2009). Moreover, whole-rock εNd (t = 1.0 Ga) valueof +2 is significantly lower than found for juvenile Neoprotero-zoic rocks in the Arabian-Nubian Shield which led Be’eri-Shlevinet al. (2009) to interpret the Sa’al schist to represent Kibaran(Grenville) age crust incorporated into the northernmost part ofthe Arabian-Nubian Shield. The volcanic activity that formed mostof the Sa’al–Zaghra complex appears to have occurred in the time
interval of 1110–1030 Ma (Stern et al., 2010; Be’eri-Shlevin et al.,2012).The single dynamothermal metamorphic event (M1) in thestudy area began during the development of layering-parallel

126 M. Hassan et al. / Precambrian Research 241 (2014) 104– 128
tudy a
fltsNtg2s1cass
iSai(oailontca
8
rmcp(
Fig. 11. The relation of metamorphism and deformation in the s
oliation (D1) and may have reached peak temperatures in theast stages of this foliation-forming event. This event is believedo have involved horizontal NW–SE tectonic extension. The exten-ion event was followed by two compressional deformations. TheW–SE compressive D2 event may overlap with the intrusion of
he El-Fringa metagabbro. The foliation of the complex is cut byabbro with an intrusion age of 1017 ± 5 Ma (Be’eri-Shlevin et al.,009), consequently the metamorphism and the crustal exten-ional in the Sa’al–Zaghra area practicably occurred in the interval030–1017 Ma. These observations are consistent with the vol-anic rocks of the complex being formed and metamorphosed inn extensional setting older than 1017 ± 5 Ma, and therefore pos-ibly occurring during the early stages of breakup of the Rodiniaupercontinent.
Based on sediment composition and volcanic rock geochem-stry, Shimron et al. (1993) and El-Gaby et al. (2002) interpreted thea’al–Zaghra rocks as a volcano-sedimentary succession of islandrc to active continental margin affinities, though heterogene-ty and magma mixing may have occurred, according to Soliman1986), Mehanna (2000) and Abu Anbar et al. (2009). However,ur preferred interpretation is that the Sa’al–Zaghra complex was
rift-related volcano-sedimentary assemblage that formed dur-ng the early stages of the break-up of Rodinia, according to theithological characteristics of the volcanic-sedimentary assemblagef the complex. The amount of felsic volcanism in the complex isot compatible with island arc volcanism. Also, volcanic rocks ofhe Agramiya Formation are bimodal, typical of rift volcanism. Theonglomerates of Zaghra Formation could have been deposited onlluvium fans close to the border faults of the rifted margins.
.2. Sa’al–Zaghra complex in the context of Sinai tectonism
Abu-Alam and Stüwe (2009) found remnants of an earlier fab-ic as inclusion trails in garnet porphyroblasts of the Feiran–Solaf
etamorphic complex (west of the Sa’al–Zaghra area). Theyoncluded that these early fabric represented an early metamor-hic phase (M1) of the Feiran–Solaf area. Fowler and Hassen2008) showed that the principal shortening strain during the M1
rea in the content of the evolution of the Arabian Nubian Shield.
metamorphic event in the Feiran–Solaf area was a vertical flatten-ing with stretching had occurred in the NW–SE direction and, toa lesser degree, the NE–SW direction. This early extensional eventreflected a larger-scale extension related to the breakup of Rodinia(Fowler and Hassen, 2008) and that may correlate with the firstdeformation phase in the Sa’al–Zaghra metamorphic complex.
Ali et al. (2009) concluded that the presence of inherited zir-cons with ages of ∼1790 Ma in syenogranite from Sinai indicatesthat older material is present within the basement. Rock fragmentsof age ca. 900–1100 Ma were found in the volcano-sedimentarysuccession at Wadi Rutig, Sinai (Samuel et al., 2011). In additionto these late mesoproterozoic fragments, other rock fragmentswith a Pan-African age 629–615 Ma can be found. Abu El-Enenand Whitehouse (2013) found that the metapsammitic gneiss inSolaf area of the Feiran–Solaf complex has a Mesoproterozoicage (1.0 Ga). These age data can be interpreted in the context ofBe’eri-Shlevin et al.’s (2012) data from the Sa’al–Zaghra complex(1110–1030 Ma) to indicate a possibility of that the Sa’al–Zaghraand the Solaf complexes together represent the oldest rocks in thenorthernmost segment of the Arabian-Nubian Shield in having aMesoproterozoic age. If so, the Pan-African Rb/Sr whole rock age ofc. 610 Ma reported by Stern and Manton (1987) for the Feiran–Solafcomplex may have been a result of isotopic disturbances during thePan-African metamorphism (610–615 Ma); or during the exhuma-tion (594 Ma; Eliwa et al., 2008).
The existence of a single metamorphic event (M1) in theSa’al–Zaghra complex in time interval 1030–1017 Ma demon-strates that the complex escaped later metamorphism during theEast- and West-Gondwana collision (Pan-African age), but not thedeformation associated with this event, which is represented bythe D3 deformation as open folding with axial planes trendingNW–SE (Fig. 11). This phase of deformation also correlates withthe NE–SW tectonic shortening event in the Feiran–Solaf complexwhich is characterized by NW–SE close folding. These facts are con-
sistent with the Sa’al–Zaghra complex having been at a shallowcrustal level (<9 km) during the East- and West-Gondwana colli-sion, and thus the complex was not affected by the deep crustallevel Pan-African metamorphism.
n Res
9
ttaft1pRtretitgetTtcEt
A
EsteStEr
R
A
A
A
A
A
A
A
A
A
A
A
A
M. Hassan et al. / Precambria
. Conclusion
The volcano-sedimentary sequence of Wadi Sa’al referred to ashe “Sa’al–Zaghra complex” of central Sinai was metamorphosedo greenschist facies metamorphic conditions at 370–420 ◦C andround 3 kbar during an extensional event that we term D1. Theoliation associated with this event is the first observed struc-ure following the crystallization age of the metavolcanics around030–1017 Ma (Be’eri-Shlevin et al., 2012) and we therefore inter-ret this low-grade metamorphism to be related to the breakup ofodinia. Postdate to the extensional deformation events, localizederrain in the region of Wadi Muqafa was intruded by concordanted granitic sheets that caused partial contact metamorphic re-quilibration of the rocks at conditions around 630–650 ◦C whilehe rocks remained at a constant depth just above 3 kbar. However,t is important to note that this event occurred prior to D2 and isherefore unrelated to the much later intrusion of other Pan-Africanranitoids around 800 Ma. The geothermal gradient during thesearlier events was 38–41 ◦C/km and is interpreted to be related tohe extensional regime that associated with the breakup of Rodinia.his gradient is much higher than the geothermal gradient duringhe collision between East- and West-Gondwana. The Sa’al–Zaghraomplex escaped the deep crustal level metamorphism during theast- and West-Gondwana collision. We suggest that this is becausehe complex was at shallow crustal level (<9 km).
cknowledgements
The authors would like to thank Christoph Hauzenberger, Karlttinger and Jürgen Neubauer for their help in mineral analysis bycanning electron microscope and the XRF analyses. Thanks also goo Baher El-Kalioubi for help in field. Much assistance was given bynthusiastic post-graduate student Mohamed Abou El-Nour fromuez Canal University. Thanks to FWF Project P22351-N22 andhe Erasmus Mundus program for financial support. Mahrous Abul-Enen and Mohammed Abdelsalam are thanked for thoughtfuleviews.
eferences
bd El-Wahed, M.A., Kamh, S.Z., 2010. Pan-African dextral transpressive duplex andflower structure in the Central Eastern Desert of Egypt. Gondwana Research 18,315–336.
bu Anbar, M., Finger, F., Solis Pichardo, G., 2009. Evolution of the metamorphosedvolcano-sedimentary rocks in Sa’al area, southern Sinai, Egypt: implicationsfrom lithology, geochemistry, mineralogy, P–T condition and age dating. Egyp-tian Journal of Geology 53, 1–35.
bu El-Enen, M.M., 2008. Geochemistry and metamorphism of the Pan-Africanbackarc Malhaq volcano-sedimentary Neoproterozoic association, W. Kid area,SE, Sinai, Egypt. Journal of African Earth Sciences 51, 189–206.
bu El-Enen, M.M., 2011. Geochemistry, provenance, and metamorphic evolution ofGabal Samra Neoproterozoic metapelites, Sinai, Egypt. Journal of African EarthSciences 59, 269–282.
bu El-Enen, M.M., Okrusch, M., Will, T.M., 2003a. The metamorphic evolution ofthe Pan-African basement in the Sinai Peninsula, Egypt. In: Fifth InternationalConference on the Geology of the Middle East, Cairo, Egypt, pp. 207–216.
bu El-Enen, M.M., Okrusch, M., Will, T.M., 2003b. Metapelitic assemblages in theUmm Zariq schists, central western Kid Belt, Sinai Peninsula, Egypt. NeuesJahrbuch für Mineralogie – Abhandlungen 178, 277–306.
bu El-Enen, M.M., Okrusch, M., Will, T.M., 2004. P–T evolution of the Taba Meta-morphic belt, Egypt: constraints from the metapelite assemblages. Journal ofAfrican Earth Sciences 38, 59–78.
bu-Alam, T.S., Santosh, M., Brown, M., Stüwe, K., 2013. Gondwana collision. Min-eralogy and Petrology 107, 1–4.
bu-Alam, T.S., Stüwe, K., 2009. Exhumation during oblique transpression: theFeiran–Solaf region, Egypt. Journal of Metamorphic Geology 27, 439–459.
bu-Alam, T.S., Stüwe, K., Hauzenberger, C., 2010. Calc-silicates from Wadi Solafregion, Sinai, Egypt. Journal of African Earth Sciences 58, 475–488.
bu El-Enen, M.M., Whitehouse, M.J., 2013. The Feiran–Solaf metamorphic complex,Sinai, Egypt: geochronological and geochemical constraints on its evolution.Precambrian Research 239, 106–125.
li, B.H., Wilde, S.A., Gabr, M.M.A., 2009. Granitoid evolution in Sinai, Egypt, basedon precise SHRIMP U–Pb zircon geochronology. Gondwana Research 18, 38–48.
earch 241 (2014) 104– 128 127
Be’eri-Shlevin, Y., Eyal, M., Eyal, Y., Whitehouse, M.J., Litvinovsky, B., 2012. The Sa’alvolcano-sedimentary complex (Sinai, Egypt). A latest Mesoproterozoic volcanicarc in the northern Arabian Nubian Shield. Geology 40, 403–406.
Be’eri-Shlevin, Y., Katzir, Y., Whitehouse, M.J., Kleinhanns, I.C., 2009. Contributionof pre Pan-African crust to formation of the Arabian Nubian Shield: new sec-ondary ionization mass spectrometry U–Pb and O studies of zircon. Geology 37,899–902.
Bielski, M., (Unpublished Ph.D. thesis) 1982. Stages in the evolution of the SinaiPeninsula. The Hebrew University of Jerusalem.
Connolly, J.A.D., Kerrick, D.M., 1987. An algorithm and computer program for calcu-lating composition phase diagrams. CALPHAD 11, 1–55.
Connolly, J.A.D., 2005. Computation of phase equilibria by linear programming: atool for geodynamic modeling and its application to subduction zone decarbon-ation. Earth and Planetary Science Letters 236 (1-2), 524–541.
Connolly, J.A.D., 1990. Multivariable phase diagrams: an algorithm based on gener-alized thermodynamics. American Journal of Science 290 (6), 666–718.
Cox, G.M., Lewisa, C.J., Collins, A.S., Halverson, G.P., Jourdan, F., Foden, J., Nettle, D.,Kattan, F., 2011. Ediacaran terrane accretion within the Arabian-Nubian Shield.Gondwana Research 21 (2–3), 341–352 (Special Issue: Western Gondwana).
Dachs, E., 2004. PET: Petrological Elementary Tools for Mathematica: an update.Computers & Geosciences 30, 173–182.
El-Gaby, S., Khalaf, I.M., Eliwa, H.A., El-Miligy, A., Gomaa, R.M., 2002. The volcanosed-imentary successions of the Wadi Sa’al-Wadi Zaghra area, southeastern Sinai,Egypt. In: Youssef, E.-S.A.A. (Ed.), Proceedings of the Sixth International Con-ference on the Geology of the Arab World, vol. 1. Cairo University, Egypt, pp.25–44.
Eliwa, H.A., Abu El-Enen, M.M., Khalaf, I.M., Itaya, T., 2004. Metamorphic evolutionof Sinai metapelites and gneisses: constraints from petrology and K/Ar dating.Egyptian Journal of Geology 48, 169–185.
Eliwa, H.A., Abu El-Enen, M.M., Khalaf, I.M., Itaya, T., Murata, M., 2008. Metamorphicevolution of Neoproterozoic metapelites and gneisses in Sinai, Egypt: insightsfrom petrology, mineral chemistry and K–Ar age dating. Journal of African EarthSciences 51, 107–122.
Eyal, M., Litvinovsky, B., Jahn, B.M., Zanvilevich, A., Katzir, Y., 2010. Origin and evo-lution of post-collisional magmatism: Coeval Neoproterozoic calc-alkaline andalkaline suites of the Sinai Peninsula. Chemical Geology 269, 153–179.
Fowler, A., Hassen, I.S., 2008. Extensional tectonic origin of gneissosity and relatedstructures of the Feiran–Solaf metamorphic belt, Sinai, Egypt. PrecambrianResearch 164, 119–136.
Fowler, A., Hassen, I.S., Osman, A.F., 2010a. Neoproterozoic structural evolution of SESinai, Egypt: I. Re-investigation of the structures and deformation kinematics ofthe Um Zariq and Malhaq Formations, northern Wadi Kid area. Journal of AfricanEarth Sciences 58, 507–525.
Fowler, A., Hassen, I.S., Osman, A.F., 2010b. Neoproterozoic structural evolution ofSE Sinai, Egypt: II. Convergent tectonic history of the continental arc Kid Group.Journal of African Earth Sciences 58, 526–546.
Fritz, H., Dallmeyer, D.R., Wallbrecher, E., Loizenbauer, J., Hoinkes, G., Neumayr,P., Khudeir, A.A., 2002. Neoproterozoic tectonothermal evolution of the Cen-tral Eastern Desert, Egypt: a slow velocity tectonic process of core complexexhumation. Journal of African Earth Sciences 34, 137–155.
Fritz, H., Wallbrecher, E., Khudeir, A.A., Abu El Ela, F., Dallmeyer, D.R., 1996.Formation of Neoproterozoic metamorphic core complexes during oblique con-vergence (Eastern Desert, Egypt). Journal of African Earth Sciences 23, 311–323.
Fritz, H., Wallbrecher, E., Loizenbauer, J., Hoinkes, G., Dallmeyer, D.R., Khudeir, A.A.,2000. Crustal evolution during oblique convergence, transpression and extru-sion within the central Eastern Desert of Egypt: a slow velocity process. Journalof African Earth Sciences 33, 33–34.
Grambling, J.A., 1990. Internally consistent geothermometry and H2O barometryin metamorphic rocks: the example garnet-chlorite-quartz. Contributions toMineralogy and Petrology 105, 617–628.
Hargrove, U.S., Stern, R.J., Kimura, J.-I., Manton, W.I., Johnson, P.R., 2006. Howjuvenile is the Arabian-Nubian Shield? Evidence from Nd isotopes and pre-Neoproterozoic inherited zircon in the Bi’r Umq suture zone, Saudi Arabia. Earthand Planetary Science Letters 252, 308–326.
Hegazi, A.M., El-Shafei, M.K., Sultan, Y.M., 2004. Multiple deformation phases ofSolaf Gneiss Belt, South Sinai, Egypt. In: Proceedings of the 7th InternationalConference on Geology of the Arab World, Cairo, pp. 313–320.
Holland, T.J.B., Baker, J.M., Powell, R., 1998. Mixing properties and activity – com-position relationships of chlorites in the system MgO–FeO–Al2O3–SiO2–H2O.European Journal of Mineralogy 10, 395–406.
Holland, T.J.B., Blundy, J., 1994. Non-ideal interactions in calcic amphiboles and theirbearing on amphibole-plagioclase thermometry. Contributions to Mineralogyand Petrology 116, 433–447.
Holland, T.J.B., Powell, R., 2001. Calculation of phase relations involving haplograniticmelts using an internally-consistent thermodynamic data set. Journal of Petro-logy 42, 673–683.
Holland, T.J.B., Powell, R., 1998. An internally consistent thermodynamic dataset forphases of petrological interest. Journal of Metamorphic Geology 16, 309–343.
Hynes, A., Forest, R.C., 1988. Empirical garnet-muscovite geothermometry in low-grade metapelites, Selwyn Range (Canadian Rockies). Journal of MetamorphicGeology 6, 297–309.
Johnson, P.R., Andresen, A., Collins, A.S., Fowler, A.R., Fritz, H., Ghebreab, W., Kusky,T., Stern, R.J., 2011. Late Cryogenian-Ediacaran history of the Arabian-NubianShield: a review of depositional, plutonic, structural, and tectonic events inthe closing stages of the northern East African Orogen. Journal of African EarthSciences 61 (3), 167–232.

1 an Res
J
L
M
M
M
N
N
P
P
P
S
White, R.W., Powell, R., Holland, T.J.B., Worley, B.A., 2000. The effect of
28 M. Hassan et al. / Precambri
ohnson, P.R., Woldehaimanot, B., 2003. Development of the Arabian–Nubian Shield:perspectives on accretion and deformation in the northern East African Orogenand the assembly of Gondwana. In: Yoshida, M., Dasgupta, S., Windley, B. (Eds.),Proterozoic East Gondwana: Supercontinent Assembly and Breakup, London.Journal of Geological Society, Special Publications 206, 289–325.
eake, B.E., Woollet, A.R., Arps, C.E., Birch, W.D., Gilbert, M.C., Grice, J.D., Hawthorne,F.C., Kato, A., Kisch, H.J., Krivovichev, V.G., Linthout, K., Laird, J., Mandarino, J.A.,Maresch, W.V., Nickel, E.H., Rock, N.M., Schumacher, J.C., Smith, D.C., Stephenson,N.C., Ungaretti, L., Whittaker, E.J., Youzhi, G., 1997. Nomenclature of amphiboles:report of the subcommittee on amphiboles of the International Mineralogi-cal Association, commission on new minerals and mineral names. AmericanMineralogist 82, 1019–1037.
assonne, H.J., Schreyer, W., 1987. Phengite geobarometry based on the limitingassemblage with K-feldspar, phlogopite, and quartz. Contributions to Mineral-ogy and Petrology 96, 212–224.
ehanna, A.M., 2000. Contribution to the petrochemistry of the metamorphosedvolcanics of Wadi Sa’al area, central South Sinai, Egypt. Egyptian Journal ofGeology 44 (1), 191–218.
oghazi, A.M., Ali, K.A., Wilde, S.A., Zhou, Q., Andersen, T., Andresen, A., El-Enen,M.M., Stern, R.J., 2012. Geochemistry, geochronology, and Sr–Nd isotopes ofthe Late Neoproterozoic Wadi Kid volcano-sedimentary rocks, Southern Sinai,Egypt: implications for tectonic setting and crustal evolution. Lithos 154,147–165.
ewton, R.C., Charlu, T.V., Kleppa, O.J., 1980. Thermochemistry of the high structuralstate plagioclases. Geochimica Cosmochimica Acta 44, 933–941.
oweir, M.A., Ghoneim, M.F., Abu-Alam, T.S., 2006. Deformational phases and tec-tonic evolution of the neoproterozoic rocks of Wadi Kareim Area, Central EasternDesert, Egypt. Annual of Geological Survey Egypt XXVIII, 81–109.
atchett, P.J., Chase, C.G., 2002. Role of transform continental margins in majorcrustal growth episodes. Geology 30, 39–42.
owell, R., Holland, T.J.B., 1988. An internally consistent thermodynamic datasetwith uncertainties and correlations: 3. Application, methods, work examplesand a computer program. Journal of Metamorphic Geology 6, 173–204.
riem, H.N.A., Eyal, M., Hebeda, E.H., Verdurmen, E.A.Th., 1984. U–Pb zircon datingin the Precambrian basement of the Arabo-Nubian Shield of the Sinai Peninsula.
A progress report. Terra Cognita, Special Issue E.C.O.G. VIII, 30–31.amuel, M.D., Be’eri-Shlevin, Y., Azer, M.K., Whitehouse, M.J., Moussa, H.E., 2011.Provenance of conglomerate clasts from the volcano-sedimentary sequence atWadi Rutig in southern Sinai, Egypt as revealed by SIMS U–Pb dating of zircon.Gondwana Research 20, 450–464.
earch 241 (2014) 104– 128
Schmidt, M.W., 1992. Amphibole composition in tonalite as a function of pressure:an experimental calibration of the Al-in-hornblende barometer. Contributionsto Mineralogy and Petrology 110, 304–310.
Shimron, A., Bogoch, R., Furnes, H., Roberts, D., 1993. The Sa’al Group: an ensialicisland arc sequence in Sinai. In: Thorweihe, U., Schandelmeier, H. (Eds.), Geosci-entific research in northeast Africa. Balkema, Rotterdam, pp. 49–53.
Soliman, F.A., (Ph.D. thesis) 1986. Geology of Wadi Sa’al Area with Special Emphasisof Metamorphism and Tectonics, Central Sinai of Egypt. Faculty of Science, SuezCanal University, Egypt, pp. 240.
Stern, R., Ali, K., Andresen, A., Wilde, S., Abu-El-Enien, M., Hassan, I., 2010. Resultsof geochronological investigations in Sinai undertaken as part of the 2008 JEBELfield trip. In: Pease, V., Kadi, K., Kozdroj, W. (Eds.), JEBEL Project October 2009Field Excursion to the Midyan Terrane, Kingdom of Saudi Arabia, with Reports onResearch by Participants in the JEBEL Project. Saudi Geological Survey TechnicalReport SGS-TR-2010-2, pp. 46–51.
Stern, R.J., 1994. Arc assembly and continental collision in the Neoproterozoic EastAfrican Orogen: implications for the consolidation of Gondwanaland. AnnualReview of Earth and Planetary Sciences 22, 319–351.
Stern, R.J., Johnson, P.R., Kröner, A., Yibas, B., 2004. Neoproterozoic ophiolites of theArabian-Nubian Shield. In: Kusky, T.M. (Ed.), Precambrian Ophiolites and RelatedRocks. Developments in Precambrian Geology, vol. 13. Elsevier, Amsterdam, pp.95–128.
Stern, R.J., Manton, W.I., 1987. Age of Feiran basement rocks, Sinai: implicationsfor late Precambrian crustal evolution in northern Afro-Arabia. Journal of theGeological Society of London 144, 569–575.
Sultan, Y.M., (M.Sc. thesis) 2003. Structural Studies on Wadi Feiran – Wadi El-SheikhArea, South Sinai, Egypt. Suez Canal University, Ismailia, pp. 144.
Tajcmanová, L., Connolly, J.A.D., Cesare, B., 2009. A thermodynamic model for tita-nium and ferric iron in biotite. Journal of Metamorphic Geology 27, 153–164.
Thompson, J.B., Hovis, G.L., 1979. Entropy of mixing in sanidine. American Mineral-ogist 64, 45–51.
White, R.W., Powell, R., Holland, T.J.B., 2001. Calculation of partial melting equilibriain the system Na2O–CaO–K2O–FeO–MgO–Al2O3–SiO2–H2O (NCKFMASH). Jour-nal of Metamorphic Geology 19, 139–153.
TiO2 and Fe2O3 on metapelitic assemblages at greenschist and amphi-bolite facies conditions: mineral equilibria calculation in the systemK2O–FeO–MgO–Al2O3–SiO2–H2O–TiO2–Fe2O3. Journal of Metamorphic Geol-ogy 18, 497–511.