2. niagara peninsula source protection area · assessment report – chapter 2: niagara peninsula...
TRANSCRIPT
Assessment Report – Chapter 2: Niagara Peninsula Source Protection Area Niagara Peninsula Source Protection Area
NPCA 7
2. NIAGARA PENINSULA SOURCE PROTECTION AREA The Watershed Characterization Report was the first technical study initiated for the Assessment Report (AR). It explains watershed characteristics and environmental issues that are relevant to source water protection. It provides readily available information on the local watershed to serve as baseline resources for detailed analyses, for example water budgeting.
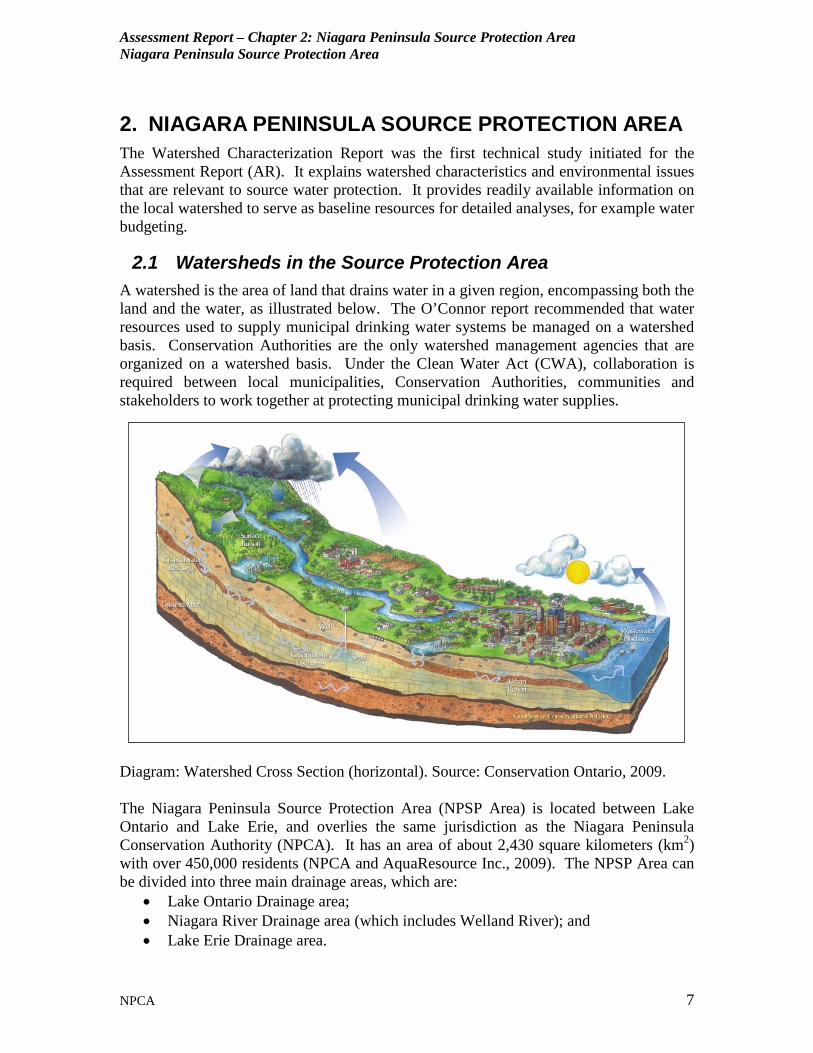
2.1 Watersheds in the Source Protection Area A watershed is the area of land that drains water in a given region, encompassing both the land and the water, as illustrated below. The O’Connor report recommended that water resources used to supply municipal drinking water systems be managed on a watershed basis. Conservation Authorities are the only watershed management agencies that are organized on a watershed basis. Under the Clean Water Act (CWA), collaboration is required between local municipalities, Conservation Authorities, communities and stakeholders to work together at protecting municipal drinking water supplies.
Diagram: Watershed Cross Section (horizontal). Source: Conservation Ontario, 2009. The Niagara Peninsula Source Protection Area (NPSP Area) is located between Lake Ontario and Lake Erie, and overlies the same jurisdiction as the Niagara Peninsula Conservation Authority (NPCA). It has an area of about 2,430 square kilometers (km2) with over 450,000 residents (NPCA and AquaResource Inc., 2009). The NPSP Area can be divided into three main drainage areas, which are:
• Lake Ontario Drainage area; • Niagara River Drainage area (which includes Welland River); and • Lake Erie Drainage area.

Assessment Report – Chapter 2: Niagara Peninsula Source Protection Area Niagara Peninsula Source Protection Area
NPCA 8
There is an abundance of subwatersheds within each of these major drainage areas. The Lake Ontario Drainage area contains significant subwatersheds such as Forty Mile Creek, Twelve Mile Creek, and Twenty Mile Creek, in addition to other smaller watersheds. The Niagara River Drainage area has the largest area and contains the most subwatersheds (approximately 50). The Lake Erie drainage area contains approximately 15 smaller watersheds and geographically covers the smallest of three major drainage areas. The NPSP Area also encompasses 117 km of Great Lakes shoreline, of which 67 km are located on Lake Erie and 50 km on Lake Ontario. Figure 2.1 represents the NPSP Area’s watershed boundaries and municipal boundaries. Figure 2.2 outlines the drainage basins and subwatersheds within the study area. Figure 2.3 shows the ground surface topography within the NPSP Area.
TR 2, TR 16 (1), 16(2)(a)
2.2 Physical Geography Characterization
Within the NPSP Area watersheds, peak flows occur in the spring months from snow melt while lower flows occur in the drier summer months. Stream flow analysis shows the NPSP Area watersheds are dominated by runoff processes. Stream response is generally flashy, meaning that flows quickly return to pre-storm conditions after a rainfall event. Baseflow, which is the portion of the stream flow that is not runoff, is the primary source of water in a stream during dry weather. Significant streamflows generally only occur in response to a rainfall event. Available gauge data indicates that there is very little evidence of any substantial surface/groundwater interactions and it is assumed that these conditions exist for most areas above the escarpment. However, enhanced recharge and baseflow conditions will be typical for permeable local geologic features such as the Fonthill Delta-Kame Complex (which is described further in Section 3.4).
Each of the three main drainage areas in the NPSP Area contains several creek and river watersheds (Figure 2.2). Some of the significant subwatersheds belonging to the three drainage areas are described in more detail below.
TR 16 (2)(a)
2.2.1 Lake Ontario Drainage Area
The Lake Ontario drainage basin covers about 40% of the NPSP Area, and is made up of both larger and smaller watersheds. The larger watersheds generally start above (south of) the Niagara Escarpment, while the smaller ones start below (north of) the escarpment before flowing into Lake Ontario. The most significant Lake Ontario basin watersheds are described below.
Assessment Report – Chapter 2: Niagara Peninsula Source Protection Area Niagara Peninsula Source Protection Area
NPCA 9
Forty Mile Creek Forty Mile Creek watershed covers an area of approximately 64.8 km2. A significant portion of the Forty Mile Creek watershed is located above the Niagara Escarpment. The creek and its tributaries span three municipalities with the headwaters located in West Lincoln and the City of Hamilton, while the mouth of the creek is located at Lake Ontario in the Town of Grimsby. Twenty Mile Creek Twenty Mile Creek watershed covers an area of 291 km2 and is about 79 km in length (MacViro Consultants Inc. et al, 2003b). The creek begins at the headwaters above the Niagara escarpment in the City of Hamilton and travels east above the escarpment, before turning north and crossing the escarpment at Balls Falls (where it drops 26 m). The creek eventually enters Lake Ontario at Jordan Harbour, after passing through the Jordan Marsh, which was created by lake waters flooding the lower reaches of the river valley. The Twenty Mile Creek watershed contains five (5) sub-watersheds including the main channel of Twenty Mile Creek; Gavora Ditch, Spring Creek, North Creek and Sinkhole Creek. The NPCA completed a Master Watershed Plan for Twenty Mile Creek in 2006 (NPCA, 2006). The Twenty Mile Creek watershed contains several areas of natural and scientific interest (ANSIs), environmentally sensitive areas (ESAs), and regionally significant wetlands. The upper reaches of the Twenty Mile Creek watershed are characterized by rolling topography with fairly steep slopes in the headwaters. Further downstream, the watershed contains gently rolling to flat topography before the creek flows over the Niagara Escarpment. Base flow in Twenty Mile Creek drops to zero during the summer months, although some water is retained in the channel pools. The low to non-existent summer flows may be due to a number of land use factors primarily resulting from agricultural expansion. These factors include a loss of water storage resulting from a decrease in the amount of forested areas, soil compaction, soil loss, and tile drainage. There may also be natural surface water losses via bedrock fractures and karst features.
The Fifteen, Sixteen and Eighteen Mile Creeks
Fifteen Mile Creek starts above the Niagara Escarpment, then flows over the escarpment at Rockway Falls, and crosses the relatively flat Iroquois Plain before entering into a drowned creek mouth that is separated from Lake Ontario by a vegetated sand bar. Fifteen Mile Creek has a drainage area of 42.5 km2. The Fifteen Mile Creek Drain system and Keenan Drain are the only municipal drains in the watershed.
Sixteen Mile Creek and Eighteen Mile Creek follow similar patterns beginning above the escarpment, crossing the escarpment and flat plains below, to eventually discharge into Lake Ontario.
Assessment Report – Chapter 2: Niagara Peninsula Source Protection Area Niagara Peninsula Source Protection Area
NPCA 10
Aquatic habitat is considered good in these watersheds. Agricultural water use is high and is typically used for irrigation, greenhouse production and livestock (MacViro Consultants Inc. et al, 2003b).
Twelve Mile Creek Twelve Mile Creek starts above the Niagara Escarpment in the Town of Pelham and flows north through Thorold and St. Catharines before discharging into Lake Ontario. The total drainage area of the watershed is 178 km2, and the length of the creek is about 20 km. The Twelve Mile Creek watershed contains 6 sub-watersheds including the Upper Twelve Mile Creek, Lake Gibson System, Richardson Creek, Francis Creek, Dick’s Creek and the Lower Twelve Mile Creek. The NPCA completed a Master Watershed Plan for Twelve Mile Creek. (NPCA, 2006) The headwaters of the main branch of Twelve Mile Creek begin at the Fonthill Kame-Delta Complex. This is the only watershed in the Niagara Peninsula that supports naturally reproducing cold water fish species (identified in the St. John’s and Effingham branches). The topography of the watershed above the escarpment is very irregular due to the deeply eroded gullies and multi-branched nature of the headwater tributaries. The upper Twelve Mile Creek contains ESAs, ANSIs, and Short Hills Provincial Park. The abundance of forested natural areas in this sub-watershed has attracted several provincially and regionally rare bird species to the area. Twelve Mile Creek flows north and passes over the escarpment at DeCew Falls. Below the escarpment, the creek follows the route of a former Welland Canal before it eventually reaches Lake Ontario at Port Dalhousie. Discharge water from the DeCew Hydro-Electric Generating Station enters the creek at the base of the escarpment, thereby significantly increasing the creek flows. It is estimated that the natural flows in the creek would be only one to two percent of current flows if water was not diverted by the generating station from the Welland Canal. Without these additional flows the natural conditions of Twelve Mile Creek below DeCew Falls would be a slow moving, meandering stream contained within a larger valley (Public Works and Government Services Canada, 1996). The Lake Gibson System is a constructed system of reservoirs owned by Ontario Power Generation (OPG). This system was created to supply water to the DeCew Power Station in 1898. Originally, water was diverted from Lake Erie via the Welland Canal by the construction of a 7.6 kilometre canal to the Niagara Escarpment just east of DeCew Falls. This canal is called the Power Canal and is now used to supply water for the DeCew Falls Water Treatment Plant (WTP). The DeCew Power Station was expanded in 1904 leading to the creation of Lakes Moodie and Gibson, and was then expanded again in 1947 with the enlargement of Lakes Moodie and Gibson, and the excavation of three channels. These included an intake channel from the Third Welland Canal north of Allanburg (see diagram next page), an equalization channel between the two arms of Lake Gibson, and an outflow channel from Lake Moodie to the new penstocks.
Assessment Report – Chapter 2: Niagara Peninsula Source Protection Area Niagara Peninsula Source Protection Area
NPCA 11
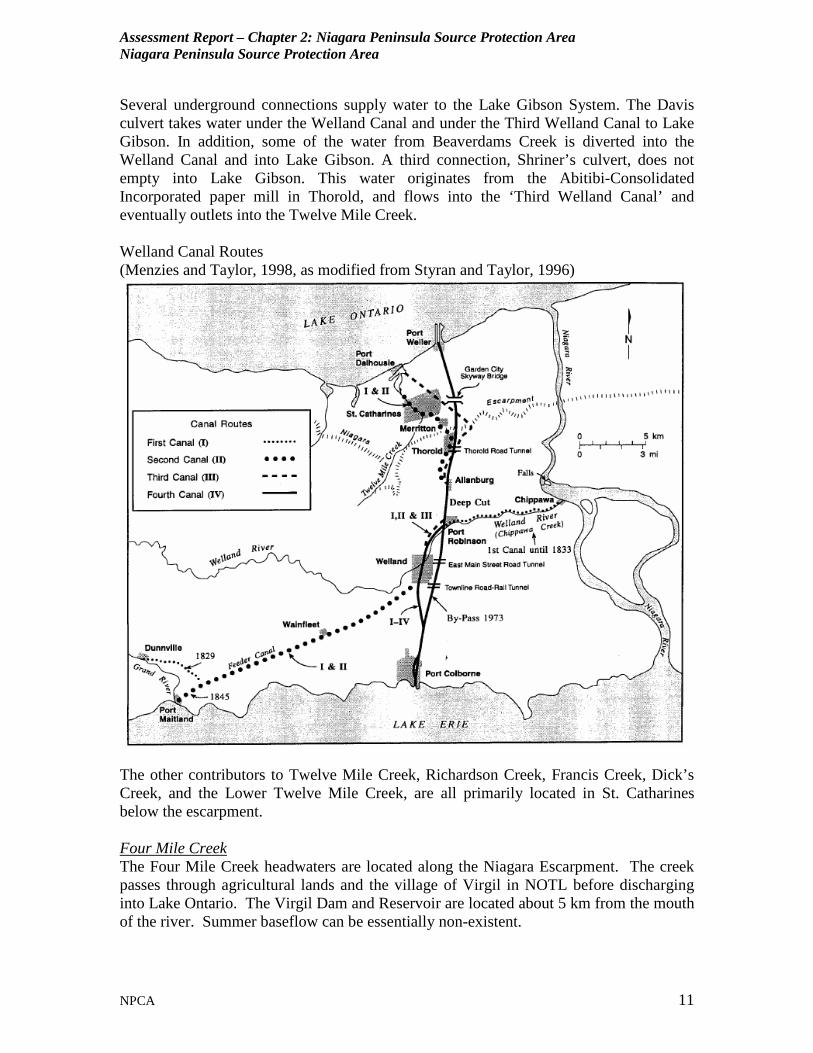
Several underground connections supply water to the Lake Gibson System. The Davis culvert takes water under the Welland Canal and under the Third Welland Canal to Lake Gibson. In addition, some of the water from Beaverdams Creek is diverted into the Welland Canal and into Lake Gibson. A third connection, Shriner’s culvert, does not empty into Lake Gibson. This water originates from the Abitibi-Consolidated Incorporated paper mill in Thorold, and flows into the ‘Third Welland Canal’ and eventually outlets into the Twelve Mile Creek. Welland Canal Routes (Menzies and Taylor, 1998, as modified from Styran and Taylor, 1996)
The other contributors to Twelve Mile Creek, Richardson Creek, Francis Creek, Dick’s Creek, and the Lower Twelve Mile Creek, are all primarily located in St. Catharines below the escarpment. Four Mile Creek The Four Mile Creek headwaters are located along the Niagara Escarpment. The creek passes through agricultural lands and the village of Virgil in NOTL before discharging into Lake Ontario. The Virgil Dam and Reservoir are located about 5 km from the mouth of the river. Summer baseflow can be essentially non-existent.
Assessment Report – Chapter 2: Niagara Peninsula Source Protection Area Niagara Peninsula Source Protection Area
NPCA 12
2.2.2 Niagara River Drainage Area The Niagara River stretches across the NPSP Area from Lake Erie north to Lake Ontario, and essentially drains the water from the four upstream Great Lakes. It has an average flow of 5,700 cubic metres per second (m3/s). The Welland River and several smaller creeks, including Black Creek, Beaver Creek and Frenchman Creek, flow into the Niagara River. The Niagara River drainage area (via Welland River watershed) stretches across the entire central portion of the NPSP Area, and covers about 55% of the NPSP Area. Welland River The Welland River is the largest watershed in the Niagara Peninsula, encompassing a watershed area of approximately 1,050 km2 (MOEE, EC, MNR, DFO, 1993). The main river channel extends from the headwaters at the western NPSP Area boundary to the eastern NPSP Area boundary, where it connects to the Niagara River, just above Niagara Falls. The river drops about 78 m in the upper portion (above Port Davidson) but only 4 m in the lower portion below Port Davidson (MacViro Consultants Inc. et al, 2003b). The Welland River watershed is located primarily on the Haldimand Clay Plain, (consisting of fine-textured glaciolacustrine deposits that cover most of the NPSP Area) and as a consequence the amount of precipitation infiltrating to groundwater is relatively low, as is also the discharge of groundwater to the river. Because of the relatively minor interaction between groundwater and surface water, the Welland River experiences accentuated peak river flows. The watershed contains one major dam; Binbrook Dam on Lake Niapenco located in City of Hamilton, as well as a number of smaller dams, which help to mitigate the variance in flows. There is an ongoing restoration program to eliminate most of the dams and other fish barriers in the river’s watershed. The lower portion of the Welland River has been significantly modified by man-made structures. The river passes beneath the old and new Welland Canals via two siphons. The flow is reversed in the lower reaches of the river as water is drawn from the Niagara River to the Queenston-Chippawa Power Canal via the Welland River. The Queenston-Chippawa Power Canal supplies water for the Adam Beck Hydro Electric Generating Station. This situation is accentuated by the regulation of flow in the Niagara River to increase power generation. This results in diurnal fluctuations in flow that extend many kilometres upstream from the river mouth (MacViro Consultants Inc. et al, 2003b). Oswego Creek covers an area over 195 km2, is oblong in shape, and stretches a distance of approximately 40 km in an east-west direction. From Canboro, to its confluence with the Welland River, flow is sluggish and large meanders characterize this downstream reach of the system. Upstream of Canboro the creek gradient is about 0.9 m/km. Land use within the watershed is predominantly agricultural with scattered development (Cumming Cockburn Limited, 1988). Lyons Creek begins in the City of Welland and discharges into the Welland River in the City of Niagara Falls. The creek is located on relatively flat lands covered with clay soils and is about 47.5 km2 (MOEE, EC, MNR and DFO, 1993).
Assessment Report – Chapter 2: Niagara Peninsula Source Protection Area Niagara Peninsula Source Protection Area
NPCA 13
Black Creek is located in Town of Fort Erie and contains a watershed of approximately 70.3 km2 (MOEE, EC, MNR and DFO, 1993). The creek starts at Humberstone Marsh, and flows in a north easterly direction before discharging into the Niagara River upstream of the Welland River, and the Niagara Falls Water Treatment Plant. The creek is located on relatively flat lands covered with mostly silty clay soils. A main tributary of Black Creek is Beaver Creek.
2.2.3 Lake Erie Drainage Area The Lake Erie drainage area covers about 5% of the NPSP Area and contains several small creek watersheds and tile drained areas which flow generally south and discharge into Lake Erie. The largest watersheds in this drainage area include Six Mile Creek, Wignell Drain, and Lowbanks Drain. All the watersheds in this drainage area are less than 20 km2 in size, and are generally located between the Onondaga Escarpment and Lake Erie.
TR 16 (2)(a)
2.2.4 Soils A soils map for the Niagara Peninsula is provided in Figure 2.4. Differences exist in mapping and categorizing of soils between Niagara Region, City of Hamilton and Haldimand County. The soils in the large central portion of the peninsula (occupied by the Niagara River/Welland River watersheds) are dominated by clays, silty clays, and silty clay loams, characteristic of the Haldimand Clay Plain. The dominant land use occupying this area is agricultural and open space incorporating residential and industrial land uses neighbouring the Niagara River. Loamy sands are encountered in the southwest portion of the Niagara Peninsula, near Dunnville. Here, the land cover is mainly agricultural and open space with non-systematic, sporadic residential areas. Sands and sandy loams are found extensively along the Lake Ontario shoreline, generating a mix of agriculture and residential land uses. Clay soils are often observed above the Niagara Escarpment which is characterized by agricultural, residential, and environmental conservation/protection areas. Several patterns are revealed when the general soils (shown in Figure 2.4) are compared to the SOLRIS-SIL land cover (Figure 2.5). Mixed Sand/Loam soils occupy the North shore of Lake Ontario and the Southwest portion of NPCA (Haldimand County), areas which are largely agricultural due to the presence of this highly productive soil type. Sandy soils found on the Iroquois Plain between Lake Ontario and the Niagara Escarpment have allowed for the development of a prime fruit and grape growing area in Ontario (Chapman & Putman, 1984). Fruits and vegetables have been grown on the well drained loam soils found in the soils between Grimsby and Hamilton. The Fonthill Delta-Kame with its better draining soils shows an emphasis towards fruit growing. (Chapman & Putman, 1984).
Assessment Report – Chapter 2: Niagara Peninsula Source Protection Area Niagara Peninsula Source Protection Area
NPCA 14
Clay loams have a high water holding capacity and are the principal soil type in the NPSP Area, coinciding with mainly agricultural and open space types of land use. There is an emphasis on livestock as well as a higher portion of idle land in areas with this type of soil, reflecting the poorer growing conditions. (Chapman & Putman, 1984).
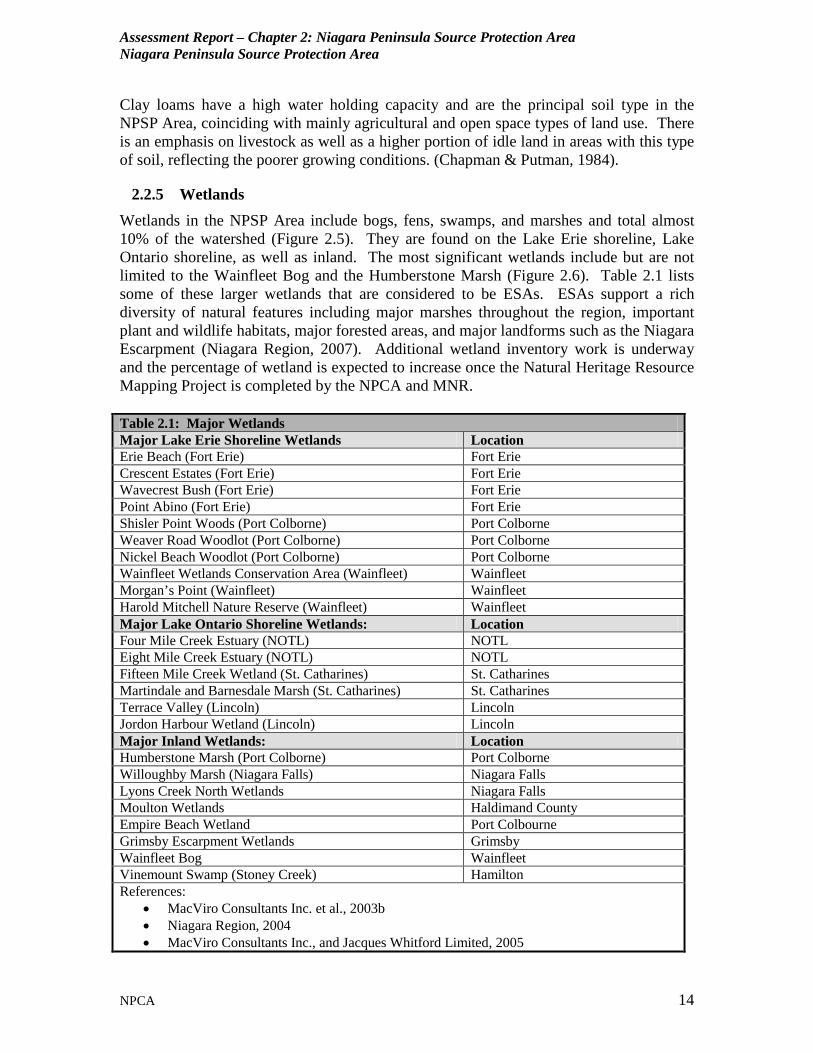
2.2.5 Wetlands Wetlands in the NPSP Area include bogs, fens, swamps, and marshes and total almost 10% of the watershed (Figure 2.5). They are found on the Lake Erie shoreline, Lake Ontario shoreline, as well as inland. The most significant wetlands include but are not limited to the Wainfleet Bog and the Humberstone Marsh (Figure 2.6). Table 2.1 lists some of these larger wetlands that are considered to be ESAs. ESAs support a rich diversity of natural features including major marshes throughout the region, important plant and wildlife habitats, major forested areas, and major landforms such as the Niagara Escarpment (Niagara Region, 2007). Additional wetland inventory work is underway and the percentage of wetland is expected to increase once the Natural Heritage Resource Mapping Project is completed by the NPCA and MNR. Table 2.1: Major Wetlands Major Lake Erie Shoreline Wetlands Location Erie Beach (Fort Erie) Fort Erie Crescent Estates (Fort Erie) Fort Erie Wavecrest Bush (Fort Erie) Fort Erie Point Abino (Fort Erie) Fort Erie Shisler Point Woods (Port Colborne) Port Colborne Weaver Road Woodlot (Port Colborne) Port Colborne Nickel Beach Woodlot (Port Colborne) Port Colborne Wainfleet Wetlands Conservation Area (Wainfleet) Wainfleet Morgan’s Point (Wainfleet) Wainfleet Harold Mitchell Nature Reserve (Wainfleet) Wainfleet Major Lake Ontario Shoreline Wetlands: Location Four Mile Creek Estuary (NOTL) NOTL Eight Mile Creek Estuary (NOTL) NOTL Fifteen Mile Creek Wetland (St. Catharines) St. Catharines Martindale and Barnesdale Marsh (St. Catharines) St. Catharines Terrace Valley (Lincoln) Lincoln Jordon Harbour Wetland (Lincoln) Lincoln Major Inland Wetlands: Location Humberstone Marsh (Port Colborne) Port Colborne Willoughby Marsh (Niagara Falls) Niagara Falls Lyons Creek North Wetlands Niagara Falls Moulton Wetlands Haldimand County Empire Beach Wetland Port Colbourne Grimsby Escarpment Wetlands Grimsby Wainfleet Bog Wainfleet Vinemount Swamp (Stoney Creek) Hamilton References:
• MacViro Consultants Inc. et al., 2003b • Niagara Region, 2004 • MacViro Consultants Inc., and Jacques Whitford Limited, 2005
Assessment Report – Chapter 2: Niagara Peninsula Source Protection Area Niagara Peninsula Source Protection Area
NPCA 15
Terrestrial and aquatic species reside in wetland areas making them highly productive environments. The majority of the NPSP Area wetlands are considered swamps, which are essentially forested wetlands accompanied by flowing water. Plants, birds, fish, and invertebrates such as freshwater shrimp and crayfish need these habitats for survival, habitat, and reproduction. Wetlands provide a number of important benefits to the NPSP Area. Wetlands can accommodate moderate nutrient loadings in the water versus dammed reservoirs which would exhibit eutrophication problems (MacViro Consultants Inc. et al, 2003b). Wetlands also tend to reduce contaminant loadings in stream flows by allowing sediments to settle out of the water, and this also provides time for plants to take in the nutrients, etc. Wetlands and sloughs (naturally vegetated surface depressions) reduce peak stream flows from storm water runoff by adding storage capacity. For example, surface depressions (or sloughs), which are common as natural areas in the Haldimand Clay Plain, have been estimated to create a storage capacity of about 312 m3/hectare (MacViro Consultants Inc. et al., 2003b). To-date no inventory of the sloughs has been completed for the NPSP Area. The advantage of the sloughs is that they have no maintenance cost (compared to man-made structures such as the Binbrook dam). Sloughs also have faster storage recovery times before the next storm, and as a result of their broad distribution throughout the watershed they reduce or “de-synchronize” storm peak river flows.
TR 16(4)
2.2.6 Forest and Woodlands Forested areas in the Niagara Peninsula (Figure 2.6 Natural Heritage Systems) have been divided into categories of wet forest, moist forest, and upland forest. All three types are found throughout the jurisdiction’s natural communities. The categories were determined using soil drainage information based on soil maps, which was then intersected with a woodlot layer. The upland forest type had a very rapid to rapid soil drainage class, moist forest types have well to moderately well soil drainage class, and wet forest type is considered to have imperfect, saturated, or organic soil drainage class. Tree cover (forest, orchards, vineyards) makes up only about 15% of the watershed’s total land cover. Forested areas in the Niagara Peninsula (Figure 2.5 SOLRIS – SIL Land Cover) include deciduous, coniferous, and mixed forest. Of the Natural Areas within the jurisdiction, 3% is coniferous (forested and plantation), 44% is deciduous (Hedgerows, deciduous forest and forest), while 2% is mixed. Wetlands (Bog, marsh, and swamp) make up the other half (50%) of the inventoried Natural Areas. These statistics were compiled from the SOLRIS data of natural layers. The greatest abundance of forest cover in the Niagara Peninsula is generally located along the Niagara Escarpment and in the south east part of the peninsula (such as the Municipality of Fort Erie).
Assessment Report – Chapter 2: Niagara Peninsula Source Protection Area Niagara Peninsula Source Protection Area
NPCA 16
Forest areas have beneficial effects on the environment. Forests can reduce weather extremes by cooling summertime temperatures and warming winter temperatures. Forest cover increases storm water infiltration to groundwater systems, and generally produces slower melting of snow pack in springtime thus reducing peak spring flows in creeks and rivers.
TR 16(4)
2.2.7 Land Uses Land uses can have a significant impact on the quality and quantity of drinking water supplies. Land uses are primarily governed by council-approved municipal planning documents such as the Official Plan (OP). The OP is a policy that describes a municipality’s strategic vision for community development and land use. OPs specify present and future uses for lands (residential, agricultural, industrial, and commercial, etc), and may also require special policies for areas such as wetlands, and ESAs. Land uses have a direct impact on the type of ground cover. Approximately 64% of the NPSP Area is agricultural, and about 21% is rural wooded or natural. The remaining 15% is considered urban (Figure 2.5). The municipalities with the highest proportion of urban lands are St. Catharines (63%), Welland (55%) and Niagara Falls (39%), while the Townships of Wainfleet and West Lincoln contain the lowest percentage of urban land (at 0% and 1% respectively). Figure 2.7 illustrates the urban area boundaries and Places to Grow – Built Boundaries in the NPSP Area. The urban areas are defined as the lands within the urban boundaries as shown on Municipal Official Plans. There are several major transportation corridors in the NPSP Area. The major road arterials are described below: • The Queen Elizabeth Way (QEW) is a major freeway that runs parallel to the Lake
Ontario shoreline and then turns southward to cross the peninsula just west of the Niagara River and ends in Fort Erie at the Peace Bridge to the U.S.A.. The QEW is the main transportation route from Toronto to Fort Erie;
• Highway 406 runs between St. Catharines (at QEW) and Welland and is currently undergoing major expansion and improvements to accommodate the increased traffic flows between these two cities. It is an important link in the development and growth plans in the Niagara Peninsula emphasizing growth along the Welland Canal and into the southern portions of the Peninsula.
• Highway 3 is a two-lane highway that runs roughly parallel to the Lake Erie shoreline connecting smaller urban centres such as Fort Erie, Crystal Beach, Port Colborne, and Dunnville;
• Highway 20 runs east-west through the centre of the peninsula connecting villages such as Fonthill and Smithville;
• Regional Road No. 24 runs north-south from Lake Ontario at Vineland to Lake Erie (at Morgans Point).
• Old No. 8 Highway is a popular scenic route that runs east-west along the northern edge of the Niagara Escarpment.
Assessment Report – Chapter 2: Niagara Peninsula Source Protection Area Niagara Peninsula Source Protection Area
NPCA 17
Two main railway corridors traverse the NPSP Area in an east-west direction. One is located north of the Niagara Escarpment and the other is located south of Welland River. The Welland Canal, which is operated by the St. Lawrence Seaway Management Corporation, runs south to north from Lake Erie to Lake Ontario (between Port Colborne and St. Catharines). The Canal is a major seaway shipping corridor and has historically been a significant economic driver in the Niagara Peninsula. However, the Welland Canal also creates a barrier to east-west land-based transportation since there is a limited number of bridges and tunnels crossing the canal. Another historic barrier to transportation has been the Niagara Escarpment. The cost to construct transportation arteries across this physiographic feature with its steep drop in elevation has often been prohibitive. Consequently, only a handful of major transportation routes actually cross the Escarpment, namely the QEW, Highway 406 and the Welland Canal. The Niagara Peninsula is also serviced by the John C. Munro Hamilton International Airport, the Niagara District Airport (formerly known as St Catharines airport) in NOTL, and the Niagara Central Airport (formerly known as Welland-Pt. Colborne airport). The Hamilton airport serves as an alternate and reliever airport for nearby Toronto-Pearson International Airport. The Niagara Airport has no regular passenger service but does accommodate a significant number of charter flights.
TR 19(9)
2.2.8 Summary Description of Fish and Wildlife Habitat (Fisheries) Fish communities have long been used as barometers of ecosystem health in watersheds, with fish community diversity, and population health, widely used as surrogate measures of habitat quality, including water quality. As a result of the recreational, commercial, aboriginal, and cultural importance of fish, a healthy fishery is vital to the overall well being of many residents within the watershed. Due to the geographic location and proximity to Lake Ontario, Lake Erie, and the Niagara River, the fish community in the NPSP Area is very diverse. It comprises approximately 98 fish species, a number of which are considered sensitive or species-at-risk. Several sensitive fish species are present in the Niagara River and tributaries or have recently been captured within the Niagara Peninsula. These species include:
• lake sturgeon (Acipenser fulvescens) • brook lamprey (Ichthyomyzon fossor) • greater redhorse (Moxostoma valenciennesi) • Grass pickerel (Esox masquinongy) • American eel (Anguilla rostrata)
Although groundwater inputs have been identified in the headwaters of many watercourses throughout the NPSP Area, the upper reaches of Twelve Mile Creek are the
Assessment Report – Chapter 2: Niagara Peninsula Source Protection Area Niagara Peninsula Source Protection Area
NPCA 18
only remaining watercourses in Niagara that are cool enough to support brook trout (Salvelinus fontinalis). As a result, the abundance of this species is of particular interest in the Niagara Peninsula (OMNR, 1989). Brook trout are typically found in clear, cold, well oxygenated streams and lakes (Scott and Crossman, 1973). Despite being the last remaining population of brook trout in the Niagara Peninsula, brook trout in upper Twelve Mile Creek are threatened by sources of thermal pollution, such as online ponds, interruptions to groundwater inputs, sediment deposition and habitat alterations. The NPCA is currently conducting a detailed temperature study of Twelve Mile Creek to determine the extent of thermal pollution within the upper reaches of this watercourse, however preliminary results are unavailable at this time. It is anticipated these data will be invaluable in the restoration and plan review process, where efforts are being made to restrict and mitigate sources of thermal pollution in the creek. Freshwater mussels found in the NPSP Area are listed on the Ontario Ministry of Natural Resources (MNRs) Natural Heritage Inventory Centre (NHIC) and are on the Species at Risk list in Ontario. These include the Round Pigtoe (Pleurobema sintoxia) mussel and the Kidneyshell (Ptychobranchus fasciolaris) mussel. The Mapleleaf (Quadrula quadrula) mussel was found during the Natural Areas Inventory of 2007 and 2008. The NPCA is conducting watershed studies on watersheds within the NPSP Area. An objective is to provide updates to the status of fish communities and sensitive species, in hopes of protecting these species by directing restoration and management decisions.
TR 16 (5)
2.2.9 Species at Risk Species at Risk are protected by federal legislation called the Species at Risk Act (SARA) proclaimed in June 2003, and is one part of a three part Government of Canada strategy for the protection of wildlife species at risk. Environment Canada, Parks Canada Agency and the Department of Fisheries and Oceans are jointly responsible for recovering listed species while working closely with provincial and territorial governments in protection and recovery. The Species at Risk in Ontario (SARO) list is issued by MNR and provides official status designations to native Ontario Species. Many of the species found on the SARO list are vulnerable to changes in water quantity and quality. The SARO list includes any native plant or animal that is at risk of extinction or of disappearing from the province. The list contains species that are Extirpated (EXP), Endangered (END), Threatened (THR), and Special Concern (SC). Extirpated species no longer exist in the wild in Ontario but still occur elsewhere. Endangered species face imminent extinction or extirpation in Ontario which is a candidate for regulation under Ontario’s ESA. Threatened species are at risk of becoming endangered in Ontario if limiting factors are not reversed. Special Concern Species have characteristics that make them sensitive to human activities. The NHIC compiles, maintains, and distributes information on natural species, plant communities, and species of conservation concern in Ontario. There are currently 250
Assessment Report – Chapter 2: Niagara Peninsula Source Protection Area Niagara Peninsula Source Protection Area
NPCA 19
NHIC species in the NPSP Area stored in a spatial database for tracking. There are 66 Species on the SARO list that correspond with the Natural Heritage Inventory Centre (NHIC) inventory for the SP Area. This list can be found in Appendix A-1 and includes the preferred habitat, the S_RANK (NHIC rank), and the Ontario MNR status.
TR 16(7)
2.2.10 Human Impacts on Fisheries The Ontario Ministry of Natural Resources (OMNR) classified watercourses throughout Niagara Region into three levels of fish habitat (Type 1,2,3) (Figure 2.8). The purpose of this grouping is to assist resource management decisions, with the overall mandate of ensuring the long-term health of ecosystems through protecting resources and their biological functions (Yagi, 2000). The designation distinguishes a respective setback requirement in order to protect fish habitat from the potential detrimental effects of development. Type 1 requires a minimum 30 meter natural buffer and Type 2 and Type 3 need a minimum of 15 meters of natural buffer. Type 1 habitats are considered critical and require a high degree of protection. They may be suitable for some enhancement, and may have sensitive fish species and/or habitats present. Type 2 habitats are important to the fish community but are below productive capacity. These areas are ideal for enhancement or restoration projects and sensitive fish species may be present during certain times of the year. Type 3 habitat has a low productive capacity with no sensitive species and/or specialized habitats present. These marginal areas can have negative impacts downstream but should not be considered for fish habitat compensation. Examples of the fish habitat levels are as follows: Type 1: springs, seeps, and upwelling areas, seasonally inundated spawning habitats, refugia, nursery areas, over wintering areas, ephemeral pools, as well as areas where sensitive species live during all or part of their life cycle. Type 2: dredged creek channels, altered waterways, and abandoned canals (Feeder Canal, Old Welland Canals). Type 3: the Welland Shipping Canal (Active), Hydro Power Canal, Queenston Reservoir, buried watercourses (interned), man-made drains (not converted creeks), and creeks that have a small drainage basin with no migration possible. Agricultural drain construction and maintenance is regulated under the Ontario Drainage Act and the protection of fish habitat is regulated under the Federal Fisheries Act. In order to connect the requirements of the two Acts, the Department of Fisheries and Oceans (DFO) developed a Class Authorization System. The Class Authorization System is a streamlined Fisheries Act review and approval process for drain maintenance activities. The sensitivity of drains can be classified according to the following four characteristics:
Assessment Report – Chapter 2: Niagara Peninsula Source Protection Area Niagara Peninsula Source Protection Area
NPCA 20
• Flow – Permanent watercourses are more sensitive than intermittent
watercourses that are dry for more than two consecutive months. • Temperature – Cold/cool water courses that are more sensitive than warm water
watercourses. • Fish Species – The presence of sensitive fish species (e.g. trout, bass, sculpin, and
pike) and fish species identified under the federal Species at Risk Act indicates the presence of a more sensitive habitat.
• Stability – a watercourse that has not recently undergone a full clean-out has most likely reached a higher state of ecological stability. The combined productivity of riparian vegetation and in-stream habitat components can be easily disrupted by maintenance activities.
Figure 2.8 also shows the NPSP Area’s Municipal Drains as determined by the Municipal Drain Classification Project. It is reasonable to assume that every watercourse in the NPSP Area has been affected by human activities as there have been countless historical alterations to the land and watercourses. For that reason it is difficult to compare aquatic communities to similar communities that have not been impacted by anthropogenic factors. If an adequate candidate site or data on reference communities existed for comparison purposes, perhaps this could be demonstrated. However, one can only speculate on the magnitude of these influences by comparing theoretical communities to actual communities. One example of how human activities have impacted aquatic populations occurred in Four Mile Creek. A variety of anthropogenic factors led to negative impacts such that conditions were no longer suitable for some species such as the Brook Trout.
TR 16(6)
2.3 Surface Water Quality A number of water quality monitoring programs are carried out that are of particular relevance to NPSP Area source water protection. These are primarily facilitated through Niagara Region and NPCA as well as the MOE and Environment Canada. Niagara Region complies with the mandatory MOE Drinking Water Information System (DWIS) testing at its water treatment plants (WTPs). Niagara Region also participates in two additional MOE programs at its WTPs which are voluntary, the Drinking Water Surveillance Program (DWSP) and the Nearshore Intake Monitoring Program. NPCA also gathers long-term water quality data through a number of surface water monitoring programs.
2.3.1 Drinking Water Information System (DWIS) Annual drinking-water system reports are produced by the Niagara Region under Ontario Regulation 170/03 for each municipal water system and posted on the internet. This data

Assessment Report – Chapter 2: Niagara Peninsula Source Protection Area Niagara Peninsula Source Protection Area
NPCA 21
was used to assess any raw water microbiological quality issues at individual WTPs in Sections 6.5, 7.5, 8.5, 9.5, 10.5 and 11.5.
2.3.2 Drinking Water Surveillance Program (DWSP)
The Drinking Water Surveillance Program (DWSP) is a voluntary program operated by the MOE in cooperation with municipalities to gather scientific data on drinking water quality in Ontario. The six (6) Niagara Region water treatment plants have been participants in this program since 1990. DWSP analyses are conducted to extremely low method detection limits employed at the MOE laboratory.
DWSP results are compared to Ontario Drinking Water Quality Standards (ODWQS) by the MOE. These are the provincial standards for drinking water quality, most of which have been adopted from the Canadian drinking water quality guidelines established by the Federal-Provincial-Territorial Committee on Drinking Water. The guidelines are derived from risk assessment based exposure limits as modified by a risk management process incorporating review of the geographic scope and prevalence of the contaminant, available technology to remove it and associated costs. The ODWQS are designed for treated water, as no raw water drinking criteria yet exist, and include four (4) tables: (i) Microbiological (ii) Chemical (iii) Radionuclide and (iv) Non-health related aesthetics and treatment guidelines (Appendix D). DWSP data was used to assess any raw water chemical quality issues at individual WTPs in Sections 6.5, 7.5, 8.5, 9.5, 10.5 and 11.5. Some additional general observations of the source water quality include: • Historic concentrations of aluminum at or above the non-health related operational
guideline; • Overall increasing trends in chloride in both Lake Erie and Lake Ontario; • Organic nitrogen concentrations exceeding the operational guideline in Lake Erie and
Lake Ontario; and • Phosphorus concentrations generally exceeded Provincial Water Quality Objectives
for the Great Lakes. These objectives are for control of algae which can be a source of toxins.
Regulatory criteria and testing methods for emerging chemicals of concern, such as endocrine disrupting compounds, pharmaceuticals, personal care products and algal blooms (i.e. microcystin-LR), have yet to be established.
2.3.3 MOE Nearshore Intake Monitoring Program The Ministry of the Environment has conducted weekly monitoring of parameters associated with algae function and eutrophication for over thirty (30) years at Niagara WTPs Rosehill (Lake Erie) and Grimsby (Lake Ontario). This data was reviewed with respect to two potential Great Lakes water quality issues, organic nitrogen and algal blooms.
Assessment Report – Chapter 2: Niagara Peninsula Source Protection Area Niagara Peninsula Source Protection Area
NPCA 22
2.3.3.1 Organic Nitrogen Organic nitrogen concentrations were generally above the ODWQS Operational Guideline (OG) of 0.15 mg/L throughout the thirty (30) year period. During the last five years (2003-2008) concentrations at Rosehill were generally higher and more subject to peaks than those at Grimsby. On average Grimsby organic nitrogen concentrations have decreased somewhat since commissioning of a new intake in 1994. The Technical Support Document for ODWQS (MOE, 2003a) indicates that “high levels (of organic nitrogen) may be caused by septic tank or sewage effluent contamination. This form of contamination is often associated with some types of chlorine-worsened taste problems.” 2.3.3.2 Algal Blooms and Phosphorus Algal blooms occur when cell concentrations are high enough to be visible to the naked eye. Many types of algae form blooms, however not all algal blooms are toxic. Some, such as the blooms of diatoms in the early spring, are very important to the health of the ecosystem. When algal blooms contain organisms having toxins, other noxious chemicals or pathogens, the bloom is known as a harmful algal bloom (HAB). HABs can cause the death of nearby fish, and foul up nearby coastlines, and produce harmful conditions to marine life and animals as well as humans. The most common group of algae to form HABs are cyanobacteria, or blue-green algae. They are able to photosynthesize and grow in water, either terrestrial, fresh, brackish or marine. Cyanobacteria have been linked to human and animal illnesses around the world. A cyanobacteria bloom may look like foam, scum, or mats on the surface of fresh water lakes and ponds. The blooms can be blue, bright green, brown, or red and may look like paint floating on the water. As algae in a cyanobacteria bloom die, unpleasant odours may result. Microscopic identification is required to confirm its presence. Algal blooms are caused by a combination of factors, such as the presence of elevated nutrients (e.g. phosphorus), warm temperatures and sunlight. Increased nutrients may be a result of urban and rural sources such as fertilizer runoff and sewage overflows. Cyanobacterial blooms can occur at any time, but most often occur in late summer or early fall. Zebra mussels may promote the formation of HABs by the removal of natural competitors, altering water chemistry and increasing the amount of light reaching the bottom of the lake. Water affected by cyanobacterial toxins needs to be filtered through activated carbon to be safe for drinking. All NPSP Area water treatment plants have a form of activated carbon available. Activated carbon also adsorbs taste and odour-causing compounds such as geosmin and MIB (2-methylisoborneol). Geosmin and MIB are also produced in aquatic environments by cyanobacteria and mould-like, filamentous bacteria called actinomycetes. In Ontario the maximum acceptable concentration (MAC) for the cyanobacterial toxin microcystin-LR in drinking water is 0.0015 mg/L. This guideline is believed to be
Assessment Report – Chapter 2: Niagara Peninsula Source Protection Area Niagara Peninsula Source Protection Area
NPCA 23
protective of human health against exposure to other microcystins that may also be present. However, there are no available microcystin-LR results in the water quality datasets available for the NPSP Area WTPs. This lack of data may be because the MOE approach to cyanobacteria monitoring first recommends: (i) visually monitoring water bodies that have historically exhibited algal blooms during the peak season (usually late May to early October) and (ii) then sampling for the toxin (MOE ODWQS, 2006a). Some observations of the long-term weekly total phosphorus data include: • Rosehill (Lake Erie) – on average, total phosphorus concentrations were above the
Provincial Water Quality Objective (PWQO) of 0.01 mg/L guideline for the entire period of record, thirty (30) years.
• Grimsby (Lake Ontario) – on average, concentrations were generally close to the PWQO 0.01 mg/L guideline from 1994 to 2008 (note a new intake was commissioned in 1994).
• On average, 1994-2008 concentrations are higher at Lake Erie (Rosehill) than Lake Ontario (Grimsby):
o Rosehill mean 0.019 mg/L, median 0.012 mg/L o Grimsby mean 0.011 mg/L, median 0.008 mg/L
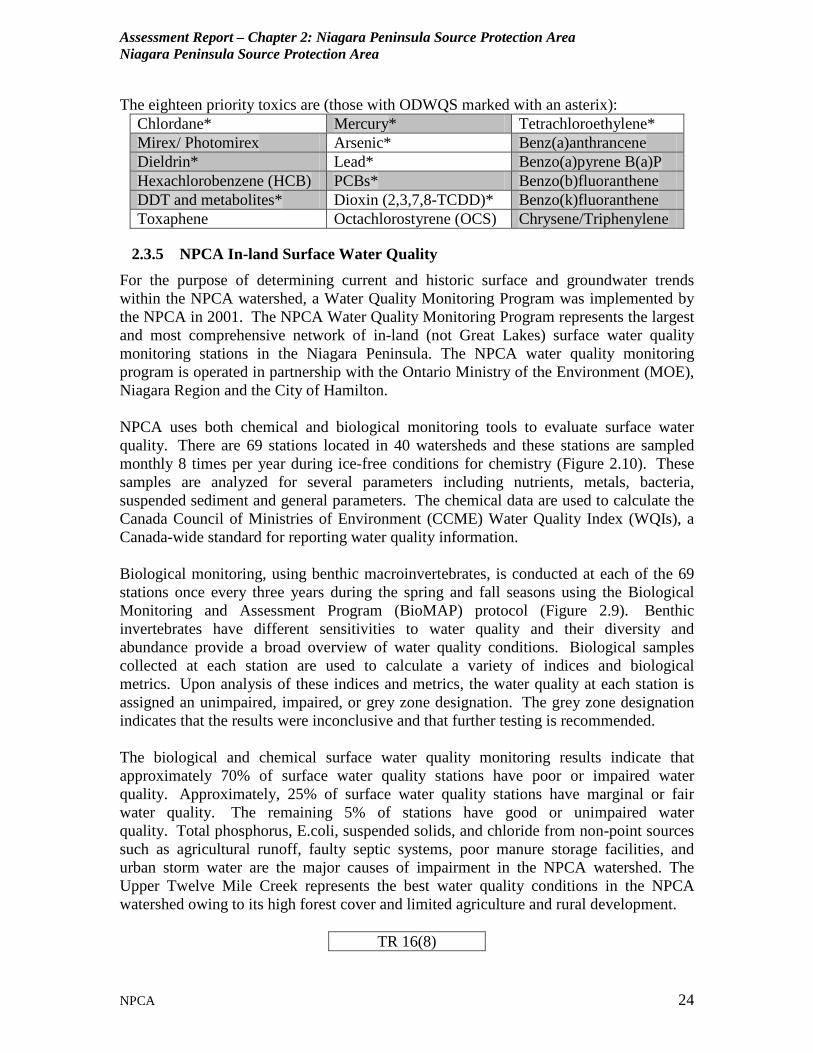
2.3.4 Niagara River Monitoring The 2007 Niagara River Toxics Management Plan (NRTMP) Progress report summarized the progress made in dealing with eighteen “Priority Toxics” of the Niagara River, by reviewing eighteen years of results (1987-2005) from the Niagara River Upstream/Downstream Program. The Upstream/Downstream (U/D) Program measures about fifty (50) organic chemicals in the dissolved and particulate phases at Fort Erie and Niagara-on-the-Lake and about 25 metals. The concentrations of suspended sediment at each station are also measured so that loads can be calculated for the particulate fraction. The U/D Program enables calculation of: (i) dissolved and particulate water concentrations, (ii) trends over time and (iii) the load of chemical presumed to be entering from sources along the Niagara River. Overall, the water quality of the river has improved significantly since 1987. Over that time a 50% reduction has been reached or exceeded for most of the 18 priority toxics. However, most of the priority toxics (highlighted below) remain at concentrations above New York State Department of Environmental Conservation water quality standards used for NRTMP program. But, DWSP testing at the Niagara Falls WTP indicates that the nine parameters tested that could be compared to the ODWQS, were below their health-related criteria. DWSP testing of the other parameters with only PWQOs also indicates only benzo (k) fluoranthene and chrysene above the objectives.
Assessment Report – Chapter 2: Niagara Peninsula Source Protection Area Niagara Peninsula Source Protection Area
NPCA 24
The eighteen priority toxics are (those with ODWQS marked with an asterix): Chlordane* Mercury* Tetrachloroethylene* Mirex/ Photomirex Arsenic* Benz(a)anthrancene Dieldrin* Lead* Benzo(a)pyrene B(a)P Hexachlorobenzene (HCB) PCBs* Benzo(b)fluoranthene DDT and metabolites* Dioxin (2,3,7,8-TCDD)* Benzo(k)fluoranthene Toxaphene Octachlorostyrene (OCS) Chrysene/Triphenylene
2.3.5 NPCA In-land Surface Water Quality For the purpose of determining current and historic surface and groundwater trends within the NPCA watershed, a Water Quality Monitoring Program was implemented by the NPCA in 2001. The NPCA Water Quality Monitoring Program represents the largest and most comprehensive network of in-land (not Great Lakes) surface water quality monitoring stations in the Niagara Peninsula. The NPCA water quality monitoring program is operated in partnership with the Ontario Ministry of the Environment (MOE), Niagara Region and the City of Hamilton. NPCA uses both chemical and biological monitoring tools to evaluate surface water quality. There are 69 stations located in 40 watersheds and these stations are sampled monthly 8 times per year during ice-free conditions for chemistry (Figure 2.10). These samples are analyzed for several parameters including nutrients, metals, bacteria, suspended sediment and general parameters. The chemical data are used to calculate the Canada Council of Ministries of Environment (CCME) Water Quality Index (WQIs), a Canada-wide standard for reporting water quality information. Biological monitoring, using benthic macroinvertebrates, is conducted at each of the 69 stations once every three years during the spring and fall seasons using the Biological Monitoring and Assessment Program (BioMAP) protocol (Figure 2.9). Benthic invertebrates have different sensitivities to water quality and their diversity and abundance provide a broad overview of water quality conditions. Biological samples collected at each station are used to calculate a variety of indices and biological metrics. Upon analysis of these indices and metrics, the water quality at each station is assigned an unimpaired, impaired, or grey zone designation. The grey zone designation indicates that the results were inconclusive and that further testing is recommended. The biological and chemical surface water quality monitoring results indicate that approximately 70% of surface water quality stations have poor or impaired water quality. Approximately, 25% of surface water quality stations have marginal or fair water quality. The remaining 5% of stations have good or unimpaired water quality. Total phosphorus, E.coli, suspended solids, and chloride from non-point sources such as agricultural runoff, faulty septic systems, poor manure storage facilities, and urban storm water are the major causes of impairment in the NPCA watershed. The Upper Twelve Mile Creek represents the best water quality conditions in the NPCA watershed owing to its high forest cover and limited agriculture and rural development.
TR 16(8)
Assessment Report – Chapter 2: Niagara Peninsula Source Protection Area Niagara Peninsula Source Protection Area
NPCA 25
2.4 Groundwater Quality There are no municipal groundwater systems in the NPSP Area. This section presents the current understanding of watershed-wide groundwater quality with respect to ODWQS Schedule 2 (Chemical) and 4 (Aesthetic). However it is understood that any identified groundwater issues for private water well drinking water systems may only have a significance of moderate. In summary, the NPSP Area also has some naturally occurring, but previously under-reported, concentrations of metals above safe drinking water levels. Nitrate groundwater contamination also exists in the NPSP Area as a result of human activities. This is currently documented in the Wainfleet Lakeshore area and consists of nitrate concentrations above safe drinking water levels.
TR 114(3) TR 134(1)
2.4.1 NPCA Provincial Groundwater Monitoring Network (PGMN) Since 2003, the NPCA has operated 15 monitoring wells in significant hydrogeologic areas in the NPCA watershed (Figure 2.11) in partnership with the MOE as part of the Provincial Groundwater Monitoring Network (PGMN). Groundwater quality is assessed at the wells with sampling at least twice per year, in the spring and fall, and analyzed for nutrients, metals, bacteria, and general chemistry. Data collected from monitoring wells indicates that the groundwater quality generally meets Ontario Drinking Water Standards with some exceptions. Observed exceedances of boron, selenium, sodium and fluoride are attributed to natural conditions and observed nitrate exceedances are attributed to agricultural nutrient applications, or septic system effluent. Additional analysis has been completed on the PGMN data and is presented in the Ambient Groundwater Quality Study, which is described in the following report section. 2.4.1.1 Ambient Groundwater Quality Study An Ambient Groundwater Quality Assessment was conducted for the NPSP Area (Jagger Hims Limited, 2008). The study was of “ambient”, i.e. believed to be naturally occurring, groundwater chemistry. Although, some of the elevated parameters would normally be associated with human impacts, e.g. elevated lead. The report was prepared for NPCA using available data sets from: • Groundwater monitoring wells in the Provincial Groundwater Monitoring Network
(PGMN); and • Background monitoring wells located at Niagara Region landfills. (Background wells
are considered to be not impacted by the landfill and thus represent the ambient or background conditions.)
Lead was the most common parameter observed in concentrations greater than the health-related ODWQS criterion. A significant number of wells that contained lead exceedances were within the Lockport Bedrock Formation or were located in overburden units that overlie the Lockport Formation. Other health-related criterion exceedances
Assessment Report – Chapter 2: Niagara Peninsula Source Protection Area Niagara Peninsula Source Protection Area
NPCA 26
included: selenium, cadmium, fluoride, chromium, nitrate, boron, arsenic, benzene, mercury and 1,2 dichlorobenzene. Study conclusions included: • At least 75% of the groundwater samples tested for trace metals contained at least one
chemical parameter with concentrations higher than the health-related criterion established in the ODWQS. Thus, all groundwater to be used as drinking water should be tested for ODWQS parameters.
• The groundwater from the Onondaga/Bois Blanc Formation may contain low concentrations of soluble petroleum hydrocarbon constituents including benzene in concentrations greater than the health-related criterion of the ODWQS.
• The average measured concentrations of arsenic, boron, and selenium were higher than the health-related criteria of the ODWQS in the Salina Formation.
• The average measured concentrations of cadmium and lead in the Guelph Formation are higher than the health-related criteria of the ODWQS.
• The average concentration of lead in the Lockport Formation is higher than the criterion of the ODWQS.
• The average lead and arsenic concentrations are sufficiently high to be a concern if groundwater from the Irondequoit/Reynales Formation was to be used as a drinking water source.
TR 16(8)
2.4.2 Wainfleet Lakeshore Area After dangerous levels of bacterial contamination and nitrate were discovered in private and communal wells in Wainfleet, Ontario, a public boil water advisory was issued on April 10, 2006. The advisory remains in place with some 1,300 homes to use bottled or boiled water until a viable and potable supply of drinking water becomes available. Nitrate is not affected by boiling. The affected wells were identified on the Lake Erie shoreline, in the township of Wainfleet (Figure 2.12). The source of the contamination is due to aging and failing septic tank systems compounded by poor soil conditions and fractured bedrock, which leads to ineffective attenuation of septic effluent. Studies conducted by Niagara Region Public Health (2001), MacViro Consultants Inc. (2002), EarthTECH (2005), and MacViro Consultants Inc. (2006) revealed that a number of the private wells were contaminated with water-borne bacteria (E. coli) and nitrate above health criteria. The Wainfleet Lakeshore Area is also designated as a highly vulnerable aquifer area (Chapter 4). Additional information is provided in Section 4.4.1 that identifies nitrate as an issue and a moderate threat. The Township of Wainfleet is located west of Port Colborne, between the Welland River and Lake Erie. It can be described as a rural/agricultural community with a small population of 6,258. Wainfleet is populated with numerous seasonal homes and cottages that make up 40% of residences, with permanent homes accounting for about 60% in the Lake Erie shoreline area. The balance of the Township is a rural/agricultural community and there are no urban areas in Wainfleet.
TR 114(3), 115,134.1, CWA 15(2)(f)
Assessment Report – Chapter 2: Niagara Peninsula Source Protection Area Niagara Peninsula Source Protection Area
NPCA 27
2.5 Surface Water and Groundwater Quantity The NPSP Area is characterized by abundant surface water sources from Lake Erie, Lake Ontario, The Niagara River and the Welland Canal. The sources are distributed amongst municipal and in some cases agricultural supply. Some challenges in the NPSP Area range from having too much water to having too little water. In times of high quantity, flooding and erosion takes place resulting in negative impacts to property owners and the natural environment. During low water level periods, wetlands and fisheries may be impacted, and agricultural irrigation water is further stressed. Overall, there are not any water quantity threats related to municipal drinking water sources in the NPSP Area. A water budgeting exercise was completed for the NPSP Area which is described in Section 3. It consisted of two key studies; a conceptual water budget and a Tier 1 water budget. These studies did not assess the hydrologic stress of the NPSP Area drinking water systems, because the Technical Rules (MOE, 2009b) indicate that a Tier 1 Water Budget “shall not include any part of a surface water body that is a Great Lake (or) a connecting channel” and NPSP Area municipal drinking water systems are supplied from Great Lakes and Great Lakes Connecting Channel sources.
TR 16(8), 9(3)(a), 18
2.6 Overview of Human Geography (Human Land Uses) This section covers the various human land uses in the study area and provides an overall picture of past, present, and future activities as they may relate to source water. The major urban centres in the NPSP Area are found along the Lake Ontario and Lake Erie shorelines, the Niagara River and the Welland Canal. The most urbanized municipality in the NPSP Area is St. Catharines which is also considered the financial hub of the Niagara Peninsula. Drinking water sources for these urban centres are supplied from the Great Lakes. Consequently, from a quantity perspective, adequate long-term supply of source water for these municipally serviced urban centres is not considered a significant issue. The rural population, over 77,000 in 2006, uses either private groundwater wells, or cisterns supplied with either rainfall or purchased drinking water (although, Niagara Region Public Health does not recommend untreated rainfall as a source of drinking water). Inland streams and rivers (such as the Welland River and Twenty Mile Creek) are not known to be used for drinking water sources.
2.6.1 Areas of Settlement Figure 2.7 illustrates the areas of settlement, urban areas and built boundaries in the NPSP Area. In the Ontario Places to Grow Act, 2005, an area of settlement “means an area of land designated in an official plan for urban uses, including urban areas, urban policy areas, towns, villages, hamlets, rural clusters, rural settlement areas, urban systems, rural service centres or future urban use areas, or as otherwise prescribed”. The municipal boundaries are outlined in Figure 2.1.
TR 16(2)(b)
Assessment Report – Chapter 2: Niagara Peninsula Source Protection Area Niagara Peninsula Source Protection Area
NPCA 28
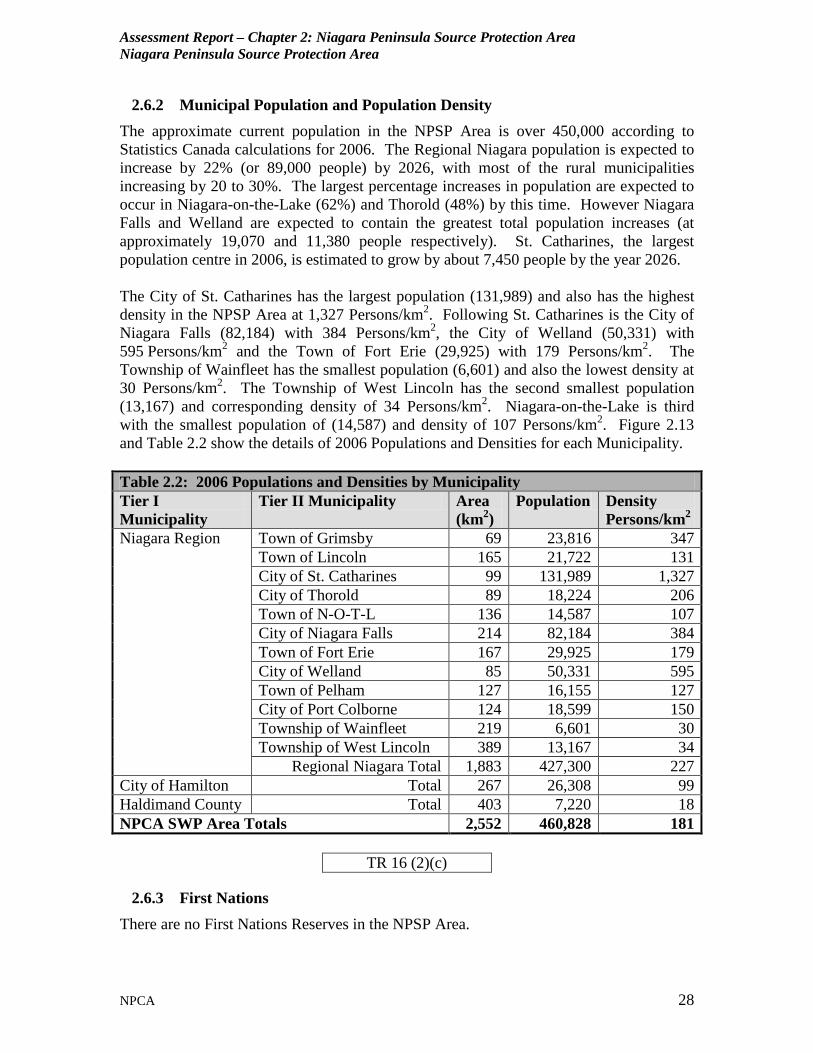
2.6.2 Municipal Population and Population Density The approximate current population in the NPSP Area is over 450,000 according to Statistics Canada calculations for 2006. The Regional Niagara population is expected to increase by 22% (or 89,000 people) by 2026, with most of the rural municipalities increasing by 20 to 30%. The largest percentage increases in population are expected to occur in Niagara-on-the-Lake (62%) and Thorold (48%) by this time. However Niagara Falls and Welland are expected to contain the greatest total population increases (at approximately 19,070 and 11,380 people respectively). St. Catharines, the largest population centre in 2006, is estimated to grow by about 7,450 people by the year 2026. The City of St. Catharines has the largest population (131,989) and also has the highest density in the NPSP Area at 1,327 Persons/km2. Following St. Catharines is the City of Niagara Falls (82,184) with 384 Persons/km2, the City of Welland (50,331) with 595 Persons/km2 and the Town of Fort Erie (29,925) with 179 Persons/km2. The Township of Wainfleet has the smallest population (6,601) and also the lowest density at 30 Persons/km2. The Township of West Lincoln has the second smallest population (13,167) and corresponding density of 34 Persons/km2. Niagara-on-the-Lake is third with the smallest population of (14,587) and density of 107 Persons/km2. Figure 2.13 and Table 2.2 show the details of 2006 Populations and Densities for each Municipality. Table 2.2: 2006 Populations and Densities by Municipality Tier I Municipality
Tier II Municipality Area (km2)
Population Density Persons/km2
Niagara Region Town of Grimsby 69 23,816 347 Town of Lincoln 165 21,722 131 City of St. Catharines 99 131,989 1,327 City of Thorold 89 18,224 206 Town of N-O-T-L 136 14,587 107 City of Niagara Falls 214 82,184 384 Town of Fort Erie 167 29,925 179 City of Welland 85 50,331 595 Town of Pelham 127 16,155 127 City of Port Colborne 124 18,599 150 Township of Wainfleet 219 6,601 30 Township of West Lincoln 389 13,167 34
Regional Niagara Total 1,883 427,300 227 City of Hamilton Total 267 26,308 99 Haldimand County Total 403 7,220 18 NPCA SWP Area Totals 2,552 460,828 181
TR 16 (2)(c)
2.6.3 First Nations There are no First Nations Reserves in the NPSP Area.
Assessment Report – Chapter 2: Niagara Peninsula Source Protection Area Niagara Peninsula Source Protection Area
NPCA 29
2.6.4 Designated Growth Areas Growth areas in the NPSP Area are expected to be primarily located along the north-south Welland Canal corridor linking the urban centres of St. Catharines/Thorold, Welland/Fonthill, and Port Colborne. The improvements to Highway 406, which connects St. Catharines to Welland, is an important link in this strategy to push economic development south across the peninsula. A mid-peninsula highway is also being considered by the province to improve economic development south of the Niagara Escarpment. While the specific route has not yet been selected by the provincial government, the mid-peninsula highway is expected to connect to the QEW in the west, cross the Niagara Escarpment and then travel west to east across the Niagara Peninsula, eventually connecting to Welland and Fort Erie.
2.6.5 Urban Residential Development Planning with respect to urban development, including residential, has been given significant consideration as part of the province’s Growth Plan for the Greater Golden Horseshoe. Municipalities maintain data with respect to existing and remaining urban residential areas and will be required to formally report this to the province using a common standard in the near future.
2.6.6 Industrial / Commercial Areas and Trends The primary industrial areas are located in the cities of St. Catharines, Thorold, Welland, and Niagara Falls, and include industrial sectors such as manufacturing of automotive parts, steel products, pulp and paper mills and recycling centres, and chemical products. The key commercial-financial districts are located in St. Catharines, and Niagara Falls.
2.6.7 Agriculture Agricultural land uses are typically oriented to operations that are most effective for the soil and climate conditions in that area. Vineyards and tender fruit orchards are primarily encountered below (north of) the Niagara Escarpment where the climate is more moderate and soil conditions are more favorable to those crops. On top of the Niagara Escarpment, livestock operations and specialty crops make up the main agricultural land uses. Specialty crops include greenhouses for flowers and vegetables, sod farms, and mushroom farms. Based on data analyzed for the Niagara River AOC between 1941 and 1991, there has been a trend toward fewer large farms. There has also been a decline in the number of farms and the amount of land used for agricultural purposes in Niagara. Market gardens, orchards, and field crops have declined in total acreage, while grape growing, greenhouse operations, and feedlot operations have increased. Niagara Regional Council commissioned a study in the fall of 2001 to assess the nature of agriculture in Niagara, and its importance to the Niagara economy. The Regional Agricultural Economic Impact Study was carried out in 2002 and used both primary and secondary data sources. It used Census data from 2001, and determined that the industry generated in excess of $511 million in gross farm sales, equivalent to about $400 million

Assessment Report – Chapter 2: Niagara Peninsula Source Protection Area Niagara Peninsula Source Protection Area
NPCA 30
in direct sales, $562 million in indirect sales and $832 million in induced sales for a total of $1.8 billion across all sectors of the Niagara economy (Niagara Region, 2003). The Niagara Region’s website provides a summary of farm statistics based on the results of the study. Table 2.3 shows how the total gross farm receipts are dispersed across the commodity groups in Niagara. Table 2.3: Total Gross Farm Receipts in Niagara in 2001 Commodity Groups in Niagara Gross Farm Receipts Greenhouse Product $217,600,000 Fruit $48,000,000 Grape $50,000,000 Poultry and Egg $90,800,000 Nursery $27,700,000 Cash Crop $2,010,000 Hog $8,100,000 Beef $4,400,000 Horse and Pony $4,200,000 Dairy $23,300,000 Miscellaneous Agriculture $34,800,000 TOTAL $510,910,000 Some important findings of this study include:
• The top ten commodity groups in 2001 were: greenhouse, hog, cash crop, nursery, poultry, grape, tender fruit, beef, horse & pony, and dairy.
• The greenhouse industry is currently the largest commodity group in Niagara. • The total gross farm receipts in 2001 in Niagara was $511.1 million dollars. • The $511 million worth of output produced $1.8 billion in output impact in the
economy, of which $344 million was related to labour income. • Lincoln, Niagara-on-the-Lake and West Lincoln generated the highest gross farm
receipts; and Fort Erie, Niagara Falls and Welland had the lowest. • The social and cultural aspects of the agricultural industry are important to
consider, such as the age of farmers, the aesthetics of driving through farmland and what a loss of the landscape would mean, farmer training and programs for schools.
The Tier 1 Water Budget and Stress Assessment Report evaluated demand from agricultural water use sectors using the de Loe methodology (de Loe, 2001 and 2005) and agricultural census data. Using this methodology, demand estimates or withdrawals for five areas were determined. The five main categories include:
• Livestock (i.e. hens and chickens); • Field crops (i.e. winter wheat); • Fruit crops (i.e. apples); • Vegetable crops (i.e. sweet corn); and • Specialty crops (i.e. sod).
Assessment Report – Chapter 2: Niagara Peninsula Source Protection Area Niagara Peninsula Source Protection Area
NPCA 31
Agricultural water use was calculated for four (4) agricultural censuses: 1991, 1996, 2001 and 2006. For water budgeting purposes the most recent census, 2006, was used to represent the most current conditions in NPCA. Calculations of livestock watering illustrate a decreasing trend between 1991 and 2006 while crop water use shows an overall increasing trend in the same time frame. In the NPSP Area, the majority of demand is primarily for greenhouse flowers (within the specialty crops category) followed closely by peaches (within the fruit crops category). Calculated agricultural consumptive water demands with respect to groundwater and in-land surface water sources indicate monthly amounts were greatest in either July, August or both.
2.6.8 Managed Lands Managed lands are lands to which agricultural sources material (e.g. manure), commercial fertilizer or non-agricultural source material (e.g. biosolids) are applied. Managed land can include, but is not limited to, cropland, fallow land, improved pasture, golf courses, sports fields, and lawns. The definition does not include storage of materials, which is dealt with separately in the threats section. Managed lands can be divided into two subsets:
• Agricultural managed land: means managed land that is used for agricultural production purposes including areas of cropland, fallow land and improved pasture where agricultural source material (ASM), commercial fertilizer or non-agricultural source material (NASM) is applied or may be applied.
• Non-agricultural managed land: includes golf courses (turf), sports fields, lawns (turf) and other built-up grassed areas that may receive nutrients (primarily commercial fertilizer).
Managed lands for NPSP Area Intake Protection Zones (IPZs) (Chapters 6 through 12), Highly Vulnerable Aquifers (HVAs) and Significant Groundwater Recharge Areas (SGRAs) (Chapter 4) were mapped by NPCA (Figures 2.14a through 2.14f, 2.15 and 2.16). The analysis was completed at a parcel class level constrained by land use mapping. The water portions of IPZs were not included. The percentage of managed lands for HVAs and SGRAs was assessed on a 1km2 grid in consultation with the MOE (DRAFT Clarification of Issues in Regard to Managed Lands, April 2010a). This was instead of the suggested determination of percentage over the (i) combined HVA area, (ii) within several HVAs combined, or (iii) for individual HVA polygons (MOE, 2009a). The 1km2 grid approach was chosen because:
i. the HVAs and SGRAs cover a large extent (662km2 and 542 km2, respectively) making a single combined percentage per vulnerable area too generalized to be informative;
ii. it uses a similar approach to the impervious surface vulnerable area mapping approach (TR 16 (11)) for combining small vulnerable areas (<1km2) while representing the heterogeneity of larger vulnerable areas (>1km2); and
iii. there are over 5000 HVA and over 1000 SGRA polygons making representation and identification per polygon too small and detailed to be clearly communicated.
Assessment Report – Chapter 2: Niagara Peninsula Source Protection Area Niagara Peninsula Source Protection Area
NPCA 32
However, the 1 km2 grid did provide a reasonable scale on which to perform the managed land analysis and communicate the results. This is particularly true when considering the parcel level property information that was used in the analysis. It is for this reason the 1km2 grid approach was considered better than, or at least equal to, the proposed default method.
Managed lands are classified for the threat assessment as <40%, 40-80%, or >80% managed lands. These values are used in the threat assessment to consider if the application of nutrients may result in a threat to a vulnerable area.
TR 16(9), 16(10)
2.6.9 Livestock Production and Density Livestock density is used as a substitute measure of the potential for generating, storing and applying ASM as a source of nutrients within a defined area. Figures 2.14g through 2.14l show the livestock density in nutrient units per hectare for each IPZ in the NPSP Area. This was used in the IPZ threat analyses completed by Stantec Consulting Ltd. Livestock density for HVAs and SGRAs were also mapped by NPCA (Figures 2.17 and 2.18). The livestock density for HVAs and SGRAs was assessed on a 1km2 grid in consultation with the MOE (DRAFT Clarification of Issues in Regard to Managed Lands, April 2010a). This was instead of the suggested determination of percentage over the (i) combined HVA area, (ii) within several HVAs combined, or (iii) for individual HVA polygons (MOE, 2009a). The 1km2 grid approach was chosen because:
i. the HVAs and SGRAs cover a large extent (662km2 and 542 km2, respectively) making a single combined percentage per vulnerable area too generalized to be informative;
ii. it uses a similar approach to the impervious surface vulnerable area mapping approach (TR 16 (11)) for combining small vulnerable areas (<1km2) while representing the heterogeneity of larger vulnerable areas (>1km2); and
iii. there are over 5000 HVA and over 1000 SGRA polygons making representation and identification per polygon too small and detailed to be clearly communicated. However, the 1 km2 grid did provide a reasonable scale on which to perform the managed land analysis and communicate the results. This is particularly true when considering the parcel level property information that was used in the analysis. It is for this reason the 1km2 grid approach was considered better than, or at least equal to, the proposed default method.
According to the Nutrient Management Act, a nutrient unit is defined as the number of animals housed, or pastured, at one time on a Farm Unit, that generates enough manure to fertilize the same area of crop land base under the most limiting of either nitrogen or phosphorous. In the case where no animals are housed, the weight or volume of manure or other biosolids used annually on a Farm Unit, that fertilizes the same area of crop land base under the most limiting of either nitrogen or phosphorus is used. This measurement was used because it reflects the environmental risk to ground and surface water based on

Assessment Report – Chapter 2: Niagara Peninsula Source Protection Area Niagara Peninsula Source Protection Area
NPCA 33
the nutrients applied, and by comparing sizes and types of Farm Units (OMAFRA, 2009b). The Niagara area is best known for its tender fruit and grape production, but also maintains a large and profitable poultry industry. Niagara alone has the largest amount of broiler and other meat-type chicken production farms in Ontario (Farms Classified by Industry, 2006). Throughout the NPSP Area, fruit production is dominant below the escarpment, while grain and oilseed and miscellaneous specialty crops tend to be prolific above the escarpment. In a regional agricultural economic impact study by Niagara Region (2001), all of the dairy, cattle, hog and poultry and egg farms make up less than 25% of all farms. Livestock operations are primarily found in the Town of Fort Erie and the Townships of Wainfleet and West Lincoln, which are located on the Haldimand Clay Plain (Waterloo Hydrogeologic Inc, 2005). Livestock is most dominant above the escarpment, with highest production in the Township of West Lincoln (Niagara Region, 2003).
TR 16(10)
2.6.10 Federal Lands The Directory of Federal Real Property (DFRP) was used to map federal lands located within the NPSP Area. The purpose of Technical Rule 16(2)(e) is to identify federally regulated lands, not federal buildings in a municipally or provincially regulated area. The DFRP is the central and only complete listing of real property holdings of the Government of Canada. It is administered by the Real Property and Material Policy Directorate of the Treasury Board Secretariat (Treasury board of Canada, 2009). Figure 2.19 shows the location of federal lands within the NPSP Area. The majority of the federal lands include the Welland Canal, which is operated by the St. Lawrence Seaway Authority. Also, some Federal lands are located in Niagara-on-the-Lake such as the Rifle Range and Training Area, the New Military Campgrounds, and the Butler’s Barracks National Historic Site of Canada. Some of the minor Federal lands are dispersed throughout the NPSP Area and are found in Jordan, Hamilton, Vineland, St. Catharines and Niagara Falls. The insets on Figure 2.19 show the federal lands in the area of Port Colborne and Allanburg. Federal lands are within the Intake Protection Zones for two water treatment plants, DeCew Falls (i.e. Allanburg area) and Port Colborne.
TR 16(2)(e)
2.6.11 Impervious Surface Areas within Vulnerable Areas The purpose of impervious area mapping is to map areas where road salt is or can be applied. CWA Technical Rule 16 (11) states that the percentage of impervious surface area where road salt can be applied per square kilometer in each vulnerable area shall be included in a characterization of a watershed, where the information is available. Mapping the percentage of impervious surface area is required for activities that are considered a threat in the Table of Drinking Water Threats (TDWTs) (Section 5.4). For
Assessment Report – Chapter 2: Niagara Peninsula Source Protection Area Niagara Peninsula Source Protection Area
NPCA 34
the NPSP Area, this includes the Intake Protection Zones (IPZs) (Chapters 6 through 12) and Highly Vulnerable Aquifers (HVAs) and Significant Groundwater Recharge Areas (SGRAs) (Chapter 4).
TR 16(11) Impervious areas for NPSP Area IPZs were mapped by Stantec Consulting Limited (Figures 2.20 through 2.27). Impervious areas for HVAs and SGRAs were mapped by NPCA (Figures 2.28 and 2.29). Total impervious surface areas are calculated on a km2 grid and classed for the threat assessment as <1%, 1-8%, 8-80% or >80% impervious. These values are used in the threat assessment to consider if the application of road salt may result in the presence of sodium or chloride. An alternative grid centroid, centered on the individual IPZ, was used by Stantec Consulting Limited rather than centred on the entire NPSP Area. The approach is appropriate and reasonable as it fairly divided the IPZs into 1km2 grids centered on the area of interest. The alternative approach has been approved by the Ministry of the Environment under Assessment Report Technical Rule 15.1 with respect to Technical Rule 17 (I. Smith, 2010a). The letter of approval is provided in Appendix E.
TR 16(11), 17
2.6.12 Protected and Recreational Areas Protected land areas are shown in Figure 2.30, and include NPCA-owned lands such as Ball’s Falls Conservation Area and Wainfleet Bog. Other areas that are marginally protected include the lands under the jurisdiction of the Niagara Escarpment Commission, and the Green Belt Act, 2005. Recreational land-use areas in the NPSP Area include Conservation Areas, municipal parks, golf courses, campgrounds, bicycling and walking paths, and the Welland Recreational Canal (which is also known as the Old Welland Canal). Recreational areas are presented in Figure 2.31.
2.6.13 Landfills Landfills and Brownfield sites are potential sources of groundwater contamination in the NPSP Area. According to the NPCA Groundwater Study, there are 112 landfill sites in the study area, of which 21 are active and 91 are closed (Figure 2.32). Older landfills that were developed prior to provincial standards that required leachate collection and liners, as well as groundwater monitoring, are potentially a major source of groundwater contamination (WHI, 2005).
2.6.14 Oil and Gas Fields, and Aggregate Extractions According to the NPCA Groundwater Study, there are approximately 53 quarries (where bedrock is extracted), and 34 gravel pits (where sand and gravel is extracted near the ground surface from granular overburden deposits) in the NPSP Area. Aggregate
Assessment Report – Chapter 2: Niagara Peninsula Source Protection Area Niagara Peninsula Source Protection Area
NPCA 35
extraction operations usually result in the protective overburden being removed and this increases the risk of groundwater contamination. Locations of major aggregate extraction operations are shown in Figure 2.33 (Surficial Geology). Natural gas has historically been extracted from deep bedrock wells in the Niagara Peninsula. Oil and Gas wells are primarily located in the southern portion of the peninsula, as shown in Figure 2.34. The Ontario Oil, Gas and Salt Library (OGSRL) provided and are in the process of verifying (i.e. georeferencing) this dataset as detailed on the figure. The OGSRL dataset included six (6) well types: (i) natural gas storage wells, (ii) natural gas wells, (iii) observation wells, (iv) oil and gas wells, (v) private gas wells and (vi) stratigraphic test wells. These data sources are further evaluated as part of the transport pathways assessment for evaluation of HVAs (Section 4).
TR 16 (3)(a)
2.6.15 Serviced Areas Municipally serviced areas in the NPSP Area are generally restricted to the larger developed urban centres. The areas serviced by municipal water are shown in Figure 2.35. A number of villages are also serviced by municipal water. These include Smithville, Jordan, Vineland, Binbrook, Virgil, and Stevensville. There are currently ten (10) water pollution control plants (WPCPs) and two (2) sewage lagoons in operation in the NPSP Area. Discharges from WPCPs and sewage lagoons are considered a Threat to the water quality. Typical concerns related to these facilities include nitrogen, phosphorous, bacteria, and pathogens. Pharmaceuticals are also now being researched for their potential adverse effects on the water quality.
2.6.16 Private Sewage Systems Many rural areas and villages in the NPSP Area are serviced by private sewage systems. The responsibility for inspection and approval of sewage systems having capacity less than 10,000 L/day depends on the municipality’s implementation of Part 8 of the Ontario Building Code (OBC). Some municipalities conduct their own approvals while some utilize the services of the Niagara Region Public Works Department. The MOE Environmental Assessment and Approvals Branch is however responsible for approval of large sewage systems (i.e. discharges greater than 10,000 L/day). Table 2.4 provides information on the municipal approvals process.
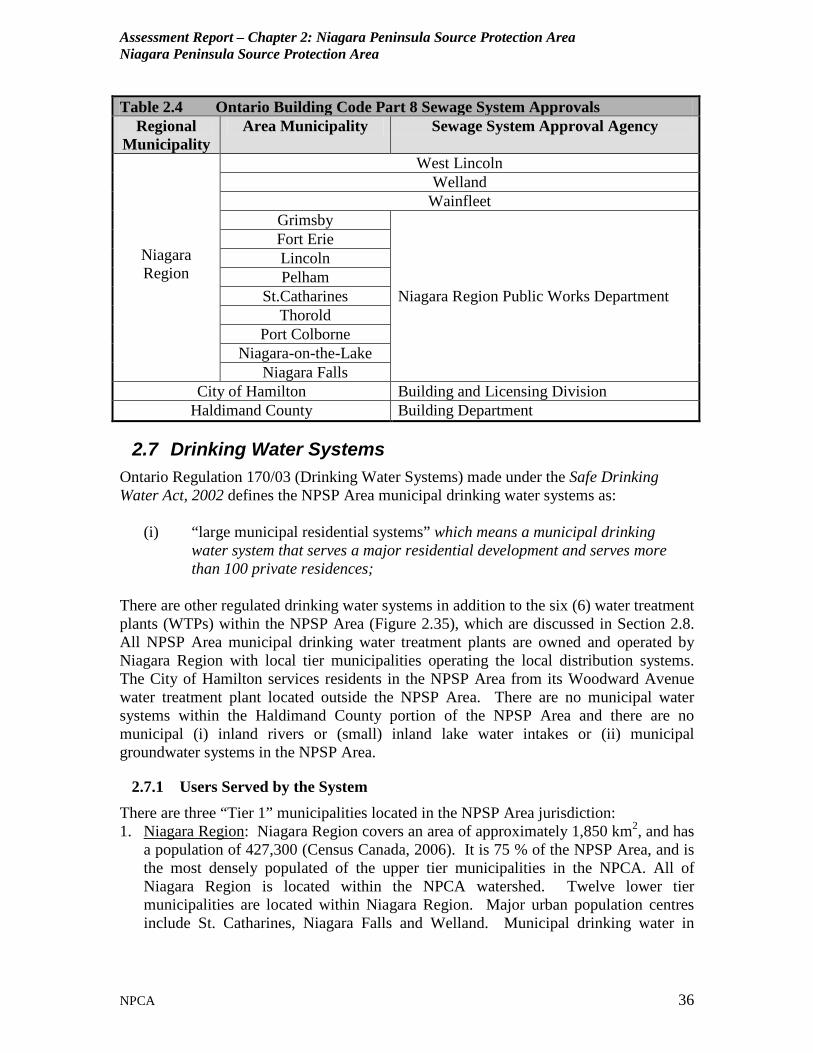
Assessment Report – Chapter 2: Niagara Peninsula Source Protection Area Niagara Peninsula Source Protection Area
NPCA 36
Table 2.4 Ontario Building Code Part 8 Sewage System Approvals Regional
Municipality Area Municipality Sewage System Approval Agency
Niagara Region
West Lincoln Welland
Wainfleet Grimsby
Niagara Region Public Works Department
Fort Erie Lincoln Pelham
St.Catharines Thorold
Port Colborne Niagara-on-the-Lake
Niagara Falls City of Hamilton Building and Licensing Division
Haldimand County Building Department
2.7 Drinking Water Systems Ontario Regulation 170/03 (Drinking Water Systems) made under the Safe Drinking Water Act, 2002 defines the NPSP Area municipal drinking water systems as:
(i) “large municipal residential systems” which means a municipal drinking water system that serves a major residential development and serves more than 100 private residences;
There are other regulated drinking water systems in addition to the six (6) water treatment plants (WTPs) within the NPSP Area (Figure 2.35), which are discussed in Section 2.8. All NPSP Area municipal drinking water treatment plants are owned and operated by Niagara Region with local tier municipalities operating the local distribution systems. The City of Hamilton services residents in the NPSP Area from its Woodward Avenue water treatment plant located outside the NPSP Area. There are no municipal water systems within the Haldimand County portion of the NPSP Area and there are no municipal (i) inland rivers or (small) inland lake water intakes or (ii) municipal groundwater systems in the NPSP Area.
2.7.1 Users Served by the System There are three “Tier 1” municipalities located in the NPSP Area jurisdiction: 1. Niagara Region: Niagara Region covers an area of approximately 1,850 km2, and has
a population of 427,300 (Census Canada, 2006). It is 75 % of the NPSP Area, and is the most densely populated of the upper tier municipalities in the NPCA. All of Niagara Region is located within the NPCA watershed. Twelve lower tier municipalities are located within Niagara Region. Major urban population centres include St. Catharines, Niagara Falls and Welland. Municipal drinking water in
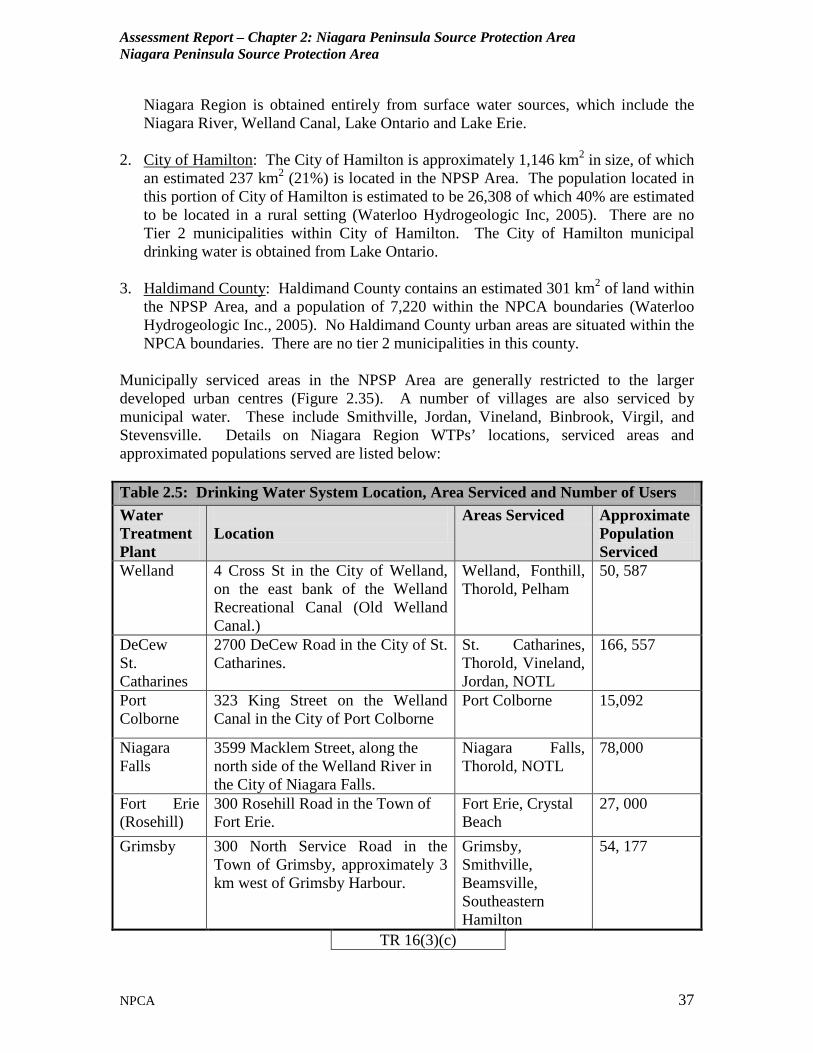
Assessment Report – Chapter 2: Niagara Peninsula Source Protection Area Niagara Peninsula Source Protection Area
NPCA 37
Niagara Region is obtained entirely from surface water sources, which include the Niagara River, Welland Canal, Lake Ontario and Lake Erie.
2. City of Hamilton: The City of Hamilton is approximately 1,146 km2 in size, of which an estimated 237 km2 (21%) is located in the NPSP Area. The population located in this portion of City of Hamilton is estimated to be 26,308 of which 40% are estimated to be located in a rural setting (Waterloo Hydrogeologic Inc, 2005). There are no Tier 2 municipalities within City of Hamilton. The City of Hamilton municipal drinking water is obtained from Lake Ontario.
3. Haldimand County: Haldimand County contains an estimated 301 km2 of land within the NPSP Area, and a population of 7,220 within the NPCA boundaries (Waterloo Hydrogeologic Inc., 2005). No Haldimand County urban areas are situated within the NPCA boundaries. There are no tier 2 municipalities in this county.
Municipally serviced areas in the NPSP Area are generally restricted to the larger developed urban centres (Figure 2.35). A number of villages are also serviced by municipal water. These include Smithville, Jordan, Vineland, Binbrook, Virgil, and Stevensville. Details on Niagara Region WTPs’ locations, serviced areas and approximated populations served are listed below: Table 2.5: Drinking Water System Location, Area Serviced and Number of Users Water Treatment Plant
Location
Areas Serviced Approximate Population Serviced
Welland 4 Cross St in the City of Welland, on the east bank of the Welland Recreational Canal (Old Welland Canal.)
Welland, Fonthill, Thorold, Pelham
50, 587
DeCew St. Catharines
2700 DeCew Road in the City of St. Catharines.
St. Catharines, Thorold, Vineland, Jordan, NOTL
166, 557
Port Colborne
323 King Street on the Welland Canal in the City of Port Colborne
Port Colborne 15,092
Niagara Falls
3599 Macklem Street, along the north side of the Welland River in the City of Niagara Falls.
Niagara Falls, Thorold, NOTL
78,000
Fort Erie (Rosehill)
300 Rosehill Road in the Town of Fort Erie.
Fort Erie, Crystal Beach
27, 000
Grimsby 300 North Service Road in the Town of Grimsby, approximately 3 km west of Grimsby Harbour.
Grimsby, Smithville, Beamsville, Southeastern Hamilton
54, 177
TR 16(3)(c)
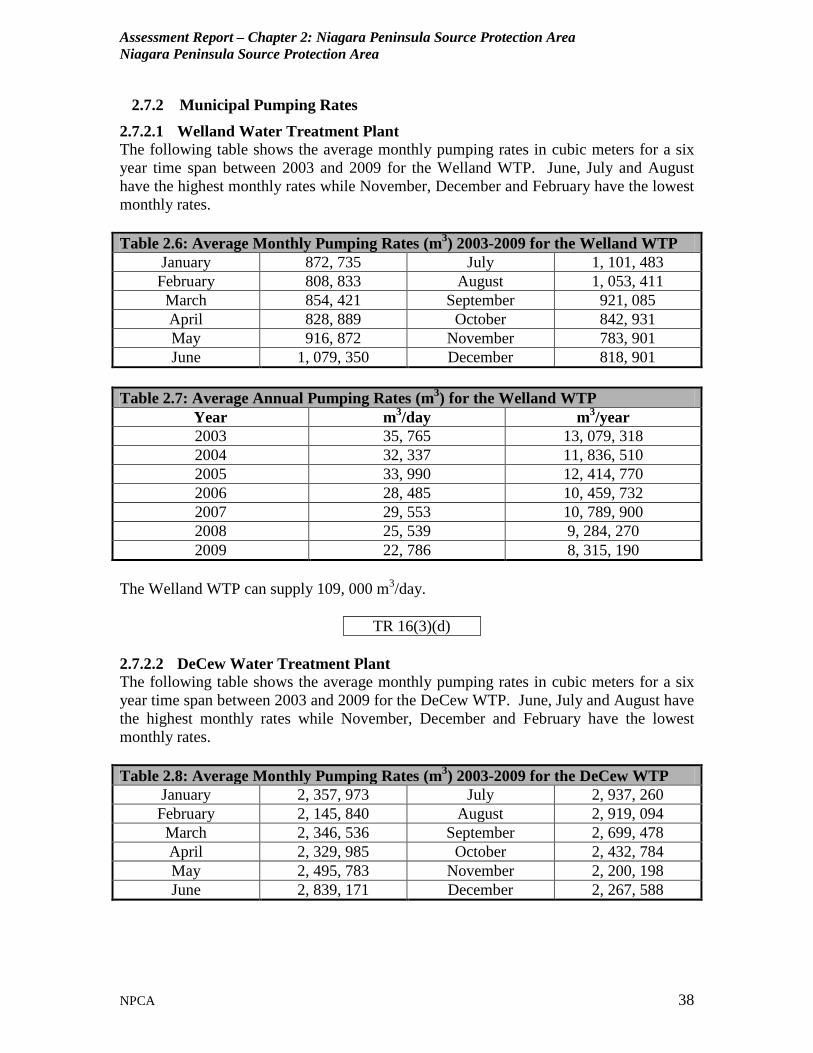
Assessment Report – Chapter 2: Niagara Peninsula Source Protection Area Niagara Peninsula Source Protection Area
NPCA 38
2.7.2 Municipal Pumping Rates 2.7.2.1 Welland Water Treatment Plant The following table shows the average monthly pumping rates in cubic meters for a six year time span between 2003 and 2009 for the Welland WTP. June, July and August have the highest monthly rates while November, December and February have the lowest monthly rates. Table 2.6: Average Monthly Pumping Rates (m3) 2003-2009 for the Welland WTP
January 872, 735 July 1, 101, 483 February 808, 833 August 1, 053, 411 March 854, 421 September 921, 085 April 828, 889 October 842, 931 May 916, 872 November 783, 901 June 1, 079, 350 December 818, 901
Table 2.7: Average Annual Pumping Rates (m3) for the Welland WTP
Year m3/day m3/year 2003 35, 765 13, 079, 318 2004 32, 337 11, 836, 510 2005 33, 990 12, 414, 770 2006 28, 485 10, 459, 732 2007 29, 553 10, 789, 900 2008 25, 539 9, 284, 270 2009 22, 786 8, 315, 190
The Welland WTP can supply 109, 000 m3/day.
TR 16(3)(d) 2.7.2.2 DeCew Water Treatment Plant The following table shows the average monthly pumping rates in cubic meters for a six year time span between 2003 and 2009 for the DeCew WTP. June, July and August have the highest monthly rates while November, December and February have the lowest monthly rates. Table 2.8: Average Monthly Pumping Rates (m3) 2003-2009 for the DeCew WTP
January 2, 357, 973 July 2, 937, 260 February 2, 145, 840 August 2, 919, 094 March 2, 346, 536 September 2, 699, 478 April 2, 329, 985 October 2, 432, 784 May 2, 495, 783 November 2, 200, 198 June 2, 839, 171 December 2, 267, 588
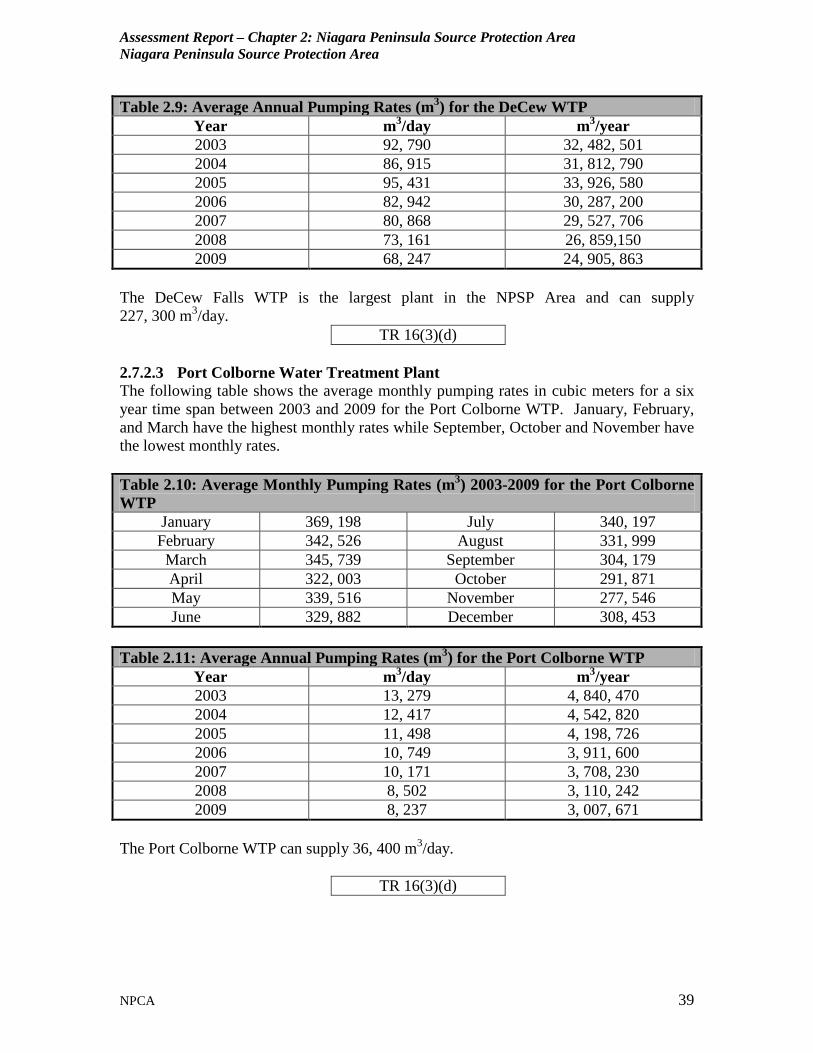
Assessment Report – Chapter 2: Niagara Peninsula Source Protection Area Niagara Peninsula Source Protection Area
NPCA 39
Table 2.9: Average Annual Pumping Rates (m3) for the DeCew WTP Year m3/day m3/year 2003 92, 790 32, 482, 501 2004 86, 915 31, 812, 790 2005 95, 431 33, 926, 580 2006 82, 942 30, 287, 200 2007 80, 868 29, 527, 706 2008 73, 161 26, 859,150 2009 68, 247 24, 905, 863
The DeCew Falls WTP is the largest plant in the NPSP Area and can supply 227, 300 m3/day.
TR 16(3)(d) 2.7.2.3 Port Colborne Water Treatment Plant The following table shows the average monthly pumping rates in cubic meters for a six year time span between 2003 and 2009 for the Port Colborne WTP. January, February, and March have the highest monthly rates while September, October and November have the lowest monthly rates. Table 2.10: Average Monthly Pumping Rates (m3) 2003-2009 for the Port Colborne WTP
January 369, 198 July 340, 197 February 342, 526 August 331, 999 March 345, 739 September 304, 179 April 322, 003 October 291, 871 May 339, 516 November 277, 546 June 329, 882 December 308, 453
Table 2.11: Average Annual Pumping Rates (m3) for the Port Colborne WTP
Year m3/day m3/year 2003 13, 279 4, 840, 470 2004 12, 417 4, 542, 820 2005 11, 498 4, 198, 726 2006 10, 749 3, 911, 600 2007 10, 171 3, 708, 230 2008 8, 502 3, 110, 242 2009 8, 237 3, 007, 671
The Port Colborne WTP can supply 36, 400 m3/day.
TR 16(3)(d)
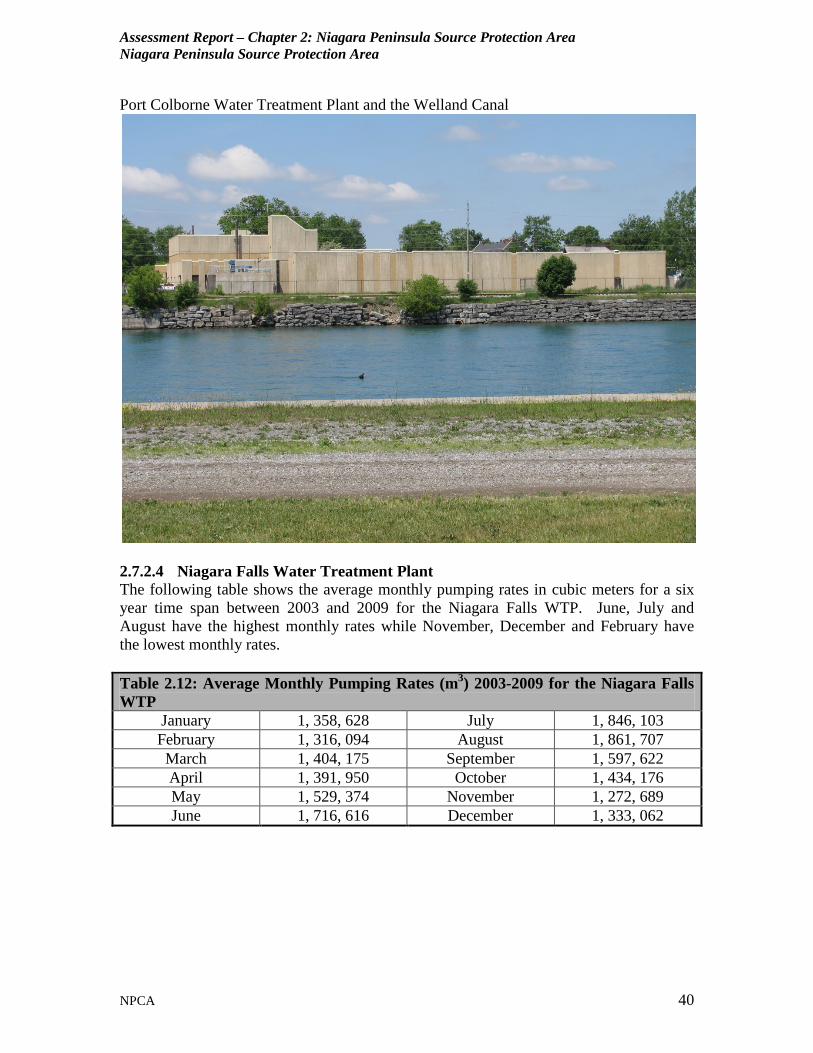
Assessment Report – Chapter 2: Niagara Peninsula Source Protection Area Niagara Peninsula Source Protection Area
NPCA 40
Port Colborne Water Treatment Plant and the Welland Canal
2.7.2.4 Niagara Falls Water Treatment Plant The following table shows the average monthly pumping rates in cubic meters for a six year time span between 2003 and 2009 for the Niagara Falls WTP. June, July and August have the highest monthly rates while November, December and February have the lowest monthly rates. Table 2.12: Average Monthly Pumping Rates (m3) 2003-2009 for the Niagara Falls WTP
January 1, 358, 628 July 1, 846, 103 February 1, 316, 094 August 1, 861, 707 March 1, 404, 175 September 1, 597, 622 April 1, 391, 950 October 1, 434, 176 May 1, 529, 374 November 1, 272, 689 June 1, 716, 616 December 1, 333, 062

Assessment Report – Chapter 2: Niagara Peninsula Source Protection Area Niagara Peninsula Source Protection Area
NPCA 41
Table 2.13: Average Annual Pumping Rates (m3) for the Niagara Falls WTP Year m3/day m3/year 2003 44,363 17, 015,075 2004 49, 042 17, 955,040 2005 52, 285 19, 363, 120 2006 49, 876 18, 215, 920 2007 51, 696 18, 886, 190 2008 47 ,732 17, 475, 410 2009 47, 994 17, 524, 640
The Niagara Falls WTP can supply 145, 500 m3/day.
TR 16(3)(d) 2.7.2.5 Rosehill Water Treatment Plant The following table shows the average monthly pumping rates in cubic meters for a six year time span between 2003 and 2009 for the Rosehill WTP. June, July and August have the highest monthly rates while November, December and February have the lowest monthly rates. Table 2.14: Average Monthly Pumping Rates (m3) 2003-2009 for Rosehill WTP
January 423, 882 July 556, 809 February 400, 530 August 543, 608 March 420, 612 September 469, 864 April 419, 007 October 433, 614 May 482, 642 November 398, 097 June 532, 151 December 401, 988
Table 2.15: Average Annual Pumping Rates (m3) for Rosehill WTP
Year m3/day m3/year 2003 15, 526 6, 183, 287 2004 14, 808 5, 404, 520 2005 15, 429 5, 632, 320 2006 14, 974 5, 467, 920 2007 14, 461 5, 281, 460 2008 14, 043 5, 110, 780 2009 14, 517 5, 299, 340
The Rosehill WTP can supply 50, 000 m3/day.
TR 16(3)(d)
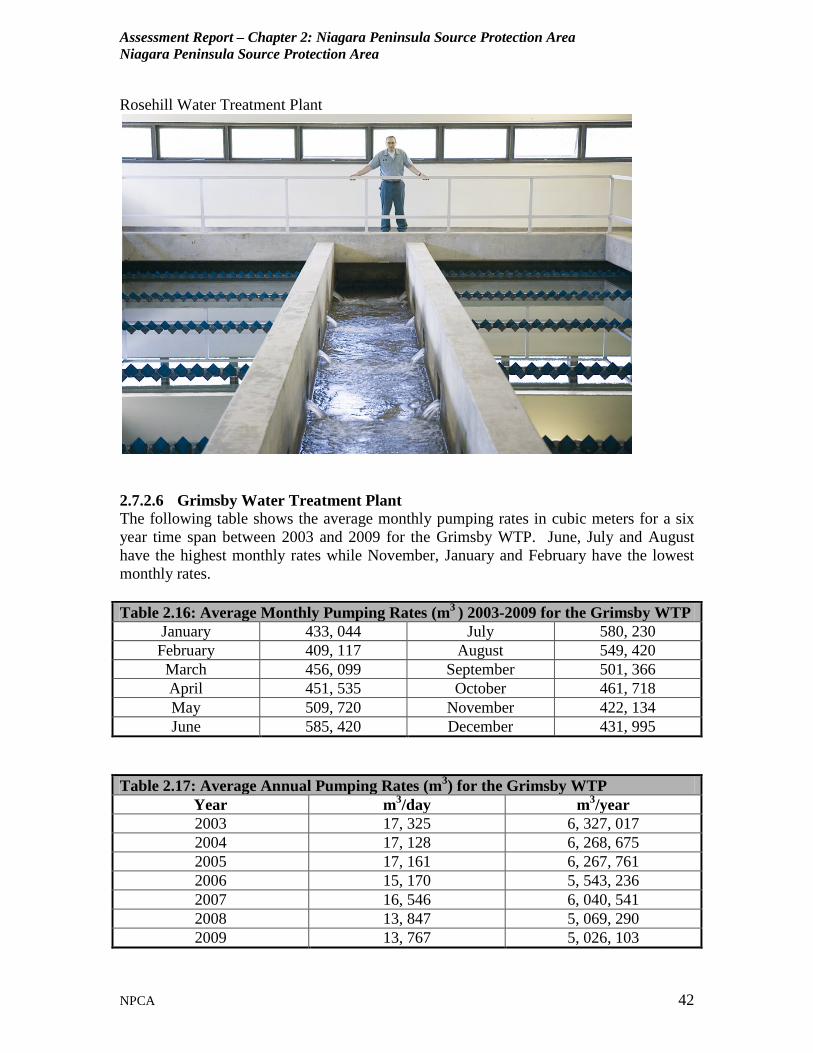
Assessment Report – Chapter 2: Niagara Peninsula Source Protection Area Niagara Peninsula Source Protection Area
NPCA 42
Rosehill Water Treatment Plant
2.7.2.6 Grimsby Water Treatment Plant The following table shows the average monthly pumping rates in cubic meters for a six year time span between 2003 and 2009 for the Grimsby WTP. June, July and August have the highest monthly rates while November, January and February have the lowest monthly rates. Table 2.16: Average Monthly Pumping Rates (m3 ) 2003-2009 for the Grimsby WTP
January 433, 044 July 580, 230 February 409, 117 August 549, 420 March 456, 099 September 501, 366 April 451, 535 October 461, 718 May 509, 720 November 422, 134 June 585, 420 December 431, 995
Table 2.17: Average Annual Pumping Rates (m3) for the Grimsby WTP
Year m3/day m3/year 2003 17, 325 6, 327, 017 2004 17, 128 6, 268, 675 2005 17, 161 6, 267, 761 2006 15, 170 5, 543, 236 2007 16, 546 6, 040, 541 2008 13, 847 5, 069, 290 2009 13, 767 5, 026, 103
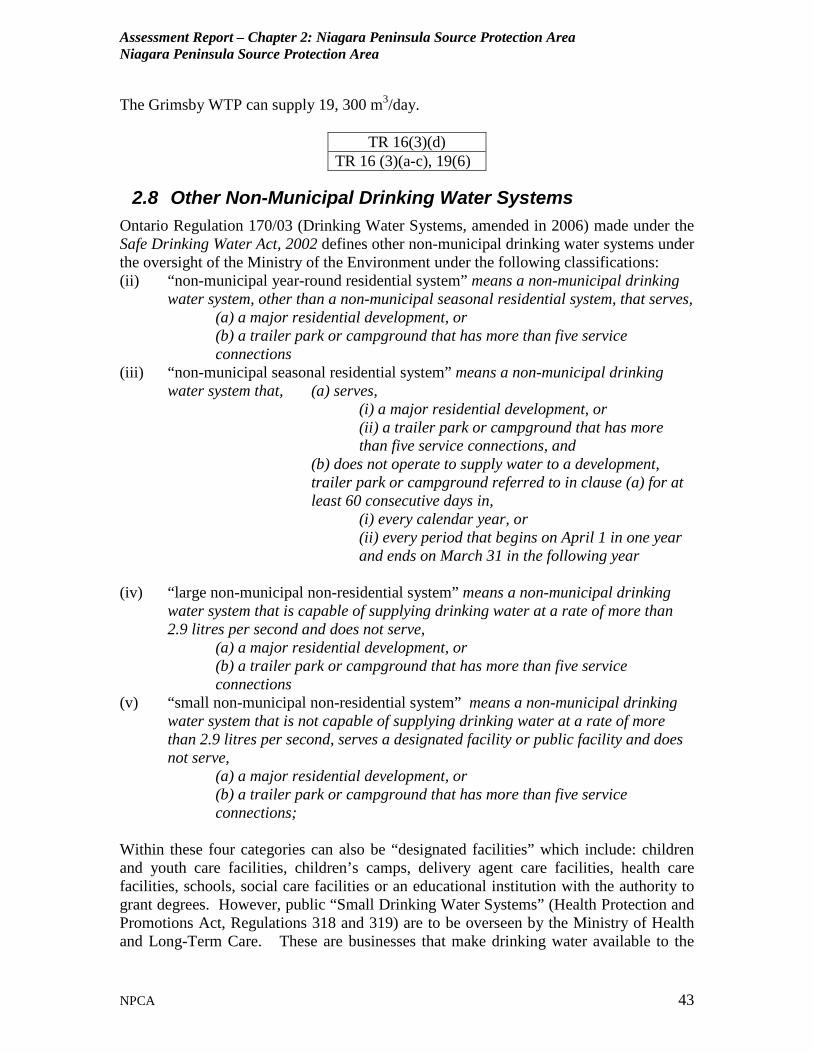
Assessment Report – Chapter 2: Niagara Peninsula Source Protection Area Niagara Peninsula Source Protection Area
NPCA 43
The Grimsby WTP can supply 19, 300 m3/day.
TR 16(3)(d) TR 16 (3)(a-c), 19(6)
2.8 Other Non-Municipal Drinking Water Systems Ontario Regulation 170/03 (Drinking Water Systems, amended in 2006) made under the Safe Drinking Water Act, 2002 defines other non-municipal drinking water systems under the oversight of the Ministry of the Environment under the following classifications: (ii) “non-municipal year-round residential system” means a non-municipal drinking
water system, other than a non-municipal seasonal residential system, that serves, (a) a major residential development, or (b) a trailer park or campground that has more than five service connections
(iii) “non-municipal seasonal residential system” means a non-municipal drinking water system that, (a) serves,
(i) a major residential development, or (ii) a trailer park or campground that has more than five service connections, and (b) does not operate to supply water to a development, trailer park or campground referred to in clause (a) for at least 60 consecutive days in, (i) every calendar year, or (ii) every period that begins on April 1 in one year and ends on March 31 in the following year
(iv) “large non-municipal non-residential system” means a non-municipal drinking water system that is capable of supplying drinking water at a rate of more than 2.9 litres per second and does not serve,
(a) a major residential development, or (b) a trailer park or campground that has more than five service connections
(v) “small non-municipal non-residential system” means a non-municipal drinking water system that is not capable of supplying drinking water at a rate of more than 2.9 litres per second, serves a designated facility or public facility and does not serve,
(a) a major residential development, or (b) a trailer park or campground that has more than five service connections;
Within these four categories can also be “designated facilities” which include: children and youth care facilities, children’s camps, delivery agent care facilities, health care facilities, schools, social care facilities or an educational institution with the authority to grant degrees. However, public “Small Drinking Water Systems” (Health Protection and Promotions Act, Regulations 318 and 319) are to be overseen by the Ministry of Health and Long-Term Care. These are businesses that make drinking water available to the
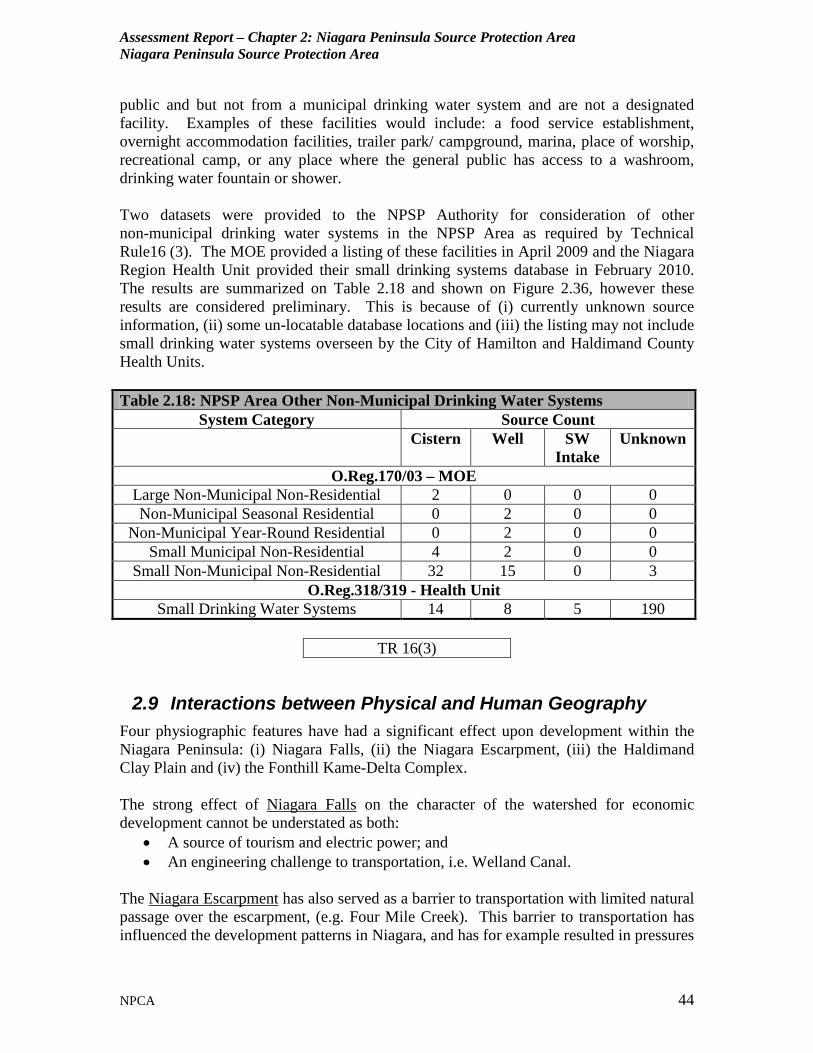
Assessment Report – Chapter 2: Niagara Peninsula Source Protection Area Niagara Peninsula Source Protection Area
NPCA 44
public and but not from a municipal drinking water system and are not a designated facility. Examples of these facilities would include: a food service establishment, overnight accommodation facilities, trailer park/ campground, marina, place of worship, recreational camp, or any place where the general public has access to a washroom, drinking water fountain or shower. Two datasets were provided to the NPSP Authority for consideration of other non-municipal drinking water systems in the NPSP Area as required by Technical Rule16 (3). The MOE provided a listing of these facilities in April 2009 and the Niagara Region Health Unit provided their small drinking systems database in February 2010. The results are summarized on Table 2.18 and shown on Figure 2.36, however these results are considered preliminary. This is because of (i) currently unknown source information, (ii) some un-locatable database locations and (iii) the listing may not include small drinking water systems overseen by the City of Hamilton and Haldimand County Health Units. Table 2.18: NPSP Area Other Non-Municipal Drinking Water Systems
System Category Source Count Cistern Well SW
Intake Unknown
O.Reg.170/03 – MOE Large Non-Municipal Non-Residential 2 0 0 0 Non-Municipal Seasonal Residential 0 2 0 0
Non-Municipal Year-Round Residential 0 2 0 0 Small Municipal Non-Residential 4 2 0 0
Small Non-Municipal Non-Residential 32 15 0 3 O.Reg.318/319 - Health Unit
Small Drinking Water Systems 14 8 5 190
TR 16(3)
2.9 Interactions between Physical and Human Geography Four physiographic features have had a significant effect upon development within the Niagara Peninsula: (i) Niagara Falls, (ii) the Niagara Escarpment, (iii) the Haldimand Clay Plain and (iv) the Fonthill Kame-Delta Complex. The strong effect of Niagara Falls on the character of the watershed for economic development cannot be understated as both:
• A source of tourism and electric power; and • An engineering challenge to transportation, i.e. Welland Canal.
The Niagara Escarpment has also served as a barrier to transportation with limited natural passage over the escarpment, (e.g. Four Mile Creek). This barrier to transportation has influenced the development patterns in Niagara, and has for example resulted in pressures
Assessment Report – Chapter 2: Niagara Peninsula Source Protection Area Niagara Peninsula Source Protection Area
NPCA 45
to develop within the fruit belt area below the escarpment rather than extend transportation routes above the escarpment. The heavy clay soils of the Haldimand Clay Plain challenge agricultural use as a result of poor drainage and deficiencies in lime, phosphorus and organic matter. The Fonthill Kame-Delta Complex however forms a horticultural island within the clay plain. Anthropogenic (or human/man-made) activities have also shaped and impacted the NPSP Area in significant ways. At the time of European settlement, the Niagara Peninsula is assumed to have been covered by forests, until the land was cleared by settlers for agricultural purposes with considerable impacts as a result of the changes in vegetative cover. Since 1829, the construction of the four Welland Canals has impacted surface water and groundwater systems. Another major NPSP Area construction project with dramatic changes to surface water flow was the construction of the Adam Beck Generating Station and the construction of the power canals, which transport water from the mouth of the Welland River to the generating station. A further description of these activities and other notable man-made structures that have had an impact on the water resources within the Niagara Peninsula: • The Welland Canal, which begins in Port Colborne on Lake Erie and ends in Port
Weller, St. Catharines on Lake Ontario. The present canal contains 8 locks and three tunnels (having surface water and groundwater dewatering operations). The fourth canal (called the new canal) is the one currently used for shipping. The three tunnels are: Townline (road and rail) tunnel under the Welland Canal; East Main Street (road) tunnel under the Welland Canal; and Thorold (road) tunnel under the Welland Canal.
• The ‘Old’ Welland Canal (also called the third canal or Welland Recreational Canal) passes through downtown Welland, and is now used only for recreation but continues to receive from Lake Erie via the fourth Welland Canal;
• The Welland River siphons at the old and new Welland Canals; • Binbrook Dam is located at the Binbrook Conservation Area and is owned and
operated by the NPCA. The dam was built in 1971 to increase the summer water flow in the Welland River and to provide seasonal flood control. The dam created an artificial lake called Lake Niapenco covering 174 hectares and stretching nearing 5.4 km in length. The Lake Niapenco reservoir is the largest inland lake in the NPSP Area, providing a location for windsurfing, fishing, canoeing, and swimming.
• Virgil Dams Conservation Area is located in the town of Niagara-on-the-Lake. It features the Four Mile Creek Floodplain and the Virgil Reservoirs.
• Oil and Gas Wells (southwest portion of the NPSP Area - potential conduits for vertical contaminant movement, Figure 2.34);
• Hydroelectric water supply tunnels, channels, and intake structures on the Niagara River and the mouth of the Welland River used for the Adam Beck Hydro Electric Generating Station;
• Lake Gibson system, including the associated intake channels and retaining dykes and Lake Moodie. Lake Gibson was created as a reservoir in 1904 for hydroelectric power generation at the Ontario Power Generation DeCew Falls 1 and 2 generating stations. It was created by flooding the shallow valley of Beaverdams Creek. Lake
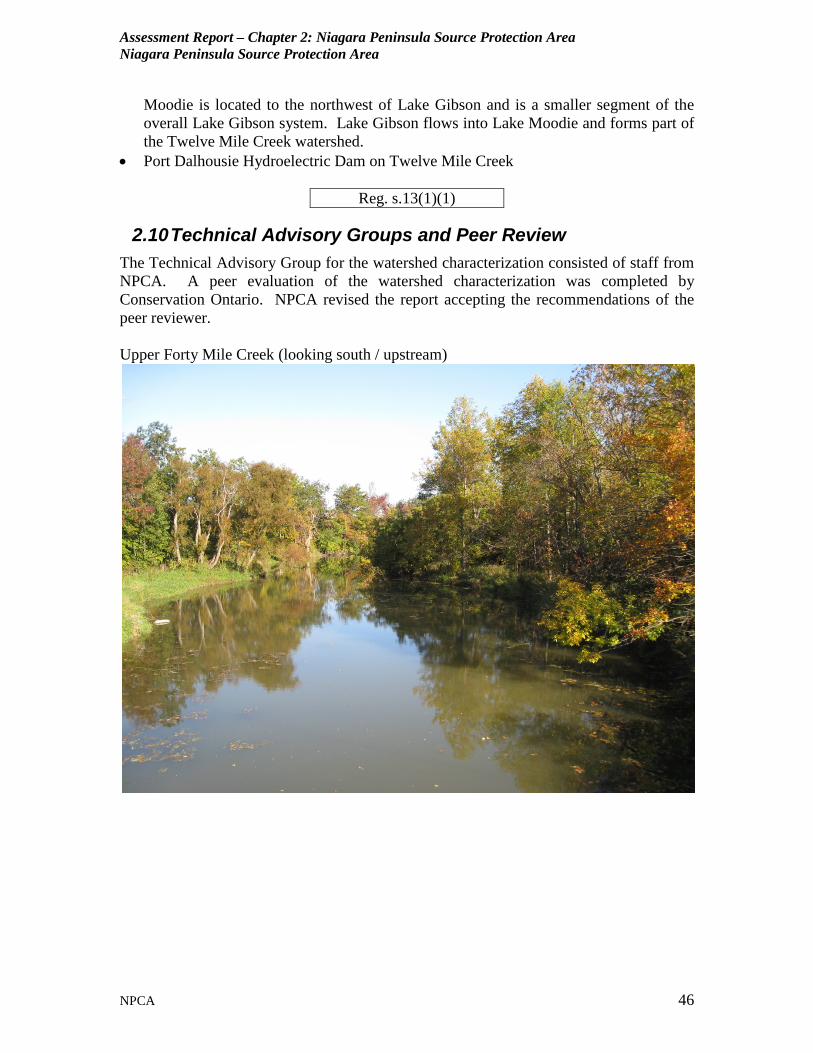
Assessment Report – Chapter 2: Niagara Peninsula Source Protection Area Niagara Peninsula Source Protection Area
NPCA 46
Moodie is located to the northwest of Lake Gibson and is a smaller segment of the overall Lake Gibson system. Lake Gibson flows into Lake Moodie and forms part of the Twelve Mile Creek watershed.
• Port Dalhousie Hydroelectric Dam on Twelve Mile Creek
Reg. s.13(1)(1)
2.10 Technical Advisory Groups and Peer Review The Technical Advisory Group for the watershed characterization consisted of staff from NPCA. A peer evaluation of the watershed characterization was completed by Conservation Ontario. NPCA revised the report accepting the recommendations of the peer reviewer. Upper Forty Mile Creek (looking south / upstream)