2 olive growing - australian olive association · pdf fileemilio martinez de victoria...
TRANSCRIPT

2 OliveGrowing

ChaptertitleAuthor 1
OLIVE GROWING

2 OliveGrowing

ChaptertitleAuthor 3
Scientific Editors
DIEGO BARRANCO RICARDO FERNANDEZ-ESCOBAR
LUIS RALLO Departamento de Agronomía.
Escuela Técnica Superior de Ingenieros Agrónomos y Montes Universidad de Córdoba
OLIVE GROWING
1st English edition of the 5th revised and enlarged edition of EL CuLtIVO dEL OLIVO
Translated by Susana E. Hovell and William A. Hovell Revised by Leandro Ravetti
For the Australian Olive Association Ltd PO Box 309 Pendle Hill NSW 2145 Australia Tel: +61 2 9863 8735 • Fax: +61 2 9636 4971
Co-edited by
JUNTA DE ANDALUCÍA Consejería de Agricultura y Pesca
EDICIONES MUNDI-PRENSA Madrid • Barcelona • Mexico
2004
RIRdC Australia 2010
4 OliveGrowing
JuNtA dE ANdALuCÍAConsejería de Agricultura y Pesca
Dirección General de Investigación y Formación Agraria
Servicio de Publicaciones y DivulgaciónJuan de Lara Nieto, s/n. 41071 SEVILLE
Tel.: 955 03 25 66 – Fax: 955 03 25 28
Grupo Mundi-Prensa• Mundi-Prensa Libros s.a.
Castelló, 37 – 28001 MadridTel. 914 36 37 00 – Fax 915 75 39 98
E-mail: [email protected]• Internet: www.mundiprensa.com • Mundi-Prensa Barcelona
• Editorial Aedos, s.a.Conseil de Cent, 391 – 08009 Barcelona
Tel. 934 88 34 92 – Fax 934 87 76 59E-mail: [email protected]
• Mundi-Prensa México, s.a. de C.V.Río Pánuco, 141 – Col. Cuauhtémoc
06500 México, D.F.Tel. 00 525 55 533 56 58 – Fax 56 58 00 525E-mail: [email protected]
TheoriginaleditionofthisworkwaspublishedinSpanishunderthetitle:ELCULTIVODELOLIVO–5aediciónPorEdicionesMundi-Prensa,Castelló,37–28001Madrid–www.mundiprensa.com©2007,EdicionesMundi-Prensa
© 2010, RIRDC/AOA Publication No. 09/067 ISBN: 1 74151 869 5
© 1996, D. Barranco; R. Fernández-Escobar; L. Rallo Depto. de Agronomía. ETSIAM. Apdo. 3048, 14080 CORDOBA D. Barranco: Phone: +34 957 21 8499 – Fax: +34 957 218569 – E-mail: [email protected] R. Fernández-Escobar: Phone: +34 957 218498 – Fax: +34 957 218569 – E-mail: [email protected] L. Rallo: Phone: +34 957 212198 – Fax: +34 957 218569 – E-mail: [email protected] © Texts and Photographs by the authors© 1996, Junta de Andalucía, Consejería de Agricultura y Pesca.© 1996, Ediciones Mundi-Prensa Duty copy: M. 19,071-2004 ISBN: 84-8474-128-1 (Junta de Andalucía) ISBN: 84-8476-190-8 (Mundi-Prensa)
1st edition: April 19972nd edition: November 19973rd edition: May 19994th edition: May 20015th edition: May 20041st English edition: September 2010
No part of this publication may be reproduced, stored in a retrieval system, or transmitted in any form or by any means electronic, mechanical, photocopying, recording or otherwise, without the prior written permission of the copyright holders.
Printed in Australia

ChaptertitleAuthor 5
PREFACE
This new English edition of OliveGrowingwas developed by the Rural Industries Research and Development Corporation and the Australian Olive Association in Australia as a translation and update of the fifth edition of the Spanish manual. It is intended as a definitive reference source for the Australian olive industry and will also be an asset for olive producers and processors in other English speaking countries.
The first four Spanish editions went out of print. Both the number of editions and the number of books sold since 1997 are unprecedented in Spanish agricul-tural literature. Furthermore, this has become one of the Spanish language publications most quoted in international scientific publications. It has now become a reference in the olive world.
Most of the authors have updated their chapters and, in some cases, enlarged upon the original text. This edition is an attempt to include new developments in knowledge that have occurred in the relevant chapters since the fourth edition. Here again, this is the result of an effort to maintain the currency of the book, and its usefulness for the readers.
This book gathers in 20 chapters the experience of a large number of scientists and experts from various public institutions. Their work published here is a compendium of substantive progress achieved in olive groves over the past 20 years.
Professionals from the olive farming and industry sectors, technical experts, students and the general public with an interest in olive groves, will find current information on relevant aspects of olive trees as oil producers, on how to control production, on the diversity of varieties used and their characteristics, on propaga-tion of this plant, on the establishment of new plantations, on how to manage the crop in order to maximise water and nutrient usage and to avoid the loss of non renewable natural resources, on how to protect the crop from pests, diseases and

6 OliveGrowing
competitors and how to harvest the olives. Finally, readers will find information on new methods for processing olive oil and table olives, and on the criteria defining olive oil quality for consumption and health.
We would like to thank these knowledgeable colleagues for their input. It is their contribution that has made this work possible. The information has been organised in a logical manner and avoiding unnecessary repetitions, while respecting the authors’ texts. Last but not least, we trust this book will be of interest to our readers. It has been edited in the hope that they will find it both useful and enjoyable.

8 OliveGrowing

8 OliveGrowing

Authors 9
AutHORS
María Paz AGUILERA HERRERABSc. in BiologyInstituto Andaluz de Investigación y Formación Agraria, Pesquera y Alimentaria Estación de Olivicultura «Venta del Llano». Mengíbar (Jaén)
José ALBA MENDOZAPhD in Chemical SciencesInstituto de la Grasa y sus Derivados CSIC. Seville
Manuel ALVARADO CORDOBES PhD in AgronomyServicio de Sanidad VegetalSeville
Diego BARRANCO NAVERO PhD in AgronomyDepartamento de Agronomía. ETSIAM. Universidad de Córdoba
Gabriel BELTRAN MAZAPhD Biological SciencesInstituto Andaluz de Investigación y Formación Agraria, Pesquera y Alimentaria Estación de Olivicultura «Venta del Llano». Mengíbar (Jaén)
Miguel Ángel BLANCO LOPEZ PhD in Plant PathologyDepartamento de Agronomía. ETSIAM. Universidad de Córdoba
Juan Manuel CABALLERO REIG PhD in AgronomyInstituto Andaluz de Investigación y Formación Agraria, Pesquera y Alimentaria CIFA «Alameda del Obispo». Córdoba
Manuel CANTOS BARRAGÁNPhD Biological SciencesInstituto de Recursos Naturales y Agrobiología CSIC. Seville

10 OliveGrowing
Luis CIVANTOS LOPEZ-VILLALTAPhD in AgronomyDirección Provincial del Ministerio de Agricultura, Pesca y Alimentación. Jaén
Manuel CIVANTOS LOPEZ-VILLALTA AgronomistDelegación de AgriculturaJaén
Julián CUEVAS GONZÁLEZ PhD in Biological SciencesDepartamento de Producción Vegetal Universidad de Almería
José Manuel DURAN ALVAROAgricultural Engineer Servicio de Sanidad Vegetal Seville
Elías FERERES CASTIELPhD in AgronomyDepartamento de Agronomía. ETSIAM. Universidad de Córdoba
Ricardo FERNÁNDEZ ESCOBAR PhD in AgronomyDepartamento de Agronomía. ETSIAM. Universidad de Córdoba
Ángel FERNÁNDEZ GARCIAAgricultural EngineerInstituto Andaluz de Investigación y Formación Agraria, Pesquera y Alimentaria Estación de Olivicultura «Venta del Llano». Mengíbar (Jaén)
José Enrique FERNÁNDEZ LUQUE PhD in AgronomyInstituto de Recursos Naturales y Agrobiología CSIC. Seville
Luisa FRIAS RUIZAgricultural EngineerInstituto Andaluz de Investigación y Formación Agraria, Pesquera y Alimentaria Estación de Olivicultura «Venta del Llano». Mengíbar (Jaén)
Carlos GARCÍA ALONSOPhD in AgronomyDepartamento de Gestión Empresarial y Métodos Cuantitativos. ETEA Universidad de Córdoba
Ángel GARCIA-ORTIZ RODRIGUEZAgronomistInstituto Andaluz de Investigación y Formación Agraria, Pesquera y Alimentaria Estación de Olivicultura «Venta del Llano». Mengíbar (Jaén)

Authors 11
Antonio GARRIDO FERNÁNDEZ PhD in Chemical SciencesInstituto de la Grasa y sus Derivados CSIC. Seville
Jesús GIL RIBESPhD in AgronomyDepartamento de Ingeniería Rural. ETSIAM. Universidad de Córdoba
Manuel HERMOSO FERNÁNDEZAgronomistInstituto Andaluz de Investigación y Formación Agraria, Pesquera y Alimentaria Estación de Olivicultura «Venta del Llano». Mengíbar (Jaén)
José HUMANES GUILLEN PhD in Agronomy Córdoba
Juana LIÑAN BENJUMEAAgricultural EngineerInstituto de Recursos Naturales y AgrobiologíaCSIC. Seville
Francisco Jesús LÓPEZ GIMENEZ PhD in AgronomyDepartamento de Ingeniería Rural. ETSIAM. Universidad de Córdoba
Mariano MAÑAS ALMENDROSPhD in Biological SciencesInstituto de Nutrición y Tecnología de Alimentos Universidad de Granada
José Manuel MARTIN LOZANOPhD in Economics and Business SciencesDepartamento de Gestión Empresarial y Métodos Cuantitativos. ETEA Universidad de Córdoba
Emilio MARTINEZ DE VICTORIA MUÑOZ PhD in Biological SciencesInstituto de Nutrición y Tecnología de Alimentos Universidad de Granada
Carlos NAVARRO GARCIAAgronomistInstituto Andaluz de Investigación y Formación Agraria, Pesquera y Alimentaria CIFA «Alameda del Obispo». Córdoba
Francisco ORGAZ ROSUA PhD in Agronomy Instituto de Agricultura Sostenible CSIC. Córdoba
Miguel Ángel PARRA RINCONPhD in Soil SciencesDepartamento de Ciencias y Recursos Agrícolas y Forestales. ETSIAM. Universidad de Córdoba

12 OliveGrowing
Miguel PASTOR MUÑOZ-COBOPhD in AgronomyInstituto Andaluz de Investigación y Formación Agraria, Pesquera y Alimentaria CIFA «Alameda del Obispo». Córdoba
Pedro Pablo PÉREZ HERNÁNDEZPhD in Economics and Business SciencesDepartamento de Economía General, Ciencias Jurídicas y Sociología. ETEA. Universidad de Córdoba
Luis RALLO ROMEROPhD in AgronomyDepartamento de Agronomía. ETSIAM. Universidad de Córdoba
Hava F. RAPOPORTPhD in Biological Sciences. Instituto de Agricultura Sostenible. CSIC. Córdoba
Luis REJANO NAVARROPhD in Chemical SciencesInstituto de la Grasa y sus Derivados CSIC. Seville
Carmen DEL RIO RINCONPhD in Biological SciencesInstituto Andaluz de Investigación y Formación Agraria, Pesquera y Alimentaria CIFA «Alameda del Obispo». Córdoba
Antonio TRAPERO CASASPhD in Plant PathologyDepartamento de Agronomía. ETSIAM. Universidad de Córdoba
Antonio TRONCOSO DE ARCEPhD in Chemical SciencesInstituto de Recursos Naturales y Agrobiología CSIC. Seville
Marino UCEDA OJEDAAgronomistInstituto Andaluz de Investigación y Formación Agraria, Pesquera y Alimentaria Estación de Olivicultura «Venta del Llano». Mengíbar (Jaén)

TableofContents 13
tABLE OF CONtENtS
Chapter 1: Olive growing in the world and in Spain, 15
Chapter 2: Botany and morphology, 33
Chapter 3: Varieties and rootstocks, 59
Chapter 4: Propagation methods, 83
Chapter 5: Fruiting and production, 113
Chapter 6: Ripening, 147
Chapter 7: Planting, 171
Chapter 8: Soil management systems, 211
Chapter 9: Fertilisation, 267
Chapter 10: Irrigation, 299
Chapter 11: Fertigation, 325
Chapter 12: Pruning, 349
Chapter 13: Mechanisation, 393
Chapter 14: Pests, 449
Chapter 15: diseases, 521
Chapter 16: Virgin olive oil production, 579
Chapter 17: Olive oil quality, 619
Chapter 18: Processing olives, 647
Chapter 19: Olive oil in human diet and health, 693
Chapter 20: the economics of olive oil, 713

14 OliveGrowing
OlivegrowingintheworldandinSpainL. Civantos 15
CHAPTER 1
OLIVE GROWING IN tHE WORLd ANd IN SPAIN
Luis CIVANTOS
16 OliveGrowing
tABLE OF CONtENtS
1. Geographic distribution of olive groves, 17 1.1. Olive trees in the world, 17 1.2. Olive trees in Spain, 17 1.3. Spain’s olive growing areas, 212. Olive oil, 23 2.1. Global overview, 23 2.2. Olive oil overview in the EU, 25 2.3. Spanish production, 263. Table olives, 28 3.1. Global overview, 28 3.2. Table olives in Spain, 304. Future prospects, 305. Bibliography, 31
OlivegrowingintheworldandinSpainL. Civantos 17
1. Geographic distribution of olive groves
Olive trees originated in an area extending from the southern Caucasus to the highlands of Iran, Palestine and the coastal area of Syria. Olive growing advanced via Cyprus towards Anatolia, and to Egypt through Crete, until it became established in all Mediterranean countries. From the fifteenth century, transoceanic voyages of Columbus, Magellan and Juan Sebastián Elcano helped olives reach and spread throughout the New World. Olives are currently grown also in South Africa, China, Japan and Australia.
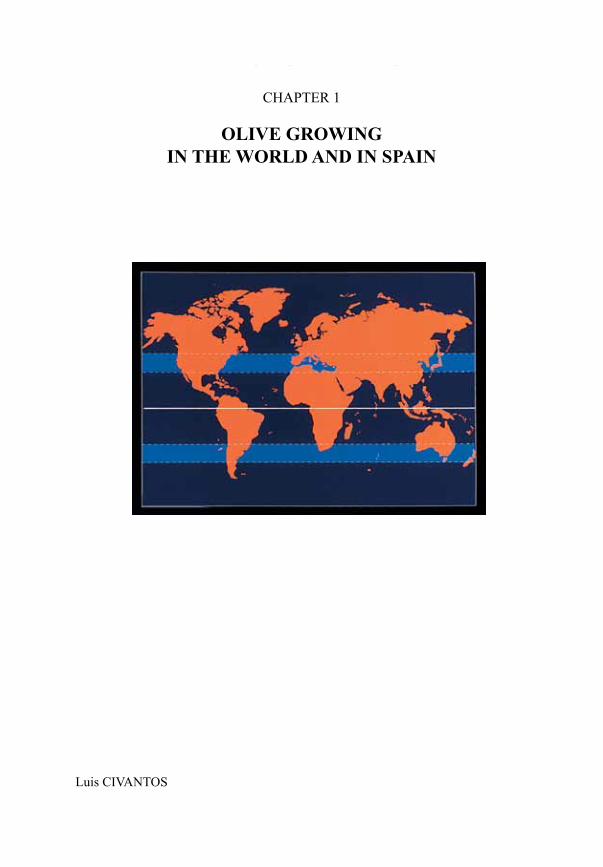
1.1. Olive trees in the worldThe habitat of the olive tree is centred around 30° and 45° latitude, both in the
northern and southern hemispheres; in Mediterranean climate regions characterised by dry and hot summers. In the southern hemisphere, olive groves are found in more tropical latitudes with altitude-modified climates.
Current olive groves are estimated at approximately 960 million olive trees, of which approximately 945 million—approximately 98% of the total—are found in the Mediterranean basin countries where they cover 9.5 million hectares. Table 1.1 shows the olive tree inventory for the main olive growing countries by continent (IOC, 2003; Oliarea and Olistat, 1998 and 1999).
Approximately 50 million olive trees are under irrigation, but dryland crops dominate.
Furthermore, the average annual production is 14 million tonnes of olives, of which 90% are used for oil production and 10% for table olives.
1.2. Olive trees in SpainIn Spain there are olive groves in almost every area of the country, making it
the world’s largest producer of olives. The only non-producing regions in Spain are the Autonomous Communities of Galicia, Asturias and Cantabria. The latest Ministry

18 OliveGrowing
of Agriculture statistics show that the area under olive groves in Spain has reached 2,405,837 hectares (MAPA, 2003), with the breakdown detailed in Table 1.2.
TABLE 1.1Geographicdistributionoftheoliveindustryintheworld
Country N.ofolivetrees(000) Area(hectares)
Algiers 16,700 168,000Angola 40 400Libya 8,000 197,000Morocco 58,000 550,000Egypt 4,500 47,000Tunisia 63,000 1,580,000South Africa 200 2,000Argentina 6,000 45,000Brazil 100 1,000Chile 560 6,000United States 1,750 14,500Mexico 1,000 12,500Peru 560 5,605Uruguay 316 1,000Afghanistan 1,000China 1,600 10,000Cyprus 2,500 9,500Iraq 750 10,000Iran 380 5,355Israel 2,500 20,000Jordan 10,000 100,000Lebanon 8,000 50,000Palestine 10,500 85,000Syria 54,500 480,000Turkey 68,000 595,000European Union: *Spain 308,700 2,424,000France 2,500 39,500Greece 120,000 1,026,000Italy 160,000 1,431,000Portugal 35,000 529,000Albania 5,500 45,000Malta 23 200Serbia and Montenegro 500 3,600Croatia 2,600 19,000Slovenia 150 1,000Australia 1,900 18,700New Zealand 230 2,300
Total World 957,559 9,534,160
Mediterranean Basin 942,343 9,415,555
Source: *Datos Olistat Oliarea (EC, 1998 and 1999)

OlivegrowingintheworldandinSpainL. Civantos 19
TABLE 1.2AreaunderolivetreesinSpain.Year2000
Purpose
Area(hectares)
Inproduction Notproducing Total Dryland Irrigated
Oil 2,087,974 143,576 2,231,550 1,944,913 231,999Table olives 164,713 9,574 174,287 134,918 24,659
Total 2,252,687 153,150 2,405,837 2,079,831 326,006
Source:Food and Agriculture Statistical Data Yearbook. Year 2003 (MAPA).
The purpose of the European Commission’s study was to determine the existing olive groves in the EU using a sampling system (Oliarea, 1999); the results showed an olive growing area of 2,423,841 hectares for Spain.
In 1964 olive groves were estimated at 2,360,000 hectares and in 1988 they had dropped to 2,087,000 hectares, with an annual decrease rate of 11,400 hectares. However, since 1988 there has been an upward trend at the rate of 26,500 hectares/year between 1988 and 2000 (Figure 1.1). The rate of new plantings has intensified over the last few years. Estimates based on the data published by the MAPA (2000) and obtained in the survey on the area under cultivation, indicate that in 2000 Spain had approximately 400,000 hectares of olive groves up to 12 years old (Civantos, 2000).
Figure 1.1. Spanish olive area and production.
Pro
duct
ion
(000
t)
Are
a (0
00 h
a)
Oil Production Table olive production Area
1.600
1.400
1.200
1.000
800
600
400
200
0
2.500
2.400
2.300
2.200
2.100
2.000
1.900
1.800
1.700
1.600
1.500
64/65
68/69
72/73
76/77
80/81
84/85
88/89
92/93
96/97
00/01
02/03
20 OliveGrowing
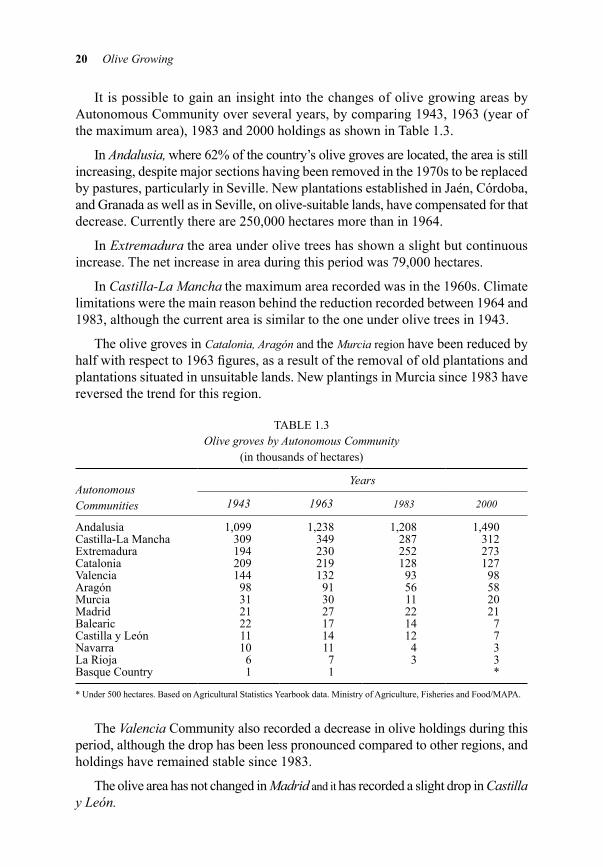
It is possible to gain an insight into the changes of olive growing areas by Autonomous Community over several years, by comparing 1943, 1963 (year of the maximum area), 1983 and 2000 holdings as shown in Table 1.3.
In Andalusia,where 62% of the country’s olive groves are located, the area is still increasing, despite major sections having been removed in the 1970s to be replaced by pastures, particularly in Seville. New plantations established in Jaén, Córdoba, and Granada as well as in Seville, on olive-suitable lands, have compensated for that decrease. Currently there are 250,000 hectares more than in 1964.
In Extremadurathe area under olive trees has shown a slight but continuous increase. The net increase in area during this period was 79,000 hectares.
In Castilla-LaManchathe maximum area recorded was in the 1960s. Climate limitations were the main reason behind the reduction recorded between 1964 and 1983, although the current area is similar to the one under olive trees in 1943.
The olive groves in Catalonia,Aragónand the Murciaregionhave been reduced by half with respect to 1963 figures, as a result of the removal of old plantations and plantations situated in unsuitable lands. New plantings in Murcia since 1983 have reversed the trend for this region.
TABLE 1.3OlivegrovesbyAutonomousCommunity
(in thousands of hectares)
AutonomousCommunities
Years
1943 1963 1983 2000
Andalusia 1,099 1,238 1,208 1,490Castilla-La Mancha 309 349 287 312Extremadura 194 230 252 273Catalonia 209 219 128 127Valencia 144 132 93 98Aragón 98 91 56 58Murcia 31 30 11 20Madrid 21 27 22 21Balearic 22 17 14 7Castilla y León 11 14 12 7Navarra 10 11 4 3La Rioja 6 7 3 3Basque Country 1 1 *
* Under 500 hectares. Based on Agricultural Statistics Yearbook data. Ministry of Agriculture, Fisheries and Food/MAPA.
The ValenciaCommunityalso recorded a decrease in olive holdings during this period, although the drop has been less pronounced compared to other regions, and holdings have remained stable since 1983.
The olive area has not changed in Madridandithas recorded a slight drop in CastillayLeón.
OlivegrowingintheworldandinSpainL. Civantos 21
The BalearicIslands,LaRioja,Navarraandthe BasqueCountryare devoting decreasing areas to olive groves.
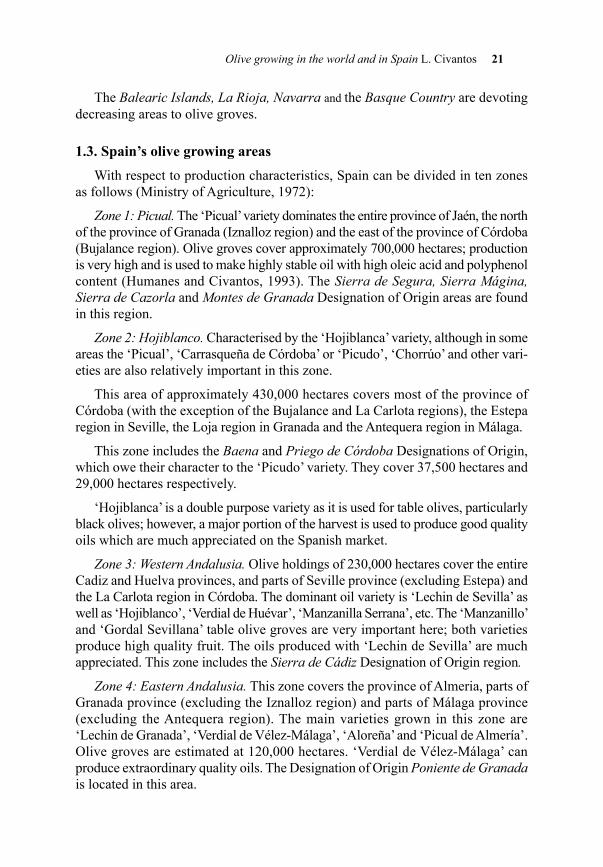
1.3. Spain’s olive growing areasWith respect to production characteristics, Spain can be divided in ten zones
as follows (Ministry of Agriculture, 1972):
Zone1:Picual.The ‘Picual’ variety dominates the entire province of Jaén, the north of the province of Granada (Iznalloz region) and the east of the province of Córdoba (Bujalance region). Olive groves cover approximately 700,000 hectares; production is very high and is used to make highly stable oil with high oleic acid and polyphenol content (Humanes and Civantos, 1993). The SierradeSegura,SierraMágina,SierradeCazorlaandMontesdeGranadaDesignation of Origin areas are found in this region.
Zone2:Hojiblanco.Characterised by the ‘Hojiblanca’ variety, although in some areas the ‘Picual’, ‘Carrasqueña de Córdoba’ or ‘Picudo’, ‘Chorrúo’ and other vari-eties are also relatively important in this zone.
This area of approximately 430,000 hectares covers most of the province of Córdoba (with the exception of the Bujalance and La Carlota regions), the Estepa region in Seville, the Loja region in Granada and the Antequera region in Málaga.
This zone includes the BaenaandPriegodeCórdobaDesignations of Origin,which owe their character to the ‘Picudo’ variety. They cover 37,500 hectares and 29,000 hectares respectively.
‘Hojiblanca’ is a double purpose variety as it is used for table olives, particularly black olives; however, a major portion of the harvest is used to produce good quality oils which are much appreciated on the Spanish market.
Zone3:WesternAndalusia.Olive holdings of 230,000 hectares cover the entire Cadiz and Huelva provinces, and parts of Seville province (excluding Estepa) and the La Carlota region in Córdoba. The dominant oil variety is ‘Lechin de Sevilla’ as well as ‘Hojiblanco’, ‘Verdial de Huévar’, ‘Manzanilla Serrana’, etc. The ‘Manzanillo’ and ‘Gordal Sevillana’ table olive groves are very important here; both varieties produce high quality fruit. The oils produced with ‘Lechin de Sevilla’ are much appreciated. This zone includes the SierradeCádizDesignation of Origin region.
Zone4:EasternAndalusia.This zone covers the province of Almeria, parts of Granada province (excluding the Iznalloz region) and parts of Málaga province (excluding the Antequera region). The main varieties grown in this zone are ‘Lechin de Granada’, ‘Verdial de Vélez-Málaga’, ‘Aloreña’ and ‘Picual de Almería’. Olive groves are estimated at 120,000 hectares. ‘Verdial de Vélez-Málaga’ can produce extraordinary quality oils. The Designation of Origin PonientedeGranadais located in this area.

22 OliveGrowing
Zone5:West.This includes the two provinces of Extremadura and the Avila, Salamanca and Zamora production areas. Here olive groves are situated at the head of the Tiétar Valley and on the banks of the Duero River, close to Portugal.
The main varieties in the 280,000 hectares of olive farms are ‘Manzanilla Cacereña’, ‘Manzanilla’ or ‘Carrasqueña de Badajoz’, ‘Morisca’, ‘Verdial de Badajoz’ and ‘Cornicabra’. The first two varieties are suitable for table olive production: ‘Cacereña’ is used for black olives while ‘Carrasqueña’ is used for green olives. SierrasdeGata-LasHurdesin Cáceres and AceitedeMonterrubioin Badajoz are Designations of Origin of this region.
Zone6:Centre.This includes 330,000 hectares of olive groves in the Autonomous Communities of Castilla-La Mancha and Madrid. The main variety in this zone is ‘Cornicabra’ as well as ‘Castellana’, ‘Alfafara’ and ‘Gordal de Hellín’. ‘Cornicabra’ produces highly prestigious oils that are in great demand in Catalonia and also in Italy. The Designation of Origin MontesdeToledois found in this zone.
Zone7:Levante.This zone covers the provinces of Murcia, Alicante and Javier, with olive groves on approximately 85,000 hectares. Here we find a large mosaic of varieties including ‘Blanqueta’, ‘Villalonga’, ‘Changlot Real’, ‘Lechin de Granada’, ‘Cornicabra’, and others.
Zone8:EbroValley.This zone includes Aragón, La Rioja, Navarra and Álava. The most widespread variety is ‘Empeltre’ while ‘Verdeña’, ‘Farga’, ‘Royal de Calatayud’ and others are also found, depending on the area. The olive holdings cover a decreasing area of 65,000 hectares. High quality oils are produced here, particularly those from Bajo Aragón, which are fruity early in the season and grow sweeter and more aromatic as the season advances. The BajoAragónDesignation of Origin is found in this region.
Zone9:Tortosa-Castellón.This zone consists of Bajo Ebro-Montsiá de Tarragona, and the province of Castellón, with approximately 85,000 hectares of ‘Farga’, ‘Morrut’, ‘Sevillenca’, ‘Empeltre’ and other varieties. Production here is used for oils which are of good quality provided fly attacks are controlled and fresh fruit are used with suitable techniques. The BaixEbre-MontsiáDesignation of Origin is found in this area.
Zone10:Arbequina.This zone covers Catalonia, excluding Bajo Ebro-Montsiá, and the Balearic Islands. Besides ‘Arbequina’—after which the region is named—, we also find ‘Verdiell’, ‘Empeltre’, ‘Argudell’ and other varieties. The olive groves cover approximately 80,000 hectares. The Designations of Origin LesGarrigues,Siuranaand TerraAltain Catalonia and AceitedeMallorcain the Balearic Islands, are found in this zone. They produce high quality oils which are fruity at the start of the season and sweet after the first frosts; these are in very high demand for direct consumption and also for blending with other olive oils.

OlivegrowingintheworldandinSpainL. Civantos 23
2. Olive oil
2.1. Global overview Figure 1.2 shows world olive oil production for the years between 1977/78 and
2001/02 (IOC, 2003). The highest and lowest productions were recorded in 2001/02 and 1981/82 with 2.8 million tonnes and 1.3 million tonnes respectively. The world production is growing at an annual rate of 46,800 tonnes. This trend has led to estimates of a mean production figure of 2.5 million tonnes for 2006/07.
Consumption variations (IOC, 2003) are lower than production variations, and range between 1.5 million tonnes in 1979/80 and 2.6 million tonnes in 2001/02. Consumption is growing at a rate of 45,500 tonnes/year; this trend would take mean consumption figures for 2007 to 2.48 million tonnes. It is interesting to note that production and consumption are balanced: each important increase in mean production leads to a similar increase in consumption.
Figure 1.2. World olive oil production and consumption.
Table 1.4 shows production and consumption for the main olive producing coun-tries, for harvesting seasons between 1981/82 and 2001/02, using mean annual figures for those periods. It also shows trade between the 1991/92 and 2001/02 harvests, using mean annual figures for those periods (IOC, 2003). The European Union is the top producer (78%), consumer (71%) and exporter (58%).
The international olive oil trade is dominated by the European Union which is the largest exporter; it also imports most of the oil that Tunisia, the second exporter (24%), exports to the world.
77/78
81/82
85/86
89/90
93/94
97/98
01/02
3.000
2.800
2.600
2.400
2.200
2.000
1.800
1.600
1.400
1.200
1.000
Harvests
‘000
tonn
es
Production Consumption

24 OliveGrowing
TABLE 1.4WorldOliveOilOverview
(mean annual figures in thousands of tonnes)
CountriesMeanannualproduction Meanannualconsumption
1981/85 1986/90 1991/95 1996/01 1981/85 1986/90 1991/95 1996/01
EU 1,288 1,275 1,450 1,977 1,259 1,306 1,406 1,739Tunisia 99 116 153 159 51 46 51 53Turkey 81 76 73 120 70 52 54 72Syria 51 62 72 108 59 58 72 92Morocco 27 41 42 63 27 36 41 53Algiers 14 12 31 34 14 14 27 36Jordan 8 9 12 18 10 11 16 18Libya 9 7 7 7 51 40 l0 10Argentina 8 9 9 9 3 4 4 7USA 1 1 2 1 34 69 103 163Other countries 25 40 33 25 84 117 144 201Total world 1,611 1,648 1,884 2,521 1,662 1,753 1,928 2,444
CountriesMeanannualexports Meanannualimports
1991/95 1996/01 1991/95 1996/01
EU *173 *262 *128 *129Tunisia 103 106 0 0Turkey 20 50 0 0Syria 3 5 0 0Morocco 4 10 2 2Algiers 0 0 0 0Jordan 1 1 6 1Libya 0 0 3 3Argentina 5 6 0 4USA 6 5 107 168
Other countries 6 5 110 167
Total world 321 450 356 474
*Onlynon-Community.
The main producing countries, including the European Union Member States, are:Spain 39% Syria 4%Italy 22% Morocco 2%Greece 16% Portugal 2%Tunisia 6% Algiers 1%Turkey 5% Jordan 1%
The main consumer countries, including the European Union Member States, are:Italy 29% France 3%Spain 22% Turkey 3%Greece 10% Portugal 3%United States 7% Tunisia 2%Syria 4% Morocco 2%

OlivegrowingintheworldandinSpainL. Civantos 25
The main importer is the USA, with 35% of the total volume of imports.
2.2. Olive oil overview in the EuAs indicated above, since early 1986, with the entry of Spain and Portugal, the
EU has dominated the world olive oil sector. In view of the importance of this fact, it is timely to compare the evolution of the olive industry in the European Union Member States between the period prior to 1986 and later years.
Table 1.5 compares the mean annual production and mean annual consumption of olive oil for the 1981/82 to 1985/86, 1986/87 to 1990/91, 1991/92 to 1995/96 and 1996/97 to 2001/02 harvests. Mean production ranges from 1.29 to 1.98 million tonnes. Spain took over from Italy as the largest producer after the first period. Other than that, the situation did not change for the rest of the countries. The mean annual consumption increased from 1.26 to 1.74 million tonnes. The figures for each country did not vary, with the exception of Spain, where consumption increased considerably after joining the EU. Also noteworthy are the proportional increases recorded in France and in non-EU Member States.
TABLE 1.5MeanoliveoilproductionandconsumptionintheEU
(mean annual figures in thousands of tonnes)
MemberStates
AnnualProduction AnnualConsumption
1981/85 1986/90 1991/95 1996/01 1981/85 1986/90 1991/95 1996/01
Germany 0 0 0 0 4 7 13 30France 2 2 3 3 25 27 42 80Italy 528 425 528 549 630 629 658 709United Kingdom 0 0 0 0 2 6 14 30Greece 256 253 418 408 202 206 207 255Spain 466 563 892 978 357 395 407 544Portugal 37 32 39 39 37 34 54 64Others 0 0 0 0 2 3 10 27
Total EU 1,289 1,275 1,450 1,977 1,259 1,307 1,406 1,739
European Union Member States’ mean exports of olive oil during 1986/87 to 1990/91, 1991/92 to 1995/96 and 1996/97 to 2001/02 are shown in Table 1.6. Of note among the internal trade figures are the exports from Spain and Greece, to Italy and France, mainly of bulk oils. Exports to other economic areas are basically oils packed under a brand name (90% of exports); Riviera type oils (refined olive oil blended with virgin olive oil) dominate this market. Italy exports a higher proportion of virgin olive oil than Spain.

26 OliveGrowing
TABLE 1.6EUProducerCountryOliveOilExports
(mean annual figures in thousands of tonnes)
MemberStates
1986/90 1991/95 1996/01
AllNon-
Community AllNon-
Community AllNon-
Community
Spain 240 47 191 55 *238 83Italy 94 68 145 96 *185 153Greece 77 6 130 10 *116 8France 11 1 14 1 *21 1Portugal 12 6 11 10 *5 16Remainder 28 1 4 1 *1 0Total EU 461 128 494 173 *756 261
*1996and1997
2.3. Spanish productionSpain is the main olive oil producer and only Italy has overtaken it, producing
more olive oil for short periods of time. Figure 1.1 shows olive oil production from 1964/65 to 2002/03. At the beginning of this chapter we referred to the decrease in olive grove area, particularly between 1964 and 1988. Despite this, production has continued to increase over the entire period, with peak production reaching 1,413,500 tonnes in 2000/01 and the lowest production being recorded in 1964 with 110,000 tonnes. Mean annual production trends for a five-year period ranged from 370,000 tonnes at the beginning of the period to 940,000 tonnes in 2002–03. Production increased at a rate of 24,700 tonnes each year, between 1981 and 2003.
The contrast between decreasing areas until 1984 and increasing production shows that Spanish olive holdings have undergone a renewal leading to increased productivity. Old plantings and other groves that were located in unsuitable lands—either because of the soil types or because of climate limitations—were pulled out in the 1960s and 1970s, and were replaced by more suitable or profitable crops for those sites and times. Simultaneously, the Spanish Government set up an Olive Grove Reconversion and Production Restructuring Plan (MAPA, 1988), to encourage activities to improve or increase specialised olive grove productivity. Alternatives were sought for unproductive olive groves in an effort to increase profitability by associating them with other compatible crops or by streamlining crop operations to reduce costs. In areas more suited to olives, high density plantings were encour-aged with a view to intensive olive growing.
This led to a decrease in the number of olive groves in less suitable regions, and to increased plantings and even higher yields in areas with a greater suitability for growing olives.
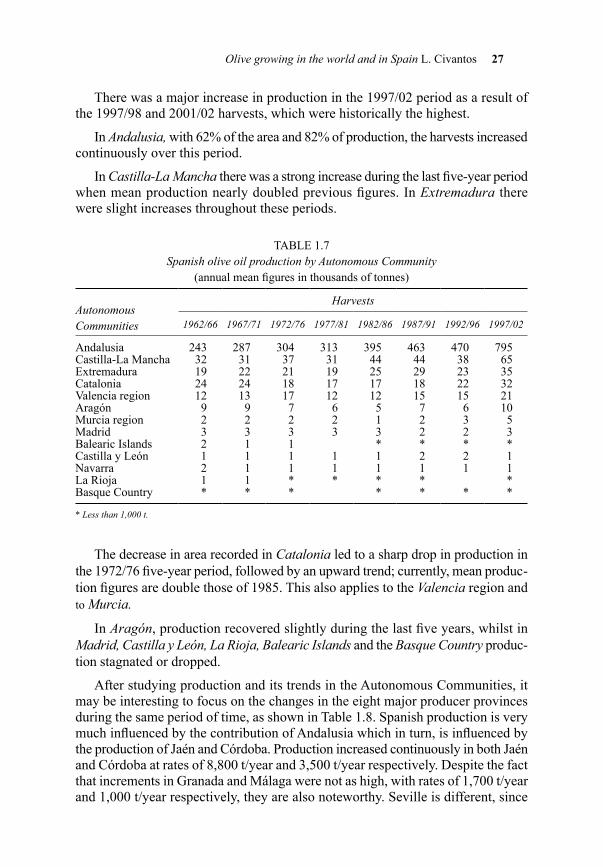
This is confirmed by the changes in olive oil production in the various Autonomous Communities; Table 1.7 shows mean annual production figures for the periods between 1962/63 and 2002/03 (MAPA, 1962 to 2003).
OlivegrowingintheworldandinSpainL. Civantos 27
There was a major increase in production in the 1997/02 period as a result of the 1997/98 and 2001/02 harvests, which were historically the highest.
In Andalusia,with 62% of the area and 82% of production, the harvests increased continuously over this period.
In Castilla-LaManchathere was a strong increase during the last five-year period when mean production nearly doubled previous figures. In Extremadurathere were slight increases throughout these periods.
TABLE 1.7SpanisholiveoilproductionbyAutonomousCommunity
(annual mean figures in thousands of tonnes)
AutonomousCommunities
Harvests
1962/66 1967/71 1972/76 1977/81 1982/86 1987/91 1992/96 1997/02
Andalusia 243 287 304 313 395 463 470 795Castilla-La Mancha 32 31 37 31 44 44 38 65Extremadura 19 22 21 19 25 29 23 35Catalonia 24 24 18 17 17 18 22 32Valencia region 12 13 17 12 12 15 15 21Aragón 9 9 7 6 5 7 6 10Murcia region 2 2 2 2 1 2 3 5Madrid 3 3 3 3 3 2 2 3Balearic Islands 2 1 1 * * * *Castilla y León 1 1 1 1 1 2 2 1Navarra 2 1 1 1 1 1 1 1La Rioja 1 1 * * * * *Basque Country * * * * * * *
*Lessthan1,000t.
The decrease in area recorded in Catalonialed to a sharp drop in production in the 1972/76 five-year period, followed by an upward trend; currently, mean produc-tion figures are double those of 1985. This also applies to the Valenciaregion and toMurcia.
In Aragón,production recovered slightly during the last five years, whilst in Madrid,CastillayLeón,LaRioja,BalearicIslandsand the BasqueCountryproduc-tion stagnated or dropped.
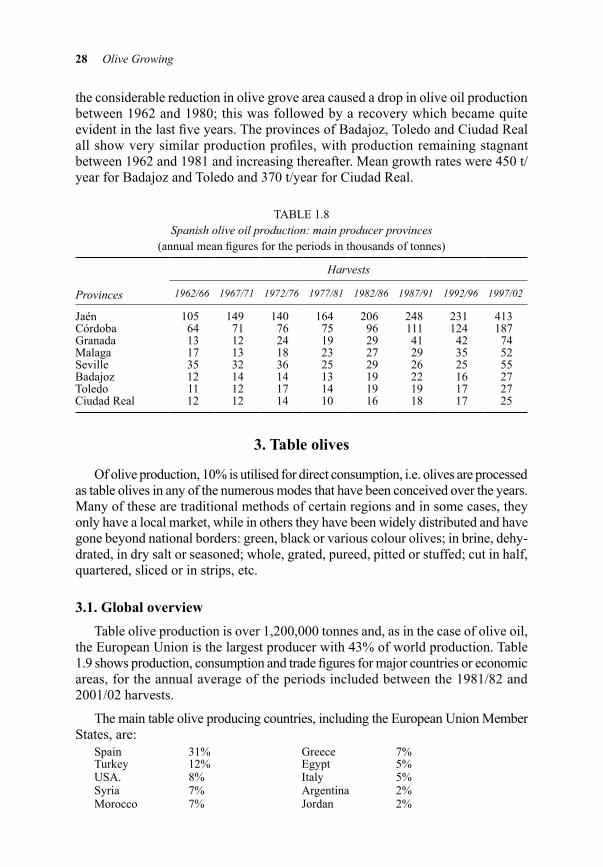
After studying production and its trends in the Autonomous Communities, it may be interesting to focus on the changes in the eight major producer provinces during the same period of time, as shown in Table 1.8. Spanish production is very much influenced by the contribution of Andalusia which in turn, is influenced by the production of Jaén and Córdoba. Production increased continuously in both Jaén and Córdoba at rates of 8,800 t/year and 3,500 t/year respectively. Despite the fact that increments in Granada and Málaga were not as high, with rates of 1,700 t/year and 1,000 t/year respectively, they are also noteworthy. Seville is different, since
28 OliveGrowing
the considerable reduction in olive grove area caused a drop in olive oil production between 1962 and 1980; this was followed by a recovery which became quite evident in the last five years. The provinces of Badajoz, Toledo and Ciudad Real all show very similar production profiles, with production remaining stagnant between 1962 and 1981 and increasing thereafter. Mean growth rates were 450 t/year for Badajoz and Toledo and 370 t/year for Ciudad Real.
TABLE 1.8Spanisholiveoilproduction:mainproducerprovinces
(annual mean figures for the periods in thousands of tonnes)
Provinces
Harvests
1962/66 1967/71 1972/76 1977/81 1982/86 1987/91 1992/96 1997/02
Jaén 105 149 140 164 206 248 231 413Córdoba 64 71 76 75 96 111 124 187Granada 13 12 24 19 29 41 42 74Malaga 17 13 18 23 27 29 35 52Seville 35 32 36 25 29 26 25 55Badajoz 12 14 14 13 19 22 16 27Toledo 11 12 17 14 19 19 17 27Ciudad Real 12 12 14 10 16 18 17 25
3. table olives
Of olive production, 10% is utilised for direct consumption, i.e. olives are processed as table olives in any of the numerous modes that have been conceived over the years. Many of these are traditional methods of certain regions and in some cases, they only have a local market, while in others they have been widely distributed and have gone beyond national borders: green, black or various colour olives; in brine, dehy-drated, in dry salt or seasoned; whole, grated, pureed, pitted or stuffed; cut in half, quartered, sliced or in strips, etc.
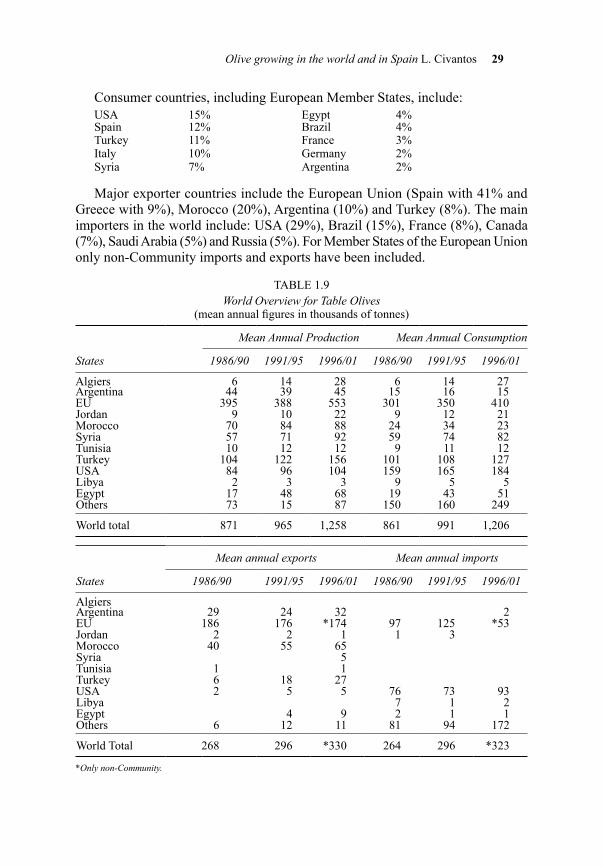
3.1. Global overview Table olive production is over 1,200,000 tonnes and, as in the case of olive oil,
the European Union is the largest producer with 43% of world production. Table 1.9 shows production, consumption and trade figures for major countries or economic areas, for the annual average of the periods included between the 1981/82 and 2001/02 harvests.
The main table olive producing countries, including the European Union Member States, are:
Spain 31% Greece 7%Turkey 12% Egypt 5%USA. 8% Italy 5%Syria 7% Argentina 2%Morocco 7% Jordan 2%
OlivegrowingintheworldandinSpainL. Civantos 29
Consumer countries, including European Member States, include:USA 15% Egypt 4%Spain 12% Brazil 4%Turkey 11% France 3%Italy 10% Germany 2%Syria 7% Argentina 2%
Major exporter countries include the European Union (Spain with 41% and Greece with 9%), Morocco (20%), Argentina (10%) and Turkey (8%). The main importers in the world include: USA (29%), Brazil (15%), France (8%), Canada (7%), Saudi Arabia (5%) and Russia (5%). For Member States of the European Union only non-Community imports and exports have been included.
TABLE 1.9WorldOverviewforTableOlives
(mean annual figures in thousands of tonnes)
States
MeanAnnualProduction MeanAnnualConsumption
1986/90 1991/95 1996/01 1986/90 1991/95 1996/01
Algiers 6 14 28 6 14 27Argentina 44 39 45 15 16 15EU 395 388 553 301 350 410Jordan 9 10 22 9 12 21Morocco 70 84 88 24 34 23Syria 57 71 92 59 74 82Tunisia 10 12 12 9 11 12Turkey 104 122 156 101 108 127USA 84 96 104 159 165 184Libya 2 3 3 9 5 5Egypt 17 48 68 19 43 51Others 73 15 87 150 160 249
World total 871 965 1,258 861 991 1,206
States
Meanannualexports Meanannualimports
1986/90 1991/95 1996/01 1986/90 1991/95 1996/01
AlgiersArgentina 29 24 32 2EU 186 176 *174 97 125 *53Jordan 2 2 1 1 3Morocco 40 55 65Syria 5Tunisia 1 1Turkey 6 18 27USA 2 5 5 76 73 93Libya 7 1 2Egypt 4 9 2 1 1Others 6 12 11 81 94 172
World Total 268 296 *330 264 296 *323
*Onlynon-Community.

30 OliveGrowing
3.2. table olives in SpainSpanish production of table olives between the 1964/65 and 2002/03 harvesting
seasons ranged from 25,500 tonnes in 1964/65 to 575,000 tonnes in 2001/02. In the early 1980s, the mean annual production was 150,000 tonnes, but at present this has increased to 420,000 tonnes. Figure 1.1 shows Spanish table olive harvests.
The main producing areas are Andalusia (Seville, Córdoba, Malaga and Huelva) with 79% of the country’s production, and Extremadura (Badajoz and Cáceres) with 20%. Commercially, the more traditional processing method used in Spain—and the one requiring the largest quantities of olives—is what is known as the Sevillianstyle; there are also numerous other specialty preparations which are typical of each region. In the 1970s, and because of the demand from Eastern European countries, blackolivesinbrinewere prepared, which were later practically replaced by Californianoxidatedblackstyleolives.Currently, 75% of the Spanish produc-tion is used for green olives, 20% forCalifornianblackstyleolives,and the balance 5% for naturalblackolivesinbrineor inaceticacid, andfor various local styles (Garrido, 1994).
Spanish table olive exports (within and outside the European Community) have strengthened: they grew from 122,000 tonnes in 1983/88 to 132,000 tonnes in the next five-year period and then to 138,000 tonnes in 1994 to 1996. Current exports have reached 244,000 tonnes, and they are exported to over 100 countries; in total, 168,000 tonnes leave the EU.
4. Future prospects
Global olive-growing area has increased slowly but constantly over the second half of the twentieth century and early twenty-first century. This crop has a very long cycle; onset of production takes time, and so does achieving peak production, while production drop is also a long process. In certain countries the expansion of olive culture has been encouraged, such as in Algiers, Tunisia and Morocco in the 1970s or more recently in Syria and Argentina. In the European Union, new plantings have been established in Spain, Greece and more recently in Portugal through a develop-ment scheme for this crop (1998). Production increases are due more to improvements in horticultural practices than to an expansion in the olive growing area.
As shown in Figure 1.2, production and consumption trends are keeping a remarkable balance at around 2.5 million tonnes, for early twenty-first century figures. Production is not very flexible, so it is not easy to expand in the short term; this has put a stop to export expansion policies. As a result, a slight harvest surplus has led to a campaign to encourage further consumption and greater access to new olive oil markets.

OlivegrowingintheworldandinSpainL. Civantos 31
A group of producer countries, including Algiers, Israel and Lebanon, tailors domestic consumption to the volume of the harvest; Jordan, Syria and Morocco also follow this policy to some extent. Resulting production increases translate into an increase of their own consumption that is potentially higher, but domestic economic conditions limit consumption increases.
Another group of producer countries consumes part of its production, and exports the balance. Consumption capacity is greater but the economy does not encourage the purchase of a product which is more expensive than its competitors. Tunisia is the typical example of this; its olive oil exports have a strong impact on its balance of trade. Higher standards of living in these countries should lead to an increased consumption of olive oil.
In European Union Member States producers, consumption of olive oil increased considerably over the 1980s and this tendency is still ongoing. Spain’s consumption has improved quite noticeably since its entry into the EU, with a yearly average of 544,000 tonnes for the 1996/97 to 2001/02 harvests.
Consumption is increasing year after year in non-producer Member States that traditionally consume little olive oil. This is a similar situation to that of the United States, Canada and Japan. Due to higher income levels and a greater concern for the impact of diet on health and life expectancy, the population is sensitive to information campaigns on a diet based on healthy foods. As a result, olive oil has been promoted as a natural product extracted from olives by mechanical means, and which is beneficial for the digestive system and particularly for the prevention of cardiovascular diseases. Thus, consumption in the United States has gone from 25,000 tonnes twenty-five years ago to an expected 200,000 tonnes for 2002/03, and continental Europe markets might respond in a similar fashion.
There is also a balance between world production and consumption of table olives. When there is a bumper crop of varieties suitable for table olives, part of the crop is used to produce olive oil thus applying a natural surplus regulation process; this, however, does not entail an overload of the olive oil market.
5. Bibliography
Civantos, L. (1995). Evolución de las superficies de olivar y de las producciones de aceite de oliva en España. Olivae,59:18–21.
Civantos, L. (1998). Aceite de oliva y Aceituna: Situación del mercado mundial. Últimos avances. Calidades y preferencias de los mercados. Denominaciones de origen controlado. GrasasyAceites,49(Part 2): 222–246.
Civantos, L. (1998). ElOlivo,elAceite,laAceituna.International Olive Council. 2nd. edition. Madrid. 130 pp.

32 OliveGrowing
Civantos, L. (1999). ObtencióndelAceitedeOlivaVirgen.Editorial Agrícola Española. revised and expanded edition. Madrid. 356 pp.
Civantos, L. (2000). ProduccióndeAceitedeOliva.Curso en la Universidad Internacional de Andalucía Antonio Machado, Baeza.
Civantos, L. (2001). ElCultivodelOlivo.Capítulo I, La olivicultura en el mundo y en España. Editorial Mundi-Prensa. Madrid.
International Olive Council. (2000). Evoluciónrecientedelmercadodelosproductosoleí-colas.Madrid.
International Olive Council. (2003). SeriesEstadísticasdelAceitedeOlivaydelaAceitunadeMesa.Madrid.
Garrido, A. 1994. Aceitunas de mesa en España. Una perspectiva actual. Olivae, 50: 21–27.Humanes, J.; Civantos, M. (1993). ProduccióndeAceitedeOlivadecalidad.Influenciadel
cultivo.Junta de Andalucía. Seville. 101 pp. Ministry of Agriculture. (1972). ElOlivarEspañol.Madrid. 136 pp.Ministry of Agriculture, Fisheries and Food. (1988). ElOlivarEspañol.PlanesdeReestructuración
yReconversión.Madrid. 84 pp.Ministry of Agriculture, Fisheries and Food. 1962to2003.AnuariosdeEstadísticasAgroalimentarias.
Madrid. Ministry of Agriculture, Fisheries and Food. 1992to2000. Encuestasobresuperficiesy
rendimientosdeloscultivos.Boletín Mensual de Estadística Agraria. Madrid. Ministry of Agriculture, Fisheries and Food. 1997to2003. Boletín Mensual de Estadística
Agraria. Madrid.

2 OliveGrowing
OLIVE GROWING
OLIVE GROWING
Olive Growing is a technical manual for all those involved in the olive growing sector, i.e. growers, processors, technical experts, students and, in general, all those with an interest in growing this ancient plant.The scientific editors have designed this book as a collection of works, involving scientists and technical experts intricately linked to the crop, as well as experts in the subject matter of their assigned chapter. The aim was for them to present in a simple and clear manner, all aspects pertaining to their subject, combining the breakthroughs of the last 25 years with practical suggestions and recommendations that would help readers plant and grow an olive grove successfully, enabling them to obtain quality products in the light of current knowhow and future estimates.The scientific editors’ goal has been fully achieved, if we are to judge from the swift sale of the first four Spanish editions, now out of print, an exceptional feat for an agricultural book. To date, no other text on Spanish agriculture has been distributed so widely in such a short time.This new English edition of Olive Growing was developed by the Rural Industries Research and Development Corporation and the Australian Olive Association in Australia as a translation and update of the fifth edition of the Spanish manual. It is intended as a definitive reference source for the Australian olive industry and will also be an asset for olive producers and processors in other English speaking countries.
EDITION
5th
SCIENTIFIC EDITORSD. BARRANCOR. FERNÁNDEZ-ESCOBARL. RALLO
SCIENTIFIC EDITORSD. BARRANCOR. FERNÁNDEZ-ESCOBARL. RALLO
SCIENTIFIC EDITORSD. BARRANCO
R. FERNÁNDEZ-ESCOBARL. RALLO
CO-EDITEDCO-EDITED
[1st ENGLISH EDITION]
ISBN: 84-8474-128-1 (Junta de Andalucía) ISBN: 84-8476-190-8 (Mundi-Prensa) ISBN: 1 74151 869 5 (RIRDC and AOA) Publication No. 09/067
www.mundiprensa.com
CO-EDITED MUNDI-PRENSA
JUNTA DE ANDALUCÍA
www.rirdc.gov.au
www.rirdc.gov.au