2 overview of the radiati on survey and … · introduced here are discussed in detail throughout...
TRANSCRIPT

2 OVERVIEW OF THE RADIATI ON SURVEY AND SITE INVESTIGATION PROCESS
2.1 Introduction
This chapter provides a brief overview of the Radiation Survey and Site Investigation (RSSI) Process, several important aspects of this Process, and its underlying principles. The concepts introduced here are discussed in detail throughout the manual.
The purpose of MARSSIM is to provide a standardized approach to demonstrating compliance with a dose- or risk-based regulation. Since most of the manual is based on general technical and statistical concepts, much of the guidance can still be applied to other types of regulations or standards. The purpose of this chapter is to provide the overview information required to understand the rest of this manual.
Section 2.2 introduces and defines key terms used throughout the manual. Some of these terms may be familiar to the MARSSIM user, while others are new terms developed specifically for this manual.
Section 2.3 describes the flow of information used to decide whether or not a site or facility complies with a regulation. The section describes the framework that is used to demonstrate compliance with a regulation, and is the basis for all guidance presented in this manual. The decision-making process is broken down into four phases: 1) planning, 2) implementation, 3) assessment, and 4) decision making.
Section 2.4 introduces the Radiation Survey and Site Investigation Process, which can be used for compliance demonstration at many sites. The section describes a series of surveys that combine to form the core of this process. Each survey has specified goals and objectives to support a final decision on whether or not a site or facility complies with the appropriate regulations. Flow diagrams showing how the different surveys support the overall process are provided, along with descriptions of the information provided by each type of survey.
Section 2.5 presents major considerations that relate to the decision-making and survey-design processes. This section, as well as the examples discussed in detail throughout the manual, focuses on residual radioactive contamination in surface soils and on building surfaces. Recommended survey designs for demonstrating compliance are presented along with the rationale for selecting these designs.
Section 2.6 recognizes that the methods presented in MARSSIM may not represent the optimal survey design at all sites. Some alternate methods for applying the Radiation Survey and Site Investigation process are discussed. Different methods for demonstrating compliance that are technically defensible may be developed with the approval of the responsible regulatory agency.
August 2000 2-1 MARSSIM, Revision 1

Overview of the Radiation Survey and Site Investigation Process
MARSSIM provides an approach that is technically defensible and flexible enough to be applied to a variety of site-specific conditions. Applying this guidance to a dose- or risk-based regulation provides a consistent approach to protecting human health and the environment. The manual’s performance-based approach to decision making provides the flexibility needed to address compliance demonstration at individual sites.
2.2 Understanding Key MARSSIM Terminology
The first step in understanding the Radiation Survey and Site Investigation (RSSI) Process is accomplished by understanding the scope of this manual, the terminology, and the concepts set forth. Some of the terms used in MARSSIM were developed for the purposes of this manual, while other commonly used terms are also adopted for use in MARSSIM. This section explains some of the terms roughly in the order of their presentation in the manual.
The process described in MARSSIM begins with the premise that a release criterion has already been provided in terms of a measurement quantity. The methods presented in MARSSIM are generally applicable and are not dependent on the value of the release criterion.
A release criterion is a regulatory limit expressed in terms of dose (mSv/y or mrem/y) or risk (cancer incidence or cancer mortality). The terms release limit or cleanup standard are also used to describe this term. A release criterion is typically based on the total effective dose equivalent (TEDE), the committed effective dose equivalent (CEDE), risk of cancer incidence (morbidity), or risk of cancer death (mortality) and generally cannot be measured directly. Exposure pathway modeling is used to calculate a radionuclide-specific predicted concentration or surface area concentration of specific nuclides that could result in a dose (TEDE or CEDE) or specific risk equal to the release criterion. In this manual, such a concentration is termed the derived concentration guideline level (DCGL). Exposure pathway modeling is an analysis of various exposure pathways and scenarios used to convert dose or risk into concentration. In many cases DCGLs can be obtained from responsible regulatory agency guidance based on default modeling input parameters, while other users may elect to take into account site-specific parameters to determine DCGLs. In general, the units for the DCGL are the same as the units for measurements performed to demonstrate compliance (e.g., Bq/kg or pCi/g, Bq/m2 or dpm/100 cm2). This allows direct comparisons between the survey results and the DCGL. A discussion of the uncertainty associated with using DCGLs to demonstrate compliance is included in Appendix D, Section D.6.
An investigation level is a radionuclide-specific level based on the release criterion that, if exceeded, triggers some response such as further investigation or remediation. An investigation level may be used early in decommissioning to identify areas requiring further investigation, and may also be used as a screening tool during compliance demonstration to identify potential problem areas. A DCGL is an example of a specific investigation level.
MARSSIM, Revision 1 2-2 August 2000

Overview of the Radiation Survey and Site Investigation Process
While the derivation of DCGLs is outside the scope of MARSSIM, it is important to understand the assumptions that underlie this derivation. The derivation assumptions must be consistent with those used for planning a compliance demonstration survey. One of the most important assumptions used for converting a dose or risk limit into a media-specific concentration is the modeled area of contamination. Other considerations include sample depth, composition, modeling parameters, and exposure scenarios. MARSSIM defines two potential DCGLs based on the area of contamination.
! If the residual radioactivity is evenly distributed over a large area, MARSSIM looks at the average activity over the entire area. The DCGLW
1 (the DCGL used for the statistical tests, see Section 2.5.1.2) is derived based on an average concentration over a large area.
! If the residual radioactivity appears as small areas of elevated activity2 within a larger area, typically smaller than the area between measurement locations, MARSSIM considers the results of individual measurements. The DCGLEMC (the DCGL used for the elevated measurement comparison (EMC), see Section 2.5.3 and Section 2.5.4) is derived separately for these small areas and generally from different exposure assumptions than those used for larger areas.
A site is any installation, facility, or discrete, physically separate parcel of land, or any building or structure or portion thereof, that is being considered for survey and investigation.
Area is a very general term that refers to any portion of a site, up to and including the entire site.
Decommissioning is the process of safely removing a site from service, reducing residual radioactivity through remediation to a level that permits release of the property, and termination of the license or other authorization for site operation. Although only part of the process, the term decommissioning is used in this sense for the Radiation Survey and Site Investigation (RSSI) Process, and is used this way throughout MARSSIM.
1 The “W” in DCGLW stands for Wilcoxon Rank Sum test, which is the statistical test recommended in MARSSIM for demonstrating compliance when the contaminant is present in background. The Sign test recommended for demonstrating compliance when the contaminant is not present in background also uses the DCGLW.
2 A small area of elevated activity, or maximum point estimate of contamination, might also be referred to as a “hot spot.” This term has been purposefully omitted from MARSSIM because the term often has different meanings based on operational or local program concerns. As a result, there may be problems associated with defining the term and reeducating MARSSIM users in the proper use of the term. Because these implications are inconsistent with MARSSIM concepts, the term is not used.
August 2000 2-3 MARSSIM, Revision 1

Overview of the Radiation Survey and Site Investigation Process
A survey unit is a physical area consisting of structure or land areas of specified size and shape for which a separate decision will be made as to whether or not that area exceeds the release criterion. This decision is made as a result of the final status survey—the survey in the RSSI Process used to demonstrate compliance with the regulation or standard. The size and shape of the survey unit are based on factors, such as the potential for contamination, the expected distribution of contamination, and any physical boundaries (e.g., buildings, fences, soil type, surface water body) at the site.
For MARSSIM, measurement is used interchangeably to mean: 1) the act of using a detector to determine the level or quantity of radioactivity on a surface or in a sample of material removed from a media being evaluated, or 2) the quantity obtained by the act of measuring. Direct measurements are obtained by placing a detector near the media being surveyed and inferring the radioactivity level directly from the detector response. Scanning is a measurement technique performed by moving a portable radiation detector at a constant speed above a surface to semi-quantitatively detect areas of elevated activity. Sampling is the process of collecting a portion of an environmental medium as being representative of the locally remaining medium. The collected portion, or aliquot, of the medium is then analyzed to identify the contaminant and determine the concentration. The word sample may also refer to a set of individual measurements drawn from a population whose properties are studied to gain information about the entire population. This second definition of sample is primarily used for statistical discussions.
To make the best use of resources for decommissioning, MARSSIM places greater survey efforts on areas that have, or had, the highest potential for contamination. This is referred to as a graded approach. The final status survey uses statistical tests to support decision making. These statistical tests are performed using survey data from areas with common characteristics, such as contamination potential, which are distinguishable from other areas with different characteristics. Classification is the process by which an area or survey unit is described according to radiological characteristics. The significance of survey unit classification is that this process determines the final status survey design and the procedures used to develop this design. Preliminary area classifications, made earlier in the MARSSIM Process, are useful for planning subsequent surveys.
Areas that have no reasonable potential for residual contamination are classified as non-impacted areas. These areas have no radiological impact from site operations and are typically identified early in decommissioning. Areas with reasonable potential for residual contamination are classified as impacted areas.
Impacted areas are further divided into one of three classifications:
MARSSIM, Revision 1 2-4 August 2002

Overview of the Radiation Survey and Site Investigation Process
! Class 1 Areas: Areas that have, or had prior to remediation, a potential for radioactive contamination (based on site operating history) or known contamination (based on previous radiation surveys) above the DCGLW. Examples of Class 1 areas include: 1) site areas previously subjected to remedial actions3, 2) locations where leaks or spills are known to have occurred, 3) former burial or disposal sites, 4) waste storage sites, and 5) areas with contaminants in discrete solid pieces of material and high specific activity.
! Class 2 Areas: Areas that have, or had prior to remediation, a potential for radioactive contamination or known contamination, but are not expected to exceed the DCGLW. To justify changing the classification from Class 1 to Class 2, there should be measurement data that provides a high degree of confidence that no individual measurement would exceed the DCGLW. Other justifications for reclassifying an area as Class 2 may be appropriate, based on site-specific considerations. Examples of areas that might be classified as Class 2 for the final status survey include: 1) locations where radioactive materials were present in an unsealed form, 2) potentially contaminated transport routes, 3) areas downwind from stack release points, 4) upper walls and ceilings of buildings or rooms subjected to airborne radioactivity, 5) areas handling low concentrations of radioactive materials, and 6) areas on the perimeter of former contamination control areas.
! Class 3 Areas: Any impacted areas that are not expected to contain any residual radioactivity, or are expected to contain levels of residual radioactivity at a small fraction of the DCGLW, based on site operating history and previous radiation surveys. Examples of areas that might be classified as Class 3 include buffer zones around Class 1 or Class 2 areas, and areas with very low potential for residual contamination but insufficient information to justify a non-impacted classification.
Class 1 areas have the greatest potential for contamination and therefore receive the highest degree of survey effort for the final status survey using a graded approach, followed by Class 2, and then by Class 3. Non-impacted areas do not receive any level of survey coverage because they have no potential for residual contamination. Non-impacted areas are determined on a site-specific basis. Examples of areas that would be non-impacted rather than impacted usually include residential or other buildings that have or had nothing more than smoke detectors or exit signs with sealed radioactive sources.
3 Remediated areas are identified as Class 1 areas because the remediation process often results in less than 100% removal of the contamination, even though the goal of remediation is to comply with regulatory standards and protect human health and the environment. The contamination that remains on the site after remediation is often associated with relatively small areas with elevated levels of residual radioactivity. This results in a non-uniform distribution of the radionuclide and a Class 1 classification. If an area is expected to have no potential to exceed the DCGLW and was remediated to demonstrate the residual radioactivity is as low as reasonably achievable (ALARA), the remediated area might be classified as Class 2 for the final status survey.
August 2000 2-5 MARSSIM, Revision 1

Overview of the Radiation Survey and Site Investigation Process
If the radionuclide of potential concern is present in background, or if the measurement system used to determine concentration in the survey unit is not radionuclide-specific, background measurements are compared to the survey unit measurements to determine the level of residual radioactivity. The background reference area is a geographical area from which representative reference measurements are performed for comparison with measurements performed in specific survey units. The background reference area is defined as an area that has similar physical, chemical, radiological, and biological characteristics as the survey unit(s) being investigated but has not been contaminated by site activities (i.e., non-impacted).
The process of planning the survey, implementing the survey plan, and assessing the survey results prior to making a decision is called the Data Life Cycle. Survey planning uses the Data Quality Objectives (DQO) Process to ensure that the survey results are of sufficient quality and quantity to support the final decision. Quality Assurance and Quality Control (QA/QC) procedures are performed during implementation of the survey plan to collect information necessary to evaluate the survey results. Data Quality Assessment (DQA) is the process of assessing the survey results, determining that the quality of the data satisfies the objectives of the survey, and interpreting the survey results as they apply to the decision being made.
A systematic process and structure for quality should be established to provide confidence in the quality and quantity of data collected to support decision making. The data used in decision making should be supported by a planning document that records how quality assurance and quality control are applied to obtain type and quality of results that are needed and expected. There are several terms used to describe a variety of planning documents, some of which document only a small part of the survey design process. MARRSIM uses the term Quality Assurance Project Plan (QAPP) to describe a single document that incorporates all of the elements of the survey design. This term is consistent with consensus guidance ANSI/ASQC E4-1994 (ASQC 1995) and EPA guidance (EPA 1994c; EPA 1997a), and is recommended to promote consistency. The use of the term QAPP in MARSSIM does not exclude the use of other terms (e.g., Decommissioning Plan, Sampling and Analysis Plan, Field Sampling Plan) to describe survey documentation provided the information included in the documentation supports the objectives of the survey.
2.3 Making Decisions Based on Survey Results
Compliance demonstration is simply a decision as to whether or not a survey unit meets the release criterion. For most sites this decision is based on the results of one or more surveys. When survey results are used to support a decision, the decision maker4 needs to ensure that the
4 The term decision maker is used throughout this section to describe the person, team, board, or committee responsible for the final decision regarding disposition of the survey unit.
MARSSIM, Revision 1 2-6 August 2000

Overview of the Radiation Survey and Site Investigation Process
data will support that decision with satisfactory confidence. Usually a decision maker will make a correct decision after evaluating the data. However, since uncertainty in the survey results is unavoidable, the possibility of errors in decisions supported by survey results is unavoidable. For this reason, positive actions must be taken to manage the uncertainty in the survey results so that sound, defensible decisions may be made. These actions include proper survey planning to control known causes of uncertainty, proper application of quality control (QC) procedures during implementation of the survey plan to detect and control significant sources of error , and careful analysis of uncertainty before the data are used to support decision making. These actions describe the flow of data throughout each type of survey, and are combined in the Data Life Cycle as shown in Figure 2.1.
There are four phases of the Data Life Cycle:
! Planning Phase. The survey design is developed and documented using the Data Quality Objectives (DQO) Process. Quality assurance and quality control (QA/QC) procedures are developed and documented in the Quality Assurance Project Plan (QAPP). The QAPP is the principal product of the planning process which incorporates the DQOs as it integrates all technical and quality aspects for the life cycle of the project, including planning, implementation, and assessment. The QAPP documents planning results for survey operations and provides a specific format for obtaining the type and quality of data needed for decision making. The QAPP elements are presented in an order corresponding to the Data Life Cycle by grouping them into two types of elements: 1) project management; and 2) collection and evaluation of environmental data (ASQC 1995). The DQO process is described in Appendix D, and applied in Chapters 3, 4, and 5 of this manual. Development of the QAPP is described in Section 9.2 and applied throughout decommissioning.
August 2000 2-7
PLANNING PHASE
Plan for Data Collection using the Data Quality Objectives Process and
Develop a Quality Assurance Project Plan
IMPLEMENTATION PHASE
Collect Data using Documented Measurement Techniques and Associated Quality Assurance and Quality Control Activities
ASSESSMENT PHASE
Evaluate the Collected Data Against the Survey Objectives using Data Verification, Data Validation, and Data Quality Assessment
DECISION-MAKING PHASE
Figure 2.1 The Data Life Cycle
MARSSIM, Revision 1

Overview of the Radiation Survey and Site Investigation Process
! Implementation Phase. The survey design is carried out in accordance with the SOPs and QAPP, resulting in the generation of raw data. Chapter 6, Chapter 7, and Appendix H provide information on the selection of data collection techniques. The QA and QC measurements, discussed in Chapter 6 and Chapter 7, also generate data and other important information that will be used during the Assessment Phase.
! Assessment Phase. The data generated during the Implementation Phase are first verified to ensure that the SOPs specified in the QAPP were actually followed and that the measurement systems performed in accordance with the criteria specified in the QAPP. Then the data are validated to ensure that the results of data collection activities support the objectives of the survey as documented in the QAPP, or permit a determination that these objectives should be modified. The data quality assessment (DQA) process is then applied using the validated data to determine if the quality of the data satisfies the data user’s needs. Data verification and validation are described in Section 9.3. The DQA process is described in Appendix E and is applied in Chapter 8.
! Decision-Making Phase. A decision is made, in coordination with the responsible regulatory agency, based on the conclusions drawn from the assessment process. The ultimate objective is to make technically defensible decisions with a specified level of confidence (Chapter 8).
2.3.1 Planning Effective Surveys—Planning Phase
The first step in designing effective surveys is planning. The DQO Process is a series of planning steps based on the scientific method for establishing criteria for data quality and developing survey designs (ASQC 1995, EPA 1994a, EPA 1987b, EPA 1987c). Planning radiation surveys using the DQO Process improves the survey effectiveness and efficiency, and thereby the defensibility of decisions. This minimizes expenditures related to data collection by eliminating unnecessary, duplicative, or overly precise data. Using the DQO Process ensures that the type, quantity, and quality of environmental data used in decision making will be appropriate for the intended application. MARSSIM supports the use of the DQO Process to design surveys for input to both evaluation techniques (elevated measurement comparison and the statistical test). The DQO Process provides systematic procedures for defining the criteria that the survey design should satisfy, including what type of measurements to perform, when and where to perform measurements, the level of decision errors for the survey, and how many measurements to perform.
The level of effort associated with planning a survey is based on the complexity of the survey. Large, complicated sites generally receive a significant amount of effort during the planning phase, while smaller sites may not require as much planning. This graded approach defines data quality requirements according to the type of survey being designed, the risk of making a
MARSSIM, Revision 1 2-8 August 2000

Overview of the Radiation Survey and Site Investigation Process
decision error based on the data collected, and the consequences of making such an error. Thisapproach provides a more effective survey design combined with a basis for judging the usabilityof the data collected.
DQOs are qualitative and quantitative statements derived from the outputs of the DQO Processthat:
! clarify the study objective! define the most appropriate type of data to collect! determine the most appropriate conditions for collecting the data! specify limits on decision errors which will be used as the basis for establishing the
quantity and quality of data needed to support the decision
The DQO Process consists of seven steps, as shown in Figure 2.2. Each step is discussed in detail in Appendix D. While all of the outputs of the DQO Process are important for designing efficient surveys, there are some that are referred to throughout the manual. These DQOs are mentioned briefly here, and are discussed in detail throughout MARSSIM and in Appendix D.
The minimum information (outputs) required from the DQO Process to proceed with the methods described in MARSSIM are:
! classify and specify boundaries of survey units: this can be accomplished at any time, but must be finalized during final status survey planning (Section 4.4, Section 4.6)
! state the null hypothesis (H0): the residual radioactivity in the survey unit exceeds the release criterion (Section 2.5, Appendix D, Section D.6)
! specify a gray region where the consequences of decision errors are relatively minor: the upper bound of the gray region is defined as the DCGLW, and the lower bound of the gray region (LBGR) is a site-specific variable generally initially selected to equal one half the DCGLW and adjusted to provide an acceptable value for the relative shift (Section 5.5.2.2, Section 5.5.2.3, Appendix D, Section D.6)
! define Type I and Type II decision errors and assign probability limits for the occurrence of these errors: the probability of making a Type I decision error (�) or a Type II decision error (�) are site-specific variables (Section 5.5.2.2, Section 5.5.2.3, Appendix D, Section D.6)
! estimate the standard deviation of the measurements in the survey unit: the standard deviation (�) is a site-specific variable, typically estimated from preliminary survey data (Section 5.5.2.2, Section 5.5.2.3)
! specify the relative shift: the shift (�) is equal to the width of the gray region (DCGLW - LBGR), and the relative shift is defined as �/�, which is generally designed to have a value between one and three (Section 5.5.2.2, Section 5.5.2.3)
August 2000 2-9 MARSSIM, Revision 1

Overview of the Radiation Survey and Site Investigation Process
STEP 6: SPECIFY LIMITS ON DECISION ERRORS
STEP 5: DEVELOP A DECISION RULE
STEP 4: DEFINE THE STUDY BOUNDARIES
STEP 3: IDENTIFY INPUTS TO THE DECISION
STEP 2: IDENTIFY THE DECISION
STEP 1: STATE THE PROBLEM
STEP 7: OPTIMIZE THE DESIGN FOR
OBTAINING DATA
Figure 2.2 The Data Quality Objectives Process
! specify the detection limit for all measurement techniques (scanning, direct measurement, and sample analysis) specified in the QAPP: the minimum detectable concentration (MDC) is unique for each measurement system (Section 6.7)
! calculate the estimated number of measurements (N) and specify the measurement locations required to demonstrate compliance: the number of measurements depends on the relative shift (�/�), Type I and Type II decision error rates (� and �), the potential for small areas of elevated activity, and the selection and classification of survey units (Section 5.5.2.2, Section 5.5.2.3)
! specify the documentation requirements for the survey, including survey planning documentation: documentation supporting the decision on whether or not the site complies with the release criterion is determined on a site-specific basis (Appendix N, Section N.2)
MARSSIM, Revision 1 2-10 August 2000

Overview of the Radiation Survey and Site Investigation Process
In addition to DQOs, values for the Data Quality Indicators (DQIs) should also be established and recorded during the planning stage. Where DQOs include performance measures and goals in relation to a specific intended use of the data, DQIs quantify the amount of error in the data collection process and the analytical measurement system regardless of how the data may be used (EPA 1997a). Precision, bias, accuracy, representativeness, comparability, and completeness are the DQIs recommended for quantifying the amount of error for survey data. These DQIs are discussed in detail in Appendix N, Section N.6.
2.3.2 Estimating the Uncertainty in Survey Results—Implementation Phase
To encourage flexibility and the use of optimal measurement techniques for a specific site, MARSSIM does not provide detailed guidance on specific techniques. Instead, MARSSIM encourages the decision maker to evaluate available techniques based on the survey objectives. Guidance on evaluating these objectives, such as detection limit, is provided.
QC programs can both lower the chances of making an incorrect decision and help the data user understand the level of uncertainty that surrounds the decision (EPA 1997a). As discussed previously, QC data are collected and analyzed during implementation to provide an estimate of the uncertainty associated with the survey results. QC measurements (scans, direct measurements, and samples) are technical activities performed to measure the attributes and performance of the survey. During any survey, a certain number of measurements should be taken for QC purposes.
2.3.3 Interpreting Survey Results—Assessment Phase
Assessment of environmental data is used to evaluate whether the data meet the objectives of the survey and whether the data are sufficient to determine compliance with the DCGL (EPA 1992a, EPA 1992b, EPA 1996a). The assessment phase of the Data Life Cycle consists of three phases: data verification, data validation, and Data Quality Assessment (DQA).
Data verification is used to ensure that the requirements stated in the planning documents are implemented as prescribed (see Section 9.3). Data validation is used to ensure that the results of the data collection activities support the objectives of the survey as documented in the QAPP, or permit a determination that these objectives should be modified (see Section 9.3 and Appendix N). Data quality assessment (DQA) is the scientific and statistical evaluation of data to determine if the data are of the right type, quality, and quantity to support their intended use (EPA 1996a). DQA helps complete the Data Life Cycle by providing the assessment needed to determine that the planning objectives are achieved (see Section 8.2). Figure 2.3 illustrates where data verification, data validation, and DQA fit into the Assessment Phase of the Data Life Cycle.
August 2000 2-11 MARSSIM, Revision 1

Overview of the Radiation Survey and Site Investigation Process
There are five steps in the DQA Process:
! Review the DQOs and Survey Design ! Conduct a Preliminary Data Review ! Select the Statistical Test ! Verify the Assumptions of the
Statistical Test ! Draw Conclusions from the Data
The strength of DQA is its design that progresses in a logical and efficient manner to promote an understanding of how well the data meet the intended use. The Assessment Phase is described in more detail in Appendix E. Section 2.6 discusses the flexibility of the Data Life Cycle and describes the use of survey designs other than those described later in MARSSIM.
2.3.4 Uncertainty in Survey Results
Uncertainty in survey results arises primarily from two sources: survey design errors and measurement errors. Survey design errors occur when the survey design is unable to capture the complete extent of variability that exists for the radionuclide distribution in a survey unit. Since it is impossible in every
INPUTS
OUTPUT
INPUT
OUTPUT
Verify Measurement Performance Verify Measurement Procedures and Reporting Requirements
DATA VAL IDATION/VERIFICATION
Review DQOs and Design Conduct Preliminary Data Review Select Statistical Test Verify Assumptions Draw Conclusions
DATA QUALITY ASSESSMENT
QC/Performance Evaluation DataRoutine Data
VALIDATED/VERIFIED DATA
CONCLUSIONS DRAWN FROM DATA
Figure 2.3 The Assessment Phase of the Data Life Cycle (EPA 1996a)
situation to measure the residual radioactivity at every point in space and time, the survey results will be incomplete to some degree. It is also impossible to know with complete certainty the residual radioactivity at locations that were not measured, so the incomplete survey results give rise to uncertainty. The greater the natural or inherent variation in residual radioactivity, the greater the uncertainty associated with a decision based on the survey results. The unanswered question is: “How well do the survey results represent the true level of residual radioactivity in the survey unit?”
Measurement errors create uncertainty by masking the true level of residual radioactivity and may be classified as random or systematic errors. Random errors affect the precision of the measurement system, and show up as variations among repeated measurements. Systematic errors show up as measurements that are biased to give results that are consistently higher or lower than the true value. Measurement uncertainty is discussed in Section 6.8.
MARSSIM, Revision 1 2-12 August 2000

Overview of the Radiation Survey and Site Investigation Process
MARSSIM uses the Data Life Cycle to control and estimate the uncertainty in the survey results on which decisions are made. Adequate planning should minimize known sources of uncertainty. QC data collected during implementation of the survey plan provide an estimate of the uncertainty. Statistical hypothesis testing during the assessment phase provides a level of confidence for the final decision. There are several levels of decisions included within each survey type. Some decisions are quantitative, based on the numerical results of measurements performed during the survey. Other decisions are qualitative based on the available evidence and best professional judgment. The Data Life Cycle can and should be applied consistently to both types of decisions.
2.3.5 Reporting Survey Results
The process of reporting survey results is an important consideration in planning the survey. Again, the level of effort for reporting should be based on the complexity of the survey. Asimple survey with relatively few results may specify a single report, while a more complicatedsurvey may specify several reports to meet the objectives of the survey. Reporting requirementsfor individual surveys should be developed during planning and clearly documented in theQAPP. These requirements should be developed with cooperation from the people performingthe analyses (e.g., the analytical laboratory should be consulted on reporting results for samples). The Health Physics Society has developed several suggestions for reporting survey results(EPA 1980c). These suggestions include:
! Report the actual result of the analysis. Do not report data as “less than the detection limit.” Even negative results and results with large uncertainties can be used in the statistical tests to demonstrate compliance. Results reported only as “<MDC” cannot be fully used and, for example, complicate even such simple analyses as calculating an average. While the nonparametric tests described in Section 8.3 and Section 8.4 can accommodate as much as 40% of the results as non-detects, it is better to report the actual results and avoid the possibility of exceeding this limit.
! Report results using the correct units and the correct number of significant digits. The choice of reporting results using SI units (e.g., Bq/kg, Bq/m2) or conventional units (e.g., pCi/g, dpm/100 cm2) is made on a site-specific basis. Generally, MARSSIM recommends that all results be reported in the same units as the DCGLs. Sometimes the results may be more convenient to work with as counts directly from the detector. In these cases the user should decide what the appropriate units are for a specific survey based on the survey objectives. The user should also report the correct number of significant digits as described in EPA 1980c.
August 2000 2-13 MARSSIM, Revision 1

Overview of the Radiation Survey and Site Investigation Process
! Report the measurement uncertainty for every analytical result or series of results, such as for a measurement system. This uncertainty, while not directly used for demonstrating compliance with the release criterion, is used for survey planning and data assessment throughout the Radiation Survey and Site Investigation Process. In addition, the uncertainty is used for evaluating the performance of measurement systems using QC measurement results (as described in Section 6.2 for scans and direct measurements, and in Section 7.2 for laboratory analysis of samples). The uncertainty is also used for comparing individual measurements to the action level, which is especially important in the early stages of decommissioning (scoping, characterization, and remedial action support surveys described in Section 2.4) when decisions are made based on a limited number of measurements. Section 6.8 discusses methods for calculating the measurement uncertainty.
! Report the minimum detectable concentration (MDC) for the measurement system as well as the method used to calculate the MDC. The MDC is an a priori estimate of the capability for detecting an activity concentration with a specific measurement system (EPA 1980c). As such, this estimate is valuable for planning and designing radiation surveys. Optimistic estimates of the MDC (calculated using ideal conditions that may not apply to actual measurements) overestimate the ability of a technique to detect residual radioactivity, especially when scanning for alpha or low-energy beta radiations. This can invalidate survey results, especially for scanning surveys. Using a more realistic MDC, as described in Section 6.7, during scoping and characterization surveys helps in the proper classification of survey units for final status surveys and minimizes the possibility of designing and performing subsequent surveys because of errors in classification. Estimates of the MDC that minimize potential decision errors should be used for planning surveys.
Reporting requirements for individual surveys should be developed during planning and clearly documented in the QAPP.
2.4 Radiation Survey and Site Investigation Process
The Data Life Cycle discussed in Section 2.3 is the basis for the performance-based guidance in MARSSIM. As a framework for collecting the information required for demonstrating compliance identified using the DQO Process, MARSSIM recommends using a series of surveys. The Radiation Survey and Site Investigation (RSSI) Process is an example of a series of surveys designed to demonstrate compliance with a dose- or risk-based regulation for sites with radioactive contamination.
MARSSIM, Revision 1 2-14 August 2000

Overview of the Radiation Survey and Site Investigation Process
There are six principal steps in the RSSI Process:
! Site Identification ! Historical Site Assessment ! Scoping Survey ! Characterization Survey ! Remedial Action Support Survey ! Final Status Survey
Table 2.1 provides a simplified overview of the principal steps in the RSSI process and how the Data Life Cycle can be used in an iterative fashion within the process. Each of these steps is briefly described in the Sections 2.4.1 through 2.4.6, and described in more detail in Chapter 3 and Chapter 5. In addition, there is a brief description of regulatory agency confirmation and verification (see Section 2.4.7). Because MARSSIM focuses on demonstrating compliance with a release criterion, specifically through the use of a final status survey, these surveys have additional objectives that are not fully discussed in MARSSIM (e.g., health and safety of workers, supporting selection of values for exposure pathway model parameters).
Figure 2.4 illustrates the Radiation Survey and Site Investigation Process in terms of area classification, and lists the major decision to be made for each type of survey. The flowchart demonstrates one method for quickly estimating the survey unit classification early in the MARSSIM Process based on limited information. While this figure shows the relationship between area classification and survey unit classification along with the major decision points that determine classification, this illustration is not designed to comprehensively consider every possibility that may occur at individual survey units. As such, it is a useful tool for visualizing the classification process, but there are site-specific characteristics that may cause variation from this scheme.
The flowchart, illustrated in Figures 2.5 through 2.8, presents the principal steps and decisions in the site investigation process and shows the relationship of the survey types to the overall assessment process. As shown in these figures, there are several sequential steps in the site investigation process and each step builds on information provided by its predecessor. Properly applying each sequential step in the RSSI Process should provide a high degree of assurance that the release criterion has not been exceeded.
August 2000 2-15 MARSSIM, Revision 1

Overview of the Radiation Survey and Site Investigation Process
Table 2.1 The Data Life Cycle used to Support the Radiation Survey and Site Investigation Process
RSSI Process Data Life Cycle MARSSIM Guidance
Site Identification Provides information on identifying potential radiation sites (Section 3.3)
Historical Site Assessment
Historical Site Assessment Data Life Cycle
Plan Implement Assess Decide
Provides information on collecting and assessing existing site data (Sections 3.4 through 3.9) and potential sources of information (Appendix G)
Scoping Survey Scoping Data Life Cycle
Plan Implement Assess Decide
Discusses the purpose and general approach for performing scoping surveys, especially as sources of information when planning final status surveys (Section 5.2)
Characterization Survey
Characterization Data Life Cycle
Plan Implement Assess Decide
Discusses the purpose and general approach for performing characterization surveys, especially as sources of information when planning final status surveys (Section 5.3)
Remedial Action Support Survey
Remedial Action Data Life Cycle
Plan Implement Assess Decide
Discusses the purpose and general approach for performing remedial action support surveys, especially as sources of information when planning final status surveys (Section 5.4)
Final Status Survey Final Status Data Life Cycle
Plan Implement Assess Decide
Provides detailed guidance for planning final status surveys (Chapter 4 and Section 5.5), selecting measurement techniques (Chapter 6, Chapter 7, and Appendix H), and assessing the data collected during final status surveys (Chapter 8 and Chapter 9)
2.4.1 Site Identification
The identification of known, likely, or potential sites is generally easily accomplished, and is typically performed before beginning decommissioning. Any facility preparing to terminate an NRC or agreement state license would be identified as a site. Formerly terminated NRC licenses may also become sites for the EPA Superfund Program. Portions of military bases or DOE facilities may be identified as sites based on records of authorization to possess or handle radioactive materials. In addition, information obtained during the performance of survey activities may identify additional potential radiation sites related to the site being investigated. Information on site identification is provided in Section 3.3.
MARSSIM, Revision 1 2-16 August 2000

Overview of the Radiation Survey and Site Investigation Process
Historical Site Assessment
Is the Area Impacted?
Scoping Survey
Is the Area Potential ly Contaminated?
Characterization Survey
Is the Probabil ity of Exceeding the DCGL W Smal l?
Remedial Act ion Support Survey
Non-Impacted No Survey Required
Class 3 Final Status Survey
Class 2 Final Status Survey
Class 1 Final Status Survey
Init ial ly Assumes a Class 1 Projected Final Status Survey Classif ication
No
Is the Probabil ity of Exceeding the DCGL EMC Smal l?
Is There Suff icient
Information to Support Classif ication as
Class 2?
Yes/ Unknown
Yes/Unknown
No
No
Yes
Yes
Yes
Yes
No
No
No
Is the Area Actual ly
Contaminated?
Figure 2.4 The Radiation Survey and Site Investigation Process in Terms of Area Classification
August 2000 2-17 MARSSIM, Revision 1

Overview of the Radiation Survey and Site Investigation Process
Design Historical Site Assessment (HSA) Using Data Quali ty Object ives (DQO)
Process
Perform HSA
Validate Data and Assess Data Quali ty
Reassess DQOs
Are the DQOs Satisf ied?
Is the Area Impacted?
Document Findings Support ing Non-Impacted
Classif ication
Area Previously Remediated and
Current ly Poses Low Human Heal th
Risk?
Provide Documentat ion Suff icent to Demonstrate
Compl iance
Document Findings of HSA
Decision to Release Area
To Figure 2.6
Survey Object ives 1) 2) to human health and the environment 3) areas 4) survey designs 5) contaminant migrat ion 6) related to the site being investigated
No
Yes No
Yes/Unknown
Yes
No
Site Identif ication
Identify potential sources of contamination Determine whether or not sites pose a threat
Differentiate impacted from non-impacted
Provide input to scoping and characterization
Provide an assessment of the l ikel ihood of
Identify addit ional potential radiation sites
Figure 2.5 The Historical Site Assessment Portion of the Radiation Survey and Site Investigation Process
MARSSIM, Revision 1 2-18 August 2000

Overview of the Radiation Survey and Site Investigation Process
From Figure 2.5
Design Scoping Survey Plan Using
DQO Process
Per form Scoping Survey
Val idate Data and Assess Data Qual i ty
Are the DQOs Sat isf ied?
Reassess DQOs
Is There Suff ic ient
Informat ion to Support Classi f icat ion as
Class 3?
Document F ind ings Support ing Class 3
Classi f icat ion
To Figure 2.7
To Figure 2.8
Survey Objectives 1) assessment 2) of the site as a Class 3 area 3) be optimized for use in characterization or final status survey 4) characterization survey design
N o
Yes No /Unknown
Yes
Perform a preliminary hazard
Support classification of all or part
Evaluate whether survey plan can
Provide input to the
Figure 2.6 The Scoping Survey Portion of the Radiation Survey and Site Investigation Process
August 2000 2-19 MARSSIM, Revision 1

Overview of the Radiation Survey and Site Investigation Process
Design Character izat ion
Survey Plan Using DQO Process
Reassess DQOs Per form
Character izat ion Survey
Are the DQOs Sat isf ied?
Val idate Data and Assess Data Qual i ty
Classi fy Areas as Class 1, Class 2,
or Class 3
Do the Class 1 and Class 2
Areas Requi re Remedia t ion?
Reassess Remedia l Al ternat ive and Site
Spec i f ic DCGLs
Remediate the Area
Per form Remedia l Act ion Support Survey
Does the Remedia l Act ion
Support Survey Indicate the Remediat ion is
Comple te?
Survey Objectives 1) the contamination 2) technologies 3) optimized for use in the final status survey 4) design
Is Reassessment of Remedial Al ternat ive
and Si te Speci f ic DCGLs Necessary?
F rom Figure 2.6
F rom Figure
2.8*
To Figure 2.8
N o
Yes
Yes
Yes
N o
N o
N o
Yes
Determine Remedia l Al ternat ive and Site
Spec i f ic DCGLs
Determine the nature and extent of
Evaluate remedial alternatives and
Evaluate whether survey plan can be
Provide input to the final status survey
* The point where survey units that fail to demonstrate compliance in the final status survey in Figure 2.8 re-enter the process
Figure 2.7 The Characterization and Remedial Action Support Survey Port ion of the Radiation Survey and Site Investigation Process
MARSSIM, Revision 1 2-20 August 2000

Overview of the Radiation Survey and Site Investigation Process
Design Final Status Survey Plan Using DQO Process
Perform Final Status Survey for Class 1
Survey Units
Perform Final Status Survey for Class 2
Survey Units
Perform Final Status Survey for Class 3
Survey Units
Perform Addit ional Surveys
Reassess DQOs
Validate Data and Assess Data Quali ty
Are the DQOs Satisf ied?
Do the Final Status Survey
Results Demonstrate Compliance with
DCGLs?
Is Addit ional Remediat ion
Required?
Document Results in the Final Status Survey Report
Survey Object ives 1) classif ication 2) or r isk from residual contamination is below the release criterion for each survey unit 3) from residual elevated areas is below the release criterion for each survey unit
From Figure 2.6 and Figure
2.7
To Figure 2.7*
Yes
Yes
No
Yes
No
No
Select/verify survey unit
Demonstrate that the potential dose
Demonstrate that the potential dose
* Connects with the Remedial Action Support Survey portion of the process in Figure 2.7
Figure 2.8 The Final Status Survey Portion of the Radiation Survey and Site Investigation Process
August 2000 2-21 MARSSIM, Revision 1

Overview of the Radiation Survey and Site Investigation Process
2.4.2 Historical Site Assessment
The primary purpose of the Historical Site Assessment (HSA) is to collect existing informationconcerning the site and its surroundings.
The primary objectives of the HSA are to:
! identify potential sources of contamination! determine whether or not sites pose a threat to human health and the environment! differentiate impacted from non-impacted areas! provide input to scoping and characterization survey designs! provide an assessment of the likelihood of contaminant migration! identify additional potential radiation sites related to the site being investigated
The HSA typically consists of three phases: identification of a candidate site, preliminaryinvestigation of the facility or site, and site visits or inspections. The HSA is followed by anevaluation of the site based on information collected during the HSA.
2.4.3 Scoping Survey
If the data collected during the HSA indicate an area is impacted, a scoping survey could beperformed. Scoping surveys provide site-specific information based on limited measurements.
The primary objectives of a scoping survey are to:
! perform a preliminary hazard assessment! support classification of all or part of the site as a Class 3 area! evaluate whether the survey plan can be optimized for use in the characterization or final
status surveys ! provide data to complete the site prioritization scoring process (CERCLA and RCRA
sites only) ! provide input to the characterization survey design if necessary
Scoping surveys are conducted after the HSA is completed and consist of judgment measurements based on the HSA data. If the results of the HSA indicate that an area is Class 3 and no contamination is found, the area may be classified as Class 3 and a Class 3 final status survey is performed. If the scoping survey locates contamination, the area may be considered as Class 1 (or Class 2) for the final status survey and a characterization survey is typically performed. Sufficient information should be collected to identify situations that require immediate radiological attention. For sites where the Comprehensive Environmental Response, Compensation, and Liability Act (CERCLA) requirements are applicable, the scoping survey
MARSSIM, Revision 1 2-22 August 2000

Overview of the Radiation Survey and Site Investigation Process
should collect sufficient data to complete the Hazard Ranking System (HRS) scoring process. For sites where the Resource Conservation and Recovery Act (RCRA) requirements are applicable, the scoping survey should collect sufficient data to complete the National Corrective Action Prioritization System (NCAPS) scoring process. Sites that meet the National Contingency Plan (NCP) criteria for a removal should be referred to the Superfund removal program (EPA 1988c). A comparison of MARSSIM guidance to CERCLA and RCRA requirements is provided in Appendix F.
2.4.4 Characterization Survey
If an area could be classified as Class 1 or Class 2 for the final status survey, based on the HSAand scoping survey results, a characterization survey is warranted. The characterization survey isplanned based on the HSA and scoping survey results. This type of survey is a detailedradiological environmental characterization of the area.
The primary objectives of a characterization survey are to:
! determine the nature and extent of the contamination! collect data to support evaluation of remedial alternatives and technologies! evaluate whether the survey plan can be optimized for use in the final status survey! support Remedial Investigation/Feasibility Study requirements (CERCLA sites only) or
Facility Investigation/Corrective Measures Study requirements (RCRA sites only) ! provide input to the final status survey design
The characterization survey is the most comprehensive of all the survey types and generates the most data. This includes preparing a reference grid, systematic as well as judgment measurements, and surveys of different media (e.g., surface soils, interior and exterior surfaces of buildings). The decision as to which media will be surveyed is a site-specific decision addressed throughout the Radiation Survey and Site Investigation Process.
2.4.5 Remedial Action Support Survey
If an area is adequately characterized and is contaminated above the derived concentrationguideline levels (DCGLs), a decontamination plan should be prepared. A remedial actionsupport survey is performed while remediation is being conducted, and guides the cleanup in areal-time mode.
Remedial action support surveys are conducted to:
! support remediation activities! determine when a site or survey unit is ready for the final status survey
August 2000 2-23 MARSSIM, Revision 1

Overview of the Radiation Survey and Site Investigation Process
! provide updated estimates of site-specific parameters used for planning the final status survey
This manual does not provide guidance on the routine operational surveys used to support remediation activities. The determination that a survey unit is ready for a final status survey following remediation is an important step in the RSSI Process. In addition, remedial activities result in changes to the distribution of contamination within the survey unit. For most survey units, the site-specific parameters used during final status survey planning (e.g., variability in the radionuclide concentration, probability of small areas of elevated activity) will need to be re-established following remediation. Obtaining updated values for these critical parameters should be considered when planning a remedial action support survey.
2.4.6 Final Status Survey
The final status survey is used to demonstrate compliance with regulations. This type of surveyis the major focus of this manual.
The primary objectives of the final status survey are to:
! select/verify survey unit classification! demonstrate that the potential dose or risk from residual contamination is below the
release criterion for each survey unit ! demonstrate that the potential dose or risk from small areas of elevated activity is below
the release criterion for each survey unit
The final status survey provides data to demonstrate that all radiological parameters satisfy the established guideline values and conditions.
Although the final status survey is discussed as if it were an activity performed at a single stage of the site investigation process, this does not have to be the case. Data from other surveys conducted during the Radiation Survey and Site Investigation Process—such as scoping, characterization, and remedial action support surveys—can provide valuable information for planning a final status survey provided they are of sufficient quality.
Professional judgment and biased sampling are important for locating contamination and characterizing the extent of contamination at a site. However, the MARSSIM focus is on planning the final status survey which utilizes a more systematic approach to sampling. Systematic sampling is based on rules that endeavor to achieve the representativeness in sampling consistent with the application of statistical tests.
MARSSIM, Revision 1 2-24 August 2000

Overview of the Radiation Survey and Site Investigation Process
2.4.7 Regulatory Agency Confirm ation and Verification
The regulatory agency responsible for the site often confirms whether the site is acceptable for release. This confirmation may be accomplished by the agency or an impartial party. Although some actual measurements may be performed, much of the work required for confirmation and verification will involve evaluation and review of documentation and data from survey activities. The evaluation may include site visits to observe survey and measurement procedures or split-sample analyses by the regulatory agency's laboratory. Therefore, accounting for confirmation and verification activities during the planning stages is important to each type of survey. In some cases, post-remedial sampling and analysis may be performed by an impartial party. The review of survey results should include verifying that the data quality objectives are met, reviewing the analytical data used to demonstrate compliance, and verifying that the statistical test results support the decision to release the site. Confirmation and verification are generally ongoing processes throughout the Radiation Survey and Site Investigation (RSSI) Process.
2.5 Demonstrating Compliance With a Dose- or Risk-Based Regulation
MARSSIM presents a process for demonstrating compliance with a dose- or risk-based regulation. The RSSI Process provides flexibility in planning and performing surveys based on site-specific considerations. A dose- or risk-based regulation usually allows one to take into account radionuclide and site-specific differences.
The final status survey is designed to demonstrate compliance with the release criterion. The earlier surveys in the RSSI Process are performed to support decisions and assumptions used in the design of the final status survey. These preliminary surveys (e.g., scoping, characterization) may have other objectives in addition to compliance demonstration that need to be considered during survey planning that are not fully discussed in this manual. For this reason MARSSIM focuses on final status survey design. To allow maximum flexibility in the survey design, MARSSIM provides guidance on designing a survey using the RSSI Process. This allows users with few resources available for planning to develop an acceptable survey design. The rationale for the development of the guidance in MARSSIM is presented in the following sections. Users with available planning resources are encouraged to investigate alternate survey designs for site-specific applications using the information provided in Section 2.6.
2.5.1 The Decision to Use Statistical Tests
The objective of compliance demonstration is to provide some level of confidence that the release criterion is not exceeded. As previously stated, 100% confidence in a decision cannot be proven because the data always contain some uncertainty. The use of statistical methods is necessary to provide a quantitative estimate of the probability that the release criterion is not
August 2000 2-25 MARSSIM, Revision 1

Overview of the Radiation Survey and Site Investigation Process
exceeded at a particular site. Statistical methods provide for specifying (controlling) the probability of making decision errors and for extrapolating from a set of measurements to the entire site in a scientifically valid fashion (EPA 1994b).
Clearly stating the null hypothesis is necessary before a statistical test can be performed. The null hypothesis recommended for use in MARSSIM is: “The residual radioactivity in the survey unit exceeds the release criterion.” This statement directly addresses the issue of compliance demonstration for the regulator and places the burden of proof for demonstrating compliance on the site owner or responsible party. The statistical tests are only applied at sites that were subjected to an Historical Site Assessment (HSA). At this point, the results of the HSA have been reviewed and the site is determined to be impacted based on existing data and professional judgment as described in Chapter 3. An impacted site, by definition, is expected to contain areas of contamination, so this statement of the null hypothesis is reasonable for these sites.
The information needed to perform a statistical test is determined by the assumptions used to develop the test. MARSSIM recommends the use of nonparametric statistical tests because these tests use fewer assumptions, and consequently require less information to verify these assumptions. The tests described in MARSSIM (see Chapter 8) are relatively easy to understand and implement compared to other statistical tests.
Site conditions can also affect the selection of statistical tests. The distribution of contamination is of particular concern at sites with residual radioactivity. Is the contamination distributed uniformly, or is it located in small areas of elevated activity? Is the residual radioactivity present as surface, volumetric, or subsurface contamination? To demonstrate the use of the RSSI Process at radiation sites, MARSSIM addresses only surface soil and building surfaces for the final status survey to demonstrate compliance. This represents a situation that is expected to commonly occur at sites with radioactive contamination, and allows the survey design to take into account the ability to directly measure surface radioactivity using scanning techniques. Other contaminated media may be identified during the HSA or preliminary surveys (i.e., scoping, characterization, remedial action support). If other contaminated media (e.g., subsurface contamination, volumetric contamination of building materials) are identified, methodologies for demonstrating compliance other than those described in this manual may need to be developed or evaluated. Situations where scanning techniques may not be effective (e.g., volumetric or subsurface contamination) are discussed in existing guidance (EPA 1989a, EPA 1994b, EPA 1994d).
MARSSIM, Revision 1 2-26 August 2000

Overview of the Radiation Survey and Site Investigation Process
2.5.1.1 Small Areas of Elevated Activity
While the development of DCGLs is outside the scope of MARSSIM, this manual assumes that DCGLs will be developed using exposure pathway models which in turn assume a relatively uniform distribution of contamination. While this represents an ideal situation, small areas of elevated activity are a concern at many sites.
MARSSIM addresses the concern for small areas of elevated activity by using a simple comparison to an investigation level as an alternative to statistical methods. Using the elevated measurement comparison (EMC) represents a conservative approach, in that every measurement needs to be below the action level. The investigation level for this comparison is called the DCGLEMC, which is the DCGLW modified to account for the smaller area. This area factor correction (discussed in Section 5.5.2.4) is considered to be a defensible modification because the exposure assumptions (e.g., exposure time and duration) are the same as those used to develop the DCGLW. In the case of multiple areas of elevated activity in a survey unit, a posting plot (discussed in Section 8.2.2.2) or similar representation of the distribution of activity in the survey unit can be used to determine any pattern in the location of these areas.
If elevated levels of residual radioactivity are found in an isolated area, in addition to residual radioactivity distributed relatively uniformly across the survey unit, the unity rule (Section 4.3.3) can be used to ensure that the total dose or risk meets the release criterion. If there is more than one of these areas, a separate term should be included in the calculation for each area of elevated activity. As an alternative to the unity rule, the dose or risk due to the actual residual radioactivity distribution can be calculated if there is an appropriate exposure pathway model available. Note that these considerations generally only apply to Class 1 survey units, since areas of elevated activity should not be present in Class 2 or Class 3 survey units.
2.5.1.2 Relatively Uniform Distribution of Contamination
As discussed previously, the development of a DCGL starts with the assumption of a relatively uniform distribution of contamination. Some variability in the measurements is expected. This is primarily due to a random spatial distribution of contamination and uncertainties in the measurement process. The arithmetic mean of the measurements taken from such a distribution would represent the parameter of interest for demonstrating compliance.
Whether or not the radionuclide of concern is present in background determines the form of the statistical test. The Wilcoxon Rank Sum (WRS) test is recommended for comparisons of survey unit radionuclide concentrations with background. When the radionuclide of concern is not present in background, the Sign test is recommended. Instructions on performing these tests are provided in Section 8.3 and Section 8.4.
August 2000 2-27 MARSSIM, Revision 1

Overview of the Radiation Survey and Site Investigation Process
The WRS and Sign tests are designed to determine whether or not the level of residual activity uniformly distributed throughout the survey unit exceeds the DCGLW. Since these methods are based on ranks, the results are generally expressed in terms of the median. When the underlying measurement distribution is symmetric, the mean is equal to the median. When the underlying distribution is not symmetric, these tests are still true tests of the median but only approximate tests of the mean. However, numerous studies show that this is a fairly good approximation (Hardin and Gilbert, 1993). The assumption of symmetry is less restrictive than that of normality because the normal distribution is itself symmetric. If, however, the measurement distribution is skewed to the right, the average will generally be greater than the median. In severe cases, the average may exceed the DCGLW while the median does not. For this reason, MARSSIM recommends comparing the arithmetic mean of the survey unit data to the DCGLW as a first step in the interpretation of the data (see Section 8.2.2.1).
The WRS test is a two-sample test that compares the distribution of a set of measurements in a survey unit to that of a set of measurements in a reference area. The test is performed by first adding the value of the DCGLW to each measurement in the reference area. The combined set of survey unit data and adjusted reference area data are listed, or ranked, in increasing numerical order. If the ranks of the adjusted reference site measurements are significantly higher than the ranks of the survey unit measurements, the survey unit demonstrates compliance with the release criterion.
The Sign test is a one-sample test that compares the distribution of a set of measurements in a survey unit to a fixed value, namely the DCGLW. First, the value for each measurement in the survey unit is subtracted from the DCGLW. The resulting distribution is tested to determine if the center of the distribution is greater than zero. If the adjusted distribution is significantly greater than zero, the survey unit demonstrates compliance with the release criterion.
Guidance on performing the statistical tests and presenting graphical representations of the data is provided in Chapter 8 and Appendix I.
2.5.2 Classification
Classifying a survey unit is crucial to the survey design because this step determines the level of survey effort based on the potential for contamination. Areas are initially classified as impacted or non-impacted based on the results of the HSA. Non-impacted areas have no reasonable potential for residual contamination and require no further evidence to demonstrate compliance with the release criterion. When planning the final status survey, impacted areas may be further divided into survey units. If a survey unit is classified incorrectly, the potential for making decision errors increases. For this reason, all impacted areas are initially assumed to be Class 1. Class 1 areas require the highest level of survey effort because they are known to have contaminant concentrations above the DCGLW, or the contaminant concentrations are unknown.
MARSSIM, Revision 1 2-28 August 2000

Overview of the Radiation Survey and Site Investigation Process
Information indicating the potential or known contaminant concentration is less than the DCGLW
can be used to support re-classification of an area or survey unit as Class 2 or Class 3.
There is a certain amount of information necessary to demonstrate compliance with the release criterion. The amount of this information that is available and the level of confidence in this information is reflected in the area classification. The initial assumption for affected areas is that none of the necessary information is available. This results in a default Class 1 classification. This corresponds with the statement of the null hypothesis that the survey unit is contaminated, and represents the most efficient case for the regulator. For this reason, the recommendations for a Class 1 final status survey represent the minimal amount of information necessary to demonstrate compliance.
Not all of the information available for an area will have been collected for purposes of compliance demonstration. For example, data are collected during characterization surveys to determine the extent, and not necessarily the amount, of contamination. This does not mean that the data do not meet the objectives of compliance demonstration, but may mean that statistical tests would be of little or no value because the data have not been collected using appropriate protocols or design. Rather than discard potentially valuable information, MARSSIM allows for a qualitative assessment of existing data (Chapter 3). Non-impacted areas represent areas where all of the information necessary to demonstrate compliance is available from existing sources. For these areas, no statistical tests are considered necessary. A classification as Class 2 or Class 3 indicates that some information on describing the potential for contamination is available for that survey unit. The data collection recommendations are modified to account for the information already available, and the statistical tests are performed on the data collected during the final status survey.
As previously stated, the conservative assumption that an area receive a classification of Class 1 is only applied to impacted sites. The HSA (described in Chapter 3) is used to provide an initial classification for the site of impacted or non-impacted based on existing data and professional judgment.
2.5.3 Design Considerations for Small Areas of Elevated Activity
Scanning surveys are typically used to identify small areas of elevated activity. The size of the area of elevated activity that the survey is designed to detect affects the DCGLEMC , which in turn determines the ability of a scanning technique to detect these areas. Larger areas have a lower DCGLEMC and are more difficult to detect than smaller areas.
The percentage of the survey unit to be covered by scans is also an important consideration. 100% coverage means that the entire surface area of the survey unit has been covered by the field of view of the scanning instrument. 100% scanning coverage provides a high level of confidence
August 2000 2-29 MARSSIM, Revision 1

Overview of the Radiation Survey and Site Investigation Process
that all areas of elevated activity have been identified. If the available information concerning the survey unit provides information demonstrating that areas of elevated activity may not be present, the survey unit may be classified as Class 2 or Class 3. Because there is already some level of confidence that areas of elevated activity are not present, 100% coverage may not be necessary to demonstrate compliance. The scanning survey coverage may be adjusted based on the level of confidence supplied by the existing data. If there is evidence providing a high level of confidence that areas of elevated activity are not present, 10% scanning coverage may meet the objectives of the survey. If the existing information provides a lower level of confidence, the scanning coverage may be adjusted between 10 and 100% based on the level of confidence and the objectives of the survey. A general recommendation is to always err to minimize the decision error. In general, scanning the entire survey unit is less expensive than finding areas of elevated activity later in the survey process. Finding such areas will lead to performing additional surveys due to survey unit misclassification.
Another consideration for scanning surveys is the selection of scanning locations. This is not an issue when 100% of the survey unit is scanned. Whenever less than 100% of the survey unit is scanned, a decision must be made on what areas are scanned. The general recommendation is that when large amounts of the survey unit are scanned (e.g., >50%), the scans should be systematically performed along transects of the survey unit. When smaller amounts of the survey unit are scanned, selecting areas based on professional judgment may be more appropriate and efficient for locating areas of elevated activity (e.g., drains, ducts, piping, ditches). A combination of 100% scanning in portions of the survey unit selected based on professional judgement and less coverage (e.g., 20-50%) for all remaining areas may result in an efficient scanning survey design for some survey units.
2.5.4 Design Considerations for Relatively Uniform Distributions of Contamination
The survey design for areas with relatively uniform distributions of contamination is primarily controlled by classification and the requirements of the statistical test. Again, the recommendations provided for Class 1 survey units are designed to minimize the decision error. Recommendations for Class 2 or Class 3 surveys may be appropriate based on the existing information and the level of confidence associated with this information.
The first consideration is the identification of survey units. The identification of survey units may be accomplished early (e.g., scoping) or late (e.g., final status) in the survey process, but must be accomplished prior to performing a final status survey. Early identification of survey units can help in planning and performing surveys throughout the RSSI Process. Late identification of survey units can prevent misconceptions and problems associated with reclassification of areas based on results of subsequent surveys. The area of an individual survey unit is determined based on the area classification and modeling assumptions used to develop the DCGLW. Identification of survey units is discussed in Section 4.6.
MARSSIM, Revision 1 2-30 August 2000

Overview of the Radiation Survey and Site Investigation Process
Another consideration is the estimated number of measurements to demonstrate compliance using the statistical tests. Section 5.5.2 describes the calculations used to estimate the number of measurements. These calculations use information that is usually available from planning or from preliminary surveys (i.e., scoping, characterization, remedial action support).
The information needed to perform these calculations is: 1) acceptable values for the probabilities of making Type I (�) or Type II (�) decision errors, 2) the estimates of the measurement variability in the survey unit (�s ) and the reference area (�r ) if necessary, and 3) the shift (�).
MARSSIM recommends that site-specific values be determined for each of these parameters. To assist the user in selecting site-specific values for decision error rates and �, MARSSIM recommends that an initial value be selected and adjusted to develop a survey design that is appropriate for a specific site. An arbitrary initial value of one half the DCGLW is selected for the lower bound of the gray region. This value is adjusted to provide a relative shift (�/�) value between one and three as described in Section 5.5.2. For decision error rates a value that minimizes the risk of making a decision error is recommended for the initial calculations. The number of measurements can be recalculated using different decision error rates until an optimum survey design is obtained. A prospective power curve (see Appendix D, Section D.6 and Appendix I, Section I.9) that considers the effects of these parameters can be very helpful in designing a survey and considering alternative values for these parameters, and is highly recommended.
To ensure that the desired power is achieved with the statistical test and to account for uncertainties in the estimated values of the measurement variabilities, MARSSIM recommends that the estimated number of measurements calculated using the formulas in Section 5.5.2.2 and 5.5.2.3 be increased by 20%. Insufficient numbers of measurements may result in failure to achieve the DQO for power and result in increased Type II decision errors, where survey units below the release criterion fail to demonstrate compliance.
Once survey units are identified and the number of measurements is determined, measurement locations should be selected. The statistical tests assume that the measurements are taken from random locations within the survey unit. A random survey design is used for Class 3 survey units, and a random starting point for the systematic grid is used for Class 2 and Class 1 survey units.
2.5.5 Developing an Integrated Survey Design
To account for assumptions used to develop the DCGLW and the realistic possibility of small areas of elevated activity, an integrated survey design should be developed to include all of the design considerations. An integrated survey design combines a scanning survey for areas of
August 2000 2-31 MARSSIM, Revision 1

Overview of the Radiation Survey and Site Investigation Process
elevated activity with random measurements for relatively uniform distributions of contamination. Table 2.2 presents the recommended conditions for demonstrating compliance for a final status survey based on classification.
Table 2.2 Recommended Conditions for Demonstrating Compliance Based on Survey Unit Classification for a Final Status Survey
Survey Unit Classification
Statistical Test
Elevated Measurement Comparison
Sampling and/or Direct Measurements
Scanning
Impacted Class 1 Yes Yes Systematic 100% Coverage
Class 2 Yes Yes Systematic 10-100% Systematic
Class 3 Yes Yes Random Judgmental
Non-Impacted No No No None
Random measurement patterns are used for Class 3 survey units to ensure that the measurements are independent and meet the requirements of the statistical tests. Systematic grids are used for Class 2 survey units because there is an increased probability of small areas of elevated activity. The use of a systematic grid allows the decision maker to draw conclusions about the size of any potential areas of elevated activity based on the area between measurement locations, while the random starting point of the grid provides an unbiased method for determining measurement locations for the statistical tests. Class 1 survey units have the highest potential for small areas of elevated activity, so the areas between measurement locations are adjusted to ensure that these areas can be identified by the scanning survey if the area of elevated activity is not detected by the direct measurements or samples.
The objectives of the scanning surveys are different. Scanning is used to identify locations within the survey unit that exceed the investigation level. These locations are marked and receive additional investigations to determine the concentration, area, and extent of the contamination.
For Class 1 areas, scanning surveys are designed to detect small areas of elevated activity that are not detected by the measurements using the systematic grids. For this reason, the measurement locations and the number of measurements may need to be adjusted based on the sensitivity of the scanning technique (see Section 5.5.2.4). This is also the reason for recommending 100% coverage for the scanning survey.
Scanning surveys in Class 2 areas are also performed primarily to find areas of elevated activity not detected by the measurements using the systematic pattern. However, the measurement
MARSSIM, Revision 1 2-32 August 2000

Overview of the Radiation Survey and Site Investigation Process
locations are not adjusted based on sensitivity of the scanning technique, and scanning is only performed in portions of the survey unit. The level of scanning effort should be proportional to the potential for finding areas of elevated activity: in Class 2 survey units that have residual radioactivity close to the release criterion a larger portion of the survey unit would be scanned, but for survey units that are closer to background scanning a smaller portion of the survey unit may be appropriate. Class 2 survey units have a lower probability for areas of elevated activity than Class 1 survey units, but some portions of the survey unit may have a higher potential than others. Judgmental scanning surveys would focus on the portions of the survey unit with the highest probability for areas of elevated activity. If the entire survey unit has an equal probability for areas of elevated activity, or the judgmental scans don’t cover at least 10% of the area, systematic scans along transects of the survey unit or scanning surveys of randomly selected grid blocks are performed.
Class 3 areas have the lowest potential for areas of elevated activity. For this reason, MARSSIM recommends that scanning surveys be performed in areas of highest potential (e.g., corners, ditches, drains) based on professional judgment. This provides a qualitative level of confidence that no areas of elevated activity were missed by the random measurements or that there were no errors made in the classification of the area.
Note that the DCGL itself is not free of error. The assumptions made in any model used to develop DCGLs for a site should be examined carefully. The results of this examination should determine if the use of site-specific parameters result in large changes in the DCGLs, or whether a site-specific model should be developed to obtain DCGLs more relevant to the exposure conditions at the site. Appendix D, Section D.6 provides additional information about the uncertainty associated with the DCGL and other considerations for developing an integrated survey design using the DQO Process.
2.6 Flexibility in Applying MARSSIM Guidance
Section 2.5 describes an example that applies the performance-based guidance presented in Section 2.3 and Section 2.4 to design a survey for a site with specific characteristics (i.e., surface soil and building surface contamination). Obviously this design cannot be uniformly applied at every site with radioactive contamination, so flexibility has been provided in the form of performance-based guidance. This guidance encourages the user to develop a site-specific survey design to account for site-specific characteristics. It is expected that most users will adopt the portions of the MARSSIM guidance that apply to their site. In addition, changes to the overall survey design that account for site-specific differences would be presented as part of the survey plan. The plan should also demonstrate that the extrapolation from measurements performed at specific locations to the entire site or survey unit is performed in a technically defensible manner.
August 2000 2-33 MARSSIM, Revision 1

Overview of the Radiation Survey and Site Investigation Process
Where Section 2.5 describes the development of a generic survey design that will be applicable at most radiation sites, this section describes the flexibility available within the MARSSIM for designing a site-specific survey design. Alternate methods for accomplishing the demonstration of compliance are briefly described and references for obtaining additional information on these alternate methods are provided.
2.6.1 Alternate Statistical Methods
MARSSIM encourages the use of statistics to provide a quantitative estimate of the probability that the release criterion is not exceeded at a site. While it is unlikely that any site will be able to demonstrate compliance with a dose- or risk-based regulation without at least considering the use of statistics, MARSSIM recognizes that the use of statistical tests may not always provide the most effective method for demonstrating compliance. For example, MARSSIM recommends a simple comparison to an investigation level to evaluate the presence of small areas of elevated activity in place of complicated statistical tests. At some sites a simple comparison of each measurement result to the DCGLW, to demonstrate that all the measurement results are below the release criterion, may be more effective than statistical tests for the overall demonstration of compliance with the regulation provided an adequate number of measurements are performed.
MARSSIM recommends the use of nonparametric statistical tests for evaluating environmental data. There are two reasons for this recommendation: 1) environmental data is usually not normally distributed, and 2) there are often a significant number of qualitative survey results (e.g., less than MDC). Either one of these conditions means that parametric statistical tests may not be appropriate. If one can demonstrate that the data are normally distributed and that there are a sufficient number of results to support a decision concerning the survey unit, parametric tests will generally provide higher power (or require fewer measurements to support a decision concerning the survey unit). The tests to demonstrate that the data are normally distributed generally require more measurements than the nonparametric tests. EPA provides guidance on selecting and performing statistical tests to demonstrate that data are normally distributed (EPA 1996a). Guidance is also available for performing parametric statistical tests (NRC 1992, EPA 1989a, EPA 1994b, EPA 1996a).
There are a wide variety of statistical tests designed for use in specific situations. These tests may be preferable to the generic statistical tests recommended in MARSSIM when the underlying assumptions for these tests can be verified. Table 2.3 lists several examples of statistical tests that may be considered for use at individual sites or survey units. A brief description of the tests and references for obtaining additional information on these tests are also listed in the table. Applying these tests may require consultation with a statistician.
MARSSIM, Revision 1 2-34 August 2000

Table 2.3 Examples of Alternate Statistical Tests August 2000
2-35 M
AR
SSIM, R
evision 1
Nudquhdv
ne sgd Q`ch`shnm Rtqudx `mc Rhsd Hmudrshf`shnm Oqnbdrr
Alternate Tests
Probability Model Assumed Type of Test Reference Advantages Disadvantages
Alternate 1-Sample Tests (no reference area measurements)
Student’s t Test Normal Parametric test for Ho: Mean < L
Guidance for Data Quality Assessment, EPA QA/G-9, p. 3.2-2.
Appropriate if data appears to be normally distributed and symmetric.
Relies on a non-robust estimator for µ and �. Sensitive to outliers and departures from normality.
t Test Applied To Logarithms
Lognormal Parametric test for Ho: Median < L
Guidance for Data Quality Assessment, EPA QA/G-9, p. 3.2-2
This is a well- known and easy-to-apply test. Useful for a quick summary of the situation if the data is skewed to right.
Relies on a non-robust estimator for �. Sensitive to outliers and departures from lognormality.
Minimum Variance Unbiased Estimator For Lognormal Mean
Lognormal Parametric estimates for mean and variance of lognormal distribution
Gilbert, Statistical Methods for Environmental Pollution Monitoring, p. 164, 1987.
A good parametric test to use if the data is lognormal.
Inappropriate if the data is not lognormal.
Chen Test Skewed to right, including Lognormal
Parametric test for Ho: Mean > 0
Journal of the American Statistical Association (90), p.767, 1995.
A good parametric test to use if the data is lognormal.
Applicable only for testing Ho: “survey unit is clean.” Survey unit must be significantly greater than 0 to fail. Inappropriate if the data is not skewed to the right.

Table 2.3 (continued) MA
RS
SIM, R
evision 1 2-36
August 2000
Nudquhdv
ne sgd Q`ch`shnm Rtqudx `mc Rhsd Hmudrshf`shnm Oqnbdrr
Alternativ e Tests
Probability Model Assumed Type of Test Reference Advantages Disadvantages
Alternate 1-Samples Tests (no reference area measurements)
Bayesian Approaches Varies, but a family of probability distributions must be selected.
Parametric test for Ho: Mean < L
DeGroot, Optimal Statistical Decisions, p. 157, 1970.
Permits use of subjective “expert judgment” in interpretation of data.
Decisions based on expert judgment may be difficult to explain and defend.
Bootstrap No restriction Nonparametric. Uses resampling methods to estimate sampling variance.
Hall, Annals of Statistics (22), p. 2011-2030, 1994.
Avoids assumptions concerning the type of distribution.
Computer intensive analysis required. Accuracy of the results can be difficult to assess.
Lognormal Confidence Intervals Using Bootstrap
Lognormal Uses resampling methods to estimate one-sided confidence interval for lognormal mean.
Angus, The Statistician (43), p. 395, 1994.
Nonparametric method applied within a parametric lognormal model.
Computer intensive analysis required. Accuracy of the results can be difficult to assess.

Table 2.3 (continued) August 2000
2-37 M
AR
SSIM, R
evision 1
Nudquhdv
ne sgd Q`ch`shnm Rtqudx `mc Rhsd Hmudrshf`shnm Oqnbdrr
Alternativ e Tests
Probability Model Assumed Type of Test Reference Advantages Disadvantages
Alternate 2-Sample Tests (reference area measurements are required)
Student’s t Test Symmetric, normal Parametric test for difference in means Ho: µx < µy
Guidance for Data Quality Assessment, EPA QA/G-9, p. 3.3-2
Easy to apply. Performance for non-normal data is acceptable.
Relies on a non-robust estimator for �, therefore test results are sensitive to outliers.
Mann-Whitney Test No restrictions Nonparametric test difference in location Ho: µx < µy
Hollander and Wolfe, Nonparametric Statistical Methods, p. 71, 1973.
Equivalent to the WRS test, but used less often. Similar to resampling, because test is based on set of all possible differences between the two data sets.
Assumes that the only difference between the test and reference areas is a shift in location.
Kolmogorov-Smirnov
No restrictions Nonparametric test for any difference between the 2 distributions
Hollander and Wolfe, Nonparametric Statistical Methods, p. 219, 1973.
A robust test for equality of two sample distributions against all alternatives.
May reject because variance is high, although mean is in compliance.
Bayesian Approaches
Varies, but a family of probability distributions must be selected
Parametric tests for difference in means or difference in variance.
Box and Tiao, Bayesian Inference in Statistical Analysis, Chapter 2, 1973.
Permits use of “expert judgment” in the interpretation of data.
Decisions based on expert judgement may be difficult to explain and defend.
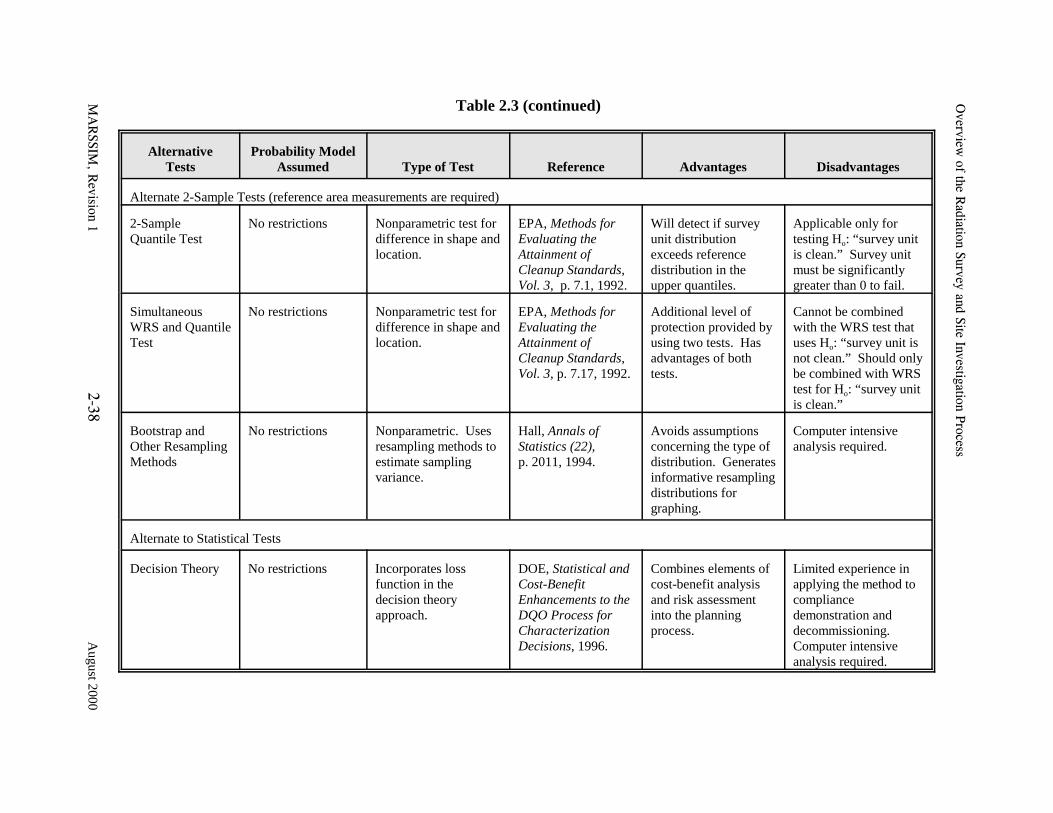
Table 2.3 (continued) Nudquhdv
ne sgd Q`ch`shnm Rtqudx `mc Rhsd Hmudrshf`shnm Oqnbdrr
L@
QRRHL
+ Qduhrhnm 0
Alternativ e Tests
Probability Model Assumed Type of Test Reference Advantages Disadvantages
Alternate 2-Sample Tests (reference area measurements are required)
2-Sample Quantile Test
No restrictions Nonparametric test for difference in shape and location.
EPA, Methods for Evaluating the Attainment of Cleanup Standards, Vol. 3, p. 7.1, 1992.
Will detect if survey unit distribution exceeds reference distribution in the upper quantiles.
Applicable only for testing Ho: “survey unit is clean.” Survey unit must be significantly greater than 0 to fail.
Simultaneous WRS and Quantile Test
No restrictions Nonparametric test for difference in shape and location.
EPA, Methods for Evaluating the Attainment of Cleanup Standards, Vol. 3, p. 7.17, 1992.
Additional level of protection provided by using two tests. Has advantages of both tests.
Cannot be combined with the WRS test that uses Ho: “survey unit is not clean.” Should only be combined with WRS test for Ho: “survey unit is clean.”
Bootstrap and Other Resampling Methods
No restrictions Nonparametric. Uses resampling methods to estimate sampling variance.
Hall, Annals of Statistics (22), p. 2011, 1994.
Avoids assumptions concerning the type of distribution. Generates informative resampling distributions for graphing.
Computer intensive analysis required.
Alternate to Statistical Tests
Decision Theory No restrictions Incorporates loss function in the decision theory approach.
DOE, Statistical and Cost-Benefit Enhancements to the DQO Process for Characterization Decisions, 1996.
Combines elements of cost-benefit analysis and risk assessment into the planning process.
Limited experience in applying the method to compliance demonstration and decommissioning. Computer intensive analysis required.
1,27 A
ugust 2000

Nudquhdv ne sgd Q`ch`shnm Rtqudx `mc Rhsd Hmudrshf`shnm Oqnbdrr
2.6.2 Alternate Null Hypothesis
The selection of the null hypothesis in MARSSIM is designed to be protective of human health and the environment as well as consistent with current methods used for demonstrating compliance with regulations. MARSSIM also acknowledges that site-specific conditions (e.g., high variability in background, lack of measurement techniques with appropriate detection sensitivity) may preclude the use of the null hypothesis that the survey unit is assumed to be contaminated. Similarly, a different null hypothesis and methodology could be used for different survey units (e.g., Class 3 survey units). NUREG 1505 (NRC 1997b) provides guidance on determining when background variability might be an issue, designing surveys based on the null hypothesis that the survey unit concentration is indistinguishable from the concentration in the reference area, and performing statistical tests to demonstrate that the survey unit is indistinguishable from background.
2.6.3 Integrating MARSSIM w ith Other Survey Designs
2.6.3.1 Accelerated Cleanup Models
There are a number of approaches designed to expedite site cleanups. These approaches can save time and resources by reducing sampling, preventing duplication of effort, and reducing inactive time periods between steps in a cleanup process. Although Section 2.4 describes the RSSI Process recommended in MARSSIM as one with six principal steps, MARSSIM is not intented to be a serial process that would slow site cleanups. Rather, MARSSIM supports existing programs and encourages approaches to expedite site cleanups. Part of the significant emphasis on planning in MARSSIM is meant to promote saving time and resources.
There are many examples of accelerated cleanup approaches. The Superfund Accelerated Cleanup Model (SACM), which includes a module called integrated site assessment, has as its objectives increased efficiency and shorter response times (EPA 1992f, EPA 1993c, EPA 1997b).
Sandia National Laboratories (SNL) uses the Observational Approach. This approach uses an iterative process of sample collection and real-time data evaluation to characterize a site. This process allows early field results to guide later data collection in the field. Data collection is limited to only that required for selecting a unique remedy for a site.5
At DOE’s Hanford Site, the parties to the Tri-Party Agreement negotiated a method to implement the CERCLA process in order to 1) accelerate the assessment phase, and 2) coordinate RCRA
5 Information on the Observational Approach recommended by Sandia National Laboratories is available on the internet at http://www.em.doe.gov/tie/strechar.html.
Cdbdladq 0886 2-39 L@QRRHL

Nudquhdv ne sgd Q`ch`shnm Rtqudx `mc Rhsd Hmudrshf`shnm Oqnbdrr
and CERCLA requirements whenever possible, thereby resulting in cost savings. The Hanford Past Practice Strategy (HPPS) was developed in 1991 to accelerate decisionmaking and initiation of remediation through activities that include maximizing the use of existing data consistent with data quality objectives.6
The adaptive sampling programs at the Environmental Assessment Division (EAD) of Argonne National Laboratory quantitatively fuse soft data (for example, historical records, aerial photos, nonintrusive geophysical data) with hard sampling results to estimate contaminant extent, measure the uncertainty associated with these estimates, determine the benefits from collecting additional samples, and assist in siting new sample locations to maximize the information gained.7
2.6.3.2 Superfund Soil Screening Guidance
The goal of the Soil Screening Guidance (EPA 1996b, EPA 1996c) is to help standardize and accelerate the evaluation and cleanup of contaminated soils at sites on the National Priorities List (NPL) designated for future residential land use. The guidance provides a methodology for calculating risk-based, site-specific, soil screening levels for chemical contaminants in soil that may be used to identify areas needing further investigation at NPL sites. While the Soil Screening Guidance was not developed for use with radionuclides, the methodology used is comparable to the MARSSIM guidance for demonstrating compliance using DCGLs. The Soil Screening Guidance assumes that there is a low probability of contamination, and does not account for small areas of elevated activity. These assumptions correlate to a Class 3 area in MARSSIM. Because the Soil Screening Guidance is designed as a screening tool instead of a final demonstration of compliance, the specific values for decision error levels, the bounds of the gray region, and the number and location of measurements are developed to support these objectives. However, MARSSIM guidance can be integrated with the survey design in the Soil Screening Guidance using this guidance as an alternate MARSSIM survey design.
The Soil Screening Guidance survey design is based on collecting samples, so scan surveys and direct measurements are not considered. To reduce analytical costs the survey design recommends compositing samples and provides a statistical test for demonstrating compliance. Compositing samples provides an additional source of uncertainty and prevents the detection of small areas of elevated activity.
6 Information on the Hanford Past Practice Strategy is available on the internet at http://www.bhi-erc.com/map/sec5.html.
7 Information on the Argonne National Laboratory adaptive sampling programs can be obtained on the internet at http://www.ead.anl.gov/~web/newead/prgprj/proj/adaptive/adaptive.html.
L@QRRHL 2-40 Cdbdladq 0886