chandrapur2 | p a g e action plan for control of air pollution at chandrapur 1.1 preamble...
TRANSCRIPT

1 | P a g e
ACTION PLAN FOR CONTROL OF AIR POLLUTION IN
NON-ATTAINMENT CITIES OF MAHARASHTRA
CHANDRAPUR
MAHARASHTRA POLLUTION CONTROL BOARD
KALPATARU POINT, 3rd Floor,
Sion-Matunga Scheme Rd. No.8, Opp. Sion Circle, Sion (East),
Mumbai-400 022.
2 | P a g e
Action Plan for Control of
Air Pollution at Chandrapur
1.1 Preamble
Chandrapur, the headquarters of the district to which it gives its name, is the largest city in
the district and is situated 761 feet above sea level in 19° 57’ north latitude and 79° 22’ east
longitude. The city is located on the confluence of rivers “Erai” and “Zarpat”. The northern
portion of the city is at high elevation and southern at low as per topographical map i.e. 56m.
The old city is surrounded by walls. These walls were called as “Parkots”. These walls have
four gates to enter and leave the city namely Jatpura gate, Pathanpura gate, Bimba gate and
Anchaleshwar gate. Also the hane four windows to enter and leave the old city namely
ChorKhidki, Vithobakhidki, Hanuman khidki and Bagadkhidki. The Gaontideo Nala is
originating from the upland of CSTPS. The Macchinala is originating from upland of
Ranger college. This Nalah is merge in the tank “RamalaTalao” located in the heart of city.
The north south length of Chandrapur city is about 10 Km and East West is 7 Km. In the north
of city, there is a dam made on river Erai, having the capacity of 20 million cubic meters.
Foundation stone of the city was laid down by Khandkya Ballalshah (Veer Shah), a Gond
king.
1.2 Climate
The climate of the district can be classified as tropical hot climate with range of temperature
through out of year. Primarily there are two prominent seasons in the district- the very hot
summer and moderate winter. The summer months are very hot and prolonged while winter
is short and mild. The monsoon season starts immediately after summer till late September.
The southwest monsoon brings lots of rainfall during rainy season and there is no draught
prone area in the district.
The temperature starts decreasing from the month of October. December is the coldest
month Mean maximum temperatures during December is 28.2°C and mean minimum is
11.6° C. The southern part is comparatively warmer than the north. This ranges between
29.6° to 14.6° C. The lowest recorded temperature is in the north is 3° C and 8° C in the
south. The daily mean temperature starts rising from the month of February and may is the
peak summer month when maximum temperature goes upto 43° C and minimum
temperature is 28° to 29° C. In severe heat condition temperature raises up to 47° C. However
temperature starts blackening after may due to onset of monsoon, which last from June to
September when it is hot and humid.

3 | P a g e
The prominent wind direction is from south to north. In summer the wind direction is from east
to south and monsoon from south to east. During winter, the wind direction changes from north
to east frequently is characterized by blowing of wild and violent winds heralding the approach
of hot season which last till middle of June. The district receives rainfall from the south west
monsoon from June to September. The average rainfall is about 1200 mm. The rainfall generally
increases as one goes from the west to the east.
1.3 Population
As per provincial reports of Census of India, population of Chandrapur city in 2011 was 3,20,379
of which males and females numbers were 1,64,085 and 1,56,294 respectively (Table 1.1 and
1.2).
Table 1.1 Demographics of Chandrapur city
Chandrapur City Total Male Female
Population 3,20,379 1,64,085 1,56,294
Table 1.2 Annual population growth rate for Chandrapur city
S.No. Year Population Decadal
Variation
Percentage
variation
Annual growth
rate (%)
1. 1951 42795 -- -- --
2. 1961 58146 15351 35.87 3.587
3. 1971 84424 26278 45.19 4.519
4. 1981 146754 62330 73.83 7.383
5. 1991 226105 79351 54.07 5.407
6. 2001 289450 71507 31.62 3.162
7. 2011 320379 31586 10.91 1.091
1.4 Road Transport
Public transport in Chandrapur is carried by bus system and personal vehicles. Chandrapur is
connected to many cities in Maharashtra by MSRTC buses. The buses ply to Nagpur, Gondia,
Amrawati, Akola, Shirdi, Aurangabad, Nanded, Pune and Hyderabad. Chandrapur is located on
main New Delhi - Chennai and New Delhi - Hyderabad - Bangalore railway line of the Indian
Railways. It comes under Nagpur division of the Central Railway. Total number of registered
motor vehicles till 2011 is 281764 as per RTP statistic data. It is increasing at the rate of 10.7%
annually. Table 1.3 presents the annual growth of vehicles of Chandrapur.
Table 1.4 Annual growth rate of registered vehicles in Chandrapur City
Code
Name of
Regional office
2006
2007
2008
2009
2010
2011
% increase
or decrease over year
34
Chandrapur
177225
195954
214619
232787
254524
281764
10.7
Source: Transport Commissioners Office, Report on Vehicle Growth and other Statistics of Maharashtra

4 | P a g e
1.5 Development and Infrastructure
Chandrapur is stated as an industrial center since 1981 when MAHAGENCO established
Chandrapur Super Thermal Power Station at Durgapur. Till 1970s the town had major industries
like Ballarpur Paper Mill, ACC cement factory and Maharashtra Elektrosmelt Limited (MEL).
There were four five underground mines which were administered by WCL.
With the start of open cast coal-mines (WCL) many small scale enterprises, especially hotel and
transport emerged. Manikgarh Cement and L&T cement were set up during the same period. The
town, infact the district witnessed industrialization in the second phase during 1990s with the
expansion of CSTPS. Many more WCL open cast mines, Maratha Ambuja Cement, Murali Agro
(Cement) industries, Ultra Tech and number of iron plants came up in the district.
There is a ‘Co-operative Industrial Estate’ along Mul road, which comes in the extended limit of
the town. The gross area of this estate is 21.04 Ha and it provides total 101 plots for Industrial
units, out of 54 plots are in function. The Maharashtra Industrial Development Corporation has
also established industrial estate along Ghugus road, outside the Municipal limits. It has 172 plots
out of which 42 plots are in function.
In addition, there are multiple service sector activities such as domestic work, auto-rickshaw
driving, street-vending, scavenging, running small grocery shops, selling vegetables and other
agricultural products road side, working as porter in the railway stations as well as in the
collieries and other industries which requires loading and unloading of heavy materials to be
done.
Thus transition of Chandrapur district from a background district to an industrial district has
completely determined the economic profile of the town. Chandrapur district is further set to
become a major investment destination in future. 38 industrial houses in the country have signed
Industrial Entrepreneurs Memorandum with Government of India. These industries include
various power generation industries, coal-mines, cement industries etc. Some industries are also
for the extraction of other less exploited minerals such as fero-mangenese, copper and limestone.
The total estimate divestment in the district by these industrial setups is to the tune of 44,771
crore. The district is set to become a major power hub in the future with expansion plans of
CSTPS and other newly commencing power stations.
Chandrapur is developing rapidly towards wide spectrum of sector as Power plants, roads,
industries, etc. Thus it can be observed that due to this rapid industrial, vehicular and

5 | P a g e
infrastructural growth, city is facing a great air pollution problem which in turn is increasing the
stress on available environmental resources.
2.0 Data Analysis and Emission Inventory
2.1 Monitoring Air Quality
Monitoring of air quality in the region has been going on for a considerable period.Many of the
stations have been collecting data through manual system and some industries also monitor the
ambient air through their manual/automatic stations.
2.1.1 Past Air Quality Monitoring NAMP Data Analysis
The trend analysis of ambient air quality of Chandrapur at NAMP and SAMP stations were done.
There are 18 NAMP station from Maharashtra, and 6 from Chandrapur. SO2, NOx and RSPM
and SPM have been identified for regular monitoring at all the locations. The monitoring of
pollutants is carried out for 24 hours (4-hourly sampling for gaseous pollutants and 8-hourly
sampling for particulate matter) with a frequency of twice a week, to have 104 observations in a
year. Air quality monitoring NAMP database of Chandrapur over the 10-year period i.e., from
2004 to 2013, was taken from MPCB website. Analysis on NAMP database was carried for
assessing air quality trends by annual and monthly means for past 10 years.
2.1.2 Land based point Measurements by IIT Bombay and NEERI
PM2.5 and PM10 samples were collected for monsoon and winter seasons at NAMP station (SRO
Nagarparishad Office Building) in Chandrapur. Standard operating procedures (SOP’s) for acid
digestion of Teflon and Quartz membrane filter paper handling from USEPA (1999) was referred
and adopted for the present work. (Source: CPCB 2010; USEPA., 1999). Weighing was
performed on an electro-microbalance with 1μg sensitivity. Unexposed and exposed Teflon and
Quartz membrane filters were kept in desiccators for a minimum of 24 hours prior to weighing.
The weighing was performed in a temperature and humidity controlled room (25 oC ± 2 oC and
40 % ± 5% RH).
Airmetrics (ARM) MiniVolTM portable air samplers were used in this study to sample PM2.5 and
PM10. The sampler can operate on battery for 24 hours continuously and has electronic panel for
programming the sample durations. The samplers are impactor based and operate at an air flow
rate of 5.0 lpm. The mass of samples collected over specified duration (8 hour) includes the main
considerations like adequate mass collection for gravimetric analyses and prevention of

6 | P a g e
overloading of the filter that could lead to excessive pressure drop across the filter. Standard
laboratory procedures were followed while handling the filter papers. The flow rate of 5.0 lpm
was found to be suitable as it would collect about 2.4 m3 of air in 8 hours, and the total mass of
sample would be in the range of 240 to 360 µg (Goyal, 2008). The instruments were calibrated
for flow rates and mass collection of PM before the sampling.
2.2 Emission Inventory
All sectors emission inventories have been prepared with a view to prepare source data in terms
of loads, areas (gridwise) and any variation for the area. These data sets are useful for air
pollution modeling and forecasting purposes.
2.2.1 Mining and Industrial sectors
Emission inventory estimates are determined based on considering available industrial activity
information, emission factors and scientific judgment. For the current study, Industrial and
Mining Google documents were prepared with all the required information for emission
inventory development for Chandrapur. The Google documents were sent to all the industries
and mining sectors present in the Chandrapur. Overall 25 mining industries and 15 commercial
industries emission inventory information were received through the Google document for
calculating emission loads of each industrial sectors. Simultaneously emission inventory
information for industries also collected from the industries’ environmental status reports and
documents those are laid in MPCB Chandrapur.
In Chandrapur there are three main categories of industries. Power plants, Cement industries and
Sponge iron industries. Other than those are coal mines thus coal as a fuel is majorly used in
industries, Paper, Textiles, Food and Feeds and Multi organics.
Sr. No. Industrila Unit in Area
Fuel Unit Consumption
PM(T/year) CO (T/yesr)
SO2 (T/year)
Nox (T/year)
1 CTPS Unit 3-7 Coal MT/day 36000 21024 3942 256887 72270
2 CTPSUnit 3-7 FO kL/day 70 38 15 481 169
3 CTPSUnit 8-9 Coal MT/day 12630 7376 1383 90125 25355
4 CTPSUnit 8-9 LDO kL/day 12.5 7 3 86 30
5 Indian Explossives
Coal Mt/day 80 47 9 571 161

7 | P a g e
2.2.2 Line source /Vehicular emissions
A vehicular emission inventory was prepared for the city of Chandrapur. The purpose of this
emission inventory was to calculate the amounts of particulate matter (PM), carbon monoxide
(CO), hydrocarbons (HC) and nitrogen oxides (NOx) emanating from vehicular sources. The
following sections provide a detailed description of the methodology that was adopted for
preparation of this emission inventory and the results that were obtained.
2.2.2.1 Methodology
The methodology for calculating vehicular emissions included the following steps:
a) Selection of important junctions within Chandrapur
b) Division of Chandrapur city into 1 km x 1 km grids
c) Selection of vehicle categories for conducting traffic counts
d) Implementation of traffic counts at selected junctions
e) Extrapolation of traffic count data to understand vehicular movement during the entire
day
f) Calculation of road lengths in each grid
g) Calculation of emission loads (grid-wise and overall) by use of emission factors
The following sections will details each of the above steps.
2.2.2.2 Selection of appropriate junctions for conducting traffic counts
Selection of appropriate locations for conducting traffic counts is a crucial step in development
of a vehicular emission inventory. Locations were selected based on the following criteria:
a) Junctions formed by state highways within Chandrapur city limits
b) Junctions formed by major arterial roads within Chandrapur city limits
c) Locations within the city which are known to have high vehicular movement
In all, eleven (11) junctions were selected for conducting the traffic counts (Table 2.1). Figure
2.1 below shows the locations of these eleven junctions.
Table 2.1 : Junction Numbers and their Respective Names
Serial
number
Junction
number Junction name
1 1 MSETCL Square*
2 2 PadoliChowk
3 3 Warora Naka
4 4 SP College Square*
5 5 Mingaon Junction*

8 | P a g e
6 6 Bengali Camp
7 7 Jatpura Gate
8 8 City Police Station Square*
9 9 Anchaleshwar Gate
10 10 Pathanpura Gate
11 11 GEC Junction*
12 12 Near Carnival Cinemas
13 13 Chandrapur Durgapur Road
14 14 DOC Road & DRC Road (Near Ayyapa Mandir)
15 15 Devada Datala Road
16 16 Entry point of MSH 6
17 17 On Nagpur Road (Near Tristar Hotel)
18 18 Wadgaon Road & Akashwani Road
19 19 Post Office Circle
20 20 MSH 6 & Ramnagar Road
* May not be the actual names. These were the names used by us for
reference as it is normally known in the area.
Figure 2.1: Grid map and vehicle counting locations of Chandrapur city

9 | P a g e
Table 2.2: Details of tentative vehicle counting locations in Chandrapur city
Vehicle count location Road names
V1 Entry point at Chandrapur-Nagpur road
V2 Entry point at MSH 6
V3 Near Chandrakhar Swami mandir
V4 On Nagpur Road near Tristar hotels
V5 Wadgaon road and Akashwani road
V6 MSH 6 and Ramnagar road
V7 Near carnival cinemas
V8 Bengali camp chowk
V9 Doc road and DRC road (near ayyappa mandir)
V10 Chandrapur Durgapur road
V11 Devada Datala road
2.2.2.3 Grid overlay
A 2 km x 2 km was overlaid over the map since the emission loads from vehicles were to be
represented in a grid-format.
2.2.2.4 Selection of vehicle categories for traffic count
It was decided that the vehicles be classified into the following 6 categories:
2 wheelers
3 wheelers
4- Wheelers
Buses/Trucks
2.2.2.4 Traffic counts at selected junctions
Timings
Traffic counts were conducted at the locations shown in Figure 2.1 and Table 1. It was decided
that the counts be conducted in three (3) different shifts, representative of peak and non-peak
times with regards to vehicular movement.
10 | P a g e
Location:
The traffic count at every location was carried out in three shifts, namely between 8 AM to 12
noon (representing morning peak hours), 1.00 PM to 4.0 PM (representing non-peak hours) and
5.0 PM to 7.0 PM (representing evening peak hours).
Traffic counting procedure
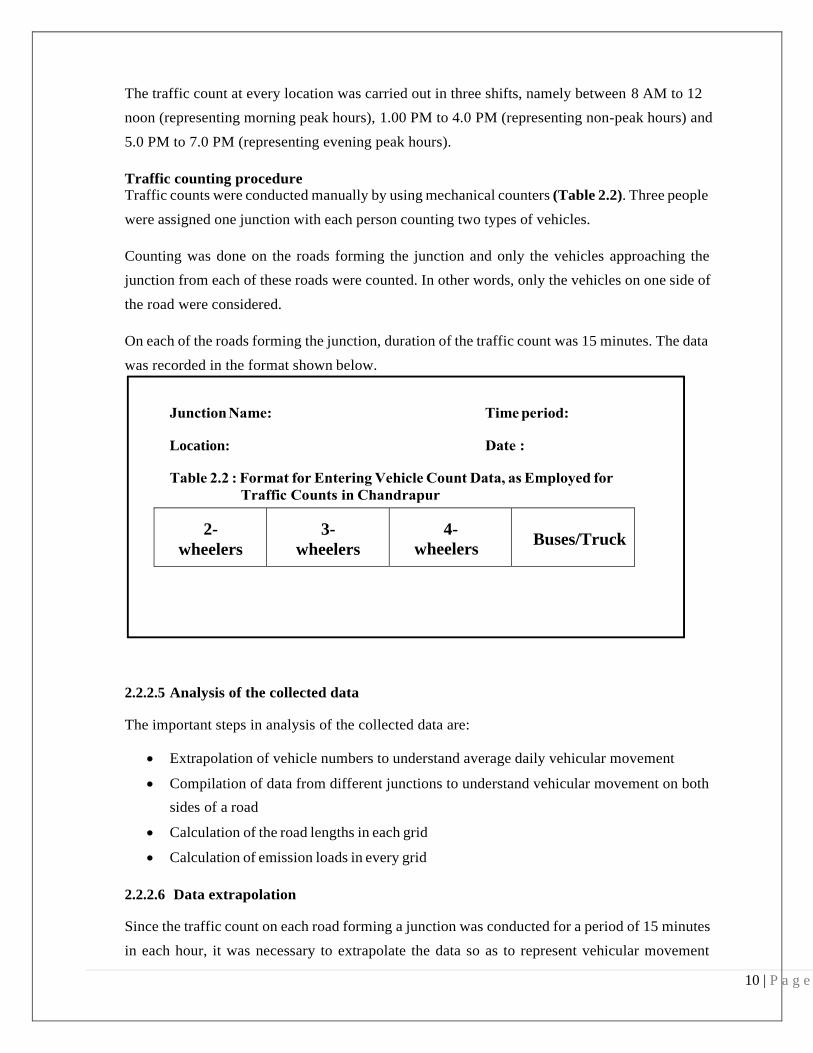
Traffic counts were conducted manually by using mechanical counters (Table 2.2). Three people
were assigned one junction with each person counting two types of vehicles.
Counting was done on the roads forming the junction and only the vehicles approaching the
junction from each of these roads were counted. In other words, only the vehicles on one side of
the road were considered.
On each of the roads forming the junction, duration of the traffic count was 15 minutes. The data
was recorded in the format shown below.
2-
wheelers
3-
wheelers
4-
wheelers
Buses/Truck
2.2.2.5 Analysis of the collected data
The important steps in analysis of the collected data are:
Extrapolation of vehicle numbers to understand average daily vehicular movement
Compilation of data from different junctions to understand vehicular movement on both
sides of a road
Calculation of the road lengths in each grid
Calculation of emission loads in every grid
2.2.2.6 Data extrapolation
Since the traffic count on each road forming a junction was conducted for a period of 15 minutes
in each hour, it was necessary to extrapolate the data so as to represent vehicular movement

11 | P a g e
occurring throughout the day.
The first step in this extrapolation was calculation of number of vehicles approaching the
junction from each road in one hour. This was done by multiplying the traffic count on each road
by a factor of 4 since the actual vehicle count duration was 15 minutes.
Hourly vehicle count for Road A = No. of vehicles counted in 15 minutes X 4 – (1)
The total duration of vehicle movement through the day was considered to be from 7.30 AM
(0700 hours) to 10.30 PM (2230 hours), divided into 3 slots, each of 5 hour duration as shown
below:
Morning peak hours: 8.00 AM to 12.00 PM
Afternoon non-peak hours: 1.0 PM to 4.0 PM
Evening peak hours: 5.00 PM to 7.00 PM
To calculate the number of vehicles travelling on one side of the road for a 5 hour slot, the
average hourly count for that slot was multiplied by a factor of 5. Following the same procedure
for the morning, afternoon and evening slots and summing up all of them, the total number of
vehicles travelling on the side of a road approaching a junction in 15 hours was calculated.
Morning slot one side vehicle count for Road A = Hourly vehicle count for Road A
during morning slot x 5 – (2)
Afternoon slot one side vehicle count for Road A = Hourly vehicle count for Road A during
afternoon slot x 5 – (3)
Evening slot one side vehicle count for Road A = Hourly vehicle count for Road A during
evening slot x 5 – (4)
)
Total number of vehicles travelling on one side of Road A during 15 hours
= (Morning slot one side vehicle count for Road A) + (Afternoon slot one side vehicle count for
Road A) + (Evening slot one side vehicle count for Road A) – (5)
2.2.2.7 Compilation of Extrapolated Data
The number of vehicles approaching a junction in 15 hours as calculated earlier represents the
vehicular movement only on one side of a road. To obtain the number of vehicles on both sides
of the road, data from other junctions from which vehicles approached the junction currently
under consideration was used.
An important assumption in this procedure was that there is no dispersion of vehicles between 2
junctions i.e. the number of vehicles leaving Junction A is equal to the number of vehicles
approaching adjacent Junction B. By applying this procedure at every junction, the number of
vehicles on both sides of any particular was calculated.

12 | P a g e
2.2.2.8 Grid-wise road length measurement
After calculation of vehicular movement on both sides of each of the roads considered for traffic
count, the lengths of these roads in each grid was calculated. This was done by using the Distance
Measurement Tool available in Google Maps.
2.2.2.9 Calculation of emission loads in every grid
Emission factors available from Automotive Research Association of India (ARAI) were used
for estimating the PM, CO, HC and NOx emission loads in every grid for each vehicle category.
These emission factors are shown in the Table 2.3:
Table 2.3 : Emission factors used for calculating vehicular emissions in Chandrapur
Vehicle categories PM
(g/km)
CO
(g/km)
HC
(g/km)
NOx
(g/km)
2 wheelers 0.015 0.93 0.65 0.35
3 wheelers 0.045 1.37 2.53 0.2
4 wheelers (Petrol) 0.004 1.3 0.24 0.2
4 wheelers (Diesel)
0.06 0.3 0.26 0.49
Buses 1.075 3.97 0.26 6.77
(Source: Automotive Research Association of India)
For calculating the amount of specified pollutant resulting from a particular grid, the following
equation was used:
Pollutant load (g/day) from vehicle category Y for grid X1
= [No. of vehicles of category Y on Road#1 within grid X1x Length of Road#1 within grid X1 in
km x Emission factor for 2 wheelers in g/km] + [No. of vehicles of category Y on Road#2 within
grid X1 x Length of Road#2 within grid X1 in km x Emission factor for 2 wheelers in g/km] +
……… - (7)
For example, if Grid no. G6 is considered, the PM emissions resulting from 2 wheelers would be
calculated as below:
PMG6 2M (g/day) = (NG6 2M)X (LG6)X (EFPM 2M) - (8)
Where,
NG6 2W is the number of 2 wheelers travelling on road in Grid G6
LG6 is the length of the road in Grid G6 (km)
EFPM 2wis the emission factor for particulate matter from 2 wheelers (g/km)

13 | P a g e
By calculating the PM, CO, HC and NOx emissions from each category of vehicle in the grid
and considering that the traffic conditions are at their peak for 300 days in a year, the total annual
load for each individual pollutant in that grid can be calculated. By application of a similar
procedure to every grid which contains roads which are under consideration, we can arrive at a
grid-wise emission inventory.
2.2.2.10 Results and discussions
Following the methodology outlined earlier, the vehicle category-wise emissions for PM, CO,
HC and NOx were calculated. Table 2.4 shows the results obtained for the same in Tonnes/year.
Similarly, category-wise contributions to each of PM, CO, HC and NOx were calculated. Figures
2.3 to 2.6 show the results obtained for the same.
Table 2.4 : Vehicle category-wise pollution loads for Chandrapur
PM2.5 (T/Y)
CO (T/Y) HC (T/Y)
Nox (T/Y)
2 wheeler 3.36 208.56 145.77 78.49
3 Wheeler 2.34 71.17 131.43 10.39
4 wheeler 56.72 209.46 13.72 357.19
Bus/Truck 45.27 167.17 10.95 285.08
Total 107.69 656.37 301.87 731.15
(all values are in Tonnes/year)
PM2.5 (T/Y), 2 wheeler, 3.36,
3%
PM2.5 (T/Y), 3 Wheeler, 2.34,
2%
PM2.5 (T/Y), 4 wheeler, 56.72,
53%
PM2.5 (T/Y), Bus/Truck, 45.27, 42%
PM2.5 (T/Y)
2 wheeler
3 Wheeler
4 wheeler
Bus/Truck

14 | P a g e
Figure 2.3 Contribution of various vehicle categories to PM emissions
Figure 2.4 Contributions of various vehicle categories to CO emissions
Figure 2.5 Contributions of various vehicle categories to HC emissions
HC (T/Y), 2 wheeler,
145.77, 48%
HC (T/Y), 3 Wheeler,
131.43, 43%
HC (T/Y), 4 wheeler, 13.72,
5%
HC (T/Y), Bus/Truck, 10.95, 4%
HC (T/Y)
2 wheeler
3 Wheeler
4 wheeler
Bus/Truck
CO (T/Y), 2 wheeler,
208.56, 32%
CO (T/Y), 3 Wheeler, 71.17,
11%
CO (T/Y), 4 wheeler,
209.46, 32%
CO (T/Y), Bus/Truck,
167.17, 25%
CO (T/Y)
2 wheeler
3 Wheeler
4 wheeler
Bus/Truck

15 | P a g e
Figure 2.6 Contributions of various vehicle categories to NOx emissions
2.2.3 Area/Distributed Sources
An area source emission inventory estimates the pollutant loads emanating from several small
but numerous individual sources in a specific geographic area and which cannot be included
under line nor point sources. Some of the most important area sources include:
Cooking, water heating and other activities in households which require use of fuels
Hotels, restaurants, bakeries, street vendors and other assorted food establishments which
require use of fuels for cooking
Crematoria
Open burning of trash
Construction activities
Street sweeping operations
Re-suspension of road dust due to vehicular movement
Generators used for domestic and commercial purposes
Area sources considered for the purpose of emission inventory for Chandrapur city are:
Cooking operations in households: Slum and non-slum
Cooking operations in hotels, restaurants and bakeries
Crematoria
Trash burning
Construction activities
Street sweeping operations
Nox (T/Y), 2 wheeler, 78.49,
11% Nox (T/Y), 3 Wheeler, 10.39,
1%
Nox (T/Y), 4 wheeler,
357.19, 49%
Nox (T/Y), Bus/Truck,
285.08, 39%
Nox (T/Y)
2 wheeler
3 Wheeler
4 wheeler
Bus/Truck

16 | P a g e
The following sections will detail the methodology adopted for estimating emissions from each
of the above mentioned sources and the results thus obtained.
2.2.3.1 Cooking operations in non-slum households
A survey of 20 non-slum household areas was conducted in randomly selected areas of
Chandrapur to understand which fuels are being used in these households and their quantities.
The results of the survey indicated that Liquefied Petroleum Gas (LPG) was the fuel of choice in
all the households and that each household used about 1 cylinder per month on average.
Emission calculations were done ward-wise. Data with regards to number of households and the
number of slum households in each of the thirty-three (33) wards in Chandrapur was obtained
from the Chandrapur Municipal Corporation (CMC). It was assumed that LPG use remains same
for all 365 days of the year. The results obtained are presented in Table 2.5.
Table 2.5 : Emissions from use of LPG in non-slum households in Chandrapur
(in Tonnes/year) PM SO2 NOX CO
LPG 0.88 3.52 7.03 2.21
2.2.3.2 Cooking operations in slum households
A survey of 55 slum households was conducted, spread over five areas within the city which
were known to have significant slum populations, so as to understand which fuels are being used
in these households and their quantities.
From the results of the survey, it was seen that a majority of the slum households used a
combination of fuels such as LPG, wood, coal and kerosene. LPG in conjunction with wood was
found to be the most common combination with 38.18% of respondents relying on this particular
combination.

17 | P a g e
Figure 2.7: Average Consumption of kerosene, Coal and Wood
as Obtained from survey results
For the purpose of emission load estimation, it was decided to round off the average
consumption values so obtained.
Table 2.6 : Emission factors for LPG, wood, Coal and Kerosene
PM (g/kg
or Lit) SO2 (g/kg
or Lit) NOx
(g/kg or Lit)
CO (g/kg or
Lit)
HC (g/kg or
Lit)
LPG 2.1 0.4 1.8 0.252 0.072
Wood 17.3 0.2 1.3 126.3 114.5 Coal 20 13.3 3.99 24.92 0.5
Kerosene 0.61 4 2.5 62 19 (Source: Pune Air Quality Management: Emission inventory and source apportionment studies, 2009-10)
Table 2.7 : Emissions from fuel use in slum households (T/Year)
PM SO2 NOx CO
LPG 0.0076 0.0014 0.0065 0.0009 0.0003
Wood 11 0.13 0.83 80.49 72.97
Coal 20.20 13.43 4.03 25.17 0.51
2.2.3.3 Emissions from crematorium
In order to calculate the emissions due cremation of dead bodies, data was obtained from
Chandrapur Municipal Corporation with regard to the number of deaths that occurred between
2016 and December 2017 (Table 2.8 and 2.9).

18 | P a g e
Table 2.8 : Number of deaths in Chandrapur city between 2016 and 2017 Total deaths
January 2016 – December 2017
3148
(Source: Chandrapur Municipal Corporation)
Table 2.9 : Quantities of wood, cow dung and kerosene required per body Quantities
Wood (kg/body) 300
Cow dung (kg/body) 3
Kerosene (litres/body) 4 (Source: Pune Air Quality Management: Emission inventory and source apportionment studies, 2009-10)
The results thus obtained are presented in Table 2.10.
Table 2.10: Emissions resulting from crematoria (T/year) PM10 PM
2.5 SO2 NOx C
O HC
Wood 8.17 5.55 0.09 0.61 60 54
Kerosene 0.012 0.0075 0.025 0.016 0.390 0.120
2.2.3.5 Emissions from trash burning
In order to estimate emissions resulting from open burning of trash in Chandrapur city, data with
regards to amount of trash collected per day in each of the 33 wards was obtained from
Chandrapur Municipal Corporation. Since there was no data available on how much trash is
actually burnt in each ward, it was decided to consider that 5% of the trash collected is burnt in
the open.
The emission factors for trash burning are presented in Table 2.11.
Table 2.11 : Emission factors for trash burning PM10 SO2 NOx CO
Emissions
(kg/MT) 8 0.5 3 42
(Source: United States Environmental Protection Agency)
2.2.3.6 Emissions from construction activities
Construction activities are a source of particulate matter emissions. Emission factors developed
by the United States Environmental Protection Agency (USEPA) estimate the amount of PM10
emissions that occur as a result of construction and demolition activities. According to USEPA,
0.11 tons of PM10 emissions occur per acre of construction activity per month i.e. 0.11 tons
PM10/Acre-Month. This emission factor is applicable to residential construction activities only.

19 | P a g e
In order to estimate PM10 emissions from construction activities in Chandrapur, two year data
was obtained from the Chandrapur Municipal Corporation regarding building permits
sanctioned from 2016-2018. 369 building permits were given in this period. Since data regarding
area of construction for each of these permitted buildings was obtained from RERA registration
data, as per the suggestion of CMC officials and 12 months as the average duration of each of the
construction activities. Results thus obtained are presented in Table 2.12.
Table 2.12 : Emissions from Construction Activities
Year Number of major
Construction Permits Sq. M Acre PM10 (T/year)
2016-17 284 189953 43.17 56.98
2017-18 147 30496 7.74 10.22
2.2.3.7 Emissions from street sweeping operations
Street sweeping is associated with particulate matter emissions due to re-suspension of the
settled dust on the streets. Manual street sweeping is carried out once a week in all 33 wards of
Chandrapur city, as per the information obtained from CMC officials.
Emission factor for PM emissions from street sweeping = 637.47 g/km (AP 42, USEPA)
In order to calculate these emissions, data with regards to the total road length in each ward that
is manually swept every week was obtained and it was assumed that these operations were
carried out for 45 weeks annually. The PM emissions resulting from street sweeping are
presented in Table 2.13.
Table 2.13: Emissions from street sweeping PM (Tonnes/year)
Streetsweeping 16.27
2.2.3.8 Emissions from bakeries
Data was collected from 4 major bakeries operating in Chandrapur. Out of these 4, one was using
electrical ovens. The emissions of this bakery were not considered. 2 bakeries used about 80 kg
of wood per day, one of which also used about 1 LPG cylinder of 19 kg every 2 days. The
remaining one used about 15 kg of wood per day and 15 litres of diesel per day. Emission
factors used for LPG and wood are shown in Table 2.14 below.
Table 2.14 : Emission factors for LPG and wood PM10
(g/day) PM2.5
(g/day) SO2
(g/day) NOx
(g/day) CO
(g/day) HC(g/da
y)
LPG 0.06 0.05 0.01 0.05 0.01 0.00 Wood 0.10 0.07 0.0012 0.01 0.74 0.67

20 | P a g e
2.2.3.9 Emissions from hotels and restaurants
There are 6 major hotels in Chandrapur. It was possible to obtain data regarding fuels used
and their quantities from 4 of these hotels. One of the hotels refused to provide the required
data whereas for the other one, the person who could provide the necessary data could not be
contacted.
It was found that 3 of the 4 hotels surveyed each used one 19 kg cylinder per day whereas
the other one used three 19 kg cylinders per day. For the remaining 2 hotels from which data
could not be obtained, one of them was regarded as using one 19 kg cylinder per day whereas
the other one was regarded as using three 19 kg cylinders per day. This consideration was
based on the size of the hotels and the data obtained for hotels of similar size was considered
to be applicable for the 2 remaining hotels.
With regards to wood use, 4 of the 6 hotels were found to be using 5 kg of wood per day, one
hotel used 10 kg of wood per day while the remaining one used 80 kg of wood per day.
None of the hotels were found to be using coal for cooking activities. Using the emission
factors shown in Table 2.15, the emissions from each hotel were calculated. The cumulative
emission from hotels have been presented in Table 2.16.
Table 2.15 : Emission factors for LPG and Wood PM
(g/day) PM2.5 (g/day)
SO2 (g/day)
NOx (g/day)
CO (g/day)
H|C (g/day)
LPG 0.74 0.50 0.14 0.63 0.09 0.02
Coal 0.53 0.35 0.11 0.66 0.01
Table 2.16 : Emissions from hotels (tonnes/year) PM SO2 NOx CO
LPG (Tonnes/year) 0.15 0.028 0.12 0.017
Coal (Tonnes/year) 0.59 0.0077 0.054 4.42

21 | P a g e
Emissions from Muncipal Solid Waste
Chandrapur city is producing 143 T/day of Municipal Solid Waste out of which about 130 T/day is collected.
There is a small composting plant for biodegrable portion of MSW on pilot level. There is a portion of solid
waste estimated to be burnt. By 2020 estimated generation of MSW will be 170 T/day.
MSW Emissions Quantity PM2.5 PM10 CO SOx
T/d MT/Year T/Year T/Year T/Year T/Year
Solid waste Generation 143.93 52534
Complete Treatment 25 9125
Not collected /as it is 13.93 5084
Burnt (20%) 1017 6 8.95 46.98 0.56
As it is 37308

22 | P a g e
3. AMBIENT AIR QUALITY DATA
3.1 Data for Monthly average reading recorded at Chandrapur
Station Name Year Month Average
of SO2
Average
of NOx
Average
of
RSPM
50 40 60
Ghuggus
2017
Apr 4 22 335
May 4 28 293
Jun 4 9 193
Jul 4 33 163
Aug 4 21 201
Sep 5 26 242
Oct 4 29 119
Nov 4 32 339
Dec 4 26 417
2018
Jan 4 25 433
Feb 5 31 438
Mar 4 28 496
Chandrapur - MIDC
2017
Apr 4 23 80
May 4 31 69
Jun 4 12 55
Jul 4 34 91
Aug 4 25 42
Sep 4 28 50
Oct 4 30 55
Nov 4 32 95
Dec 4 31 112
2018
Jan 5 21 72
Feb 5 32 83
Mar 5 34 87
Chandrapur - SRO
MPCB
2017
Apr 4 31 123
May 4 33 88
Jun 4 28 66
Jul 4 33 59
Aug 4 22 60
Sep 4 26 61
Oct 4 31 110
Nov 4 33 91
Dec 4 32 108
2018
Jan 4 24 109
Feb 5 29 90
Mar 4 33 127
Tadali MIDC 2017 Apr 4 22 129

23 | P a g e
May 4 27 190
Jun 4 21 71
Jul 4 33 163
Aug 4 23 70
Sep 4 26 80
Oct 4 31 124
Nov 4 32 105
Dec 4 25 123
2018
Jan 4 21 90
Feb 5 32 85
Mar 4 32 67
Ballarshah
2017
Apr 4 24 160
May 4 34 150
Jun 4 17 93
Jul 4 34 121
Aug 4 25 104
Sep 4 28 94
Oct 4 29 99
Nov 4 34 176
Dec 4 29 171
2018
Jan 5 24 133
Feb 5 35 138
Mar 4 33 147
Rajura
2017
Apr 4 24 206
May 4 34 282
Jun 4 10 112
Jul 4 34 158
Aug 4 23 177
Sep 4 28 140
Oct 4 31 129
Nov 4 32 164
Dec 4 26 222
2018
Jan 4 26 199
Feb 5 24 233
Mar 4 26 196
Civil Lines,
Chandrapur 2017
Apr 12 33 197
May 12 25 165
Jun 9 21 74
Jul 9 26 56
Aug 9 24 58
Sep 9 24 75

24 | P a g e
Oct 9 24 116
Nov 9 24 134
Dec 10 25 164
2018
Jan 11 26 154
Feb 10 25 133
Mar 10 25 176
Station Name Year Average of SO2 Average of NOX Average of
RSPM
50 40 60
Ghuggus
04-05 18 28 80
05-06 21 31 131
06-07 31 39 139
07-08 36 53 186
08-09 34 54 172
09-10 46 32 180
10-11 23 24 211
11-12 18 21 206
12-13 11 13 207
13-14 9 19 174
14-15 9 14 140
15-16 4 17 180
16-17 4 25 242
17-18 4 26 298
Chandrapur -
MIDC
04-05 25 37 110
05-06 26 37 130
06-07 38 41 123
07-08 37 50 125
08-09 34 53 148
09-10 63 31 141
10-11 25 25 150
11-12 21 35 131
12-13 14 17 105
13-14 18 27 60
14-15 14 30 70
15-16 7 26 75
16-17 4 34 77
17-18 4 28 74
Chandrapur -
SRO MPCB
04-05 23 34 107
05-06 20 30 116
06-07 31 38 130

25 | P a g e
07-08 30 46 161
08-09 26 45 159
09-10 41 35 74
10-11 21 27 92
11-12 18 31 66
12-13 14 17 75
13-14 10 26 66
14-15 7 23 87
15-16 4 20 70
16-17 4 28 84
17-18 4 29 90
Tadali MIDC
09-10 29 19 169
10-11 18 20 216
11-12 16 18 151
12-13 9 13 173
13-14 7 16 195
14-15 7 15 112
15-16 4 20 58
16-17 4 23 79
17-18 4 27 110
Ballarshah
09-10 32 35 122
10-11 17 32 129
11-12 19 24 123
12-13 9 19 192
13-14 10 37 135
14-15 10 48 130
15-16 4 28 123
16-17 4 32 108
17-18 4 29 132
Rajura
09-10 34 37 119
10-11 17 19 115
11-12 16 19 159
12-13 9 21 196
13-14 10 31 145
14-15 7 17 144
15-16 4 17 127
16-17 4 27 156
17-18 4 27 185
Chandrapur
CAAQMS
16-17 13 19 69
17-18 8 19 64
Civil Lines ,
Chandrapur 17-18 10 25 125

26 | P a g e
4. Monitoring Mechanism for Implementation
The aforesaid action plan shall be implemented by Maharashtra State Pollution Control Board with
coordination of concern departments/stakeholders.
5.Implementation status
The Chief Secretary, Govt. of Maharashtra to convene the meetings with different concerned
departments and direct for compliance of directions for implementation of air quality of Amravati.
The Principal Secretary, Environment and Forest, Govt. of Maharashtra to also convene the meeting
for follow up of the aforesaid directions. The Maharashtra Pollution control Board continuously
conducted the meetings with all stakeholders for preparation of comprehensive action plan for city
and its implementation.

27 | P a g e
6.0 Action Plan
Development of Action Plan for Control of Air Pollution in Non-attainment Cities
Plan for Chandrapur
Sr.N
o
Source
group
Control
option Action
Expecte
d
reducti
on &
impacts
Technic
al
feasibili
ty
Requirem
ent of
financial
resources
Implementati
on period
(short/mid/lo
ng-term)
Time target
for
implementat
ion
Responsib
le
agency(ies
)
Any
other
informati
on
1 (i
) Vehicle
emission
Launch
extensive
drives against
polluting
vehicles for
ensuring
strict
compliance
Monthly
special drive
at toll plaza
for random
checking of
PUC for
vehicles.
Medium Feasible Short Term 3 Month R.T.O.
No heavy
duty vehicle
traffic
through city
Promting use
of by-pass
road ro
avoid entry
of heavy
vehicles in
the
city.Major
haul trucks
with heavy
loads should
not pass
through the
main city.
The plan
being made
shold be
implemented
in next 1-1.5
years.
High Feasible
Can be
estimated
for Roads
as well as
manpower
Mid term 9-12 months RTO and
PWD

28 | P a g e
Overloading
of vehicles to
be stopped
Online
checking
when
vehicles
leave
industries
with their
guarantee
that the
vehicle is
not carrying
more
material than
its
designated
loads. All
commercial
vehicle
carrying
coal, cement
etc must get
tagged with
user
industries.
High Feasible Short temrs 3-4 months
RTO,
Concenred
Industry,
WCL
Regular I &
M
Programme
Set up a
mechanism
of Inspection
and
Maintenance
programme
for all
vehicles in
the district
through
automated
system
assessment.
The I &M
center shall
also test all
Medium Feasible Mid term 12-15 months RTO
29 | P a g e
vehicles for
their in built
emission
tests.
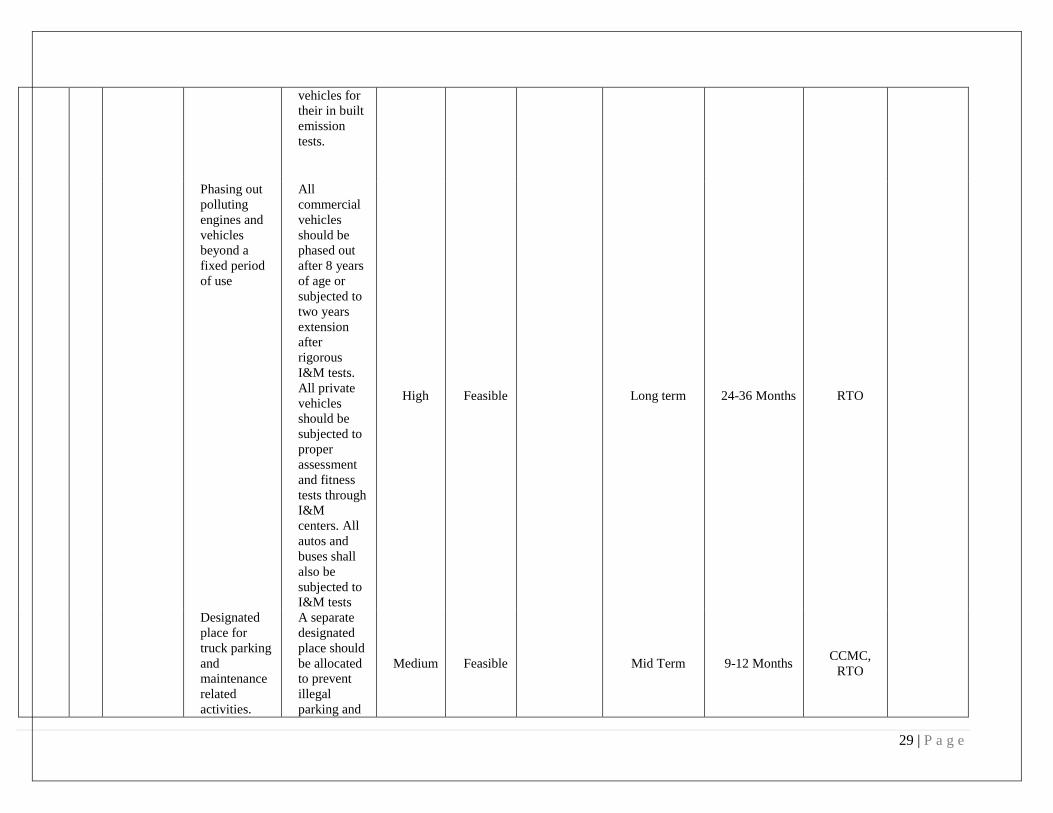
Phasing out
polluting
engines and
vehicles
beyond a
fixed period
of use
All
commercial
vehicles
should be
phased out
after 8 years
of age or
subjected to
two years
extension
after
rigorous
I&M tests.
All private
vehicles
should be
subjected to
proper
assessment
and fitness
tests through
I&M
centers. All
autos and
buses shall
also be
subjected to
I&M tests
High Feasible Long term 24-36 Months RTO
Designated
place for
truck parking
and
maintenance
related
activities.
A separate
designated
place should
be allocated
to prevent
illegal
parking and
Medium Feasible Mid Term 9-12 Months CCMC,
RTO

30 | P a g e
repair shops
on the roads
and kerb
side.
Public
Transport
Improvement
Public
transport
improvemen
t needs to be
undertaken
on urgent
basis. There
is a need of
at least 75
additional
buses in
addition to
industrial
transport
systems
being made
available by
industries for
its workers.
Medium Feasible Mid Term 9-12 Months CCMC
Pilots on
Bioswale for
dust
reduction
Bioswale
design and
implementati
on for
roadside
improvemen
t of dust
control
Medium Feasible Mid Term 9-12 Months CCMC
Road Design
for improved
traffic
management
Current road
design
makes the
kerb side
open and
that leads to
illegal
Medium Feasible Long Term 18-24 Months CCMC

31 | P a g e
movement of
vehicles.
The future
road and
kerb side
design must
take into
account the
method
wherein the
kerbside is
completely
made
inaccessible
for vehicle
plying. This
would help
prevent dust
entering on
to the road.
Road
dust and
C&D
Reduction in
Fugutive dust
at
Construction
Site
Propoer
onsite
provisions
for avoiding
dust created
such as
sprinkling of
water. Use
of RMC
instead of
insitu
concreting
Medium Feasible Long term 12-24 months CCMC
Road Dust
reduction
Blacktoppin
g of metaled
Roads
including
pavement of
Road
shoulders
Medium Feasible Long term 12-24 months CCMC,
PWD

32 | P a g e
Concrete
Roads
More
Concrete
Roads to be
made in city
with
planning of
over 50%
main roads
to be
concretized.
Medium Feasible Long term 12-24 months City
Engineer,
CCMC,
PWD
Solid
waste
/open
burning
Segrigation and Collection of MSW
About 143 T/day of MSW. Segrigation is initiated. Segrigation of waste need to followed strictly
High Feasible Short term 3-6 months City
Engineer,
CCMC
Composting Composting plant capacity 50 MT/day.
Medium Feasible Short term 3-6 months City
Engineer,
CCMC
House hold
composting
to
community
level
In each wards some house hold composting pits are created in un-scientific manner, a guideline to be issued by Municipal Corporation for house hold
Medium Feasible Mid term 6-9 months Public,
Ward
members,
CCMC

33 | P a g e
composting plants.
Bio-gas Plant at MC
For segregated waste installation of Bio gas plant of capacity of 30-50 MT/day may be considered
High Feasible Mid term 6-9 months CCMC
Community level Bio-gas plants
Bio-gas plants for vegetable markets, function halls etc.
High Feasible Mid term 6-9 months Communit
ies as well
as CCMC
Cremator
ia
Improved
fuels for
Creatoria
currently
either wood
or kerosene
is used, use
of electric
fired
crematoria to
be promoted
Low Feasible Mid term 6-9 months CCMC
Beckeries
, Eat-
outs,
Hotels
and
Restaura
nts
Cleaner Fuel
for Hotels
and Dhabas
Hotels and
dhabas need
to be
educated and
compulsorily
asked to use
LPG for its
cooking
Medium Feasible Mid term 6-9 months MPCB,
CCMC

34 | P a g e
purposes.
Registration
of all eatouts
Improved
combustion
devices
Use of the
efficient
tandoors can
be made
compulsary
for
restaurants
and hotels.
Improved
ovens for
beckeries
Medium Feasible Mid term 6-9 months MPCB,
CCMC
Househol
d
Promotion of
LPG to stop
use of coal
Increased
use of LPG
through
promotional
scheme.
Actions for
prohibiting
use of low
calorific
fuels in the
house holds
Medium Feasible Mid term 6-9 months CCMC,
Industries
through
CSR
Improved
Chulahs
for
unavoidable
low calorific
value fuel
usage
providing
smoke-less
chulhas
(certified by
MNRE) for
a limited
period till
Medium Feasible Mid term 6-9 months CCMC,
Industries
through
CSR,
MPCB

35 | P a g e
use of such
fuels is
completely
stopped.
Reduction of
the trash and
MSW
burning
Prohibitory
actions for
stopping
open air
trash burning
and
awareness
programmes
Medium Feasible Mid term 6-9 months MPCB
Industry
Power
Plants
Use of high
quality coal
Power plants
in
Chandrapur
region
should be
allowed to
use high
quality Coal
(low ash).
The units
connected
with the low
stack height
should not
be allowed
to operate on
high ash
containing
coal. The
other units
of CSTPL
can use high
ash coal,
however,
their ESP
system need
to meet the
High Feasible
/ with
challeng
es
Mid term 9-12 months MPCB,
CTPS and
other poer
plants
36 | P a g e
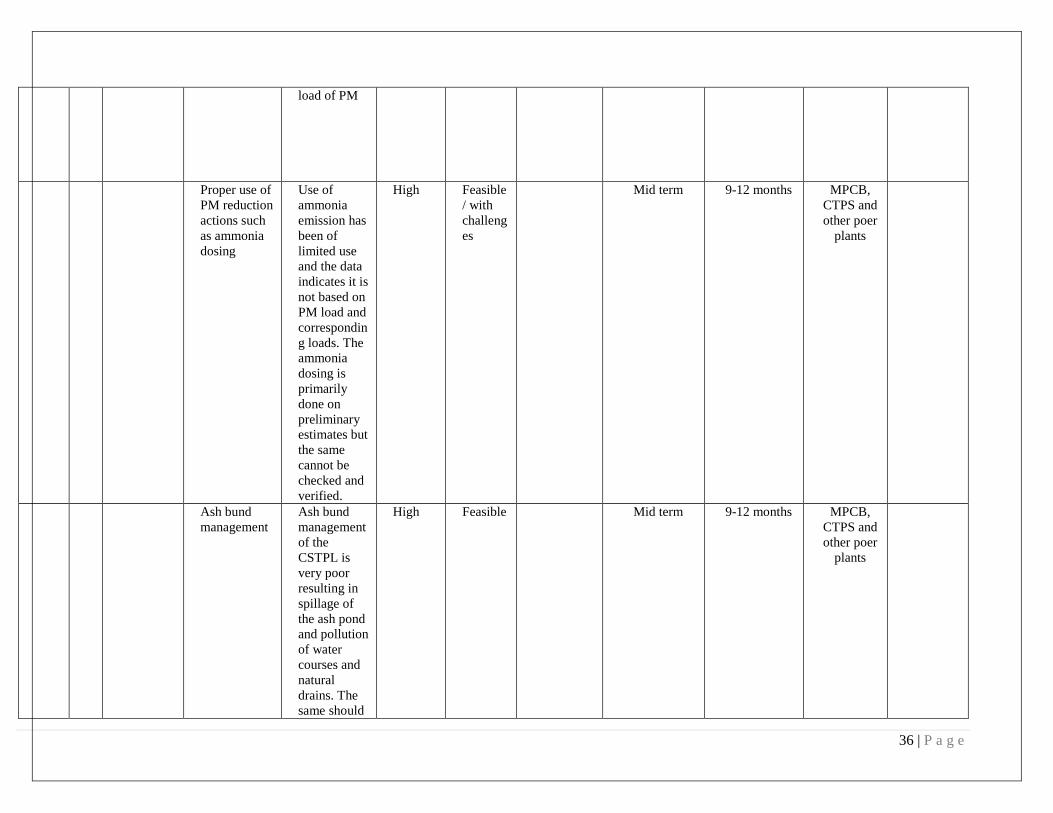
load of PM
Proper use of
PM reduction
actions such
as ammonia
dosing
Use of
ammonia
emission has
been of
limited use
and the data
indicates it is
not based on
PM load and
correspondin
g loads. The
ammonia
dosing is
primarily
done on
preliminary
estimates but
the same
cannot be
checked and
verified.
High Feasible
/ with
challeng
es
Mid term 9-12 months MPCB,
CTPS and
other poer
plants
Ash bund
management
Ash bund
management
of the
CSTPL is
very poor
resulting in
spillage of
the ash pond
and pollution
of water
courses and
natural
drains. The
same should
High Feasible Mid term 9-12 months MPCB,
CTPS and
other poer
plants

37 | P a g e
be
completely
revamped as
minor repair
and
maintenance
carried out
after every
incident has
not been
very
effective.
Data
triangulation
The air
pollution
control units,
data
triangulation
method
through
audit process
wherein all
data sources
and
measuremen
ts are seen
together to
assess the
efficiencies
High Feasible Mid term 9-12 months MPCB,
CTPS and
other poer
plants
Industry
Mining
Industries
Use of Dust
suppression
Chemicals
for Loading
of
vehicles/wag
ons
Trucks
carrying coal
must be
loaded
within the
carriage area
and after it, a
chemical
dust
suppression
spray should
be carried
out to
High Feasible Mid term 9-12 months MPCB,
RTO,
WCL

38 | P a g e
prevent dust
particle
getting
blown away
due to wind
effect during
transportatio
n. This
technique
can also be
used on
railway
wagons after
the laoding
has been
done. There
is a need to
undertake a
pilot for a
particular
mine area
completely
and compare
the same
with other
mine, so that
it can be
replicated.
Coverted
trucks for
coal
transporation
The average
trucks
carrying the
coal, must be
converted
gradually to
closed
system so
that on road
spillage can
be avoided.
These
High Feasible Mid term 9-12 months MPCB,
RTO,
WCL

39 | P a g e
designs need
to be
implemented
at the
earliest as
the open
truck with
tarpaulin
cover has
limited
efficiencies.
Over Burden
Management
Implementat
ion of
DGMS
rules. for
New dumps.
High Feasible Mid term 9-12 months MPCB,
WCL
Stablization
of Old OB
dumps
For old
dumps, slope
stabilization
and Platation
Medium Feasible Mid term 9-12 months MPCB,
WCL
Industry
Cement
Industries
Air Pollution
Control
Equipment
Assessment
The air
pollution
control units
assessment
should be
carried out
with proper
data
triangulation
method
through
audit process
wherein all
data sources
and
measuremen
ts are seen
together to
High Feasible Short term 3-6 months MPCB,
Cement
Industry

40 | P a g e
assess the
efficiencies.
This
assessment
should be
carried out
through third
party and
appointed
independentl
y by MPCB
to avoid any
conflict of
interest.
Air Quality
Prediction
A fine grid
air quality
management
model for
cement
should be set
up to predict
PM and
NOx, based
on real term
emission
which shall
come from
its data feed
of stacks
emissions.
This model
should be
aligned with
MPCB and a
public
domain to
share the
information
to all.
High Feasible Short term 3-6 months MPCB,
Cement
Industry

41 | P a g e
Material
Handling for
Dust
reduction
Fugitive dust
emission
control could
be achieved
through site
specific
analysis and
assessment
of each
plant.
Proper
Loading
unloading
and specific
parking
areas for
trucks
High Feasible Short term 3-6 months MPCB,
Cement
Industry
Road
Cleaning
Once every
week, all the
internal haul
roads as also
2 km radius
roads should
be cleaned
either
mechanicall
y or through
water
sprinkler.
Since the
region is
water scarce,
they can use
treated
domestic
water
High Feasible Short term 3-6 months Cement
Iny

42 | P a g e