2 population - oxfordshire insight · 2.2 population mid-2016 population estimate as of mid-2016,...
TRANSCRIPT

JSNA 2018
Data has been updated in this version Data has been reviewed and is unchanged
Final version April 2018 page 15
= +
2 Population This section describes the changing size and profile of Oxfordshire’s population.
2.1 Population – key findings
This section highlights the key messages from the review of data on population (data sources and research references are provided with the detailed data in the remainder of this chapter).
• As of mid-2016, the estimated total population of Oxfordshire was 683,200.
• Over the ten-year period, 2006 and 2016, there was an overall growth in the population of Oxfordshire of 52,100 people (+8.3%), similar to the increase across England (+8.4%).
• The five-year age band with the greatest increase over this period was the newly retired age group 65 to 69 (+41%). There was a decline in the population aged 35 to 44.
• District Councils’ plans for new housing in existing (adopted) and draft local plans set out an ambition for new housing in Oxfordshire of 34,300 by the end of March 2022 and a further 47,200 homes by end March 2031, a total of 81,500 new homes in the next 15 years.
• Oxfordshire County Council population forecasts, based on these plans for housing growth, predict an increase in the number of Oxfordshire residents of +187,500 people (+27%) between 2016 and 2031, taking the total population of the county from 687,900 to 874,400.
• By 2031, the number of people aged 85 and over is expected to have increased by 55% in Oxfordshire overall, with the highest growth predicted in South Oxfordshire (+64%) and Vale of White Horse (+66%).
• Life expectancy is increasing. Between 2001-03 and 2014-16, the gap between male and female Life Expectancy in Oxfordshire decreased from 4.1 years to 3.2 years.
• Life expectancy by ward data for Oxford City shows the gap in male life expectancy between the more affluent North ward and the relatively deprived ward of Northfield Brook has increased from 4 years in 2003-07 to 15 years in 2011-15. Female life expectancy in these wards has remained at similar levels with a gap of just over 10 years.
• Data for the combined years 2009 to 2013 shows that for males there was a 10-year gap in Disability Free Life Expectancy between the most and least deprived areas of Oxfordshire. For females, the gap was just under 10 years.

JSNA 2018
Data has been updated in this version Data has been reviewed and is unchanged
Final version April 2018 page 16
= +
2.2 Population
Mid-2016 population estimate
As of mid-2016, the ONS estimated total population of Oxfordshire was 683,200 residents1 (including students and armed forces). This was an increase of 5,400 (+0.8%) compared with the previous year (mid-2015).
Figure 1 Population of Oxfordshire and districts, mid-2016 and change 2015 to 2016
Source: ONS mid-year population estimates released June 2017
1 NOTE the Office for National Statistics revised the local authority 2016 mid-year population estimates on 23 March 2018. These have not yet been included in this JSNA publication as Oxford City Council and Oxfordshire County Council (as well as other Local Authorities outside Oxfordshire) have significant concerns about the revisions, which are being discussed with ONS. The revised estimates give Oxfordshire’s population as 678,500, a reduction of 4,700.
Oxfordshire 683,2003
Mid-2016 population3 (ONS) mid-2015 to mid-2016 change in population3
Oxfordshire +5,400
+

JSNA 2018
Data has been updated in this version Data has been reviewed and is unchanged
Final version April 2018 page 17
= +
Historical change in population by age
Over the ten-year period, 2006 and 2016, there was an overall growth in the population of Oxfordshire of 52,100 people (+8.3%), similar to the increase across England (+8.4%).
The five-year age band with the greatest increase over this period was the newly retired age group 65 to 69 (+41%). There was a decline in the population aged 35 to 44.
Figure 2 Oxfordshire’s population by age 2006 and 20162
Source: ONS mid-year population estimates (2016 estimates released June 2017)
Children and young people aged 0 to 17 made up 21% of Oxfordshire’s population as of mid-2016, a similar proportion to that in 2006. As shown in the population pyramid above and the chart below, the greatest increases were in the age groups 0-4 and 5-9.
2 NOTE the Office for National Statistics revised the local authority 2016 mid-year population estimates on 23 March 2018. These have not yet been included in this JSNA publication as Oxford City Council and Oxfordshire County Council (as well as other Local Authorities outside Oxfordshire) have significant concerns about the revisions, which are being discussed with ONS. The revised estimates give Oxfordshire’s population as 678,500, a reduction of 4,700.
30,000 20,000 10,000 0 10,000 20,000 30,000
0 - 4
5-9
10-14
15-19
20-24
25-29
30-34
35-39
40-44
45-49
50-54
55-59
60-64
65-69
70-74
75-79
80-84
85+
Female 2006 Male 2006
Decline in population aged 35 to 44
Greatest increase in newly retired age group 65-69 (+41%)
Historical change 2006 to 2016
+
+
JSNA 2018
Data has been updated in this version Data has been reviewed and is unchanged
Final version April 2018 page 18
= +
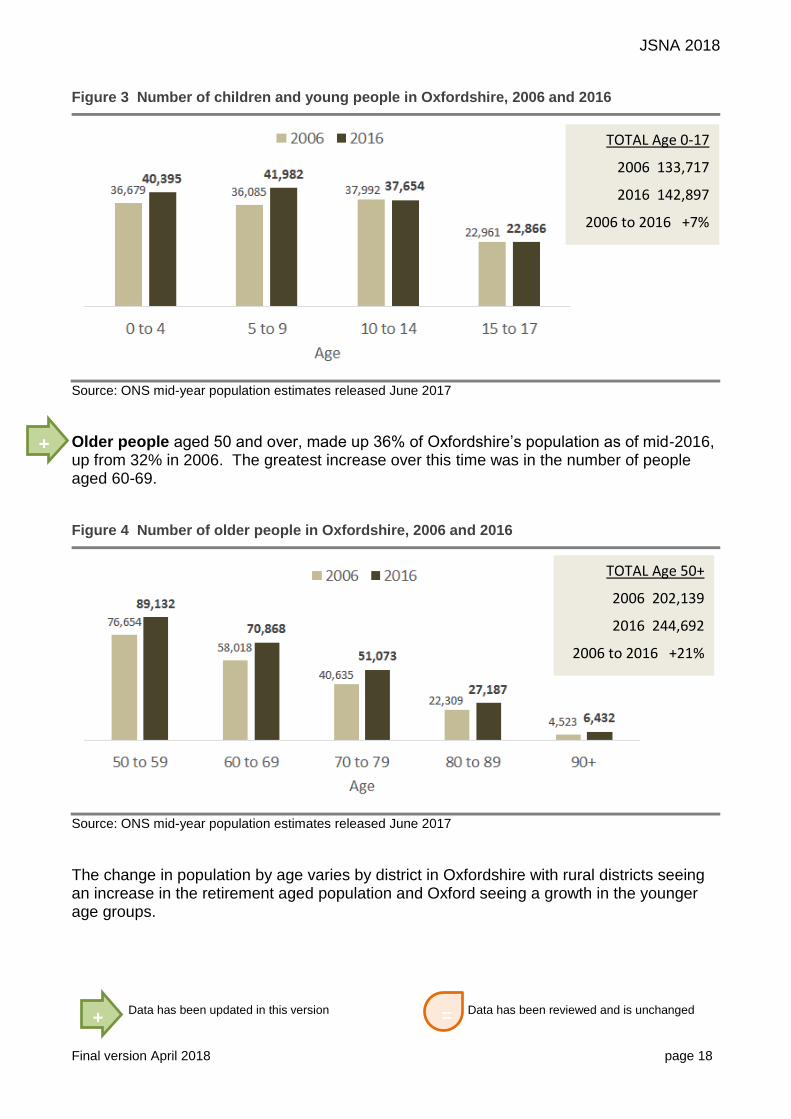
Figure 3 Number of children and young people in Oxfordshire, 2006 and 2016
Source: ONS mid-year population estimates released June 2017
Older people aged 50 and over, made up 36% of Oxfordshire’s population as of mid-2016, up from 32% in 2006. The greatest increase over this time was in the number of people aged 60-69.
Figure 4 Number of older people in Oxfordshire, 2006 and 2016
Source: ONS mid-year population estimates released June 2017
The change in population by age varies by district in Oxfordshire with rural districts seeing an increase in the retirement aged population and Oxford seeing a growth in the younger age groups.
TOTAL Age 0-17
2006 133,717
2016 142,897
2006 to 2016 +7%
TOTAL Age 50+
2006 202,139
2016 244,692
2006 to 2016 +21%
+
JSNA 2018
Data has been updated in this version Data has been reviewed and is unchanged
Final version April 2018 page 19
= +
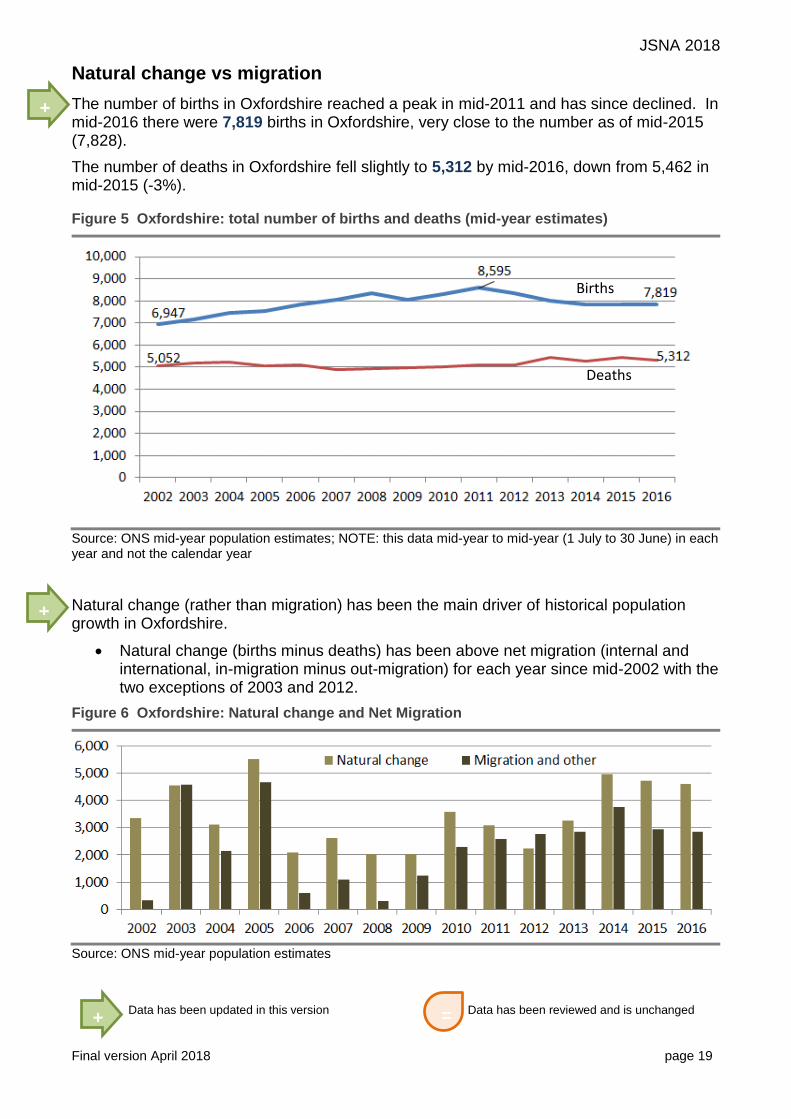
Natural change vs migration
The number of births in Oxfordshire reached a peak in mid-2011 and has since declined. In mid-2016 there were 7,819 births in Oxfordshire, very close to the number as of mid-2015 (7,828).
The number of deaths in Oxfordshire fell slightly to 5,312 by mid-2016, down from 5,462 in mid-2015 (-3%).
Figure 5 Oxfordshire: total number of births and deaths (mid-year estimates)
Source: ONS mid-year population estimates; NOTE: this data mid-year to mid-year (1 July to 30 June) in each year and not the calendar year
Natural change (rather than migration) has been the main driver of historical population growth in Oxfordshire.
• Natural change (births minus deaths) has been above net migration (internal and international, in-migration minus out-migration) for each year since mid-2002 with the two exceptions of 2003 and 2012.
Figure 6 Oxfordshire: Natural change and Net Migration
Source: ONS mid-year population estimates
Births
Deaths
+
+

JSNA 2018
Data has been updated in this version Data has been reviewed and is unchanged
Final version April 2018 page 20
= +
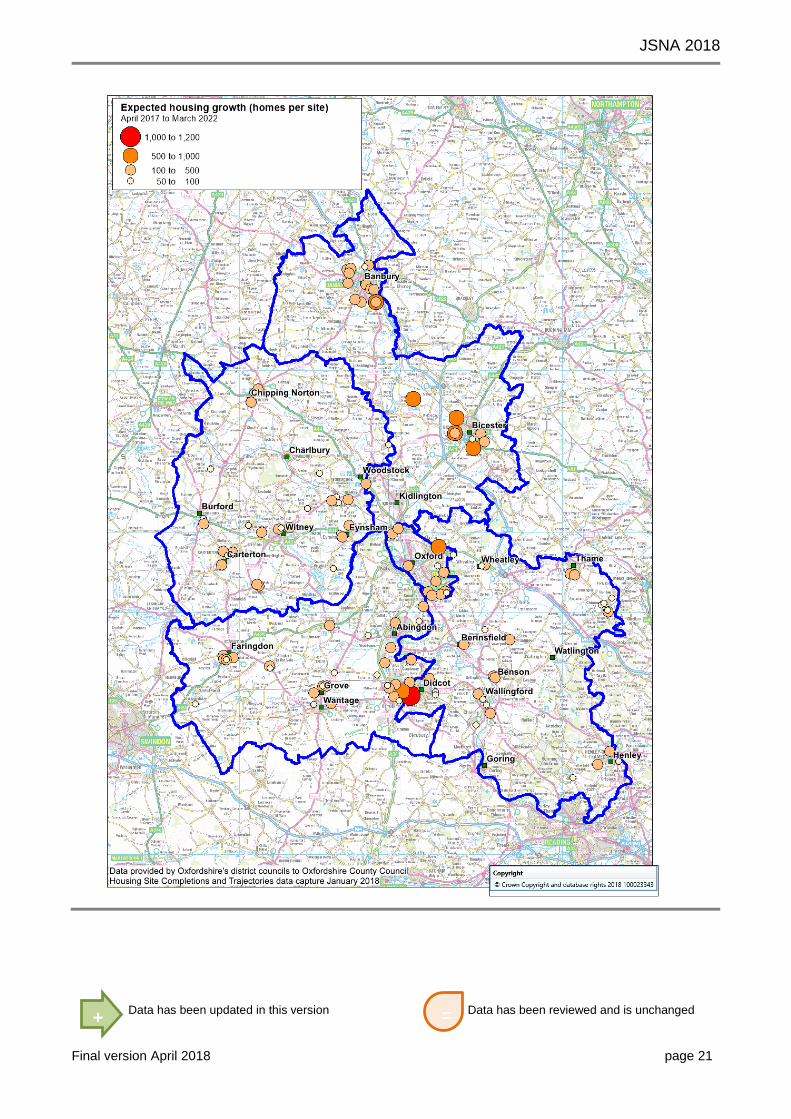
Forecast growth in population
District Councils’ local plans setting out planned housing development are at various stages of development.
• Cherwell has an existing (adopted) plan for Bicester, Banbury and Upper Heyford. An additional plan for Woodstock, A44 corridor, south and south east Kidington and north Oxford sites will be examined in 2018.
• Oxford has development in progress in Barton and Northern Gateway and a new local plan is in early stages of development.
• South Oxfordshire has an existing plan covering housing in Didcot and Wallingford and a plan for new housing in Culham, Berinsfield, Chalgrove and Wheatley will be examined in 2018.
• Vale of White Horse has an existing plan for housing outside Didcot, in Wantage-Grove and north Abingdon. A plan with development at Harwell, Dalton Barracks and other sites will be examined in 2018.
• West Oxfordshire’s local plan is in the later stages of the public examination and covers housing growth at Witney, Carterton, Eynsham and other sites.
The adopted and draft plans together set out housing growth in Oxfordshire of 34,300 by the end of March 2022 and a further 47,200 homes by end March 2031, a total of 81,500 new homes in the next 15 years.
Table 1 Total homes planned (adopted and draft local plans) for Oxfordshire to March 2031
Apr17 to Mar22 Apr22 to Mar31
Cherwell 10,082 13,214
Oxford City 3,156 3,849
South Oxfordshire 7,021 10,628
Vale of White Horse 9,357 10,455
West Oxfordshire 4,687 9,037
Oxfordshire total 34,302 47,183
Based on Oxfordshire Infrastructure Strategy housing site completions and trajectories reviewed January 2018
JSNA 2018
Data has been updated in this version Data has been reviewed and is unchanged
Final version April 2018 page 21
= +

JSNA 2018
Data has been updated in this version Data has been reviewed and is unchanged
Final version April 2018 page 22
= +
Oxfordshire County Council’s updated local population forecasts include the expected housing growth in adopted and draft district local plans.
The new forecasts are also based on an improved set of assumptions from ONS, especially in the upper age bands where deaths data is now available by single year of age.
The following charts show the differences by age group between the new County Council forecasts (Apr18), the old County Council forecasts (Nov 2016, as reported in the 2017 JSNA) and the trend-based Office for National Statistics 2014-based sub national population projections.
The comparisons show a similar trend in the total population and younger age groups and a lower predicted growth in the number of older people than the previous set of forecasts.
Figure 7 Comparison of Oxfordshire County Council population forecasts based on housing growth (Nov16 and Apr18) and ONS projections based on past trends
Sources: Oxfordshire County Council population forecasts (Nov16 and revised Apr 2018) and ONS 2014-based subnational population projections
+

JSNA 2018
Data has been updated in this version Data has been reviewed and is unchanged
Final version April 2018 page 23
= +
The latest Oxfordshire County Council population forecasts, predict an increase in the number of Oxfordshire residents of +186,500 people (+27%) between 2016 and 2031.
Table 2 Projected growth in total resident population 2016 to 2031
2016 2031 Change 2016 to 2031
Cherwell 148,200 203,900 55,800 38%
Oxford 161,400 172,000 10,500 7%
South 139,600 181,500 41,800 30%
Vale 129,400 178,900 49,600 38%
West 109,300 138,100 28,800 26%
OXFORDSHIRE 687,900 874,400 186,500 27%
Source: Oxfordshire County Council population forecasts (revised Apr18)
The older age group 65+ in Oxfordshire is expected to increase by +44%, well above the predicted growth in the number of children and young people aged 0-19 (24%).
Figure 8 Oxfordshire population by age 2016 and 2031
Source: Oxfordshire County Council population forecasts (revised Apr18)
44% increase in the age group 65+
Predicted change 2016 to 2031
+
+
40,000 20,000 0 20,000 40,000
0 - 4
5-9
10-14
15-19
20-24
25-29
30-34
35-39
40-44
45-49
50-54
55-59
60-64
65-69
70-74
75-79
80-84
85+
Female 2031 Male 2031
24% increase in the age group 0-19
2016 to 2031
27% increase (all ages)
40,000 20,000 0 20,000 40,000
0 - 4
5-9
10-14
15-19
20-24
25-29
30-34
35-39
40-44
45-49
50-54
55-59
60-64
65-69
70-74
75-79
80-84
85+
Female 2031 Male 2031
40,000 20,000 0 20,000 40,000
0 - 4
5-9
10-14
15-19
20-24
25-29
30-34
35-39
40-44
45-49
50-54
55-59
60-64
65-69
70-74
75-79
80-84
85+
Female 2016 Male 2016

JSNA 2018
Data has been updated in this version Data has been reviewed and is unchanged
Final version April 2018 page 24
= +
Predicted growth of the oldest age group (85+)
Between 2001 and 2016 the number of people aged 85 and over, living in Oxfordshire, increased from 11,300 to 17,000, a growth of 50%.
Between 2016 and 2031, Oxfordshire County Council predicts this age group will increase by a further 9,400 people to 26,500 (+55%).
Figure 9 Historical and forecast number of people aged 85 and over living in Oxfordshire
Sources: ONS mid-year population estimates; Oxfordshire County Council population forecasts (revised Apr18); totals may not sum due to rounding
Each district in Oxfordshire is predicted an increase in the number of people aged 85 and over. The district expected to see the greatest percentage increase (+66%) is Vale of White Horse, followed by South Oxfordshire (+64%).
Table 3 Historical and projected number of people aged 85 and over, Oxfordshire districts (2001 to 2016 and 2016 to 2031)
ONS mid-year estimates OCC projection
2001 2016 2001 to 2016
2031 2016 to 2031
Cherwell 2,200 3,400 1,300 5,400 1,900 56%
Oxford 2,500 2,900 400 3,600 700 26%
South Oxfordshire 2,600 3,900 1,300 6,300 2,500 64%
Vale of White Horse 2,100 3,600 1,500 6,000 2,400 66%
West Oxfordshire 2,000 3,300 1,200 5,200 1,900 59%
Oxfordshire 11,300 17,100 5,800 26,500 9,400 55%
Sources: ONS mid-year population estimates; Oxfordshire County Council population forecasts (revised Apr18); totals may not sum due to rounding
+
5,400
11,300
17,000
26,500
-
5,000
10,000
15,000
20,000
25,000
30,000
19
81
19
83
19
85
19
87
19
89
19
91
19
93
19
95
19
97
19
99
20
01
20
03
20
05
20
07
20
09
20
11
20
13
20
15
20
17
20
19
20
21
20
23
20
25
20
27
20
29
20
31
+5,700 (50%)
+9,400 (+55%)

JSNA 2018
Data has been updated in this version Data has been reviewed and is unchanged
Final version April 2018 page 25
= +
2.3 Life Expectancy
The most recent set of 3-year Life Expectancy data shows that, between 2013-15 and 2014-16, Life Expectancy for males and females in Oxfordshire each increased.
• Male Life Expectancy increased from 81.2 to 81.4 (+0.2 years)
• Female Life Expectancy increased from 84.3 to 84.6 (+0.3 years)
Between 2001-03 and 2014-16, the gap between male and female Life Expectancy decreased from 4.1 years to 3.2 years.
Figure 10 Change in Life Expectancy in Oxfordshire – males and females to 2014-16
Source: ONS Figures are based on the number of deaths registered and mid-year population estimates, aggregated over 3 consecutive years. Note that scale does not start at 0
ONS data on changes in life expectancy by socio-economic group3 (national data) shows a significant increase in life expectancy of professional males – above the gains for all groups of females and most of the other male socio-economic groups.
Life expectancy by ward data for Oxford shows a significant increase in male life expectancy in the more affluent North ward and no change in male life expectancy in the more deprived ward of Northfield Brook. The gap in male life expectancy between these two wards has increased from 4 years in 2003-07 to 15 years in 2011-15.
Female life expectancy in these wards has remained at similar levels with a gap of just over 10 years.
3 https://www.ons.gov.uk/peoplepopulationandcommunity/birthsdeathsandmarriages/lifeexpectancies/bulletins/trendinlifeexpectancyatbirthandatage65bysocioeconomicpositionbasedonthenationalstatisticssocioeconomicclassificationenglandandwales/2015-10-21
+

JSNA 2018
Data has been updated in this version Data has been reviewed and is unchanged
Final version April 2018 page 26
= +
Figure 11 Trend in life expectancy by ward (showing confidence intervals), 5 year rolling average
Source: 2011-15 life expectancy by ward data available from Local Health; LE data for previous years from Oxfordshire County Council archive. Note that trend data is not available for wards outside Oxford City as a result of changes in ward boundaries in 2015 and 2016. Note scale does not start at 0.

JSNA 2018
Data has been updated in this version Data has been reviewed and is unchanged
Final version April 2018 page 27
= +
2.4 Inequality in Disability Free Life Expectancy
Disability Free Life Expectancy (DFLE) is the average number of years an individual is expected to live free of disability if current patterns of mortality and disability continue to apply.
There are clear inequalities in DFLE across Oxfordshire, with people in the most deprived areas having significantly lower Disability Free Life Expectancy compared with the least deprived.
• Data for the combined years 2009 to 2013 shows that for males there was a 10-year gap between the most and least deprived areas. For females, the gap was just under 10 years.
The following charts shows DFLE in years for the 5 most deprived Middle Layer Super Output areas in Oxfordshire compared with the 5 least deprived MSOAs.
Figure 12 Disability Free Life Expectancy: most deprived vs least deprived MSOAs in Oxfordshire, 2009-2013
Sources: ONS Disability Free Life Expectancy at birth by MSOA. IMD 2015 ranks and average scores for English Middle Layer Super Output Areas created by Public Health England from population weighted averages of their constituent Lower Super Output Area scores.
Next update to this data will be following the 2021 Census
Males
Females
Lower confidence interval of male DFLE for least deprived area
Lower confidence interval of female DFLE for least deprived area
=