2. runny measuring
TRANSCRIPT

© Centre for Industry Education Collaboration http://www.ciec.org.uk/1
[ACTIVITY DETAIL]
2. Runny measuring
Measurements of 'runniness' are made by timing a marble dropping through a cylinder of liquid, or by pouring liquid through a funnel and measuring the time taken.
OBJECTIVES � Compare and group materials together, according to whether they are solids, liquids or gases.
� To show that all liquids do not flow at the same rate.
� To measure the 'runniness' of liquids, and make comparisons.
� Gathering, recording, classifying and presenting data in a variety of ways to help in answering questions
RESOURCES(Per group of 4 children unless otherwise stated)
� Activity sheets 4-5
� Stop clock or stopwatch
� 3 x 250 ml measuring cylinders
� 3 pop bottles (280 ml or 330 ml size) 3+ liquids, 'very thick' to 'runny'
Option 1* Option 2
1 marble (standard size)
250 ml samples of all liquids
from 'very thick' to 'runny'
3 funnels1
50 ml samples of all liquids
in labelled yogurt pots
*Quickest, and closest to industrial practice.
INTRODUCING THE ACTIVITY (15 MINUTES)Refer to the letter and point out that the company wants assistance to solve the problem, and that the company want to move the liquid around the site in pipes. Discuss methods of measuring 'how runny' the liquids are. Questions could include:
1 If possible use funnels of similar diameter 'tube', for a fair test. If you do not have access to funnels, these can be made by cutting the top off plastic water/pop bottles just below the 'shoulder'. These should have a screw top. Using a 4 mm drill, a hole can be drilled in the plastic screw top, before replacing on the bottle top.
75 mins
Safety noteSome of the liquids have quite strong smells. Open
windows to allow air to circulate.

© Centre for Industry Education Collaboration http://www.ciec.org.uk/2
� How would they compare, say, salad cream coming out of a bottle with washing up liquid?
� Is it enough to say 'This is slower than that?'
� Would it be useful to tell the company how slowly each liquid flows?
� What would you need to measure to decide how quickly liquids flow?
� How can you present the information you get to the company so that they can see at a glance which is the quickest/slowest?
Lead the discussion to the idea of letting something fall through the liquid and measuring the time taken for the object to fall to the bottom of the container, or letting the liquids flow through a narrow pipe, e.g. a funnel, and timing how long it takes for a given amount of liquid to fall through.
MAIN ACTIVITY (40 MINUTES)Two investigations are described below, though other ideas suggested by the children could also be investigated.
Option 1 will take less time to complete than Option 2, and is commonly used by industry. It is therefore suggested that this is the main method used. However, depending on class ability, it could be that some children test each option, and the results compared. In both options, the children need to be able to measure time taken. A stop clock is preferable to a stopwatch, as only whole seconds are measured.
Recording sheets are provided for both options, with a space for the children's predictions. Activity sheet 4 encourages them to tabulate their results and draw conclusions from their findings. Activity sheet 5 gives an opportunity to produce a bar chart of the results, giving a visual presentation of the numbers. Alternatively, children could construct their own block graph or bar charts. Block graphs can be constructed on 1-2 cm2 paper with gummed coloured squares, each representing, say, 10 seconds. (Squares can be cut down to represent shorter times when necessary). Each bar could be a different colour. This could be either a group or class recording activity.
Option 1: Timing a marble falling through a column of liquid.
Each measuring cylinder is filled with 250 ml of liquid, allowing space for the marble to displace some liquid. Dangle the marble just above the surface of the first liquid, drop it and start the clock1. Stop the clock when the marble hits the bottom, and record the time. Repeat the experiment with the remaining liquids.
Option 2: Timing liquid flowing through a funnel into a bottle.
A funnel is placed in the pop bottle, and the measured sample poured in quickly. Encourage the children to think about when to 'stop the clock'. Should they wait until every last drop has drained through? (It is suggested that the clock is 'stopped' when the flow turns to drops otherwise there could be a very long wait!). This process encourages the children to consider a reasonable stop point, and to keep it the same for each liquid.
1 If repeat tests are to be carried out, the marble could have a thread attached to it with Blu-tack or similar for ease of retrieval. The Blu-tack can loosen after each test. To help prevent this, re-attach the Blu-tack before each test, rolling it between the fingers to make it sticky again.
© Centre for Industry Education Collaboration http://www.ciec.org.uk/3
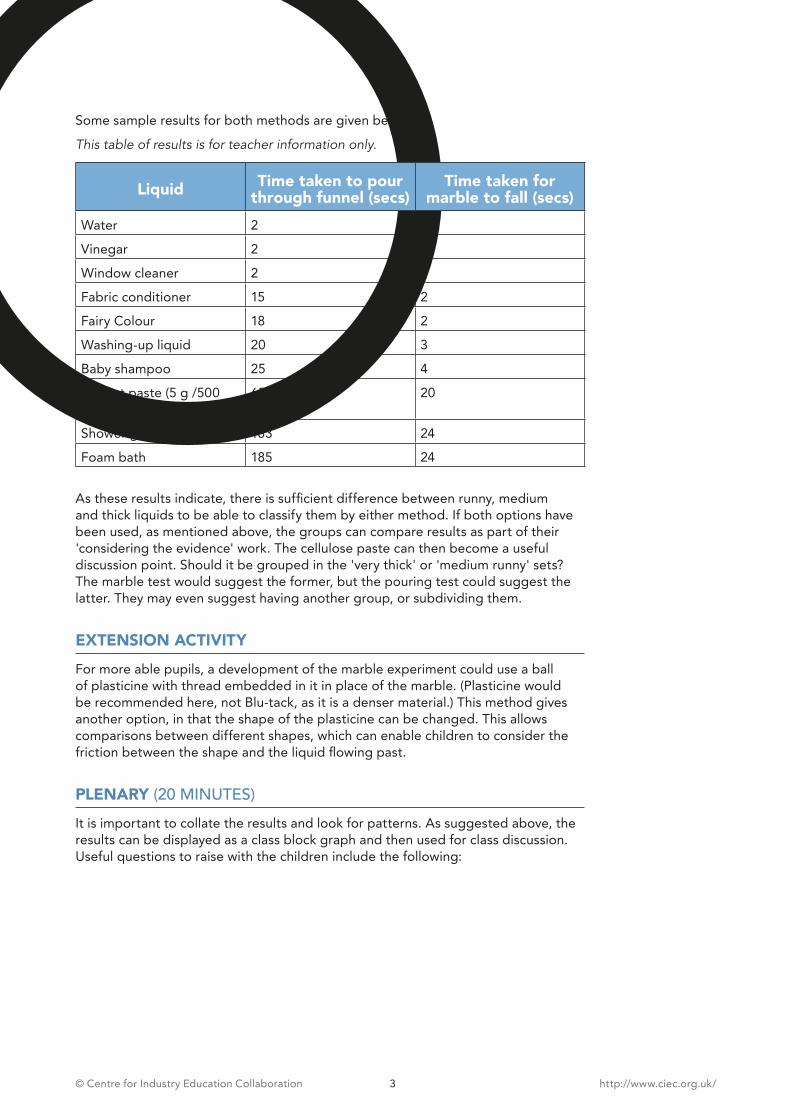
Some sample results for both methods are given below.
This table of results is for teacher information only.
Liquid Time taken to pour through funnel (secs)
Time taken for marble to fall (secs)
Water 2 1
Vinegar 2 1
Window cleaner 2 1
Fabric conditioner 15 2
Fairy Colour 18 2
Washing-up liquid 20 3
Baby shampoo 25 4
PlayArt paste (5 g /500 ml)
65 20
Shower gel 183 24
Foam bath 185 24
As these results indicate, there is sufficient difference between runny, medium and thick liquids to be able to classify them by either method. If both options have been used, as mentioned above, the groups can compare results as part of their 'considering the evidence' work. The cellulose paste can then become a useful discussion point. Should it be grouped in the 'very thick' or 'medium runny' sets? The marble test would suggest the former, but the pouring test could suggest the latter. They may even suggest having another group, or subdividing them.
EXTENSION ACTIVITYFor more able pupils, a development of the marble experiment could use a ball of plasticine with thread embedded in it in place of the marble. (Plasticine would be recommended here, not Blu-tack, as it is a denser material.) This method gives another option, in that the shape of the plasticine can be changed. This allows comparisons between different shapes, which can enable children to consider the friction between the shape and the liquid flowing past.
PLENARY (20 MINUTES)It is important to collate the results and look for patterns. As suggested above, the results can be displayed as a class block graph and then used for class discussion. Useful questions to raise with the children include the following:

© Centre for Industry Education Collaboration http://www.ciec.org.uk/4
� Do the times taken show the runny, medium and thick liquids?
� If both methods have been used, are the two sets of results similar?
� Is there an advantage to having both sets of information to compare against each other?
� The industry asked for measurements to be provided. Will our data help the industry make some decisions about the sort of liquid they might like to produce? How might it be helpful?
� Why do you think industry may prefer to use the 'marble method' to measure runniness of liquids? Possible suggestions could relate to the time taken to complete the tests, and its simplicity.
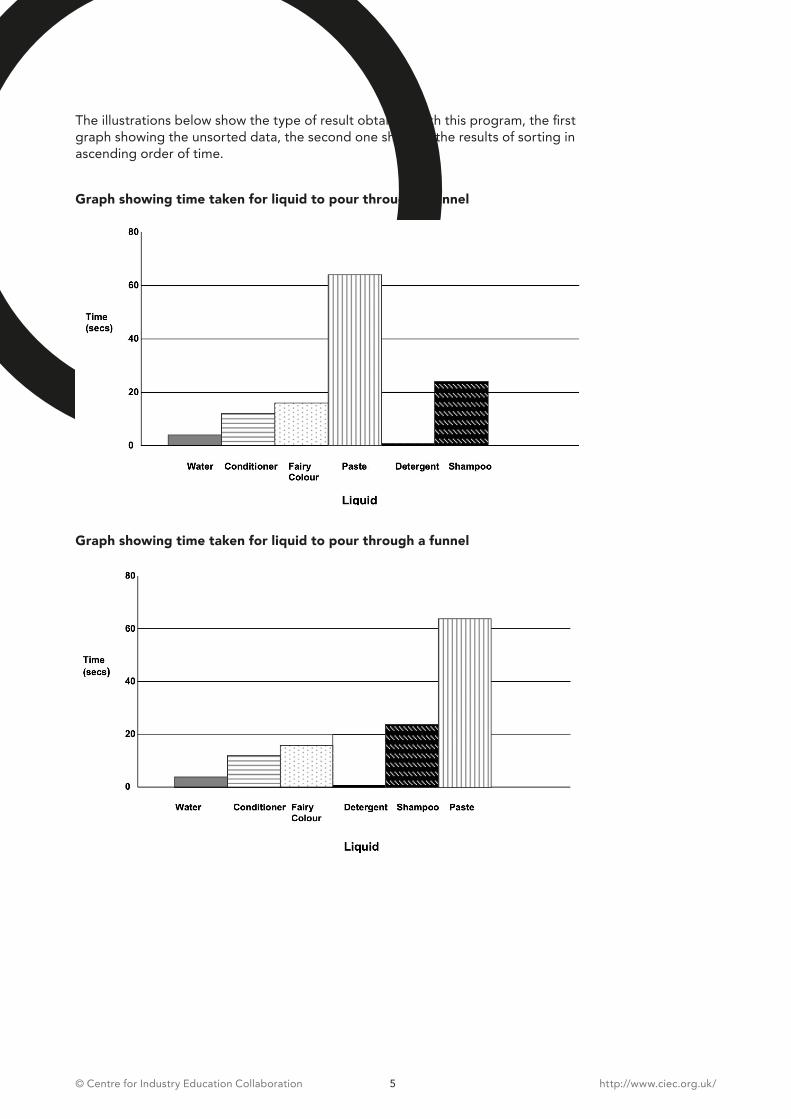
The children can use ICT to record their results. A spreadsheet could be set up to record the data in a table, and the charting wizard used to produce bar charts of the results. This encourages children to use the software to put the data in order, either ascending or descending, rather than haphazardly. This is an important skill to learn in this context. Two examples of the type of software which could be used in the primary school are the NGfL program First Workshop, or the RM Windowbox program Starting Graphs. In this latter case, illustrated overleaf, the following sequence of operations produces the graphs.
1. Click on New Project.
2. Set up the two columns presented with the labels Liquid and Time taken, filling in the data from their results.
3. They can choose the appropriate graph type from a range given.
4. Sort in ascending or descending order. The time scale automatically changes to accommodate the numbers typed into the column.
© Centre for Industry Education Collaboration http://www.ciec.org.uk/5
The illustrations below show the type of result obtained with this program, the first graph showing the unsorted data, the second one showing the results of sorting in ascending order of time.
Graph showing time taken for liquid to pour through a funnel
Graph showing time taken for liquid to pour through a funnel

© Centre for Industry Education Collaboration http://www.ciec.org.uk/6
Similarly, the following examples illustrate what could be done using MS Excel, which could be set up previously by the teacher for Year 4 children if they are not entirely familiar with the program.
1. The table is typed, with the headings, in Microsoft Excel, as shown below:
2. Highlight the chart by clicking and dragging across the table.
Liquid Time taken to pour through funnel (secs)
Water 2
Fabric conditioner 15
Vinegar 2
Baby shampoo 25
Foam bath liquid 185
Window cleaner 2
Fairy Colour 18
Washing-up 20
Play Art paste 65
3. Click on the Chart Wizard button on the Menu bar.
4. From the options given, choose the type of graph required (a column graph in this case). Clicking and holding down the mouse button on the bar below the options gives a view of the graph that will be produced. Click Next.
5. Leave the data range unchanged and click Next.
6. Type the title and labels for the two axes in the spaces provided, if required. Click Next.
7. Check the button labelled As new sheet to produce a separate graph from the table. Click on Finish.
If the column of times and the heading is highlighted, the results can be sorted into ascending or descending order.
These results have been charted in the order shown, as shown overleaf.
1. Click on Tools on the Menu bar.
2. Click Sort..., Ascending (or Descending), and the table will re-order according to the type of sort.
3. Clicking on the Chart tab at the bottom of the spreadsheet will display the chart with the results also re-ordered. Any change to the table is immediately reflected in the chart.

© Centre for Industry Education Collaboration http://www.ciec.org.uk/7
As with the previous program, the data can be sorted in either ascending or descending order of time.