2 thermogravimetric analysis (tga) 2.1 general description · thermogravimetric analysis 2...
TRANSCRIPT

Thermogravimetric Analysis
2 Thermogravimetric Analysis (TGA)
2.1 General Description Thermogravimetric analysis (TGA) is an analytical technique used to determine a material’s
thermal stability and its fraction of volatile components by monitoring the weight change that
occurs as a specimen is heated. The measurement is normally carried out in air or in an inert
atmosphere, such as Helium or Argon, and the weight is recorded as a function of increasing
temperature. Sometimes, the measurement is performed in a lean oxygen atmosphere (1 to 5%
O2 in N2 or He) to slow down oxidation. In addition to weight changes, some instruments also
record the temperature difference between the specimen and one or more reference pans
(differential thermal analysis, or DTA) or the heat flow into the specimen pan compared to that of
the reference pan (differential scanning calorimetry, or DSC). The latter can be used to monitor
the energy released or absorbed via chemical reactions during the heating process. In the
particular case of carbon nanotubes, the weight change in an air atmosphere is typically a
superposition of the weight loss due to oxidation of carbon into gaseous carbon dioxide and the
weight gain due to oxidation of residual metal catalyst into solid oxides.
2.2 Types of TGA Instruments
TGA instruments can be divided into two general types: vertical and horizontal balance. Vertical
balance instruments have a specimen pan hanging from the balance (TA Instruments, etc) or
located above the balance on a sample stem (Netzsch). It is necessary to calibrate these
instruments in order to compensate for buoyancy effects due to the variation in the density of the
purge gas with temperature, as well as the type of gas. Vertical balance instruments generally do
not have reference pan and are incapable of true DTA or DSC measurements (Netzsch being an
exception). Horizontal balance instruments (TA, Perkin Elmer, etc.) normally have two pans
(sample and reference) and can perform DTA and DSC measurements. They are considered free
from buoyancy effects, but require calibration to compensate for differential thermal expansion of
balance arms. One common instrument for general purpose use, the TA Instruments Model SDT
2790, is used as an example for the following description and discussion.

Thermogravimetric Analysis
2.3 Operating Principle and Definitions In most cases, TGA analysis is performed in an oxidative atmosphere (air or oxygen and inert gas
mixtures) with a linear temperature ramp. The maximum temperature is selected so that the
specimen weight is stable at the end of the experiment, implying that all chemical reactions are
completed (i.e., all of the carbon is burnt off leaving behind metal oxides). This approach provides
two important numerical pieces of information: ash content (residual mass, Mres) and oxidation
temperature (To) (Figure 1). While the definition of ash content is unambiguous, oxidation
temperature can be defined in many ways, including the temperature of the maximum in the
weight loss rate (dm/dTmax) and the weight loss onset temperature (Tonset). The former refers to
the temperature of the maximum rate of oxidation, while the latter refers to the temperature when
oxidation just begins. The use of the former definition, To = dm/dTmax, is preferred for two reasons.
First, due to the gradual initiation of transition (sometimes up to 100 oC, Figure 1) it may be
difficult to determine Tonset precisely. Gradual onset is believed to be due to nanotubes being
contaminated with amorphous carbon and other types of carbonaceous impurities that oxidize at
temperatures lower than that of nanotubes. In these cases, Tonset describes the properties of the
impurities rather than the nanotubes. Second, weight loss due to carbon oxidation is often
superimposed on the weight increase due to catalyst oxidation at low temperatures. In some
cases this leads to an upward swing of the TGA curve prior to the bulk of the weight loss, which
makes the definition of Tonset even more difficult and ambiguous. However, determining dm/dTmax
is relatively straightforward. Therefore, oxidation temperature is herein defined as To = dm/dTmax.
(a)
-0.2
0.3
0.8
Der
iv. W
eigh
t (%
/°C)
0
20
40
60
80
100
Wei
ght (
%)
0 200 400 600Temperature (°C) Universal V3.0G TA Instruments
T0
Tonset
Mres
(b)
336.93°C387.67°C
-0.2
0.0
0.2
0.4
0.6
0.8
1.0
Der
iv. W
eigh
t (%
/°C
)
40
60
80
100
120
Wei
ght (
%)
50 150 250 350 450 550Temperature (°C)
, ,
Universal V3.8B TA Instruments
T0
Tonset
Figure 1: (a) TGA of purified SWCNTs; 3 specimens sampled from the same batch. (b) Graph illustrating the ambiguity in determining Tonset.
Thermogravimetric Analysis
TGA measurement of “as-produced” nanotube material in air usually produces only one peak in
the dm/dT curve, as “fluffy” raw nanotubes oxidize rapidly in an oxygen-rich environment.
However, analysis of purified nanotube material in air may produce more than one peak. These
additional peaks are likely due to the fact that purified material contains a fraction of nanotubes
with damage and/or with functional groups (i.e., the material is oxidized at lower temperatures) or
because purified material is more compacted after drying. The position of each peak is also
strongly affected by the amount and morphology of the metal catalyst particles and other carbon-
based impurities, as well as their distribution within a specimen. A lean oxygen environment can
be used to better separate these peaks. In addition, these peaks have also been attributed to
various components in the nanotube material (amorphous carbon, nanotubes, graphitic particles),
and it may be possible to quantify these components by deconvolution of peaks.
Oxidation temperature, To, is basically a measure of the thermal stability of nanotubes in air and
depends on a number of parameters. For example, smaller diameter nanotubes are believed to
oxidize at lower temperature due to a higher curvature strain. Defects and derivatization moiety in
nanotube walls can also lower the thermal stability. Active metal particles present in the nanotube
specimens may catalyze carbon oxidation, so the amount of metal impurity in the sample can
have a considerable influence on the thermal stability. It is impossible to distinguish these
contributions, but, nevertheless, thermal stability is a good measure of the overall quality of a
given nanotube sample. Higher oxidation temperature is always associated with purer, less-
defective samples.
2.4 Sources of Error When performing TGA runs on especially clean nanotubes with minimal ash content (< 3 %), it
should be noted that residual mass is sometimes negative. This happens even after fresh
calibration of the instrument. The long-term stability of the instrument zero (over a 3-hour run) is
within 20-40 µg, which constitutes 1-2 % of the initial 2-4 mg sample. For samples with very small
ash content, this amounts to a fairly large error. It is therefore necessary to weigh each ash
residue independently using a microbalance. This way ash content measurement accuracy is
greatly improved. Other instruments may have better long-term zero stability, but it is still
preferable to check ash content occasionally by independent measurement. Additionally, there
may be a time lag in the sample temperature and the oven temperature which can be reduced by
lowering the ramp rates. Finally, temperature calibration should be done periodically according to
the instrument manufacturer’s specifications.

Thermogravimetric Analysis
2.5 Practical Concerns
2.5.1 Material Inhomogeneity
It has been noted that when TGA measurements are performed on several nanotube specimens
sampled from the same batch, the TGA traces do not necessarily coincide (Figure 1, Figures 4-11
in Appendix). There is always some variation that exceeds the accuracy and repeatability of the
instrument. This observation serves to emphasize that carbon nanotube batches are not pure
chemicals and, therefore, are not as homogenous and uniform as is usually implied for pure
chemicals. This means that values of Mr and T0 produced in one TGA run are not necessarily
representative of the whole batch. The only reasonable approach to this problem is to perform
TGA on at least three (or more) specimens sampled from the batch and calculate mean averages
of Mr and T0. Interestingly, this approach also allows one to calculate standard deviations of Mr
and T0. It is obvious that standard deviations σMr and σTo can serve as a measure of the
inhomogeneity of the nanotubes in the batch (See appendix for experimental data and
discussion).
2.5.2 Combustion
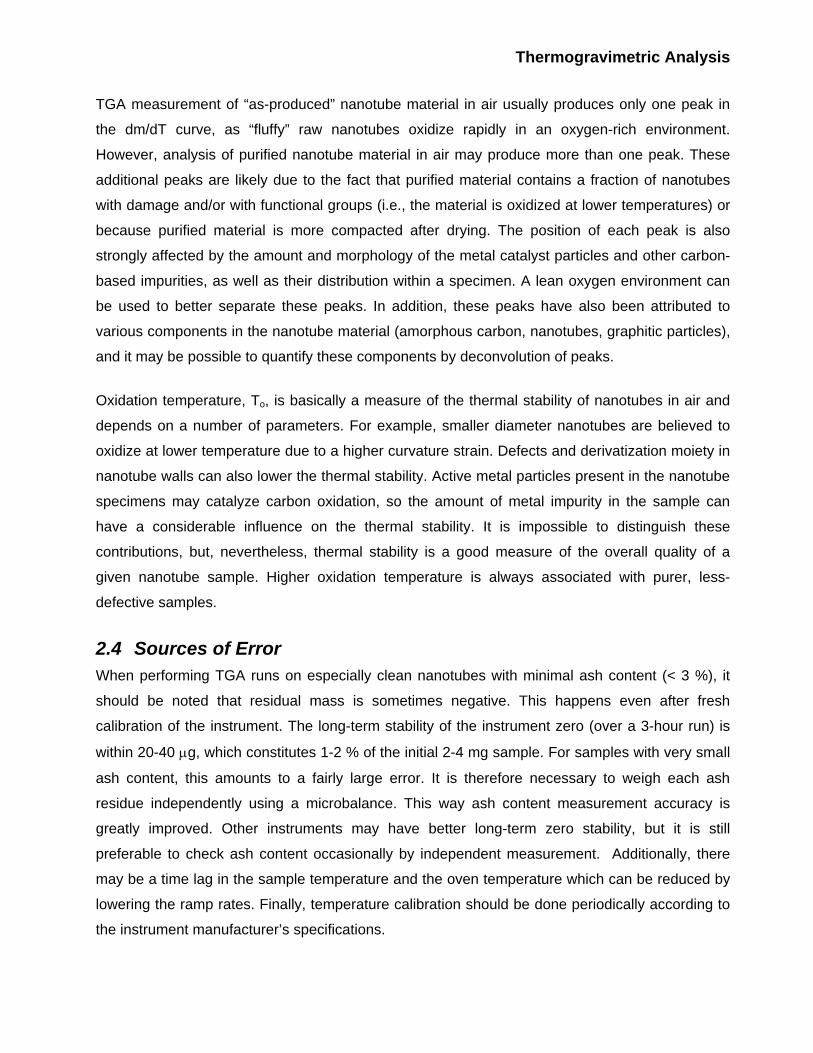
Sometimes a strange, and unexpected, effect is observed in the TGA results (Figure 2). The
weight trace suddenly goes backwards along the abscissa and then continues forward as usual.
This behavior becomes easily explainable if the weight trace and the temperature are plotted
versus time. In this graph, it is evident that the event is accompanied by a sudden loss of a
significant fraction of the sample mass, as well as a large spike in the temperature difference
(DTA) plot. At the same time, temperature goes up by 10-20 oC, and then comes down and
continues along a linear ramp. We have estimated that the temperature increase rate reaches up
to 50 oC/min during such events and is fairly independent of the nominal furnace heating rare.
These are unambiguous signs of combustion (i.e., the sample starts burning and releases a
considerable amount of heat very quickly, causing a sharp increase in temperature followed by
heat dissipation and a subsequent temperature drop). This behavior is more often observed on
as-produced unpurified nanotubes that are “fluffy” and have more metal catalyst. It is noticed that
combustion decreases Mr and increases its standard deviation (see Appendix). This probably
happens due to ejection of smoke particulates from the sample pan during rapid burning (i.e.,
there is some poorly controlled weight loss beyond oxidation of carbon). Therefore it’s better to
avoid conditions that cause combustion.
Thermogravimetric Analysis
2.5.3 Heating Rate
Typical heating rates employed in TGA measurements of carbon nanotube specimens are in the
10-20 oC/min range. It has been noted that heating rate has a pronounced effect on the measured
values of Mr and T0 and their standard deviations (see Appendix). The effect on T0 has been
attributed in the literature to the limited rate of heat conduction into the sample. The effect on Mr is
mostly related to combustion that higher ramp rates are more likely to produce. It is found that in
as-produced unpurified (“fluffy”) samples, combustion is likely to occur at or above 5 oC/min. The
conclusion is that heating rate must be constant in all measurements to avoid inconsistency in T0
measurement, and at or below 5 oC/min to avoid combustion. Selecting a heating rate of 5 oC/min
is a reasonable compromise, considering that lowering the rate more causes unacceptably long
experiments.
2.5.4 Sample Weight
When working with as-produced “fluffy” nanotubes, it is difficult to place more than 2-4 mg of
material into a typical 200 µl sample pan. Considering zero stability of modern TGA instruments, this quantity of material is still acceptable, but should be an absolute minimum. Samples of
appoximately 10 mg are recommended.
20
40
60
80
100
120
Wei
ght (
%)
150 200 250 300 350 400 450 500 550
Temperature (°C) Universal V3.0G TA Instru
0
200
400
600
800
Tem
pera
ture
(°C
)
20
40
60
80
100
120
Wei
ght (
%)
0 20 40 60 80 100
Time (min) Universal V3.0G TA Instruments
a b
Figure 2: Evidence of nanotube combustion in TGA. (a) Trace going “backward”. (b) Temperature spike
caused by combustion. Note different abscissa units – temperature on (a) and time on (b).
Thermogravimetric Analysis
2.6 Suggested Protocol
Based on the discussion above and results of the study reported in the Appendix, the following
protocol for TGA measurements is proposed. If this protocol is followed for each sample, it will
produce results that can be cross-compared.
1. Heating rate 5 oC/min. in air. Maximum temperature sufficient to stabilize sample
weight (typically 800 oC).
2. Sample size at least 2 - 4 mg, more if possible.
3. Three separate TGA runs on each sample.
4. Ash content measured independently on microbalance.
Mean values of T0 and Mres are representative of the sample oxidation temperature and ash
content. Standard deviations of T0 and Mres are representative of the sample inhomogeneity.
2.7 Appendix
2.7.1 Protocol Development
All TGA experiments were performed using a TA Instruments SDT 2790 TGA with air as a purge
gas at a flow rate of 100 sccm. All samples were from the same batch of as-produced (“fluffy”)
HiPco single-wall carbon nanotubes. The inhomogeneity of the material, the heating rate,
combustion, and their combined effect on the results of the TGA experiments were studied. In
addition, we investigated the stability of the instrument zero and it’s implications in determining
precise ash content.
2.7.2 Material Inhomogeneity
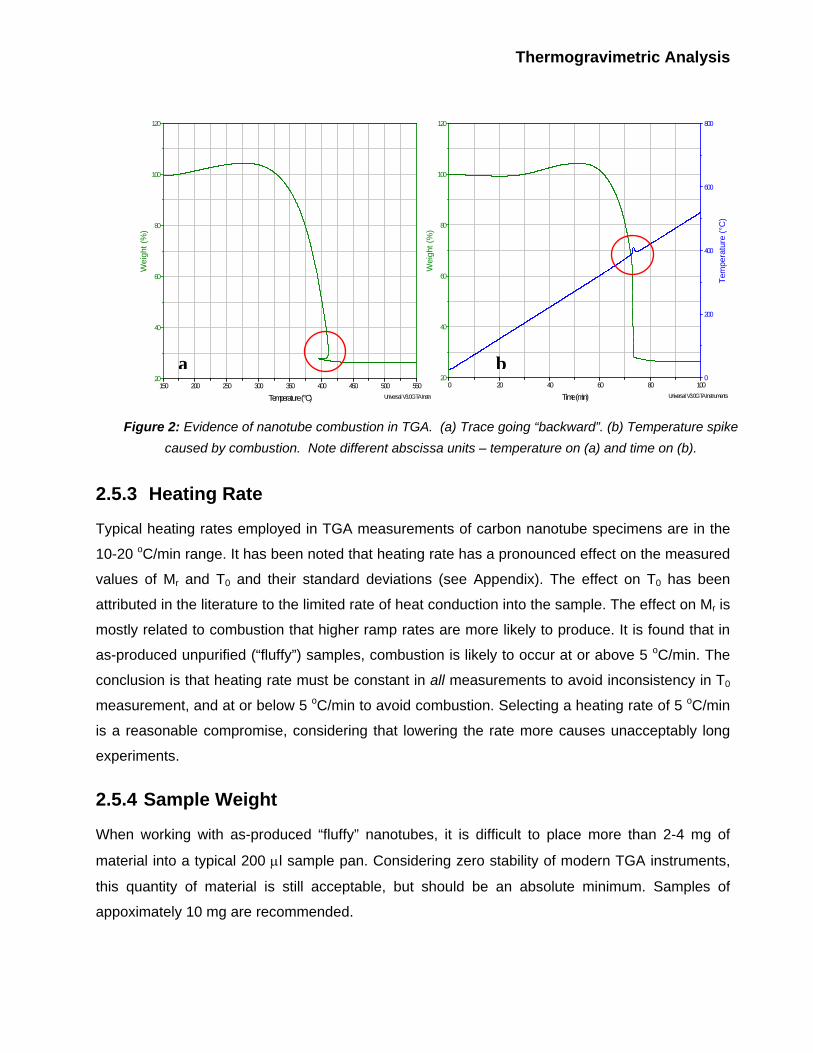
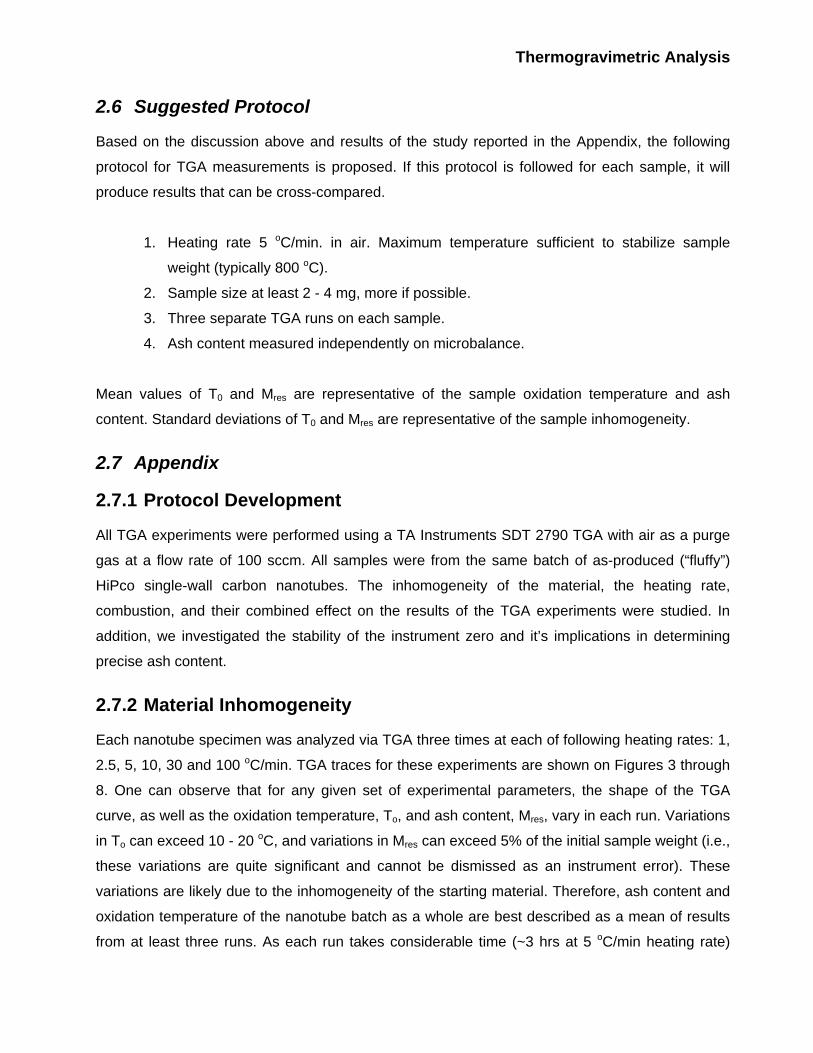
Each nanotube specimen was analyzed via TGA three times at each of following heating rates: 1,
2.5, 5, 10, 30 and 100 oC/min. TGA traces for these experiments are shown on Figures 3 through
8. One can observe that for any given set of experimental parameters, the shape of the TGA
curve, as well as the oxidation temperature, To, and ash content, Mres, vary in each run. Variations
in To can exceed 10 - 20 oC, and variations in Mres can exceed 5% of the initial sample weight (i.e.,
these variations are quite significant and cannot be dismissed as an instrument error). These
variations are likely due to the inhomogeneity of the starting material. Therefore, ash content and
oxidation temperature of the nanotube batch as a whole are best described as a mean of results
from at least three runs. As each run takes considerable time (~3 hrs at 5 oC/min heating rate)
Thermogravimetric Analysis
and consumes 2 - 4 mg of the sample, it is impractical to do more than three runs. A sample size
of 2-4 mg is sufficient to produce good data, but not too large as to consume a significant fraction
of the nanotube material available. It has also been noticed that nanotube materials of different
properties have varying standard deviations of To (σT) and Mres (σM). This result could also be
due to the varying degree of inhomogeneity in different samples. For example, unpurified and
purified HiPco nanotubes have σT = ~2.7 oC and σT = ~6.5 oC respectively (5 oC/min heating rate).
Therefore, σM and σT values can be used to describe inhomogeneity of the sample – the larger
the standard deviation, the more inhomogeneous the sample.
HP87 unp 1C/min
0.35
0.85
1.35
Der
iv. W
eigh
t (%
/°C
)
0
20
40
60
80
100
120
Wei
ght (
%)
0 100 200 300 400 500
Temperature (°C) Universal V3.0G TA Instruments Figure 3: TGA graphs of unpurified HiPco SWCNT material; three specimens sampled from the same
batch; 1 °C/min heating rate in air.
HP87 unp 2.5C/min
-0.15
0.35
0.85
1.35
Der
iv. W
eigh
t (%
/°C
)
0
20
40
60
80
100
120
Wei
ght (
%)
0 100 200 300 400 500
Temperature (°C) Universal V3.0G TA Instruments
Figure 4: TGA graphs of unpurified HiPco SWCNT material; three specimens sampled from the same
batch; 2.5 °C/min heating rate in air.
Thermogravimetric Analysis
HP87 unp 5C/min
-0.15
0.35
0.85
1.35
1.85
Der
iv. W
eigh
t (%
/°C
)
0
20
40
60
80
100
120W
eigh
t (%
)
0 100 200 300 400 500
Temperature (°C) Universal V3.0G TA Instruments
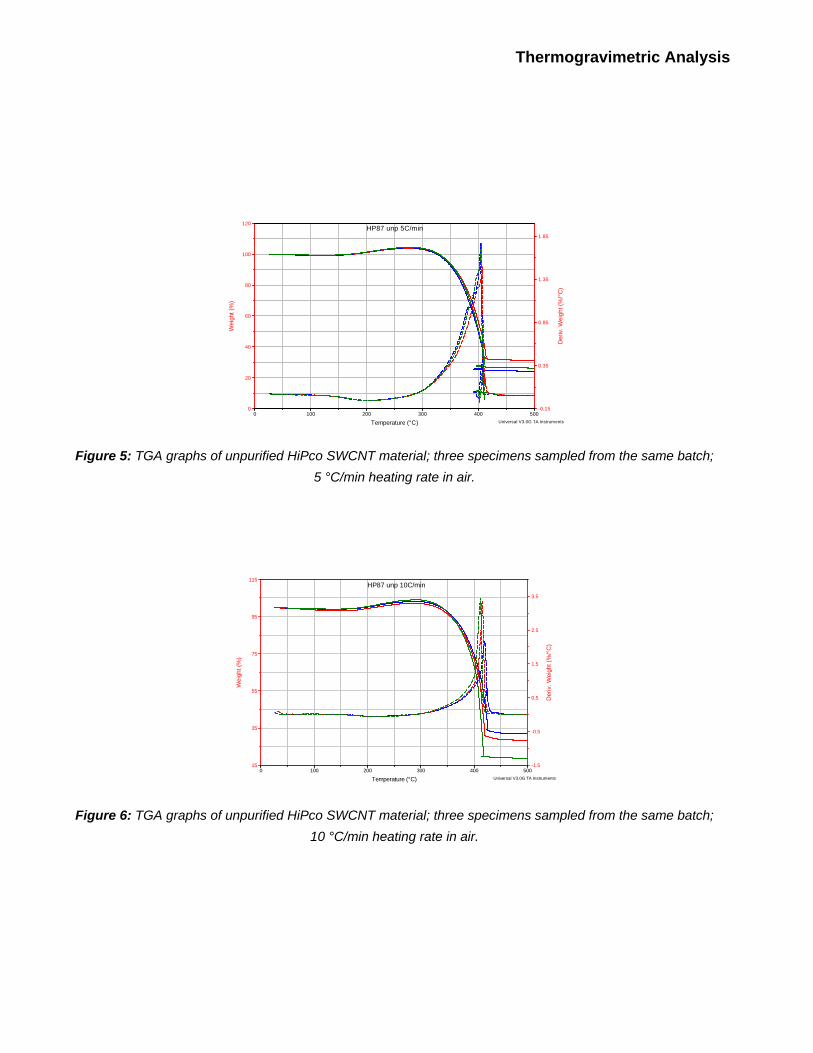
Figure 5: TGA graphs of unpurified HiPco SWCNT material; three specimens sampled from the same batch;
5 °C/min heating rate in air.
HP87 unp 10C/min
-1.5
-0.5
0.5
1.5
2.5
3.5
Der
iv. W
eigh
t (%
/°C
)
15
35
55
75
95
115
Wei
ght (
%)
0 100 200 300 400 500
Temperature (°C) Universal V3.0G TA Instruments
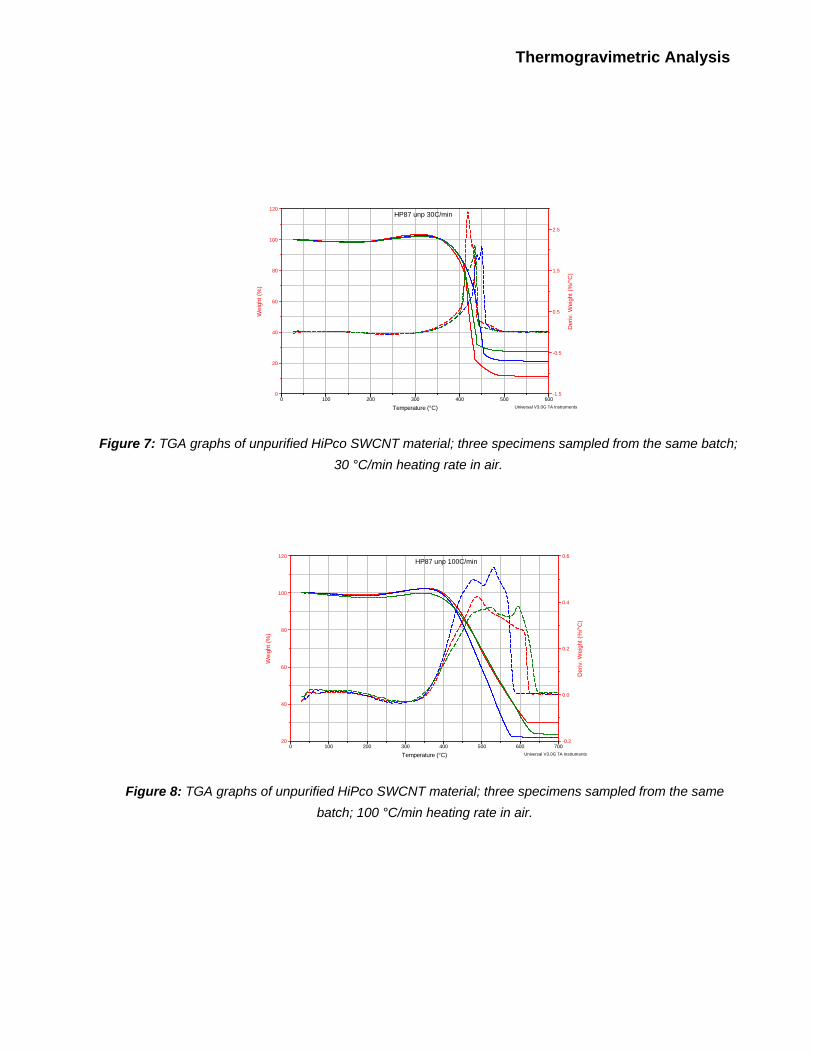
Figure 6: TGA graphs of unpurified HiPco SWCNT material; three specimens sampled from the same batch;
10 °C/min heating rate in air.
Thermogravimetric Analysis
HP87 unp 30C/min
-1.5
-0.5
0.5
1.5
2.5
Der
iv. W
eigh
t (%
/°C
)
0
20
40
60
80
100
120
Wei
ght (
%)
0 100 200 300 400 500 600
Temperature (°C) Universal V3.0G TA Instruments
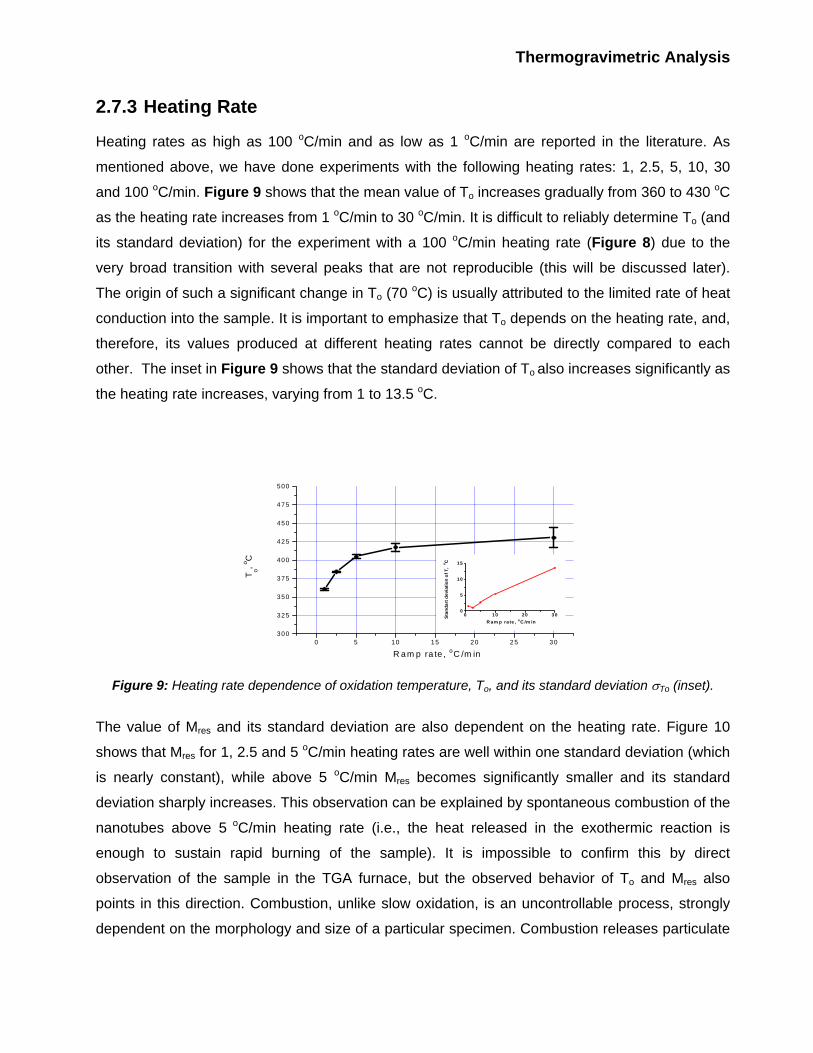
Figure 7: TGA graphs of unpurified HiPco SWCNT material; three specimens sampled from the same batch;
30 °C/min heating rate in air.
HP87 unp 100C/min
-0.2
0.0
0.2
0.4
0.6
Der
iv. W
eigh
t (%
/°C
)
20
40
60
80
100
120
Wei
ght (
%)
0 100 200 300 400 500 600 700
Temperature (°C) Universal V3.0G TA Instruments
Figure 8: TGA graphs of unpurified HiPco SWCNT material; three specimens sampled from the same
batch; 100 °C/min heating rate in air.
Thermogravimetric Analysis
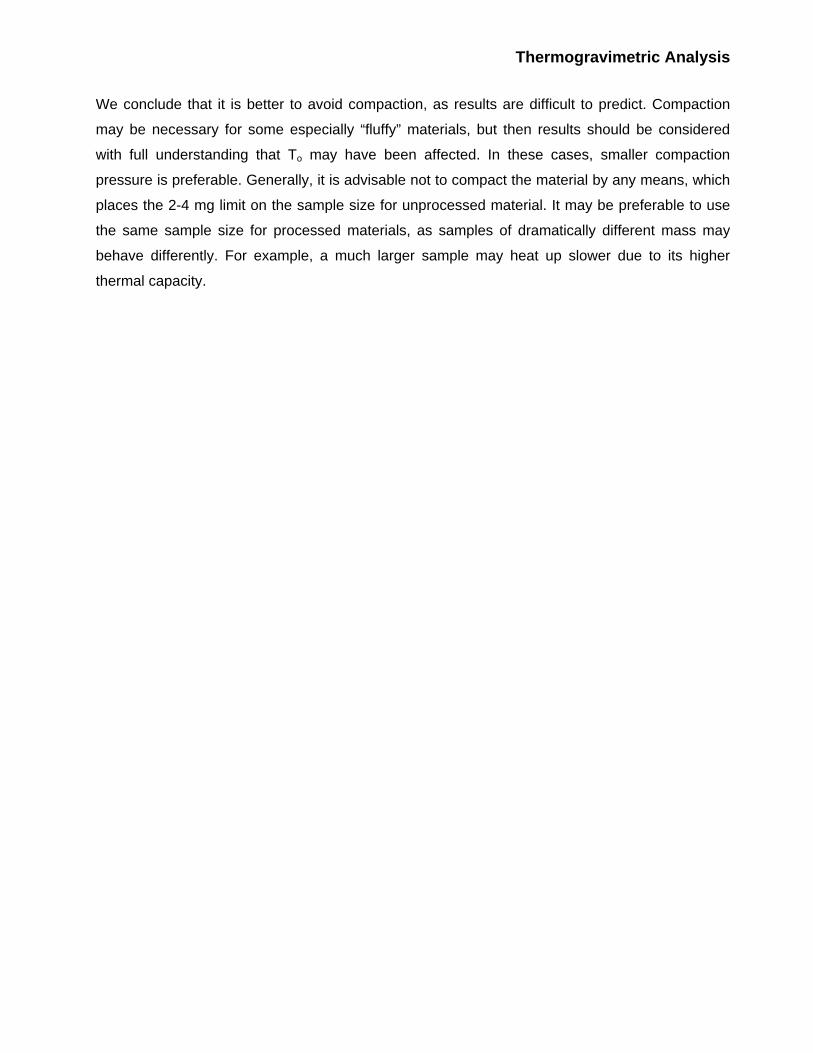
2.7.3 Heating Rate
Heating rates as high as 100 oC/min and as low as 1 oC/min are reported in the literature. As
mentioned above, we have done experiments with the following heating rates: 1, 2.5, 5, 10, 30
and 100 oC/min. Figure 9 shows that the mean value of To increases gradually from 360 to 430 oC
as the heating rate increases from 1 oC/min to 30 oC/min. It is difficult to reliably determine To (and
its standard deviation) for the experiment with a 100 oC/min heating rate (Figure 8) due to the
very broad transition with several peaks that are not reproducible (this will be discussed later).
The origin of such a significant change in To (70 oC) is usually attributed to the limited rate of heat
conduction into the sample. It is important to emphasize that To depends on the heating rate, and,
therefore, its values produced at different heating rates cannot be directly compared to each
other. The inset in Figure 9 shows that the standard deviation of To also increases significantly as
the heating rate increases, varying from 1 to 13.5 oC.
The value of Mres and its standard deviation are also dependent on the heating rate. Figure 10
shows that Mres for 1, 2.5 and 5 oC/min heating rates are well within one standard deviation (which
is nearly constant), while above 5 oC/min Mres becomes significantly smaller and its standard
deviation sharply increases. This observation can be explained by spontaneous combustion of the
nanotubes above 5 oC/min heating rate (i.e., the heat released in the exothermic reaction is
enough to sustain rapid burning of the sample). It is impossible to confirm this by direct
observation of the sample in the TGA furnace, but the observed behavior of To and Mres also
points in this direction. Combustion, unlike slow oxidation, is an uncontrollable process, strongly
dependent on the morphology and size of a particular specimen. Combustion releases particulate
0 5 1 0 15 20 2 5 30300
325
350
375
400
425
450
475
500
T o, o C
R a m p ra te , oC /m in
0 10 20 300
5
10
15
Stan
dart
dev
iatio
n of
T,
o C
R am p ra te , oC /m in
Figure 9: Heating rate dependence of oxidation temperature, To, and its standard deviation σTo (inset).

Thermogravimetric Analysis
matter (smoke) from the sample in a relatively random fashion, therefore reducing residual mass,
which is indeed observed above 5 oC/min as discussed above (Figure 10). A large increase in the
standard deviation of Mr is also consistent with this explanation, as the additional mass loss due
to smoke release in a particular run can vary significantly with the size and morphology of the
specimen. In the absence of combustion, To must depend only on the properties of the nanotube
specimen. On the other hand, when heating rate is fast enough to produce combustion, the peak
in the dM/dt is always reached at the point where combustion begins; therefore, its position
depends also on the morphology of the specimen. This will certainly produce larger standard
deviations of the To, which is consistent with our observations (Figure 9 inset).
TGA traces obtained at 100 oC/min heating rate (Figure 8) do not exhibit signs of combustion.
Instead, mass loss occurs rather gradually in the 400 – 600 oC temperature range. Derivative
weight loss curves do not have well-defined peaks and appear rather irreproducible, making it
impossible to define To. As noted above, combustion increases with the specimen heating rate up
to approximately 50 oC/min. So, in this case, the rate of the temperature increase in the TGA
furnace is actually higher than the maximum heating rate of the specimen that can be achieved
even with the help of combustion. This means that there has to be a significant time lag between
furnace and specimen temperatures, and that mass loss rate depends mostly on the morphology
of the particular sample. This explains the gradual mass loss and poor reproducibility of the
derivative weight curves.
0 5 10 1 5 20 2 5 300
10
20
30
40
50
Mre
s, %
R a m p ra te , oC /m in
0 1 0 20 300
5
10
15
Stan
dart
dev
iatio
n of
M, %
R am p ra te , oC /m in
Figure 10: Heating rate dependence of the residual mass, Mres, and its standard deviation, σMres (inset).

Thermogravimetric Analysis
TGA results obtained with higher heating rates (allowing combustion) become increasingly less
reliable, with standard deviations of To and Mres rapidly increasing (resulting in a systematic
decrease in the Mres values). Therefore, it is important to collect TGA data with heating rates that
do not allow combustion. For the particular HiPco specimen used in this study, only heating rates
of 1 and 2.5 oC/min preclude combustion. However, we have noticed that purified samples that
have much less active catalyst can be run at higher heating rates without combustion.
Selection of the heating rate is also of practical importance. Usually a sample has to be heated to
at least 800 oC, which requires 13.3 hours at a rate of 1 oC/min, compared to 8 min at 100 oC/min.
Heating fast saves time, so the majority of researchers have used 10 - 20 oC/min rates. Based on
the discussion above, we have selected 5 oC/min as a compromise, as each run takes less than 3
hours and we avoid combustion for most types of samples.
2.7.4 Sample Compaction
There is a huge difference in the morphology of “as-is” nanotube material and material that has
been processed into buckypaper (usually after purification, but sometimes unpurified material is
processed into buckypaper by dispersing in a solvent, filtering, and drying). The apparent density
of unprocessed, “as-is” “fluffy” material can be 1 - 2 orders of magnitude smaller than that of
processed material. It is difficult to place more than 2 - 4 mg of unprocessed material into the
sample pan. As a result, some researchers have employed mechanical compaction as a means to
increase apparent density and specimen size.
We have compared TGA results of “as-is” material with material compacted in a standard KBr die
by applying 2, 5 and 10 tons pressure in a hydraulic press. The values of Mres were essentially
unaffected, while compacting at progressively higher pressure leads to a 10-20 °C decrease in
the To values. However, changes in To do not follow a uniform trend. To decreases from 417 oC
to 395 oC as compacting pressure goes from 0 to 5 tons and then increases to 403 oC as
compacting pressure increases to 10 tons. Compacting pressure does not affect the standard
deviations of Mres and To. The reasons for this behavior are not clear. We have noticed that
combustion still occurs at a heating rate of 5 oC/min, which is probably related to the presence of
a considerable amount of active Fe catalyst particles.
Thermogravimetric Analysis
We conclude that it is better to avoid compaction, as results are difficult to predict. Compaction
may be necessary for some especially “fluffy” materials, but then results should be considered
with full understanding that To may have been affected. In these cases, smaller compaction
pressure is preferable. Generally, it is advisable not to compact the material by any means, which
places the 2-4 mg limit on the sample size for unprocessed material. It may be preferable to use
the same sample size for processed materials, as samples of dramatically different mass may
behave differently. For example, a much larger sample may heat up slower due to its higher
thermal capacity.