20 a story of resilience annual report 20
TRANSCRIPT
A N N U A L R E P O R T 2 0 2 0 / 1
A STORY OF RESILIENCE
ANNUAL REPORT 2020

A N N UA L R E P O R T
A STORY OF RESILIENCE
2020
4 / Q A T A R I N S U R A N C E G R O U P A N N U A L R E P O R T 2 0 2 0 / 5
His Highness Sheikh Tamim bin Hamad Al-Thani
The Amir of the State of Qatar

6 / Q A T A R I N S U R A N C E G R O U P A N N U A L R E P O R T 2 0 2 0 / 7
His Highness Sheikh Hamad bin Khalifa Al-Thani
Father Amir
6256
68
66
69
67
7278
136
12
26
18
30
22
50
364046
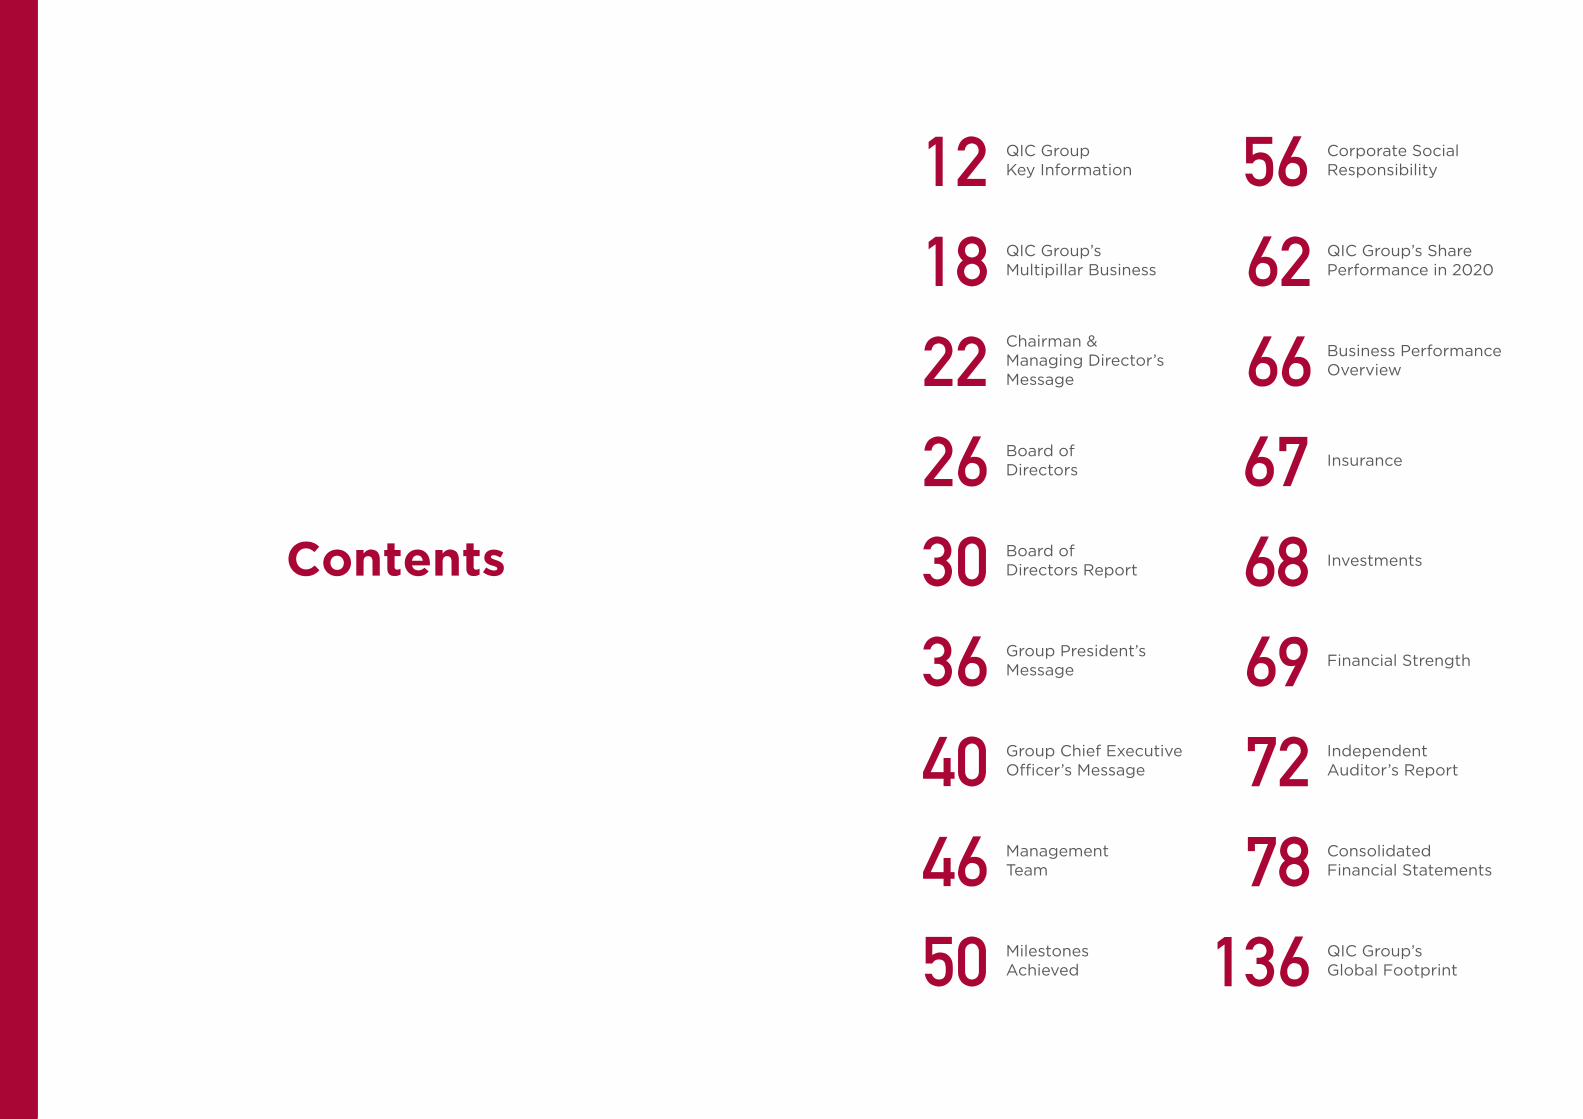
QIC Group Key Information
QIC Group’s Multipillar Business
Chairman & Managing Director’s Message
Board of Directors
Board of Directors Report
Milestones Achieved
Group President’s Message
Group Chief Executive Officer’s Message
Management Team
QIC Group’s Share Performance in 2020
Corporate Social Responsibility
Business Performance Overview
Insurance
Investments
Financial Strength
Independent Auditor’s Report
Consolidated Financial Statements
QIC Group’s Global Footprint
Contents
10 / Q A T A R I N S U R A N C E G R O U P A N N U A L R E P O R T 2 0 2 0 / 11
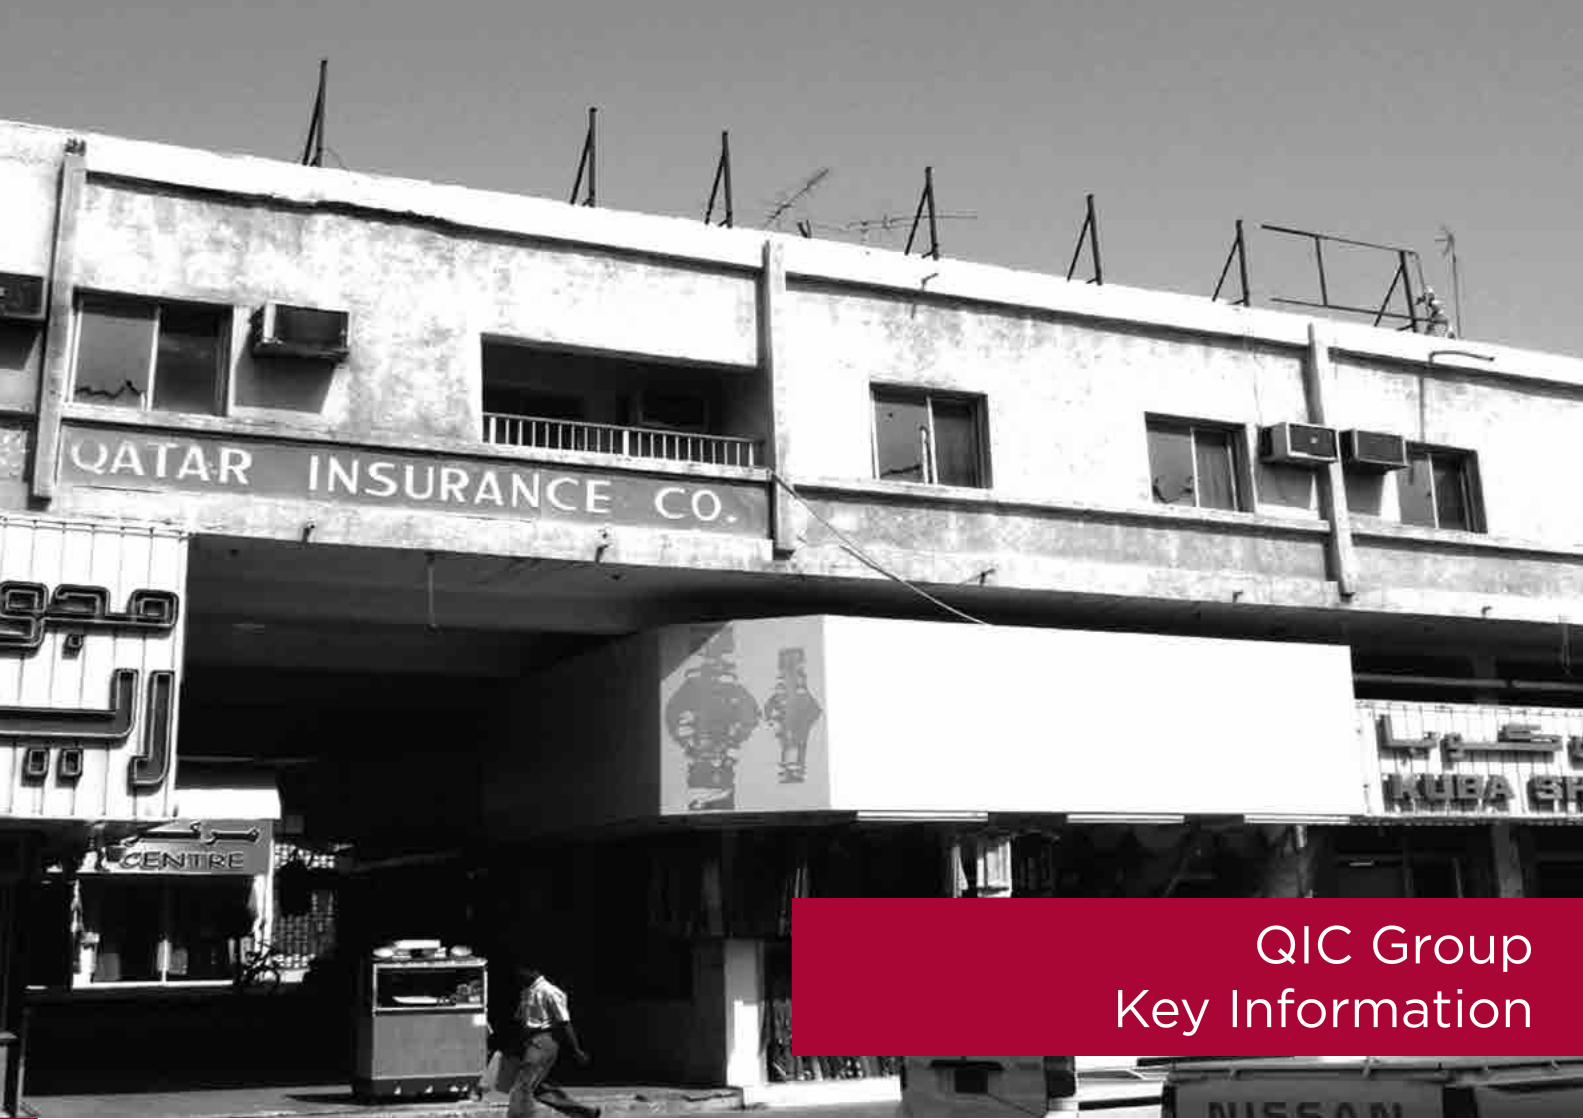
QIC Group Key Information

12 / Q A T A R I N S U R A N C E G R O U P A N N U A L R E P O R T 2 0 2 0 / 13
QIC Group Key Information
QIC
Our Shares
QR Million 2020 2019 2018 2017 2016
Gross premiums written 12,202 12,060 11,823 10,972 9,228
Underwriting results (595) 282 519 56 791
Net profit attributable to parent 101 651 646 418 1,034
Investment & other Income 1,366 1,036 826 958 902
Cash and Investments 25,680 25,079 23,639 22,297 19,112
Total Assets 42,584 39,415 39,165 34,734 28,715
Equity attributable to parent 8,194 8,453 7,726 8,017 8,236
Earnings per share (QR)* (0.004) 0.174 0.174 0.109 0.306
QIC market capitalisation (QR Mn) 7,715 10,321 11,449 14,423 20,449
Dividend per share (QR) - 0.15 1.5 1.5 1.5
Bonus Share (%) - - - 15% 15%
Share price at 31 December (QR) 2.36 3.16 35.9 52.01 84.8
Book value per share (QR) 2.51 2.59 2.37 2.45 2.52
** Disclaimer for A.M. Best: For all rating information including details of the office responsible for issuing the individual ratings please visit A.M. Best’s Ratings & Criteria Center.
*** Disclaimer for S&P Rating: For all rating information please visit www.standardandpoors.com
Financial Strength Rating Standard & Poor’s A.M. Best
QR12.2billionGross written premiums for the year.
QR12.2billion
14 / Q A T A R I N S U R A N C E G R O U P A N N U A L R E P O R T 2 0 2 0 / 15
VisionThe Group’s Vision of the future is to maintain our drive for growth and excellence through innovation, diversification and responsible leadership. By means of existing and new strategic alliances and partnerships we aim to create the optimum framework for continuous profitable development.
Statement of ValuesAt QIC Group we value each employee and acknowledge their own distinctive contribution. We value their effort, their enterprise, their contribution and opinions.
Our Group is built on teamwork, respect and mutual trust. Each person, at whatever level she or he may operate, is empowered and will therefore make their own unique contribution. Each employee is encouraged to be responsible for their own actions. We encourage positive contribution, acknowledge innovation and reward excellence. We encourage a safe workplace, comply with all laws and regulations and strive to meet the expectations and requirements of our customers. We value our customers as trusted partners.
We value constructive feedback and candid comment. We endeavour to absorb these into our business model. Honest criticism is accepted as a valued contribution to our organisation. We meet our obligations to shareholders, customers, employees and society.
S T A B I L I T Y
S E C U R I T Y
S T R E N G T H

16 / Q A T A R I N S U R A N C E G R O U P A N N U A L R E P O R T 2 0 2 0 / 17
Our Multipillar Business
18 / Q A T A R I N S U R A N C E G R O U P A N N U A L R E P O R T 2 0 2 0 / 19
QIC Group’s Multipillar Business
Qatar Insurance Company (QIC)
Qatar Insurance Company (QIC), part of QIC Group is a publicly listed composite insurer with a consistent performance history of 56 years. Founded in 1964, QIC was the first domestic insurance company in the State of Qatar. Since its inception, QIC has consistently navigated individuals and businesses through economic cycles by offering a diverse portfolio of personal (car, home, travel, boat, personal accident benefit) and commercial (energy, marine & aviation, property & commercial, medical & motor) insurances, combining distribution with excellent service delivery. Today QIC is the leading insurer in the MENA region and has an expanding global footprint. QIC is one of the highest rated insurers in the Gulf region with a rating of “A” from Standard & Poor’s and “A (Excellent)” from A.M. Best. In terms of profitability and market capitalization, QIC is the largest insurance company in the MENA region. QIC is listed on the Qatar Stock Exchange and has a market capitalization of over USD 2.1 billion.
QLM Life & Medical Insurance
QLM Life & Medical Insurance W.L.L. differentiates itself from its peers by delivering bespoke innovative medical insurance solutions with unmatched customer service. The company’s core strength lies in its strong financial base, 24/7 in-house operations, a highly experienced team of experts and a wide network of medical service providers. QLM Life & Medical Insurance is well positioned to deliver world-class healthcare services to its multicultural client base.
QLM, which began as a department within QIC, has grown independently apart from QIC into a prosperous separate new Life and Medical insurance entity listed on QSE.
S&P Global Ratings has reassigned its “A-”
issuer credit and financial strength ratings on QLM Life and Medical Insurance Company (QLM) with stable outlook.
Qatar Re
Qatar Re is licensed as a Class 4 insurer and is a global multi-line reinsurer writing all major Property, Casualty and Specialty lines of business. Through its headquarters in Bermuda, and offices in Zurich and London, Qatar Re is close to the world’s major reinsurance markets and the core operations of its clients. Qatar Re is backed by a parental guarantee from Qatar Insurance Company S.A.Q. (QIC) and benefits from QIC’s substantial and growing capital base. Qatar Re is rated “A” by S&P Global Ratings and “A” by A.M. Best. For full details, please refer to the credit agencies sites. Qatar Re has the following fully owned subsidiaries:• QIC Europe Limited (“QEL”) with its head
office in Malta and Branch Office in the UK• Zenith Insurance Company Limited (“ZIP”) –
licensed Motor/Car Insurer based in Gibraltar also operating in the UK
• Markerstudy Insurance Company Limited (“MICL”) – insurer based in Gibraltar also operating in the UK
• St. Julians Insurance Company Limited (“SJICL) – a UK-focused motor insurer, based in Gibraltar (Gibraltar Companies: Markerstudy, Zenith and St. Julians)
In 2018, Qatar Re completed the transaction to acquire Markerstudy Group’s three Gibraltar-based insurance carriers; namely, Zenith, MICL and St Julians Insurance Company Ltd (St Julians), (collectively referred to as the Gibraltar Companies).
Antares Managing Agency Ltd
Antares, (The Managing Agent of Syndicate 1274 “AMAL”); a subsidiary of QIC Group is a
specialist insurer and reinsurer operating at Lloyd’s in London, Shanghai, and Singapore. Lloyd’s is the world’s global insurance and reinsurance market of choice. Antares delivers a worldwide diversified range of Property, Reinsurance, Casualty and Specialty underwriting services through its highly experienced team of underwriters.
Antares is dedicated to providing an efficient and effective service to its clients ensuring quality, security, continuity and a consistent approach to risk transfer. Antares benefits from the consistently strong security ratings assigned to Lloyd’s “A+” from Standard & Poor’s and “A” from A.M. Best.
QIC Europe Ltd
QIC Europe Limited “QEL or the Company” (a wholly owned subsidiary of Qatar Re) is the Malta based insurer which also operates in London.
Regulated by the Malta Financial Services Authority (MFSA), its business model is based on writing insurance sourced through carefully selected Managing General Agents (MGAs) and coinsurance partners across the European Economic Area (EEA).
QEL is backed by a full guarantee from QIC Group, rated “A” by Standard and Poor’s and benefits from the QIC Group’s capital base.
Qatar Economic Advisors
Qatar Economic Advisors (QEA) is a subsidiary of QIC Group, focusing on investment activi-ties. QEA manages the Group’s proprietary investments as well as various investment funds on behalf of third party clients. It has a highly experienced and qualified team of professionals with a collective investment experience of over 100 years. QEA has played
a vital role in making exceptional contributions to the Group’s continued profitability and unparalleled success.
Epicure Investment Management
Founded in May 2019, Epicure Investment Management (EIM) is a 100% subsidiary of QIC Group. EIM is established under the Qatar Financial Centre and is regulated by the Qatar Financial Centre Regulatory Authority. EIM focuses on managing/advising on discretionary investment portfolios, investment funds and other investment products for third party clients as well as the entities under QIC Group.
QICR
QICR is a 100% subsidiary of QIC Group, focusing on real estate investments. QICR’s portfolio consists of high quality real estate assets, mostly in Qatar. The company focuses on investing in income generating real estate assets with strong anchor tenants, with an intention to earn rental income.
Anoud Technologies
Established in the Qatar Financial Centre in April 2020, Anoud Technologies (Anoud Tech) is a wholly owned subsidiary of QIC Group. Anoud Tech – through its close collaboration with Swiss Re – offers Anoud+, a best-in-class insurance IT platform to insurers in developed and emerging markets alike. Anoud+, an internally developed solution, provides insurers an efficient, comprehensive way to manage all aspects of their insurance programs. Anoud Tech’s strategy is aligned with Qatar National Vision 2030, which emphasizes the development of a digital economy as a means of empowering the private sector and reducing the nation’s dependence on hydrocarbon industries.

20 / Q A T A R I N S U R A N C E G R O U P A N N U A L R E P O R T 2 0 2 0 / 21
Chairman & Managing Director’s Message
22 / Q A T A R I N S U R A N C E G R O U P A N N U A L R E P O R T 2 0 2 0 / 23
Chairman & Managing Director’s Message
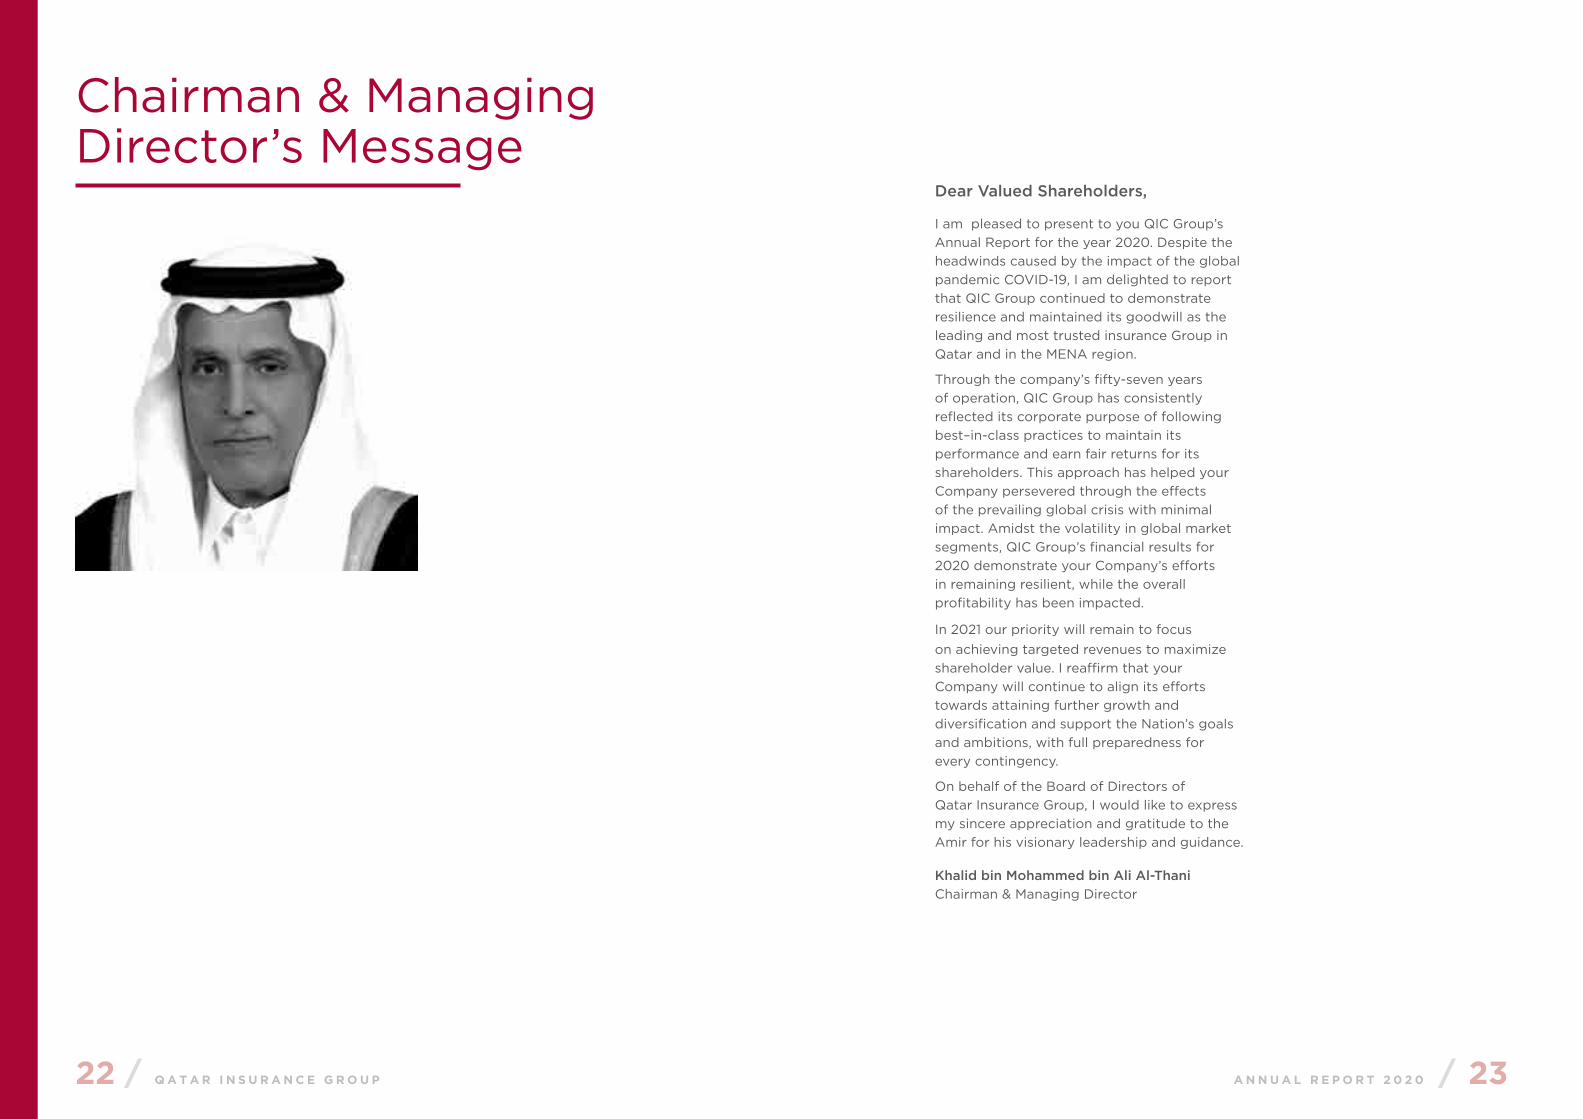
Dear Valued Shareholders,
I am pleased to present to you QIC Group’s Annual Report for the year 2020. Despite the headwinds caused by the impact of the global pandemic COVID-19, I am delighted to report that QIC Group continued to demonstrate resilience and maintained its goodwill as the leading and most trusted insurance Group in Qatar and in the MENA region.
Through the company’s fifty-seven years of operation, QIC Group has consistently reflected its corporate purpose of following best–in-class practices to maintain its performance and earn fair returns for its shareholders. This approach has helped your Company persevered through the effects of the prevailing global crisis with minimal impact. Amidst the volatility in global market segments, QIC Group’s financial results for 2020 demonstrate your Company’s efforts in remaining resilient, while the overall profitability has been impacted.
In 2021 our priority will remain to focus on achieving targeted revenues to maximize shareholder value. I reaffirm that your Company will continue to align its efforts towards attaining further growth and diversification and support the Nation’s goals and ambitions, with full preparedness for every contingency.
On behalf of the Board of Directors of Qatar Insurance Group, I would like to express my sincere appreciation and gratitude to the Amir for his visionary leadership and guidance.
Khalid bin Mohammed bin Ali Al-Thani Chairman & Managing Director
24 / Q A T A R I N S U R A N C E G R O U P A N N U A L R E P O R T 2 0 2 0 / 25
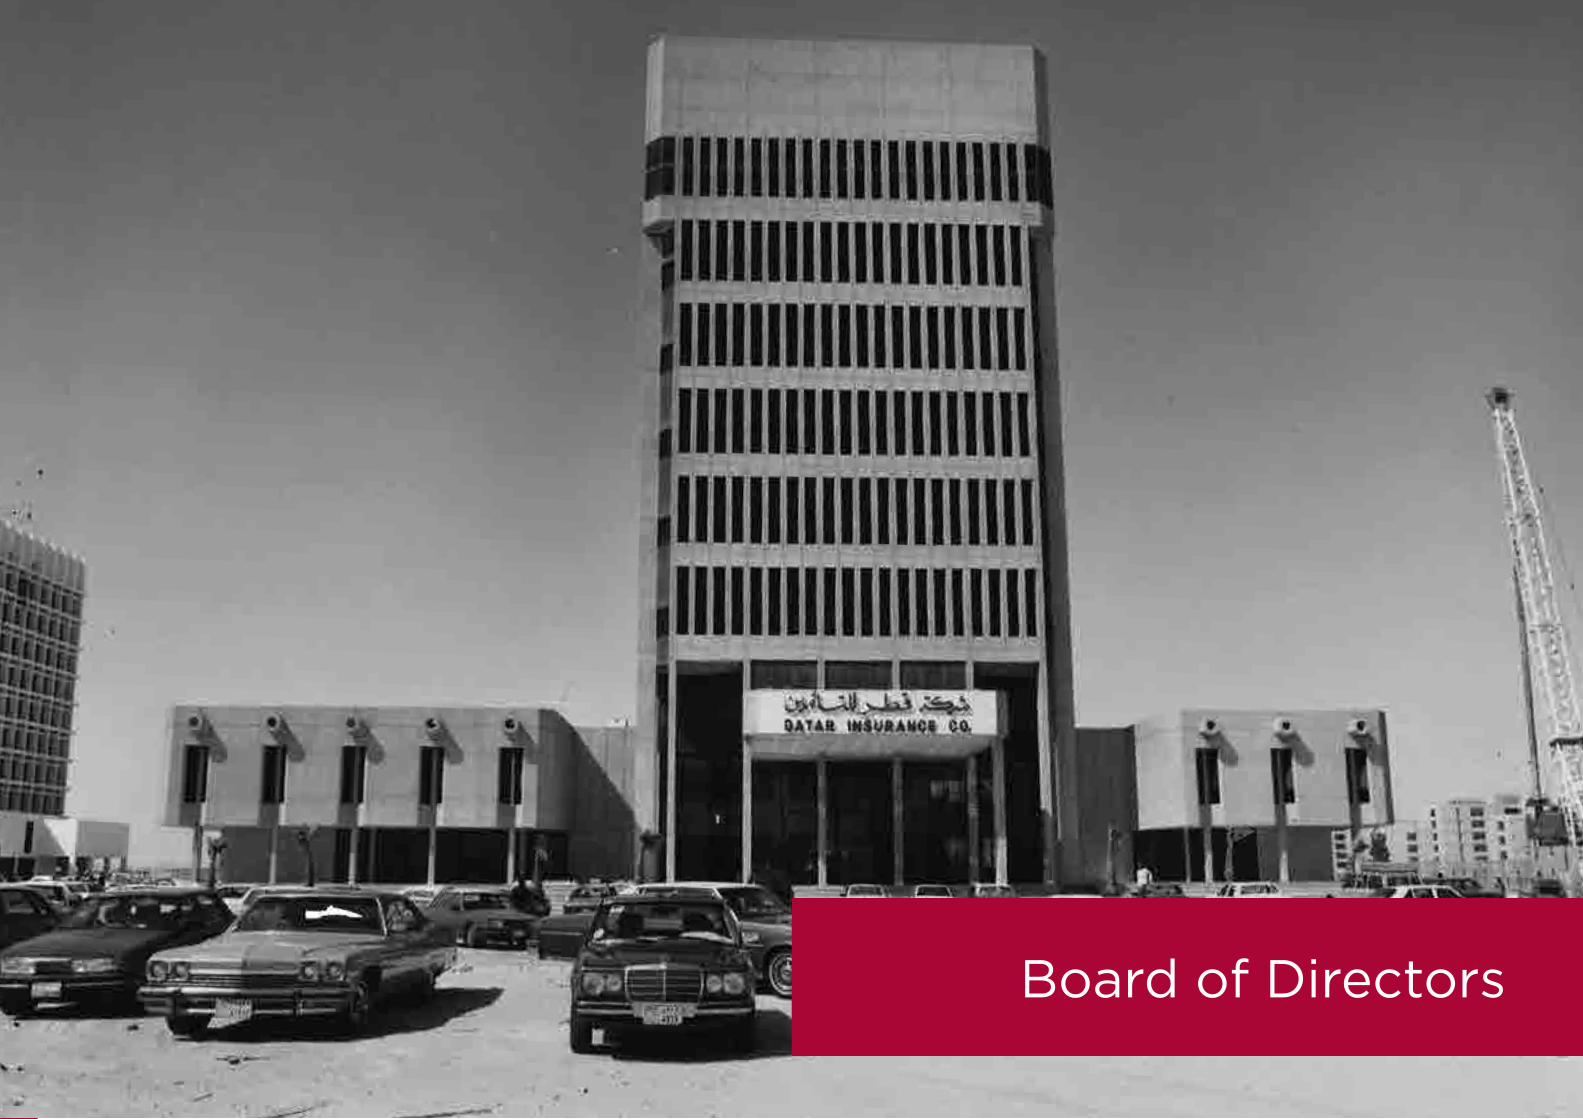
Board of Directors

26 / Q A T A R I N S U R A N C E G R O U P A N N U A L R E P O R T 2 0 2 0 / 27
Board of Directors
Sheikh Khalid bin Mohammed bin Ali Al ThaniChairman & Managing Director
Sheikh Jassim bin Hamad bin Jassim Jabor Al ThaniMember
Mr. Abdullah bin Khalifa Al AttiyaDeputy Chairman
Sheikh Saoud bin Khalid bin Hamad Al ThaniMember
Mr. Hussain Ibrahim Al FardanMember
Sheikh Faisal bin Thani bin Faisal Al ThaniMember
Mr. Mohammed Jassim M A JaidahMember
Sheikh Abdulrahman bin Saud bin Fahad Al ThaniMember
Sheikh Hamad bin Faisal bin Thani Jasim Al ThaniMember
Mr. Ali Yousef Hussein Ali KamalMember
Mr. Khalaf Ahmed Al MannaiMember
Khalifa A. Al SubaeyGroup President
28 / Q A T A R I N S U R A N C E G R O U P A N N U A L R E P O R T 2 0 2 0 / 29
Board of Directors Report
30 / Q A T A R I N S U R A N C E G R O U P A N N U A L R E P O R T 2 0 2 0 / 31
Board of Directors Report
Dear Esteemed Shareholders,
The Board of Directors of QIC is pleased to present the Group’s 56th Annual Report, which includes the Group’s activities, its consolidated financial statements for the year 2020 and its outlook for 2021.
2020: A challenging year for global insurance The COVID-19 pandemic sparked the deepest global economic crisis since the Great Depression of the 1930s. The impact of COVID-19 on global insurance markets was largely felt through the deluge of insurance claims related to business interruption, cancelled events, etc. together with weaker premium growth prospects. The pandemic impacted investment income as a result of plummeting interest rates and elevated levels of capital markets volatility. The global insurance industry has estimated that the 2020 losses arising from COVID-19 pandemic on account of insurance claims and investment portfolio losses were in excess of USD 200 billion.
In 2020 the global insurance industry also had to absorb an estimated USD 83 billion insured catastrophe losses, the 5th costliest in history arising from a record 30 named storms including five named storms making landfall in the US state of Louisiana alone, again the highest on record.
While the Group’s international business was negatively impacted by global losses arising from the COVID-19 pandemic and from catastrophe losses, MENA insurance operations once again delivered an outstanding performance during the year. The COVID-19 pandemic enforced strict lockdown measures helped to maintain satisfactory performance, as motor and medical lines of business saw reduced
claims activity. Gross written premiums for the year remained stable at QAR 12.20 billion, compared to QAR 12.06 billion for 2019. QIC’s MENA direct operations reported Gross Written Premiums of QAR 2.3 billion, compared to QAR 2.2 billion in 2019. Our successful positioning as one of the most digitally transformed insurance companies in the region in the personal line segment, witnessed major growth in the B2C and B2B channels of business during the pandemic. Meanwhile our international business continued its process of de-risking non profitable business and carefully allocating risk capacity from high severity, capital intensive risks to less volatile and lower severity lines of business. The Gross Written Premiums for our international operations stood at QAR 9.9 billion, as compared to QAR 9.8 billion in 2019. Our international business now accounts for 81% of the Group’s total premium base.
The Group’s net underwriting results for the year were directly impacted by the losses arising from the reported global market events of COVID-19 pandemic losses and above normal catastrophe losses. The Group’s net underwriting result stood at a loss of QAR 595 million, as compared to profit of QAR 282 million in 2019. The Group also continued to follow its prudent reserve strengthening policy across the international business, taking into consideration the ongoing litigation in the UK courts regarding pandemic losses, the impact of increases in reserves for our UK motor business arising from indexation of claims, etc. On the other hand, with the exit of several key international insurers from the GCC region our direct business in Qatar and the MENA region continued to strongly consolidate its leading position by demonstrating consistent growth across select lines of business and delivering consistent and healthy underwriting profits.
QIC, based on its diversified business profile, its focus on personal and select commercial lines and its digitally transformed business model is well placed to strengthen its market position and thrive in the post-COVID environment.
Investment Management - An Outstanding Strength of QICIn 2020, QIC’s investment team once again proved its mettle. Despite the unprecedented volatility in global financial markets, QIC’s investment portfolio performed well. Following the lockdown, central banks and governments took unprecedented measures to mitigate its impact by cutting interest rates, extending or relaunching quantitative easing programmes as well as subsidizing or incentivizing economic activities. Inevitably, these measures affected the performance of insurers’ investment portfolios as equities drastically dropped and rebounded while bonds predominately declined. Against this backdrop, QIC achieved a net investment and other income of USD 1,366 million during the year 2020 compared to USD 1,036 million in 2019. On a year-to-year basis the return on investment excluding any one-off gains came at a healthy 3.5%.
The team’s outstanding investment perfor-mance is attributed to careful diversification of the portfolio across geographies and investment classes.
In acknowledgment of our superior asset management capabilities, QIC has been ranked as the “Top Investment House” by The Asset magazine for the third year in a row. The survey ranked top investment houses in Asian G3 bonds (issued by Asian issuers in USD, EUR and JPY) based on the number of votes won by their investors.
Epicure Investment Management Limited, QIC Group’s wholly owned investment
management company is the largest investment manager in Qatar with investments assets in excess of USD 7 billion (including external AUMs) and is also one of the largest Investment Managers in GCC. The Epicure team employs best-in-class qualified investment professionals. Epicure is well placed to be a source of non-insurance revenues in the years to come.
Robust Capital position and Successful Issuance of USD 300 Million Tier 2 Capital NotesDespite the ongoing global uncertainties of historic proportions, and as a testament of offering excellent security to policyholders, our Group’s capital and liquidity position continue to be robust. The Group continues to ensure that the appropriate risk adjusted levels of capital redundancy from a regulatory and S&P/AM Best rating point of view is maintained.
Further enhancing the Group’s robust capital position and reinforcing its efficient capital structure, in May 2020, we successfully issued USD 300 million perpetual non-call 5.5 year subordinated Tier 2 capital notes. Despite the volatility in international debt capital markets, the subscription demand from investors in respect of this Tier- 2 capital raise was outstanding and demonstrated the continued confidence of capital markets/investors in QIC Group. The notes were issued through QIC (Cayman) Limited, a special purpose vehicle incorporated in the Cayman Islands, and guaranteed by Qatar Insurance Company.
QLM Listing on Qatar Stock ExchangeEstablished in 2011, QLM Life & Medical Insurance Company (QLM) has grown into the leading medical and life insurance company in Qatar and among the leaders in the GCC region. QLM has delivered solid profitability and generated exceptional shareholder value during its 10 years of history.
32 / Q A T A R I N S U R A N C E G R O U P A N N U A L R E P O R T 2 0 2 0 / 33
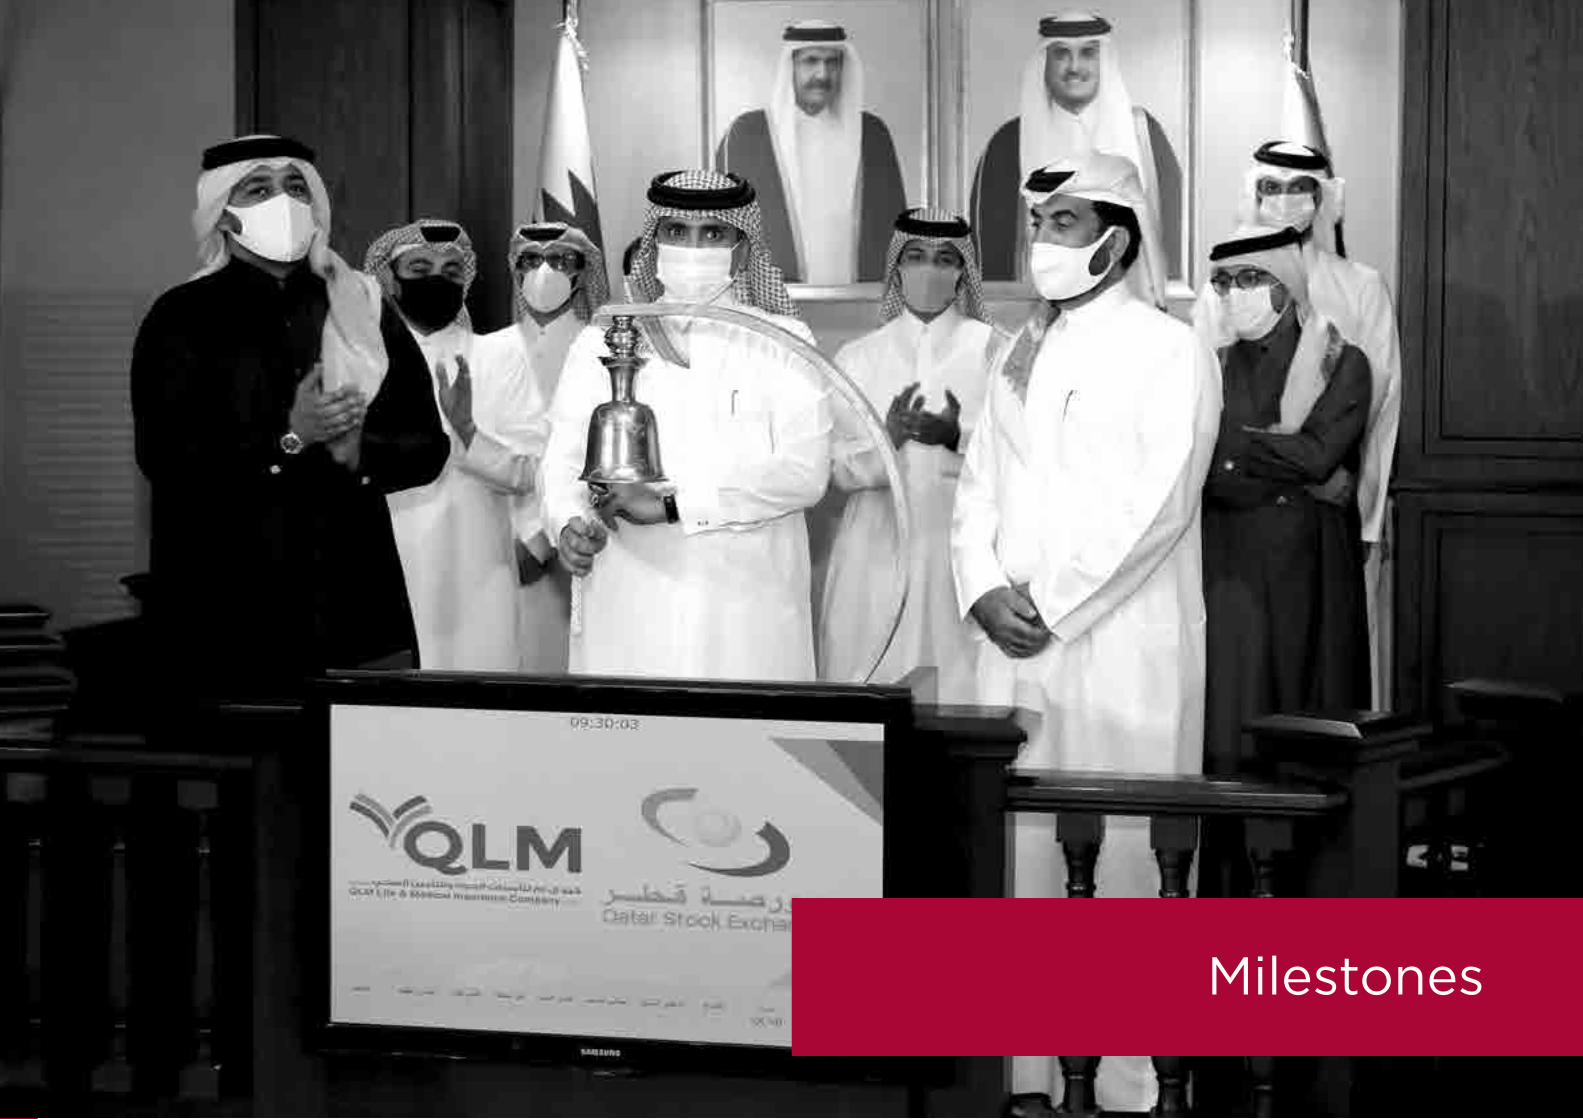
As a testament to QIC’s continued excellence in generating shareholder and enterprise value, in 2020, QLM had a highly successful initial public offering (IPO) in which it offered 60% of its share capital. QLM’s shares commenced trading on the Qatar Stock Exchange on 13 January 2021. This was Qatar’s first IPO since 2019 which saw QLM shares soar by 24% on its first day of trading. The QLM IPO was the country’s first IPO that was conducted completely online. QIC will provide continued commitment and support to QLM and will retain a 25% shareholding in the publicly listed QLM.
Leading Digital Innovation through Anoud TechnologiesAs part of the Group’s strategy to generate new channels of revenue, QIC Group entered into a strategic collaboration with Swiss Re, a leading global reinsurance company, to offer its in-house developed, best-in-class fully integrated, digitally transformed insurance IT platform called Anoud+ to third-party insurers in developed and emerging markets alike. As part of the collaboration, QIC will integrate specialised offerings into its platform to help insurers oversee and manage their underwriting strategy and monitor their exposure to natural catastrophes. Pursuant to this, QIC established a wholly owned IT services subsidiary of QIC Group called Anoud Technologies LLC (Anoud Tech).
Anoud Tech, was recently named by ACORD and Alchemy Crew in the 2020 Top Ten Leaders with the greatest current and future ability to change the industry through InsurTech. ACORD is a non-profit organization in the insurance industry, while Alchemy Crew is a worldwide leader in InsurTech strategy.
Strengthening the Enterprise Risk Management FrameworkQIC Group is a frontrunner in Enterprise Risk Management (ERM) and demonstrates a robust corporate compliance culture. Our risk-based capital adequacy ranks amongst the strongest level, benefiting
from our large capital base. We have been accredited for our exceptionally strong financial flexibility proven by our ability to successfully access capital markets and generate organic growth.
The Group continues to strive to improve its risk management framework that is commensurate with the complexity of our risk portfolio. Our risk management culture and key risk controls continue to improve with a hub and spoke design to develop and integrate a Group-wide ERM framework. Risk modeling is well advanced in some parts of the Group and will be further strengthened once the Group-wide model is finalized.
Investment in Markerstudy Group led by Pollen Street CapitalMarkerstudy Group UK recently concluded a deal for an investment in its Group led by Pollen Street Capital (a UK based independent alternative investment management company). The transaction which is subject to regulatory approvals, will see Pollen Street Capital acquire a substantial stake in MSG Group. QIC Group’s participation in this deal underlines its commitment as a strategic partner to Markerstudy Group. The conclusion of the transaction would also facilitate a substantial repayment of Markerstudy’s debt to QIC.
S&P and AM Best rating Global credit rating agencies, Standard & Poor’s and AM Best, reaffirmed the Group’s “A” rating with Negative Outlook during the year.
Governance CodeQatar Insurance Company has complied with the requirements and principles of governance in accordance with the corporate governance code for legal entities listed in the main market – issued by the Qatar Financial Markets Authority (QFMA), and in accordance with the corporate governance code for insurance companies issued by the Qatar Central Bank (QCB). The Annual Report on Corporate Governance (copy attached) describes the company’s position in terms of
compliance with the corporate governance code. The Annual Report on Corporate Governance will be submitted to Qatar Financial Markets Authority (QFMA) post approval at the AGM.
Nationalization – Our Commitment and Succession Planning EffortsQIC, being a leading insurance group in the region is committed and takes pride in its nationalization efforts in all the geographies it operates in within the region.
Qatarization is always at the forefront in our succession planning in accordance with the country’s efforts to realizing the Qatar National Vision (QNV) 2030. QIC has a track record of empowering younger Qatari talent into demanding corporate roles and executive management positions.
Process Efficiency and Automation EffortsQIC’s continued endeavour towards process efficiency and automation resulted in further improvement of its already exceptionally low administrative expense ratio for its core operations to 6.2%.
In total, the Group reported a consolidated net profit of QAR 126 million for 2020 compared with QAR 671 million for the previous year which resulted in Earnings Per Share of QAR (0.004) per share (2019: QAR 0.174 per share). The Board proposes the non-distribution of dividend for the year 2020 taking into consideration the insignificant net profit achieved during the year.
In addition to serving its shareholders, QIC continues to value its corporate social responsibility and provides support to the community in cultural, sporting and educational initiatives. For this year, QIC has allocated 2.5% of its profits generated from its Qatar operations (QAR 10.8 million) towards such initiatives.
Prudently Optimistic Outlook for 2021 The year 2021 will be a year of prudent optimism for QIC. The financial and economic challenges brought forth by COVID-19 will continue to impact our business down the road. With the current insurance rate hardening to slowly fade away and when policy holders expect insurers to have a greater understanding of their individualized needs, insurance digitization efforts will continue to strengthen in 2021. Qatar and the MENA region are expected to benefit from economic diversification and reduced dependence on hydrocarbon exports.
Qatar will continue to benefit from the ongoing investments for the upcoming FIFA World Cup 2022 and expansion plan of LNG production capacity from 77 million tons p.a to 110 million tons p.a by 2026. We are also encouraged by Qatar’s strengthened economic resilience and the uplifting of blockade as a sign of improving trading conditions in the region.
The entire Board of Directors would like to express its appreciation to the Group’s management team and our employees for their tireless efforts and determination. Our sincere thanks also goes to you, our Esteemed Shareholders, for your continued support to ensure the progress of the Group. Finally, we would like to express our deepest appreciation and gratitude to the wise leadership of H.H. Sheikh Tamim bin Hamad Al Thani, the Amir of the State of Qatar for his continued support and guidance.

34 / Q A T A R I N S U R A N C E G R O U P A N N U A L R E P O R T 2 0 2 0 / 35
Group President’s Message

36 / Q A T A R I N S U R A N C E G R O U P A N N U A L R E P O R T 2 0 2 0 / 37
Group President’s Message
Dear Valued Shareholders,
At QIC Group we are united by a common culture of agility, discipline and co-operation that makes us resilient in the face of adversity. Over the course of 57 years, we have been through and mastered many challenging phases and I assure you that we will continue to prosper.
The year 2020 will be remembered as a year of great uncertainty and economic turmoil, the global pandemic outbreak being a major reason for uncertainty all around. Despite these unprecedented challenges, QIC Group continued on its path of resilience to come out of these challenging times with minimal effect – a reflection of our business principles of STRENGTH, STABILITY and SECURITY.
Despite being a catastrophic year for the global insurance and reinsurance market, Qatar Insurance continued to be one of the major players in the market with 81% contribution from international operations of the Group’s total insurance premiums. Qatar Reinsurance Company, one of the Group’s subsidiaries, was ranked among the top-50 reinsurance companies in the world.
Global insurance industry has estimated 2020 losses arising from the pandemic on account of insurance claims and investment portfolio losses to be in excess of USD 200 billion. An estimated USD 83 billion in 2020 from insured catastrophe losses has severely impacted the profitability of all insurance companies.
Consequent to lockdown measures around the world, central banks and governments took extraordinary measures to mitigate its impact, some of which included cutting interest rates and extending or relaunching quantitative easing programmes as well as subsidizing or incentivizing economic activities. These serious measures have affected many insurers investment portfolios as equities
drastically dropped and rebounded while bonds declined. Even with these prevailing factors, QIC achieved a net investment and other income of USD 1,366 million during the year 2020 compared to USD 1,036 million in 2019. On a year-to-year basis the return on investment excluding any one-off gains came at a healthy 3.5%.
During the year, USD 300 million perpetual non-call 5.5 year subordinated Tier-2 capital notes were issued to further improve Group’s robust capital position and reinforce our efficient capital structure. Despite the volatility in international debt capital markets, the subscription demand from investors in respect of this Tier- 2 capital raise was outstanding and demonstrated the continued confidence of capital markets/investors in QIC Group.
As part of QIC Group’s strategy to create new channels of revenue, a facilitation agreement was signed with Swiss Re, a global leader in reinsurance, for QIC to provide integrated information technology systems to insurance companies in emerging markets. To further support this effort Qatar Insurance Group established a fully owned subsidiary, Anoud Technologies (Anoud Tech). I am also pleased to inform you that Anoud Tech was recently ranked among the top ten pioneers for the year 2020, for its potential, present and future ability to change the insurance sector through technology.
In 2021, our focus will remain on digitizing insurance operations which will help us maintain our competitive edge in the insurance industry.
I would like to express my gratitude to the Board of Directors for their continuous support and guidance.
Khalifa A. Al Subaey Group President
38 / Q A T A R I N S U R A N C E G R O U P A N N U A L R E P O R T 2 0 2 0 / 39
Group Chief Executive Officer’s Message
40 / Q A T A R I N S U R A N C E G R O U P A N N U A L R E P O R T 2 0 2 0 / 41
Group Chief Executive Officer’s Message
I am delighted to present the key business achievements of Qatar Insurance Group during 2020.
Economic OutlookIn the year 2020, the global economy was severely impacted by the outbreak of COVID-19. The region also felt the severe impacts as the oil prices dropped to record lows and the economic activities came to a standstill. The impact of economic turmoil is reflected in the global gross domestic product (GDP) dropping by 4.36% and the GCC GDP dropping by approximately 6%.
The outbreak of COVID-19, which resulted in large scale event cancellations, business interruptions and travel disruptions, created a massive dent on the insurance industry globally. The industry was further impacted by an abnormal US hurricane season with over 30 named hurricanes. Overall the industry suffered colossal underwriting losses during 2020 and QIC was no exception. Despite a very difficult year, QIC proved its resilience and ensured its capital and rating were unaffected.
Financial markets are expected to remain volatile in 2021 due to the continued impact of COVID-19 and interest rate uncertainties. But QIC Group will continue on its path of resilience and will focus on digitization efforts along with other process optimization initiatives that will result in reduced cost of operations and an improved overall profitability.
2021 brings its own challenges as well as opportunities. The global insurance industry
is rising from the ashes and the insurance rates have firmed up significantly. This should benefit the industry globally along with QIC. Further, as the vaccination goes in overdrive, the global economic activity is expected to get back to normal in H2 2021 and 2022. This should impact financial markets positively. Lastly, the resolution of the GCC Conflict, FIFA World Cup 2022, and the planned LNG expansion in Qatar, will benefit QIC positively.
Financial PerformanceWhile the unprecedented challenges of 2020 had an impact on QIC Group’s international business, our MENA insurance operations once again delivered an outstanding performance during the year. Strict lockdown measures across geographies have resulted in lower claims in the direct motor and medical lines of business. Gross Written Premiums for the year remained stable at QAR 12.20 billion, compared to QAR 12.06 billion for 2019. QIC’s MENA direct operations reported Gross Written Premiums of QAR 2.3 billion, compared to QAR 2.2 billion in 2019.
QIC’s acknowledged status as one of the most digital-ready of insurance companies in the region in the personal line segment further paid off. QIC Group’s net underwriting results for the year were directly impacted by the losses arising from the reported global market events arising from the pandemic scenario. It stood at a loss of QAR 595 million, as compared to a profit of QAR 282 million in 2019.
Although our overall profitability was affected by the global financial turmoil, the investment
42 / Q A T A R I N S U R A N C E G R O U P A N N U A L R E P O R T 2 0 2 0 / 43
team has done well to earn an investment and other income of QAR 1,366 million, as compared to QAR 1,036 million in 2019.
Epicure Investment Management Limited, QIC Group’s wholly owned investment management subsidiary, continues to be Qatar’s largest award-winning investment manager and also one of GCC’s largest, with investments assets in excess of USD 7 billion [including external Assets Under Management (AUM)]. Epicure employs best-in-class qualified investment professionals and is one of the key non-insurance channels of revenue for the Group.
Our Group’s capital and liquidity position continues to be robust and is a testament to offering excellent security to policyholders in the face of the many uncertainties that are prevalent. QIC continues to ensure that the appropriate risk-adjusted levels of capital adequacy from a regulatory and S&P/AM Best rating point of view is maintained.
QIC’s continued endeavour towards process efficiency and automation resulted in further improvement of its already exceptionally low administrative expense ratio for its core operations to 6.2%. In total, the Group reported a consolidated net profit of QAR 126 million which resulted in Earnings per Share of QAR (0.004) per share.
International OperationsInternational businesses generated a Gross Written Premium of QAR 9.9 billion, as compared to QAR 9.8 billion in 2019, and now accounts for 81% of the Group’s total premium base. We rigorously continue our ongoing efforts to de-risk non-profitable business and prudently allocating risk capacity from high severity, capital intensive risks to less volatile and lower severity lines of business. The Group also continued to follow its prudent reserve
strengthening policy across the international business.
Developments in Qatar and across the MENA regionQIC Insured reported steady growth through continuous innovations, strategic collaborations, and enhanced digital distribution channels. Applying improved artificial intelligence-based algorithms and predictive analysis across all verticals, we successfully optimized operations that in turn enhanced customer satisfaction and cost efficiencies. Efforts to continuously adopt and improve technology in our operations have positively impacted process efficiencies.
Enterprise Risk ManagementEnterprise Risk Management is at the forefront of all our business decisions as an integral part of our corporate compliance philosophy. It is reflected in the fact that our risk-based capital adequacy ranks amongst the strongest levels, which is supported by our large capital base. It is further strengthened by our ability to easily access capital markets and generate organic growth.
Our risk management efforts are adequately placed to match the complexity or our risk portfolio.
Awards and Recognition2020 was no different when it came to winning awards. I am happy to report that this year we have, as before, received many important honors.
Anoud Tech, a wholly owned IT services subsidiary of the QIC Group, was recently named by ACORD and Alchemy Crew in the ‘2020 TOP TEN LEADERS WITH THE GREATEST CURRENT AND FUTURE ABILITY TO CHANGE THE INDUSTRY THROUGH INSURTECH’. This win endorses QIC’s
strength in the key areas of ‘Collaboration’, ‘Sustainability & Inclusion’, and ‘Global Ecosystem’. It recognises the success of QIC Group’s business strategy of employing cutting-edge technologies in our insurance and reinsurance operations, and of marketing these capabilities to the insurance industry at large.
QIC’s prioritization of investments as a cornerstone for the success of the insurance business saw it being recognized again as the “Top Investment House” for its superior asset management capabilities by ‘The Asset’ magazine for the third consecutive year.
Talent Acquisition and NationalizationQIC has always placed great emphasis on ensuring the right-fit, right employee, especially for the company’s key business and technical positions. Of equal importance has been nationalization, as part of QIC’s succession planning in line with the Qatar National Vision (QNV) 2030 goals. QIC is known for its sustained efforts to train, develop and empower younger Qatari individuals to fulfil demanding corporate roles and take on executive management positions successfully.
The future will see QIC consistently strengthening and upgrading skill sets to promote new standards amongst a new generation of local insurance professionals who will help steer the company to newer heights, in the years to come.
Corporate Social ResponsibilityFor all its success over the years, QIC has never forgotten its non-occupational, socially oriented responsibilities. The company’s Corporate Social Responsibility activities have indeed been an important
component of its corporate identity. 2020 saw the allocation of QAR 10.8 million (2.5% of its profits generated from its Qatar operations) to provide cultural, sporting and educational support to the community.
Looking forwardThe year 2021 will be a year of hope, opportunities, great innovations and a renewed drive to scale new heights.
We will keep moving forward to develop our ability to continuously innovate and digitally transform our business model which will be critical in maintaining our leadership position.
Finally, I wish to express my sincere gratitude to the Group President and the management team for their continuous support.
Salem Khalaf Al Mannai Group Chief Executive Officer

44 / Q A T A R I N S U R A N C E G R O U P A N N U A L R E P O R T 2 0 2 0 / 45
Management Team

46 / Q A T A R I N S U R A N C E G R O U P A N N U A L R E P O R T 2 0 2 0 / 47
Haya Al Mana Group Chief Administrative Officer
Varghese DavidGroup Chief Financial Officer
Khalifa A. Al SubaeyGroup President
Salem Khalaf Al Mannai QIC Group CEO
Sunil TalwarDeputy Group President
Sultan GhaniAdvisor to Group CEO
Ahmed El TabbakhDeputy Group CEO – International
C. M. UnnikrishnanDeputy Group CEO - MENA Operations
Chirag DoshiGroup Chief Investment Officer
Mark GrahamGroup Chief Risk Officer
Management Team
Michael van der Straaten CEO – QIC Global
48 / Q A T A R I N S U R A N C E G R O U P A N N U A L R E P O R T 2 0 2 0 / 49
Milestones
50 / Q A T A R I N S U R A N C E G R O U P A N N U A L R E P O R T 2 0 2 0 / 51
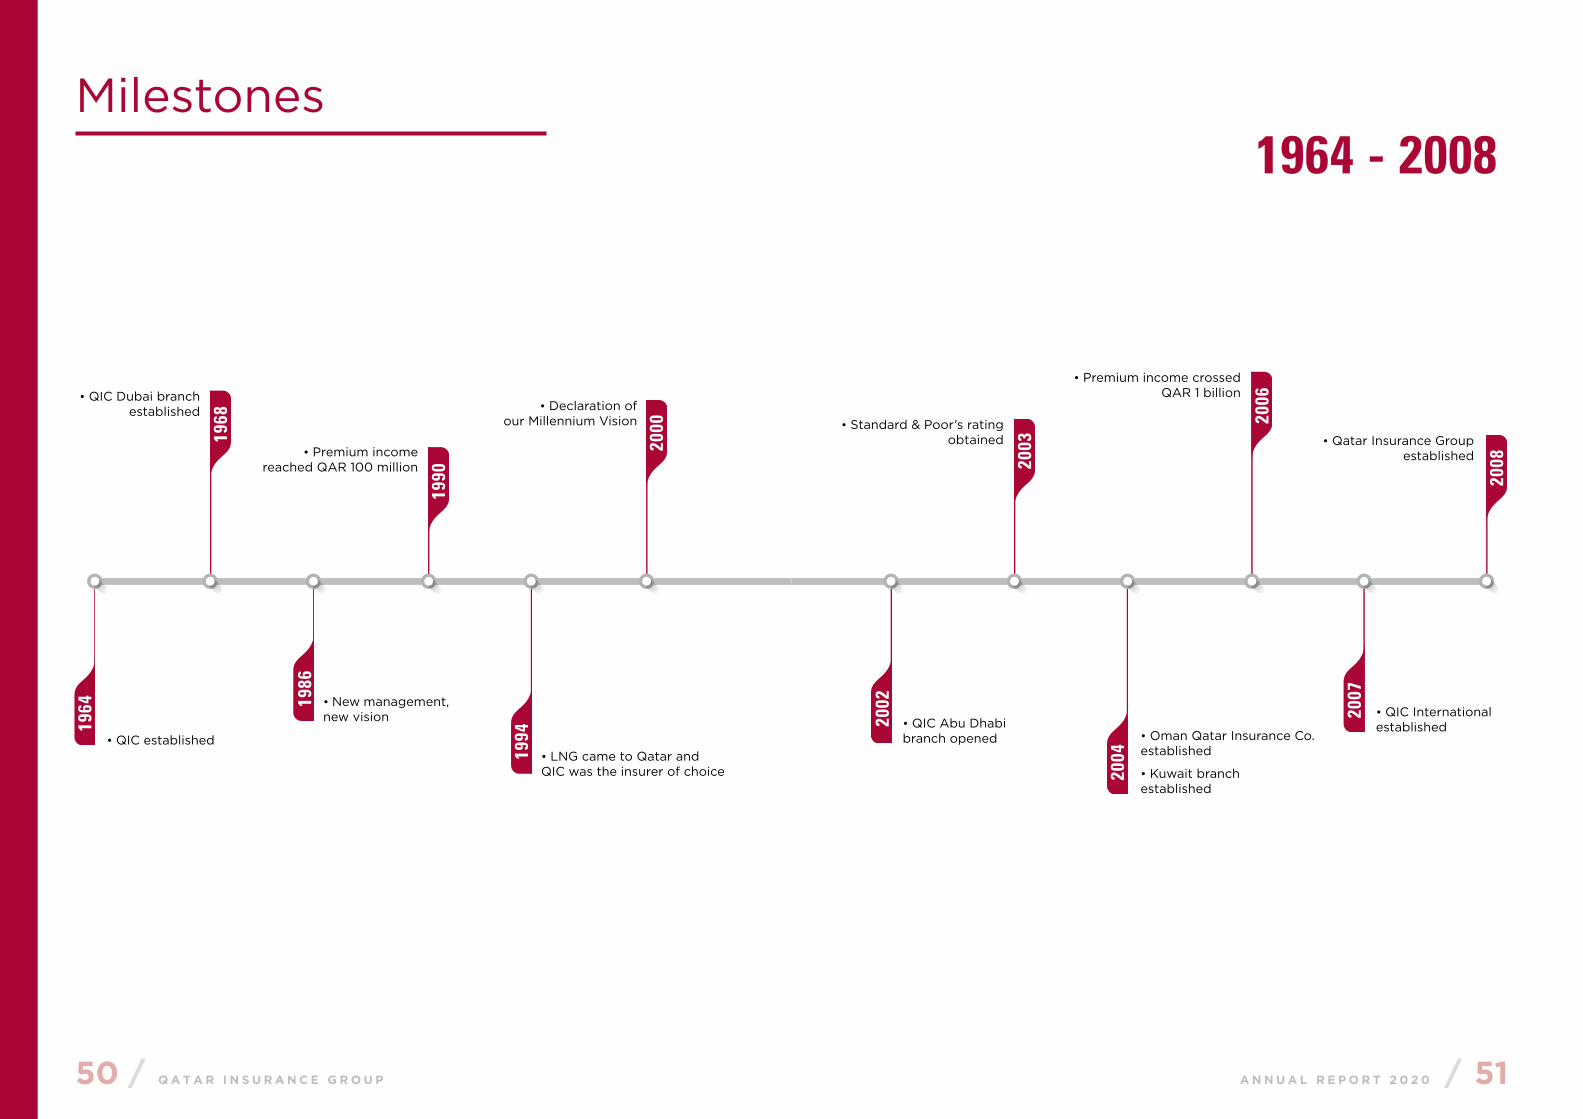
1964 - 2008
2008
• Qatar Insurance Group established
1968
1990
2000
2003
2006• QIC Dubai branch
established
• Premium income reached QAR 100 million
• Declaration of our Millennium Vision • Standard & Poor’s rating
obtained
• Premium income crossed QAR 1 billion
1964 19
86
2002
2004
2007
1994• QIC established
• New management, new vision
• LNG came to Qatar and QIC was the insurer of choice
• QIC Abu Dhabi branch opened • Oman Qatar Insurance Co.
established
• Kuwait branch established
• QIC International established
Milestones

52 / Q A T A R I N S U R A N C E G R O U P A N N U A L R E P O R T 2 0 2 0 / 53
2009 - 2020
• Q Life & Medical Insurance
Company LLC established
• Qatar Re placed USD 450 million perpetual non-call 5.5 subordinated
2 Tier notes
• QIC ranked as ‘Top Investment House’
from MENA Region
• OQIC IPO was oversubscribed 1.4 times
• Qatar Re, reinsurance arm of QIC won ‘Bond Deal of
the Year’ Award
• Premium income crossed USD 1 billion
• Oman Qatar Insurance Company (OQIC) recognized as ‘Best Insurance Company for Online Services & Motor
Insurance’ in Oman
• QIC recognized as the ‘Best Motor Insurance Company
MENA’
• QIC won two prestigious awards at the MENA
Fund Manager Performance Awards
• QIC won ‘Best Digital Transformation in Insurance’
Award
• QIC ranked as ‘Top Investment House from
MENA region’
• Qatar Re ranked amongst global top 50 reinsurers
• Antares Asia, a LIoyd’s Asia Platform, was
established in Singapore
• Qatar Re opened a representative office
in Singapore and a branch office in Dubai
• QLM established a branch in Labuan, Malaysia
• Qatar Re relocated to Bermuda
• Gross Written Premium(GWP) crossed
USD 2 billion for the full year
2011
2013
2015
2017
• Q-Re, our specialist reinsurance company established
• Qatar Re ranked 35th amongst top 50 global reinsurers
• Antares joined the LIoyd’s China platform in Shanghai
• Gross Written Premium (GWP) crossed QAR 9.9 billion for the full year
• Salem Khalaf Al Mannai appointed as Group CEO of Qatar Insurance Group
• QIC issues $300mn Tier 2 capital notes
• QIC ranked for the third year in a row as ‘Top Investment House’ from the MENA region
• A.M. Best Rating obtained
• Qatar Re opened branches in Zurich and Bermuda, and a representative office in London
• Qatar Re’s Markerstudy acquisition marked a significant step towards QIC’s global expansion strategy
• Qatar Re opened a branch office in London
• QIC won ‘2017 MENA Fund Manager Performance’ Award
• Qatar Rail West Bay Station to be named West Bay Qatar Insurance Company
• QIC ranked as ‘Top Investment House from MENA region’
• QIC Group launched QIC Learning Academy
• OQIC won ‘Best Performing Company’ at AIWA awards
• Qatar Re ranked 27th amongst top 50 global reinsurers
• QIC Group’s representation at the Labour Law reform forum hosted by the Qatar Chamber of Commerce & Industry and International Labour Organisation
• QIC established QIC Europe Ltd (QEL)
• Antares acquisition
• Net profit crossed QAR 1 billion
• QIC’s 50th Anniversary
2009
2012
2014
2016
2018
2020
2019

54 / Q A T A R I N S U R A N C E G R O U P A N N U A L R E P O R T 2 0 2 0 / 55
Corporate Social Responsibility

56 / Q A T A R I N S U R A N C E G R O U P A N N U A L R E P O R T 2 0 2 0 / 57
Corporate Social Responsibility (CSR) is an important aspect of the personality of the QIC Group. To QIC Group, CSR is all about building a better world while building its business. And it has succeeded. By supporting and participating in various social service initiatives and environmental engagements, QIC Group has been consistent in demonstrating its commitment towards its societal mission.
Being socially conscious has allowed us to respond, engage and solve the common concerns of the society along with the cooperation of our customers, business partners and affiliates. By unlocking our full potential as a business powerhouse, we have pledged to continue to create resilient communities, which would inherently create a stable society and a sustainable nation.
Sustainability at QIC GroupAt QIC Group, we practice sustainability all the way, through every step of our business activity. We follow best practices to reduce the carbon footprint and ensure viability not only of our business, but also of the environment in which we operate. We have adopted ways to reduce energy consumption, conserve water and support initiatives to give back to the community.
QIC Group has made extensive changes to reduce overall energy consumption and become more energy efficient. For instance, to lower the overall power consumption, QIC Group has encouraged staff to turn off PCs, printers and other electrical devices before leaving the office. We have ensured regular maintenance of facilities to ensure that they function in an energy-efficient manner. QIC Group has retrofitted its lighting systems with energy efficient LED lights to reduce the energy consumption. In fact, to enhance the
energy efficiency score of HVAC systems, QIC Group has installed switchers that reduce the overall power consumption to a minimum level especially after office hours and on weekends. We have adopted measures to reduce paper consumption and inculcate the practice of storing files in various digital formats.
QIC Group has participated in various social, environmental and community service engagements to achieve its societal mission and demonstrate its commitment towards Corporate Social Responsibility. Every year QIC Group allocates approximately 2.5% of profits generated from Qatar operations towards supporting activities related to charitable causes, sporting and cultural events that uphold the values of the community, and create causes for a sustainable future. As it moves ahead, QIC Group will continue to support such initiatives to create a scalable impact and set the foundation for a highly dynamic society and a sustainable nation.
Corporate Social Responsibility

58 / Q A T A R I N S U R A N C E G R O U P A N N U A L R E P O R T 2 0 2 0 / 59
Katara International Exhibition for Kahraman Sponsor
A first of its kind, the Katara International Exhibition for Kahraman which QIC Group sponsored displayed rare, invaluable beads made of authentic Kahraman (Amber) from around the world. It brought together traders and collectors of Kahraman beads, along with craftsmen who hand-made the beads from natural fossilized resin. Being socially conscious has allowed us to respond, engage and solve the common concerns of society along with the cooperation of our customers, business partners and affiliates.
Blood Donation Drive
Organized in collaboration with Hamad Medical Corporation (HMC) Blood Donation Unit, HMC mobilized its blood donation bus along with its medical unit to assist in the successful completion of the blood donation drive. For QIC Group the blood donation campaign serves as an important socially oriented initiative, which creates a positive societal impact.
Over $1 million raised for Covid-19 Medical Supplies in Bermuda
QIC Global is listed as a contributor to the Bermudian Hospitals Board for medical equipment amid the COVID-19 global pandemic for collectively raising $1,044,000 for essential medical supplies and equipment, including personal protective equipment and ventilators, along with international and local businesses in Bermuda.
Sponsorship of the Insurance Institute of London Annual Prize
Annual sponsorship of The QIC Global Underwriting Prize (Strategic Underwriting Unit 995) in association with Insurance Institute of London.
Official Insurance Sponsor of S’hail – Katara International Hunting & Falcons Exhibition
Held at the Cultural Village Foundation in Katara, S’hail is regarded as the largest international exhibition that specializes in exhibiting Falcons and its handling equipment with participants from different countries across the world.
CSR Engagements in 2020

60 / Q A T A R I N S U R A N C E G R O U P A N N U A L R E P O R T 2 0 2 0 / 61
QIC Group’s Share Performance in 2020

62 / Q A T A R I N S U R A N C E G R O U P A N N U A L R E P O R T 2 0 2 0 / 63
GCC Markets Reported Mixed Performance in 2020 The year 2020 was an extraordinary one for the global markets. The unprecedented stimulus measures and vaccine breakthroughs following the coronavirus crash have led to a rapid rebound in stocks sending them to record highs. The MSCI World Index gained 14.1 per cent. The MSCI Emerging Markets Index followed global markets higher, up 15.8 per cent. Brent recovered at the end of the year but still closed the year 21.5 per cent lower.
The performance of QIC shares remained volatile in 2020 against the performance of QE index as 2020 results was adversely impacted by the effects of coronavirus pandemic & CAT losses. QIC shares fell 25.3 per cent in the year vs. a flat performance recorded by the QE index. Adjusting for the dividends, QIC’s total returns for 2020 would have been -21.4%. QE insurance index also declined 12.4 per cent in 2020. Gulf Cooperation Council (GCC) markets had a mixed performance. Most remained in the red for most of the year impacted by the coronavirus pandemic and the oil price decline. Saudi Arabia outperformed its GCC Peers, gaining 3.6 percent in 2020, while Qatar was flat and other GCC markets ended the year in the red.
Strong policy response by Qatari government helped soften the health and economic effects of the pandemic and the fall in oil prices.
Qatar announced 2021 budget with huge spending on major projects, as well as on education and health, affirming the importance of these sectors. US$19.8 billion has been allocated for major projects, a 37 per cent of the total expenditure worth US$53.5 billion. The budget also allocated funds to develop citizens’ lands by providing an integrated
infrastructure of water, electricity, sewage, roads, and all other facilities in different regions of the country. Development of these lands will lead to the expansion of residential communities, which would enhance urban expansion. 2021 budget showcases Qatar’s resilience and durability amid the impact of pandemic on the global economy.
IMF expects a gradual recovery in Qatar with real GDP growth expected at 2.7 per cent in 2021, supported by increasing gas production and the rebound in domestic demand. Expansion of the North Field will increase Qatar’s hydrocarbon production by about 64 per cent by 2027. The upcoming FIFA World Cup will generate opportunities for Qatar and the region. Forecasts indicate that upwards of 1.7 million people could visit Qatar during the tournament with approximately 500,000 visitors in the country on the busiest days.
On January 5, during a GCC summit in Saudi Arabia, GCC leaders signed a solidarity and stability agreement to end a 43-month long blockade against Qatar. The end of the blockade will bring political stability in the region and build a stronger GCC block. The opening of airspace and land borders will help tourism (both leisure and business) and trade & investment in the region. Real estate and hospitality sectors will benefit as the pandemic eases and GCC tourists start to visit Qatar. Additionally, Qatari bank’s funding and liquidity profile would also get a boost. Qatari banking system had witnessed ~US$30 billion outflow of deposits when the blockade was imposed which was managed by ~US$40 billion liquidity injection by the government.
QIC Group’s Share Performance in 2020
120.00
105.00
90.00
75.00
60.00
Dec
-19
Jan-
20
Feb
-20
Mar
-20
Ap
r-20
May
-20
Jun-
20
Jul-
20
Aug
-20
Sep
-20
Oct
-20
Nov
-20
Dec
-20
QATI QD Equity DSM Index QINS Index

64 / Q A T A R I N S U R A N C E G R O U P A N N U A L R E P O R T 2 0 2 0 / 65
Business Performance Overview

66 / Q A T A R I N S U R A N C E G R O U P A N N U A L R E P O R T 2 0 2 0 / 67
2016
791
56
519282
-595
1,200
900
-900
600
-600
300
-300
02017 2018 2019
2020
International Domestic Regional P & C Marine & Avation
Health & Life
81%
10%
9%
88%
8%9%
2016
9,228
10,97211,823 12,060 12,20213,000
10,500
8,000
5,500
3,000
500
02017 2018 2019 2020
QIC Group’s Business Performance Overview Insurance
2016
1,034
418
646 651
101
1,200
1,000
800
600
400
200
02017 2018 2019 2020 2016
28,71534,734
39,165 39,41542,584
50,000
40,000
30,000
20,000
10,000
02017 2018 2019 2020
2016
20,449
14,42311,449 10,321
7,715
25,000
20,000
15,000
10,000
5,000
02017 2018 2019 20202016
8,236 8,017 7,7268,453 8,194
10,000
7,500
5,000
2,500
02017 2018 2019 2020
Net Profit Attributable to Parent(QR Million)
Market Capitalization(QR Million)
Total Assets(QR Million)
Net Underwriting Results(QR Million)
Gross Premium Written Domestic Vs International Vs Regional
Gross Premium Written Line of Business
Ratio Analysis 2020 2019 2018 2017 2016
Retention Ratio (%) 67 86 86 82 87
Net technical reserves/net premium written (%) 193 139 138 146 129
Net loss reserves/net premium written (%) 144 93 95 94 80
Net Equity(QR Million)
Gross Premium(QR Million)
68 / Q A T A R I N S U R A N C E G R O U P A N N U A L R E P O R T 2 0 2 0 / 69
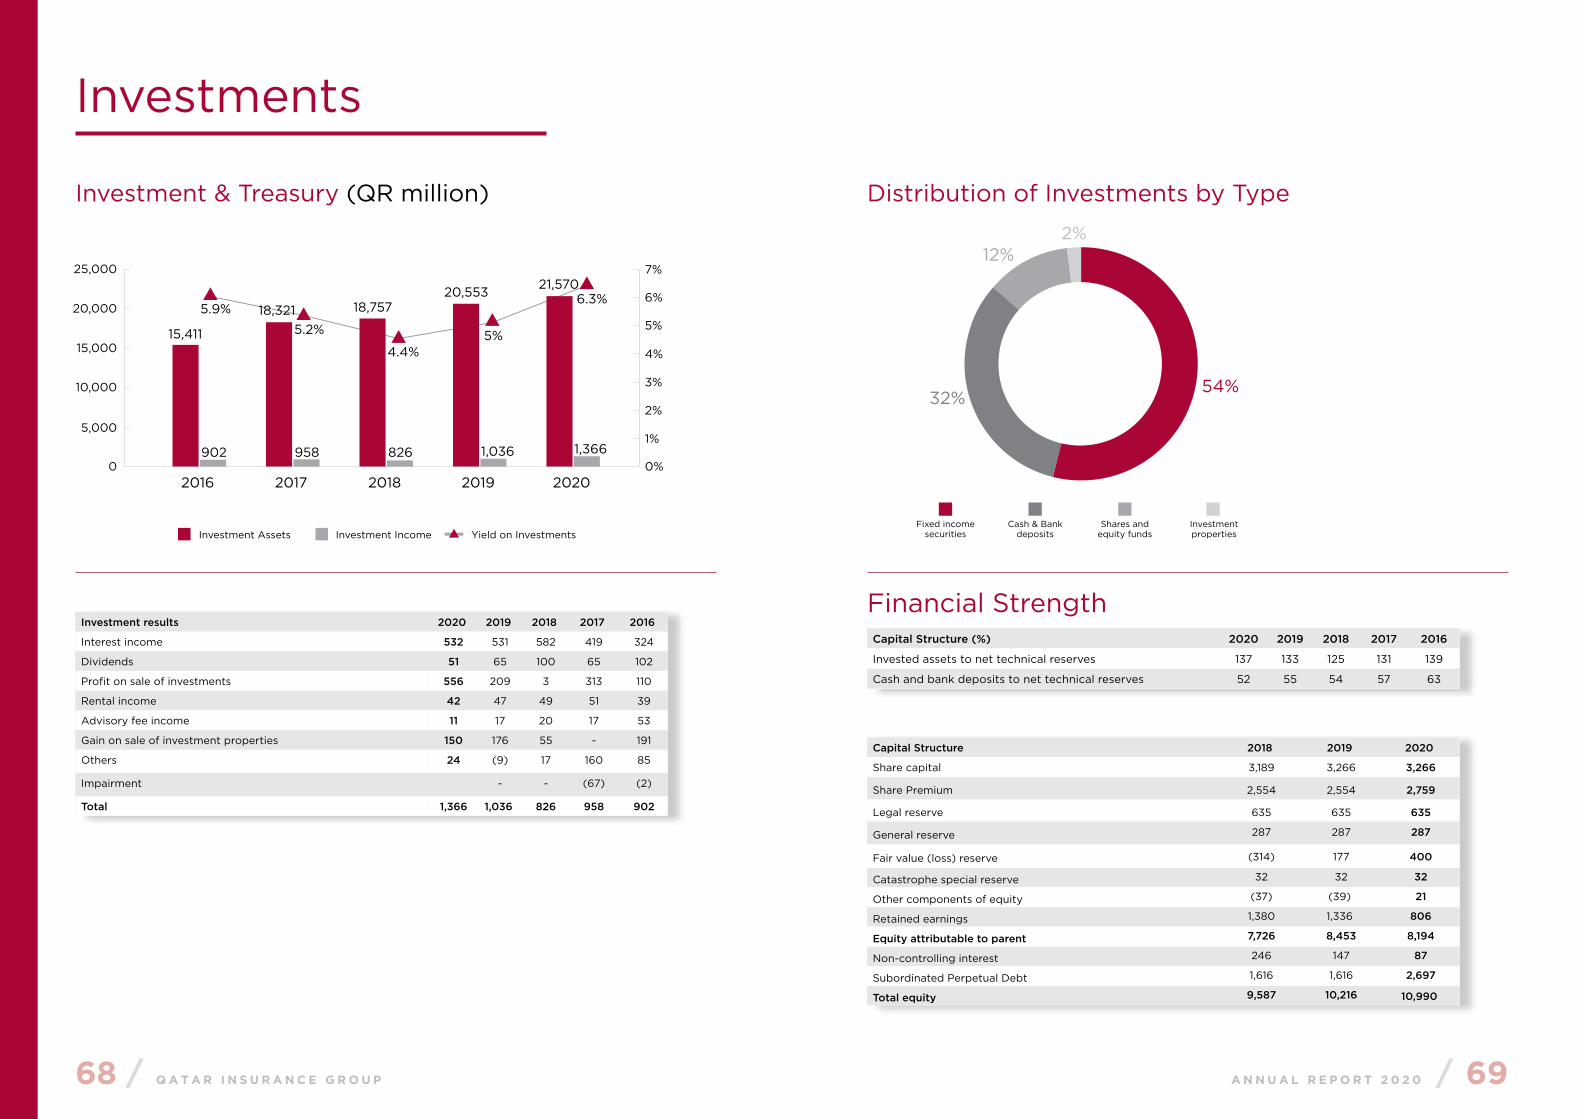
Investment & Treasury (QR million)
Investment Assets Investment Income Yield on Investments
54%Fixed income
securities
33%Cash & Bank
Deposits
12%Shares and
equtiy funds
2%Investment properties
2016
15,411
902 958 826 1,036 1,366
5.2%
4.4%5%
6.3%5.9% 18,321 18,757
20,553 21,570 25,000
20,000
15,000
10,000
5,000
0 0%
1%
2%
3%
4%
5%
6%
7%
2017 2018 2019 2020
Investment results 2020 2019 2018 2017 2016
Interest income 532 531 582 419 324
Dividends 51 65 100 65 102
Profit on sale of investments 556 209 3 313 110
Rental income 42 47 49 51 39
Advisory fee income 11 17 20 17 53
Gain on sale of investment properties 150 176 55 - 191
Others 24 (9) 17 160 85
Impairment - - (67) (2)
Total 1,366 1,036 826 958 902
Fixed income securities
Cash & Bank deposits
Shares and equity funds
Investment properties
54%32%
12%2%
Financial Strength
Distribution of Investments by Type
Investments
Capital Structure (%) 2020 2019 2018 2017 2016
Invested assets to net technical reserves 137 133 125 131 139
Cash and bank deposits to net technical reserves 52 55 54 57 63
Capital Structure 2018 2019 2020
Share capital 3,189 3,266 3,266
Share Premium 2,554 2,554 2,759
Legal reserve 635 635 635
General reserve 287 287 287
Fair value (loss) reserve (314) 177 400
Catastrophe special reserve 32 32 32
Other components of equity (37) (39) 21
Retained earnings 1,380 1,336 806
Equity attributable to parent 7,726 8,453 8,194
Non-controlling interest 246 147 87
Subordinated Perpetual Debt 1,616 1,616 2,697
Total equity 9,587 10,216 10,990
70 / Q A T A R I N S U R A N C E G R O U P A N N U A L R E P O R T 2 0 2 0 / 71
Independent Auditor’s Report
72 / Q A T A R I N S U R A N C E G R O U P A N N U A L R E P O R T 2 0 2 0 / 73
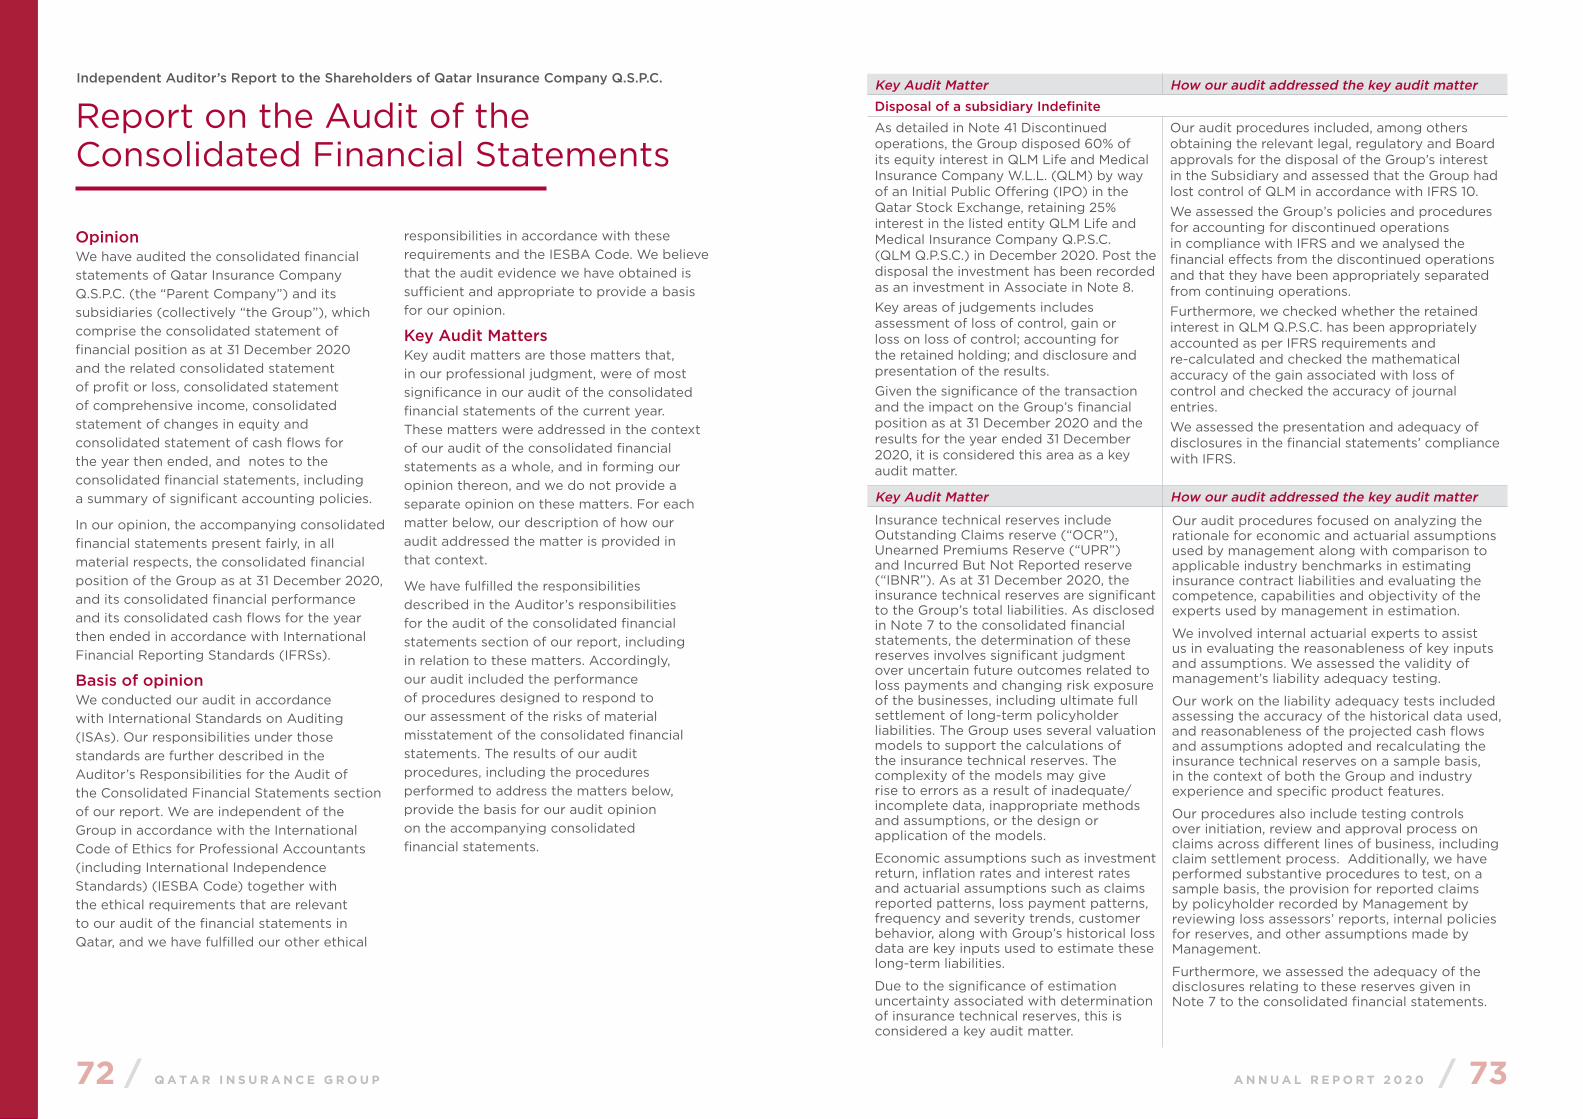
Report on the Audit of the Consolidated Financial Statements
OpinionWe have audited the consolidated financial statements of Qatar Insurance Company Q.S.P.C. (the “Parent Company”) and its subsidiaries (collectively “the Group”), which comprise the consolidated statement of financial position as at 31 December 2020 and the related consolidated statement of profit or loss, consolidated statement of comprehensive income, consolidated statement of changes in equity and consolidated statement of cash flows for the year then ended, and notes to the consolidated financial statements, including a summary of significant accounting policies.
In our opinion, the accompanying consolidated financial statements present fairly, in all material respects, the consolidated financial position of the Group as at 31 December 2020, and its consolidated financial performance and its consolidated cash flows for the year then ended in accordance with International Financial Reporting Standards (IFRSs).
Basis of opinion We conducted our audit in accordance with International Standards on Auditing (ISAs). Our responsibilities under those standards are further described in the Auditor’s Responsibilities for the Audit of the Consolidated Financial Statements section of our report. We are independent of the Group in accordance with the International Code of Ethics for Professional Accountants (including International Independence Standards) (IESBA Code) together with the ethical requirements that are relevant to our audit of the financial statements in Qatar, and we have fulfilled our other ethical
responsibilities in accordance with these requirements and the IESBA Code. We believe that the audit evidence we have obtained is sufficient and appropriate to provide a basis for our opinion.
Key Audit MattersKey audit matters are those matters that, in our professional judgment, were of most significance in our audit of the consolidated financial statements of the current year. These matters were addressed in the context of our audit of the consolidated financial statements as a whole, and in forming our opinion thereon, and we do not provide a separate opinion on these matters. For each matter below, our description of how our audit addressed the matter is provided in that context.
We have fulfilled the responsibilities described in the Auditor’s responsibilities for the audit of the consolidated financial statements section of our report, including in relation to these matters. Accordingly, our audit included the performance of procedures designed to respond to our assessment of the risks of material misstatement of the consolidated financial statements. The results of our audit procedures, including the procedures performed to address the matters below, provide the basis for our audit opinion on the accompanying consolidated financial statements.
Independent Auditor’s Report to the Shareholders of Qatar Insurance Company Q.S.P.C. Key Audit Matter How our audit addressed the key audit matterDisposal of a subsidiary IndefiniteAs detailed in Note 41 Discontinued operations, the Group disposed 60% of its equity interest in QLM Life and Medical Insurance Company W.L.L. (QLM) by way of an Initial Public Offering (IPO) in the Qatar Stock Exchange, retaining 25% interest in the listed entity QLM Life and Medical Insurance Company Q.P.S.C. (QLM Q.P.S.C.) in December 2020. Post the disposal the investment has been recorded as an investment in Associate in Note 8.Key areas of judgements includes assessment of loss of control, gain or loss on loss of control; accounting for the retained holding; and disclosure and presentation of the results.Given the significance of the transaction and the impact on the Group’s financial position as at 31 December 2020 and the results for the year ended 31 December 2020, it is considered this area as a key audit matter.
Our audit procedures included, among others obtaining the relevant legal, regulatory and Board approvals for the disposal of the Group’s interest in the Subsidiary and assessed that the Group had lost control of QLM in accordance with IFRS 10.We assessed the Group’s policies and procedures for accounting for discontinued operations in compliance with IFRS and we analysed the financial effects from the discontinued operations and that they have been appropriately separated from continuing operations.Furthermore, we checked whether the retained interest in QLM Q.P.S.C. has been appropriately accounted as per IFRS requirements and re-calculated and checked the mathematical accuracy of the gain associated with loss of control and checked the accuracy of journal entries.We assessed the presentation and adequacy of disclosures in the financial statements’ compliance with IFRS.
Insurance technical reserves include Outstanding Claims reserve (“OCR”), Unearned Premiums Reserve (“UPR”) and Incurred But Not Reported reserve (“IBNR”). As at 31 December 2020, the insurance technical reserves are significant to the Group’s total liabilities. As disclosed in Note 7 to the consolidated financial statements, the determination of these reserves involves significant judgment over uncertain future outcomes related to loss payments and changing risk exposure of the businesses, including ultimate full settlement of long-term policyholder liabilities. The Group uses several valuation models to support the calculations of the insurance technical reserves. The complexity of the models may give rise to errors as a result of inadequate/incomplete data, inappropriate methods and assumptions, or the design or application of the models.
Economic assumptions such as investment return, inflation rates and interest rates and actuarial assumptions such as claims reported patterns, loss payment patterns, frequency and severity trends, customer behavior, along with Group’s historical loss data are key inputs used to estimate these long-term liabilities.
Due to the significance of estimation uncertainty associated with determination of insurance technical reserves, this is considered a key audit matter.
Our audit procedures focused on analyzing the rationale for economic and actuarial assumptions used by management along with comparison to applicable industry benchmarks in estimating insurance contract liabilities and evaluating the competence, capabilities and objectivity of the experts used by management in estimation.
We involved internal actuarial experts to assist us in evaluating the reasonableness of key inputs and assumptions. We assessed the validity of management’s liability adequacy testing.
Our work on the liability adequacy tests included assessing the accuracy of the historical data used, and reasonableness of the projected cash flows and assumptions adopted and recalculating the insurance technical reserves on a sample basis, in the context of both the Group and industry experience and specific product features.
Our procedures also include testing controls over initiation, review and approval process on claims across different lines of business, including claim settlement process. Additionally, we have performed substantive procedures to test, on a sample basis, the provision for reported claims by policyholder recorded by Management by reviewing loss assessors’ reports, internal policies for reserves, and other assumptions made by Management.
Furthermore, we assessed the adequacy of the disclosures relating to these reserves given in Note 7 to the consolidated financial statements.
Key Audit Matter How our audit addressed the key audit matter

74 / Q A T A R I N S U R A N C E G R O U P A N N U A L R E P O R T 2 0 2 0 / 75
Report on the Audit of the Consolidated Financial Statements (continued)
Independent Auditor’s Report to the Shareholders of Qatar Insurance Company Q.S.P.C. (continued)
Other information included in the Group’s 2020 Annual ReportOther information consists of the information included in the Group’s annual report (the “Annual Report”), other than the Group’s consolidated financial statements and our auditor’s report thereon. The Group’s 2020 Annual Report is expected to be made available to us after the date of this auditor’s report. Our opinion on the consolidated financial statements does not cover the other information and we do not express any form of assurance conclusion thereon.
In connection with our audit of the consolidated financial statements, our responsibility is to read the other information and, in doing so, consider whether the other information is materially inconsistent with the consolidated financial statements or our knowledge obtained in the audit, or otherwise appears to be materially misstated.
Responsibilities of management and the Board of Directors for the consolidated financial statementsManagement is responsible for the preparation and fair presentation of the consolidated financial statements in accordance with IFRSs, and for such internal control as management determines is necessary to enable the preparation of consolidated financial statements that are free from material misstatement, whether due to fraud or error.
In preparing the consolidated financial statements, management is responsible for assessing the Group’s ability to continue as a going concern, disclosing, as applicable, matters related to going concern and using the going concern basis of accounting unless management either intends to liquidate the
Group or to cease operations, or has no realistic alternative but to do so.
The Board of Directors are responsible for overseeing the Group’s financial reporting process.
Auditor’s responsibilities for the audit of the consolidated financial statementsOur objectives are to obtain reasonable assurance about whether the consolidated financial statements as a whole are free from material misstatement, whether due to fraud or error, and to issue an auditor’s report that includes our opinion. Reasonable assurance is a high level of assurance, but is not a guarantee that an audit conducted in accordance with ISA will always detect a material misstatement when it exists. Misstatements can arise from fraud or error and are considered material if, individually or in the aggregate, they could reasonably be expected to influence the economic decisions of users taken on the basis of these consolidated financial statements.
As part of an audit in accordance with ISAs, we exercise professional judgment and maintain professional skepticism throughout the audit. We also:• Identify and assess the risks of material
misstatement of the consolidated financial statements, whether due to fraud or error, design and perform audit procedures responsive to those risks, and obtain audit evidence that is sufficient and appropriate to provide a basis for our opinion. The risk of not detecting a material misstatement resulting from fraud is higher than for one resulting from error, as fraud may involve collusion, forgery, intentional omissions, misrepresentations, or the override of internal control.
• Obtain an understanding of internal control relevant to the audit in order to design audit procedures that are appropriate in the circumstances, but not for the purpose of expressing an opinion on the effectiveness of the Group’s internal control.
• Evaluate the appropriateness of accounting policies used and the reasonableness of accounting estimates and related disclosures made by management.
• Conclude on the appropriateness of management’s use of the going concern basis of accounting and, based on the audit evidence obtained, whether a material uncertainty exists related to events or conditions that may cast significant doubt on the Group’s ability to continue as a going concern. If we conclude that a material uncertainty exists, we are required to draw attention in our auditor’s report to the related disclosures in the consolidated financial statements or, if such disclosures are inadequate, to modify our opinion. Our conclusions are based on the audit evidence obtained up to the date of our auditor’s report. However, future events or conditions may cause the Group to cease to continue as a going concern.
• Evaluate the overall presentation, structure and content of the consolidated financial statements, including the disclosures, and whether the consolidated financial statements represent the underlying transactions and events in a manner that achieves fair presentation.
• Obtain sufficient appropriate audit evidence regarding the financial information of the entities or business activities within the Group to express an opinion on the consolidated financial statements. We are responsible for the direction, supervision and performance of the Group audit. We remain solely responsible for our audit opinion.
We communicate with the Board of Directors regarding, among other matters, the planned scope and timing of the audit and significant
audit findings, including any significant deficiencies in internal control that we identify during our audit.
We also provide the Board of Directors with a statement that we have complied with relevant ethical requirements regarding independence, and to communicate with them all relationships and other matters that may reasonably be thought to bear on our independence, and where applicable, actions taken to eliminate threats or safeguards applied..
From the matters communicated with the Board of Directors, we determine those matters that were of most significance in the audit of the consolidated financial statements of the current year and are therefore the key audit matters. We describe these matters in our auditor’s report unless law or regulation precludes public disclosure about the matter or when, in extremely rare circumstances, we determine that a matter should not be communicated in our report because the adverse consequences of doing so would reasonably be expected to outweigh the public interest benefits of such communication.
Report on Legal and Other Regulatory RequirementsFurthermore, in our opinion, proper books of account have been kept by the Group and the consolidated financial statements comply with the Qatar Commercial Companies Law No. 11 of 2015, the applicable provisions of Qatar Central Bank Law No. 13 of 2012 and the Company’s Articles of Association. We have obtained all the information and explanations we required for the purpose of our audit, and are not aware of any violations of the above mentioned laws or the Articles of Association having occurred during the year, which might have had a material adverse effect on the Group’s financial position or performance.
Ahmed Sayed of Ernst & Young Auditor’s Registration No. 326
Doha, State of Qatar Date: 14 February 2021
76 / Q A T A R I N S U R A N C E G R O U P A N N U A L R E P O R T 2 0 2 0 / 77
Consolidated Financial Statements
78 / Q A T A R I N S U R A N C E G R O U P A N N U A L R E P O R T 2 0 2 0 / 79
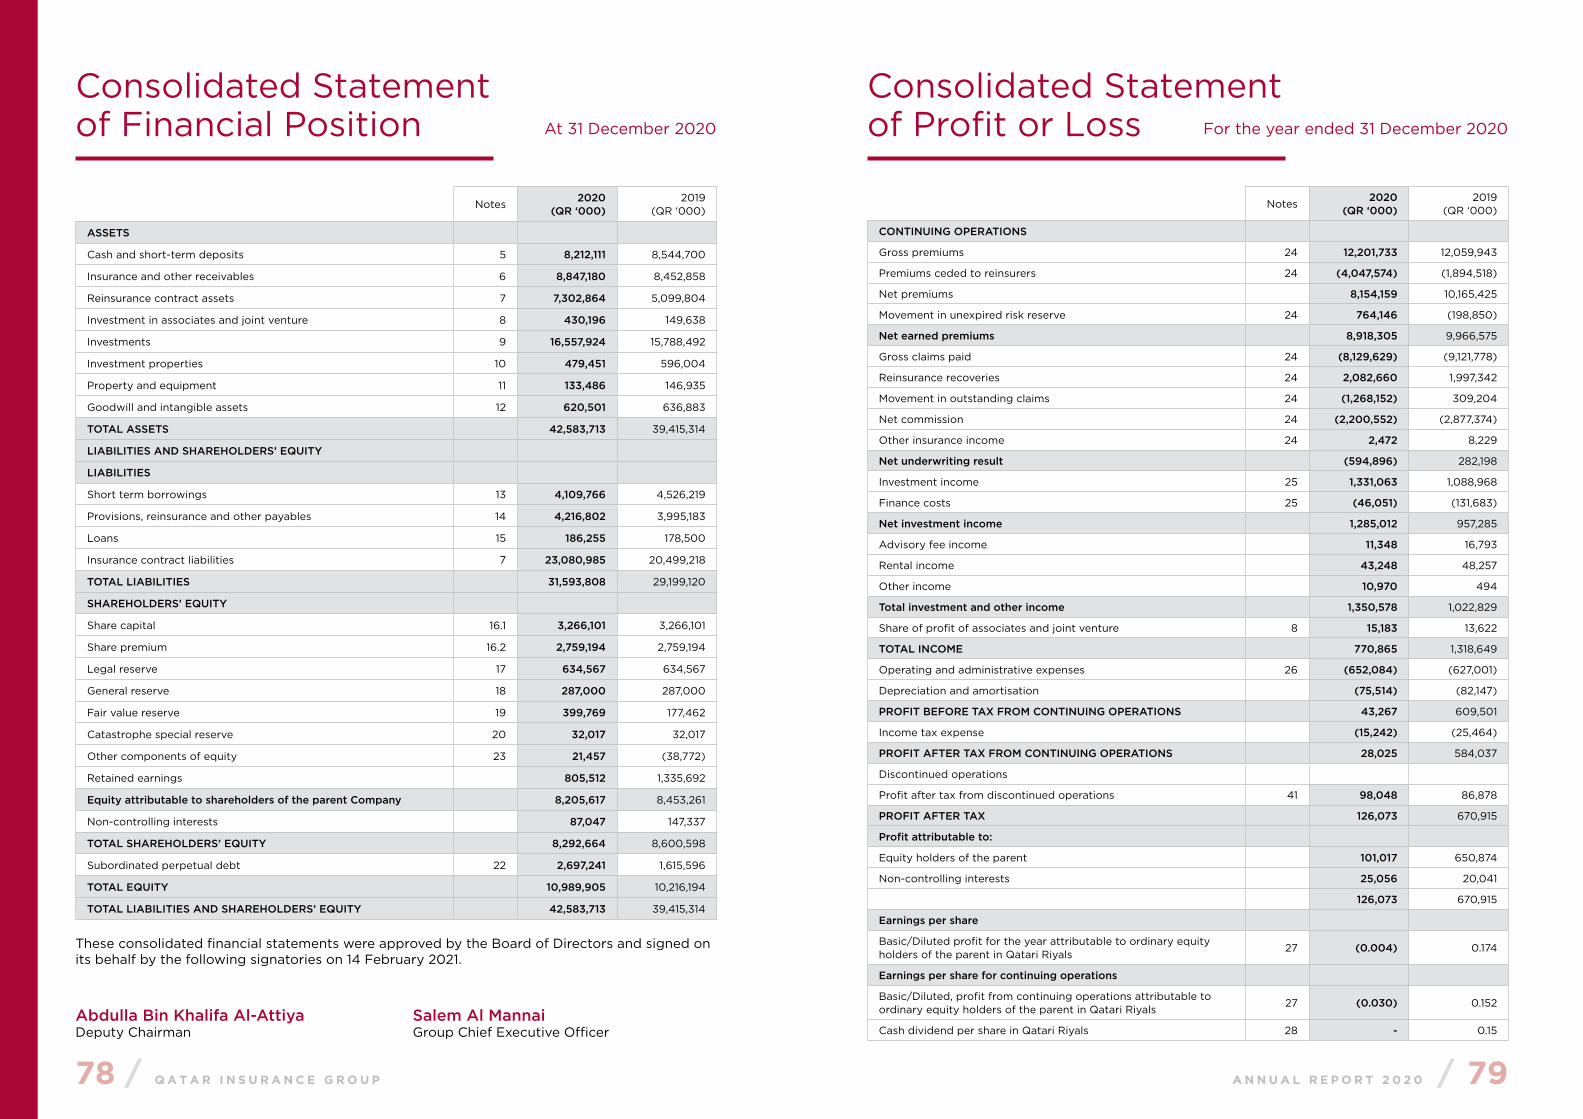
Consolidated Statement of Financial Position At 31 December 2020
Consolidated Statementof Profit or Loss For the year ended 31 December 2020
Notes2020
(QR ‘000)2019
(QR ‘000)
ASSETS
Cash and short-term deposits 5 8,212,111 8,544,700
Insurance and other receivables 6 8,847,180 8,452,858
Reinsurance contract assets 7 7,302,864 5,099,804
Investment in associates and joint venture 8 430,196 149,638
Investments 9 16,557,924 15,788,492
Investment properties 10 479,451 596,004
Property and equipment 11 133,486 146,935
Goodwill and intangible assets 12 620,501 636,883
TOTAL ASSETS 42,583,713 39,415,314
LIABILITIES AND SHAREHOLDERS’ EQUITY
LIABILITIES
Short term borrowings 13 4,109,766 4,526,219
Provisions, reinsurance and other payables 14 4,216,802 3,995,183
Loans 15 186,255 178,500
Insurance contract liabilities 7 23,080,985 20,499,218
TOTAL LIABILITIES 31,593,808 29,199,120
SHAREHOLDERS’ EQUITY
Share capital 16.1 3,266,101 3,266,101
Share premium 16.2 2,759,194 2,759,194
Legal reserve 17 634,567 634,567
General reserve 18 287,000 287,000
Fair value reserve 19 399,769 177,462
Catastrophe special reserve 20 32,017 32,017
Other components of equity 23 21,457 (38,772)
Retained earnings 805,512 1,335,692
Equity attributable to shareholders of the parent Company 8,205,617 8,453,261
Non-controlling interests 87,047 147,337
TOTAL SHAREHOLDERS’ EQUITY 8,292,664 8,600,598
Subordinated perpetual debt 22 2,697,241 1,615,596
TOTAL EQUITY 10,989,905 10,216,194
TOTAL LIABILITIES AND SHAREHOLDERS’ EQUITY 42,583,713 39,415,314
These consolidated financial statements were approved by the Board of Directors and signed on its behalf by the following signatories on 14 February 2021.
Abdulla Bin Khalifa Al-AttiyaDeputy Chairman
Salem Al Mannai Group Chief Executive Officer
Notes2020
(QR ‘000)2019
(QR ‘000)
CONTINUING OPERATIONS
Gross premiums 24 12,201,733 12,059,943
Premiums ceded to reinsurers 24 (4,047,574) (1,894,518)
Net premiums 8,154,159 10,165,425
Movement in unexpired risk reserve 24 764,146 (198,850)
Net earned premiums 8,918,305 9,966,575
Gross claims paid 24 (8,129,629) (9,121,778)
Reinsurance recoveries 24 2,082,660 1,997,342
Movement in outstanding claims 24 (1,268,152) 309,204
Net commission 24 (2,200,552) (2,877,374)
Other insurance income 24 2,472 8,229
Net underwriting result (594,896) 282,198
Investment income 25 1,331,063 1,088,968
Finance costs 25 (46,051) (131,683)
Net investment income 1,285,012 957,285
Advisory fee income 11,348 16,793
Rental income 43,248 48,257
Other income 10,970 494
Total investment and other income 1,350,578 1,022,829
Share of profit of associates and joint venture 8 15,183 13,622
TOTAL INCOME 770,865 1,318,649
Operating and administrative expenses 26 (652,084) (627,001)
Depreciation and amortisation (75,514) (82,147)
PROFIT BEFORE TAX FROM CONTINUING OPERATIONS 43,267 609,501
Income tax expense (15,242) (25,464)
PROFIT AFTER TAX FROM CONTINUING OPERATIONS 28,025 584,037
Discontinued operations
Profit after tax from discontinued operations 41 98,048 86,878
PROFIT AFTER TAX 126,073 670,915
Profit attributable to:
Equity holders of the parent 101,017 650,874
Non-controlling interests 25,056 20,041
126,073 670,915
Earnings per share
Basic/Diluted profit for the year attributable to ordinary equity holders of the parent in Qatari Riyals
27 (0.004) 0.174
Earnings per share for continuing operations
Basic/Diluted, profit from continuing operations attributable to ordinary equity holders of the parent in Qatari Riyals
27 (0.030) 0.152
Cash dividend per share in Qatari Riyals 28 - 0.15
80 / Q A T A R I N S U R A N C E G R O U P A N N U A L R E P O R T 2 0 2 0 / 81
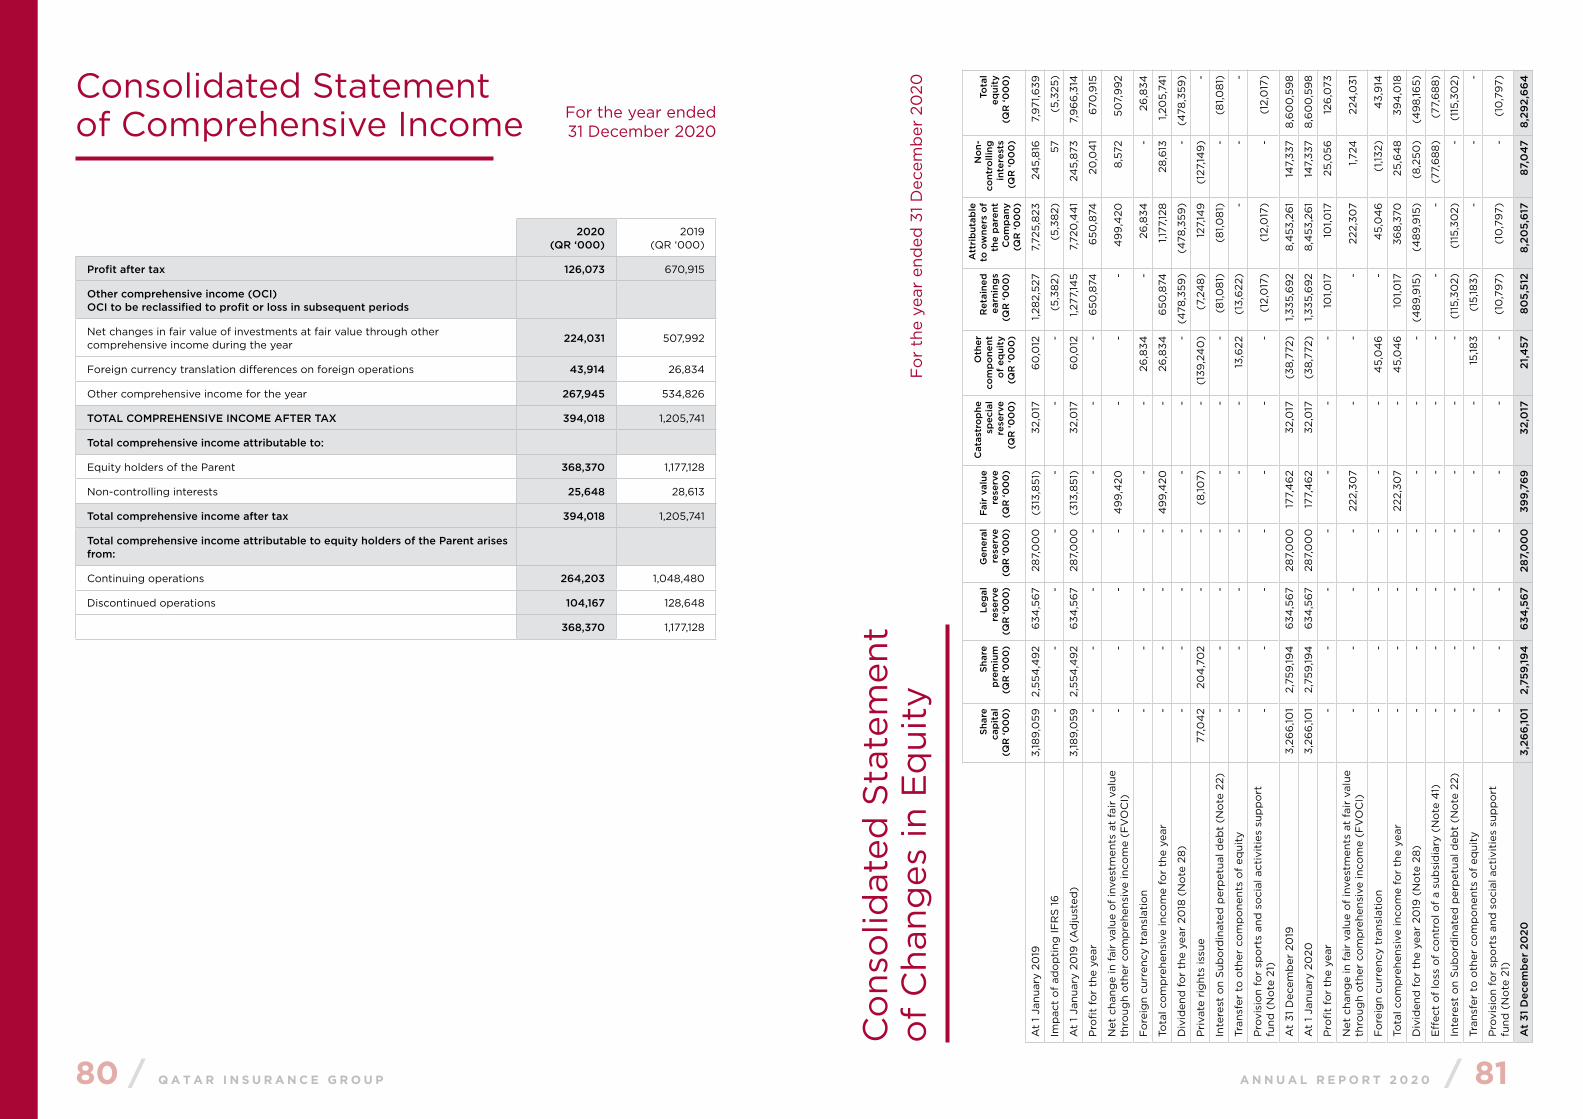
Consolidated Statement of Comprehensive Income
2020(QR ‘000)
2019(QR ‘000)
Profit after tax 126,073 670,915
Other comprehensive income (OCI)OCI to be reclassified to profit or loss in subsequent periods
Net changes in fair value of investments at fair value through other comprehensive income during the year
224,031 507,992
Foreign currency translation differences on foreign operations 43,914 26,834
Other comprehensive income for the year 267,945 534,826
TOTAL COMPREHENSIVE INCOME AFTER TAX 394,018 1,205,741
Total comprehensive income attributable to:
Equity holders of the Parent 368,370 1,177,128
Non-controlling interests 25,648 28,613
Total comprehensive income after tax 394,018 1,205,741
Total comprehensive income attributable to equity holders of the Parent arises from:
Continuing operations 264,203 1,048,480
Discontinued operations 104,167 128,648
368,370 1,177,128
Co
nso
lidat
ed S
tate
men
to
f C
hang
es in
Eq
uity
Fo
r th
e ye
ar e
nded
31
Dec
emb
er 2
020
Shar
eca
pit
al(Q
R ‘0
00
)
Shar
e p
rem
ium
(QR
‘00
0)
Leg
alre
serv
e(Q
R ‘0
00
)
Gen
eral
re
serv
e(Q
R ‘0
00
)
Fair
val
ue
rese
rve
(QR
‘00
0)
Cat
astr
op
hesp
ecia
l re
serv
e(Q
R ‘0
00
)
Oth
er
com
po
nent
o
f eq
uity
(QR
‘00
0)
Ret
aine
d
earn
ing
s(Q
R ‘0
00
)
Att
rib
utab
le
to o
wne
rs o
f th
e p
aren
t C
om
pan
y(Q
R ‘0
00
)
No
n-co
ntro
lling
in
tere
sts
(QR
‘00
0)
Tota
l eq
uity
(QR
‘00
0)
At
1 Ja
nuar
y 20
193,
189
,059
2,
554
,49
2 6
34,5
67
287,
00
0
(313
,851
)32
,017
6
0,0
12
1,28
2,52
7 7,
725,
823
24
5,8
16
7,9
71,6
39
Imp
act
of
ado
pti
ng IF
RS
16
-
- -
- -
- -
(5,3
82)
(5,3
82)
57
(5,3
25)
At
1 Ja
nuar
y 20
19 (
Ad
just
ed)
3,18
9,0
59
2,55
4,4
92
634
,56
7 28
7,0
00
(3
13,8
51)
32,0
17
60
,012
1,2
77,14
5 7,
720
,44
1 24
5,8
73
7,9
66
,314
Pro
fit
for
the
year
- -
- -
- -
- 6
50,8
74
650
,874
20
,04
1 6
70,9
15
Net
cha
nge
in f
air
valu
e o
f in
vest
men
ts a
t fa
ir v
alue
th
roug
h o
ther
co
mp
rehe
nsiv
e in
com
e (F
VO
CI)
--
--
49
9,4
20
--
-4
99
,420
8
,572
50
7,9
92
Fo
reig
n cu
rren
cy t
rans
lati
on
- -
- -
- -
26,8
34
- 26
,834
-
26,8
34
Tota
l co
mp
rehe
nsiv
e in
com
e fo
r th
e ye
ar-
--
-4
99
,420
-
26,8
34
650
,874
1,1
77,12
8
28,6
13
1,20
5,74
1
Div
iden
d f
or
the
year
20
18 (
No
te 2
8)
- -
- -
- -
- (4
78,3
59)
(478
,359
)-
(478
,359
)
Pri
vate
rig
hts
issu
e 77
,04
2 20
4,7
02
- -
(8,10
7)-
(139
,24
0)
(7,2
48
)12
7,14
9
(127
,149
)-
Inte
rest
on
Sub
ord
inat
ed p
erp
etua
l deb
t (N
ote
22)
- -
- -
- -
- (8
1,08
1)(8
1,08
1)-
(81,0
81)
Tran
sfer
to
oth
er c
om
po
nent
s o
f eq
uity
- -
- -
- -
13,6
22
(13,
622
)-
- -
Pro
visi
on
for
spo
rts
and
so
cial
act
ivit
ies
sup
po
rt
fund
(N
ote
21)
- -
- -
- -
- (1
2,0
17)
(12,
017
)-
(12,
017
)
At
31 D
ecem
ber
20
193,
266
,101
2,75
9,19
4
634
,56
7 28
7,0
00
17
7,4
62
32,0
17
(38
,772
)1,3
35,6
92
8,4
53,2
61
147,
337
8,6
00
,59
8
At
1 Ja
nuar
y 20
203,
266
,101
2,75
9,19
4
634
,56
7 28
7,0
00
17
7,4
62
32,0
17
(38
,772
)1,3
35,6
92
8,4
53,2
61
147,
337
8,6
00
,59
8
Pro
fit
for
the
year
--
--
--
-10
1,017
10
1,017
25
,056
12
6,0
73
Net
cha
nge
in f
air
valu
e o
f in
vest
men
ts a
t fa
ir v
alue
th
roug
h o
ther
co
mp
rehe
nsiv
e in
com
e (F
VO
CI)
--
--
222,
307
--
-22
2,30
7 1,7
24
224
,031
Fo
reig
n cu
rren
cy t
rans
lati
on
--
--
--
45,
04
6-
45,
04
6
(1,13
2)4
3,9
14
Tota
l co
mp
rehe
nsiv
e in
com
e fo
r th
e ye
ar-
--
-22
2,30
7-
45,
04
610
1,017
36
8,3
70
25,6
48
39
4,0
18
Div
iden
d f
or
the
year
20
19 (
No
te 2
8)
--
--
--
-(4
89
,915
)(4
89
,915
)(8
,250
)(4
98
,165)
Eff
ect
of
loss
of
cont
rol o
f a
sub
sid
iary
(N
ote
41)
--
--
--
--
-(7
7,6
88
)(7
7,6
88
)
Inte
rest
on
Sub
ord
inat
ed p
erp
etua
l deb
t (N
ote
22)
--
--
--
-(1
15,3
02)
(115
,30
2)-
(115
,30
2)
Tran
sfer
to
oth
er c
om
po
nent
s o
f eq
uity
--
--
--
15,18
3(1
5,18
3)-
--
Pro
visi
on
for
spo
rts
and
so
cial
act
ivit
ies
sup
po
rt
fund
(N
ote
21)
--
--
--
-(1
0,7
97)
(10
,79
7)-
(10
,79
7)
At
31 D
ecem
ber
20
203,
266
,101
2,75
9,19
4
634
,567
28
7,0
00
39
9,7
69
32
,017
21
,457
80
5,51
28,
205,
617
87,0
47
8,29
2,6
64
For the year ended 31 December 2020
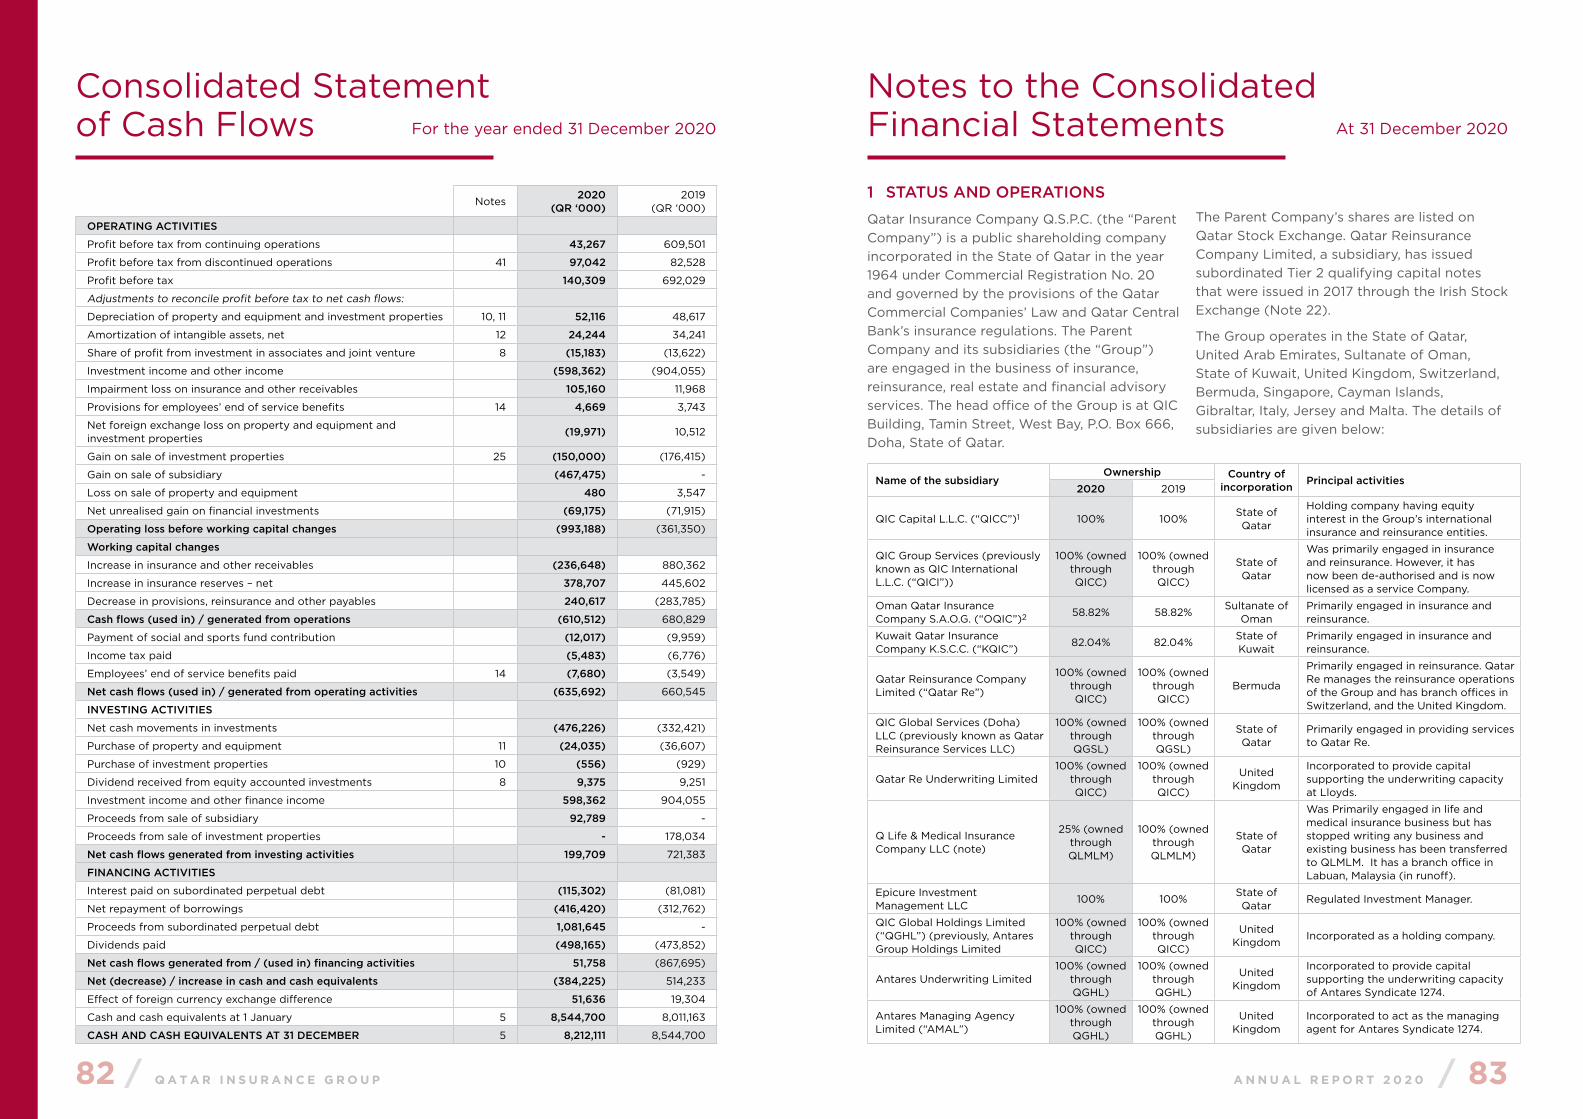
82 / Q A T A R I N S U R A N C E G R O U P A N N U A L R E P O R T 2 0 2 0 / 83
Notes to the ConsolidatedFinancial Statements At 31 December 2020
Consolidated Statementof Cash Flows For the year ended 31 December 2020
Notes2020
(QR ‘000)2019
(QR ‘000)
OPERATING ACTIVITIES
Profit before tax from continuing operations 43,267 609,501
Profit before tax from discontinued operations 41 97,042 82,528
Profit before tax 140,309 692,029
Adjustments to reconcile profit before tax to net cash flows:
Depreciation of property and equipment and investment properties 10, 11 52,116 48,617
Amortization of intangible assets, net 12 24,244 34,241
Share of profit from investment in associates and joint venture 8 (15,183) (13,622)
Investment income and other income (598,362) (904,055)
Impairment loss on insurance and other receivables 105,160 11,968
Provisions for employees’ end of service benefits 14 4,669 3,743
Net foreign exchange loss on property and equipment and investment properties
(19,971) 10,512
Gain on sale of investment properties 25 (150,000) (176,415)
Gain on sale of subsidiary (467,475) -
Loss on sale of property and equipment 480 3,547
Net unrealised gain on financial investments (69,175) (71,915)
Operating loss before working capital changes (993,188) (361,350)
Working capital changes
Increase in insurance and other receivables (236,648) 880,362
Increase in insurance reserves – net 378,707 445,602
Decrease in provisions, reinsurance and other payables 240,617 (283,785)
Cash flows (used in) / generated from operations (610,512) 680,829
Payment of social and sports fund contribution (12,017) (9,959)
Income tax paid (5,483) (6,776)
Employees’ end of service benefits paid 14 (7,680) (3,549)
Net cash flows (used in) / generated from operating activities (635,692) 660,545
INVESTING ACTIVITIES
Net cash movements in investments (476,226) (332,421)
Purchase of property and equipment 11 (24,035) (36,607)
Purchase of investment properties 10 (556) (929)
Dividend received from equity accounted investments 8 9,375 9,251
Investment income and other finance income 598,362 904,055
Proceeds from sale of subsidiary 92,789 -
Proceeds from sale of investment properties - 178,034
Net cash flows generated from investing activities 199,709 721,383
FINANCING ACTIVITIES
Interest paid on subordinated perpetual debt (115,302) (81,081)
Net repayment of borrowings (416,420) (312,762)
Proceeds from subordinated perpetual debt 1,081,645 -
Dividends paid (498,165) (473,852)
Net cash flows generated from / (used in) financing activities 51,758 (867,695)
Net (decrease) / increase in cash and cash equivalents (384,225) 514,233
Effect of foreign currency exchange difference 51,636 19,304
Cash and cash equivalents at 1 January 5 8,544,700 8,011,163
CASH AND CASH EQUIVALENTS AT 31 DECEMBER 5 8,212,111 8,544,700
Name of the subsidiaryOwnership Country of
incorporation Principal activities2020 2019
QIC Capital L.L.C. (“QICC”)1 100% 100%State of Qatar
Holding company having equity interest in the Group’s international insurance and reinsurance entities.
QIC Group Services (previously known as QIC International L.L.C. (“QICI”))
100% (owned through QICC)
100% (owned through QICC)
State of Qatar
Was primarily engaged in insurance and reinsurance. However, it has now been de-authorised and is now licensed as a service Company.
Oman Qatar Insurance Company S.A.O.G. (“OQIC”)2 58.82% 58.82%
Sultanate of Oman
Primarily engaged in insurance and reinsurance.
Kuwait Qatar Insurance Company K.S.C.C. (“KQIC”)
82.04% 82.04%State of Kuwait
Primarily engaged in insurance and reinsurance.
Qatar Reinsurance Company Limited (“Qatar Re”)
100% (owned through QICC)
100% (owned through QICC)
Bermuda
Primarily engaged in reinsurance. Qatar Re manages the reinsurance operations of the Group and has branch offices in Switzerland, and the United Kingdom.
QIC Global Services (Doha) LLC (previously known as Qatar Reinsurance Services LLC)
100% (owned through QGSL)
100% (owned through QGSL)
State of Qatar
Primarily engaged in providing services to Qatar Re.
Qatar Re Underwriting Limited100% (owned
through QICC)
100% (owned through QICC)
United Kingdom
Incorporated to provide capital supporting the underwriting capacity at Lloyds.
Q Life & Medical Insurance Company LLC (note)
25% (owned through QLMLM)
100% (owned through QLMLM)
State of Qatar
Was Primarily engaged in life and medical insurance business but has stopped writing any business and existing business has been transferred to QLMLM. It has a branch office in Labuan, Malaysia (in runoff).
Epicure Investment Management LLC
100% 100% State of Qatar
Regulated Investment Manager.
QIC Global Holdings Limited (“QGHL”) (previously, Antares Group Holdings Limited
100% (owned through QICC)
100% (owned through QICC)
United Kingdom
Incorporated as a holding company.
Antares Underwriting Limited100% (owned
through QGHL)
100% (owned through QGHL)
United Kingdom
Incorporated to provide capital supporting the underwriting capacity of Antares Syndicate 1274.
Antares Managing Agency Limited (“AMAL”)
100% (owned through QGHL)
100% (owned through QGHL)
United Kingdom
Incorporated to act as the managing agent for Antares Syndicate 1274.
1 STATUS AND OPERATIONS
Qatar Insurance Company Q.S.P.C. (the “Parent Company”) is a public shareholding company incorporated in the State of Qatar in the year 1964 under Commercial Registration No. 20 and governed by the provisions of the Qatar Commercial Companies’ Law and Qatar Central Bank’s insurance regulations. The Parent Company and its subsidiaries (the “Group”) are engaged in the business of insurance, reinsurance, real estate and financial advisory services. The head office of the Group is at QIC Building, Tamin Street, West Bay, P.O. Box 666, Doha, State of Qatar.
The Parent Company’s shares are listed on Qatar Stock Exchange. Qatar Reinsurance Company Limited, a subsidiary, has issued subordinated Tier 2 qualifying capital notes that were issued in 2017 through the Irish Stock Exchange (Note 22).
The Group operates in the State of Qatar, United Arab Emirates, Sultanate of Oman, State of Kuwait, United Kingdom, Switzerland, Bermuda, Singapore, Cayman Islands, Gibraltar, Italy, Jersey and Malta. The details of subsidiaries are given below:

84 / Q A T A R I N S U R A N C E G R O U P A N N U A L R E P O R T 2 0 2 0 / 85
Name of the subsidiaryOwnership Country of
incorporation Principal activities2020 2019
Antares Underwriting Asia Pte. Limited
100% (owned through AMAL)
100% (owned through AMAL)
SingaporeIncorporated to participate in Lloyds Asia Scheme.
QIC Global Services Limited (“QGSL”) (previously, Antares Underwriting Services Limited)
100% (owned through QGHL)
100% (owned through QGHL)
United Kingdom
Incorporated as a services company to provide services to the international insurance and reinsurance entities of the Group with branch offices in Malta and Gibraltar.
QIC Global Services (Bermuda) Limited
100% (through QGSL)
100% (through QGSL)
Bermuda Service company
QIC Global Services (Zurich) AG100%
(through QGSL)
100% (through QGSL)
Switzerland Service company
Antares Capital I Limited100% (owned
through QGHL)
100% (owned through QGHL)
United Kingdom
Incorporated to provide capital supporting the underwriting capacity of Antares Syndicate 1274.
Antares Capital III Limited100% (owned
through QGHL)
100% (owned through QGHL)
United Kingdom
Incorporated to provide capital supporting the underwriting capacity of Antares Syndicate 1274.
Antares Capital IV Limited100% (owned
through QGHL)
100% (owned through QGHL)
United Kingdom
Incorporated to provide capital supporting the underwriting capacity of Antares Syndicate 1274.
QIC Europe Limited (QEL)100% (owned
through Qatar Re)
100% (owned through
Qatar Re)Malta
Primarily engaged in insurance business and reinsurance and has branch offices in Italy and the United Kingdom
QANIT Ltd. -100% (owned
through QICI)
UAEWas primarily engaged in Real Estate activities in the UAE and liquidated in 2019
Qatar Insurance Company Real Estate W.L.L.
100% 100%State of Qatar
Primarily engaged in Real Estate activities in the State of Qatar.
QEA Consulting W.L.L. (“QEA”) (previously known as Qatar Economic Advisors)
100% 100%State of Qatar
Primarily engaged in financial and other advisory services.
Qatar Insurance Group W.L.L. 100% 100%State of Qatar
Primarily engaged in the management of QIC Group entities.
QIC Asset Management Ltd (“QICAM”)
100% (owned through
QEA)
100% (owned through QEA)
Cayman Islands
Holding company for investment assets.
Education Company 2 Ltd. 100% 100%Cayman Islands
Primarily engaged in financial and other advisory services.
Epicure Managers Qatar Ltd. 100% 100% B.V.I.Primarily engaged in providing investment management services.
Taleem Advisory Ltd.100% (owned
through QEA)
100% (owned through QEA)
Cayman Islands
Primarily engaged in financial and other advisory services.
Arneb Real Estate Limited (“AREL”)
100% 100% JerseyPrimarily engaged in real estate activities.
Synergy Frimley Limited100% (owned
through AREL)
100% (owned through AREL)
JerseyPrimarily engaged in real estate activities.
Synergy Bristol Limited100% (owned
through AREL)
100% (owned through AREL)
JerseyPrimarily engaged in real estate activities.
QLM Life & Medical Insurance Company Q.P.S.C. (previously known as QLM Life & Medical Insurance Company W.L.L)3
25% 85%State of Qatar
Primarily engaged to carry on life and medical insurance business.
Name of the subsidiaryOwnership Country of
incorporation Principal activities2020 2019
Markerstudy Insurance Co. Ltd.100% (owned
through Qatar Re)
100% (owned through
Qatar Re)Gibraltar
Primarily engaged in insurance business.
Zenith Insurance Plc100% (owned
through Qatar Re)
100% (owned through
Qatar Re)Gibraltar
Primarily engaged in insurance business.
Ultimate 100% (owned
through Qatar Re)
100% (owned through
Qatar Re)Gibraltar
Was primarily engaged in insurance business. The company has been placed into runoff and has been de-registered with the insurance regulator in Gibraltar.
St Julians Insurance Co. Ltd100% (owned
through Qatar Re)
100% (owned through
Qatar Re)Gibraltar
Was primarily engaged in insurance business. The company has been placed into runoff.
Mayflower Limited100% (owned
through Qatar Re)
100% (owned through
Qatar Re)Gibraltar
Primarily engaged in real estate activities.
North Town Management Limited100% (owned
through Qatar Re)
100% (owned through
Qatar Re)Gibraltar
A property management company (limited by guarantee having no share capital). This entity is dormant.
QIC (Cayman) Limited 100% -Cayman Islands
Primarily engaged in investment activities.
Anoud Technologies LLC
100% (owned through
QIC Group Services LLC
- QatarEngaged in the business of rendering IT and related services.
1. In 2019, the Group acquired the minority shares in QICC (4.26%) through a private rights share issuance of the Parent entity. This was approved at the Annual General Assembly meeting held on 26 February 2019. As on 31 December 2019, QICC is a wholly owned subsidiary of the Group
2. Direct ownership of the Parent Company in OQIC is 52.50% whereas the remaining shares are held through group entities.
3. On 30 December 2020, the Initial Public Offering (IPO) process and the conversion of QLM Life & Medical Insurance Company to Qatari Public Shareholding Company (Q.P.S.C.) was successfully completed and consequently, the interest held by the Group has been reduced from 85% to 25%. This reduction in shareholding has resulted on loss of control over this subsidiary. The retained shareholding has been recognised as investment in associate as at 31 December 2020. The related details are set out in Note 41.
86 / Q A T A R I N S U R A N C E G R O U P A N N U A L R E P O R T 2 0 2 0 / 87
2 BASIS OF PREPARATION
Statement of complianceThe consolidated financial statements of the Group have been prepared in accordance with International Financial Reporting Standards (IFRS) as issued by the International Accounting Standards Board (IASB) and the applicable provisions of the Qatar Commercial Companies Law and Qatar Central Bank regulations.
Basis of preparationThe accompanying consolidated financial statements have been prepared under the historical cost convention, except for certain financial instruments that are measured at fair value at the end of each reporting period.
Financial assets and financial liabilities are offset and the net amount reported in these consolidated statement of financial position only when there is a legally enforceable right to offset the recognised amounts and there is an intention to settle on a net basis, or to realise the assets and settle the liability simultaneously. Income and expense are not offset in the consolidated statement of profit or loss unless required or permitted by any accounting standard or interpretation, as specifically disclosed in the accounting policies of the Group.
The consolidated financial statements provide comparative information in respect of the previous period.
The Group presents its consolidated statement of financial position broadly in order of liquidity. An analysis regarding recovery or settlement within 12 months after reporting date (no more than 12 months) and more than 12 months after reporting date (more than 12 months) is presented in Note 33.
Basis of consolidationThe consolidated financial statements comprise the financial statements of Qatar Insurance Company Q.S.P.C. and its subsidiaries as at 31 December 2020 (together referred to as the “Group”). Control is achieved when the Group is exposed, or has rights, to variable returns from its involvement with the investee and has the ability to affect those
returns through its power over the investee. Specifically, the Group controls an investee if and only if the Group has:
• Power over the investee (i.e. existing rights that give it the current ability to direct the relevant activities of the investee)
• Exposure, or rights, to variable returns from its involvement with the investee, and
• The ability to use its power over the investee to affect its returns
Generally, there is a presumption that a majority of voting rights results in control. To support this presumption and when the Group has less than a majority of the voting or similar rights of an investee, the Group considers all relevant facts and circumstances in assessing whether it has power over an investee, including:
• The contractual arrangement with the other vote holders of the investee
• Rights arising from other contractual arrangements
• The Group’s voting rights and potential voting rights
The Group re-assesses whether or not it controls an investee if facts and circumstances indicate that there are changes to one or more of the three elements of control. Consolidation of a subsidiary begins when the Group obtains control over the subsidiary and ceases when the Group loses control of the subsidiary. Assets, liabilities, income and expenses of a subsidiary acquired or disposed of during the year are included in the statement of comprehensive income from the date the Group gains control until the date the Group ceases to control the subsidiary.
Profit or loss and each component of other comprehensive income (OCI) are attributed to the equity holders of the parent of the Group and to the non-controlling interests. Losses applicable to the non-controlling interest in excess of the non-controlling interests are allocated against the interest of the Group except to the extent that the non-controlling interest has a binding obligation and is able to make an additional investment to cover losses. These consolidated financial statements are prepared using uniform accounting policies
for like transactions and other events in similar circumstances. When necessary, adjustments are made to the financial statements of subsidiaries to bring their accounting policies into line with the Group’s accounting policies.
Subsidiaries are fully consolidated from the date of acquisition, being the date on which the Group obtains control, and continue to be consolidated until the date when such control ceases. The financial statements of the subsidiaries are prepared for the same reporting period as the parent company, using consistent accounting policies.
A change in the ownership interest of a subsidiary, without a loss of control, is accounted for as an equity transaction.
If the Group loses control over a subsidiary, it derecognises the related assets (including goodwill), liabilities, non-controlling interest and other components of equity, while any resultant gain or loss is recognised in profit or loss. Any investment retained is recognised at fair value.
Transactions eliminated on consolidationInter-company balances and transactions, and any unrealised gains arising from intra-group transactions are eliminated in preparing the consolidated financial statements.
Non-controlling interestsNon-controlling interests represent the Company’s portion of profit or loss and net assets not held by the Group and are presented separately in the consolidated income statement, consolidated statement of comprehensive income and within equity in the consolidated statement of financial position, separately from the equity of the Company. Losses applicable to the non-controlling interest in excess of the non-controlling interests are allocated against the interest of the Group except to the extent that the non-controlling interest has a binding obligation and is able to make an additional investment to cover losses. Acquisitions of non-controlling interests are accounted for using the parent extension method, whereby, the difference between the consideration and the book value of the share of the net assets acquired is recognised as goodwill.
Functional and presentation currencyThese consolidated financial statements are presented in Qatari Riyal (QR) and rounded to the nearest thousand (QR ‘000), unless otherwise indicated.
The individual financial statements of the Group entities are presented in the currency of the primary economic environment in which they operate (functional currency). For the purpose of these consolidated financial statements, the results and financial position of each subsidiary are expressed in the functional currency of the Parent Company.
The assets and liabilities of foreign operations are translated to Qatari Riyal using exchange rates prevailing at the reporting date. Income and expenses are also translated to Qatari Riyal at the exchange rates prevailing at the dates of the transactions. The exchange differences arising on the translation for consolidation are recognised in OCI. On disposal of a foreign operation, the component of OCI relating to that particular foreign operation is reclassified to profit or loss.
Any goodwill arising on the acquisition of a foreign operation and any fair value adjustments to the carrying amounts of assets and liabilities arising on the acquisition are treated as assets and liabilities of the foreign operation and translated at the rate of exchange prevailing at the end of each reporting period. Exchange differences are recognised in other comprehensive income.
3 CHANGES IN ACCOUNTING POLICIES AND DISCLOSURES
3.1 New standards, interpretations and amendments adopted by the GroupThe accounting policies adopted in the preparation of the consolidated financial statements are consistent with those followed in the preparation of the Group’s annual consolidated financial statements for the year ended 31 December 2019, except for the adoption of certain standards and amendments, which are effective for annual periods beginning on or after 1 January 2020. The Group has not early adopted any other standard, interpretation or amendment that has been issued but is not yet effective.
88 / Q A T A R I N S U R A N C E G R O U P A N N U A L R E P O R T 2 0 2 0 / 89
Following amendments adopted by the Group had no impact on the consolidated financial statements for the reporting period.
• Amendments to IFRS 3: Definition of a Business
• Amendments to IFRS 7, IFRS 9 and IAS 39 Interest Rate Benchmark Reform
• Amendments to IAS 1 and IAS 8 Definition of Material
• Conceptual Framework for Financial Reporting issued on 29 March 2018
• Amendments to IFRS 16 Covid-19 Related Rent Concessions
3.2 Standards issued but not yet effectiveThe new and amended standards and interpretations that are issued, but not yet effective, up to the date of issuance of the Group’s financial statements are disclosed below. The Group intends to adopt these new and amended standards and interpretations, if applicable, when they become effective.
IFRS 17 Insurance Contracts IFRS 17 Insurance Contracts establishes principles for the recognition, measurement, presentation and disclosure of insurance contracts issued. It also requires similar principles to be applied to reinsurance contracts held and investment contracts with discretionary participation features issued. The standard is effective for annual periods beginning on or after 1 January 2023 with an earlier application is permitted.
IFRS 17 provides comprehensive guidance on accounting for insurance contracts and investment contracts with discretionary participation features. For general insurance contracts, IFRS 17 requires discounting of loss reserves expected to be paid in more than one year as well as risk adjustment, for which confidence level equivalent disclosure will be required.
In order to further evaluate the effects of adopting IFRS 17, an IFRS 17 Group Implementation Team has been set up sponsored by the Group Chief Financial Officer, comprising senior management from Finance, Risk, Operations and Investment Operations.
Implementation team has successfully completed the first phase (Gap analysis) and currently working on the detailed operational and financial impact.
Other new and amended standards and interpretations that are issued, but not yet effective.Following new and amended standards and interpretations are effective from 1 January 2022, except for ‘Amendments to IAS 1: Classification of Liabilities as Current or Non-current’, which will be effective from 1 January 2023.
• Reference to the Conceptual Framework – Amendments to IFRS 3
• Property, Plant and Equipment: Proceeds before Intended Use – Amendments to IAS 16
• Onerous Contracts – Costs of Fulfilling a Contract – Amendments to IAS 37
• IFRS 1 First-time Adoption of International Financial Reporting Standards – Subsidiary as a first-time adopter
• IFRS 9 Financial Instruments – Fees in the ’10 per cent’ test for derecognition of financial liabilities
• IAS 41 Agriculture – Taxation in fair value measurements
• Amendments to IAS 1: Classification of Liabilities as Current or Non-current
3.3 Use of estimates and judgmentsThe preparation of the consolidated financial statements in conformity with International Financial Reporting Standards (“IFRS”) requires management to make judgements, estimates and assumptions that affects the application of accounting policies and the reported amounts of assets, liabilities, income and expenses. Actual results may differ from these estimates.
Estimates and underlying assumptions are reviewed on an on-going basis. Revisions to accounting estimates are recognised in the period in which the estimate is revised and in any future periods affected. The key judgements and estimates made by the Group are detailed in Note 35.
In preparing these consolidated financial statements, the significant judgments made by management in applying the Group’s accounting policies were the same as those applied to the consolidated financial statements as at and for the year ended 31 December 2020.
Significant accounting judgements and estimates The Group makes judgements, estimates and assumptions that affect the reported amounts of assets, liabilities, revenues, expenses and disclosure of contingent liabilities at the reporting date. Estimates and judgements are continually evaluated and are based on historical experience and other factors, including expectation of future events that are believed to be reasonable under the circumstances.
4 SIGNIFICANT ACCOUNTING POLICIES
Business combination and Goodwill The management uses the following criteria to evaluate whether a business combination has substance to apply the acquisition method or as per under uniting of interests’ method where the transaction lacks substance as described in IFRS 3 – Business Combinations:
• the purpose of the transaction;
• the involvement of outside parties in the transaction, such as non-controlling interests or other third parties;
• whether or not the transaction is conducted at fair value;
• The existing activities of the entities involved in the transactions; whether or not it is bringing entities together into a reporting entity that did not exist before; and
• where a new company is established, whether it is undertaken in connection with an IPO or spin-off or other change in control and significant change in ownership.
Business combinations are accounted for using the acquisition method. The cost of an acquisition is measured as the aggregate of the consideration transferred, measured at acquisition date fair value and the amount
of any non- controlling interest in the acquiree. For each business combination, the acquirer measures the non-controlling interest in the acquiree either at fair value or at the proportionate share of the acquiree’s identifiable net assets. Acquisition costs incurred are expensed and included in administrative expenses.
The Group determines that it has acquired a business when the acquired set of activities and assets include an input and a substantive process that together significantly contribute to the ability to create outputs. The acquired process is considered substantive if it is critical to the ability to continue producing outputs, and the inputs acquired include an organised workforce with the necessary skills, knowledge, or experience to perform that process or it significantly contributes to the ability to continue producing outputs and is considered unique or scarce or cannot be replaced without significant cost, effort, or delay in the ability to continue producing outputs.
When the Group acquires a business, it assesses the financial assets and liabilities assumed for appropriate classification and designation in accordance with the contractual terms, economic circumstances and pertinent conditions as at the acquisition date. This includes the separation of embedded derivatives in host contracts by the acquiree.
Any contingent consideration to be transferred by the acquirer will be recognised at fair value at the acquisition date. Contingent consideration classified as equity is not remeasured and its subsequent settlement is accounted for within equity. Contingent consideration classified as an asset or liability that is a financial instrument and within the scope of IFRS 9 Financial Instruments, is measured at fair value with the changes in fair value recognised in the consolidated statement of profit or loss. Other contingent consideration that is not within the scope of IFRS 9 is measured at fair value at each reporting date with changes in fair value recognised in profit or loss.
Goodwill is initially measured at cost (being the excess of the aggregate of the consideration transferred and the amount recognised for
90 / Q A T A R I N S U R A N C E G R O U P A N N U A L R E P O R T 2 0 2 0 / 91
non-controlling interests and any previous interest held over the net identifiable assets acquired and liabilities assumed). If the fair value of the net assets acquired is in excess of the aggregate consideration transferred, the Group re-assesses whether it has correctly identified all of the assets acquired and all of the liabilities assumed and reviews the procedures used to measure the amounts to be recognised at the acquisition date. If the reassessment still results in an excess of the fair value of net assets acquired over the aggregate consideration transferred, then the gain is recognised in consolidated statement of profit or loss.
After initial recognition, goodwill is measured at cost less any accumulated impairment losses. For the purpose of impairment testing, goodwill acquired in a business combination is, from the acquisition date, allocated to each of the Group’s cash-generating units that are expected to benefit from the combination, irrespective of whether other assets or liabilities of the acquiree are assigned to those units.
Where goodwill has been allocated to a cash-generating unit and part of the operation within that unit is disposed of, the goodwill associated with the operation disposed of is included in the carrying amount of the operation when determining the gain or loss on disposal of the operation. Goodwill disposed in this circumstance is measured based on the relative values of the operation disposed of and the portion of the cash-generating unit retained.
Goodwill is tested for impairment annually (as at 31 December) and when circumstances indicate that the carrying value may be impaired.
Impairment is determined for goodwill by assessing the recoverable amount of the cash-generating unit (or group of cash-generating units), to which the goodwill relates. Where the recoverable amount of the cash-generating unit (or group of cash-generating units) is less than the carrying amount of the cash-generating unit (or group of cash-generating units) to which goodwill has been allocated, an impairment loss is recognised. Impairment losses relating to goodwill cannot be reversed in future periods.
Investments in associates and jointly controlled entitiesAssociates are those entities in which the Group has significant influence. Significant influence is the power to participate in the financial and operating policy decisions of the investee but is not control or joint control over those policies. When necessary, adjustments are made to bring the accounting policies in line with those of the group.
Joint ventures are joint arrangement whereby the parties that have joint control of the arrangement have rights to the net assets of the joint venture. Joint control is the contractually agreed sharing of control of an arrangement, which exists only when decisions about the relevant activities require unanimous consent of the parties sharing control.
Investments in associates and jointly controlled entities are accounted for using the equity method.
Under the equity method, the investment is initially recognised in the consolidated statement of financial position at cost and adjusted thereafter to recognise the Group’s share of profit or loss and other comprehensive income of the associate or joint venture. When the Group’s share of losses exceeds its interest in an equity-accounted investee, the carrying amount of that interest, including any long-term investments, is reduced to zero, and the recognition of further losses is discontinued except to the extent that the Group has an obligation or has made payments on behalf of the investee.
The consolidated financial statements include the Group’s share of profit or loss and other comprehensive income, after adjustments to align the accounting policies with those of the Group, from the date that significant influence or joint control commences until the date that significant influence or joint control ceases. The financial year end of the associate entities and the Group are uniform.
Gains and losses resulting from downstream transactions between the Group and its associate or joint venture are recognised in the entity’s financial statements only to the extent of unrelated investors interest in the associate or joint venture.
Intangible assetsIntangible assets acquired in a business combination and recognised separately from goodwill are initially recognised at cost which is their fair value as at the date of acquisition. Subsequent to initial recognition,
• Intangible assets with finite lives are amortised over the useful economic life and assessed for impairment whenever there is an indication that the intangible asset may be impaired. The amortisation period and the amortisation method for an intangible asset with a finite useful life are reviewed at least at each financial year end. Changes in the expected useful life or the expected pattern of consumption of future economic benefits embodied in the asset are accounted for by changing the amortisation period or method, as appropriate, and are treated as changes in accounting estimates. The amortisation expense on intangible assets with finite lives is recognised in the consolidated statement of profit or loss.
• Intangible assets with indefinite useful lives are tested for impairment annually either individually or at the cash generating unit level. Such intangibles are not amortised. The useful life of an intangible asset with an indefinite life is reviewed annually to determine whether indefinite life assessment continues to be supportable. If not, the change in the useful life assessment from indefinite to finite is made on prospective basis.
Gains or losses arising from derecognition of an intangible asset are measured as the difference between the net disposal proceeds and the carrying amount of the asset and are recognised in the consolidated statement of profit or loss when the asset is derecognised.
The current economic lives applied to the Group’s intangible assets are as follows:
Intangible assets acquired Economic Life
Syndicate Capacity Indefinite
Runoff services – Württembergische Versicherung AG
7 years
Framework agreement 10 years
Non life insurance license Indefinite
Foreign currency transactionsForeign currency transactions are recorded in the respective functional currencies of Group entities at the rates of exchange prevailing at the date of each transaction. Monetary assets and liabilities denominated in foreign currencies at the reporting date are translated to the respective functional currencies at the rate of exchange prevailing at the year end. The resultant exchange differences are included in the consolidated statement of profit or loss.
Financial instruments A financial instrument is any contract that gives rise to a financial asset of one entity and a financial liability or equity instrument of another entity.
a) Initial recognition
Financial assets and liabilities are initially recognised on the trade date. The classification of financial instruments at initial recognition depends on their contractual terms and the business model for managing the instruments. Financial instruments are initially measured at their fair value, except in the case of financial assets and financial liabilities recorded at FVTPL, transaction costs are added to, or subtracted from the amount. Insurance receivables are measured at the transaction price. The Day 1 gain or loss is recognised when the fair value of financial instruments at initial recognition differs from the transaction price.
b) Day 1 profit or loss
When the transaction price of the instrument differs from the fair value at origination and the fair value is based on a valuation technique using only inputs observable in market transactions, the Group recognises the difference between the transaction price and fair value in net trading income. In those cases where fair value is based on models for which some of the inputs are not observable, the difference between the transaction price and the fair value is deferred and is only recognised in profit or loss when the inputs become observable, or when the instrument is derecognised.
92 / Q A T A R I N S U R A N C E G R O U P A N N U A L R E P O R T 2 0 2 0 / 93
c) Measurement categories of financial assets and liabilities
The Group classifies all of its financial assets based on the business model for managing the assets and the asset’s contractual terms, measured at either:
• Amortised cost;
• Fair value through other comprehensive income (FVOCI); or
• Fair value through profit or loss (FVTPL)
The Group classifies and measures its derivative and trading portfolio at FVTPL. The Group may designate financial instruments at FVTPL, if so doing eliminates or significantly reduces measurement or recognition inconsistencies.
Financial liabilities are measured at fair value through profit or loss (FVTPL) and amortised cost.
Initial recognition
a) Financial investments at amortised cost
The Group only measures financial assets at amortised cost if both of the following conditions are met:
• The financial asset is held within a business model with the objective to hold financial assets in order to collect contractual cash flows; and
• The contractual terms of the financial asset give rise on specified dates to cash flows that are solely payments of principal and interest (SPPI) on the principal amount outstanding.
The details of these conditions are outlined below.
(i) Business model assessment
The Group determines its business model at the level that best reflects how it manages groups of financial assets to achieve its business objective.
The Group’s business model is not assessed on an instrument-by-instrument basis, but at a higher level of aggregated portfolios and is based on observable factors such as:
• How the performance of the business model and the financial assets held within that business model are evaluated and reported to the key management personnel
• The risks that affect the performance of the business model (and the financial assets held within that business model) and, in particular, the way those risks are managed
• How managers of the business are compensated (for example, whether the compensation is based on the fair value of the assets managed or on the contractual cash flows collected)
• The expected frequency, value and timing of sales are also important aspects of the Group’s assessment
The business model assessment is based on reasonably expected scenarios without taking ‘worst case’ or ‘stress case’ scenarios into account. If cash flows after initial recognition are realised in a way that is different from the original expectations, the Group does not change the classification of the remaining financial assets held in that business model, but incorporates such information when assessing newly originated or newly purchased financial assets going forward.
(ii) The SPPI test
As a second step of its classification process the Group assesses the contractual terms of financial assets to identify whether they meet the SPPI test. Principal’ for the purpose of this test is defined as the fair value of the financial asset at initial recognition and may change over the life of the financial asset (for example, if there are repayments of principal or amortisation of the premium/discount).
The most significant elements of interest within a lending arrangement are typically the consideration for the time value of money and credit risk. To make the SPPI assessment, the Group applies judgement and considers relevant factors such as the currency in which the financial asset is denominated, and the period for which the interest rate is set.
In contrast, contractual terms that introduce a more than de-minimis exposure to risks or volatility in the contractual cash flows that are unrelated to a basic lending arrangement do not give rise to contractual cash flows that are solely payments of principal and interest on the amount outstanding. In such cases, the financial asset is required to be measured at FVTPL.
b) Debt instruments at FVOCI
The Group applies the new category under IFRS 9 of debt instruments measured at FVOCI when both of the following conditions are met:
• The instrument is held within a business model, the objective of which is achieved by both collecting contractual cash flows and selling financial assets; and
• The contractual terms of the financial asset meet the SPPI test
FVOCI debt instruments are subsequently measured at fair value with gains and losses arising due to changes in fair value recognised in OCI. Interest income and foreign exchange gains and losses are recognised in profit or loss in the same manner as for financial assets measured at amortised cost. On derecognition, cumulative gains or losses previously recognised in OCI are reclassified from OCI to profit or loss.
c) Equity instruments at FVOCI
Upon initial recognition, the Group occasionally elects to classify irrevocably some of its equity investments as equity instruments at FVOCI when they meet the definition of definition of Equity under IAS 32 Financial Instruments: Presentation and are not held for trading. Such classification is determined on an instrument-by- instrument basis.
Gains and losses on these equity instruments are never recycled to profit. Dividends are recognised in profit or loss as investment income when the right of the payment has been established, except when the Group benefits from such proceeds as a recovery of part of the cost of the instrument, in which case, such gains are recorded in OCI. Equity instruments at FVOCI are not subject to an impairment assessment.
d) Financial assets and financial liabilities at fair value through profit or loss
Financial assets and financial liabilities in this category are those that are not held for trading and have been either designated by management upon initial recognition or are mandatorily required to be measured at fair value under IFRS 9. Management only designates an instrument at FVTPL upon initial
recognition when one of the following criteria are met. Such designation is determined on an instrument-by-instrument basis:
• The designation eliminates, or significantly reduces, the inconsistent treatment that would otherwise arise from measuring the assets or liabilities or recognising gains or losses on them on a different basis;
• The liabilities are part of a group of financial liabilities, which are managed and their performance evaluated on a fair value basis, in accordance with a documented risk management or investment strategy; or
• The liabilities containing one or more embedded derivatives, unless they do not significantly modify the cash flows that would otherwise be required by the contract, or it is clear with little or no analysis when a similar instrument is first considered that separation of the embedded derivative(s) is prohibited
Financial assets and financial liabilities at FVTPL are recorded in the consolidated statement of financial position at fair value. Changes in fair value are recorded in profit and loss with the exception of movements in fair value of liabilities designated at FVTPL due to changes in the Group’s own credit risk. Such changes in fair value are recorded in the Own credit reserve through OCI and do not get recycled to the profit or loss. Interest earned or incurred on instruments designated at FVTPL is accrued in interest income or interest expense, respectively, using the EIR, taking into account any discount/ premium and qualifying transaction costs being an integral part of instrument. Interest earnt on assets mandatorily required to be measured at FVTPL is recorded using contractual interest rate. Dividend income from equity instruments measured at FVTPL is recorded in profit or loss as other operating income when the right to the payment has been established.
e) Derivative financial instruments
A derivative is a financial instrument or other contract with all three of the following characteristics:
• Its value changes in response to the change in a specified interest rate, financial instrument price, commodity price, foreign exchange rate, index of prices or rates,
94 / Q A T A R I N S U R A N C E G R O U P A N N U A L R E P O R T 2 0 2 0 / 95
credit rating or credit index, or other variable, provided that, in the case of a non-financial variable, it is not specific to a party to the contract (i.e., the ‘underlying’).
• It requires no initial net investment or an initial net investment that is smaller than would be required for other types of contracts expected to have a similar response to changes in market factors.
• It is settled at a future date.
The Group enters into derivative transactions with various counterparties. The Group uses derivative financial instruments for economic hedging purposes such as forward currency contracts and interest rate swaps to hedge its foreign currency risks interest rate risks and equity price risk, respectively. Derivatives are recorded at fair value and carried as assets when their fair value is positive and as liabilities when their fair value is negative. The changes in the fair value of derivatives are included in net trading income unless hedge accounting is applied.
Derivatives embedded in host contracts are accounted for as separate derivatives and recorded at fair value if their economic characteristics and risks are not closely related to those of the host contracts and the host contracts are not held for trading or designated at FVTPL. These embedded derivatives are measured at fair value with changes in fair value recognised in profit or loss. Reassessment only occurs if there is either a change in the terms of the contract that significantly modifies the cash flows that would otherwise be required or a reclassification of a financial asset out of FVTPL category. However, as an exception to above, a policyholder’s option to surrender an insurance contract for a fixed amount (or for an amount based on a fixed amount and an interest rate) is not separated and measured at fair value even if the exercise price differs from the carrying amount of the host insurance liability.
Embedded derivatives that meet the definition of insurance contracts are treated and measured as insurance contracts.
Any gains or losses arising from changes in fair value on derivatives are taken directly to profit or loss, except for the effective portion of cash
flow hedges, which are recognised in OCI and later reclassified to profit or loss when the hedged item affects profit or loss.
Impairment of financial assets The Group applies a three-stage approach to measuring expected credit losses (ECL) on financial assets carried at amortised cost and debt instruments classified as FVOCI. Assets migrate through the three stages based on the change in credit quality since initial recognition.
a) Overview
The Group recognise the allowance for expected credit losses for debt financial assets not held at FVTPL. Equity instruments are not subject to impairment under IFRS 9.
The ECL allowance is based on the credit losses expected to arise over the life of the asset (the lifetime expected credit loss or LTECL), unless there has been no significant increase in credit risk since origination, in which case, the allowance is based on the 12 months’ expected credit loss (12mECL). The 12mECL is the portion of LTECLs that represent the ECLs that result from default events on a financial instrument that are possible within the 12 months after the reporting date.
The Group has established a policy to perform an assessment, at the end of each reporting period, of whether a financial instrument’s credit risk has increased significantly since initial recognition, by considering the change in the risk of default occurring over the remaining life of the financial instrument.
Based on the above process, the Group categorizes its FVOCI assets into stages as described below:
Stage 1: When financial instruments are first recognised, the Group recognises an allowance based on 12 month ECLs. Stage 1 also include financial instruments where the credit risk has improved and the has been reclassified from Stage 2.
Stage 2: When a financial instrument has shown a significant increase in credit risk since origination, the Group records an allowance for the
life time ECLs. Stage 2 also include instruments, where the credit risk has improved and the loan has been reclassified from Stage 3.
Stage 3: Includes financial assets that have objective evidence of impairment at the reporting date. For these assets, lifetime ECL are recognised and treated, along with the interests calculated. When transitioning financial assets from stage 2 to stage 3, the percentage of provision made for such assets should not be less than the percentage of provision made before transition. Purchased or originated credit impaired assets are financial assets that are credit impaired on initial recognition and are recorded at fair value at original recognition and interest income is subsequently recognised based on a credit-adjusted EIR. ECLs are only recognised or released to the extent that there is a subsequent change in the expected credit losses.
For financial assets for which the Group has no reasonable expectations of recovering either the entire outstanding amount, or a proportion thereof, the gross carrying amount of the financial asset is reduced. This is considered a (partial) derecognition of the financial asset.
The accounts which are restructured due to credit reasons in past 12 months will be classified under stage 2.
b) The calculation of ECLs
The Group calculates ECLs based on probability-weighted scenarios to measure the expected cash shortfalls, discounted at an approximation to the EIR. A cash shortfall is the difference between the cash flows that are due to an entity in accordance with the contract and the cash flows that the entity expects to receive.
The mechanics of the ECL calculations are outlined below and the key elements are, as follows:
• The Probability of Default (“PD”) is an estimate of the likelihood of default over a given time horizon.
• The Exposure at Default (“EAD “) is an estimate of the exposure at a future default date, taking into account expected changes in the exposure after the reporting date.
• The Loss Given Default (“LGD”) is an estimate of the loss arising in the case where a default occurs at a given time. It is based on the difference between the contractual cash flows due and those that are expected to receive, including from the realisation of any collateral.
Impairment losses and releases are accounted for and disclosed separately from modification losses or gains that are accounted for as an adjustment of the financial asset’s gross carrying value.
The mechanics of the ECL method are summarised below:
Stage 1: The 12 month ECL is calculated as the portion of LTECLs that represent the ECLs that result from default events on a financial instrument that are possible within the 12 months after the reporting date. The Group calculates the 12mECL allowance based on the expectation of a default occurring in the 12 months following the reporting date. These expected 12-month default probabilities are applied to a forecast EAD and multiplied by the expected LGD and discounted by an approximation to the original EIR.
Stage 2: When a financial asset has shown a significant increase in credit risk since origination, the Group records an allowance for the LTECLs. The mechanics are similar to those explained above, but PDs and LGDs are estimated over the lifetime of the instrument. The expected cash shortfalls are discounted by an approximation to the original EIR.
Stage 3: For financial asset considered credit-impaired, the Group recognises the lifetime expected credit losses for these financial assets. The method is similar to that for Stage 2 assets, with the PD set at 100%.
96 / Q A T A R I N S U R A N C E G R O U P A N N U A L R E P O R T 2 0 2 0 / 97
The ECLs for debt instruments measured at FVOCI do not reduce the carrying amount of these financial assets in the consolidated statement of financial position, which remains at fair value. Instead, an amount equal to the allowance that would arise if the assets were measured at amortised cost is recognised in OCI as an accumulated impairment amount, with a corresponding charge to profit or loss. The accumulated loss recognised in OCI is recycled to the profit and loss upon derecognition of the assets.
c) Forward looking information
The Group, for forward looking information, relies on a broad range of forward looking information as economic inputs, such as:
• GDP growth
• Unemployment rates
• Central Bank base rates
The inputs and models used for calculating ECLs may not always capture all characteristics of the market at the date of the consolidated financial statements. To reflect this, qualitative adjustments or overlays are occasionally made as temporary adjustments when such differences are significantly material.
Cash and short-term depositsCash and short-term deposits in the statement of financial position comprise cash at bank and on hand and short-term highly liquid deposits with a maturity of three months or less, that are readily convertible to a known amount of cash and subject to an insignificant risk of changes in value.
Short term borrowingsShort term borrowings are recognised initially at fair value, net of transaction costs incurred and it is subsequently stated at amortised cost; any difference between the proceeds (net of transaction costs) and the redemption value is recognised in the consolidated statement of profit or loss over the period of the borrowings using the effective interest method.
Investment propertiesInvestment properties are properties held to earn rentals and/or for capital appreciation. Investment properties are measured initially at
cost, including transaction costs. Subsequent to initial recognition, investment properties are carried at historical cost less accumulated depreciation and accumulated impairment losses. Investment properties are derecognised when either they have been disposed-off or when the investment property is permanently withdrawn from use and no future economic benefit is expected from its disposal. Any gains or losses on the retirement or disposal of an investment property are recognised in the consolidated statement of profit or loss in the year of retirement or disposal.
Property and equipmentProperty and equipment, including owner-occupied properties, are carried at historical cost less accumulated depreciation and accumulated impairment losses. Subsequent expenditure is capitalised only when it is probable that future economic benefits associated with the expenditure will flow to the Group.
Ongoing repairs and maintenance are charged to the consolidated statement of profit or loss during the financial period they are incurred.
The assets’ residual values, useful lives and method of depreciation applied are reviewed and adjusted, if appropriate, at each financial year end and adjusted prospectively, if appropriate. Impairment reviews are performed when there are indicators that the carrying value may not be recoverable. Impairment losses are recognised in the consolidated statement of profit or loss as an expense.
An item of property and equipment is derecognised upon disposal or when no future economic benefits are expected from its use or disposal. Any gain or loss arising on de-recognition of the asset (calculated as the difference between the net disposal proceeds and the carrying amount of the asset) is recognised in the consolidated statement of profit or loss in the year the asset is derecognised.
Depreciation
Depreciation is provided on a straight-line basis on all property and equipment and investment properties, other than freehold land which is determined to have an indefinite life.
The rates of depreciation are based upon the following estimated useful lives:
Buildings - 15 to 30 years
Furniture & fixtures - 2 to 5 years
Motor vehicles - 3 years
Depreciation methods, useful lives and residual values are reviewed and adjusted if appropriate at each financial year end.
Impairment of non-financial assetsAn assessment is made at each reporting date to determine whether there is objective evidence that an asset or group of assets is impaired. If such evidence exists, the estimated recoverable amount of that asset is determined and an impairment loss is recognised for the difference between the recoverable amount and the carrying amount. Impairment losses are recognised in the consolidated statement of profit or loss.
ProvisionsThe Group recognises provisions in the consolidated financial statements when the Group has a legal or constructive obligation (as a result of a past event) that can be estimated reliably, and it is probable that an outflow of economic benefits will be required to settle the obligation. The provision is created by charging the consolidated statement of profit or loss for any obligations as per the calculated value of these obligations and the expectation of their realisation at the reporting date.
Employees’ end of service benefits
National employees
With respect to national employees, the Group makes contributions to the government pension fund to the respective local regulatory authorities as a percentage of the employees’ salaries in accordance with the requirements of respective local laws pertaining to retirement and pensions, wherever required. The Group’s share of contributions to these schemes, which are defined contribution schemes under International Accounting Standard 19, Employee Benefits are charged to the consolidated statement of profit or loss in the year to which they relate.
Other employees
Provision is made for amounts payable in respect of employees’ end of service benefits based on contractual obligations or respective local labour laws of the group entities, whichever is higher, and is calculated using the employee’s salary and period of service at the reporting date.
Contribution to social and sports fundPursuant to the Qatar Law No. 13 of 2008 and the related clarifications issued in 2012, which is applicable to all Qatari listed shareholding companies with publicly traded shares, the Group has made an appropriation of 2.5% of its adjusted net profit to a state social fund.
Share capitalThe Group has issued ordinary shares that are classified as equity instruments. Incremental external costs that are directly attributable to the issue of these shares are recognised in equity.
Dividend distributionDividend distribution to the Parent Company’s shareholders is recognised as a liability in the Parent Company’s consolidated financial statements in the period in which the dividends are approved by the Parent Company’s shareholders.
Earnings per shareThe Group presents basic and diluted earnings per share (EPS) data for its ordinary shares. Basic EPS is calculated by dividing the profit or loss attributable to ordinary shareholders of the Parent Company, further adjusted to the dividend appropriation for instruments eligible for additional Tier 2 Capital, by the weighted number of ordinary shares outstanding during the year. Diluted EPS is calculated by adjusting the earnings and number of shares for the effects of all dilutive potential shares.
Income taxTaxation on the results for the year comprises of current tax calculated as per the fiscal regulations of the respective country in which the Group operates.
98 / Q A T A R I N S U R A N C E G R O U P A N N U A L R E P O R T 2 0 2 0 / 99
Current tax is recognised in the profit or loss as the tax payable on the taxable income for the year, using tax rates enacted or substantially enacted at the reporting date, and any adjustment to tax payable in respect of previous years.
Deferred income tax is provided, using the liability method, for all temporary differences arising between the tax bases of assets and liabilities and their carrying values for financial reporting purposes. Currently enacted tax rates are used to determine deferred tax. Deferred income tax assets and liabilities are offset as there is a legally enforceable right to offset. The tax effects on the temporary differences are disclosed under non-current liabilities as deferred tax.
A deferred tax asset is recognised only to the extent that it is probable that future taxable profits will be available against which the unused tax losses and credits can be utilised. Deferred tax assets are reduced to the extent that it is no longer probable that the related tax benefit will be realised.
Income tax on the profit or loss for the year comprises current and deferred tax. Income tax is recognised in the consolidated statement of profit or loss for the year except to the extent that it relates to items recognised directly to other comprehensive income, in which case it is recognised in equity.
LeasesThe Group assesses at contract inception whether a contract is, or contains, a lease. That is, if the contract conveys the right to control the use of an identified asset for a period of time in exchange for consideration.
Group as a lessee
The Group recognises right-of-use assets and lease liabilities for those leases previously classified as operating leases, except for short-term leases and leases of low-value assets. The right-of-use assets for most leases are recognised based on the carrying amount as if the standard had always been applied, apart from the use of incremental borrowing rate at the date of initial application. In some leases, the right-of-use assets are recognized based on the amount equal to the lease
liabilities, adjusted for any related prepaid and accrued lease payments previously recognised. Lease liabilities are recognised based on the present value of the remaining lease payments, discounted using the incremental borrowing rate at the date of initial application.
Group as a lessor
Leases in which the Group does not transfer substantially all the risks and rewards incidental to ownership of an asset are classified as operating leases. Rental income arising is accounted for on a straight-line basis over the lease terms and is included in revenue in the consolidated statement of profit or loss due to its operating nature. Initial direct costs incurred in negotiating and arranging an operating lease are added to the carrying amount of the leased asset and recognised over the lease term on the same basis as rental income. Contingent rents are recognised as revenue in the period in which they are earned.
Non-current assets held for sale and discontinued operationsThe Group classifies non-current assets and disposal groups as held for sale if their carrying amounts will be recovered principally through a sale transaction rather than through continuing use. Non-current assets and disposal groups classified as held for sale are measured at the lower of their carrying amount and fair value less costs to sell. Costs to sell are the incremental costs directly attributable to the disposal of an asset (disposal group), excluding finance costs and income tax expense.
The criteria for held for sale classification is regarded as met only when the sale is highly probable, and the asset or disposal group is available for immediate sale in its present condition. Actions required to complete the sale should indicate that it is unlikely that significant changes to the sale will be made or that the decision to sell will be withdrawn. Management must be committed to the plan to sell the asset and the sale expected to be completed within one year from the date of the classification.
Property, plant and equipment and intangible assets are not depreciated or amortised once classified as held for sale.
Assets and liabilities classified as held for sale are presented separately as current items in the statement of financial position.
A disposal group qualifies as discontinued operation if it is a component of an entity that either has been disposed of, or is classified as held for sale, and:
• Represents a separate major line of business or geographical area of operations
• Is part of a single co-ordinated plan to dispose of a separate major line of business or geographical area of operations
Or
• Is a subsidiary acquired exclusively with a view to resale
Discontinued operations are excluded from the results of continuing operations and are presented as a single amount as profit or loss after tax from discontinued operations in the statement of profit or loss.
Detailed disclosures are provided in Note 41. All other notes to the financial statements include amounts for continuing operations, unless indicated otherwise.
Insurance operations
Insurance and other receivables
Insurance and other receivables are recognised when due and measured on initial recognition at the fair value of the consideration received or receivable. The carrying value of the receivables is reviewed for impairment whenever events or circumstances indicate that the carrying amount may not be recoverable, with the impairment loss recorded in the consolidated statement of profit or loss. After initial measurement, insurance and other receivables are measured at amortised cost as deemed appropriate.
Insurance receivables are derecognised when the derecognition criteria for financial assets have been met.
Reinsurance contract assetsThe Group cedes insurance risk in the normal course of business as part of its businesses model. Reinsurance assets represent balances recoverable from reinsurance companies. Amounts recoverable from reinsurers are
estimated in a manner consistent with the outstanding claims provision or settled claims associated with the reinsurers’ policies and are in accordance with the related reinsurance contract.
Reinsurance assets are reviewed for impairment at each reporting date, or more frequently, when an indication of impairment arises during the reporting year. Impairment occurs when there is objective evidence as a result of an event that occurred after initial recognition of the reinsurance asset that the Group may not receive all outstanding amounts due under the terms of the contract and the event has a reliably measurable impact on the amounts that the Group will receive from the reinsurer. The impairment loss is recorded in the consolidated statement of profit or loss. Ceeded reinsurance arrangements do not relieve the Group from its obligations to policyholders.
Reinsurance and other payablesReinsurance and other payables are recognised when due and measured on initial recognition at the fair value of the consideration received less directly attributable transaction costs. Subsequently, reinsurance and other payables are measured at amortised cost, as deemed appropriate.
Gross premiums Gross premiums are recognised when written and include an estimate for written premiums receivable at period end. Gross premiums comprise the total premiums receivable for the whole period of cover provided by contracts entered into during the accounting periods. Gross premiums also include any adjustments arising in the accounting period for premiums receivable in respect of business written in prior accounting periods. Premium on insurance contracts are recognised as revenue (earned premiums) proportionally over the period of coverage or using actuarial assumptions, as appropriate.
Unearned premiums are those proportions of premiums written in a year that relate to periods of risk after the reporting date. The proportion attributable to subsequent periods is deferred as a provision for unearned premiums.
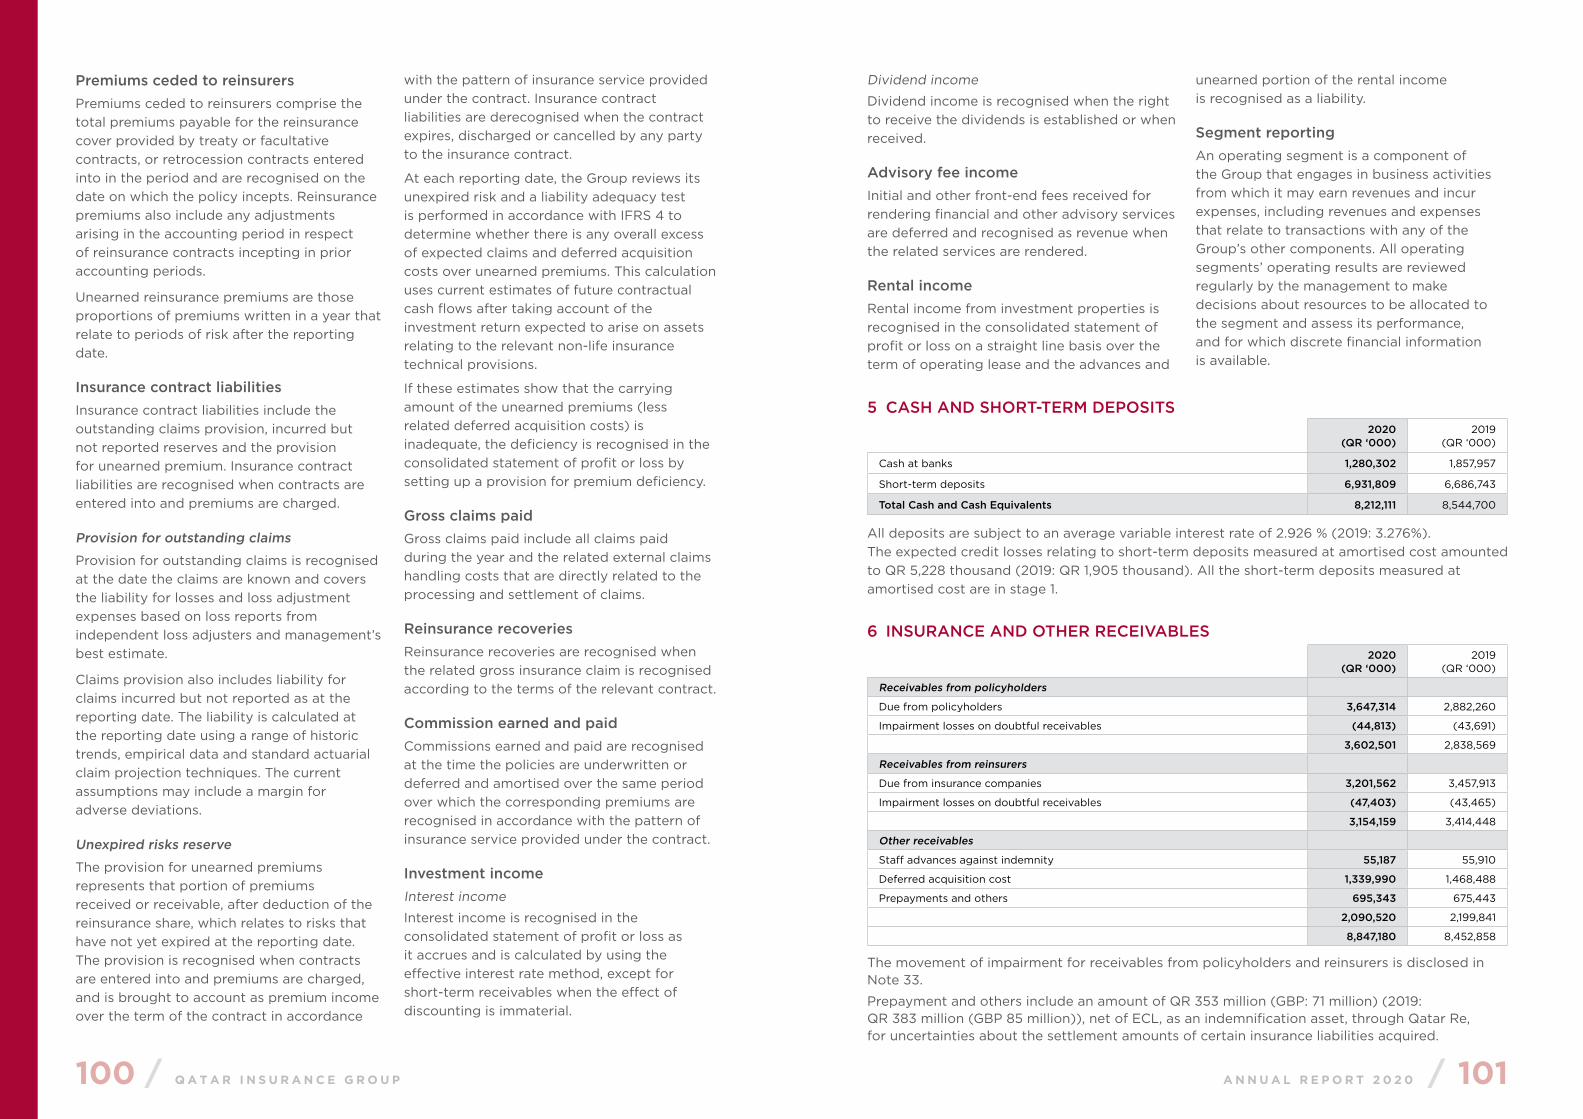
100 / Q A T A R I N S U R A N C E G R O U P A N N U A L R E P O R T 2 0 2 0 / 101
Premiums ceded to reinsurers Premiums ceded to reinsurers comprise the total premiums payable for the reinsurance cover provided by treaty or facultative contracts, or retrocession contracts entered into in the period and are recognised on the date on which the policy incepts. Reinsurance premiums also include any adjustments arising in the accounting period in respect of reinsurance contracts incepting in prior accounting periods.
Unearned reinsurance premiums are those proportions of premiums written in a year that relate to periods of risk after the reporting date.
Insurance contract liabilitiesInsurance contract liabilities include the outstanding claims provision, incurred but not reported reserves and the provision for unearned premium. Insurance contract liabilities are recognised when contracts are entered into and premiums are charged.
Provision for outstanding claims
Provision for outstanding claims is recognised at the date the claims are known and covers the liability for losses and loss adjustment expenses based on loss reports from independent loss adjusters and management’s best estimate.
Claims provision also includes liability for claims incurred but not reported as at the reporting date. The liability is calculated at the reporting date using a range of historic trends, empirical data and standard actuarial claim projection techniques. The current assumptions may include a margin for adverse deviations.
Unexpired risks reserve
The provision for unearned premiums represents that portion of premiums received or receivable, after deduction of the reinsurance share, which relates to risks that have not yet expired at the reporting date. The provision is recognised when contracts are entered into and premiums are charged, and is brought to account as premium income over the term of the contract in accordance
with the pattern of insurance service provided under the contract. Insurance contract liabilities are derecognised when the contract expires, discharged or cancelled by any party to the insurance contract.
At each reporting date, the Group reviews its unexpired risk and a liability adequacy test is performed in accordance with IFRS 4 to determine whether there is any overall excess of expected claims and deferred acquisition costs over unearned premiums. This calculation uses current estimates of future contractual cash flows after taking account of the investment return expected to arise on assets relating to the relevant non-life insurance technical provisions.
If these estimates show that the carrying amount of the unearned premiums (less related deferred acquisition costs) is inadequate, the deficiency is recognised in the consolidated statement of profit or loss by setting up a provision for premium deficiency.
Gross claims paidGross claims paid include all claims paid during the year and the related external claims handling costs that are directly related to the processing and settlement of claims.
Reinsurance recoveriesReinsurance recoveries are recognised when the related gross insurance claim is recognised according to the terms of the relevant contract.
Commission earned and paidCommissions earned and paid are recognised at the time the policies are underwritten or deferred and amortised over the same period over which the corresponding premiums are recognised in accordance with the pattern of insurance service provided under the contract.
Investment incomeInterest income
Interest income is recognised in the consolidated statement of profit or loss as it accrues and is calculated by using the effective interest rate method, except for short-term receivables when the effect of discounting is immaterial.
Dividend income
Dividend income is recognised when the right to receive the dividends is established or when received.
Advisory fee incomeInitial and other front-end fees received for rendering financial and other advisory services are deferred and recognised as revenue when the related services are rendered.
Rental incomeRental income from investment properties is recognised in the consolidated statement of profit or loss on a straight line basis over the term of operating lease and the advances and
unearned portion of the rental income is recognised as a liability.
Segment reportingAn operating segment is a component of the Group that engages in business activities from which it may earn revenues and incur expenses, including revenues and expenses that relate to transactions with any of the Group’s other components. All operating segments’ operating results are reviewed regularly by the management to make decisions about resources to be allocated to the segment and assess its performance, and for which discrete financial information is available.
5 CASH AND SHORT-TERM DEPOSITS2020
(QR ‘000)2019
(QR ‘000)
Cash at banks 1,280,302 1,857,957
Short-term deposits 6,931,809 6,686,743
Total Cash and Cash Equivalents 8,212,111 8,544,700
All deposits are subject to an average variable interest rate of 2.926 % (2019: 3.276%). The expected credit losses relating to short-term deposits measured at amortised cost amounted to QR 5,228 thousand (2019: QR 1,905 thousand). All the short-term deposits measured at amortised cost are in stage 1.
6 INSURANCE AND OTHER RECEIVABLES2020
(QR ‘000)2019
(QR ‘000)
Receivables from policyholders
Due from policyholders 3,647,314 2,882,260
Impairment losses on doubtful receivables (44,813) (43,691)
3,602,501 2,838,569
Receivables from reinsurers
Due from insurance companies 3,201,562 3,457,913
Impairment losses on doubtful receivables (47,403) (43,465)
3,154,159 3,414,448
Other receivables
Staff advances against indemnity 55,187 55,910
Deferred acquisition cost 1,339,990 1,468,488
Prepayments and others 695,343 675,443
2,090,520 2,199,841
8,847,180 8,452,858
The movement of impairment for receivables from policyholders and reinsurers is disclosed in Note 33.
Prepayment and others include an amount of QR 353 million (GBP: 71 million) (2019: QR 383 million (GBP 85 million)), net of ECL, as an indemnification asset, through Qatar Re, for uncertainties about the settlement amounts of certain insurance liabilities acquired.

102 / Q A T A R I N S U R A N C E G R O U P A N N U A L R E P O R T 2 0 2 0 / 103
7 INSURANCE CONTRACT LIABILITIES AND REINSURANCE CONTRACT ASSETS2020
(QR ‘000)2019
(QR ‘000)
Gross insurance contract liabilities
Claims reported and unsettled 11,441,827 10,598,797
Claims incurred but not reported 6,017,323 3,885,558
Unearned premiums 5,621,835 6,014,863
23,080,985 20,499,218
Reinsurers’ share of insurance contract liabilities
Claims reported and unsettled 3,952,034 3,431,016
Claims incurred but not reported 1,730,350 685,499
Unearned premiums 1,620,480 983,289
7,302,864 5,099,804
Net insurance contract liabilities
Claims reported and unsettled 7,489,793 7,167,781
Claims incurred but not reported 4,286,973 3,200,059
Unearned premiums 4,001,355 5,031,574
15,778,121 15,399,414
Movements in insurance contract liabilities and reinsurance contract assets are as follows:
2020 2019
Insurance contract liabilities
(QR ‘000)
Reinsurers’ share
(QR ‘000)
Net(QR ‘000)
Insurance contract liabilities
(QR ‘000)
Reinsurers’ share
(QR ‘000)
Net(QR ‘000)
At 1 January 14,484,355 4,116,515 10,367,840 14,697,786 4,401,594 10,296,192
Claims incurred 11,643,108 3,627,059 8,016,049 9,035,767 1,500,521 7,535,246
Claims paid during the year (8,756,152) (1,939,333) (6,816,819) (9,733,481) (1,803,912) (7,929,569)
Effect of portfolio transfer and other movements
390,878 (49,334) 440,212 484,283 18,312 465,971
Effect of loss of control of a Subsidiary
(303,039) (72,523) (230,516) - - -
At 31 December 17,459,150 5,682,384 11,776,766 14,484,355 4,116,515 10,367,840
At 1 January 6,014,863 983,289 5,031,574 5,723,211 1,065,591 4,657,620
Premiums written during the year
12,978,617 3,898,984 9,079,633 12,843,165 1,744,393 11,098,772
Premiums earned during the year
(13,066,660) (3,231,232) (9,835,428) (12,474,313) (1,826,443) (10,647,870)
Effect of portfolio transfer and other movements
133,034 - 133,034 (77,200) (252) (76,948)
Effect of loss of control of a Subsidiary
(438,019) (30,561) (407,458) - - -
At 31 December 5,621,835 1,620,480 4,001,355 6,014,863 983,289 5,031,574
8 INVESTMENT IN ASSOCIATES AND JOINT VENTURE
2020(QR ‘000)
2019(QR ‘000)
Damaan Islamic Insurance Company “BEEMA” Q.P.S.C. 105,615 98,808
Al Liwan Real Estate W.L.L. 45,074 46,167
Massoun Insurance Services L.L.C. 4,757 4,663
QLM Life & Medical Insurance Company Q.P.S.C. (Note 41) 274,750 -
430,196 149,638
Details of the investment in associates and joint venture held during the years ended 31 December 2020 and 31 December 2019 were as follows.
Name of investment Place of incorporationand operation
Proportion of ownership and voting power held Principal activities
Damaan Islamic Insurance Company “BEEMA” (Q.P.S.C.)
State of Qatar 25% directly Insurance and reinsurance
Al Liwan Real Estate W.L.L. State of Qatar 38.46% directlyReal estate investment,
brokerage and management
QLM Life & Medical Insurance Company Q.P.S.C. (Note 41)
State of Qatar 25% directly Medical and life insurance
Massoun Insurance Services L.L.C.
State of Qatar 50% directlyInsurance marketing and
distribution
(i) These investments have no contingent liabilities or capital commitments as at 31 December 2020 or 2019.
Summarised financial information of the associates and joint venture are as follows:
2020(QR ‘000)
2019(QR ‘000)
Current assets 2,317,414 530,200
Non-current assets 402,170 462,881
Current liabilities 1,449,049 211,369
Non-current liabilities 244,612 241,735
Profit for the year 153,318 47,809
The movements in investment in associates and a joint venture are as follows:
2020(QR ‘000)
2019(QR ‘000)
Balance at 1 January 149,638 145,267
Additions (Note 41) 274,750 -
Dividends received (9,375) (9,251)
Share of profit for the year 15,183 13,622
Balance at 31 December 430,196 149,638
9 INVESTMENTS2020
(QR ‘000)2019
(QR ‘000)
Financial investments at fair value through profit or loss (FVTPL) 3,541,704 3,873,131
Financial investments at fair value through other comprehensive
income (FVOCI) 13,016,220 11,915,361
16,557,924 15,788,492
2020
FVTPL(QR ‘000)
FVOCI(QR ‘000)
Managed funds 743,986 -
Derivative financial instruments (Note 34) 26,354 31,394
Debt instruments 611,674 12,984,826
Qatar public shareholding companies 858,608 -
International quoted shares 373,504 -
Unquoted shares and private equity 927,578 -
Total 3,541,704 13,016,220
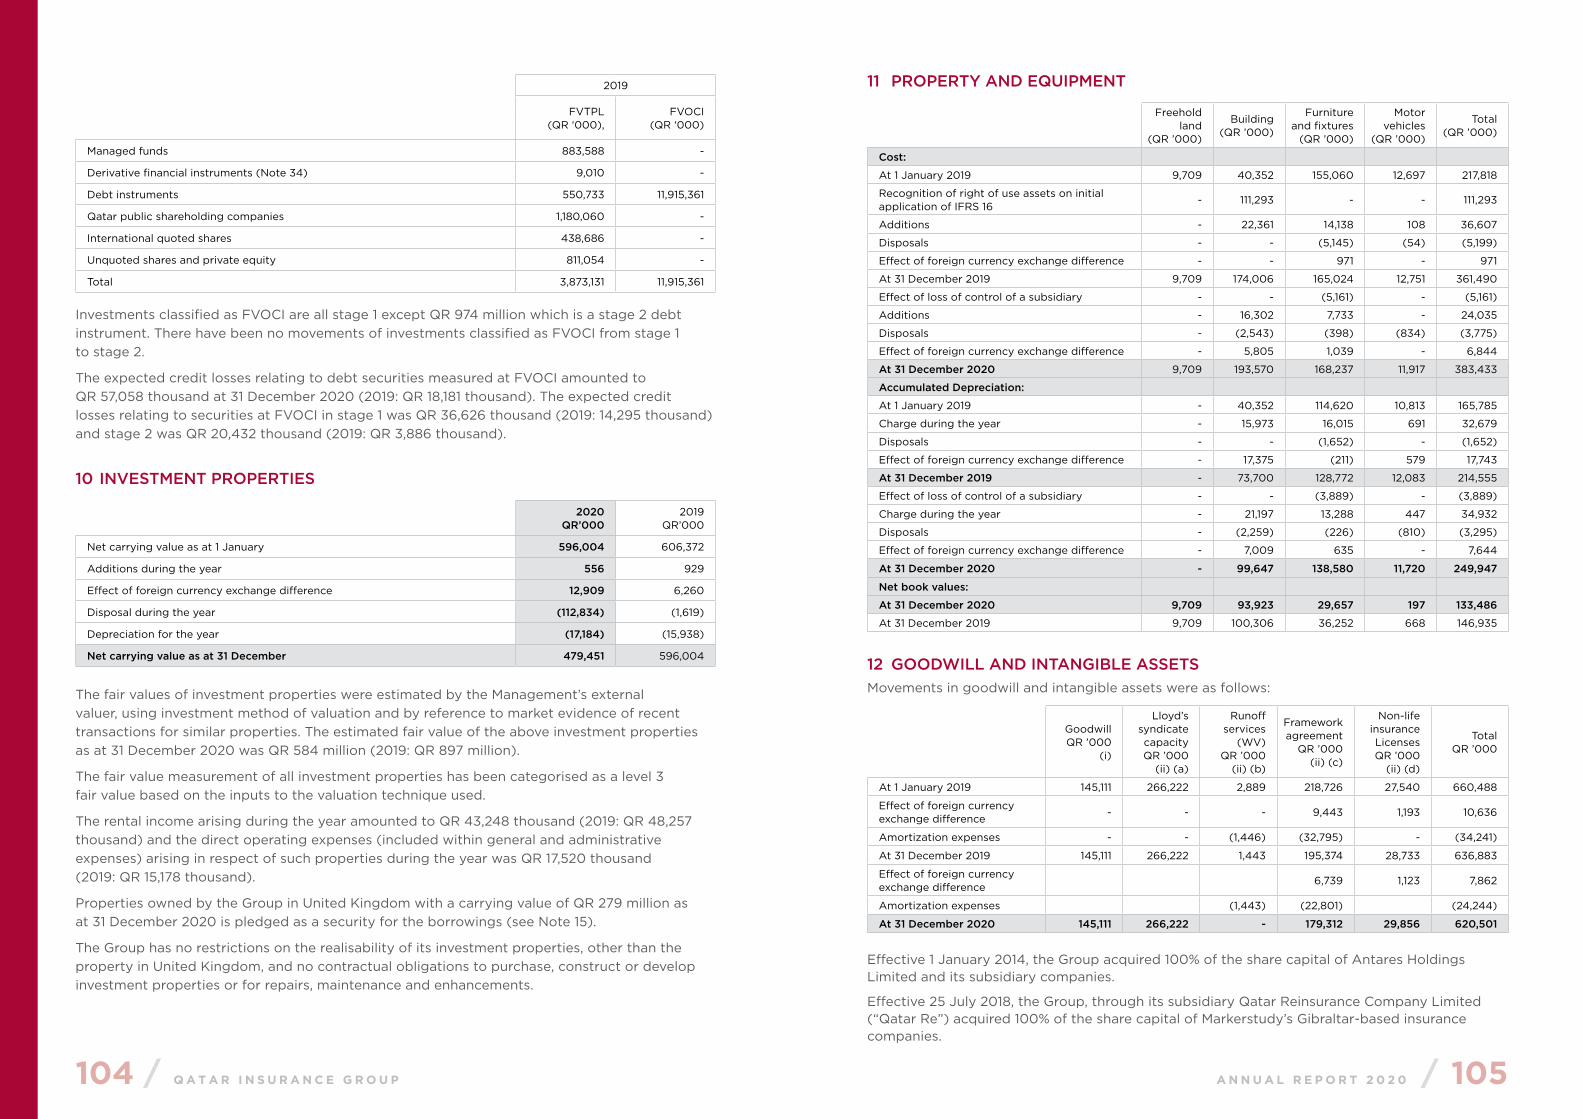
104 / Q A T A R I N S U R A N C E G R O U P A N N U A L R E P O R T 2 0 2 0 / 105
2019
FVTPL(QR ‘000),
FVOCI(QR ‘000)
Managed funds 883,588 -
Derivative financial instruments (Note 34) 9,010 -
Debt instruments 550,733 11,915,361
Qatar public shareholding companies 1,180,060 -
International quoted shares 438,686 -
Unquoted shares and private equity 811,054 -
Total 3,873,131 11,915,361
Investments classified as FVOCI are all stage 1 except QR 974 million which is a stage 2 debt instrument. There have been no movements of investments classified as FVOCI from stage 1 to stage 2.
The expected credit losses relating to debt securities measured at FVOCI amounted to QR 57,058 thousand at 31 December 2020 (2019: QR 18,181 thousand). The expected credit losses relating to securities at FVOCI in stage 1 was QR 36,626 thousand (2019: 14,295 thousand) and stage 2 was QR 20,432 thousand (2019: QR 3,886 thousand).
10 INVESTMENT PROPERTIES
2020QR’000
2019QR’000
Net carrying value as at 1 January 596,004 606,372
Additions during the year 556 929
Effect of foreign currency exchange difference 12,909 6,260
Disposal during the year (112,834) (1,619)
Depreciation for the year (17,184) (15,938)
Net carrying value as at 31 December 479,451 596,004
The fair values of investment properties were estimated by the Management’s external valuer, using investment method of valuation and by reference to market evidence of recent transactions for similar properties. The estimated fair value of the above investment properties as at 31 December 2020 was QR 584 million (2019: QR 897 million).
The fair value measurement of all investment properties has been categorised as a level 3 fair value based on the inputs to the valuation technique used.
The rental income arising during the year amounted to QR 43,248 thousand (2019: QR 48,257 thousand) and the direct operating expenses (included within general and administrative expenses) arising in respect of such properties during the year was QR 17,520 thousand (2019: QR 15,178 thousand).
Properties owned by the Group in United Kingdom with a carrying value of QR 279 million as at 31 December 2020 is pledged as a security for the borrowings (see Note 15).
The Group has no restrictions on the realisability of its investment properties, other than the property in United Kingdom, and no contractual obligations to purchase, construct or develop investment properties or for repairs, maintenance and enhancements.
11 PROPERTY AND EQUIPMENT
Freehold land
(QR ’000)
Building(QR ’000)
Furniture and fixtures
(QR ’000)
Motor vehicles
(QR ’000)
Total(QR ’000)
Cost:
At 1 January 2019 9,709 40,352 155,060 12,697 217,818
Recognition of right of use assets on initial application of IFRS 16
- 111,293 - - 111,293
Additions - 22,361 14,138 108 36,607
Disposals - - (5,145) (54) (5,199)
Effect of foreign currency exchange difference - - 971 - 971
At 31 December 2019 9,709 174,006 165,024 12,751 361,490
Effect of loss of control of a subsidiary - - (5,161) - (5,161)
Additions - 16,302 7,733 - 24,035
Disposals - (2,543) (398) (834) (3,775)
Effect of foreign currency exchange difference - 5,805 1,039 - 6,844
At 31 December 2020 9,709 193,570 168,237 11,917 383,433
Accumulated Depreciation:
At 1 January 2019 - 40,352 114,620 10,813 165,785
Charge during the year - 15,973 16,015 691 32,679
Disposals - - (1,652) - (1,652)
Effect of foreign currency exchange difference - 17,375 (211) 579 17,743
At 31 December 2019 - 73,700 128,772 12,083 214,555
Effect of loss of control of a subsidiary - - (3,889) - (3,889)
Charge during the year - 21,197 13,288 447 34,932
Disposals - (2,259) (226) (810) (3,295)
Effect of foreign currency exchange difference - 7,009 635 - 7,644
At 31 December 2020 - 99,647 138,580 11,720 249,947
Net book values:
At 31 December 2020 9,709 93,923 29,657 197 133,486
At 31 December 2019 9,709 100,306 36,252 668 146,935
12 GOODWILL AND INTANGIBLE ASSETSMovements in goodwill and intangible assets were as follows:
GoodwillQR ’000
(i)
Lloyd’s syndicate capacityQR ’000
(ii) (a)
Runoff services
(WV)QR ’000
(ii) (b)
Framework agreement
QR ’000(ii) (c)
Non-life insurance LicensesQR ’000
(ii) (d)
TotalQR ’000
At 1 January 2019 145,111 266,222 2,889 218,726 27,540 660,488
Effect of foreign currency exchange difference
- - - 9,443 1,193 10,636
Amortization expenses - - (1,446) (32,795) - (34,241)
At 31 December 2019 145,111 266,222 1,443 195,374 28,733 636,883
Effect of foreign currency exchange difference
6,739 1,123 7,862
Amortization expenses (1,443) (22,801) (24,244)
At 31 December 2020 145,111 266,222 - 179,312 29,856 620,501
Effective 1 January 2014, the Group acquired 100% of the share capital of Antares Holdings Limited and its subsidiary companies.
Effective 25 July 2018, the Group, through its subsidiary Qatar Reinsurance Company Limited (“Qatar Re”) acquired 100% of the share capital of Markerstudy’s Gibraltar-based insurance companies.
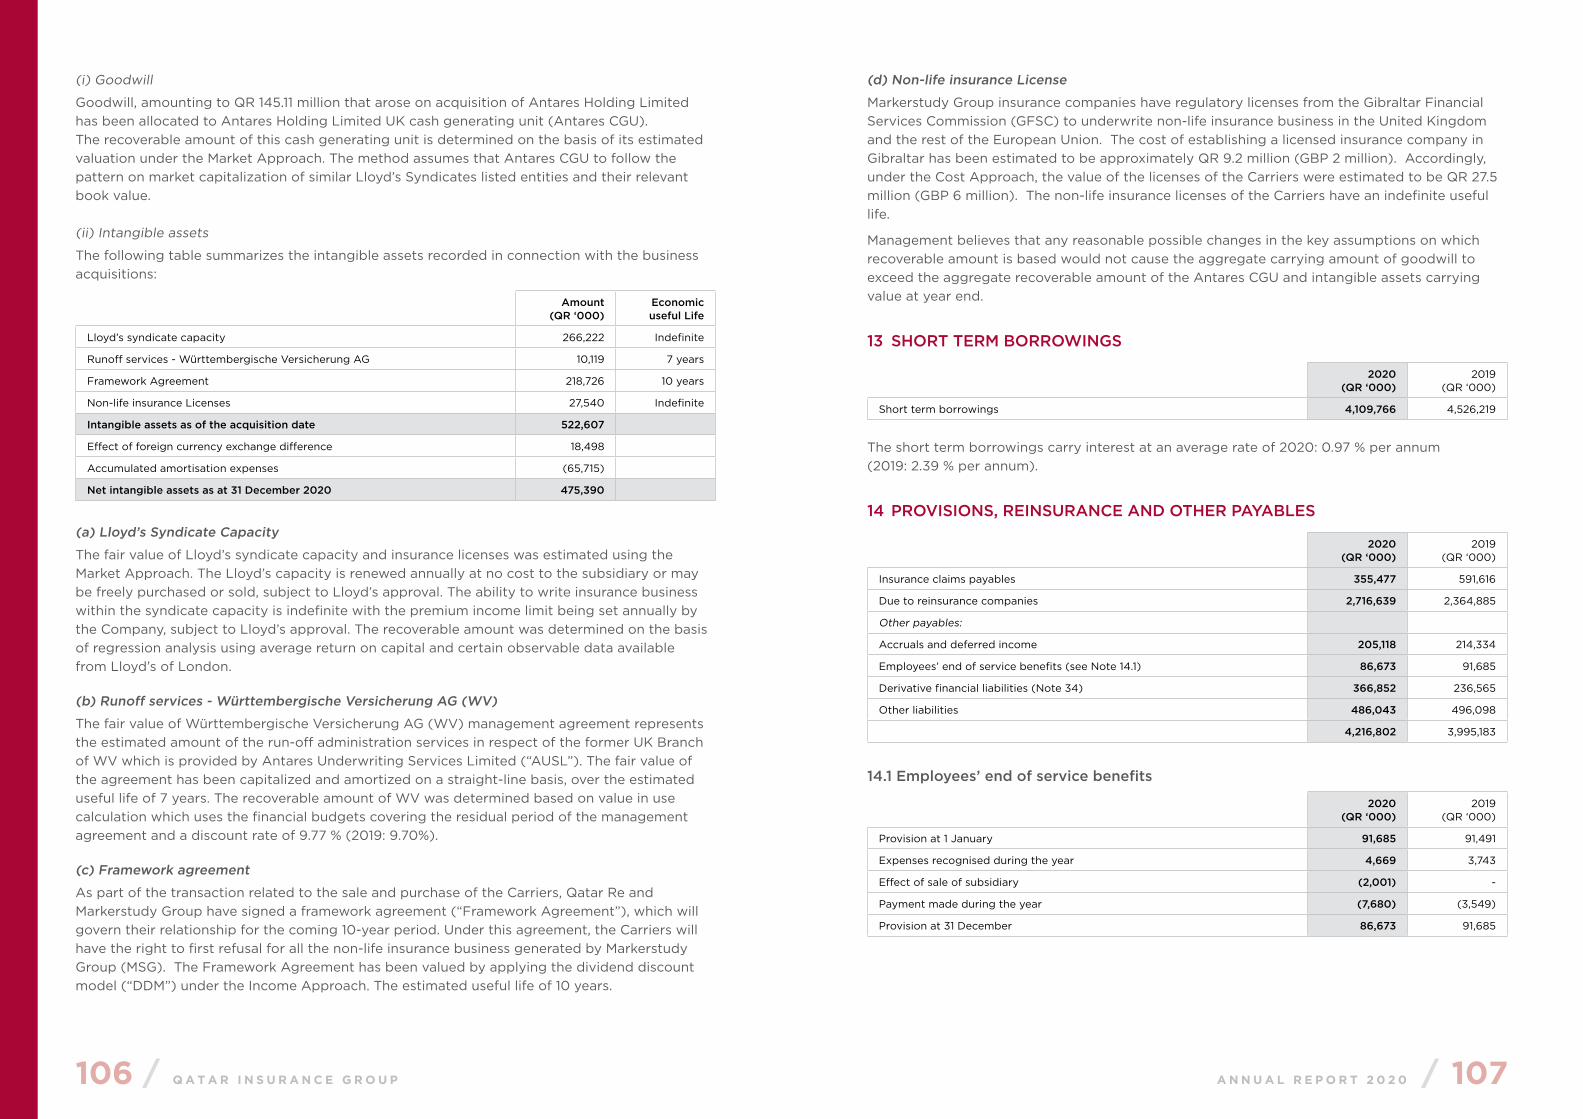
106 / Q A T A R I N S U R A N C E G R O U P A N N U A L R E P O R T 2 0 2 0 / 107
(i) Goodwill
Goodwill, amounting to QR 145.11 million that arose on acquisition of Antares Holding Limited has been allocated to Antares Holding Limited UK cash generating unit (Antares CGU). The recoverable amount of this cash generating unit is determined on the basis of its estimated valuation under the Market Approach. The method assumes that Antares CGU to follow the pattern on market capitalization of similar Lloyd’s Syndicates listed entities and their relevant book value.
(ii) Intangible assets
The following table summarizes the intangible assets recorded in connection with the business acquisitions:
Amount(QR ‘000)
Economic useful Life
Lloyd’s syndicate capacity 266,222 Indefinite
Runoff services - Württembergische Versicherung AG 10,119 7 years
Framework Agreement 218,726 10 years
Non-life insurance Licenses 27,540 Indefinite
Intangible assets as of the acquisition date 522,607
Effect of foreign currency exchange difference 18,498
Accumulated amortisation expenses (65,715)
Net intangible assets as at 31 December 2020 475,390
(a) Lloyd’s Syndicate Capacity
The fair value of Lloyd’s syndicate capacity and insurance licenses was estimated using the Market Approach. The Lloyd’s capacity is renewed annually at no cost to the subsidiary or may be freely purchased or sold, subject to Lloyd’s approval. The ability to write insurance business within the syndicate capacity is indefinite with the premium income limit being set annually by the Company, subject to Lloyd’s approval. The recoverable amount was determined on the basis of regression analysis using average return on capital and certain observable data available from Lloyd’s of London.
(b) Runoff services - Württembergische Versicherung AG (WV)
The fair value of Württembergische Versicherung AG (WV) management agreement represents the estimated amount of the run-off administration services in respect of the former UK Branch of WV which is provided by Antares Underwriting Services Limited (“AUSL”). The fair value of the agreement has been capitalized and amortized on a straight-line basis, over the estimated useful life of 7 years. The recoverable amount of WV was determined based on value in use calculation which uses the financial budgets covering the residual period of the management agreement and a discount rate of 9.77 % (2019: 9.70%).
(c) Framework agreement
As part of the transaction related to the sale and purchase of the Carriers, Qatar Re and Markerstudy Group have signed a framework agreement (“Framework Agreement”), which will govern their relationship for the coming 10-year period. Under this agreement, the Carriers will have the right to first refusal for all the non-life insurance business generated by Markerstudy Group (MSG). The Framework Agreement has been valued by applying the dividend discount model (“DDM”) under the Income Approach. The estimated useful life of 10 years.
(d) Non-life insurance License
Markerstudy Group insurance companies have regulatory licenses from the Gibraltar Financial Services Commission (GFSC) to underwrite non-life insurance business in the United Kingdom and the rest of the European Union. The cost of establishing a licensed insurance company in Gibraltar has been estimated to be approximately QR 9.2 million (GBP 2 million). Accordingly, under the Cost Approach, the value of the licenses of the Carriers were estimated to be QR 27.5 million (GBP 6 million). The non-life insurance licenses of the Carriers have an indefinite useful life.
Management believes that any reasonable possible changes in the key assumptions on which recoverable amount is based would not cause the aggregate carrying amount of goodwill to exceed the aggregate recoverable amount of the Antares CGU and intangible assets carrying value at year end.
13 SHORT TERM BORROWINGS
2020(QR ‘000)
2019(QR ‘000)
Short term borrowings 4,109,766 4,526,219
The short term borrowings carry interest at an average rate of 2020: 0.97 % per annum (2019: 2.39 % per annum).
14 PROVISIONS, REINSURANCE AND OTHER PAYABLES
2020(QR ‘000)
2019(QR ‘000)
Insurance claims payables 355,477 591,616
Due to reinsurance companies 2,716,639 2,364,885
Other payables:
Accruals and deferred income 205,118 214,334
Employees’ end of service benefits (see Note 14.1) 86,673 91,685
Derivative financial liabilities (Note 34) 366,852 236,565
Other liabilities 486,043 496,098
4,216,802 3,995,183
14.1 Employees’ end of service benefits
2020(QR ‘000)
2019(QR ‘000)
Provision at 1 January 91,685 91,491
Expenses recognised during the year 4,669 3,743
Effect of sale of subsidiary (2,001) -
Payment made during the year (7,680) (3,549)
Provision at 31 December 86,673 91,685
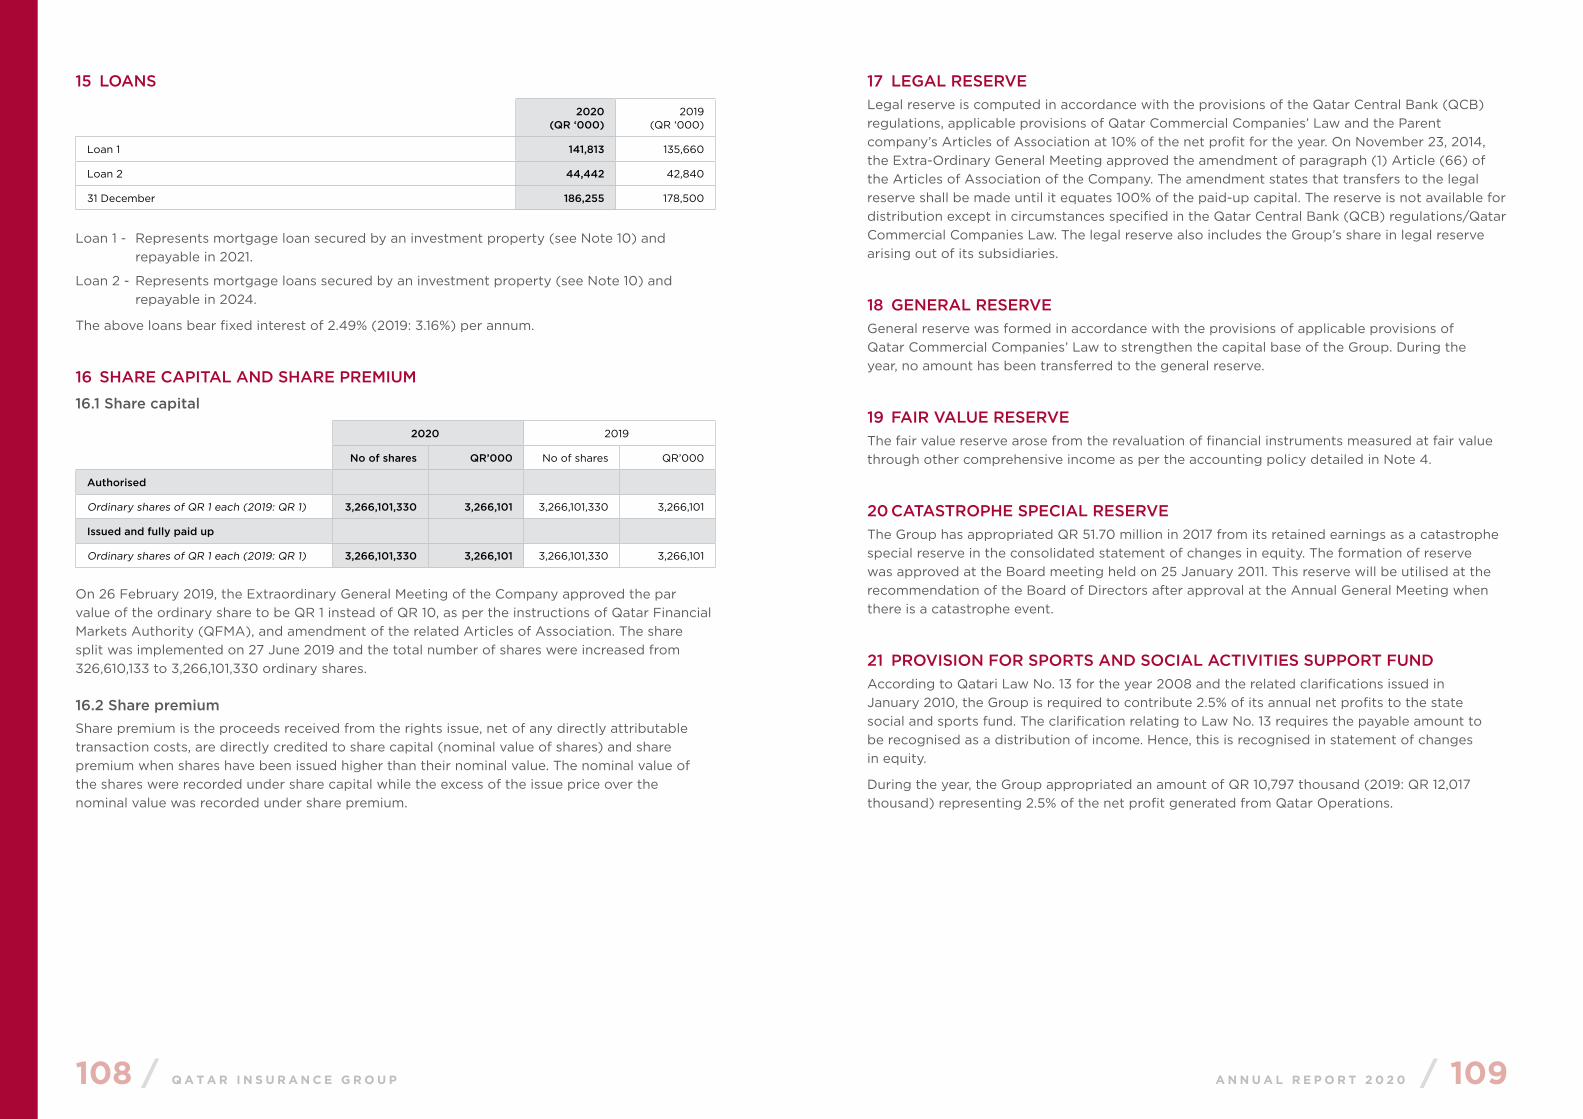
108 / Q A T A R I N S U R A N C E G R O U P A N N U A L R E P O R T 2 0 2 0 / 109
15 LOANS
2020(QR ‘000)
2019(QR ‘000)
Loan 1 141,813 135,660
Loan 2 44,442 42,840
31 December 186,255 178,500
Loan 1 - Represents mortgage loan secured by an investment property (see Note 10) and repayable in 2021.
Loan 2 - Represents mortgage loans secured by an investment property (see Note 10) and repayable in 2024.
The above loans bear fixed interest of 2.49% (2019: 3.16%) per annum.
16 SHARE CAPITAL AND SHARE PREMIUM
16.1 Share capital
2020 2019
No of shares QR’000 No of shares QR’000
Authorised
Ordinary shares of QR 1 each (2019: QR 1) 3,266,101,330 3,266,101 3,266,101,330 3,266,101
Issued and fully paid up
Ordinary shares of QR 1 each (2019: QR 1) 3,266,101,330 3,266,101 3,266,101,330 3,266,101
On 26 February 2019, the Extraordinary General Meeting of the Company approved the par value of the ordinary share to be QR 1 instead of QR 10, as per the instructions of Qatar Financial Markets Authority (QFMA), and amendment of the related Articles of Association. The share split was implemented on 27 June 2019 and the total number of shares were increased from 326,610,133 to 3,266,101,330 ordinary shares.
16.2 Share premiumShare premium is the proceeds received from the rights issue, net of any directly attributable transaction costs, are directly credited to share capital (nominal value of shares) and share premium when shares have been issued higher than their nominal value. The nominal value of the shares were recorded under share capital while the excess of the issue price over the nominal value was recorded under share premium.
17 LEGAL RESERVELegal reserve is computed in accordance with the provisions of the Qatar Central Bank (QCB) regulations, applicable provisions of Qatar Commercial Companies’ Law and the Parent company’s Articles of Association at 10% of the net profit for the year. On November 23, 2014, the Extra-Ordinary General Meeting approved the amendment of paragraph (1) Article (66) of the Articles of Association of the Company. The amendment states that transfers to the legal reserve shall be made until it equates 100% of the paid-up capital. The reserve is not available for distribution except in circumstances specified in the Qatar Central Bank (QCB) regulations/Qatar Commercial Companies Law. The legal reserve also includes the Group’s share in legal reserve arising out of its subsidiaries.
18 GENERAL RESERVE General reserve was formed in accordance with the provisions of applicable provisions of Qatar Commercial Companies’ Law to strengthen the capital base of the Group. During the year, no amount has been transferred to the general reserve.
19 FAIR VALUE RESERVE The fair value reserve arose from the revaluation of financial instruments measured at fair value through other comprehensive income as per the accounting policy detailed in Note 4.
20 CATASTROPHE SPECIAL RESERVEThe Group has appropriated QR 51.70 million in 2017 from its retained earnings as a catastrophe special reserve in the consolidated statement of changes in equity. The formation of reserve was approved at the Board meeting held on 25 January 2011. This reserve will be utilised at the recommendation of the Board of Directors after approval at the Annual General Meeting when there is a catastrophe event.
21 PROVISION FOR SPORTS AND SOCIAL ACTIVITIES SUPPORT FUNDAccording to Qatari Law No. 13 for the year 2008 and the related clarifications issued in January 2010, the Group is required to contribute 2.5% of its annual net profits to the state social and sports fund. The clarification relating to Law No. 13 requires the payable amount to be recognised as a distribution of income. Hence, this is recognised in statement of changes in equity.
During the year, the Group appropriated an amount of QR 10,797 thousand (2019: QR 12,017 thousand) representing 2.5% of the net profit generated from Qatar Operations.
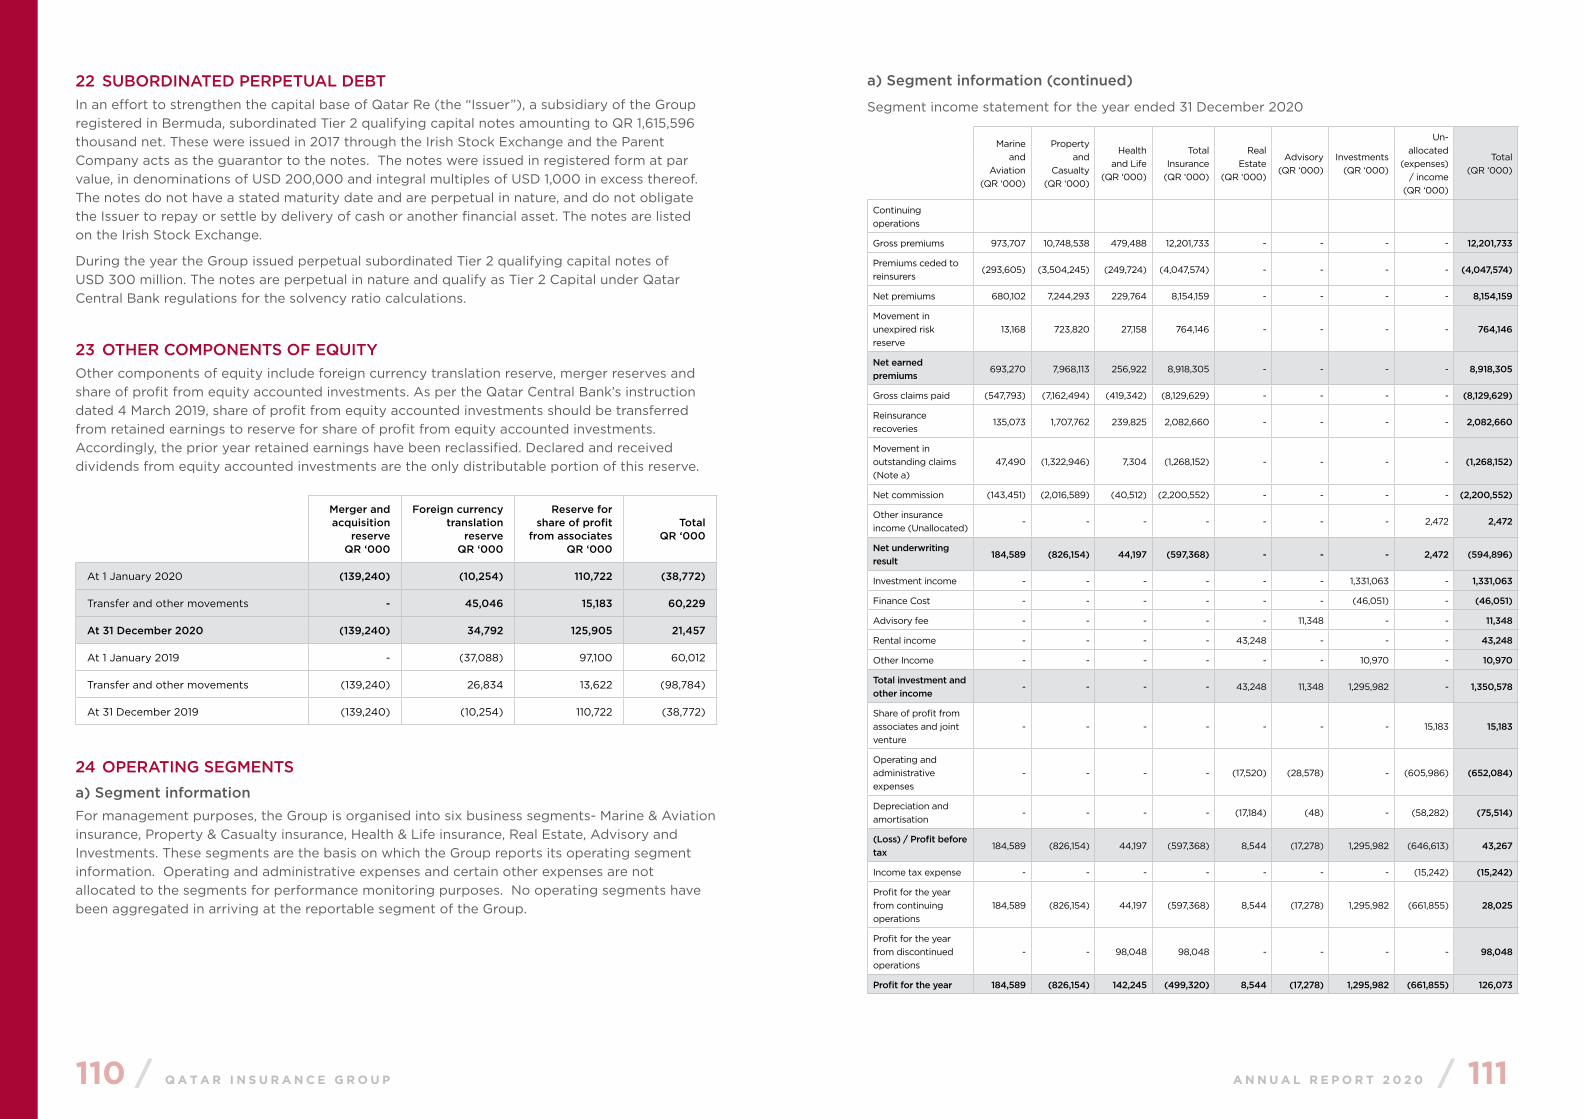
110 / Q A T A R I N S U R A N C E G R O U P A N N U A L R E P O R T 2 0 2 0 / 111
22 SUBORDINATED PERPETUAL DEBTIn an effort to strengthen the capital base of Qatar Re (the “Issuer”), a subsidiary of the Group registered in Bermuda, subordinated Tier 2 qualifying capital notes amounting to QR 1,615,596 thousand net. These were issued in 2017 through the Irish Stock Exchange and the Parent Company acts as the guarantor to the notes. The notes were issued in registered form at par value, in denominations of USD 200,000 and integral multiples of USD 1,000 in excess thereof. The notes do not have a stated maturity date and are perpetual in nature, and do not obligate the Issuer to repay or settle by delivery of cash or another financial asset. The notes are listed on the Irish Stock Exchange.
During the year the Group issued perpetual subordinated Tier 2 qualifying capital notes of USD 300 million. The notes are perpetual in nature and qualify as Tier 2 Capital under Qatar Central Bank regulations for the solvency ratio calculations.
23 OTHER COMPONENTS OF EQUITYOther components of equity include foreign currency translation reserve, merger reserves and share of profit from equity accounted investments. As per the Qatar Central Bank’s instruction dated 4 March 2019, share of profit from equity accounted investments should be transferred from retained earnings to reserve for share of profit from equity accounted investments. Accordingly, the prior year retained earnings have been reclassified. Declared and received dividends from equity accounted investments are the only distributable portion of this reserve.
Merger and acquisition
reserveQR ‘000
Foreign currency translation
reserveQR ‘000
Reserve for share of profit
from associates QR ‘000
TotalQR ‘000
At 1 January 2020 (139,240) (10,254) 110,722 (38,772)
Transfer and other movements - 45,046 15,183 60,229
At 31 December 2020 (139,240) 34,792 125,905 21,457
At 1 January 2019 - (37,088) 97,100 60,012
Transfer and other movements (139,240) 26,834 13,622 (98,784)
At 31 December 2019 (139,240) (10,254) 110,722 (38,772)
24 OPERATING SEGMENTSa) Segment informationFor management purposes, the Group is organised into six business segments- Marine & Aviation insurance, Property & Casualty insurance, Health & Life insurance, Real Estate, Advisory and Investments. These segments are the basis on which the Group reports its operating segment information. Operating and administrative expenses and certain other expenses are not allocated to the segments for performance monitoring purposes. No operating segments have been aggregated in arriving at the reportable segment of the Group.
a) Segment information (continued)
Segment income statement for the year ended 31 December 2020
Marine and
Aviation(QR ‘000)
Property and
Casualty(QR ‘000)
Health and Life
(QR ‘000)
Total Insurance
(QR ‘000)
Real Estate
(QR ‘000)
Advisory(QR ‘000)
Investments(QR ‘000)
Un-allocated
(expenses) / income
(QR ‘000)
Total(QR ‘000)
Continuing operations
Gross premiums 973,707 10,748,538 479,488 12,201,733 - - - - 12,201,733
Premiums ceded to reinsurers
(293,605) (3,504,245) (249,724) (4,047,574) - - - - (4,047,574)
Net premiums 680,102 7,244,293 229,764 8,154,159 - - - - 8,154,159
Movement in unexpired risk reserve
13,168 723,820 27,158 764,146 - - - - 764,146
Net earned premiums
693,270 7,968,113 256,922 8,918,305 - - - - 8,918,305
Gross claims paid (547,793) (7,162,494) (419,342) (8,129,629) - - - - (8,129,629)
Reinsurance recoveries
135,073 1,707,762 239,825 2,082,660 - - - - 2,082,660
Movement in outstanding claims (Note a)
47,490 (1,322,946) 7,304 (1,268,152) - - - - (1,268,152)
Net commission (143,451) (2,016,589) (40,512) (2,200,552) - - - - (2,200,552)
Other insurance income (Unallocated)
- - - - - - - 2,472 2,472
Net underwriting result
184,589 (826,154) 44,197 (597,368) - - - 2,472 (594,896)
Investment income - - - - - - 1,331,063 - 1,331,063
Finance Cost - - - - - - (46,051) - (46,051)
Advisory fee - - - - - 11,348 - - 11,348
Rental income - - - - 43,248 - - - 43,248
Other Income - - - - - - 10,970 - 10,970
Total investment and other income
- - - - 43,248 11,348 1,295,982 - 1,350,578
Share of profit from associates and joint venture
- - - - - - - 15,183 15,183
Operating and administrative expenses
- - - - (17,520) (28,578) - (605,986) (652,084)
Depreciation and amortisation
- - - - (17,184) (48) - (58,282) (75,514)
(Loss) / Profit before tax
184,589 (826,154) 44,197 (597,368) 8,544 (17,278) 1,295,982 (646,613) 43,267
Income tax expense - - - - - - - (15,242) (15,242)
Profit for the year from continuing operations
184,589 (826,154) 44,197 (597,368) 8,544 (17,278) 1,295,982 (661,855) 28,025
Profit for the year from discontinued operations
- - 98,048 98,048 - - - - 98,048
Profit for the year 184,589 (826,154) 142,245 (499,320) 8,544 (17,278) 1,295,982 (661,855) 126,073
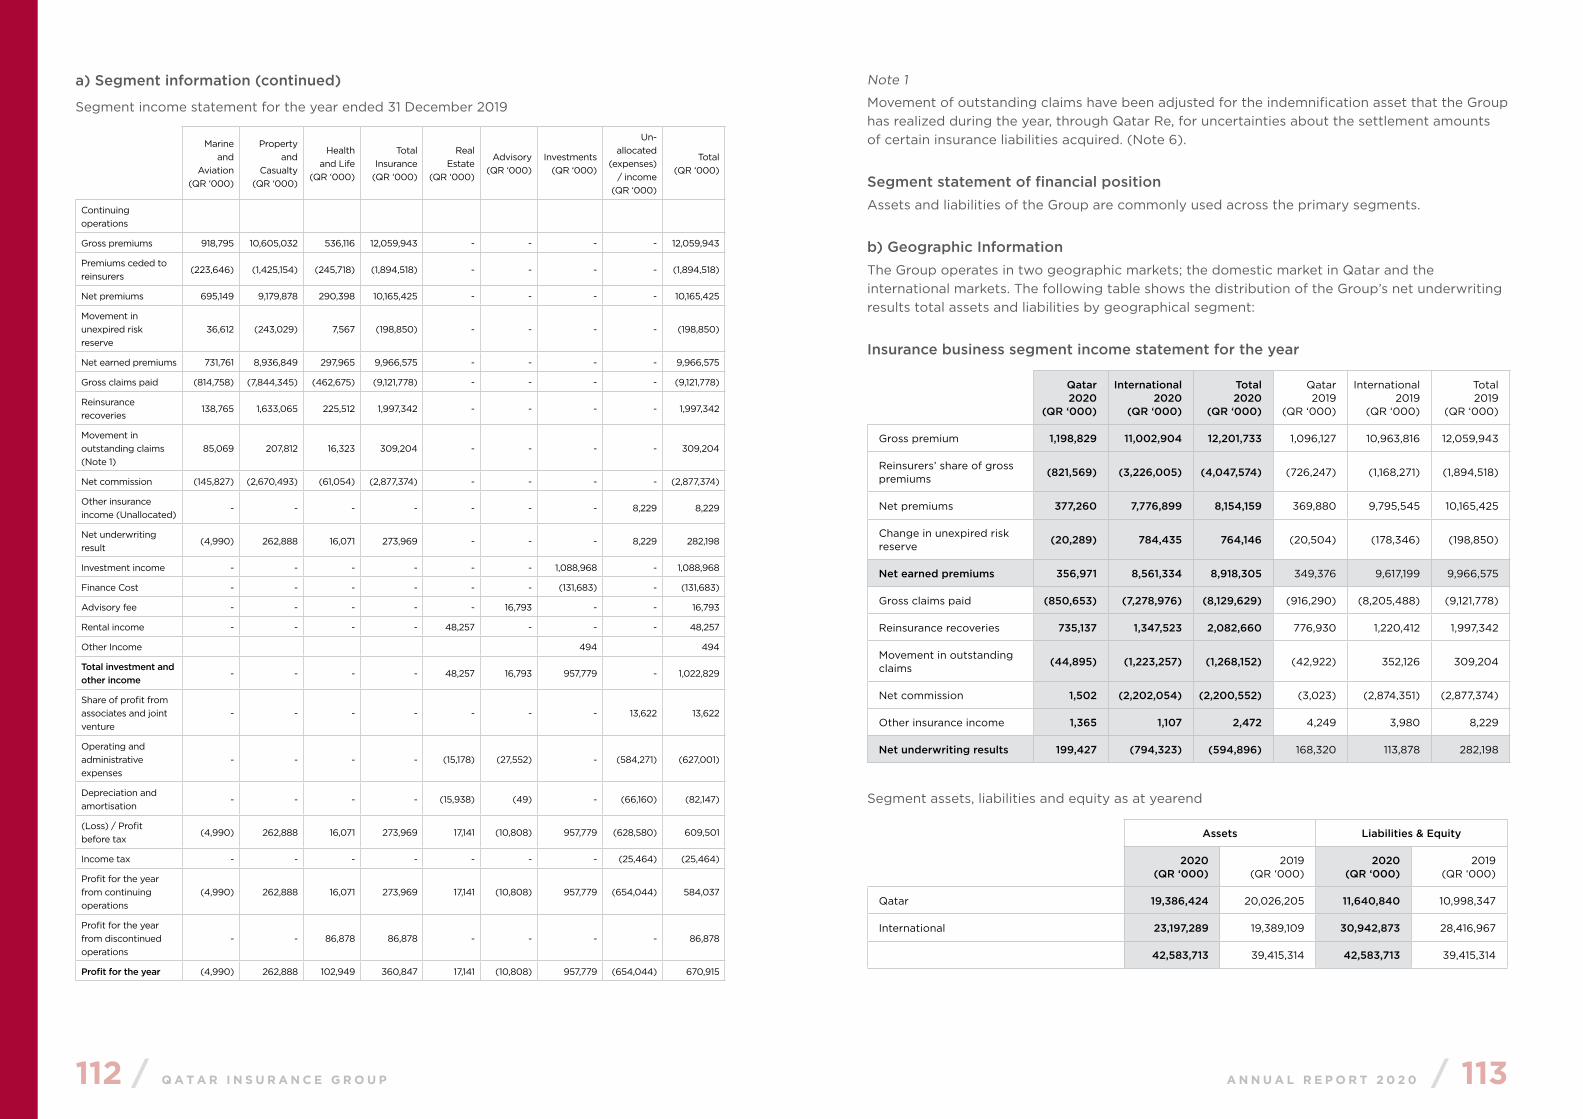
112 / Q A T A R I N S U R A N C E G R O U P A N N U A L R E P O R T 2 0 2 0 / 113
a) Segment information (continued)
Segment income statement for the year ended 31 December 2019
Marine and
Aviation(QR ‘000)
Property and
Casualty(QR ‘000)
Health and Life
(QR ‘000)
Total Insurance
(QR ‘000)
Real Estate
(QR ‘000)
Advisory(QR ‘000)
Investments(QR ‘000)
Un-allocated
(expenses) / income
(QR ‘000)
Total(QR ‘000)
Continuing operations
Gross premiums 918,795 10,605,032 536,116 12,059,943 - - - - 12,059,943
Premiums ceded to reinsurers
(223,646) (1,425,154) (245,718) (1,894,518) - - - - (1,894,518)
Net premiums 695,149 9,179,878 290,398 10,165,425 - - - - 10,165,425
Movement in unexpired risk reserve
36,612 (243,029) 7,567 (198,850) - - - - (198,850)
Net earned premiums 731,761 8,936,849 297,965 9,966,575 - - - - 9,966,575
Gross claims paid (814,758) (7,844,345) (462,675) (9,121,778) - - - - (9,121,778)
Reinsurance recoveries
138,765 1,633,065 225,512 1,997,342 - - - - 1,997,342
Movement in outstanding claims (Note 1)
85,069 207,812 16,323 309,204 - - - - 309,204
Net commission (145,827) (2,670,493) (61,054) (2,877,374) - - - - (2,877,374)
Other insurance income (Unallocated)
- - - - - - - 8,229 8,229
Net underwriting result
(4,990) 262,888 16,071 273,969 - - - 8,229 282,198
Investment income - - - - - - 1,088,968 - 1,088,968
Finance Cost - - - - - - (131,683) - (131,683)
Advisory fee - - - - - 16,793 - - 16,793
Rental income - - - - 48,257 - - - 48,257
Other Income 494 494
Total investment and other income
- - - - 48,257 16,793 957,779 - 1,022,829
Share of profit from associates and joint venture
- - - - - - - 13,622 13,622
Operating and administrative expenses
- - - - (15,178) (27,552) - (584,271) (627,001)
Depreciation and amortisation
- - - - (15,938) (49) - (66,160) (82,147)
(Loss) / Profit before tax
(4,990) 262,888 16,071 273,969 17,141 (10,808) 957,779 (628,580) 609,501
Income tax - - - - - - - (25,464) (25,464)
Profit for the year from continuing operations
(4,990) 262,888 16,071 273,969 17,141 (10,808) 957,779 (654,044) 584,037
Profit for the year from discontinued operations
- - 86,878 86,878 - - - - 86,878
Profit for the year (4,990) 262,888 102,949 360,847 17,141 (10,808) 957,779 (654,044) 670,915
Note 1
Movement of outstanding claims have been adjusted for the indemnification asset that the Group has realized during the year, through Qatar Re, for uncertainties about the settlement amounts of certain insurance liabilities acquired. (Note 6).
Segment statement of financial positionAssets and liabilities of the Group are commonly used across the primary segments.
b) Geographic InformationThe Group operates in two geographic markets; the domestic market in Qatar and the international markets. The following table shows the distribution of the Group’s net underwriting results total assets and liabilities by geographical segment:
Insurance business segment income statement for the year
Qatar2020
(QR ‘000)
International2020
(QR ‘000)
Total2020
(QR ‘000)
Qatar2019
(QR ‘000)
International2019
(QR ‘000)
Total2019
(QR ‘000)
Gross premium 1,198,829 11,002,904 12,201,733 1,096,127 10,963,816 12,059,943
Reinsurers’ share of gross premiums
(821,569) (3,226,005) (4,047,574) (726,247) (1,168,271) (1,894,518)
Net premiums 377,260 7,776,899 8,154,159 369,880 9,795,545 10,165,425
Change in unexpired risk reserve
(20,289) 784,435 764,146 (20,504) (178,346) (198,850)
Net earned premiums 356,971 8,561,334 8,918,305 349,376 9,617,199 9,966,575
Gross claims paid (850,653) (7,278,976) (8,129,629) (916,290) (8,205,488) (9,121,778)
Reinsurance recoveries 735,137 1,347,523 2,082,660 776,930 1,220,412 1,997,342
Movement in outstanding claims
(44,895) (1,223,257) (1,268,152) (42,922) 352,126 309,204
Net commission 1,502 (2,202,054) (2,200,552) (3,023) (2,874,351) (2,877,374)
Other insurance income 1,365 1,107 2,472 4,249 3,980 8,229
Net underwriting results 199,427 (794,323) (594,896) 168,320 113,878 282,198
Segment assets, liabilities and equity as at yearend
Assets Liabilities & Equity
2020(QR ‘000)
2019(QR ‘000)
2020(QR ‘000)
2019(QR ‘000)
Qatar 19,386,424 20,026,205 11,640,840 10,998,347
International 23,197,289 19,389,109 30,942,873 28,416,967
42,583,713 39,415,314 42,583,713 39,415,314
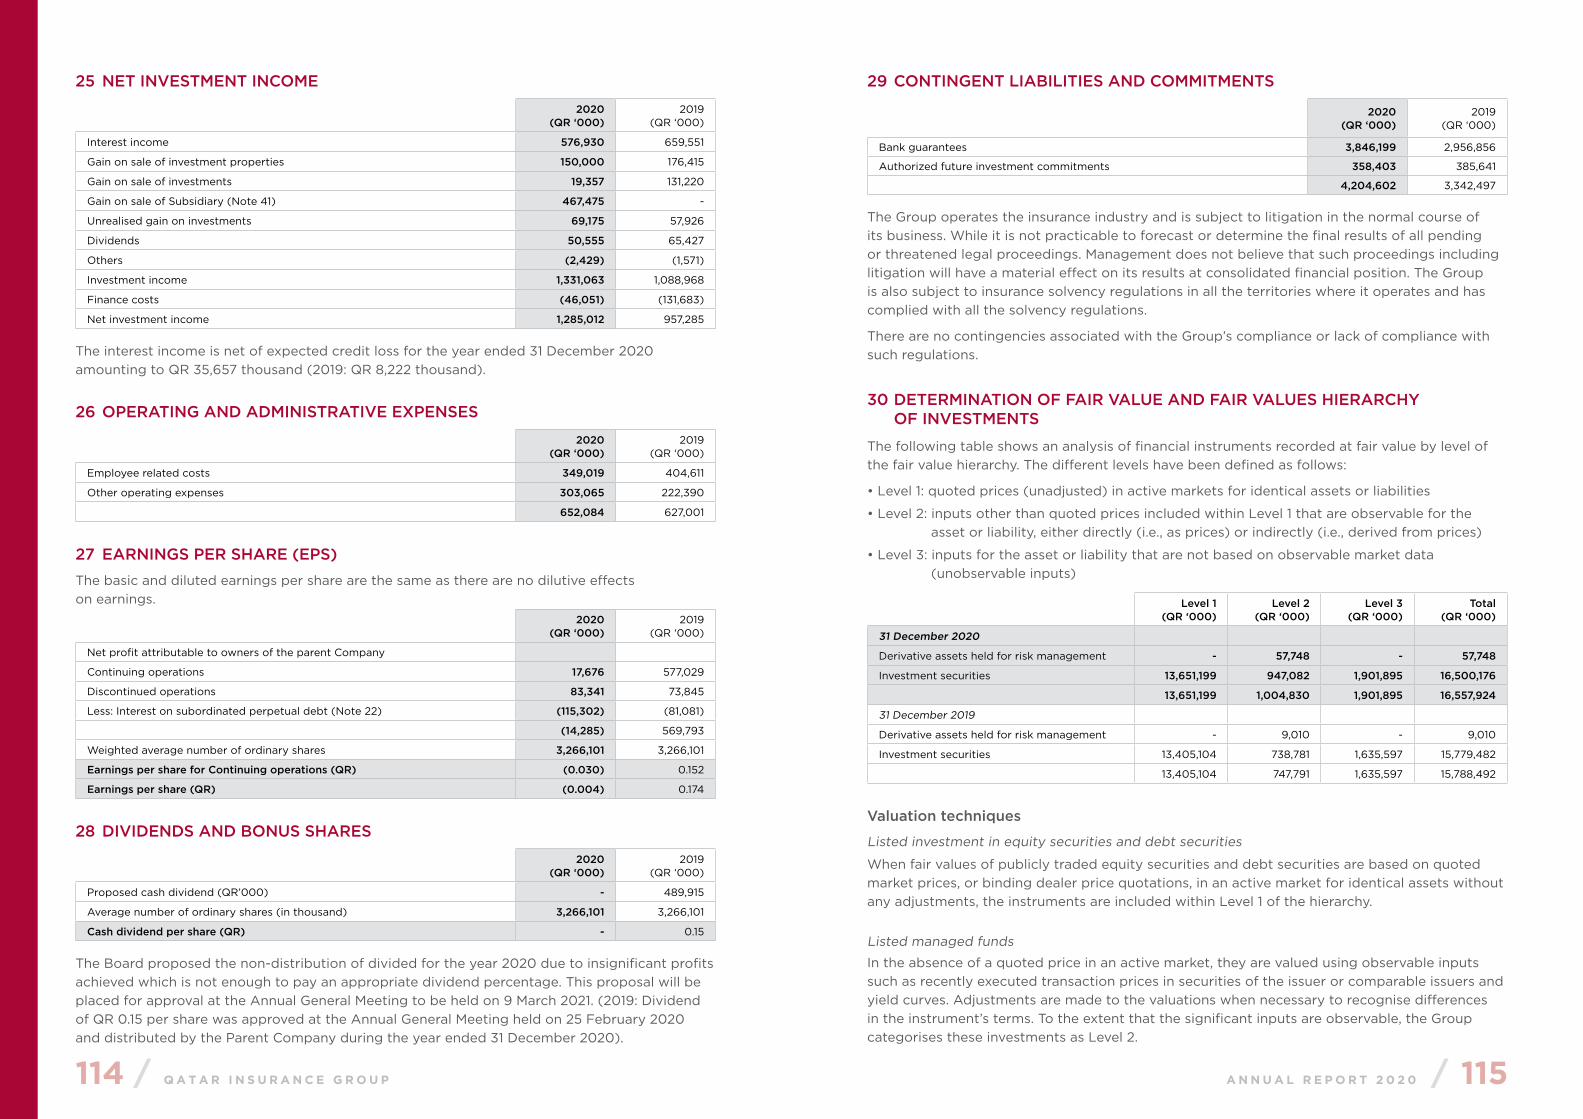
114 / Q A T A R I N S U R A N C E G R O U P A N N U A L R E P O R T 2 0 2 0 / 115
25 NET INVESTMENT INCOME
2020(QR ‘000)
2019(QR ‘000)
Interest income 576,930 659,551
Gain on sale of investment properties 150,000 176,415
Gain on sale of investments 19,357 131,220
Gain on sale of Subsidiary (Note 41) 467,475 -
Unrealised gain on investments 69,175 57,926
Dividends 50,555 65,427
Others (2,429) (1,571)
Investment income 1,331,063 1,088,968
Finance costs (46,051) (131,683)
Net investment income 1,285,012 957,285
The interest income is net of expected credit loss for the year ended 31 December 2020 amounting to QR 35,657 thousand (2019: QR 8,222 thousand).
26 OPERATING AND ADMINISTRATIVE EXPENSES
2020(QR ‘000)
2019(QR ‘000)
Employee related costs 349,019 404,611
Other operating expenses 303,065 222,390
652,084 627,001
27 EARNINGS PER SHARE (EPS)The basic and diluted earnings per share are the same as there are no dilutive effects on earnings.
2020(QR ‘000)
2019(QR ‘000)
Net profit attributable to owners of the parent Company
Continuing operations 17,676 577,029
Discontinued operations 83,341 73,845
Less: Interest on subordinated perpetual debt (Note 22) (115,302) (81,081)
(14,285) 569,793
Weighted average number of ordinary shares 3,266,101 3,266,101
Earnings per share for Continuing operations (QR) (0.030) 0.152
Earnings per share (QR) (0.004) 0.174
28 DIVIDENDS AND BONUS SHARES
2020(QR ‘000)
2019(QR ‘000)
Proposed cash dividend (QR’000) - 489,915
Average number of ordinary shares (in thousand) 3,266,101 3,266,101
Cash dividend per share (QR) - 0.15
The Board proposed the non-distribution of divided for the year 2020 due to insignificant profits achieved which is not enough to pay an appropriate dividend percentage. This proposal will be placed for approval at the Annual General Meeting to be held on 9 March 2021. (2019: Dividend of QR 0.15 per share was approved at the Annual General Meeting held on 25 February 2020 and distributed by the Parent Company during the year ended 31 December 2020).
29 CONTINGENT LIABILITIES AND COMMITMENTS
2020(QR ‘000)
2019(QR ‘000)
Bank guarantees 3,846,199 2,956,856
Authorized future investment commitments 358,403 385,641
4,204,602 3,342,497
The Group operates the insurance industry and is subject to litigation in the normal course of its business. While it is not practicable to forecast or determine the final results of all pending or threatened legal proceedings. Management does not believe that such proceedings including litigation will have a material effect on its results at consolidated financial position. The Group is also subject to insurance solvency regulations in all the territories where it operates and has complied with all the solvency regulations.
There are no contingencies associated with the Group’s compliance or lack of compliance with such regulations.
30 DETERMINATION OF FAIR VALUE AND FAIR VALUES HIERARCHY OF INVESTMENTS
The following table shows an analysis of financial instruments recorded at fair value by level of the fair value hierarchy. The different levels have been defined as follows:
• Level 1: quoted prices (unadjusted) in active markets for identical assets or liabilities
• Level 2: inputs other than quoted prices included within Level 1 that are observable for the asset or liability, either directly (i.e., as prices) or indirectly (i.e., derived from prices)
• Level 3: inputs for the asset or liability that are not based on observable market data (unobservable inputs)
Level 1(QR ‘000)
Level 2(QR ‘000)
Level 3(QR ‘000)
Total(QR ‘000)
31 December 2020
Derivative assets held for risk management - 57,748 - 57,748
Investment securities 13,651,199 947,082 1,901,895 16,500,176
13,651,199 1,004,830 1,901,895 16,557,924
31 December 2019
Derivative assets held for risk management - 9,010 - 9,010
Investment securities 13,405,104 738,781 1,635,597 15,779,482
13,405,104 747,791 1,635,597 15,788,492
Valuation techniques
Listed investment in equity securities and debt securities
When fair values of publicly traded equity securities and debt securities are based on quoted market prices, or binding dealer price quotations, in an active market for identical assets without any adjustments, the instruments are included within Level 1 of the hierarchy.
Listed managed funds
In the absence of a quoted price in an active market, they are valued using observable inputs such as recently executed transaction prices in securities of the issuer or comparable issuers and yield curves. Adjustments are made to the valuations when necessary to recognise differences in the instrument’s terms. To the extent that the significant inputs are observable, the Group categorises these investments as Level 2.
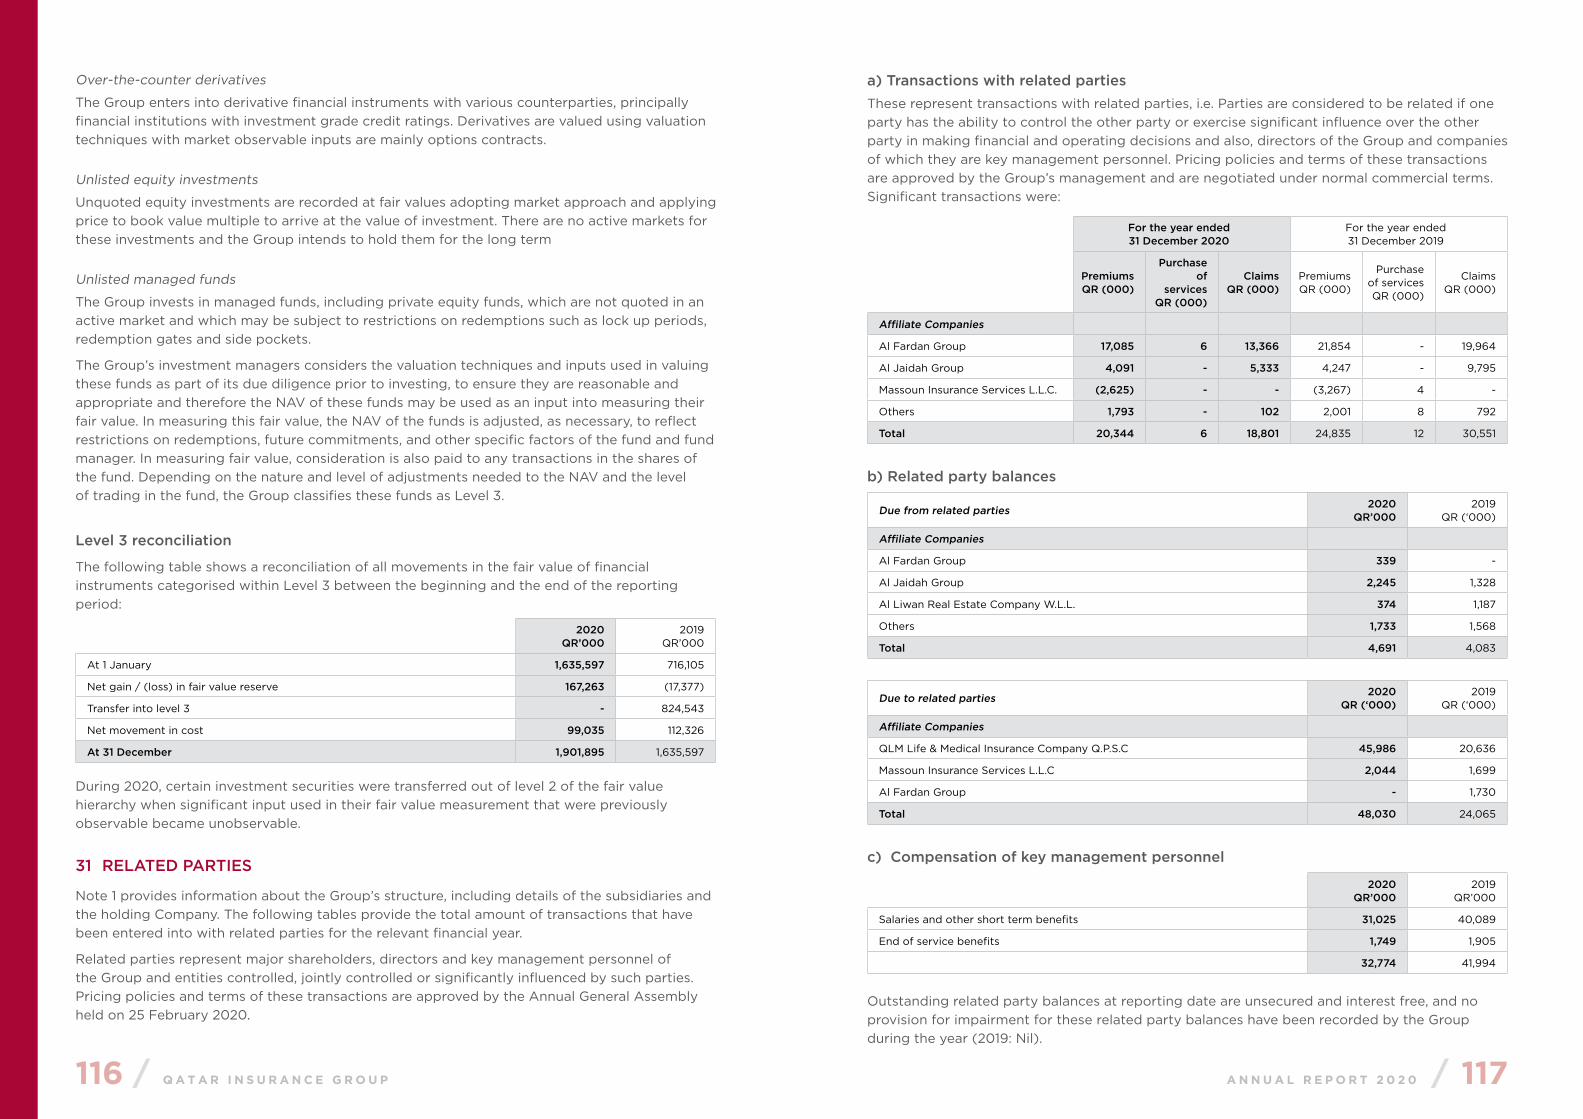
116 / Q A T A R I N S U R A N C E G R O U P A N N U A L R E P O R T 2 0 2 0 / 117
Over-the-counter derivatives
The Group enters into derivative financial instruments with various counterparties, principally financial institutions with investment grade credit ratings. Derivatives are valued using valuation techniques with market observable inputs are mainly options contracts.
Unlisted equity investments
Unquoted equity investments are recorded at fair values adopting market approach and applying price to book value multiple to arrive at the value of investment. There are no active markets for these investments and the Group intends to hold them for the long term
Unlisted managed funds
The Group invests in managed funds, including private equity funds, which are not quoted in an active market and which may be subject to restrictions on redemptions such as lock up periods, redemption gates and side pockets.
The Group’s investment managers considers the valuation techniques and inputs used in valuing these funds as part of its due diligence prior to investing, to ensure they are reasonable and appropriate and therefore the NAV of these funds may be used as an input into measuring their fair value. In measuring this fair value, the NAV of the funds is adjusted, as necessary, to reflect restrictions on redemptions, future commitments, and other specific factors of the fund and fund manager. In measuring fair value, consideration is also paid to any transactions in the shares of the fund. Depending on the nature and level of adjustments needed to the NAV and the level of trading in the fund, the Group classifies these funds as Level 3.
Level 3 reconciliation
The following table shows a reconciliation of all movements in the fair value of financial instruments categorised within Level 3 between the beginning and the end of the reporting period:
2020QR’000
2019QR’000
At 1 January 1,635,597 716,105
Net gain / (loss) in fair value reserve 167,263 (17,377)
Transfer into level 3 - 824,543
Net movement in cost 99,035 112,326
At 31 December 1,901,895 1,635,597
During 2020, certain investment securities were transferred out of level 2 of the fair value hierarchy when significant input used in their fair value measurement that were previously observable became unobservable.
31 RELATED PARTIES
Note 1 provides information about the Group’s structure, including details of the subsidiaries and the holding Company. The following tables provide the total amount of transactions that have been entered into with related parties for the relevant financial year.
Related parties represent major shareholders, directors and key management personnel of the Group and entities controlled, jointly controlled or significantly influenced by such parties. Pricing policies and terms of these transactions are approved by the Annual General Assembly held on 25 February 2020.
a) Transactions with related partiesThese represent transactions with related parties, i.e. Parties are considered to be related if one party has the ability to control the other party or exercise significant influence over the other party in making financial and operating decisions and also, directors of the Group and companies of which they are key management personnel. Pricing policies and terms of these transactions are approved by the Group’s management and are negotiated under normal commercial terms. Significant transactions were:
For the year ended 31 December 2020
For the year ended 31 December 2019
PremiumsQR (000)
Purchase of
servicesQR (000)
ClaimsQR (000)
PremiumsQR (000)
Purchase of servicesQR (000)
ClaimsQR (000)
Affiliate Companies
Al Fardan Group 17,085 6 13,366 21,854 - 19,964
Al Jaidah Group 4,091 - 5,333 4,247 - 9,795
Massoun Insurance Services L.L.C. (2,625) - - (3,267) 4 -
Others 1,793 - 102 2,001 8 792
Total 20,344 6 18,801 24,835 12 30,551
b) Related party balances
Due from related parties 2020QR’000
2019QR (‘000)
Affiliate Companies
Al Fardan Group 339 -
Al Jaidah Group 2,245 1,328
Al Liwan Real Estate Company W.L.L. 374 1,187
Others 1,733 1,568
Total 4,691 4,083
Due to related parties 2020QR (‘000)
2019QR (‘000)
Affiliate Companies
QLM Life & Medical Insurance Company Q.P.S.C 45,986 20,636
Massoun Insurance Services L.L.C 2,044 1,699
Al Fardan Group - 1,730
Total 48,030 24,065
c) Compensation of key management personnel
2020QR’000
2019QR’000
Salaries and other short term benefits 31,025 40,089
End of service benefits 1,749 1,905
32,774 41,994
Outstanding related party balances at reporting date are unsecured and interest free, and no provision for impairment for these related party balances have been recorded by the Group during the year (2019: Nil).
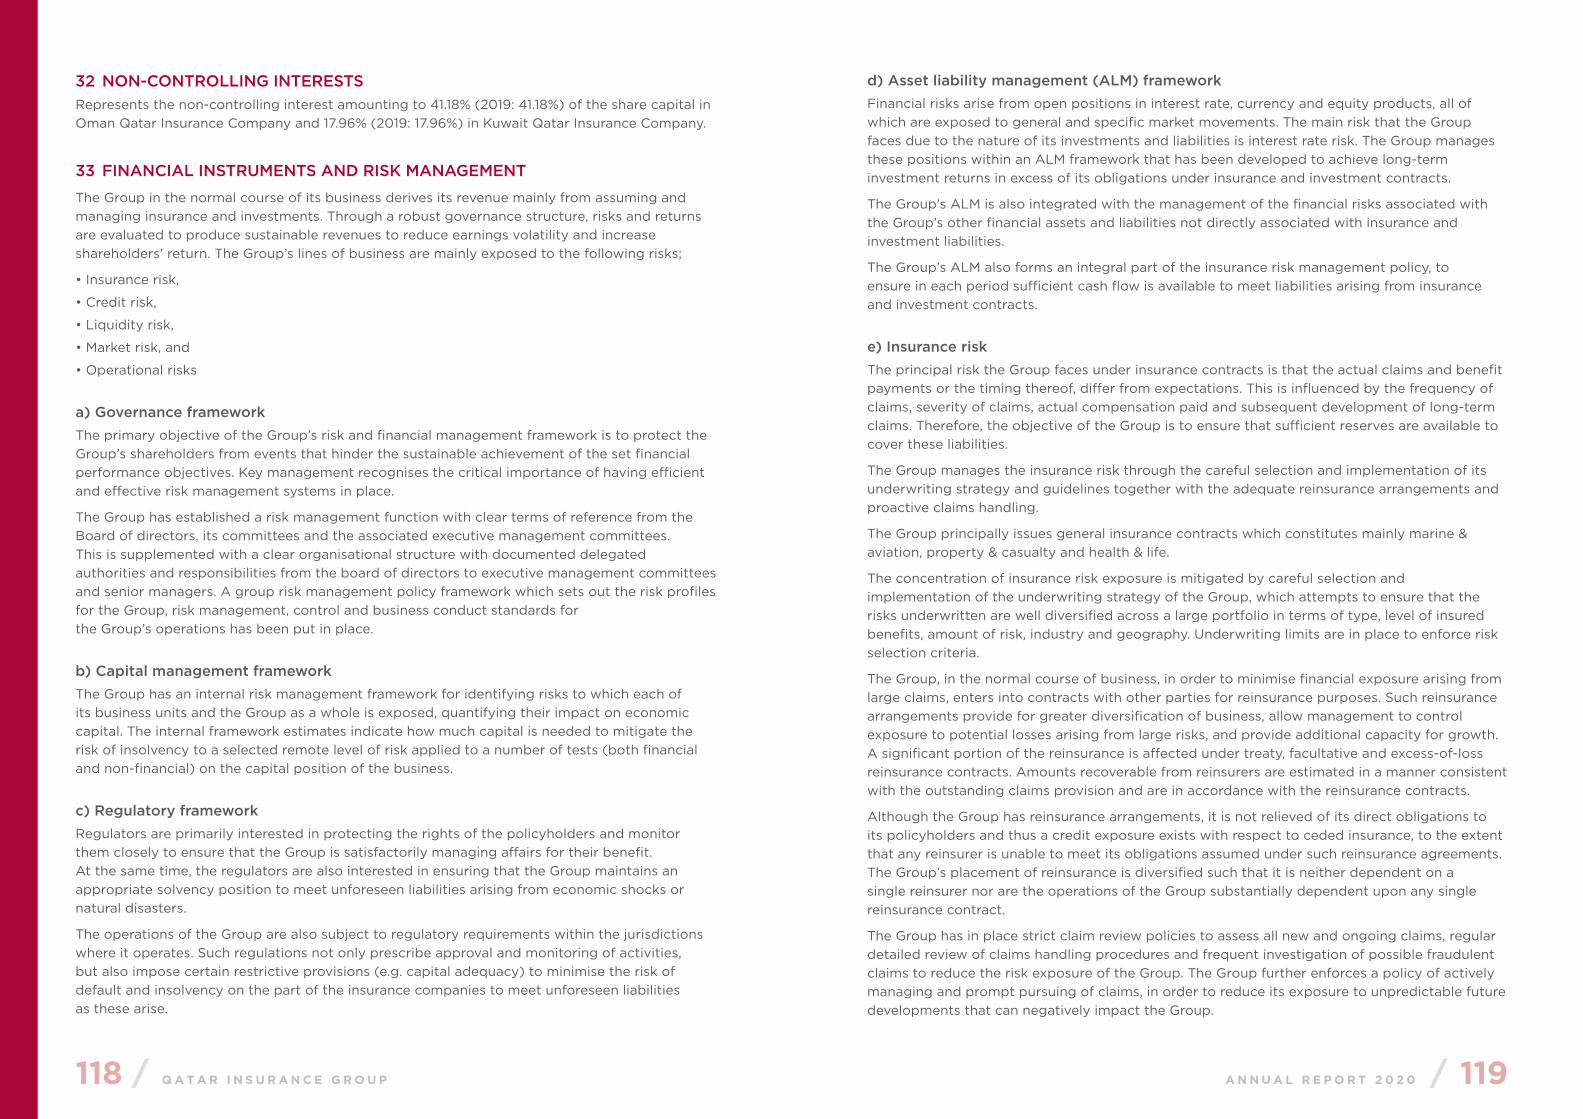
118 / Q A T A R I N S U R A N C E G R O U P A N N U A L R E P O R T 2 0 2 0 / 119
32 NON-CONTROLLING INTERESTSRepresents the non-controlling interest amounting to 41.18% (2019: 41.18%) of the share capital in Oman Qatar Insurance Company and 17.96% (2019: 17.96%) in Kuwait Qatar Insurance Company.
33 FINANCIAL INSTRUMENTS AND RISK MANAGEMENT
The Group in the normal course of its business derives its revenue mainly from assuming and managing insurance and investments. Through a robust governance structure, risks and returns are evaluated to produce sustainable revenues to reduce earnings volatility and increase shareholders’ return. The Group’s lines of business are mainly exposed to the following risks;
• Insurance risk,
• Credit risk,
• Liquidity risk,
• Market risk, and
• Operational risks
a) Governance frameworkThe primary objective of the Group’s risk and financial management framework is to protect the Group’s shareholders from events that hinder the sustainable achievement of the set financial performance objectives. Key management recognises the critical importance of having efficient and effective risk management systems in place.
The Group has established a risk management function with clear terms of reference from the Board of directors, its committees and the associated executive management committees. This is supplemented with a clear organisational structure with documented delegated authorities and responsibilities from the board of directors to executive management committees and senior managers. A group risk management policy framework which sets out the risk profiles for the Group, risk management, control and business conduct standards for the Group’s operations has been put in place.
b) Capital management frameworkThe Group has an internal risk management framework for identifying risks to which each of its business units and the Group as a whole is exposed, quantifying their impact on economic capital. The internal framework estimates indicate how much capital is needed to mitigate the risk of insolvency to a selected remote level of risk applied to a number of tests (both financial and non-financial) on the capital position of the business.
c) Regulatory frameworkRegulators are primarily interested in protecting the rights of the policyholders and monitor them closely to ensure that the Group is satisfactorily managing affairs for their benefit. At the same time, the regulators are also interested in ensuring that the Group maintains an appropriate solvency position to meet unforeseen liabilities arising from economic shocks or natural disasters.
The operations of the Group are also subject to regulatory requirements within the jurisdictions where it operates. Such regulations not only prescribe approval and monitoring of activities, but also impose certain restrictive provisions (e.g. capital adequacy) to minimise the risk of default and insolvency on the part of the insurance companies to meet unforeseen liabilities as these arise.
d) Asset liability management (ALM) frameworkFinancial risks arise from open positions in interest rate, currency and equity products, all of which are exposed to general and specific market movements. The main risk that the Group faces due to the nature of its investments and liabilities is interest rate risk. The Group manages these positions within an ALM framework that has been developed to achieve long-term investment returns in excess of its obligations under insurance and investment contracts.
The Group’s ALM is also integrated with the management of the financial risks associated with the Group’s other financial assets and liabilities not directly associated with insurance and investment liabilities.
The Group’s ALM also forms an integral part of the insurance risk management policy, to ensure in each period sufficient cash flow is available to meet liabilities arising from insurance and investment contracts.
e) Insurance risk The principal risk the Group faces under insurance contracts is that the actual claims and benefit payments or the timing thereof, differ from expectations. This is influenced by the frequency of claims, severity of claims, actual compensation paid and subsequent development of long-term claims. Therefore, the objective of the Group is to ensure that sufficient reserves are available to cover these liabilities.
The Group manages the insurance risk through the careful selection and implementation of its underwriting strategy and guidelines together with the adequate reinsurance arrangements and proactive claims handling.
The Group principally issues general insurance contracts which constitutes mainly marine & aviation, property & casualty and health & life.
The concentration of insurance risk exposure is mitigated by careful selection and implementation of the underwriting strategy of the Group, which attempts to ensure that the risks underwritten are well diversified across a large portfolio in terms of type, level of insured benefits, amount of risk, industry and geography. Underwriting limits are in place to enforce risk selection criteria.
The Group, in the normal course of business, in order to minimise financial exposure arising from large claims, enters into contracts with other parties for reinsurance purposes. Such reinsurance arrangements provide for greater diversification of business, allow management to control exposure to potential losses arising from large risks, and provide additional capacity for growth. A significant portion of the reinsurance is affected under treaty, facultative and excess-of-loss reinsurance contracts. Amounts recoverable from reinsurers are estimated in a manner consistent with the outstanding claims provision and are in accordance with the reinsurance contracts.
Although the Group has reinsurance arrangements, it is not relieved of its direct obligations to its policyholders and thus a credit exposure exists with respect to ceded insurance, to the extent that any reinsurer is unable to meet its obligations assumed under such reinsurance agreements. The Group’s placement of reinsurance is diversified such that it is neither dependent on a single reinsurer nor are the operations of the Group substantially dependent upon any single reinsurance contract.
The Group has in place strict claim review policies to assess all new and ongoing claims, regular detailed review of claims handling procedures and frequent investigation of possible fraudulent claims to reduce the risk exposure of the Group. The Group further enforces a policy of actively managing and prompt pursuing of claims, in order to reduce its exposure to unpredictable future developments that can negatively impact the Group.
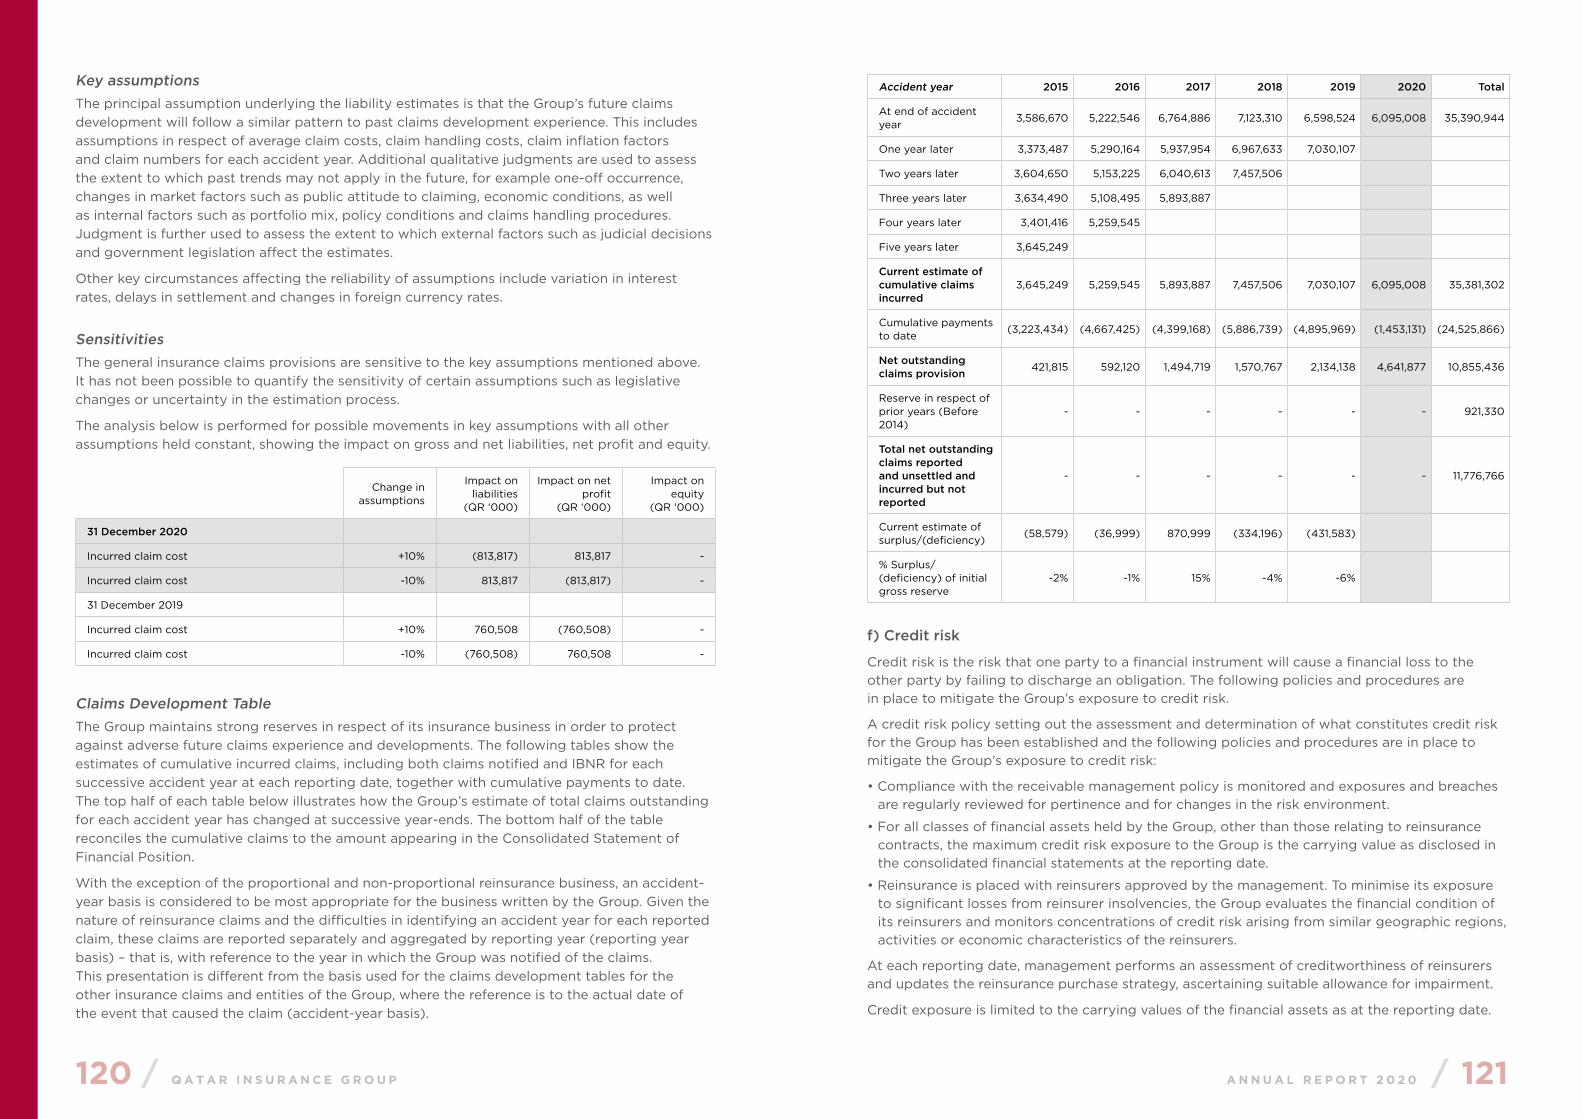
120 / Q A T A R I N S U R A N C E G R O U P A N N U A L R E P O R T 2 0 2 0 / 121
Key assumptionsThe principal assumption underlying the liability estimates is that the Group’s future claims development will follow a similar pattern to past claims development experience. This includes assumptions in respect of average claim costs, claim handling costs, claim inflation factors and claim numbers for each accident year. Additional qualitative judgments are used to assess the extent to which past trends may not apply in the future, for example one-off occurrence, changes in market factors such as public attitude to claiming, economic conditions, as well as internal factors such as portfolio mix, policy conditions and claims handling procedures. Judgment is further used to assess the extent to which external factors such as judicial decisions and government legislation affect the estimates.
Other key circumstances affecting the reliability of assumptions include variation in interest rates, delays in settlement and changes in foreign currency rates.
SensitivitiesThe general insurance claims provisions are sensitive to the key assumptions mentioned above. It has not been possible to quantify the sensitivity of certain assumptions such as legislative changes or uncertainty in the estimation process.
The analysis below is performed for possible movements in key assumptions with all other assumptions held constant, showing the impact on gross and net liabilities, net profit and equity.
Change in assumptions
Impact on liabilities
(QR ‘000)
Impact on net profit
(QR ‘000)
Impact on equity
(QR ‘000)
31 December 2020
Incurred claim cost +10% (813,817) 813,817 -
Incurred claim cost -10% 813,817 (813,817) -
31 December 2019
Incurred claim cost +10% 760,508 (760,508) -
Incurred claim cost -10% (760,508) 760,508 -
Claims Development TableThe Group maintains strong reserves in respect of its insurance business in order to protect against adverse future claims experience and developments. The following tables show the estimates of cumulative incurred claims, including both claims notified and IBNR for each successive accident year at each reporting date, together with cumulative payments to date. The top half of each table below illustrates how the Group’s estimate of total claims outstanding for each accident year has changed at successive year-ends. The bottom half of the table reconciles the cumulative claims to the amount appearing in the Consolidated Statement of Financial Position.
With the exception of the proportional and non-proportional reinsurance business, an accident-year basis is considered to be most appropriate for the business written by the Group. Given the nature of reinsurance claims and the difficulties in identifying an accident year for each reported claim, these claims are reported separately and aggregated by reporting year (reporting year basis) – that is, with reference to the year in which the Group was notified of the claims. This presentation is different from the basis used for the claims development tables for the other insurance claims and entities of the Group, where the reference is to the actual date of the event that caused the claim (accident-year basis).
Accident year 2015 2016 2017 2018 2019 2020 Total
At end of accident year
3,586,670 5,222,546 6,764,886 7,123,310 6,598,524 6,095,008 35,390,944
One year later 3,373,487 5,290,164 5,937,954 6,967,633 7,030,107
Two years later 3,604,650 5,153,225 6,040,613 7,457,506
Three years later 3,634,490 5,108,495 5,893,887
Four years later 3,401,416 5,259,545
Five years later 3,645,249
Current estimate of cumulative claims incurred
3,645,249 5,259,545 5,893,887 7,457,506 7,030,107 6,095,008 35,381,302
Cumulative payments to date
(3,223,434) (4,667,425) (4,399,168) (5,886,739) (4,895,969) (1,453,131) (24,525,866)
Net outstanding claims provision 421,815 592,120 1,494,719 1,570,767 2,134,138 4,641,877 10,855,436
Reserve in respect of prior years (Before 2014)
- - - - - - 921,330
Total net outstanding claims reported and unsettled and incurred but not reported
- - - - - - 11,776,766
Current estimate of surplus/(deficiency)
(58,579) (36,999) 870,999 (334,196) (431,583)
% Surplus/ (deficiency) of initial gross reserve
-2% -1% 15% -4% -6%
f) Credit risk
Credit risk is the risk that one party to a financial instrument will cause a financial loss to the other party by failing to discharge an obligation. The following policies and procedures are in place to mitigate the Group’s exposure to credit risk.
A credit risk policy setting out the assessment and determination of what constitutes credit risk for the Group has been established and the following policies and procedures are in place to mitigate the Group’s exposure to credit risk:
• Compliance with the receivable management policy is monitored and exposures and breaches are regularly reviewed for pertinence and for changes in the risk environment.
• For all classes of financial assets held by the Group, other than those relating to reinsurance contracts, the maximum credit risk exposure to the Group is the carrying value as disclosed in the consolidated financial statements at the reporting date.
• Reinsurance is placed with reinsurers approved by the management. To minimise its exposure to significant losses from reinsurer insolvencies, the Group evaluates the financial condition of its reinsurers and monitors concentrations of credit risk arising from similar geographic regions, activities or economic characteristics of the reinsurers.
At each reporting date, management performs an assessment of creditworthiness of reinsurers and updates the reinsurance purchase strategy, ascertaining suitable allowance for impairment.
Credit exposure is limited to the carrying values of the financial assets as at the reporting date.

122 / Q A T A R I N S U R A N C E G R O U P A N N U A L R E P O R T 2 0 2 0 / 123
i) Maximum exposure to credit risk
The table below shows the maximum exposure to credit risk for the components of consolidated statement of financial position.
2020(QR ‘000)
2019(QR ‘000)
Derivative financial assets (Note 9) 57,748 9,010
Financial investments at fair value through profit or loss (FVTPL) 611,674 550,733
Financial investments at fair value through other comprehensive income (FVOCI)
12,984,826 11,915,361
Insurance and other receivables (Note 6) 6,811,847 6,308,927
Reinsurance contract assets (Note 7) 5,682,384 4,116,515
Short-term deposits (Note 5) 6,931,809 6,686,743
33,080,288 29,587,289
ii) Credit quality
Neither past due nor
impaired(QR ‘000)
Past due but not impaired
(QR ‘000)
Past due and
impaired(QR ‘000)
Total(QR ‘000)
31 December 2020
Derivative financial assets 57,748 - - 57,748
Financial investments at fair value through profit or loss (FVTPL) – Debt securities
611,674 - - 611,674
Financial investments at fair value through other comprehensive income (FVOCI) – Debt securities
12,010,513 974,313 - 12,984,826
Insurance and other receivables 5,670,036 1,049,595 92,216 6,811,847
Reinsurance contract assets 5,682,384 - - 5,682,384
Short-term deposits 6,931,809 - - 6,931,809
30,964,164 2,023,908 92,216 33,080,288
31 December 2019
Derivative financial assets 9,010 - - 9,010
Financial investments at fair value through profit or loss (FVTPL) – Debt securities
550,733 - - 550,733
Financial investments at fair value through other comprehensive income (FVOCI) – Debt securities
11,915,361 - - 11,915,361
Insurance and other receivables 5,213,415 1,008,355 87,157 6,308,927
Reinsurance contract assets 4,116,515 - - 4,116,515
Short-term deposits 6,686,743 - - 6,686,743
28,491,777 1,008,355 87,157 29,587,289
iii) Aging analysis of neither past due nor impaired and past due but not impaired
<30 days(QR ‘000)
31 to 60 days
(QR ‘000)
61 to 90 days
(QR ‘000)
91 to 120 days
(QR ‘000)
Above 121 days
(QR ‘000)
Total(QR ‘000)
31 December 2020
Insurance and other receivables 5,107,024 280,065 106,128 269,035 1,141,811 6,904,063
31 December 2019
Insurance and other receivables 4,155,499 384,179 488,234 272,659 1,095,512 6,396,083
iv) Impaired financial assets
At 31 December 2020, there are impaired reinsurance assets of QR 47,403 thousand (2019: QR 43,465 thousand), impaired receivables from policy holders of QR 44,813 thousand (2019: QR 43,691 thousand).
The Group records all impairment allowances in separate impairment allowances accounts. The movement in the allowances for impairment losses for the year are as follows:
Impairment on insurance and reinsurance receivables
2020(QR ‘000)
2019(QR ‘000)
At 1 January 87,156 75,188
Charged during the year 5,060 11,968
At 31 December 92,216 87,156
g) Liquidity riskLiquidity risk is the risk that the Group will encounter difficulty in meeting the obligations associated with its financial liabilities.
Liquidity requirements are monitored regularly on a daily/weekly/monthly basis and management ensures that sufficient funds are available to meet any commitments as they arise.
Maturity profiles
The table below summarises the maturity profile of the financial assets and financial liabilities of the Group based on remaining undiscounted contractual obligations, including interest payable and receivable. For insurance contracts liabilities and reinsurance assets, maturity profiles are determined based on estimated timing of net cash outflows from the recognised insurance liabilities. Unearned premiums and the reinsurers’ share of unearned premiums have been excluded from the analysis as they are not contractual obligations.
31 December 2020 Up to a year(QR ‘000)
1-5 years(QR ‘000)
Over 5 years
(QR ‘000)
Total(QR ‘000)
Financial assets
Derivative financial assets 57,748 - - 57,748
Non-derivative financial assets
Financial investments at fair value through profit or loss (FVTPL)
3,316,111 166,033 33,206 3,515,350
Financial investments at fair value through other comprehensive income (FVOCI)
2,298,325 5,507,462 5,179,039 12,984,826
Insurance receivables, net 6,756,660 - - 6,756,660
Reinsurance contract assets 5,682,384 - - 5,682,384
Cash and short-term deposits 8,103,018 109,093 - 8,212,111
26,214,246 5,782,588 5,212,245 37,209,079
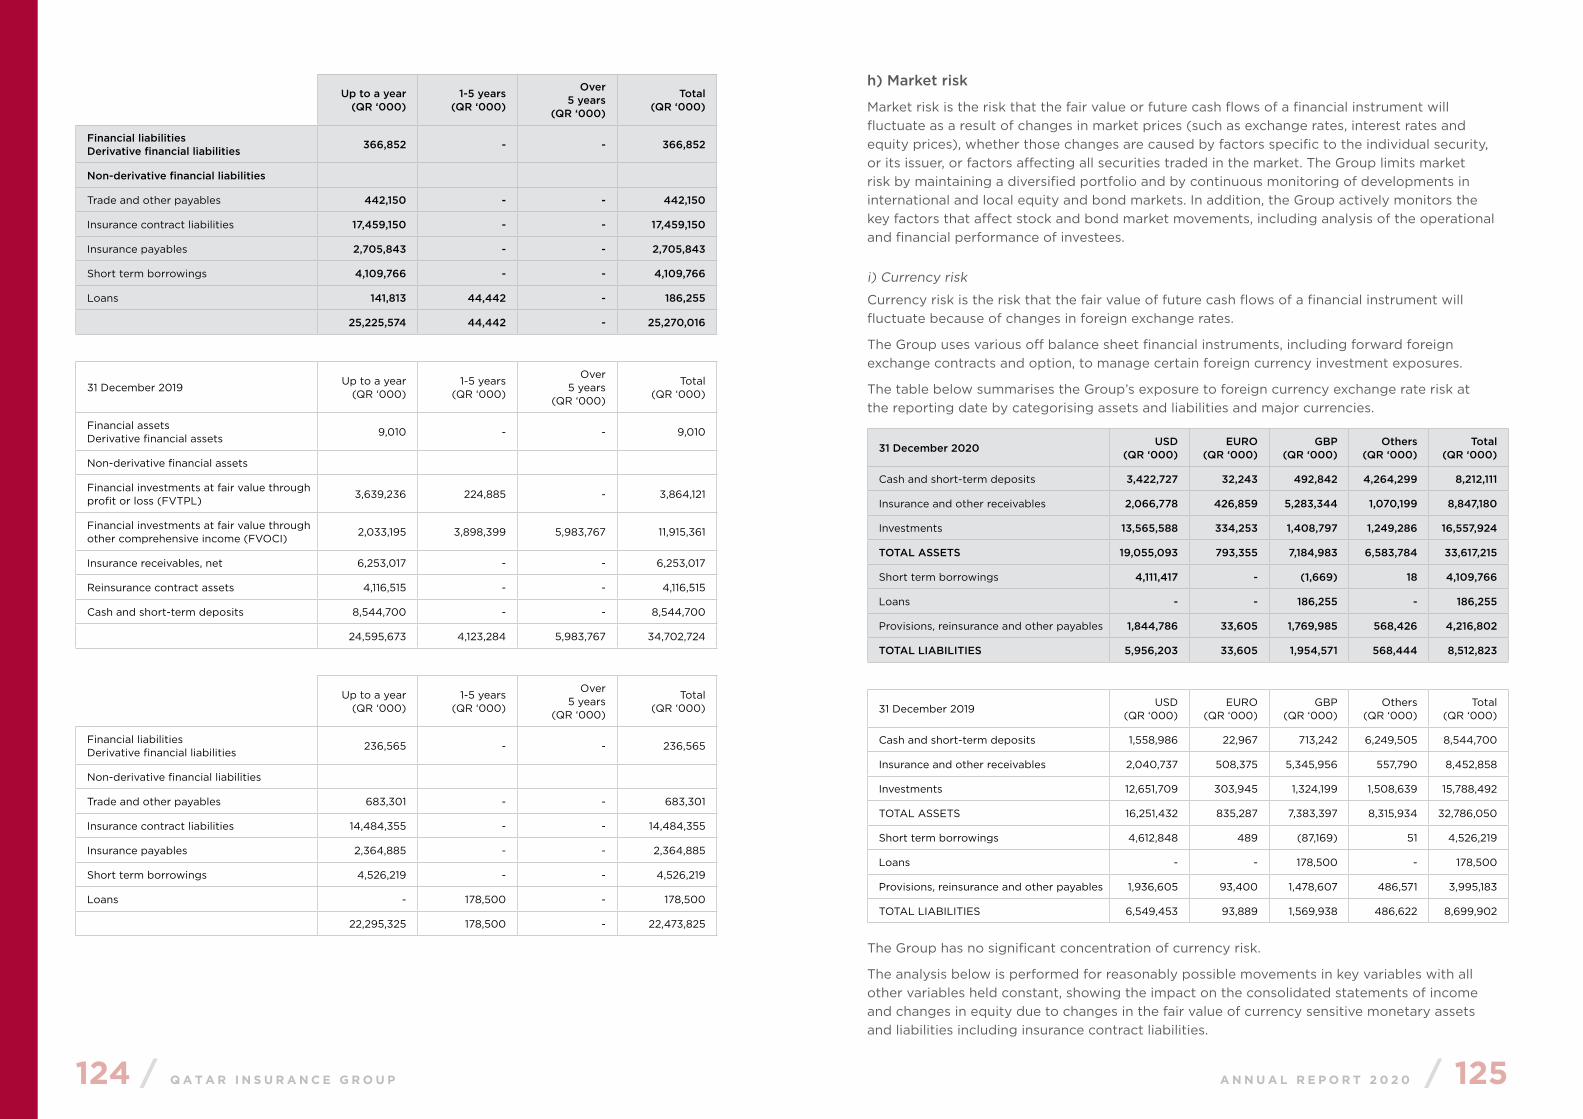
124 / Q A T A R I N S U R A N C E G R O U P A N N U A L R E P O R T 2 0 2 0 / 125
Up to a year(QR ‘000)
1-5 years(QR ‘000)
Over 5 years
(QR ‘000)
Total(QR ‘000)
Financial liabilities Derivative financial liabilities 366,852 - - 366,852
Non-derivative financial liabilities
Trade and other payables 442,150 - - 442,150
Insurance contract liabilities 17,459,150 - - 17,459,150
Insurance payables 2,705,843 - - 2,705,843
Short term borrowings 4,109,766 - - 4,109,766
Loans 141,813 44,442 - 186,255
25,225,574 44,442 - 25,270,016
31 December 2019Up to a year
(QR ‘000)1-5 years
(QR ‘000)
Over 5 years
(QR ‘000)
Total(QR ‘000)
Financial assetsDerivative financial assets
9,010 - - 9,010
Non-derivative financial assets
Financial investments at fair value through profit or loss (FVTPL)
3,639,236 224,885 - 3,864,121
Financial investments at fair value through other comprehensive income (FVOCI)
2,033,195 3,898,399 5,983,767 11,915,361
Insurance receivables, net 6,253,017 - - 6,253,017
Reinsurance contract assets 4,116,515 - - 4,116,515
Cash and short-term deposits 8,544,700 - - 8,544,700
24,595,673 4,123,284 5,983,767 34,702,724
Up to a year(QR ‘000)
1-5 years(QR ‘000)
Over 5 years
(QR ‘000)
Total(QR ‘000)
Financial liabilitiesDerivative financial liabilities
236,565 - - 236,565
Non-derivative financial liabilities
Trade and other payables 683,301 - - 683,301
Insurance contract liabilities 14,484,355 - - 14,484,355
Insurance payables 2,364,885 - - 2,364,885
Short term borrowings 4,526,219 - - 4,526,219
Loans - 178,500 - 178,500
22,295,325 178,500 - 22,473,825
h) Market risk
Market risk is the risk that the fair value or future cash flows of a financial instrument will fluctuate as a result of changes in market prices (such as exchange rates, interest rates and equity prices), whether those changes are caused by factors specific to the individual security, or its issuer, or factors affecting all securities traded in the market. The Group limits market risk by maintaining a diversified portfolio and by continuous monitoring of developments in international and local equity and bond markets. In addition, the Group actively monitors the key factors that affect stock and bond market movements, including analysis of the operational and financial performance of investees.
i) Currency risk
Currency risk is the risk that the fair value of future cash flows of a financial instrument will fluctuate because of changes in foreign exchange rates.
The Group uses various off balance sheet financial instruments, including forward foreign exchange contracts and option, to manage certain foreign currency investment exposures.
The table below summarises the Group’s exposure to foreign currency exchange rate risk at the reporting date by categorising assets and liabilities and major currencies.
31 December 2020 USD(QR ‘000)
EURO(QR ‘000)
GBP(QR ‘000)
Others(QR ‘000)
Total(QR ‘000)
Cash and short-term deposits 3,422,727 32,243 492,842 4,264,299 8,212,111
Insurance and other receivables 2,066,778 426,859 5,283,344 1,070,199 8,847,180
Investments 13,565,588 334,253 1,408,797 1,249,286 16,557,924
TOTAL ASSETS 19,055,093 793,355 7,184,983 6,583,784 33,617,215
Short term borrowings 4,111,417 - (1,669) 18 4,109,766
Loans - - 186,255 - 186,255
Provisions, reinsurance and other payables 1,844,786 33,605 1,769,985 568,426 4,216,802
TOTAL LIABILITIES 5,956,203 33,605 1,954,571 568,444 8,512,823
31 December 2019USD
(QR ‘000)EURO
(QR ‘000)GBP
(QR ‘000)Others
(QR ‘000)Total
(QR ‘000)
Cash and short-term deposits 1,558,986 22,967 713,242 6,249,505 8,544,700
Insurance and other receivables 2,040,737 508,375 5,345,956 557,790 8,452,858
Investments 12,651,709 303,945 1,324,199 1,508,639 15,788,492
TOTAL ASSETS 16,251,432 835,287 7,383,397 8,315,934 32,786,050
Short term borrowings 4,612,848 489 (87,169) 51 4,526,219
Loans - - 178,500 - 178,500
Provisions, reinsurance and other payables 1,936,605 93,400 1,478,607 486,571 3,995,183
TOTAL LIABILITIES 6,549,453 93,889 1,569,938 486,622 8,699,902
The Group has no significant concentration of currency risk.
The analysis below is performed for reasonably possible movements in key variables with all other variables held constant, showing the impact on the consolidated statements of income and changes in equity due to changes in the fair value of currency sensitive monetary assets and liabilities including insurance contract liabilities.
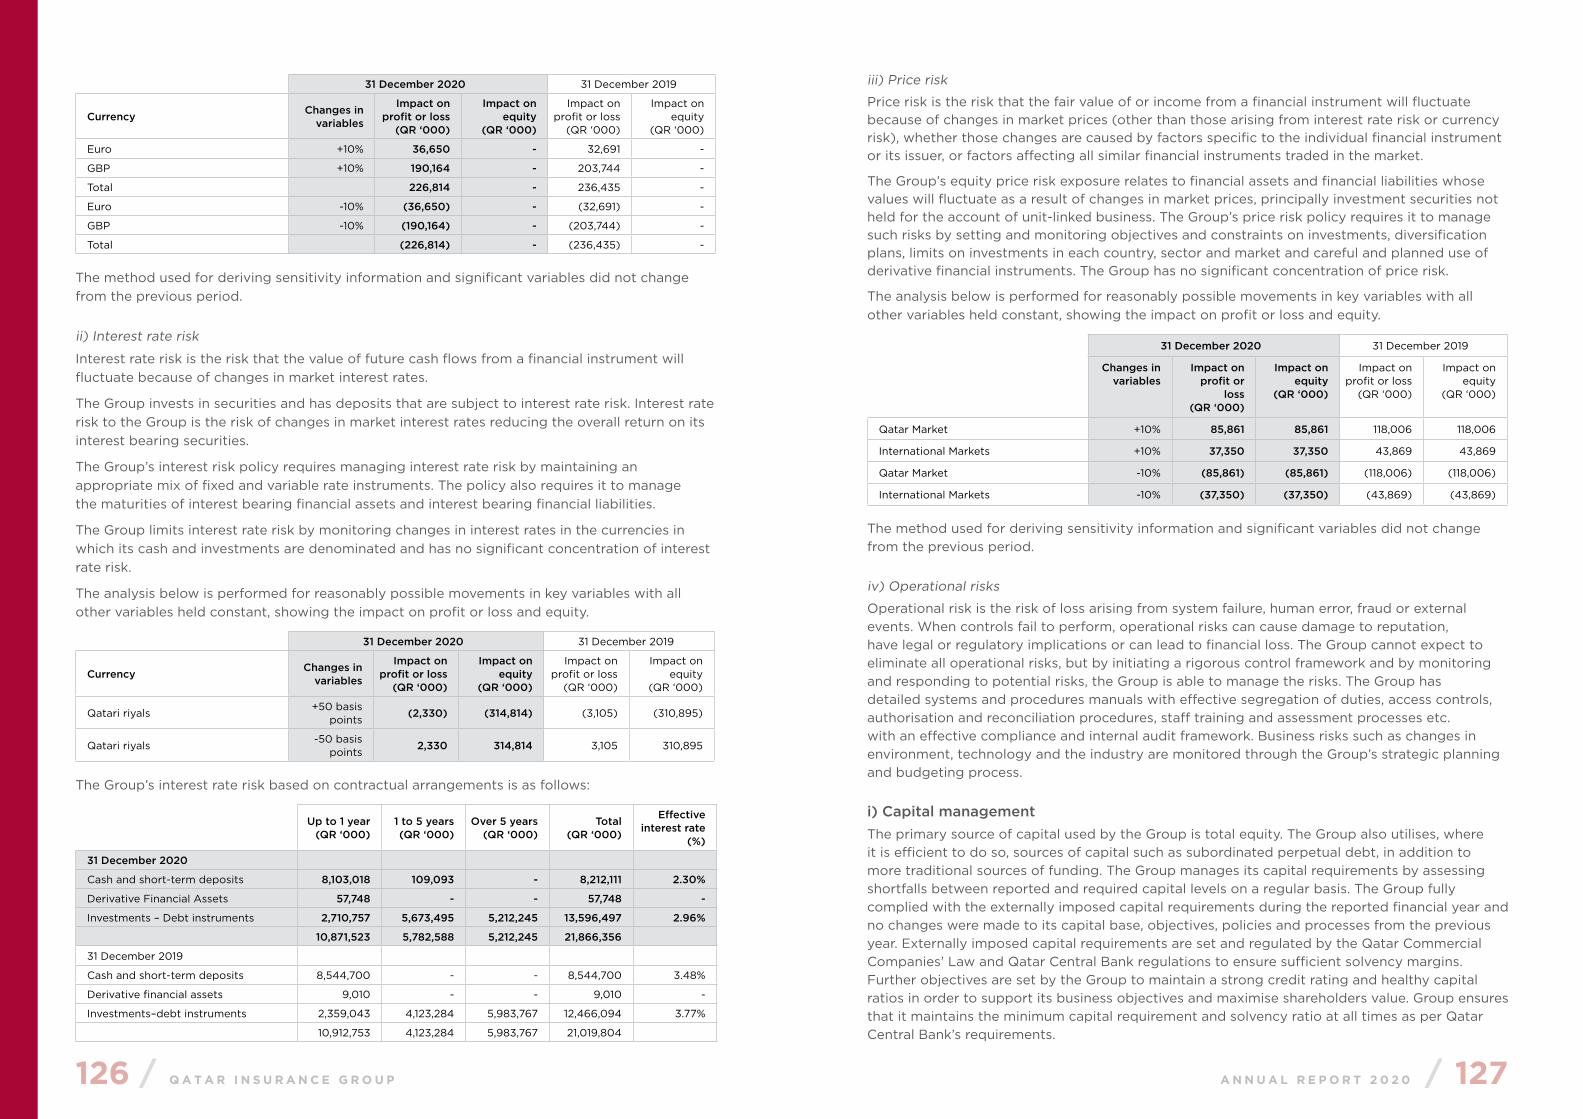
126 / Q A T A R I N S U R A N C E G R O U P A N N U A L R E P O R T 2 0 2 0 / 127
31 December 2020 31 December 2019
Currency Changes in variables
Impact on profit or loss
(QR ‘000)
Impact on equity
(QR ‘000)
Impact on profit or loss
(QR ‘000)
Impact on equity
(QR ‘000)
Euro +10% 36,650 - 32,691 -
GBP +10% 190,164 - 203,744 -
Total 226,814 - 236,435 -
Euro -10% (36,650) - (32,691) -
GBP -10% (190,164) - (203,744) -
Total (226,814) - (236,435) -
The method used for deriving sensitivity information and significant variables did not change from the previous period.
ii) Interest rate risk
Interest rate risk is the risk that the value of future cash flows from a financial instrument will fluctuate because of changes in market interest rates.
The Group invests in securities and has deposits that are subject to interest rate risk. Interest rate risk to the Group is the risk of changes in market interest rates reducing the overall return on its interest bearing securities.
The Group’s interest risk policy requires managing interest rate risk by maintaining an appropriate mix of fixed and variable rate instruments. The policy also requires it to manage the maturities of interest bearing financial assets and interest bearing financial liabilities.
The Group limits interest rate risk by monitoring changes in interest rates in the currencies in which its cash and investments are denominated and has no significant concentration of interest rate risk.
The analysis below is performed for reasonably possible movements in key variables with all other variables held constant, showing the impact on profit or loss and equity.
31 December 2020 31 December 2019
Currency Changes in variables
Impact on profit or loss
(QR ‘000)
Impact on equity
(QR ‘000)
Impact on profit or loss
(QR ‘000)
Impact on equity
(QR ‘000)
Qatari riyals+50 basis
points(2,330) (314,814) (3,105) (310,895)
Qatari riyals-50 basis
points2,330 314,814 3,105 310,895
The Group’s interest rate risk based on contractual arrangements is as follows:
Up to 1 year(QR ‘000)
1 to 5 years(QR ‘000)
Over 5 years(QR ‘000)
Total(QR ‘000)
Effective interest rate
(%)
31 December 2020
Cash and short-term deposits 8,103,018 109,093 - 8,212,111 2.30%
Derivative Financial Assets 57,748 - - 57,748 -
Investments – Debt instruments 2,710,757 5,673,495 5,212,245 13,596,497 2.96%
10,871,523 5,782,588 5,212,245 21,866,356
31 December 2019
Cash and short-term deposits 8,544,700 - - 8,544,700 3.48%
Derivative financial assets 9,010 - - 9,010 -
Investments–debt instruments 2,359,043 4,123,284 5,983,767 12,466,094 3.77%
10,912,753 4,123,284 5,983,767 21,019,804
iii) Price risk
Price risk is the risk that the fair value of or income from a financial instrument will fluctuate because of changes in market prices (other than those arising from interest rate risk or currency risk), whether those changes are caused by factors specific to the individual financial instrument or its issuer, or factors affecting all similar financial instruments traded in the market.
The Group’s equity price risk exposure relates to financial assets and financial liabilities whose values will fluctuate as a result of changes in market prices, principally investment securities not held for the account of unit-linked business. The Group’s price risk policy requires it to manage such risks by setting and monitoring objectives and constraints on investments, diversification plans, limits on investments in each country, sector and market and careful and planned use of derivative financial instruments. The Group has no significant concentration of price risk.
The analysis below is performed for reasonably possible movements in key variables with all other variables held constant, showing the impact on profit or loss and equity.
31 December 2020 31 December 2019
Changes in variables
Impact on profit or
loss(QR ‘000)
Impact on equity
(QR ‘000)
Impact on profit or loss
(QR ‘000)
Impact on equity
(QR ‘000)
Qatar Market +10% 85,861 85,861 118,006 118,006
International Markets +10% 37,350 37,350 43,869 43,869
Qatar Market -10% (85,861) (85,861) (118,006) (118,006)
International Markets -10% (37,350) (37,350) (43,869) (43,869)
The method used for deriving sensitivity information and significant variables did not change from the previous period.
iv) Operational risks
Operational risk is the risk of loss arising from system failure, human error, fraud or external events. When controls fail to perform, operational risks can cause damage to reputation, have legal or regulatory implications or can lead to financial loss. The Group cannot expect to eliminate all operational risks, but by initiating a rigorous control framework and by monitoring and responding to potential risks, the Group is able to manage the risks. The Group has detailed systems and procedures manuals with effective segregation of duties, access controls, authorisation and reconciliation procedures, staff training and assessment processes etc. with an effective compliance and internal audit framework. Business risks such as changes in environment, technology and the industry are monitored through the Group’s strategic planning and budgeting process.
i) Capital managementThe primary source of capital used by the Group is total equity. The Group also utilises, where it is efficient to do so, sources of capital such as subordinated perpetual debt, in addition to more traditional sources of funding. The Group manages its capital requirements by assessing shortfalls between reported and required capital levels on a regular basis. The Group fully complied with the externally imposed capital requirements during the reported financial year and no changes were made to its capital base, objectives, policies and processes from the previous year. Externally imposed capital requirements are set and regulated by the Qatar Commercial Companies’ Law and Qatar Central Bank regulations to ensure sufficient solvency margins. Further objectives are set by the Group to maintain a strong credit rating and healthy capital ratios in order to support its business objectives and maximise shareholders value. Group ensures that it maintains the minimum capital requirement and solvency ratio at all times as per Qatar Central Bank’s requirements.
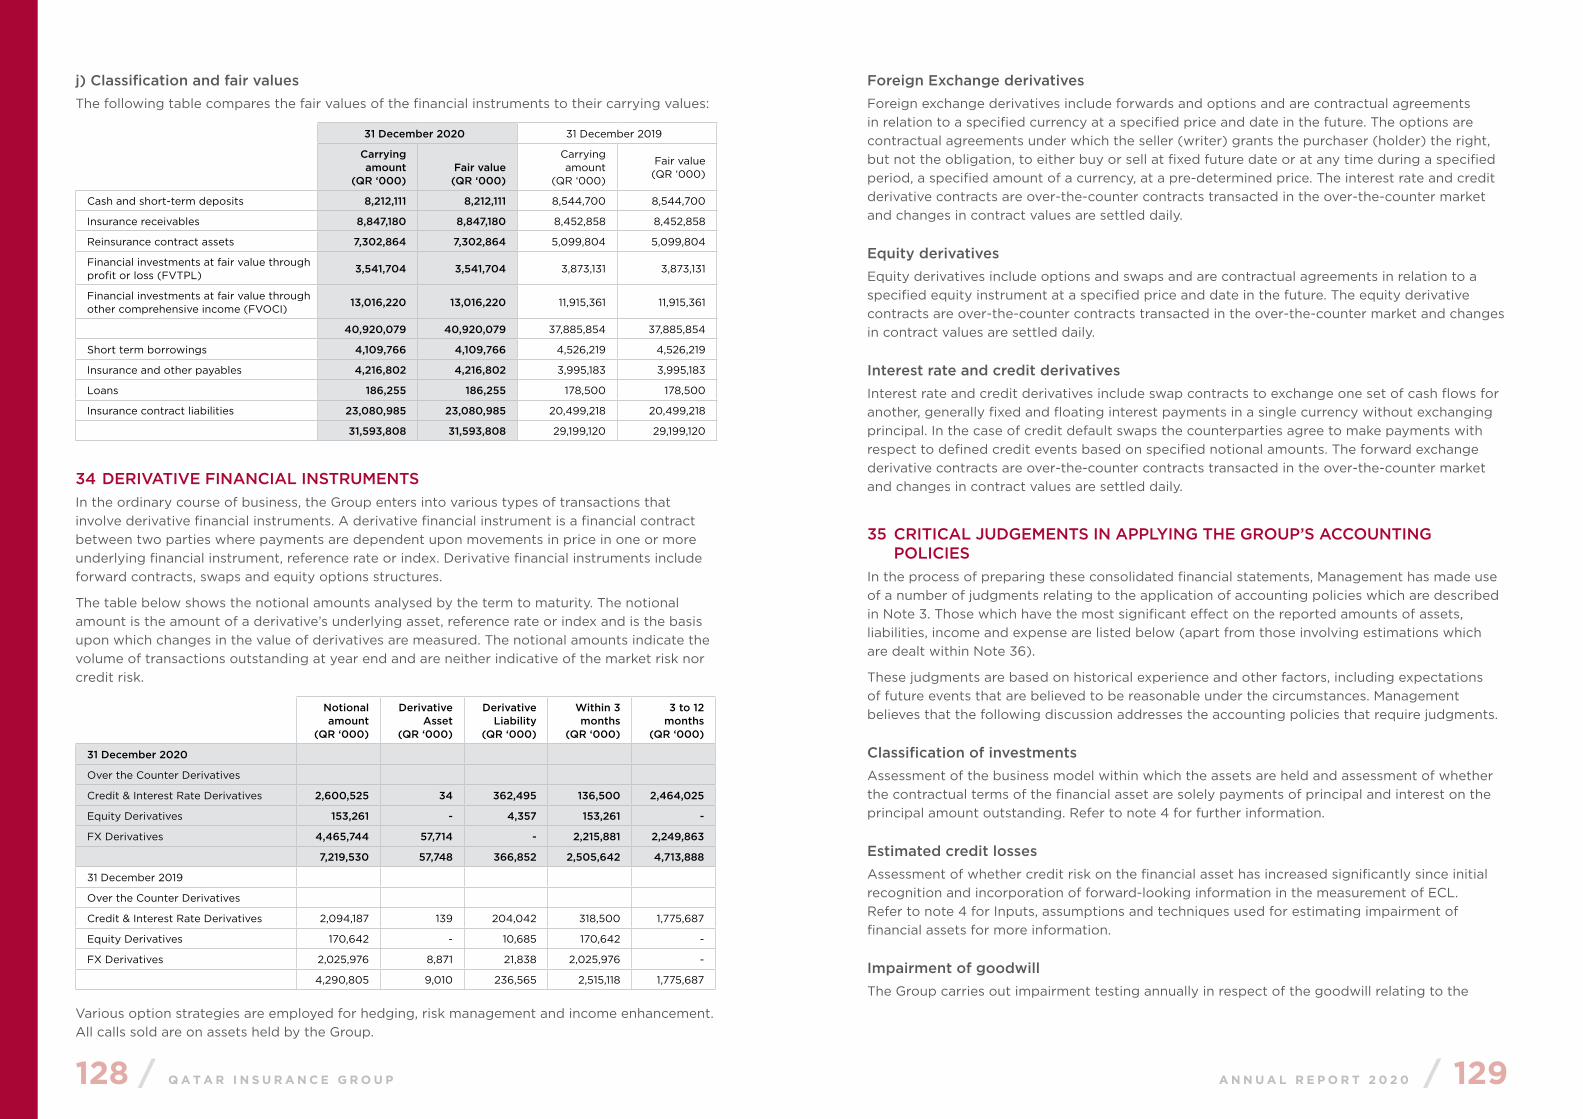
128 / Q A T A R I N S U R A N C E G R O U P A N N U A L R E P O R T 2 0 2 0 / 129
j) Classification and fair values The following table compares the fair values of the financial instruments to their carrying values:
31 December 2020 31 December 2019
Carrying amount
(QR ‘000)Fair value(QR ‘000)
Carrying amount
(QR ‘000)
Fair value(QR ‘000)
Cash and short-term deposits 8,212,111 8,212,111 8,544,700 8,544,700
Insurance receivables 8,847,180 8,847,180 8,452,858 8,452,858
Reinsurance contract assets 7,302,864 7,302,864 5,099,804 5,099,804
Financial investments at fair value through profit or loss (FVTPL)
3,541,704 3,541,704 3,873,131 3,873,131
Financial investments at fair value through other comprehensive income (FVOCI)
13,016,220 13,016,220 11,915,361 11,915,361
40,920,079 40,920,079 37,885,854 37,885,854
Short term borrowings 4,109,766 4,109,766 4,526,219 4,526,219
Insurance and other payables 4,216,802 4,216,802 3,995,183 3,995,183
Loans 186,255 186,255 178,500 178,500
Insurance contract liabilities 23,080,985 23,080,985 20,499,218 20,499,218
31,593,808 31,593,808 29,199,120 29,199,120
34 DERIVATIVE FINANCIAL INSTRUMENTSIn the ordinary course of business, the Group enters into various types of transactions that involve derivative financial instruments. A derivative financial instrument is a financial contract between two parties where payments are dependent upon movements in price in one or more underlying financial instrument, reference rate or index. Derivative financial instruments include forward contracts, swaps and equity options structures.
The table below shows the notional amounts analysed by the term to maturity. The notional amount is the amount of a derivative’s underlying asset, reference rate or index and is the basis upon which changes in the value of derivatives are measured. The notional amounts indicate the volume of transactions outstanding at year end and are neither indicative of the market risk nor credit risk.
Notional amount
(QR ‘000)
Derivative Asset
(QR ‘000)
Derivative Liability
(QR ‘000)
Within 3 months
(QR ‘000)
3 to 12 months
(QR ‘000)
31 December 2020
Over the Counter Derivatives
Credit & Interest Rate Derivatives 2,600,525 34 362,495 136,500 2,464,025
Equity Derivatives 153,261 - 4,357 153,261 -
FX Derivatives 4,465,744 57,714 - 2,215,881 2,249,863
7,219,530 57,748 366,852 2,505,642 4,713,888
31 December 2019
Over the Counter Derivatives
Credit & Interest Rate Derivatives 2,094,187 139 204,042 318,500 1,775,687
Equity Derivatives 170,642 - 10,685 170,642 -
FX Derivatives 2,025,976 8,871 21,838 2,025,976 -
4,290,805 9,010 236,565 2,515,118 1,775,687
Various option strategies are employed for hedging, risk management and income enhancement. All calls sold are on assets held by the Group.
Foreign Exchange derivativesForeign exchange derivatives include forwards and options and are contractual agreements in relation to a specified currency at a specified price and date in the future. The options are contractual agreements under which the seller (writer) grants the purchaser (holder) the right, but not the obligation, to either buy or sell at fixed future date or at any time during a specified period, a specified amount of a currency, at a pre-determined price. The interest rate and credit derivative contracts are over-the-counter contracts transacted in the over-the-counter market and changes in contract values are settled daily.
Equity derivativesEquity derivatives include options and swaps and are contractual agreements in relation to a specified equity instrument at a specified price and date in the future. The equity derivative contracts are over-the-counter contracts transacted in the over-the-counter market and changes in contract values are settled daily.
Interest rate and credit derivativesInterest rate and credit derivatives include swap contracts to exchange one set of cash flows for another, generally fixed and floating interest payments in a single currency without exchanging principal. In the case of credit default swaps the counterparties agree to make payments with respect to defined credit events based on specified notional amounts. The forward exchange derivative contracts are over-the-counter contracts transacted in the over-the-counter market and changes in contract values are settled daily.
35 CRITICAL JUDGEMENTS IN APPLYING THE GROUP’S ACCOUNTING POLICIESIn the process of preparing these consolidated financial statements, Management has made use of a number of judgments relating to the application of accounting policies which are described in Note 3. Those which have the most significant effect on the reported amounts of assets, liabilities, income and expense are listed below (apart from those involving estimations which are dealt within Note 36).
These judgments are based on historical experience and other factors, including expectations of future events that are believed to be reasonable under the circumstances. Management believes that the following discussion addresses the accounting policies that require judgments.
Classification of investments Assessment of the business model within which the assets are held and assessment of whether the contractual terms of the financial asset are solely payments of principal and interest on the principal amount outstanding. Refer to note 4 for further information.
Estimated credit lossesAssessment of whether credit risk on the financial asset has increased significantly since initial recognition and incorporation of forward-looking information in the measurement of ECL. Refer to note 4 for Inputs, assumptions and techniques used for estimating impairment of financial assets for more information.
Impairment of goodwillThe Group carries out impairment testing annually in respect of the goodwill relating to the
130 / Q A T A R I N S U R A N C E G R O U P A N N U A L R E P O R T 2 0 2 0 / 131
acquired subsidiaries. In carrying out the impairment analysis, the Group makes the following estimates which are critical:
The WV valuation was used a 3-year projection based on the residual life of the WV run off contract. Antares’ return on capacity for 2019 was 6.6%. Antares’ market value was estimated using the price to tangible book value. Price to tangible book value was estimated to be 1.69 Equity beta was used to compute Antares’ cost of equity for the WV valuation. The discount rate is was estimated to be 9.77%.
The Management performs sensitivity analysis on the above and key assumptions in ascertaining its impact on the recoverable amount and impairment to the carrying value of goodwill in the consolidated financial statements. Material changes in the above assumptions may impact the recoverable amounts and may lead to an impairment to goodwill.
36 KEY SOURCES OF ESTIMATES UNCERTAINTYThe key assumptions concerning the future, and other key sources of estimation uncertainty at the reporting date, that have a significant risk of causing a material adjustment to the carrying amounts of assets and liabilities within the next financial year, are discussed below;
Claims made under insurance contracts Claims and loss adjustment expenses are charged to the consolidated statement of profit or loss as incurred based on the estimated liability for compensation owed to contract holders or third parties damaged by the contract holders. Liabilities for unpaid claims are estimated using the input of assessments for individual cases reported to the Group and management estimations for the claims incurred but not reported. The method for making such estimates and for establishing the resulting liability is continually reviewed. Any difference between actual claims and the provisions made are included in the consolidated statement of profit or loss in the year of settlement. As of 31 December 2020, the net estimate for unpaid claims amounted to QR 11,776,766 thousand (2019: QR 10,367,840 thousand).
Goodwill impairment testingThe Group determines whether goodwill is impaired at least on an annual basis. This requires an estimation of the recoverable amount of the CGU to which goodwill is allocated. Details of the key assumptions used in the estimation of the recoverable amounts are contained in Note 12 and Note 35.
Impairment of Insurance and other receivables An estimate of the collectible amount of insurance and other receivables is made when collection of the full amount is no longer probable. This determination of whether these insurance and other receivables are impaired, entails the Group evaluating the credit and liquidity position of the policy holders and the insurance companies, historical recovery rates including detailed investigations carried out during 2014 and feedback received from their legal department. The difference between the estimated collectible amount discounted to present value if applicable and the book amount is recognised as an expense in the consolidated statement of profit or loss. Any difference between amounts actually collected in the future periods and the amounts expected will be recognised in the consolidated statement of profit or loss at the time of collection. As of 31 December 2020, the insurance receivable and reinsurance receivables amounted to QR 3,647,314 thousand (2019: QR 2,882,260 thousand) and QR 3,201,562 thousand (2019: QR 3,457,913 thousand), respectively, and the provision for impairment on insurance receivable and reinsurance receivable amounted to QR 44,813 thousand (2019: QR 43,691 thousand) and QR 47,403 thousand (2019: QR 43,465 thousand) respectively.
Liability Adequacy TestAt each reporting date, liability adequacy tests are performed to ensure the adequacy of insurance contract liabilities. The Group makes use of the best estimates of future contractual cash flows and claims handling and administration expenses, as well as investment income from the assets backing such liabilities in evaluating the adequacy of the liability. Any deficiency is immediately charged to the consolidated statement of profit or loss.
37 PARENTAL GUARANTEEThe Parent Company has provided unconditional parental guarantee to its subsidiary companies, Qatar Reinsurance Company L.L.C. (Qatar – Re), Kuwait Qatar Insurance Company and QIC Europe Ltd, Malta for the purpose of obtaining financial rating from international rating agencies. As at 31 December 2020, the parental guarantee provided to QLM Life and Medical Insurance Company has been withdrawn as a result of the disposal.
38 GROUP RESTRUCTURINGDuring 2019, the Group acquired the minority shares in QIC Capital (4.26%) through a private rights issue share issuances of the parent entity. This was approved at the annual general assembly meeting held on 26 February 2019. As on 31 December 2020, QIC Capital is a wholly owned subsidiary of the Group.
39 IMPACT OF COVID-19The ongoing COVID-19 pandemic has had a significant impact on the global economy and the ability of individuals, businesses, and governments to operate. Across the globe, travel, trade, business, working arrangements and consumption have been materially impacted by the pandemic.
The Group is closely monitoring the situation and has activated its business continuity planning and other risk management practices to manage the potential business disruption COVID-19 outbreak may have on its operations and financial performance.
The Group may be impacted by any policies, practices, laws, or regulations introduced by governments which require or compel insurers to defer insurance premiums, pay claims in relation to COVID-19 losses which would not otherwise be payable under the relevant policy or in the normal course of business. The extent of the impact on our business and results of operations is largely dependent on the evolving future developments and the actions taken globally to address its impact. The Group had incurred claims of QR 514 million (USD 141 million), net of reinsurance, for the year ended 31 December 2020.
The Group’s investment portfolio is exposed to the current market volatility. Investment portfolios have certain exposures in economies that are relatively dependent on the price of crude oil. The Group has also an exposure of a loan due from a managing general agency (MGA). The management of the group and the MGA have mutually agreed to extend the repayment, given the current circumstances. Due to the uncertainties about global markets and economic performance, changes have been incorporated in the Expected Credit Loss (ECL) calculation to reflect the observable current Macro-Economic factors and forward-looking information
The Group’s capital, liquidity and funding positions remain robust and the Group remains operationally strong in the face of unprecedented global uncertainty presented by the COVID-19 pandemic. The Group expects this uncertainty and consequent capital contraction to influence rates across wholesale and reinsurance markets.

132 / Q A T A R I N S U R A N C E G R O U P A N N U A L R E P O R T 2 0 2 0 / 133
40 EVENTS AFTER THE REPORTING PERIODMarkerstudy Group UK recently concluded a deal for an investment in its Group led by Pollen Street Capital (a UK based independent alternative investment management company). The transaction which is subject to regulatory approvals, will see Pollen Street Capital acquire a substantial stake in MSG Group. QIC Group’s participation in this deal underlines its commitment as a strategic partner to Markerstudy Group. The conclusion of the transaction would also facilitate a substantial repayment of Markerstudy’s debt to the Group.
41 DISCONTINUED OPERATIONSOn 22 November 2020, by virtue of an resolution on extraordinary general assembly, the shareholders of QLM Life & Medical Insurance Company (QLM), a subsidiary of the Group, resolved to convert the subsidiary to a public shareholding Company (Q.P.S.C) and subsequently list on the Qatar Stock Exchange through an Initial Public Offering (“IPO”) of 60% of the shares held by the Group to the public. The IPO process was successfully completed on 30 December 2020 and Consequently, the interest held by the Group has been reduced to 25% of paid-up share capital of QLM Life & Medical Insurance Company Q.P.S.C
At 31 December 2020, QLM Life & Medical Insurance Company Q.P.S.C. was reported as a discontinued operation. The results of QLM Life & Medical Insurance Company Q.P.S.C. for the year are presented below;
2020QR (‘000)
2019QR (‘000)
Gross premiums 1,001,323 1,020,479
Premium ceded to reinsurers (67,951) (77,906)
Net premiums 933,372 942,573
Movement in unexpired risk reserve 32,923 (67,909)
Net earned premiums 966,295 874,664
Gross claims paid (826,488) (908,980)
Reinsurance recoveries 53,083 99,607
Movement in outstanding claims (78,716) 15,282
Net commissions (11,766) (2,414)
Net underwriting results 102,408 78,159
Investment and other income 45,992 63,415
Finance costs (4,762) (10,799)
Net investment income 41,230 52,616
Total income 143,638 130,775
Operating and administrative expenses (45,750) (47,536)
Depreciation and amortization (846) (711)
Profit before tax from discontinued operations 97,042 82,528
Income tax expenses 1,006 4,350
Profit after tax from discontinued operations 98,048 86,878
Other comprehensive income from discontinued operations
Net changes in fair value of debt instruments at FVOCI 6,119 41,770
Total comprehensive income for the period attributable to:
Equity holders of the parent from discontinued operations 104,167 128,648
Earnings per share
Basic/Diluted, profit for the year from discontinued operations in Qatari Riyals 0.03 0.04
The net cash flows incurred by QLM Life & Medical Insurance Company Q.P.S.C. are, as follows;
2020
QR (‘000)2019
QR (‘000)
Operating 75,397 124,600
Investing 154,392 93,053
Financing (193,524) 48,766
Net increase in cash generated 36,265 266,419
The carrying amounts of assets and liabilities of QLM Life & Medical Insurance Company Q.P.S.C as at the date of loss of control were as follows:
2020QR (‘000)
Assets
Cash and short-term deposits 604,976
Insurance and other receivables 326,390
Reinsurance contract assets 103,084
Due from related parties 115,094
Financial investments 590,886
Property and equipment 1,279
Total Assets 1,741,709
Liabilities
Short term borrowings (242,333)
Provisions, reinsurance and other payables (104,590)
Insurance contract liabilities (741,058)
Due to related parties (130,697)
Total Liabilities (1,218,678)
Value of the net assets as of the date of loss of control 523,031
Gain on disposal of investments in subsidiary
2020QR (‘000)
Consideration received by cash 661,500
Fair value of interest retained (25%) by the Group 274,750
Carrying amount of the subsidiary
Value of the net assets as of the date of loss of control (523,031)
Non-controlling interests 78,455
Cost incurred in relating to disposal process (24,199)
Profit after tax on disposal of investments in subsidiary 467,475
134 / Q A T A R I N S U R A N C E G R O U P A N N U A L R E P O R T 2 0 2 0 / 135
QIC Group’s Global Footprint
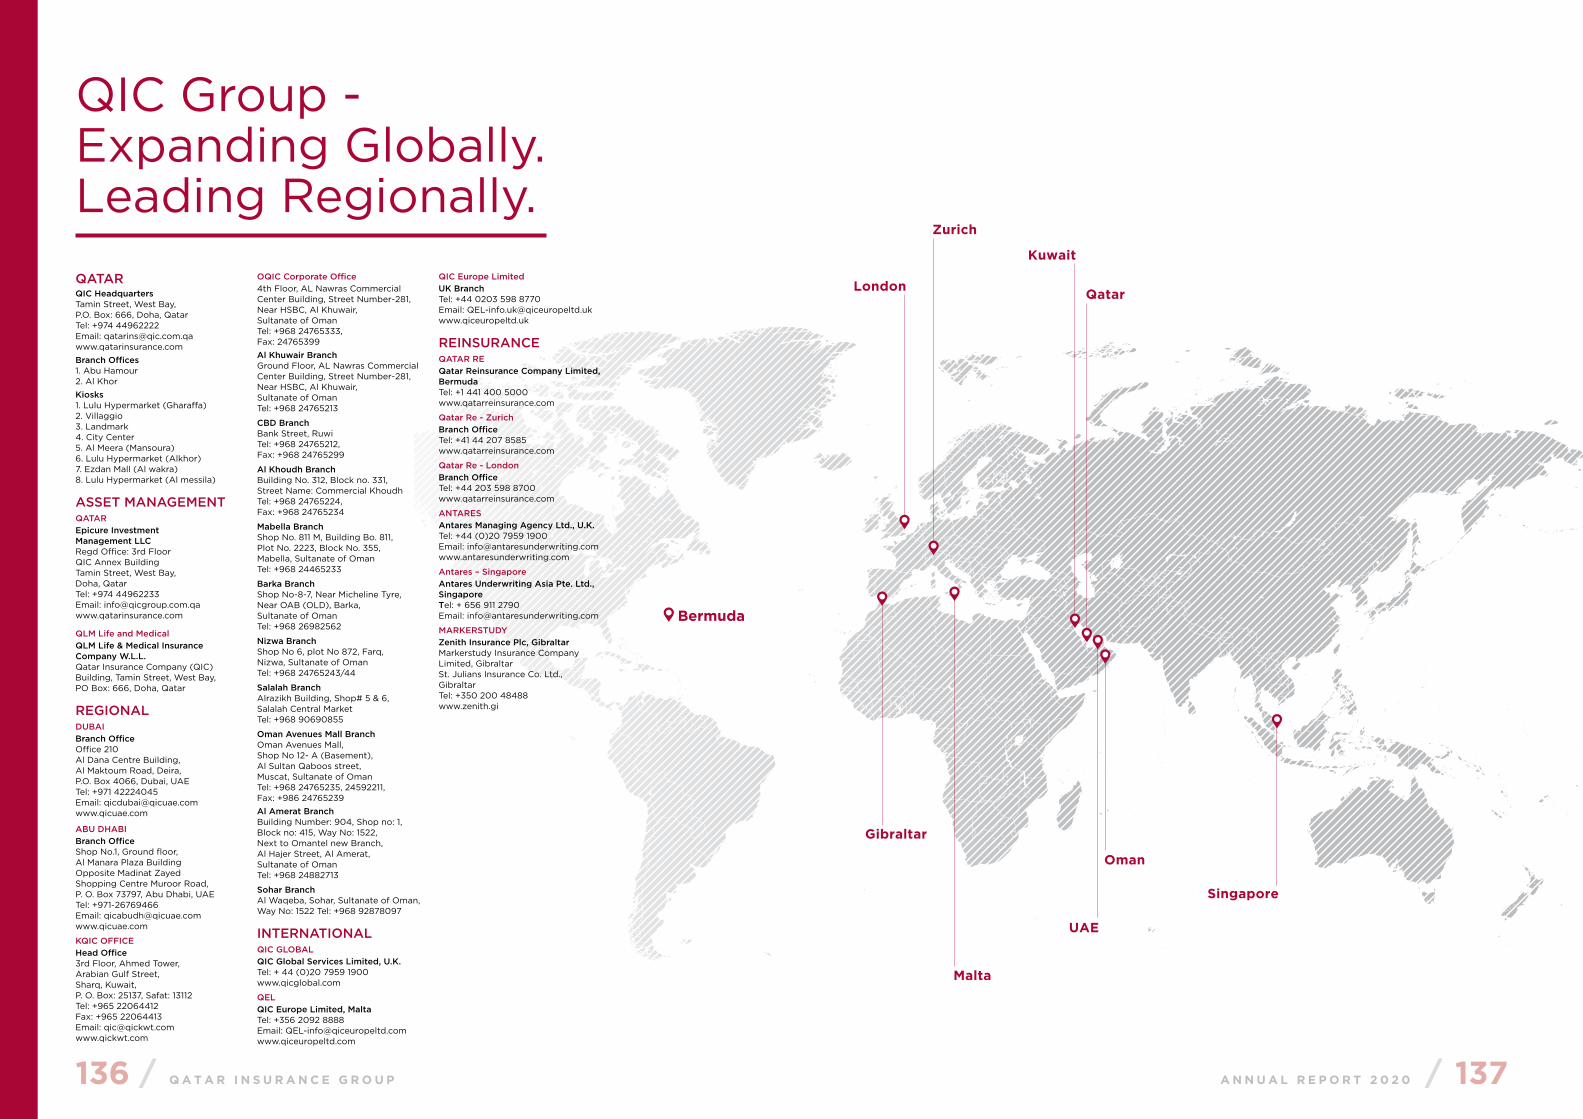
136 / Q A T A R I N S U R A N C E G R O U P A N N U A L R E P O R T 2 0 2 0 / 137
QIC Group - Expanding Globally. Leading Regionally.QATARQIC Headquarters Tamin Street, West Bay, P.O. Box: 666, Doha, Qatar Tel: +974 44962222 Email: [email protected] www.qatarinsurance.comBranch Offices 1. Abu Hamour 2. Al KhorKiosks 1. Lulu Hypermarket (Gharaffa)2. Villaggio3. Landmark4. City Center5. Al Meera (Mansoura)6. Lulu Hypermarket (Alkhor)7. Ezdan Mall (Al wakra) 8. Lulu Hypermarket (Al messila)
ASSET MANAGEMENTQATAR Epicure Investment Management LLC Regd Office: 3rd Floor QIC Annex Building Tamin Street, West Bay, Doha, Qatar Tel: +974 44962233 Email: [email protected] www.qatarinsurance.com
QLM Life and Medical QLM Life & Medical Insurance Company W.L.L. Qatar Insurance Company (QIC) Building, Tamin Street, West Bay, PO Box: 666, Doha, Qatar
REGIONAL
DUBAI Branch Office Office 210 Al Dana Centre Building, Al Maktoum Road, Deira, P.O. Box 4066, Dubai, UAE Tel: +971 42224045 Email: [email protected] www.qicuae.com
ABU DHABI Branch Office Shop No.1, Ground floor, Al Manara Plaza Building Opposite Madinat Zayed Shopping Centre Muroor Road, P. O. Box 73797, Abu Dhabi, UAE Tel: +971-26769466 Email: [email protected] www.qicuae.com
KQIC OFFICE Head Office 3rd Floor, Ahmed Tower, Arabian Gulf Street, Sharq, Kuwait, P. O. Box: 25137, Safat: 13112 Tel: +965 22064412 Fax: +965 22064413 Email: [email protected] www.qickwt.com
OQIC Corporate Office4th Floor, AL Nawras Commercial Center Building, Street Number-281, Near HSBC, Al Khuwair, Sultanate of Oman Tel: +968 24765333, Fax: 24765399 Al Khuwair Branch Ground Floor, AL Nawras Commercial Center Building, Street Number-281, Near HSBC, Al Khuwair, Sultanate of Oman Tel: +968 24765213
CBD Branch Bank Street, Ruwi Tel: +968 24765212, Fax: +968 24765299
Al Khoudh Branch Building No. 312, Block no. 331, Street Name: Commercial Khoudh Tel: +968 24765224, Fax: +968 24765234
Mabella Branch Shop No. 811 M, Building Bo. 811, Plot No. 2223, Block No. 355, Mabella, Sultanate of Oman Tel: +968 24465233
Barka Branch Shop No-8-7, Near Micheline Tyre, Near OAB (OLD), Barka, Sultanate of Oman Tel: +968 26982562
Nizwa Branch Shop No 6, plot No 872, Farq, Nizwa, Sultanate of Oman Tel: +968 24765243/44
Salalah Branch Alrazikh Building, Shop# 5 & 6, Salalah Central Market Tel: +968 90690855
Oman Avenues Mall Branch Oman Avenues Mall, Shop No 12- A (Basement), Al Sultan Qaboos street, Muscat, Sultanate of Oman Tel: +968 24765235, 24592211, Fax: +986 24765239Al Amerat Branch Building Number: 904, Shop no: 1, Block no: 415, Way No: 1522, Next to Omantel new Branch, Al Hajer Street, Al Amerat, Sultanate of Oman Tel: +968 24882713
Sohar Branch Al Waqeba, Sohar, Sultanate of Oman, Way No: 1522 Tel: +968 92878097
INTERNATIONALQIC GLOBAL QIC Global Services Limited, U.K. Tel: + 44 (0)20 7959 1900 www.qicglobal.com
QEL QIC Europe Limited, Malta Tel: +356 2092 8888 Email: [email protected] www.qiceuropeltd.com
QIC Europe Limited UK Branch Tel: +44 0203 598 8770 Email: [email protected] www.qiceuropeltd.uk
REINSURANCEQATAR RE Qatar Reinsurance Company Limited, Bermuda Tel: +1 441 400 5000 www.qatarreinsurance.com
Qatar Re - Zurich Branch Office Tel: +41 44 207 8585 www.qatarreinsurance.com
Qatar Re - London Branch Office Tel: +44 203 598 8700 www.qatarreinsurance.com
ANTARES Antares Managing Agency Ltd., U.K. Tel: +44 (0)20 7959 1900 Email: [email protected] www.antaresunderwriting.com
Antares – Singapore Antares Underwriting Asia Pte. Ltd., Singapore Tel: + 656 911 2790 Email: [email protected]
MARKERSTUDY Zenith Insurance Plc, Gibraltar Markerstudy Insurance Company Limited, Gibraltar St. Julians Insurance Co. Ltd., Gibraltar Tel: +350 200 48488 www.zenith.gi
Bermuda
London
Gibraltar
Malta
Zurich
Kuwait
Oman
UAE
Singapore
Qatar

138 / Q A T A R I N S U R A N C E G R O U P
w w w . q a t a r i n s u r a n c e . c o m / c o r p o r a t e