2.0 economics, demographics, freight, and the multimodal...
TRANSCRIPT

The Statewide Long-Range Transportation Plan 2035 2-1
2.0 Economics, Demographics, Freight, and the Multimodal Transportation System – Conditions and Trends
2.1 Introduction
Texas is the second most populated state in the nation and contains the nation’s largest
highway network, has the largest interstate network, and has the second highest
volume of traffic. Texas ports handle 19.1 percent of the nation’s total domestic and
foreign maritime cargo. Additionally, Texas has the largest freight rail network in the
country carrying 8 percent of all freight moved by rail. There are 29 urban transit
providers in Texas that account for 3 percent of the nation’s urban transit ridership.5
Finally, two of the nation’s top 10 busiest commercial airports (Dallas-Fort Worth
International Airport [DFW] [4] and George Bush Intercontinental Airport [IAH] [8]) are
located in Texas.6
Population and interrelated economic activity drive demand for transportation facilities
and services. This chapter identifies Texas’ existing and projected demographic and
economic conditions, the existing multi-modal transportation system and the potential
effects of population and economic growth on that system. The future transportation
needs of Texas are projected to be greater than in past years while future funding
sources and levels are uncertain.
Environmental concerns related to transportation are becoming more prevalent and the
planning process must evolve to address these concerns. These topics will be
discussed in depth in Chapter 8.
What makes Texas transportation unique?
Texas is a large state that has a lot of roadway mileage. It takes 13 hours at the
posted speed limits to cross the state at its widest point.
It has a large international boundary with Mexico with 27 border crossings that
handle the most truck, rail, and personal vehicle crossings of any state.
5 Sources: U. S. Census Bureau, The 2010 Statistical Abstract of the United States, Tables 12, 1053, and 1054. Available at
http://www.census.gov/compendia/statab/. Bureau of Transportation Statistics, State Transportation Statistics 2009, Tables 1-14, 3-24, 3-4, 4-4, 5-3, available at http://www.bts.gov/publications/state_transportation_statistics/state_transportation_statistics_2009/index.html
6 Federal Aviation Administration 2008 passenger boarding statistics

The Statewide Long-Range Transportation Plan 2035
Economics, Demographics, Freight, and the Multimodal 2-2
Transportation System – Conditions and Trends
Its seaports are of national importance. Millions of gallons of petroleum products,
manufactured goods, military deployments, and other freight are moved into and
out of Texas, and between the global marketplace and the rest of the U.S.
The vital routes of Interstate Highway 40 (I-40), I-30, I-20, and I-10 through
Texas connect the western U.S. to the southern and eastern U.S.
Texas is demographically diverse, with large expanses of rural areas, and distinct
north, south, east, and western Texas regions.
Texas is geographically diverse, with many ecological regions, from the western
Chihuahuan deserts to the eastern forests as well as the central plains and
mountains of El Paso and the Big Bend.
Texas has several of the largest metropolitan urban areas in the U.S.—Houston-
Galveston, Dallas-Fort Worth, Austin and San Antonio, the Lower Rio Grande
Valley, and El Paso—as well as many large cities. Connectivity between these
urban areas is a vital part of the economy.
2.2 Texas Economic, Population, and Employment Trends
2.2.1 The Texas Economy
While there have been four recessions in the U.S. over the past 30 years (i.e., 1981–82,
1990–91, 2001, and 2007–09) it is generally accepted that the most recent economic
recession was the worst since the Great Depression of the 1920s and 1930s. The
ongoing high levels of unemployment continue to affect transportation in two major
ways: reduced levels of travel and reduced tax revenues. However, several Texas
metropolitan areas are experiencing population growth because of net in-migration
(international and from other states). While slowed by the current recession, the Texas
economy has remained stronger than that of the U.S. as a whole.
The Texas economy has also grown faster, on average than the U.S. economy as a
whole since 1990. Historical data on GDP and gross state product (GSP) show that the
average increases per year between 1990 and 2007 were 2.89 percent for the U.S.
GDP and 4.04 percent for Texas GSP.
Forecasts from the Texas Comptroller of Public Accounts predict that the U.S. and
Texas economies will rebound from the current recession (in terms of GSP and GDP),
and grow at 2.6 percent and 3.37 percent, respectively, on average, per year between

The Statewide Long-Range Transportation Plan 2035
Economics, Demographics, Freight, and the Multimodal 2-3
Transportation System – Conditions and Trends
2010 and 2035 (Figure 2-1).7 An efficient and well-maintained transportation system is
vital to the state’s ability to remain economically competitive at home and abroad.
Figure 2-1: Comparative Annual Economic Growth, 1990 to 2035
2.2.2 Texas Population Forecasts
Of the many forces driving and shaping growth in transportation demand, population is
the largest. For the SLRTP, the recommended Texas population forecast scenario is the
―0.5‖ scenario. Migration scenarios offered by the State Demographer are described
below:
Scenario 0.0 (Zero Migration): This scenario assumes that the forecast net migration
is zero resulting in growth only through natural increase (the excess or deficit of births
relative to deaths).
Scenario 0.5 (One-Half 1990–2000 Migration): The SLRTP uses this scenario, which
has been prepared as an approximate average of the zero (0.0) and 1990–2000 (1.0)
scenarios. It assumes rates of net migration one-half of those of the 1990s.
Scenario 1.0 (1990–2000 Migration): The ―1.0‖ scenario assumes that the net
migration rates of the 1990s will characterize those occurring in the future of Texas. The
1990s was a period characterized by rapid growth.
7 Texas Comptroller of Public Accounts and HIS Global Insight, Inc. Data are historical through 2007. Numbers are in 2000
dollars.
-4.0
-2.0
0.0
2.0
4.0
6.0
8.0
10.0
1990 1995 2000 2005 2010 2015 2020 2025 2030 2035Ye
ar
to Y
ea
r P
erc
en
t C
ha
ng
e
Year
Texas Gross State Product U.S. Gross Domestic Product

The Statewide Long-Range Transportation Plan 2035
Economics, Demographics, Freight, and the Multimodal 2-4
Transportation System – Conditions and Trends
The Texas State Demographer suggests that the 0.5 scenario continues to be the most
appropriate scenario for most counties for use in long-term planning. The 2008 and
2035 population projections for each scenario are compared in Table 2-1.
Table 2-1: Texas Population, 2008 and 2035 by Migration Scenario8
Scenario 2008 Population 2035 Population Change Percent
Scenario 0.0 22,444,491 25,830,944 3,386,453 15.1
Scenario 0.5 23,614,497 33,789,697 10,175,200 43.1
Scenario 1.0 24,902,640 46,105,919 21,203,279 85.1
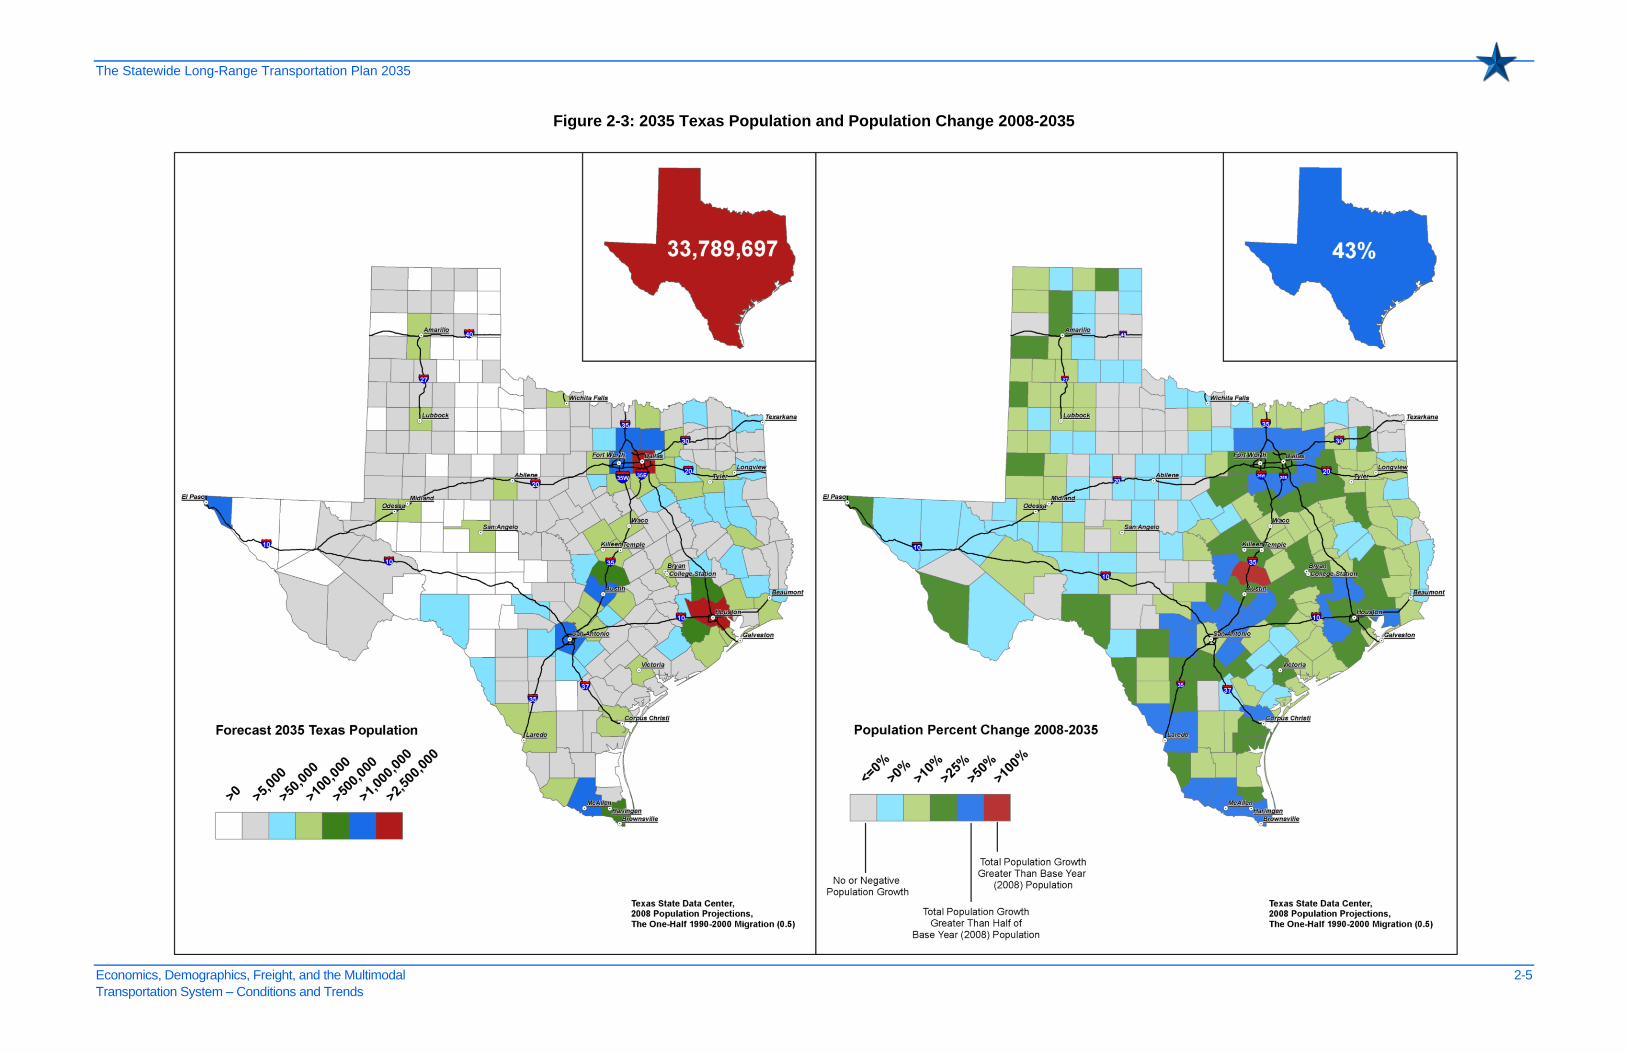
Based on the ―0.5‖ scenario the population of Texas increased by an estimated
6,627,987 persons (i.e., a 39.0 percent increase) since 1990.9 From 2008, Texas’
population is forecast to grow an additional 10,175,200 persons by 2035. Figure 2-2
shows Texas’ population growth, a 43.1 percent increase over the estimated 2008
levels and a forecast average annual percent per year increase of 1.6 percent, or
376,859 persons per year. Figure 2-3 illustrates the geographic distribution of Texas’
2035 forecast population and percent change in population from 2008 to 2035 by
county.
Figure 2-2: Texas Historical and Forecast Population Growth, 1930 to 203510
8 Texas State Data Center (TSDC), 2008 Population Projections
9 Historical: U.S. Bureau of the Census. Texas Population of Counties by Decennial Census: 1900 to 1990. March 27,
1995. Available at http://www.census.gov/population/www/censusdata/cencounts/index.html 10
―Historical population data (1930–2007) is based on actual U.S. Bureau of the Census population decennial population
counts and interim estimates. Population projections from 2008–2035 are based on the TSDC’s 2008 Population Projections, The One-Half 1990–2000 Migration (0.5) Scenario (which is the TSDC’s recommended scenario) .
24,902,640
46,105,919
22,444,49125,830,944
23,614,497
33,789,697
5,000,000
10,000,000
15,000,000
20,000,000
25,000,000
30,000,000
35,000,000
40,000,000
45,000,000
50,000,000
Po
pu
lati
on
Year (Percent Change Data Points are 2008 & 2035)
Migration Scenario 1.0 Migration Scenario 0.0 Migration Scenario 0.5
The Statewide Long-Range Transportation Plan 2035
Economics, Demographics, Freight, and the Multimodal 2-5
Transportation System – Conditions and Trends
Figure 2-3: 2035 Texas Population and Population Change 2008-2035

The Statewide Long-Range Transportation Plan 2035
Economics, Demographics, Freight, and the Multimodal 2-6
Transportation System – Conditions and Trends
2.2.2.1 Geographic Distribution of Texas Population
In order to study the statewide geographic distribution of population and population
growth and their impact to transportation, a classification scheme was developed at the
county level for the SLRTP. Each county was assigned a type based on:
Its estimated total county 2008 population,
The population of the largest city within the county in 2008,
Whether or not the county contained an urbanized area classified as an MPO,
The proximity of the county to other counties with large populations or MPOs,
and
The commuting characteristics of the resident population.
The county types defined in the SLRTP are as follows:
Urban-metro County = 2008 population greater than 500,000 and the county is a
core MPO county (Example: Harris County, containing the city of Houston)
Large County = 2008 population greater than 50,000 but less than 500,000 and
the county is a core MPO county (Example: Tom Green County, containing the
city of San Angelo)
Suburban County = 2008 population greater than 50,000 AND; is contained
within an MPO boundary or the county borders an MPO core county, AND has
out-worker flows GREATER THAN 30 percent (Example: Collin County, with
multiple cities)
Medium County = 2008 population greater than 50k AND; is not an MPO County,
or it borders a MPO County AND but has worker outflows LESS THAN 30%
(example Val Verde County)
Small County = 2008 population greater than 20,000 but less than 50,000
(Example: Titus County, containing the town of Mt. Pleasant)
Rural County = 2008 population less than 20,000 (Example: Loving County,
Population 65)
The county types were used to analyze both 2008 and 2035 population growth and
other measures in a consistent manner. Each county type and county name is provided
on Figure 2-4.

The Statewide Long-Range Transportation Plan 2035
Economics, Demographics, Freight, and the Multimodal 2-7
Transportation System – Conditions and Trends
Figure 2-4: SLRTP County Types

The Statewide Long-Range Transportation Plan 2035
Economics, Demographics, Freight, and the Multimodal 2-8
Transportation System – Conditions and Trends
As shown in Table 2-2 and illustrated on Figure 2-5, the vast majority of population
growth will occur in urban-metro, suburban, and large counties. Combined, these
counties will account for 92 percent of the growth, over 9.3 million persons by 2035.
Table 2-2: 2000, 2008, and Forecast 2035 Population by County Type
County Type 2000 2008 2035 Growth
2008-2035
% Change 2008-2035
Urban-Metro 10,519,992 11,903,007 17,028,201 5,125,194 43.1
Large 3,412,833 3,747,564 4,852,359 1,104,795 29.5
Suburban 3,647,447 4,427,349 7,583,884 3,156,535 71.3
Medium 497,108 546,767 696,821 150,054 27.4
Small 1,701,214 1,857,473 2,356,424 498,951 26.9
Rural 1,073,226 1,132,337 1,272,008 139,671 12.3
Total 20,851,820 23,614,497 33,789,697 10,175,200 43.1
Figure 2-5: Texas 2008 and Forecast 2035 Population Trends by County Type
0
2,000,000
4,000,000
6,000,000
8,000,000
10,000,000
12,000,000
14,000,000
16,000,000
18,000,000
Po
pu
lati
on
County Type
2008
2035

The Statewide Long-Range Transportation Plan 2035
Economics, Demographics, Freight, and the Multimodal 2-9
Transportation System – Conditions and Trends
2.2.2.2 Texas Population by Age Group
The overall population of the U.S. and Texas is aging, as the baby-boomer generation
enters the 65+ age group. Table 2-3 and Figure 2-6 show the population forecast by
age group for Texas. Between 2008 and 2035, Texas will add an additional 3.4 million
persons in the 65+ age group, a 144 percent increase. Texas will go from having
10 percent of its population in this age group to over 17 percent. However, while the 65+
age group will be the fastest growing age group, the majority of Texas residents will
remain in the younger age groups.
The increase in older Texans will have an impact on transportation needs, since this
age group either is retired or demonstrates different work, shopping, leisure, and
medical and special needs travel behavior.
Table 2-3: Texas 2008 and Forecast 2035 Population by Age Group
Age Group 2008 2035 % 2008 % 2035 Growth % Change
<18 6,373,056 7,600,617 27.0 22.5 1,227,561 19.3
18–24 2,448,144 3,141,915 10.4 9.3 693,771 28.3
25–44 6,799,904 9,306,023 28.7 27.5 2,506,119 36.9
45–64 5,593,461 7,885,313 23.7 23.3 2,291,852 41.0
65+ 2,399,932 5,855,829 10.2 17.4 3,455,897 144.0
Total 23,614,497 33,789,697 100 100 10,175,200 43.1
Figure 2-6: Texas 2008-2035 Population by Age Group
00
1,000,000
2,000,000
3,000,000
4,000,000
5,000,000
6,000,000
7,000,000
8,000,000
9,000,000
10,000,000
<18 18-24 25-44 45-64 65+
Po
pu
lati
on
Age Group
2008
2035
The Statewide Long-Range Transportation Plan 2035
Economics, Demographics, Freight, and the Multimodal 2-10
Transportation System – Conditions and Trends
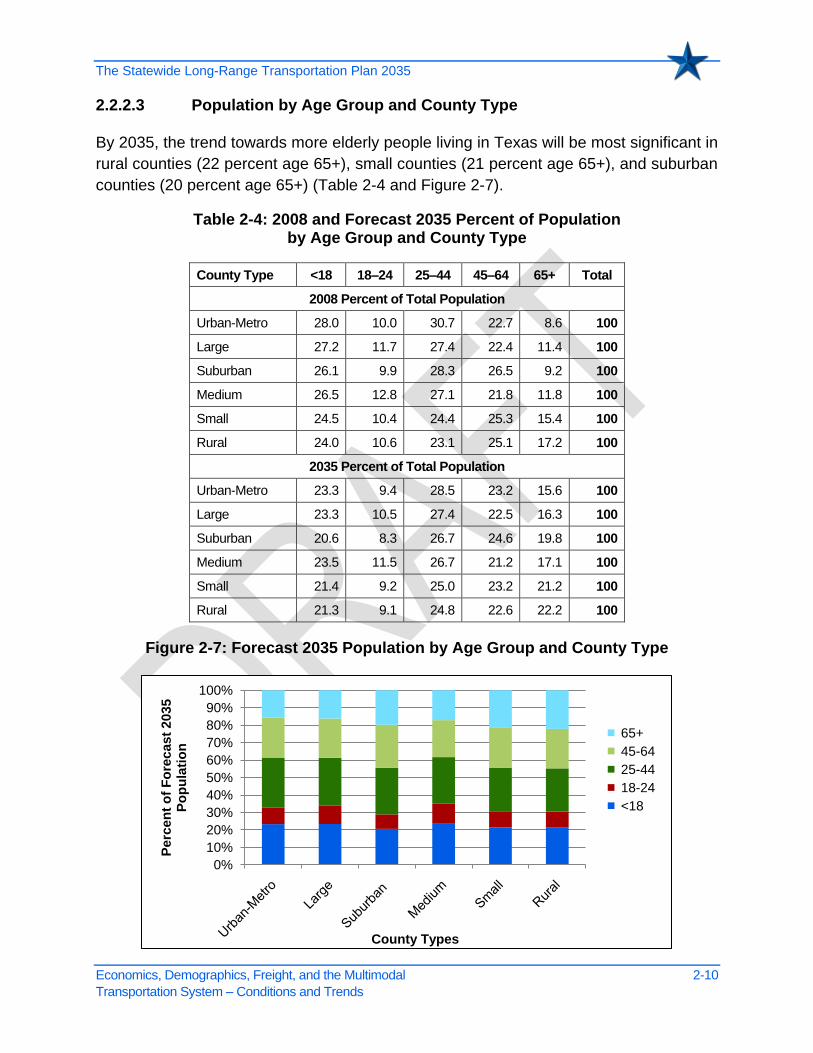
2.2.2.3 Population by Age Group and County Type
By 2035, the trend towards more elderly people living in Texas will be most significant in
rural counties (22 percent age 65+), small counties (21 percent age 65+), and suburban
counties (20 percent age 65+) (Table 2-4 and Figure 2-7).
Table 2-4: 2008 and Forecast 2035 Percent of Population by Age Group and County Type
County Type <18 18–24 25–44 45–64 65+ Total
2008 Percent of Total Population
Urban-Metro 28.0 10.0 30.7 22.7 8.6 100
Large 27.2 11.7 27.4 22.4 11.4 100
Suburban 26.1 9.9 28.3 26.5 9.2 100
Medium 26.5 12.8 27.1 21.8 11.8 100
Small 24.5 10.4 24.4 25.3 15.4 100
Rural 24.0 10.6 23.1 25.1 17.2 100
2035 Percent of Total Population
Urban-Metro 23.3 9.4 28.5 23.2 15.6 100
Large 23.3 10.5 27.4 22.5 16.3 100
Suburban 20.6 8.3 26.7 24.6 19.8 100
Medium 23.5 11.5 26.7 21.2 17.1 100
Small 21.4 9.2 25.0 23.2 21.2 100
Rural 21.3 9.1 24.8 22.6 22.2 100
Figure 2-7: Forecast 2035 Population by Age Group and County Type
0%
10%
20%
30%
40%
50%
60%
70%
80%
90%
100%
Pe
rce
nt
of
Fo
rec
as
t 2
03
5
Po
pu
lati
on
County Types
65+
45-64
25-44
18-24
<18

The Statewide Long-Range Transportation Plan 2035
Economics, Demographics, Freight, and the Multimodal 2-11
Transportation System – Conditions and Trends
2.2.3 Texas Employment,
Employment increase typically tracks with population increase, more specifically, with
the labor force increase. Labor force is the proportion of the population that is eligible for
work, typically measured as all eligible (e.g., nonincarcerated) population between the
ages of 16 and 65 years old. Total employment is equal to labor force minus
unemployed persons. Therefore, if the unemployment rate remains relatively stable and
the proportion of the population eligible for work remains stable, then total employment
typically tracks as a proportion of population. In 2008, the state’s labor force was equal
to 11,812,190 persons.
According to statistics published by the Texas Workforce Commission, there were
1,249,324 more persons working in 2008 (11,200,334) than in 2000 (9,951,010),
representing a 13 percent change (Figure 2-8).
Figure 2-8: Labor Force, Employment, Unemployment 2000–200811
Recent employment forecasts from the Texas Comptroller of Public Accounts estimate
that by 2035 nonfarm employment will be 16,186,400 persons or an approximate
53 percent increase from 2008 nonfarm employment (Figure 2-9). Additionally, the
unemployment rate in 2035 is forecast to be approximately 4.5 percent of the labor
force.
11
Historic Employment Data Source: Texas Workforce Commission, Tracer, Unemployment (LAUS), yearly October
estimates, available at http://www.tracer2.com/cgi/dataanalysis/
9,951,012 11,138,607
-
2,000,000
4,000,000
6,000,000
8,000,000
10,000,000
12,000,000
14,000,000
2000 2001 2002 2003 2004 2005 2006 2007 2008
To
tal P
ers
on
s
Year
Labor Force Employment Unemployment

The Statewide Long-Range Transportation Plan 2035
Economics, Demographics, Freight, and the Multimodal 2-12
Transportation System – Conditions and Trends
Figure 2-9: Historic and Forecast Nonfarm Employment and Unemployment 1990–203512
2.2.3.1 Worker Flows and Employment by County Type
The commute to work has a significant impact on the transportation system. Work trips
constitute 9.6 percent13 of all daily trips in Texas, and most of them occur during the
same time of day. This commuter behavior creates most of the congestion during the
peak periods.
The U.S. Census Bureau conducts the American Community Survey (ACS) sample of
U.S. households each year. The ACS is used to tabulate journey-to-work information.
The ACS data are summarized and reported every year using the previous 3 years’
collected data. According to the 2006–2008 ACS, 25 counties in Texas had greater than
50 percent of their residents work in an adjacent county. Most of these counties were
adjacent to the large metropolitan regions of Dallas-Fort Worth, Austin, San Antonio, or
Houston. This indicates that a significant proportion of workers are choosing to
commute into core urban counties from surrounding counties rather than working in the
county where they reside. This characteristic reflects the tradeoffs that people make
between short commutes and access to affordable housing often found in more
suburban or rural counties. It also reflects the dynamic nature of the job market with
people changing jobs and thus commuter patterns on a regular basis. Transportation
plays a role in these patterns, both in terms of supporting work-trip commutes and in the
need to adapt to these new demands.
12
Forecast employment data presented in this section is based on current economic analysis provided by the Texas
Comptroller of Public Accounts provided by Gary Preuss. No data is available at this time for forecast conditions at the county level.
13 National Household Travel Survey, 2009, available at http://nhts.ornl.gov/
10,607.0
16,186.4
0.0
1.0
2.0
3.0
4.0
5.0
6.0
7.0
8.0
9.0
0
2,000
4,000
6,000
8,000
10,000
12,000
14,000
16,000
18,000
1990 1995 2000 2005 2010 2015 2020 2025 2030 2035
Un
em
plo
ym
en
t R
ate
No
nfa
rm E
mp
loym
en
t (1
000
's)
YearNonfarm Employment Unemployment Rate

The Statewide Long-Range Transportation Plan 2035
Economics, Demographics, Freight, and the Multimodal 2-13
Transportation System – Conditions and Trends
As illustrated on Figure 2-10, greater than 50 percent of workers living in suburban
counties travel to work outside of their residence county, followed by rural counties
(49 percent), small counties (35 percent), medium counties (16 percent), large counties
(13 percent), and urban-metro counties (11 percent).
Figure 2-10: Percent of Workers Who Work Outside of County
Similar to population growth, employment as a percent of the state total is increasing for
urban-metro, suburban, and large counties (from 84 percent in 2000 to 86 percent in
2008) (Figure 2-11).
Urban-Metro
LargeSubur
banMediu
mSmall Rural
Percent of Workers Who Work Outside of County
11% 13% 52% 16% 35% 46%
0%
10%
20%
30%
40%
50%
60%P
erc
en
t o
f W
ork
ers
County Type

The Statewide Long-Range Transportation Plan 2035
Economics, Demographics, Freight, and the Multimodal 2-14
Transportation System – Conditions and Trends
Figure 2-11: Percent of Total Statewide Employment 2000–2008 by County Type
2.3 Texas Roadway Inventory
As part of the statewide planning process, an inventory of Texas roadways was
completed. Roadways are measured by their length (―centerline‖ miles), and by the
length and number of lanes they have (―lane miles‖). Lane miles represent total capacity
on the roadway system. Additionally, roadways are classified by TxDOT as either ―on-
system‖ or ―off-system.‖
On-system roadways are on the designated state highway system, owned and
maintained by TxDOT, and are typically funded with a combination of federal and state
or state-only funds. These roadways include all interstate highways, U.S. highways
(US), state highways (SH), farm-to-market roads (FM), and other state roads.
Off-system roadways are not part of the designated state highway system and are
under the direct jurisdiction of the local government such as a county, city, other political
subdivision of the state, or special district with authority to finance a highway
improvement project.
For the SLRTP, centerline miles and lane miles in 2008 were measured from several
sources. The Roadway Highway Inventory Network (RHiNO) Database is the main
source of information.
Urban-Metro
LargeSuburba
nSmall Medium Rural
2000 52% 15% 19% 7% 2% 5%
2008 50% 21% 15% 2% 7% 5%
0%
10%
20%
30%
40%
50%
60%P
erc
en
t o
f To
tal
Sta
tew
ide E
mp
loym
en
t
County Type

The Statewide Long-Range Transportation Plan 2035
Economics, Demographics, Freight, and the Multimodal 2-15
Transportation System – Conditions and Trends
For 2035, future centerline and lane miles are subject to implementation of plans,
programming of projects, construction, and funding availability. Details of potential
future roadways can be found in:
MTPs – These plans are published by MPOs and are updated every 5 years.
2010 UTP – adopted in April 2010 by the Texas Transportation Commission,
Table 2-5 provides 1990 and 2008 total centerline miles and lane miles for on-system
roadways. From 1990 to 2008, total on-system roadway centerline miles and lane miles
in the state grew by 4.3 percent and 6.0 percent, respectively. In addition, 226,336
centerline miles of off-system roadways were added to the state as of 2008. Figure 2-12
shows the interstates U.S. highways, and state highways of Texas.

The Statewide Long-Range Transportation Plan 2035
Economics, Demographics, Freight, and the Multimodal 2-16
Transportation System – Conditions and Trends
Figure 2-12: Texas Roadways

The Statewide Long-Range Transportation Plan 2035
Economics, Demographics, Freight, and the Multimodal 2-17
Transportation System – Conditions and Trends
Table 2-5: Texas 1990 and 2008 Roadways, On-System Centerline and Lane Miles14
Mileage 1990 2008 Growth %
Change
Centerline Miles 76,730 80,067 3,337 4.3
Lane Miles 182,447 193,309 10,861 6.0
Note: Excludes Off-System Toll Roads
Figure 2-13 illustrates total 2008 centerline miles and lane miles by county type. Rural
counties hold the most roadway mileage in Texas.
Figure 2-13: Texas 2008 Roadways, On-System
Centerline Miles and Lane Miles by County Type15
Note: Excludes Off-System Toll Roads
Table 2-6 provides total centerline miles and lane miles for on-system roadways in 2008
by highway system. FM and other roads are the largest part of the highway system in
the state in terms of both centerline miles and lane miles, followed by SH (which include
highways and loops).
14
Source: TxDOT RHiNO database 15
Source: TxDOT RHiNO database
Urban -Metro
LargeSubur-
banMedium Small Rural
Centerline Miles
5,714 9,335 10,370 3,276 18,844 32,528
Lane Miles
20,799 24,864 26,045 7,482 42,829 71,289
-
10,000
20,000
30,000
40,000
50,000
60,000
70,000
80,000
Mil
es
County Type

The Statewide Long-Range Transportation Plan 2035
Economics, Demographics, Freight, and the Multimodal 2-18
Transportation System – Conditions and Trends
Table 2-6: Texas 2008 Roadways, On-System Centerline and Lane Miles by Highway System16
Highway System Centerline
Miles % of On-System
Roads Lane Miles
% of On-System Roads
Interstates (I-) 3,233 4.0 15,155 7.8
US Highways (US) 12,105 15.1 35,737 18.5
State Highways (SH), spurs, loops, business routes
16,346 20.4 42,384 21.9
Other (Farm-to, Ranch-to-Market Roads, Recreational Roads etc.)
41,313 51.7 85,355 44.2
Frontage Roads 7,069 8.8 14,677 7.6
Total 80,067 100.0 193,309 100.0
Note: Excludes Off-System Toll Roads
2.4 Texas Vehicle Miles of Travel Forecast
2.4.1 Variability in Transportation Forecasts
When developing a plan as large as the SLRTP, it is important to underscore the fact
that the future cannot be precisely predicted. Although the SLRTP uses one set of
forecasts, it is important to discuss the variability that might be expected over the life of
the plan.
The past is not always a good guide to the future. It is plausible that some nontraditional
factors will exert unexpected influences on society over the 25-year life of this plan,
resulting in different trends.
For the most part, travel demand does not vary greatly in the short term. While factors
such as weather, maintenance/construction, incidents, major events, and school/public
holidays will influence road traffic and transit ridership from hour-to-hour or day-to-day,
any given Monday will likely be similar to the previous and following Mondays. Over the
long term, however, other factors begin to influence travel demand. These factors are
typically gradual.
Population growth,
Age distribution, i.e., an aging population,
Employment trends, and
Disposable income.
16
Source: TxDOT RHiNO database

The Statewide Long-Range Transportation Plan 2035
Economics, Demographics, Freight, and the Multimodal 2-19
Transportation System – Conditions and Trends
Other factors can be both gradual and at times more precipitous:
Economic disruptions (and recovery),
Addition or loss of transportation system capacity,
Relocation of major employers, and
Opening/closure of major traffic generating facilities.
Over an extended period of time, such as the 24-year period covered by this plan, these
and other factors will combine to influence the frequency and extent of local and long
distance travel behavior, the modal choice, and the economics of personal travel and
freight transportation.
2.4.2 Alternative Futures for Texas Transportation
Economic conditions have historically driven personal and freight transportation
choices. Technological advances have historically led to efficiencies in transportation,
which led to changes in modal choice and travel behavior. Texas has moved among
various modes, from horseback to steam trains, to diesel trains to personal automobiles,
to urban rail and commuter rail. In a plan such as the SLRTP 2035, it is expected that
this trend of change in response to economics and efficiency will continue.
Traditionally, increasing affluence has led to increasing levels of personal mobility
through greater auto ownership. Increasing affluence has also allowed Texans to afford
a greater choice in residential location and discretionary travel choice. With Texas’
abundance of land and limited constraint on new development, suburbanization has
increased the footprint of its metropolitan areas, commutes have lengthened, and traffic
congestion has grown. Looking forward, it is plausible that the same trend will continue
over the life of this plan.
Relatively inexpensive energy coupled with the ―just in time delivery‖ concept has
allowed for a boom over the past 20 years in freight transportation. A much wider
diversity of products has been made available to the average Texan because of
economical freight transportation and supply chain management. The development of
efficient freight movement and technologies has also put a strain on the ability of state
and local governments to meet the demands that freight transportation is placing upon
the systems.
The following factors may affect future transportation choices in Texas:

The Statewide Long-Range Transportation Plan 2035
Economics, Demographics, Freight, and the Multimodal 2-20
Transportation System – Conditions and Trends
Factor 1: Changing Energy Sources Will Influence Transportation
The past 100 years has seen the rise of the internal combustion engine and the
widespread availability of relatively inexpensive petroleum. This assumption has been
traditionally built into transportation planning. Various opinions suggest that global oil
production will reach a peak, and subsequently enter a state of terminal decline, in the
coming years or decades.17 Regardless of the exact timing, petroleum-related fuel
prices are expected to rise significantly, unless fuel efficiency improves and/or global
demand for oil decreases by at least the same rate as the decline in production. Several
possibilities exist that must be taken into account for the SLRTP 2035. Future travel
patterns may be significantly different from historic trends, unless alternate sources of
transportation energy are brought online, such as:
Alternative energy sources for vehicles, whether they are electric, hybrid, or
natural gas conversions, or even other sources, may change the economics of
personal and freight transportation choices.
Possible scarcity of gasoline and diesel, changing the economic factors that
currently contribute to the growth in single-occupant vehicular travel.
Rapidly changing technologies and patterns of gasoline usage, resulting in more
efficient personal and freight transportation, may offset the effect on personal and
freight transportation choices that would otherwise be precipitated by increases
in gasoline costs.
Alternative energy sources will affect the gasoline tax, a major source of revenue
used by government to build transportation systems.
If energy costs for personal and freight transportation can remain stable by bringing
alternative sources into common usage, then travel demand is expected to grow at a
similar pace as it has over the past 20 years.
Another possible scenario for the SLRTP 2035 is that transportation energy costs will be
unstable. This instability could be a pattern of relatively inexpensive gasoline and diesel
cost, spiked periodically by increasingly frequent increases in gasoline and diesel cost.
This instability, while causing significant disruptions in transportation economics and
individual choices, would precipitate a move towards stabilizing energy costs, resulting
in increased usage of alternative fuels and sources of energy for transportation.
17
National Academies Press, Available at; http://www.nap.edu/catalog.php?record_id=11585

The Statewide Long-Range Transportation Plan 2035
Economics, Demographics, Freight, and the Multimodal 2-21
Transportation System – Conditions and Trends
Factor 2: Climate Change Could Effect Transportation
Climate change may have several important implications for the Texas transportation
system by the end of the century. While these are beyond the timeframe for this plan, it
is nonetheless timely to consider possible impacts of climate change:18
Sea-level rise and increased storm surge during hurricanes may increase the risk
of major coastal impacts, including both temporary and permanent flooding at
airports, roads, rail lines, and tunnels,
Flooding from increasingly intense downpours may increase the risk of
disruptions and delays in air, rail, and road transportation, and damage from
erosion in some areas,
The increase in extreme heat may limit some transportation operations and
cause pavement and track damage. Decreased extreme cold could provide some
benefit such as reduced snow and ice removal costs, and
Increased intensity of strong hurricanes could lead to more evacuations,
infrastructure damage and failure, and transportation interruptions.
U.S. States Department of Transportation (USDOT) has provided some guidance on
possible steps to adapting to climate change.19
Factor 3: Urban Livability and Sustainability Goals Will Impact Transportation
Livability and sustainability are concepts that are likely to be central to future surface
transportation legislation. While new federal legislation is not expected soon, it is
appropriate to recognize how this may influence transportation planning over the life of
this plan.20 Some impacts could include an increased focus on transit and rail services,
transit-oriented development, smaller personal vehicles, and human powered modes,
e.g., bicycle/pedestrian.
In the past 20 years, Texans have moved toward more sustainable choices for
transportation, a trend that is expected to continue. Changes in Texas included the
following:
A revival of downtown and inner-city residential development and infill of central
metropolitan regions,
18
http://www.globalchange.gov/publications/reports/scientific-assessments/us-impacts/ 19
http://climate.dot.gov/impacts-adaptations/planning.html 20
http://fta.dot.gov/publications/publications_10935.html

The Statewide Long-Range Transportation Plan 2035
Economics, Demographics, Freight, and the Multimodal 2-22
Transportation System – Conditions and Trends
Development of three urban rail systems (in Dallas-Fort Worth, Houston and
Austin), and support for the development of more rail and streetcar systems,
An increasing desire for more bicycle and pedestrian opportunities for work,
shopping, and recreational travel purposes.
Factor 4: Changing Personal Travel Behavior Will Change Transportation Demand
Personal choices to change how and when Texans choose to travel will affect how the
transportation system is developed. While many of these changes are personal choices,
transportation agencies can encourage alternative travel times and modes using Travel
Demand Management (TDM). TDM provides an approach to better matching travel
demand with available travel options. Some examples of TDM measures include:
Dynamic and intelligent measures to increase vehicle occupancy, such as high-
occupancy vehicle (HOV) lanes, car/van pooling, increased use of existing
transit/paratransit, and addition of new transit services,
Information and communications technologies with new workplace practices,
including measures such as teleworking, telecommuting, and flextime,
Measures such as allowing greater use of night time hours for truck deliveries,
and changes in parking policies in both downtown and suburban areas,
Parking policy changes could include reduced parking requirement standards for
new developments, elimination of free parking spaces for employees in
congested areas, introduction of on-street parking charges, and residential area
parking policies. These measures may prove to be challenging in the short term
for institutional, logistical, and societal reasons.
Factor 5: New Technology Could Bring New Patterns of Transportation to Texas
New technology can bring changes to how and when Texans choose to travel, and the
economics of those decisions. Looking back 20 or 30 years, the advent of the internet
and communications has changed the transportation landscape. Vehicles are now safer
and more reliable. Changes in technology could bring changes in demand for
transportation to Texas.
One example of a change in technology that is envisioned for intercity travel in the U.S.
is high-speed rail service connecting large metropolitan areas. In April 2009, USDOT
published its Vision of High-Speed Rail in America.21 This includes several lines in
21
Federal Rail Administration Vision of High-Speed Rail in America
http://www.fra.dot.gov/downloads/Research/FinalFRA_HSR_Strat_Plan.pdf

The Statewide Long-Range Transportation Plan 2035
Economics, Demographics, Freight, and the Multimodal 2-23
Transportation System – Conditions and Trends
Texas that if developed as high-speed rail facilities, could result in new options for travel
between San Antonio, Dallas and points north, and between Houston and points east.
Another example of an advanced technology that could change transportation demand
is ITS. Global Positioning Systems (GPS) navigation, instant routing services, dynamic
traffic signal systems, and other advanced traffic management techniques could have a
large impact on the need for new capacity.
2.4.3 Forecast Vehicle Miles of Travel Methodology
Demand for roads is typically measured in vehicle miles of travel (VMT). VMT is the
total daily vehicles that use a road multiplied by the length of the roadway. One car
travelling for 1 mile equals one vehicle mile of travel. Two cars travelling for 2 miles are
four VMT, and so on.
Forecasts for 2035 VMT were developed by using the RHiNO trend line method for the
rural areas and urban network models for urban areas. The RHiNO trend line method
uses a historical series of traffic counts to create a trend line of traffic for each segment
of roadway to 2028. The trend line method was extended from 2028 to 2035. Urban
network models are used to forecast the number of trips, their destination, and route,
and in some urban areas, the mode used to make the trip. The urban network models
reflect the capacity improvements documented in the urban area long-range plans.
2.4.4 Forces Affecting VMT Growth in Texas
VMT are the basic measurement of traffic on roadways, which includes personal autos
commercial trucks. The main driving forces behind the predicted increases in VMT
include:
Population growth – as population continues to increase, more people use the
roadways.
The need for delivery of goods – increasing population requires more goods to
be transported, much of which is done by commercial trucks.
The quantity of travel per person – as the urban and suburban areas expand, the
average miles driven per day per person also increases. Expanding urban areas
create more opportunities for work, home, and business locations across a larger
urban area.
Increasing imports and exports to Texas ports drive growth in transporting goods
from maritime ports to Texas and the rest of the U.S.

The Statewide Long-Range Transportation Plan 2035
Economics, Demographics, Freight, and the Multimodal 2-24
Transportation System – Conditions and Trends
Increasing imports and exports to international border gateways has a similar
effect.
Increasing flows of passenger and freight travel across the east-west and north-
south interstate and US routes through Texas.
Expanding tourist and business opportunities in Texas increases nonresident
vacation and business conference attendance.
2.4.5 VMT and Population Growth
Figure 2-14 shows that the average daily VMT is expected to grow faster than
population by 2035. VMT is predicted to grow 72 percent, while population will grow by
43 percent over 2008 measured levels. While some of this faster growth in VMT is
attributable to increased trip length and number of trips per person, much of the higher
growth rate in VMT is because of truck and commercial vehicle travel.
Figure 2-14: VMT, Population, and Lane Miles, 1985–203522
Table 2-7 and Figure 2-15 indicate the different growth rates between passenger autos
and commercial trucks. While passenger auto VMT is expected to increase by
22
Historical Lane Mileage and VMT, 1985, 1990, 1995, 2000, 2005 – Highway Performance Monitoring System (HPMS),
USDOT; Historical population, 1985, 1990, 1995, 2000 – U.S. Census; Projected population, 2005 and 2035 –TSDC, 0.5 growth scenario; 2035 Projected VMT – TxDOT Roadway-Highway Inventory Network (RHiNO) and urban network travel demand model analysis; 2035 Projected Lane Mileage – TxDOT RHiNO, TxDOT UTP, urban network models as of May 2010; All projections interpolated for 2010, 2015, 2020, 2025, and 2030 for graphical presentation.
0%
20%
40%
60%
80%
100%
120%
140%
160%
180%
200%
1985 1990 1995 2000 2005 2008 2010 2015 2020 2025 2030 2035
Pe
rce
nt
Ch
an
ge
fro
m 1
98
5
VMT Population Lane Miles
The Statewide Long-Range Transportation Plan 2035
Economics, Demographics, Freight, and the Multimodal 2-25
Transportation System – Conditions and Trends
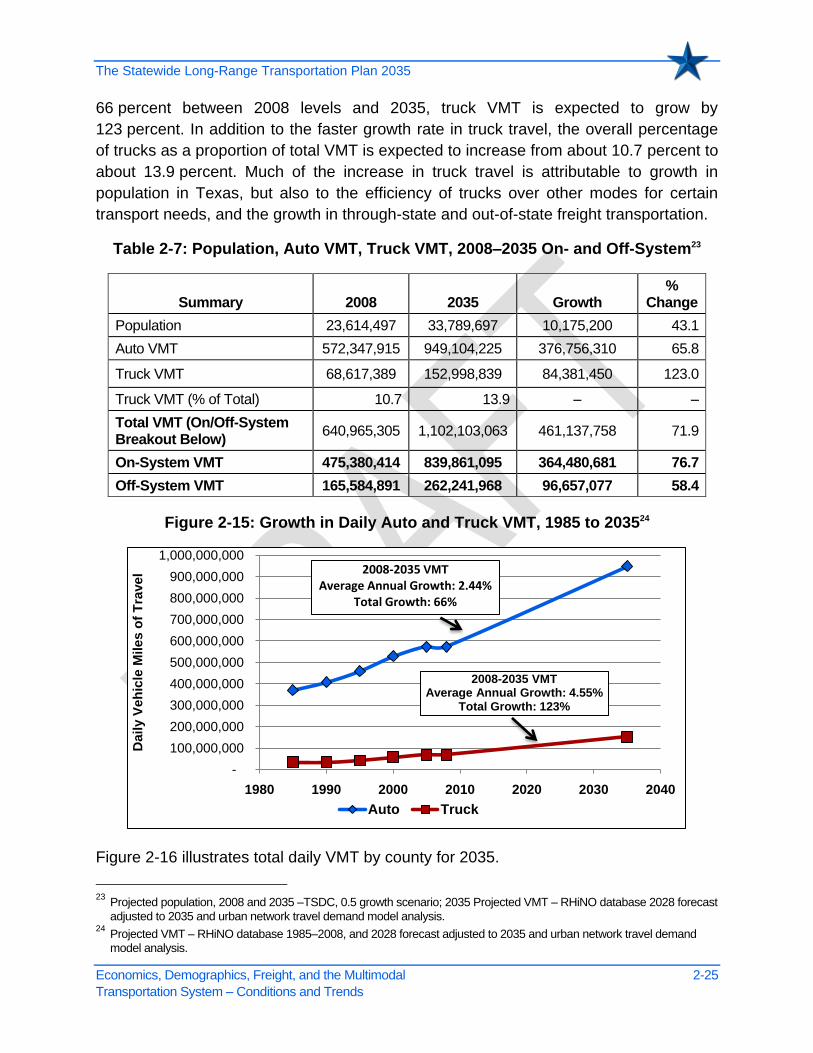
66 percent between 2008 levels and 2035, truck VMT is expected to grow by
123 percent. In addition to the faster growth rate in truck travel, the overall percentage
of trucks as a proportion of total VMT is expected to increase from about 10.7 percent to
about 13.9 percent. Much of the increase in truck travel is attributable to growth in
population in Texas, but also to the efficiency of trucks over other modes for certain
transport needs, and the growth in through-state and out-of-state freight transportation.
Table 2-7: Population, Auto VMT, Truck VMT, 2008–2035 On- and Off-System23
Summary 2008 2035 Growth %
Change
Population 23,614,497 33,789,697 10,175,200 43.1
Auto VMT 572,347,915 949,104,225 376,756,310 65.8
Truck VMT 68,617,389 152,998,839 84,381,450 123.0
Truck VMT (% of Total) 10.7 13.9 – –
Total VMT (On/Off-System Breakout Below)
640,965,305 1,102,103,063 461,137,758 71.9
On-System VMT 475,380,414 839,861,095 364,480,681 76.7
Off-System VMT 165,584,891 262,241,968 96,657,077 58.4
Figure 2-15: Growth in Daily Auto and Truck VMT, 1985 to 203524
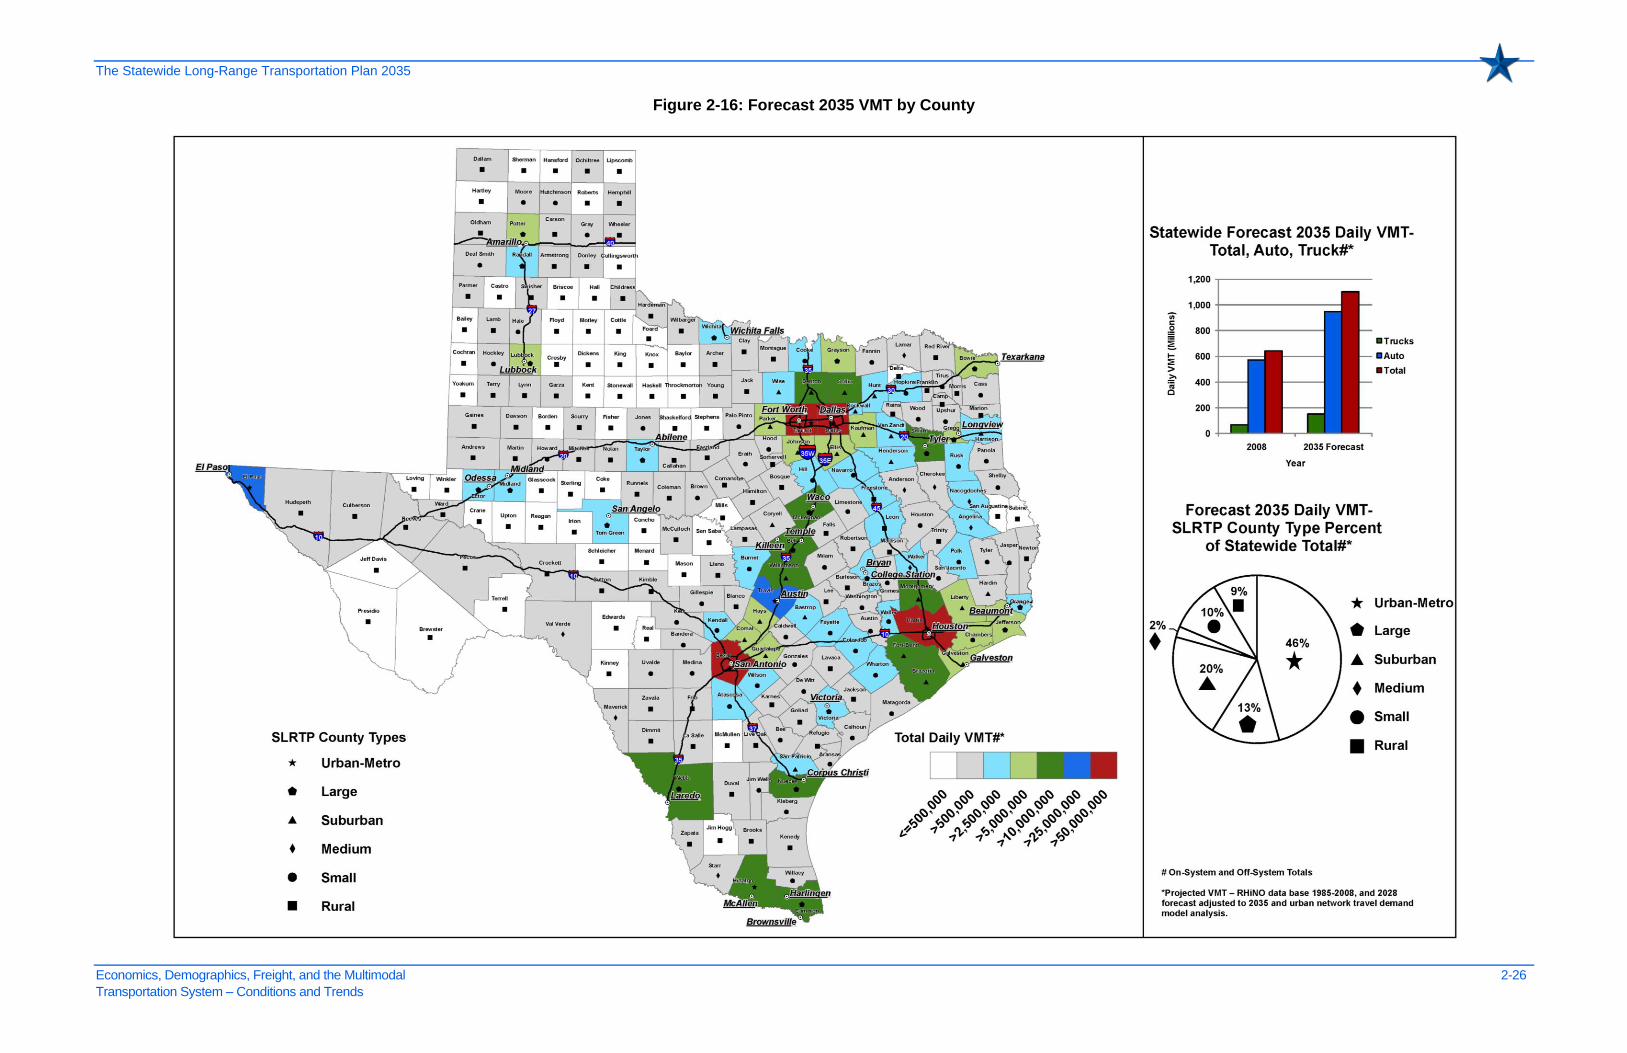
Figure 2-16 illustrates total daily VMT by county for 2035.
23
Projected population, 2008 and 2035 –TSDC, 0.5 growth scenario; 2035 Projected VMT – RHiNO database 2028 forecast
adjusted to 2035 and urban network travel demand model analysis. 24
Projected VMT – RHiNO database 1985–2008, and 2028 forecast adjusted to 2035 and urban network travel demand
model analysis.
-
100,000,000
200,000,000
300,000,000
400,000,000
500,000,000
600,000,000
700,000,000
800,000,000
900,000,000
1,000,000,000
1980 1990 2000 2010 2020 2030 2040
Da
ily V
eh
icle
Mile
s o
f T
rave
l
Auto Truck
2008-2035 VMT
Average Annual Growth: 2.44%Total Growth: 66%
2008-2035 VMTAverage Annual Growth: 4.55%
Total Growth: 123%
The Statewide Long-Range Transportation Plan 2035
Economics, Demographics, Freight, and the Multimodal 2-26
Transportation System – Conditions and Trends
Figure 2-16: Forecast 2035 VMT by County

The Statewide Long-Range Transportation Plan 2035
Economics, Demographics, Freight, and the Multimodal 2-27
Transportation System – Conditions and Trends
2.4.6 The Geography of Texas Auto and Truck VMT Growth
Figure 2-17 shows the growth in VMT in the highest 20 counties in Texas ranked by
total 2035 VMT. Harris County dominates the growth in auto and truck VMT. It is
important to note that Dallas and Tarrant Counties are considered one metropolitan
area although they are shown separately on this chart. This chart shows the increase in
VMT from 2008 to 2035. After the largest metropolitan counties, most of the remaining
fastest growing counties are suburban to these core metropolitan counties. However,
included in the top 20 counties are other individual large counties, such as El Paso and
Nueces counties.
Figure 2-17: Daily Auto and Truck VMT Growth, 2008–2035, in Top 20 Counties25
Table 2-8 shows the 2008 and 2035 auto, truck and total daily VMT and percent change
by type of county type. Figure 2-18 illustrates VMT growth by county type. While much
of the growth in both population and VMT by 2035 will occur in urban-metro counties, all
areas will see a significant percent change in VMT. All county types (not all counties
individually) will see a rise of more than 50 percent in VMT. This chart shows that in
more urbanized regions of the state, VMT growth is more closely tied to population
growth than in rural areas. In contrast, VMT will grow by over 60 percent in rural areas,
25
Sources: Projected VMT – RHiNO database 2008 and 2028 forecast adjusted to 2035 and urban network travel demand
model analysis.
-
10,000,000
20,000,000
30,000,000
40,000,000
50,000,000
60,000,000
70,000,000
80,000,000
90,000,000
VM
T C
ha
ng
e 2
00
8 t
o 2
03
5
Auto VMT Growth 2008-2035 Truck VMT Growth 2008-2035

The Statewide Long-Range Transportation Plan 2035
Economics, Demographics, Freight, and the Multimodal 2-28
Transportation System – Conditions and Trends
while population increases by only 12 percent, indicating that growth in VMT in these
counties is tied more closely to trucks and autos generated outside the county.
Table 2-8: Total Daily VMT by County Type On- and Off-System Roads, 2008–203526
Summary
Urban – Metro
Large City Suburban Medium Small Rural Total
2008
Auto VMT 278,677,645 84,167,975 101,502,596 11,500,162 53,575,684 42,923,853 572,347,915
Truck VMT 18,006,787 10,884,740 12,788,259 2,187,325 11,180,160 13,570,118 68,617,389
Total VMT 296,684,433 95,052,716 114,290,855 13,687,487 64,755,844 56,493,970 640,965,305
Population 11,903,007 3,747,564 4,427,349 546,767 1,857,473 1,132,337 23,614,497
- 2035
Auto VMT 462,662,358 120,712,594 195,756,808 18,184,470 87,751,643 64,036,351 949,104,225
Truck VMT 41,193,896 24,760,372 28,706,167 4,698,803 23,758,544 29,881,057 152,998,839
Total VMT 503,856,254 145,472,965 224,462,975 22,883,273 111,510,188 93,917,408 1,102,103,063
Population 17,028,201 4,852,359 7,583,884 696,821 2,356,424 1,272,008 33,789,697
- % Change 2008–2035
Auto VMT 66.0 43.4 92.9 58.1 63.8 49.2 65.8
Truck VMT 128.8 127.5 124.5 114.8 112.5 120.2 123.0
Total VMT 69.8 53.0 96.4 67.2 72.2 66.2 71.9
Population 43.1 29.5 71.3 27.4 26.9 12.3 43.1
While high growth in truck travel is to be expected in counties where population is
growing the fastest, it is important to note that truck travel in rural areas is also expected
to grow significantly. This growth in truck VMT in rural counties is a result of the many
miles of connecting roadways crossing these counties including in particular the
interstate system.
26
Sources: Projected VMT – RHiNO database 2008 and 2028 forecast adjusted to 2035 and urban network travel demand
model analysis.

The Statewide Long-Range Transportation Plan 2035
Economics, Demographics, Freight, and the Multimodal 2-29
Transportation System – Conditions and Trends
Figure 2-18: Daily VMT by County Type, 1990–203527
While Table 2-8 shows the expected growth in VMT for each county type, Table 2-9
shows where the total growth is expected to occur. Urban-metro counties and adjacent
suburban counties will account for 69 percent of the growth in VMT in Texas by 2035
(45 percent plus 24 percent, respectively).
Table 2-9: Percent of Total Daily VMT Growth by County Type, 2008–2035
County Type % of Total
Growth % of Auto
Growth
% of Truck
Growth
Urban-Metro 45 49 27
Large 11 10 16
Suburban 24 25 19
Medium 2 2 3
Small 10 9 15
Rural 8 6 19
Total 100 100 100
27
Sources: Projected VMT – RHiNO database 1990, 2000, 2008, and 2028 forecast adjusted to 2035 and urban network
travel demand model analysis.
-
100,000,000
200,000,000
300,000,000
400,000,000
500,000,000
600,000,000
1990 2000 2008 2035
Dail
y V
MT
Rural Small Suburban
Large Urban - Metro Medium

The Statewide Long-Range Transportation Plan 2035
Economics, Demographics, Freight, and the Multimodal 2-30
Transportation System – Conditions and Trends
2.4.7 Forecast Traffic Congestion Levels (On-System Roads Only)
While it is important to inventory the Texas roadway system and total travel in the state,
it is also important to measure the roadway traffic conditions expected by 2035.
Congestion is a term heard often when discussing highway traffic conditions, and there
are many definitions. The Texas Transportation Institute (TTI) has an ongoing
monitoring study called the Urban Mobility Report (http://mobility.tamu.edu/ ) that uses
consistent methods to measure congestion. The SLRTP uses one of TTI’s methods.
Using the RHiNO database, a basic measure of congestion can be obtained by dividing
the Average Daily Traffic (ADT) into the number of lanes on each segment, yielding an
ADT per lane. Table 2-10 shows the thresholds of ADT per lane for each level of
congestion.
Table 2-10: Daily Traffic Volume per Lane Congestion Calculation28
Facility and Congestion Level
Daily Traffic Volume per Lane
Freeway
Uncongested Under 15,000
Medium 15,001–17,500
Heavy 17,501–20,000
Severe 20,001–25,000
Extreme Over 25,000
Arterial
Uncongested Under 5,500
Medium 5,501–7,000
Heavy 7,001–8,500
Severe 8,501–10,000
Extreme Over 10,000
Clearly, there are many special situations on certain segments of roadway that cause
traffic bottlenecks and delays. These special situations, including inclement weather
conditions, are not represented by this basic measure.
A representative summary of the overall traffic conditions can be obtained by
aggregating the VMT on roadways that fall into each congestion level. Table 2-11
28
2009 Urban Mobility Report, TTI.

The Statewide Long-Range Transportation Plan 2035
Economics, Demographics, Freight, and the Multimodal 2-31
Transportation System – Conditions and Trends
shows daily VMT on the state roadway system for each level of congestion for 2008 and
2035.
Table 2-11: VMT by Congestion Level On-System Roads, 2008–203529
Summary
Freeway Arterial
2008 2035 2008 2035
VMT
% of Total VMT
% of Total VMT
% of Total VMT
% of Total
Uncongested 97,929,466 45.6 130,610,584 32.7 186,138,452 71.4 227,722,248 51.8
Medium 22,404,813 10.4 33,261,069 8.3 25,706,170 9.9 52,087,778 11.8
Heavy 17,578,520 8.2 28,856,963 7.2 17,366,898 6.7 45,276,220 10.3
Severe 37,538,930 17.5 54,728,298 13.7 9,818,812 3.8 31,045,088 7.1
Extreme 39,288,495 18.3 152,565,588 38.1 21,609,858 8.3 83,707,262 19.0
% ≥ Heavy 44.0 59.0 18.7 36.4
Total 214,740,224 400,022,501 260,640,190 439,838,594
Figure 2-19 and Figure 2-20 show the breakout by county type of VMT on the state
roadway system in the heavy or greater level of congestion for 2008 and 2035. While 67
percent of freeway travel is currently occurring in heavy or worse congestion in urban-
metro counties, this is expected to grow to over 80 percent of travel by 2035.
Additionally, given current trends, the percentage of VMT operating at heavy or greater
level of congestion on freeways and arterials in large, suburban, medium, and small
county types is expected to increase by 2035.
29
Projected VMT – RHiNO database 2008 and 2028 forecast adjusted to 2035 and urban network travel demand model
analysis. 2009 Urban Mobility Report, TTI.

The Statewide Long-Range Transportation Plan 2035
Economics, Demographics, Freight, and the Multimodal 2-32
Transportation System – Conditions and Trends
Figure 2-19: Percent of Freeway VMT at Heavy or Greater Congestion by County Type, On-System Roads30
Figure 2-20: Percent of Arterial VMT at Heavy or Greater Congestion by County Type, On-System Roads31
30
Ibid 31
Ibid
67%
5%
25%
0% 0% 0%
80%
20%
49% 52%
12%
1%
0%5%
10%15%20%25%30%35%40%45%50%55%60%65%70%75%80%85%90%95%
100%
Urban - Metro Large Suburban Medium Small Rural
Pe
rcen
t o
f V
MT
2008
2035
48%
8%
21%
11%
1% 0%
66%
20%
47%
36%
18%
7%
0%5%
10%15%20%25%30%35%40%45%50%55%60%65%70%75%80%85%90%95%
100%
Urban -Metro
Large Suburban Medium Small Rural
Pe
rce
nt
of
VM
T
2008
2035

The Statewide Long-Range Transportation Plan 2035
Economics, Demographics, Freight, and the Multimodal 2-33
Transportation System – Conditions and Trends
2.5 Texas Bridges
Figure 2-21 shows the number and distribution of Texas’ 51,300 on- and off-system
bridges in Texas.
On-system bridges are vehicular bridges that are located on the designated state
highway system, owned and maintained by TxDOT, and typically funded with a
combination of federal and state or state-only funds.
Off-system bridges are not part of the designated state highway system and are under
the direct jurisdiction of the local government such as a county, city, other political
subdivision of the state, or special district with authority to finance a highway
improvement project.
Figure 2-21: Texas Bridge Classification 201032
The correlation between the age of bridges and their need for special maintenance
predicts the need for resources to support bridge replacement and rehabilitation. In
addition, on-system Texas bridges built after 1900 can be classified by significant
changes in the design criteria that governed their construction:
Built before 1950—Bridges generally designed for less than the current state
legal load.
Built between 1950 and 1970—Bridges generally required to accommodate the
minimum design load or higher recommended by the American Association of
State Highway and Transportation Officials (AASHTO), but may be narrower than
their approach roadways. A number of these bridges are too narrow to meet
32
TxDOT BRINSAP Database
17,790 35%
33,510 65%
Off-System
On-System

The Statewide Long-Range Transportation Plan 2035
Economics, Demographics, Freight, and the Multimodal 2-34
Transportation System – Conditions and Trends
current requirements. (Required bridge load capacity is described in detail in
TxDOT’s Bridge Inspection Manual.)
Built after 1970—Bridges generally required to accommodate the minimum
design load or higher recommended by the AASHTO and must be at least as
wide as their approach roadways.
Figure 2-22 shows the number of bridges constructed during the periods described
above.
Figure 2-22: Time Period of Bridge Construction33
The federal criterion for bridge replacement is a sufficiency rating of 50 or below. A
statistical analysis on the Bridge Inventory, Inspection and Appraisal Program
(BRINSAP) database from 1997 through 2007 performed by the Center for
Transportation Research for 2030 Committee Transportation Needs Report determined
that on-system bridges typically reach this threshold at 55 years of age. Similar analysis
for off-system bridges yields a value of 50 years of age. The values were developed to
33
TxDOT BRINSAP Database
1,672
12,853
18,985
0
1,7322,543
13,512
3
0
2,000
4,000
6,000
8,000
10,000
12,000
14,000
16,000
18,000
20,000
Nu
mb
er
of
Bri
dg
es
On-system Off-system

The Statewide Long-Range Transportation Plan 2035
Economics, Demographics, Freight, and the Multimodal 2-35
Transportation System – Conditions and Trends
achieve a 10 percent probability that the age of replacement is less than the calculated
value.34
Data from BRINSAP indicate that Texas will experience one of the first sizeable ―bridge
reconstruction cycles‖ during this plan period (2010–2035). Based on an estimated
service life of 55 years for on-system bridges, more than 15,000 bridges constructed
between 1955 and 1980 will be considered potential candidates for replacement during
the needs analysis. One quarter of these bridges were constructed in just three urban
districts: Dallas, San Antonio, and Fort Worth—in the wake of post-war economic
growth, implementation of the interstate system, and freeway development in the larger
cities. Many of the remaining on-system structures during this timeframe appear to be
related to the addition of mileage to the farm-to-market system in districts such as
Waco, San Angelo, and Yoakum.
For off-system bridges, over 5,000 of the 17,800 structures were also built between
1955 and 1985, especially by large municipalities, cities, counties and developers of
new residential and commercial neighborhoods in the suburban areas. Over half of
these bridges are located in the largest urban areas of the period: Houston, Dallas, Fort
Worth, and San Antonio.
The distribution of the on-system bridges indicates the decade in which most of the
interstate construction was accomplished (1960s) and the decade of major construction
efforts in each of the large districts. The off-system bridges track with the amount of
residential and commercial development to accommodate the rapid growth in the state
since 1980.
The number of bridges does not provide an indication of the size of bridges. The size of
the bridge deck, measured in square feet, is used to compare bridge sizes. Figure 2-23
and Figure 2-24 show the distribution of deck area by age for on- and off-system
bridges.
For on-system bridges, spikes in the graph can be associated with bridge work with
major freeway construction/reconstruction projects. The 1960s reflected major efforts on
the first wave of urban freeways as well as interstate construction. The spike in 1989
includes the Downtown Y in San Antonio. The 1990s encompassed the reconstruction
of North Central Expressway in Dallas. The spike in 2007 is associated with the opening
of SH 45, Loop 1, and SH 130 in Central Texas.
34
TxDOT 2030 Committee Texas Transportation Needs Report, 2009

The Statewide Long-Range Transportation Plan 2035
Economics, Demographics, Freight, and the Multimodal 2-36
Transportation System – Conditions and Trends
For off-system bridges, the amount of deck area tracks with population gains and
economic prosperity of the mid- to late 1980s and the first decade of this century. The
economic downturns in 2002, 2003, and 2008 clearly track the reduction in new housing
and commercial developments.
Figure 2-23: Distribution of Deck Area by Year Built for On-System Roadways35
Figure 2-24: Distribution of Deck Area by Year Built for Off-System Roadways36
35
TxDOT BRINSAP Database 36
Ibid
0
2,000,000
4,000,000
6,000,000
8,000,000
10,000,000
12,000,000
14,000,000
16,000,000
18,000,000
19
20
19
25
19
30
19
35
19
40
19
45
19
50
19
55
19
60
19
65
19
70
19
75
19
80
19
85
19
90
19
95
20
00
20
05
20
10
Dec
k A
rea S
qu
are
Fe
et
Year Built
0
2,000,000
4,000,000
6,000,000
8,000,000
10,000,000
12,000,000
14,000,000
16,000,000
18,000,000
19
20
19
25
19
30
19
35
19
40
19
45
19
50
19
55
19
60
19
65
19
70
19
75
19
80
19
85
19
90
19
95
20
00
20
05
20
10
Deck A
rea S
qu
are
Fe
et
Year Built

The Statewide Long-Range Transportation Plan 2035
Economics, Demographics, Freight, and the Multimodal 2-37
Transportation System – Conditions and Trends
Table 2-12 shows distribution of bridges by bridge length. The longest on-system bridge
in Texas is the Sabine River/Toledo Bend Bridge on SH 21 at 13,196 feet. The longest
off-system bridge in Texas is the Pharr/Reynosa Bridge over the Rio Grande at
15,770 feet.
Table 2-12: Bridges by Length37
Bridge Length
On-System Bridges Off-System Bridges
Over Waterway
Not Over Waterway Total*
Over Waterway
Not Over Waterway Total*
< 30 feet 5,707 4 5,711 3,098 4 3,102
30–100 feet 10,213 132 10,345 10,502 106 10,608
100–250 feet 6,068 3,376 9,444 2,759 202 2,961
250–400 feet 1,511 2,663 4,174 445 123 568
400–1,000 feet 1,429 1,142 2,571 286 108 394
1,000–2,500 feet 466 492 958 68 61 129
2,500 feet–1 mile 112 132 244 14 9 23
1–2 miles 30 24 54 3 0 3
≥ 2 mile 5 2 7 1 0 1
Totals 25,541 7,967 33,508 17,176 613 17,789
*Note: Totals differ from Figure 2-21 due to incomplete data records for a total of three bridges.
2.5.1 Texas Bridge Conditions
The standard definitions for condition of bridges are as follows:
Structurally Deficient: A structurally deficient bridge is one with routine
maintenance concerns that do not pose a safety risk or one that is frequently
flooded. To remain open to traffic, structurally deficient bridges are often posted
with reduced weight limits that restrict the gross weight of vehicles using the
bridges.
Functionally Obsolete: Classification as functionally obsolete means the bridge
met current design standards when built, but over time has become obsolete due
to an increase in traffic volume. Functionally obsolete bridges are those that do
not have adequate lane widths, shoulder widths, or vertical clearance to serve
current traffic demands or are occasionally flooded.
Substandard-for-Load-Only: The term ―substandard-for-load-only‖ is used by
TxDOT to designate bridges in relatively good condition that do not have specific
maintenance concerns, but do have a load-carrying capacity less than the state
37
Ibid

The Statewide Long-Range Transportation Plan 2035
Economics, Demographics, Freight, and the Multimodal 2-38
Transportation System – Conditions and Trends
legal limit for public roadways. Substandard-for-load-only bridges are posted with
reduced weight limits. These bridges are not classified as structurally deficient or
functionally obsolete under Federal Highway Administration (FHWA) definitions.
Table 2-13 shows the condition of Texas bridges as of March 2010.
Table 2-13: Condition of Texas Bridges, March 201038
Rating Bridges Percent
On-System (33,510 bridges)
Substandard for Load Only 93 0.28
Structurally Deficient 328 0.98
Functionally Obsolete 3,514 10.49
Off-System (17,790 bridges)
Substandard for Load Only 1,085 6.10
Structurally Deficient 1,281 7.20
Functionally Obsolete 3,979 22.37
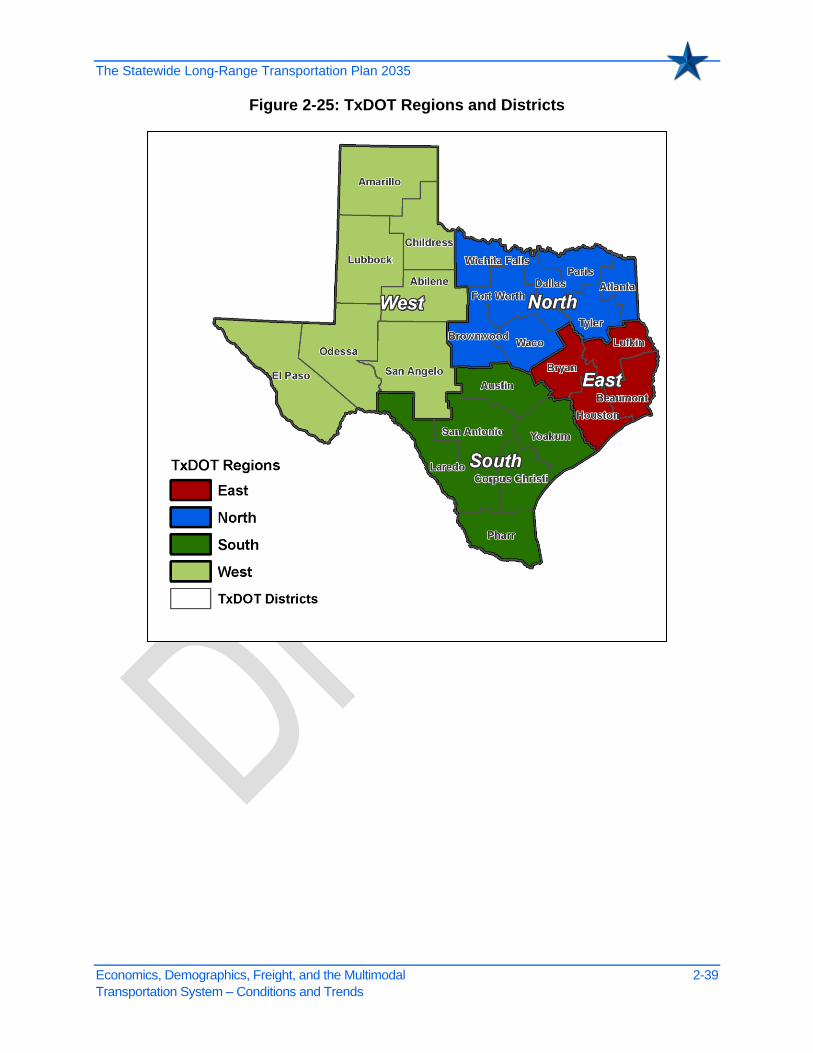
Figure 2-26 and Figure 2-27, provide a comparison of bridges in each of the four
TxDOT regions (Figure 2-25) and show the distribution of functionally obsolete and
structurally deficient bridges.
38
Ibid
The Statewide Long-Range Transportation Plan 2035
Economics, Demographics, Freight, and the Multimodal 2-39
Transportation System – Conditions and Trends
Figure 2-25: TxDOT Regions and Districts

The Statewide Long-Range Transportation Plan 2035
Economics, Demographics, Freight, and the Multimodal 2-40
Transportation System – Conditions and Trends
Figure 2-26: Functionally Obsolete Bridges by Region, March 201039
Figure 2-27: Structurally Deficient Bridges by Region, March 201040
39
Ibid 40
TxDOT BRINSAP Database
0 500 1,000 1,500 2,000
NORTH
SOUTH
EAST
WEST
Number of functionally obsolete bridges
Off-System Bridge
On-System Bridge
0 200 400 600 800
NORTH
SOUTH
EAST
WEST
Number of structurally deficient bridges
Off-System Bridge
On-System Bridge

The Statewide Long-Range Transportation Plan 2035
Economics, Demographics, Freight, and the Multimodal 2-41
Transportation System – Conditions and Trends
The Texas Transportation Commission established the goal of achieving 80 percent of
the bridges rated in good or better condition by September 2011.41 Bridges are
considered in ―good or better‖ condition if they are not structurally deficient, functionally
obsolete or substandard-for-load-only. Figure 2-28 summarizes the progress towards
achieving this goal.
Table 2-14: On and Off System Bridge Ratings by Year42
Fiscal Year Good or Better (%)
2001 70%
2002 71%
2003 75%
2004 76%
2005 76%
2006 77%
2007 78%
2008 78%
2009 79%
2010 80%
Goal 2011 80%
Figure 2-28: Reduction in On-System Structurally-Deficient Bridges by Year, 2001–201043
41
Transportation Commission Minute Order 108608, August 30, 2001 42
TxDOT Bridge Facts, 2001-2009 43
Transportation Commission Minute Order 108608, August 30, 2001
763
693645 565 528
483
421
354325 328
0
100
200
300
400
500
600
700
800
900
2001 2002 2003 2004 2005 2006 2007 2008 2009 2010
Str
uctu
rall
y D
efi
cie
nt
Bri
dg
es
Fiscal Year

The Statewide Long-Range Transportation Plan 2035
Economics, Demographics, Freight, and the Multimodal 2-42
Transportation System – Conditions and Trends
TxDOT expended $3.9 billion over the last nine fiscal years to achieve the progress in
replacing bridges. Figure 2-29 and Figure 2-30 show the value of construction contracts
to replace or rehabilitate existing bridges and contracts to build new bridges over this
time period.
Figure 2-29: Value of Rehab/Replace Bridge Contracts, 2001–200944
Figure 2-30: Value of New Location Bridge Contracts, 2001–200945
44
TxDOT Bridge Facts, 2001–2009 45
TxDOT Bridge Facts, 2001–2009
0
50
100
150
200
250
300
350
400
450
$0
$100
$200
$300
$400
$500
$600
$700
2001 2002 2003 2004 2005 2006 2007 2008 2009
Nu
mb
er
of
co
ntr
acts
Valu
e o
f C
on
trac
t (M
illi
on
$)
Fiscal Year
On-System Contract
Off-System Contract
On-System Number
Off-System Number
0
50
100
150
200
250
300
350
$0
$100
$200
$300
$400
$500
$600
$700
$800
2001 2002 2003 2004 2005 2006 2007 2008 2009
Num
ber
of con
tra
cts
Valu
e o
f C
ontr
act
(Mill
ion $
)
Fiscal Year
On-System Contract
Off-System Contract
On-System Number
Off-System Number

The Statewide Long-Range Transportation Plan 2035
Economics, Demographics, Freight, and the Multimodal 2-43
Transportation System – Conditions and Trends
2.6 Texas Pavements
2.6.1 Texas Pavement Types
For Routine Maintenance/Preventative/Rehabilitative Maintenance (RM/PRM) planning
purposes, TxDOT groups pavements into three general categories. Figure 2-31 shows
the general distribution of each pavement type within the TxDOT system.
Figure 2-31: Pavement Types46
Asphaltic concrete pavement (ACP) is by far the most common type of pavement
on the TxDOT system. This category also includes the sealed flexible base
sections found on most farm-to-market roads.
Continuously reinforced concrete pavement (CRCP) is primarily found on high
volume roadways and uses steel reinforcement to manage concrete cracking in a
controlled manner.
As the name implies, joints are constructed at regular intervals, creating jointed
concrete pavement (JCP) slabs. Reinforcing steel use varies widely in JCP.
2.6.2 Texas Pavement Conditions
Pavement conditions on existing Texas roadways are affected by a number of variables
such as age, traffic volume, number and size of heavy trucks, weather, strength and
46
TxDOT Construction Division, 2010
Asphaltic Concrete
92%
Continuously Reinforced Concrete
6%
Jointed Concrete
2%

The Statewide Long-Range Transportation Plan 2035
Economics, Demographics, Freight, and the Multimodal 2-44
Transportation System – Conditions and Trends
stability of underlying soils, stormwater and internal drainage, and the type/quality of the
initial pavement construction. RM/PRM must be systematically performed to counter the
combined impacts of these variables.
The process for planning, budgeting, and scheduling pavement RM/PRM generally
includes development and maintenance of a pavement inventory, regular measurement
of the existing pavement conditions, and identification and prioritization of RM/PRM
needs.
Several terms have specific meanings when used in discussions about pavement
conditions.
Distress rating – A numerical value used to quantify the extent of pavement
distress for a particular roadway section. The distress rating is one of the two key
measurements used to define overall pavement conditions.
Ride quality measurement – A directly measured numerical value used to
quantify the smoothness or roughness of pavements. It is the second key
measurement used to quantify overall pavement conditions.
Pavement distress – A general term used to describe pavement that has
deteriorated from any combination of variable factors. Descriptive terms such as
―rutting,‖ ―cracking,‖ ―potholes,‖ ―patched areas,‖ and ―punchouts‖ all refer to
pavement distress.
Ride quality – This term is used to describe the smoothness of pavement
surfaces.
Pavement condition is a composite numerical value calculated from pavement
distress ratings and ride quality measurements taken for a specific section of
roadway. TxDOT annually calculates new pavement condition scores – in
roughly half-mile sections – for the entire roadway system not under construction.
TxDOT’s Pavement Management Information System (PMIS) is a statewide program
that annually collects on-site measurements of pavement distress ratings, ride quality
measurements, and composite pavement condition scores to show trends and overall
RM/PRM needs for the TxDOT system.
A general snapshot of the pavement conditions is also generated to meet a specific
Departmental goal. In August 2001, the Texas Transportation Commission set a
statewide goal to have 90 percent of Texas pavements in ―good‖ or better condition

The Statewide Long-Range Transportation Plan 2035
Economics, Demographics, Freight, and the Multimodal 2-45
Transportation System – Conditions and Trends
within 10 years. 47 ―Good‖ condition is defined as a composite pavement condition score
of 70 or higher for a particular section of roadway. The pavement condition scores
collected within PMIS will need to be at least 70 for roughly 90 percent of the roadway
sections to meet this goal.
Although pavement condition scores improved slightly from 2003 to 2005, scores are
again declining. The goal of 90 percent of the pavement in ―Good‖ or better condition
has not been met. Figure 2-32 provides a summary of the overall pavement condition
scores since 1997.
Figure 2-32: Percentage of Roads with Good or Better Condition, Fiscal Year
1997–201048
47
Transportation Commission Minute Order 108608, August 30, 2001 48
TxDOT Construction Division, 2010
84
.32
%
85
.22
%
84
.96
%
84
.93
%
84
.37
%
84
.22
%
85
.28
%
87
.02
%
87
.34
%
86
.69
%
86
.76
%
86
.27
%
85
.94
%
86
.97
%
0%
10%
20%
30%
40%
50%
60%
70%
80%
90%
100%
1997 1998 1999 2000 2001 2002 2003 2004 2005 2006 2007 2008 2009 2010
PE
RC
EN
TA
GE
OF
PA
VE
ME
NT
S W
ITH
"G
OO
D" O
R B
ET
TE
R
CO
ND
ITIO
N S
CO
RE
S
YEAR
STATEWIDE % "GOOD" OR BETTER
STATEWIDE TARGET: CONDITION SCORES OF "GOOD" OR BETTER ON 90%
OF TxDOT ROADS BY END OF FY 2011

The Statewide Long-Range Transportation Plan 2035
Economics, Demographics, Freight, and the Multimodal 2-46
Transportation System – Conditions and Trends
As demand increases, particularly truck traffic, the wear and tear on Texas’ highways
increases. Added to this increasing need for maintenance is severely limited funding to
repair roads. A significant difference exists between TxDOT’s projected PRM funding for
2010–2035 and the pavement maintenance funding needs recently identified by the
Center for Transportation Research. A clear portrayal of the cumulative effect of the
PRM funding deficit is presented on Figure 2-33, which shows the dramatic decline in
PMIS pavement condition scores predicted by the Center for Transportation Research
(CTR) pavement deterioration model under TxDOT’s current projected PRM funding
levels through 2035. This figure shows that although TxDOT is close to meeting its goal
of 90 percent of pavements rated as good or better, current trends in funding lead to a
rapid decline in overall average statewide pavement rating. This decline, given current
funding trends, will cause Texas’ pavement scores to average less than 10 percent
good or better by 2035.
Figure 2-33: Projected Percentage of Lane Miles in Good or Better Condition
Figure 2-34 illustrates pavement conditions by TxDOT district.
0%
10%
20%
30%
40%
50%
60%
70%
80%
90%
100%
- 2005 2010 2015 2020 2025 2030 2035
"G
oo
d" o
r B
ett
er
Sc
ore
s
Year
Lane Miles
Measured
Performance
Predicted
Performance

The Statewide Long-Range Transportation Plan 2035
Economics, Demographics, Freight, and the Multimodal 2-47
Transportation System – Conditions and Trends
Figure 2-34: Percent of Total District Lane Miles Rated Good or Better

The Statewide Long-Range Transportation Plan 2035
Economics, Demographics, Freight, and the Multimodal 2-48
Transportation System – Conditions and Trends
2.7 Intelligent Transportation Systems
Since the early 1990s, ITS has been an important part of the Texas transportation
system. USDOT defines ITS as ―the integration of advanced communications
technologies into the transportation infrastructure and in vehicles.‖
ITS provides users with up-to-date information on incidents, weather conditions, and
congestion while improving the overall movement of vehicles through the monitoring of
traffic conditions at a centralized traffic management center (TMC). In addition, ITS
improves the flow of information to emergency responders, media outlets, and traffic
information providers—resulting in a safer and more efficient transportation system. ITS
can be a cost-effective tool to reduce congestion and improve air quality.
ITS technologies can cover a wide range of travel modes including transit and freight.
Advanced Public Transportation Systems (APTS) incorporate the latest technology into
transit systems to move passengers and vehicles efficiently. The freight industry and
businesses with large commercial fleets rely on ITS information for routing, dispatching,
and managing fleet operations.
2.7.1 Intelligent Transportation Systems Technologies and Operations
A variety of ITS technologies has been implemented over the last 20 years in Texas.
While roadway applications of ITS typically focus on state highways maintained by
TxDOT, other agencies such as cities, counties, toll roads, and transit authorities have
also implemented ITS into their overall systems.
The following are examples of ITS equipment currently deployed in Texas:
Traffic Management Centers (TMCs) are central hubs where highway, transit,
incident, and weather information unite. The largest TMCs include DalTrans &
TransVision in the Dallas-Fort Worth area, San Antonio’s TransGuide, and Houston’s
TranStar. Several city agencies have also implemented smaller scale TMCs that focus
on monitoring traffic signal timings throughout the city. An example is the City of Dallas’
TMC, where staff can detect signal malfunctions and change traffic signal timings
directly from the TMC.49
Some TMCs house multiple agencies. At Houston’s TranStar, officials from Harris
County, the City of Houston, Houston Metro, and TxDOT partner together to serve the
49
City of Dallas, http://www.dallascityhall.com/pwt/traffic_management_center.html, May 25, 2010

The Statewide Long-Range Transportation Plan 2035
Economics, Demographics, Freight, and the Multimodal 2-49
Transportation System – Conditions and Trends
mobility needs of the area. This cross-agency coordination has served the Houston area
well especially during hurricane evacuation and response.50
Dynamic Message Signs (DMS) are large signs with electronic messaging that convey
travel time, AMBER Alerts, weather, incident information, and safety messages to
drivers. While the great majority of DMS are located along freeways, cities like Dallas
have begun implementing DMS on arterial roadways in order to give drivers alternate
options when congestion occurs.51
Closed-Circuit Television (CCTV) cameras monitor traffic conditions and incidents by
providing real-time video to the TMC that the general public can access through
websites. This allows the TMC to apply the necessary measures to warn the user of the
impending condition and notify the appropriate emergency personnel. Cameras also
give cities the ability to detect malfunctions at signalized intersections. CCTV cameras
in Houston have been especially helpful before, during, and after hurricane evacuations.
Lane Control Signals (LCS) are mounted above the travel lane and give advance
warning to drivers of a lane closure due to incidents or construction.
Radar Detection uses electromagnetic waves to determine vehicular volumes, speed,
classification, and travel times between points. This data can be used for establishing
traffic patterns and calculating travel times between points. Dallas/Fort Worth and El
Paso implement nearly 80 percent of the radar detection devices in Texas.
Loop Detection provides similar information as radar detection except that it uses
magnetic induction loops in the pavement to track vehicle information. The majority of
loop detection on freeways is found in the Austin-San Antonio area.
Highway Advisory Radio (HAR) broadcast important roadway information to drivers.
Typically, a large sign with flashers will indicate which station the driver can access. For
example, a driver in the Austin area can tune into 5:30 AM to hear about lane closures
24 hours a day.52 Similarly, drivers can also tune into a specific radio station as they
approach a major airport to obtain flight information.
Ramp Metering uses timed signalization at entrance ramps to provide an even
distribution of vehicles merging onto congested highways. Houston is currently the only
50
Houston TranStar, http://www.houstontranstar.org, 2008 Annual Report, May 25, 2010 51
City of Dallas, http://www.dallascityhall.com/pwt/dynamic_message_signs.html, May 25, 2010 52
Texas Department of Transportation, http://www.dot.state.tx.us/aus/newsrel/laneclos.htm, May 25, 2010

The Statewide Long-Range Transportation Plan 2035
Economics, Demographics, Freight, and the Multimodal 2-50
Transportation System – Conditions and Trends
city implementing ramp metering on its highways in order to control freeway congestion
during peak hours.
Automatic Vehicle Identification (AVI) uses transponder tags to determine traffic flow
characteristics and are used primarily by Houston TranStar to measure travel times and
speeds.
Roadway Weather Information Systems such as flood warning systems and weather
sensors warn drivers of adverse weather conditions. Information on wind, rainfall,
hurricane, ice, and snow conditions can allow drivers and emergency officials to take
the appropriate precautions during a weather event.
Advanced Traffic Signal Systems consist of equipment that can monitor traffic flows
and can communicate to both the TMC and adjacent signal systems in order to
maximize signal timing efficiency and reduce delays.
Traffic Signal Priority (TSP) enables transit vehicles to obtain an early or extended
green light at traffic signals in order to allow improved service between stations. Dallas
Area Rapid Transit (DART) has been implementing and testing TSP at several
intersections in Dallas.53
Automatic Vehicle Location (AVL) uses GPS to monitor exact locations of transit
vehicles and accurately calculate travel times. An example is VIA in San Antonio, which
began implementing AVL in 2002 to manage their bus fleet better.54 Most of the large
transit agencies in Texas utilize AVL. In addition, freight companies utilize AVL to
determine the location and movement of goods throughout Texas.
Automatic Passenger Counters (APC) are currently used on several DART and
Capital Metro (Austin) vehicles. All of Houston Metro’s transit vehicles use APC.55
Passenger counts assist transit agencies in determining bus and rail schedules based
on demand.
Electronic Toll Collection (ETC) allows drivers to use transponder tags to pay tolls.
This reduces the need for cash systems that can delay traffic. Examples include EZ-
tags in Houston, TollTags in Dallas, and TxTAGs, which can be used on any toll road
statewide.
53
ITS-Texas, http://www.itstexas.org/meetings/2009meetingoverview.stm, May 25, 2010 54
VIA, http://www.viainfo.net/Organization/History.aspx, May 25, 2010 55
Boyle, Daniel, Passenger Counting Systems: A Synthesis of Transit Practice, Transit Cooperative Research Program
(TCRP): Synthesis 77, 2008, pp. 71–72

The Statewide Long-Range Transportation Plan 2035
Economics, Demographics, Freight, and the Multimodal 2-51
Transportation System – Conditions and Trends
The majority of ITS communications in Texas are based on wired networks—usually
copper or fiber-optic cables that run underground through special conduits. The cost to
construct and relocate these lines can be high. Additionally, underground cabling of
fiber optic cable can be difficult to deploy in rural areas due to the long distances
required and the ratio of construction cost to the overall users of the technology.
The use of wireless communication technology is being implemented as an alternative
to traditional wiring. Wireless technology uses radio bands, which can be licensed or
unlicensed. Although unlicensed bands can be used by everyone and are easier to
implement, they can be susceptible to interference. TxDOT, city departments, and
emergency personnel use both types of radio bands depending on the nature of
communication. Wireless ITS devices use both unlicensed and licensed bands.
TxDOT maintains an inventory of ITS equipment throughout the state. Table 2-15
summarizes the current statewide ITS operations by District and gives a general idea of
whether a District’s ITS deployment is in its initial or advanced stages. All but three
TxDOT Districts utilize some form of ITS equipment with urban areas commanding the
largest percentage of operations. Where applicable, the TMC name is given.
Table 2-15: Summary of Statewide ITS Operations by TxDOT District
District (TMC Name)
DM
S
CC
TV
CC
TV
Wir
eles
s
LC
S
Rad
ar D
etec
tio
n
Lo
op
s
HA
R
Ram
p M
eter
AV
I Sit
e
Flo
od
War
nin
g
Wea
ther
Sen
sor
Abilene 4
Amarillo (PEGASIS) 13 16 1 1
Atlanta 3 5 1 2
Austin (Austin Roads) 44 91 23 261 12 1884 4
Beaumont 19
Brownwood 3 4
Bryan 3 6 2
Childress
Corpus Christi 22 26 1
Dallas (DalTrans) 62 285 14 287
El Paso (TransVista) 61 113 169 256 13
Ft Worth (TransVision) 74 162 14 56 182 2
Houston (TranStar) 186 548 24 73 13 87 160 39
Laredo (STRATIS) 16 33 5 44 12 64

The Statewide Long-Range Transportation Plan 2035
Economics, Demographics, Freight, and the Multimodal 2-52
Transportation System – Conditions and Trends
Table 2-15: Summary of Statewide ITS Operations by TxDOT District
District (TMC Name)
DM
S
CC
TV
CC
TV
Wir
eles
s
LC
S
Rad
ar D
etec
tio
n
Lo
op
s
HA
R
Ram
p M
eter
AV
I Sit
e
Flo
od
War
nin
g
Wea
ther
Sen
sor
Lubbock (TransView) 3 16 4 3 3
Lufkin
Odessa 4 3
Paris 4
Pharr 13 1
San Angelo
San Antonio (TransGuide) 178 179 1 247 98 1,200 17
Tyler (NETRIS) 2 3 1
Waco 6 2 2
Wichita Falls (Texoma Vision) 4 9 16 1 2
Yoakum 4 7 11
Totals 728 1,489 107 777 935 3,164 32 87 160 23 47
2.7.2 Intelligent Transportation Systems and Congestion
As the Texas population increases, congestion and travel delays are expected to
increase, placing significant economic and safety demands on the existing
transportation system. ITS will allow agencies to innovatively use technology to reduce
congestion and increase mobility at a lower cost than the traditional method of
constructing new roadways.
The TTI has produced National Congestion Tables over the last 12 years that reflect the
cost to the public from traffic delays and congestion. These measures are part of an
ongoing, long-term effort by TTI to track congestion and mobility. Table 2-16
summarizes the congestion costs in Texas’ urban areas and the savings that have been
achieved in 2007 with operational and ITS treatments.

The Statewide Long-Range Transportation Plan 2035
Economics, Demographics, Freight, and the Multimodal 2-53
Transportation System – Conditions and Trends
Table 2-16: Annual Congestion Cost and Savings by Urban Area (2007)56
Urban Area
Congestion Costs/Consumption Operational Treatment Savings
Travel Delay (1,000 Hours)
Excess Fuel
Consumed (1,000
Gallons)
Congestion Cost
($ Million) Operational Treatment*
Delay Savings (1,000 Hours)
Cost Savings
($ Million)
Dallas/Fort Worth/ Arlington
140,744 96,477 2,849 r, i, s, a, h 11,186 221.8
Houston 123,915 88,239 2,482 r, i, s, a, h 15,201 300.8
San Antonio 31,026 21,973 621 i, s, a 1,386 27.8
Austin 22,777 15,578 471 i, s, a 1,209 25.1
El Paso 7,185 4,691 147 i, s, a 515 10.3
Laredo 1,806 1,005 37 i, s, a 36 0.8
Corpus Christi 1,629 970 32 s, a 23 0.5
Beaumont 1,425 866 28 s, a 13 0.2
Brownsville 841 486 17 s, a 18 0.4
Totals 331,348 230,285 6,684 - 29,587 587.7
*r: freeway ramp metering; i: freeway incident management; s: arterial street signal coordination; a: arterial street access management; h: high-occupancy vehicle lanes
2.7.2.1 Intelligent Transportation Systems Current Challenges and Future
Since TMCs and ITS systems are not uniform across all districts, one of the key
challenges for TxDOT is statewide communication. The Traffic Operations Division is
working to implement updated software that will allow TMCs across the state to
communicate with each other. This update presents its own challenges such as:
A mixture of old and new technology;
District institutional and control boundaries; and
Operational agreements.
The ultimate goal is to send information back and forth from a centralized statewide
system so that the public can receive information about the whole state via one website.
Another challenge is funding. Federal funding from the FHWA was a key incentive to
initiate the early ITS projects. These dedicated federal funds have been discontinued
56
Texas Transportation Institute Urban Mobility Report, 2009

The Statewide Long-Range Transportation Plan 2035
Economics, Demographics, Freight, and the Multimodal 2-54
Transportation System – Conditions and Trends
now that ITS is considered an integral part of major highway construction projects.
Consequently, Districts have had to incorporate equipment maintenance as a
component of the traditional maintenance budget and to fund additions to ITS systems
under the traditional traffic-funding category.57
2.7.3 Expanded Use of Existing Technologies
Depending on funding, the following is a sampling of potential applications that Texas
could see in the future.
Enhance Traffic Management. Moving ITS components beyond freeways and
implementing them on arterials will further enhance the system-wide operations of the
transportation system. This will require efficient coordination between local and state
governments. The Dallas area is one of several cities nationwide that is pioneering the
concept of Integrated Corridor Management (ICM).58 With ICM, multiple entities and
modes can work together as a system rather than independently allowing travelers to
have a central source of information to determine route and mode choice.
Continued dissemination of travel time and incident information via dynamic
message signs, electronic devices, and websites could reduce congestion by
providing road users with alternate choices. TxDOT is also evaluating the
implementation of a ―5-1-1 system‖ where travelers can dial 5-1-1 for up-to-date traffic
information.
Increase use of Integrated Signal Systems. Continued improvements to existing
signal systems through the monitoring of vehicular flows, efficient signal timing, and
communication between multiple signalized intersections can significantly improve
traffic flow within congested areas. This will require ongoing coordination between
counties, cities, and TxDOT.
ITS at Texas Border Facilities. Increased usage of ITS technologies such as cameras,
wait-time displays, ETC, and vehicle sensors can help improve the flow of trade and
tourism between Mexico and Texas. This in turn will improve homeland security and
cross-border data collection. Commercial vehicles that travel back and forth across the
border will benefit from decreased delay times as these ITS technologies are
implemented.
57
Discussion with TxDOT, March 17, 2010. 58
USDOT website, http://www.its.dot.gov/icms/pioneer_dallas.htm, June 14, 2010

The Statewide Long-Range Transportation Plan 2035
Economics, Demographics, Freight, and the Multimodal 2-55
Transportation System – Conditions and Trends
Freight Applications. Integrating ITS with commercial vehicles will improve general
permitting processes and allow agencies to better track hazardous materials and
oversized vehicles.
Transit ITS. As rail and Bus Rapid Transit (BRT) options become commonplace
throughout Texas cities, ITS technologies such as AVL and travel-time displays can be
used to assist passengers with planning trips. Combining transit and roadway
management will be vital to efficient multimodal operations.
Congestion Pricing. On heavily congested highways that include an optional express
lane, technologies like ETC can be used to apply congestion pricing (varying the toll
rate based on congestion to influence traveling patterns).
Wireless Technology. Wireless connections allow ITS equipment to be implemented
on a wider scale with less cost. This will allow important information to be transmitted
quickly to travelers, as well as giving traffic management officials a broad range of
information.
Emergency Management. ITS has emerged as a valuable resource during large-scale
hurricane evacuations and dealing with congestion as a result of catastrophic events.
Expanded use of ITS in these regions will allow the state to continue its commitment to
improve responses to both weather and homeland security events.
2.7.4 New Technologies in Development
The following is a sample list of newer ITS technologies that have been in development.
In-Vehicle Technologies. Traditionally, many ITS technologies have focused outside of
the passenger’s vehicle. The next generation of ITS components will include the use of
―in-vehicle‖ technologies. These ―smart‖ technologies will allow vehicles to detect
obstructions and other out-of-sight vehicles, improving the safety of drivers on the
roadway and reducing collisions.
Floating Vehicle Data. Data such as speed and traffic information can be collected
using wireless or GPS devices within vehicles.
Occupancy Detection. For HOV applications, emerging technologies that can detect
the number of passengers in a vehicle will assist law enforcement in the verification
process.
Intelligent Speed Assistance (ISA). These technologies advise a driver or vehicle to
adapt their speed based on local speed limits and road conditions.

The Statewide Long-Range Transportation Plan 2035
Economics, Demographics, Freight, and the Multimodal 2-56
Transportation System – Conditions and Trends
Road to Vehicle Communications. In-ground sensors using radio frequency
identification (RFID) will assist drivers to safely adjust to roadway conditions.
As Texas grows, ITS will provide a key tool to achieve the state’s goals to ―provide safe,
effective, and efficient movement of people and goods.‖59 ITS will provide an important
resource to obtain operations data that can be used to determine the overall
transportation system’s performance. These performance measures will allow agencies
to objectively make decisions on how to fund and deliver ITS applications throughout
the state.
2.8 Public Transportation in Texas
2.8.1 Urban Transit in Texas
As of 2010, urban transit in Texas includes fixed-route and demand-response bus
systems, trolley systems, and urban rail systems. Urban transit systems in Texas
consist predominantly of fixed-route bus service. Urban rail systems exist in the cities of
Austin, Dallas, and Houston, and trolley/streetcar systems exist in Dallas and
Galveston. Subsequent sections discuss these urban transit systems for each of the
seven Metropolitan Transit Authorities (MTA), one coordinated county transit authority,
and 30 urban transit agencies, providing ridership and fleet data for each.
In general, the majority of urban transit system usage within Texas occurs within the
eight MTAs. Figure 2-35 shows the statewide transit ridership for fiscal 2008 for MTAs,
urbanized, nonurbanized (rural), elderly and disabled, and Job Access Reverse
Commute (JARC) systems. The seven MTAs and one coordinated county transit
authority in Texas accounted for 92 percent of urban transit ridership, while the 30
urbanized areas only accounted for 6 percent. However, this disparity is expected, as
the MTAs are the largest and most densely urbanized areas.
59
TxDOT website, http://www.dot.state.tx.us/about_us/mission.htm, May 27, 2010 59
Schrank, David, and Lomax, Tim, 2009 Urban Mobility Report, Texas Transportation Institute, July 2009.

The Statewide Long-Range Transportation Plan 2035
Economics, Demographics, Freight, and the Multimodal 2-57
Transportation System – Conditions and Trends
Figure 2-35: 2008 Public Transit System Ridership60
Figure 3-36 shows the geographic coverage of public transportation systems in Texas.
60
TxDOT, 2008 Texas Transit Statistics
91.8%
5.9%
1.6% 0.4% 0.3%
MTA
Urbanized
Nonurbanized
Elderly and Disabled
JARC

The Statewide Long-Range Transportation Plan 2035
Economics, Demographics, Freight, and the Multimodal 2-58
Transportation System – Conditions and Trends
Figure 2-36: Public Transportation Systems in Texas (Cities and Counties Served by Public Transportation Systems)

The Statewide Long-Range Transportation Plan 2035
Economics, Demographics, Freight, and the Multimodal 2-59
Transportation System – Conditions and Trends
Within Texas as a whole, urban transit system ridership is increasing. As shown in
Table 2-17, between 2002 and 2008, transit ridership within the MTAs increased by
10.2 percent, while ridership within the urbanized areas increased 10.1 percent. An
―Unlinked Passenger Trip‖ is a count of each passenger entering a public transportation
vehicle. It does not represent a single passenger trip as some passengers may need to
change busses to get to their final destination.
Table 2-17: Summary of Unlinked Passenger Trips and Bus Fleet Vehicles for 2002 and 200861
Transit Area 2002 2008
2002 to 2008
Growth % Change
Unlinked Passenger Trips
MTA 252,550,674 278,397,166 25,846,492 10.2
Urbanized Area 268,991,402 296,181,091 27,189,689 10.1
Summary of Bus Fleet Vehicles
MTA 4,912 4,449 -463 -9.4
Urbanized Area 5,491 5,193 -298 -5.4
While urban transit ridership increased as a whole between 2002 and 2008, bus fleet
size actually decreased among MTA’s and urban transit systems by 9.4 and
5.4 percent, respectively.
While some of this reduction is a result of the introduction of urban rail in cities such as
Dallas and Houston, much of the bus fleet reduction is likely a result of efficiency
reductions in order to lessen the impact of budget shortfalls due to the recession. The
largest increases were in Denton, Longview, and McAllen with increases of 360 percent,
175 percent, and 63 percent, respectively, while the largest reductions were in Texas
City, Fort Worth, and Victoria, with reductions of 52 percent, 37 percent, and 31 percent,
respectively.
2.8.2 MTA Bus Systems
The following sections describe existing bus service in each of the MTAs: Austin,
Corpus Christi, Dallas, Denton, El Paso, Fort Worth, Houston, and San Antonio. For
each MTA system area, the service area is described, and recent fleet size and
ridership trends are discussed.
61
TxDOT 2002–2005 Texas Transit Statistics; TxDOT 2008 Texas Transit Statistics

The Statewide Long-Range Transportation Plan 2035
Economics, Demographics, Freight, and the Multimodal 2-60
Transportation System – Conditions and Trends
Austin Bus System: The Capital Metropolitan Transportation Authority (CapMetro or
CMTA), serves a 500-square-mile area with approximately 3,300 stops throughout the
capital area through local, limited and flyer, feeder, crosstown, special event, University
of Texas Shuttle (UT) shuttle, express fixed bus routes, and vanpools.
The CapMetro bus fleet contained a total of 665 buses in 2008, an 11.3 percent
reduction in fleet from fiscal year (FY) 2002. The FY 2008 ridership was approximately
35 million passenger trips, representing a 2.7 percent increase in ridership over FY
2002 ridership levels. Average weekday bus ridership in FY 2008 was 140,000 one-way
trips.
A system map can be found at: http://www.capmetro.org/riding/
Corpus Christi Bus System: The Corpus Christi Regional Transportation Authority
(RTA) covers 838 square miles. The RTA provides fixed route service, tourist,
commuter, charter, public event, and van/car pool services. Additionally, the RTA offers
paratransit bus service called the B-Line, which provides public transportation for people
whose disabilities prevent them from using fixed route bus services.
In 2008, the RTA’s bus fleet contained 121 buses, a 1 percent reduction from FY 2002.
The FY 2008 ridership was approximately 5.5 million passenger trips, representing a
3.6 percent decrease in ridership over FY 2002 ridership levels. Average weekday bus
ridership in FY 2008 was 18,331 trips.
A system map can be found at: http://ccrta.org/rider-info/system-map/
Dallas Bus System: The Dallas area is served by DART, providing fixed-route and
demand-response bus services to the City of Dallas, as well as Addison, Carrollton,
Cockrell Hill, Farmers Branch, Garland, Glenn Heights, Highland Park, Irving, Plano,
Richardson, Rowlett, and University Park. As of 2010, the DART bus system operates
approximately 130 bus routes covering 13 cities and 700 square miles. Additionally,
DART provides paratransit services for the disabled.
The DART bus fleet had 1,025 buses in 2008, a 3.8 percent reduction from FY 2002.
The FY 2008 ridership was approximately 67.0 million passenger trips, representing a
15.8 percent increase in ridership over FY 2002 ridership levels. Average weekday bus
ridership in FY 2008 was 152,700 trips.
A system map can be found at: http://www.dart.org/

The Statewide Long-Range Transportation Plan 2035
Economics, Demographics, Freight, and the Multimodal 2-61
Transportation System – Conditions and Trends
Denton Bus System: The Denton County Transportation Authority (DCTA) provides
several bus services to the general public in the Greater Lewisville and Denton area.
These services include fixed route service in Denton, Highland Village, and Lewisville,
campus shuttles to the University of North Texas and North Central Texas College, and
a regional commuter service into downtown Dallas. Additionally, DCTA offers demand
response/paratransit service in Denton, Lewisville, Highland Village, and Corinth.
The DCTA bus fleet contained 69 buses in 2008, a 360 percent increase from FY 2002.
The FY 2008 ridership was approximately 1.9 million passenger trips, representing a
521 percent increase in ridership over FY 2002 ridership levels.
A system map can be found at: http://www.dcta.net/commuterexpress.asp
El Paso Bus System: The El Paso area is served by Sun Metro, which offers fixed-
route and paratransit bus service within El Paso County and throughout the City of
Sunland Park, New Mexico. Sun Metro has 63 fixed bus routes running within this
service area. Job Express, another service of Sun Metro, provides support to individuals
transitioning from welfare to work through job training, education, employment, and
childcare destinations.
Sun Metro had 251 buses in 2008, a 16.2 percent increase from FY 2002. The FY 2008
ridership was approximately 12.5 million passenger trips, representing an 8.4 percent
decrease in ridership over FY 2002 ridership levels.
A system map can be found at: http://www.elpasotexas.gov/sunmetro/
Fort Worth Bus System: The Fort Worth T, generally called The T provides local bus
service, express bus service, and rider request service within Fort Worth and Richland
Hills. The T has 37 fixed bus routes running within this service area. In addition, the T's
Mobility Impaired Transportation Service offers door-to-door transportation within Fort
Worth, Richland Hills, and Blue Mound.
The Fort Worth T bus fleet contained 200 buses in 2008, a 37.1 percent decrease from
FY 2002. The FY 2008 ridership was approximately 8.4 million passenger trips,
representing a 37.7 percent increase in ridership over FY 2002 ridership levels.
A system map can be found at http://www.the-t.com/
Houston Bus System: The Houston area is served by the Metropolitan Transit
Authority of Harris County, referred to as METRO. METRO provides local, express, and
Texas Medical Center circulator services, as well as paratransit services. Communities

The Statewide Long-Range Transportation Plan 2035
Economics, Demographics, Freight, and the Multimodal 2-62
Transportation System – Conditions and Trends
that are part of the METRO service area include the Cities of Houston, Bellaire, Bunker
Hill Village, El Lago, Hedwig Village, Hilshire Village, Humble, Hunters Creek, Katy,
Missouri City, Piney Point, Southside Place, Spring Valley, Taylor Lake Village, and
West University Place. Major portions of unincorporated Harris County are also
included.
METRO has 102 fixed bus routes running within this service area. METRO had 1,423
buses in 2008, a 16.6 percent decrease in fleet from FY 2002. The FY 2008 ridership
was approximately 102.1 million passenger trips, representing a 6.1 percent increase in
ridership over FY 2002 ridership levels.
A system map can be found at: http://www.ridemetro.org/SchedulesMaps/
San Antonio Bus System: The San Antonio area is served by VIA Metropolitan
Transit, commonly referred to as VIA. VIA’s service area is 1,226 square miles, which is
98 percent of Bexar County. The service area is made up of the unincorporated parts of
Bexar County and the following municipalities: Alamo Heights, Leon Valley, Balcones
Heights, Olmos Park, Castle Hills, San Antonio, China Grove, Shavano Park, Converse,
St. Hedwig, Elmendorf, Terrell Hills, Kirby, and Von Ormy. Also included in VIA’s service
area is the Bexar County portion of Cibolo.
VIA provides local and express bus service, paratransit service for riders with
disabilities, vanpool service for commuters, and special event park-and-ride service. VIA
has 6,994 bus stops along 90 bus lines, which are divided into five service categories:
frequent, metro, express, skip, and streetcar.
The VIA bus fleet had 695 buses in 2008, a 3.2 percent decrease from FY 2002. The
FY 2008 ridership was approximately 46.2 million passenger trips, representing an
18.2 percent increase in ridership over FY 2002 ridership levels.
A system map can be found at: http://www.viainfo.net/
2.8.3 Other Urban Bus Systems
As of 2010, there are 30 urban bus systems operating in Texas. Cities with urban bus
systems (see Figure 2-36) have service areas located in cities or geographic areas with
urbanized area populations that range from 48,767 to 523,144 as listed in the 2000
census. These urban area transit districts can be classified into three population groups:
Small urban areas with populations between 50,000 and 100,000,
Medium urban areas with population from 100,000 to 215,000, and
Larger urban areas with population greater than 215,000.

The Statewide Long-Range Transportation Plan 2035
Economics, Demographics, Freight, and the Multimodal 2-63
Transportation System – Conditions and Trends
2.8.3.1 Small Urban Area Transit
The Texarkana Urban Transit District serves 48,767 people (Census 2000) in its
urbanized area, which includes both Texas and Arkansas. Texarkana’s bus transit
agency (the T-Line) provides fixed route and Americans with Disabilities Act of 1990, as
Amended (ADA)-compliant curb-to-curb bus service throughout the greater Texarkana
area within both Texas and Arkansas. From 2002 to 2008, ridership on the T-Line
system increased by approximately 70.5 percent, from 167,306 to 285,200 unlinked
passenger trips per year. However, during this same period, the number of buses in the
fleet (8) did not change. This suggests that Texarkana was successful in promoting
service within its area and increasing efficiency within its existing operations.
Other small urban area transit districts with populations less than 100,000 that
experienced an increase in ridership are Temple, Victoria, Wichita Falls, Galveston, San
Angelo, and Longview. Small urban area transit districts that experienced a decrease in
ridership greater than 25 percent include Sherman-Denison and Texas City.
2.8.3.2 Medium Urban Area Transit
The Midland-Odessa Urban Transit District serves an urbanized population of 210,616
people (Census 2000). The area’s bus transit agency (EZ Rider) provides fixed route
and ADA-compliant curb-to-curb bus service within the urbanized areas of both Midland
and Odessa. The urban bus system started reporting data in 2004 and serviced
479,727 unlinked passenger trips in 2008. The first year this transit agency did report
unlinked passenger trips was 2004 with 232,867 (TxDOT 2002–2005 Transit Statistics).
The percent increase for unlinked passenger trips increased by 106 percent from 2004
to 2008. The number of buses decreased from 38 buses in 2004 to 23 buses in 2008,
meaning the newly formed transit agency in 2004 became more efficient providing
ridership with fewer buses.
Other medium urban area transit districts that experienced increases in excess of
90 percent in ridership include Mesquite and Bryan-College Station. Medium urban area
transit districts that experienced decreases in ridership greater than 20 percent include
Beaumont, Lubbock, and Harlingen.
2.8.3.3 Large Urban Area Transit
McAllen is served by multiple transit companies, including McAllen Express (ME)
Transit as the City of McAllen’s Public Transportation System and Valley Transit
Company, offering intercity service within the Rio Grande Valley and Mexico. These
services provide international, national, fixed route, and paratransit bus services for a
population of 523,144 (Census 2000). McAllen is host to the only major bus terminal

The Statewide Long-Range Transportation Plan 2035
Economics, Demographics, Freight, and the Multimodal 2-64
Transportation System – Conditions and Trends
along the U.S.-Mexico border to house American and Mexican bus lines as well as the
City’s primary bus station for the urban bus system. McAllen Express increased its
unlinked passenger trips by 10.9 percent from 2002 to 2008. The number of buses in its
fleet also increased by 62.5 percent from 16 buses in 2002 to 26 buses in 2008. The
urban area of McAllen includes more than one community experiencing increases in
population, and therefore, the transit district is increasing its fleet size to meet the
increased public transit demands.
Other large urban areas that also experienced increases in ridership include Arlington
and North Richland Hills (NETS). None of the larger urban area transit districts
experienced decreases in ridership.
2.8.4 Urban and Commuter Rail Systems
Note: Detailed Information regarding urban and commuter rail systems can be found in
the Texas Rail Plan available at http://www.txdot.gov/public_involvement/
rail_plan/trp.htm.
Within Texas, urban and/or commuter rail systems currently exist within the Dallas-Fort
Worth metroplex area (DART, the Trinity Railway Express [TRE], and McKinney Avenue
Transit Authority [MATA]), Houston (MetroRail), and Austin (Capital MetroRail). In
addition, the Cities of Dallas, Fort Worth, and Austin have initiated studies for the
planning and design or expansion of urban streetcar systems to complement regional
rail. The City of Galveston operates a small streetcar system covering a service area of
approximately 6 miles on the island. Two cars previously operated on the system, with
each car designed to look like vintage electric trolleys. The cars are powered by diesel-
electric engines. The Galveston trolley service is currently suspended due to extensive
damage suffered during Hurricane Ike in 2008, including damage to the trolleys, tracks,
and maintenance facilities. Each existing rail transit system is described in more detail
below.
2.8.4.1 The Dallas – Fort Worth Urban and Commuter Rail System
The 48-mile DART Rail system provides service to work, shopping, and entertainment
destinations in Dallas, Garland, Plano, and Richardson. Thirty-nine stations currently
exist along three routes, with all stations served by additional connecting bus routes.
DART Rail routes vary from dedicated elevated route segments to at-grade and
underground routes. Power to the rail system is supplied by an overhead electrification
system. The DART rail fleet contains 115 rail vehicles. The FY 2008 ridership was
approximately 19.4 million passenger trips. Average weekday ridership in FY 2008 was
65,800 passengers, making it the eighth highest in the United States.

The Statewide Long-Range Transportation Plan 2035
Economics, Demographics, Freight, and the Multimodal 2-65
Transportation System – Conditions and Trends
DART and the T jointly operate the TRE, containing 35 miles of commuter rail transit
linking downtown Dallas and Fort Worth with stops in the mid-cities and at DFW Airport.
The TRE system offers frequent departures from Union Station in downtown Dallas to
the Intermodal Transportation Center (ITC) in Fort Worth. The TRE system currently
serves 10 stations along the Dallas-Fort Worth route, with bus connections to the DFW
Airport and consists of diesel-powered locomotives pulling one or two-level passenger
cars. The TRE also operates self-powered diesel railcars. The TRE fleet contains 6
locomotives, 13 rail diesel cars, 11 bi-level coaches, and 10 bi-level cab cars. The FY
2008 ridership was approximately 2.7 million passenger trips. Average weekday
ridership in FY 2008 was 9,800 passengers.
The MATA operates a 5.2-mile trolley route (M-Line) from the north side of Downtown
Dallas along McKinney Avenue through the Uptown neighborhood. The MATA system
consists of four vintage electric powered streetcars, all built between 1909 and 1925.
The FY 2008 ridership was approximately 291,106 passenger trips, a 16 percent
increase over FY 2007 levels.
2.8.4.2 The Houston MetroRail System
The Houston MetroRail system serves downtown Houston, Midtown, the Museum and
Hospital Districts, and Reliant Stadium. As of 2010, the Red Line route consisted of
approximately 7.5 miles of light rail transit. MetroRail has 18 light rail vehicles. Each
96-foot-long, double-articulated vehicle has four low platform doors per side and has a
capacity of 72 seated and approximately 169 standing passengers, or a total capacity of
around 241 per car. The average daily weekday ridership in FY 2008 was 39,500
passengers.
2.8.4.3 The Austin Capital MetroRail Commuter Rail System
The Capital MetroRail Red Line commuter rail system opened March 22, 2010, and
provides a downtown Austin to Leander route. Nine stations exist along the 32-mile
route.
The startup rail system fleet consists of six railcar vehicles. The vehicles have a
capacity of 200 passengers, 108 seated and 92 standing. The system operates on
shared-use track with local freight rail and is currently operating during rush hour
periods only, Monday through Friday.
2.8.5 Rural Transit Systems
Rural transit systems provide the general public with both fixed-route and demand-
response services. In Texas, rural transit systems are generally regional systems

The Statewide Long-Range Transportation Plan 2035
Economics, Demographics, Freight, and the Multimodal 2-66
Transportation System – Conditions and Trends
serving multiple counties, although some systems serve only one county or even
sections of a county. Several rural transit systems provide service and connections to
larger nearby metropolitan areas through established fixed route service with transfer
points.
In general, fixed route service is normally the most cost-effective service available, as it
provides dependability in moving riders between desired destinations. In rural areas,
fixed route service may be available between larger communities within the service
area, as well as servicing major destinations within a single community. Some rural
areas also have fixed route service in local tourist areas, such as South Padre Island. In
rural areas, fixed route service normally operates during daylight hours with limited to no
service available at night. The service is designed for safe and efficient use of the
traveling public. ADA accessible fixed-route bus service in rural communities has been
successful at transporting persons with disabilities. This is due, in part, to the support of
the communities’ leadership and promotion of the service.
Rural transit agencies also provide demand-response transit services. This type of bus
service is useful to meet the needs of lower density rural areas of Texas. Most demand-
response trips tend to be taken by the elderly, lower income, and rural residents who
require transportation assistance getting to medical appointments, employment,
shopping, and other services. In many rural areas, demand-response service is also
available during evening hours to serve customers’ needs after established fixed-route
service ends.
Figure 2-36 shows the 38 rural public transportation systems in Texas. All rural
counties, except Newton County in southeast Texas, are serviced by a rural
transportation system. Table 2-8 provides a summary of the total ridership and fleet size
for all rural areas in Texas for calendar years 2002 and 2008 Based on 2002 and 2008
data, service ridership showed a 9.5 percent increase among all rural transit providers,
from 4,516,606 riders to 4,947,317 riders. During this same period, total fleet size
among all providers stayed ahead of ridership, increasing from 1,151 vehicles to 1,315
vehicles, a 14.25 percent increase.

The Statewide Long-Range Transportation Plan 2035
Economics, Demographics, Freight, and the Multimodal 2-67
Transportation System – Conditions and Trends
Table 2-18: Summary of Unlinked Passenger Trips and Bus Fleet Vehicles for 2002 and 200862
Summary
Unlinked Passenger Trips
% Change
Total Fleet Size %
Change 2002 2008 2002 2008
Total Rural Ridership and Fleet Size
4,516,606 4,947,317 9.50 1,151 1,315 14.25
Average for Reporting System*
115,810 126,854 9.50 29 34 17.24
*Average is based on 39 rural transit providers (two agencies merged after 2008).
2.8.6 Planned Transit System Improvements
Planning efforts for future transit improvements varies based on the size of the system.
The MTA agencies generally have long-range planning studies available to guide
expansion of service. Due to their smaller size and limited funding, urban and rural
transit agencies do not generally conduct the same level of long-range forecasting and
planning. Future services for the smaller agencies are almost exclusively a function of
the amount of local, state, and federal funding provided to the agency.
While the majority of the population growth will be in the larger communities, counties
with less than 50,000 population are projected to grow by over 625,000 people by 2035.
The growth in population over 65 years of age for Texas as a whole is 144% (or nearly
3.5 million) which will lead to a higher percentage of the population within this age
bracket for all county types.
2.8.6.1 Factors that Impact Future Transit Usage
The major factors that are anticipated to influence future transit usage and forecasts
include system expansions, changes in demographics, transit-oriented development
(TOD), roadway congestion, and economic conditions.
Factor 1: Demographics
One of the more significant influences on forecasted ridership is changing
demographics, including total population, elderly population, and income level (Table
2-19). In general, increases in total population result in increases in transit ridership.
Even where the percentage of transit ridership is static over time, an increase in the
62
TxDOT 2002 – 2005 Texas Transit Statistics; TxDOT 2008 Texas Transit Statistics

The Statewide Long-Range Transportation Plan 2035
Economics, Demographics, Freight, and the Multimodal 2-68
Transportation System – Conditions and Trends
pool of potential users (i.e., total population) will result in an overall increase in ridership.
Moreover, elderly individuals (i.e., persons 65 years of age and older) have historically
had a higher rate of transit ridership than any other age group. Therefore, increases in
total population and/or increases in elderly populations will likely result in increased
transit ridership as well.
Table 2-19: Population Change for Urban-Metropolitan Statistical Areas63
Metropolitan Statistical Area (MSA)
Total Pop (2005)
Total Pop (2035)
% Pop Change
Elderly Pop
(2005)
Elderly Pop
(2035) % Elderly Change
Dallas-Fort Worth-Arlington
5,670,067 9,360,983 65.1 451,294 1,573,933 248.8
Houston-Sugar Land-Baytown
5,120,772 7,894,728 54.2 410,278 1,323,879 222.7
San Antonio-New Braunfels
1,833,766 2,448,170 33.5 198,199 465,305 134.8
Austin-Round Rock-San Marcos
1,405,087 2,466,185 75.5 104,260 470,647 351.4
El Paso 740,723 1,098,856 48.3 72,813 166,229 128.3
McAllen-Edinburg-Mission
657,116 1,308,819 99.2 60,715 165,377 172.4
Corpus Christi 430,831 587,030 36.3 49,267 97,365 97.6
Lubbock 261,945 296,760 13.3 28,943 50,799 75.5
Amarillo 240,465 320,247 33.2 28,527 58,150 103.8
Laredo 226,862 490,418 116.2 16,510 50,697 207.1
Brownsville-Harlingen 374,446 631,964 68.8 41,516 90,223 117.3
Waco 221,426 277,042 25.1 27,570 44,512 61.5
Bryan-College Station 195,410 263,456 34.8 16,565 39,800 140.3
Beaumont-Port Arthur 395,695 447,290 13.0 51,623 85,024 64.7
Odessa 126,645 158,776 25.4 14,155 26,698 88.6
Abilene 165,587 181,803 9.8 21,349 34,310 60.7
San Angelo 109,281 124,278 13.7 14,714 23,917 62.5
Victoria 117,996 150,201 27.3 14,856 27,246 83.4
Longview 200,411 242,056 20.8 28,224 48,225 70.9
Sherman-Denison 114,163 131,687 15.3 16,969 28,760 69.5
As shown in Table 2-19, all 20 MSAs are forecast to experience growth in both total
population and elderly population, which suggests a corresponding increase in future
urban transit system ridership. However, growth rates vary widely between the various
63
Texas State Data Center. 2008 Population Projections, The One-Half 1990–2000 Migration (0.5) Scenario. February
2009. Available at http://txsdc.utsa.edu/tpepp/2008projections/
The Statewide Long-Range Transportation Plan 2035
Economics, Demographics, Freight, and the Multimodal 2-69
Transportation System – Conditions and Trends
MSAs, from a low of 9.8 percent total population growth in the Abilene MSA to a high of
351.4 percent elderly population growth in the Austin-Round Rock-San Marcos MSA.
Among the 20 MSAs analyzed, the overall highest growth rates in total population
between 2005 and 2035 are forecast to occur in the Laredo, McAllen-Edinburg-Mission,
Austin-Round Rock-San Marcos, Brownsville-Harlingen, and Dallas-Fort Worth-
Arlington MSAs, with growth rates of 65 to 116 percent. Meanwhile, the highest growth
rates in elderly population during this same time period are forecast to occur in the
Austin-Round Rock-San Marcos, Dallas-Fort Worth-Arlington, Houston-Sugar Land-
Baytown, Laredo, and McAllen-Edinburg-Mission MSAs, with growth rates in excess of
150 percent. Comparing the two lists reveals that four of the five MSAs are contained in
both lists. Therefore, based on demographic changes between 2005 and 2035, a higher
than average growth in transit ridership can be expected in the Laredo, McAllen-
Edinburg-Mission, Austin-Round Rock-San Marcos, and Dallas-Fort Worth-Arlington
MSAs.
Factor 2: System Expansion
System expansion is the most robust tool that transit agencies possess that can be
used to increase ridership. By expanding the existing system, the transit agency
provides a transit alternative to an area without service, resulting in increased ridership
from people residing in that area as well as people traveling to destinations within the
new service area.
System expansions vary in type and intensity depending upon the size and type of
existing service. Some expansions consist of the addition of local bus routes or new
express routes, while other expansions in the larger systems may include light rail,
commuter rail, and/or streetcar lines.
Factor 3: Land Use
Public transportation systems typically have higher ridership in areas of more intense
land use density. The land use patterns in the larger Texas cities are transitioning to
increase residential density along new transportation corridors, such as the DART light
rail lines, or to bring more residential units to downtown areas, such as in Austin.
Increases in density bring the need for more transit and pedestrian-friendly
streetscapes. In suburban counties, mixed use developments, or TODs, are being
planned around new (or planned) rail stations.
TODs are mixed-use residential and commercial centers designed to maximize transit
and non-motorized transportation access. TODs typically have a centrally located train
station, metro station, tram stop, or bus stop surrounded by relatively high-density

The Statewide Long-Range Transportation Plan 2035
Economics, Demographics, Freight, and the Multimodal 2-70
Transportation System – Conditions and Trends
development. The land use density transitions to progressively lower-density
development as the distance from the transit core increases.
TODs are being established in urban areas adjacent to public transportation facilities
throughout Texas, especially within the largest MSAs, such as Dallas, Fort Worth,
Houston, San Antonio, and Austin. By providing a compact, mixed-use development
within an urban environment accessible by transit, TODs provide opportunities for
people to move into urban neighborhoods, alleviate the need for and expense of
personal vehicles, and avoid ever-increasing congestion. Urban planners and real
estate experts expect TODs to continue gaining in popularity in the future due in part to
some cities giving incentives that include, but are not limited to, the following:
Allowing a mix of land uses,
Allowing an increase in floor area ratios (FAR). FAR is the ratio of the total floor area of buildings on a certain location to the size of the land of that location,
Allowing an increase in total development density,
Allowing a reduction in required parking spaces per square foot of development,
Providing streamlined permitting, and
Providing tax incentives.
Therefore, as developers continue to build TODs around existing and proposed transit
stops, transit ridership should continue to increase concurrently.
Factor 4: Economic Conditions
An overarching factor that influences all of the factors mentioned is economic
conditions. The condition of the economy greatly influences whether transit agencies
undertake system expansions, whether developers build more TODs, whether people
decide to ride public transit versus using personal vehicles, and whether the entities
responsible for building and expanding roadways throughout the state have the money
to do so in order to attempt to relieve congestion.
The United States as a whole, is currently in the midst of a major economic recession.
Most economists believe that while we are slowly emerging from the recession, we are
not likely to return to prerecession levels of prosperity any time soon. Therefore, transit
system expansions and TODs will likely continue to be deferred, while roadway
expansions projects are also deferred due to lack of funds. This delay in roadway
expansion coupled with continued population growth within the urbanized areas will
likely increase congestion. As a result, transit ridership should continue to grow;

The Statewide Long-Range Transportation Plan 2035
Economics, Demographics, Freight, and the Multimodal 2-71
Transportation System – Conditions and Trends
however, transit ridership will likely grow at a slow rate until the economy rebounds and
transit agencies are able to program future expansions.
Another economic factor that influences transit ridership levels is the price of gasoline.
As gasoline prices rise in Texas, more people across the state reduce the use of their
cars and turn to public transportation to commute to work, to go to school, to travel to
shopping centers, and to attend medical appointments. Record high gas prices of $4
per gallon during the summer of 2008 contributed to a significant increase in transit
ridership for many of the transit systems in Texas. According to the American Public
Transportation Association historical ridership data, the percentage increase in total
public transit ridership levels during the summer of 2008 over summer 2007 levels were
4.8 percent in Fort Worth, 8.6 percent in Dallas, 17.2 percent in Austin, and 17.3
percent in Denton. The Dallas-Fort Worth Trinity Railway Express commuter rail system
experienced an 18.8 percent increase in transit ridership during this period. Many
smaller metropolitan and rural transit agencies experienced increased transit ridership
during this same period with an increase of 7.3 percent in Corpus Christi and 11.0
percent within the rural Bryan, Texas, based Brazos Transit District. Of the large transit
agencies, only the Houston (–6.9 percent) and Galveston (–10.8 percent) area
experienced decreased transit ridership during this period. However, these areas were
significantly impacted by Hurricane Ike during early September 2008. Prior to Hurricane
Ike’s landfall, Houston METRO experienced similar public transit ridership increases
with a 9.6 percent increase from July 2008 over July 2007 levels.
By the summer of 2009, gasoline prices had fallen approximately 36 percent from their
2008 summer peak. Most transit agencies within Texas experienced decreased
ridership levels during this period including Dallas (–12.3 percent), Austin
(−11.3 percent), San Antonio (–10.9 percent), Houston (–7.1 percent), and El Paso
( 4.5 percent).64
2.8.7 Transit Ridership Forecasts
The latest public transportation statistics were published by TxDOT in 2009 and
reported information for 2008. Transit ridership increased substantially for some transit
agencies due to the spike in gasoline prices. The straight-line forecast discussed below
is based on total trips within the state of Texas for each type of system and may not
reflect the trends in each community. Ridership forecasts by system are shown in Table
2-20.
64
American Public Transportation Association (APTA) website, http://www.apta.com/mediacenter/pressreleases/2008/Pages/081208_ridership_surges.aspx, accessed June 8, 2010.

The Statewide Long-Range Transportation Plan 2035
Economics, Demographics, Freight, and the Multimodal 2-72
Transportation System – Conditions and Trends
Table 2-20: Annual Transit Ridership Forecasts65
System 2002 2008
Ridership Growth
(Unlinked Passenger
Trips) 2002-2008
% Change
2002-2008
Projected Ridership (Unlinked
Passenger Trips) 2035
Rural 4,516,606 4,947,317 430,711 9.5% 6,885,517
Urban 16,206,693 17,783,925 1,577,232 9.7% 24,881,469
MTA 252,857,636 278,397,166 25,539,530 10.1% 393,325,052
Total 273,580,935 301,128,408 27,547,473 425,092,037
Rural: Between 2002 and 2008, the rural transit systems had a 9.5 percent growth in
unlinked passenger trips. Using the growth from 2002 to 2008, the number of trips could
increase from just over 4,947,000 in 2008 to over 6,885,000 in 2035.
Urban: Between 2002 and 2008, the statewide unlinked passenger trips grew by 9.7
percent or over 1,577,000 trips. This number includes 1,173,000 in 2008 on four new
systems that went into operation after 2002. Using the growth from 2002 to 2008, the
number of trips could increase from just over 17,783,000 in 2008 to over 24,881,000 in
2035.
MTA: Between 2002 and 2008, the statewide unlinked passenger trips grew by 10,1
percent or over 25,339,530 trips. Using the growth from 2002 to 2008, the number of
trips could increase from just over 278,397,000 in 2008 to over 425,092,000 in 2035.
2.8.7.1 Bus and Urban and Commuter Rail System Expansions
Note: Detailed Information regarding urban and commuter rail system expansions can
be found in the Texas Rail Plan available at:
http://www.txdot.gov/public_involvement/rail_plan/trp.htm
While all of the MTAs in Texas have long-term transit system expansion plans, the
current state of the economy is forcing many of the agencies to defer expansion plans,
replace high dollar expansion alternatives with more modest alternatives, or simply
cancel expansion plans until the economy recovers. For example, DART recently
announced that because of continuing shortfalls in sales tax revenues, all proposed rail
expansion projects that are not currently under construction are being put on hold
indefinitely. This decision applies to all rail expansion projects proposed over the next
65
TxDOT 2008 Texas Transit Statistics and straight-line forecasts based on 2002 to 2008 growth

The Statewide Long-Range Transportation Plan 2035
Economics, Demographics, Freight, and the Multimodal 2-73
Transportation System – Conditions and Trends
20 years. This move is being made as a result of the continued recession and is a move
that many of the transit agencies in Texas are being forced to make, despite ongoing
efforts to provide transit alternatives to a broader group of people.
Overall, long-term system expansion will continue statewide; however, most transit
agencies are currently deferring major system expansions and focusing instead on less
costly, more efficient alternatives that incrementally increase ridership. Some of these
alternatives include implementing ITS to improve operational efficiency, encouraging
additional TODs around existing stations, and considering BRT, streetcar, and
commuter rail alternatives instead of the more costly light rail alternative. Additionally,
the current administration in Washington, D.C., is proposing a change to the criteria
used to select projects under the New Starts and Small Starts programs in order to
consider sustainability and livability benefits for urban rail and BRT projects. Many
agencies are focusing future expansion efforts toward using modern streetcars,
including Dallas, Fort Worth, Houston, San Antonio, and Austin.
2.8.7.2 Planned Transit for Central Texas
Bus: Capital Metro has proposed 11 fleet and route expansion projects for the 2010
and 2011 fiscal years to meet population growth trends in their service area (TxDOT,
Austin District – FY 2008–2011 STIP). The 11 fleet and route expansion projects
include the following:
Purchasing 7 buses for rapid transit services,
Replacing 149 buses,
Purchasing 49 sedans for paratransit service, and
Replacing 47 paratransit vans.
Capital Metro is also proposing to expand nonfixed routes for ADA paratransit service,
contract a third party to provide additional rural public transit, and provide job access
reverse commutes for the 2010 and 2011 fiscal years. These proposed projects are to
be funded with both non-federal and federal funds.
As part of its All Systems Go Long-Range Transportation Plan, Capital Metro has
proposed expansion of enhanced/BRT bus service. The BRT bus service (MetroRapid)
will consist of hybrid buses operating on 10 to 15 minute headways with limited stops,
offering up to 20 percent faster service within defined corridors. This service is expected
to offer high-tech features, such as traffic signal priority systems and continuously
updated bus arrival information. Initial service will include two routes along heavily
traveled Burnet Road, Lamar Boulevard, and Congress Avenue. Capital Metro has
The Statewide Long-Range Transportation Plan 2035
Economics, Demographics, Freight, and the Multimodal 2-74
Transportation System – Conditions and Trends
secured funding for the initial system and is completing designs of stations and the
traffic signal priority system.
Commuter Rail: Capital MetroRail is currently considering expansion of its commuter
rail system. The expansion would include:
A new 28-mile Green Line route connecting downtown Austin with East Austin,
Manor and Elgin, using existing Capital Metro-owned tracks,
Up to five additional trains operating on 20-minute peak period headways along
the new route that would serve eight stations, and
Projected ridership between 7,000 to 12,000 daily riders along the new route in
2030 assuming an all-day, weekday, bidirectional service.
Modern Street Car: The City of Austin has proposed a downtown modern streetcar
circulator system. The system would:
Have estimated daily ridership of approximately 13,100 passenger trips in 2030
for the downtown circulator system,
Have approximately 19,100 weekday riders along a future extension from
Downtown to Austin-Bergstrom International Airport,
Link to the existing Capital MetroRail Red Line and proposed Lone Star Rail
District (LSTAR) commuter rail route,
Connect key activity centers within the Austin metropolitan area including the
downtown area, the Capital Complex, the University of Texas, and the Mueller
Redevelopment area, and
Provide a future connection to the Long Center and Zilker Park.
The City of Round Rock is considering an 18.3-mile commuter rail connection from the
cities of Round Rock, Georgetown, and Pflugerville, called the RR/GT/PF Rail Link. The
proposed alignment has the connecting branch starting from the Capital Metropolitan
Transit Authority Red Line just north of Howard Lane and running along the SH 45
rights-of-way and the now-abandoned Missouri/Kansas/Texas corridor. Three stations
are planned for Round Rock, with one station planned for Georgetown and one for
Pflugerville.
The Lone Star Rail District (LSTAR): is a proposed passenger rail line that would
consist of express service from Downtown Austin to Downtown San Antonio, with stops
in San Marcos and New Braunfels. LSTAR would also provide local service between

The Statewide Long-Range Transportation Plan 2035
Economics, Demographics, Freight, and the Multimodal 2-75
Transportation System – Conditions and Trends
Georgetown and San Antonio with stops at 16 proposed stations. The rail line would run
in the Union Pacific corridor that parallels I-35. It is anticipated that completion and
federal approval of the engineering and environmental studies and receipt of a notice-
to-proceed allowing the Lone Star Rail to begin final design and construction will occur
in 2011.
2.8.7.3 Planned Transit for Corpus Christi
Bus: RTA has proposed seven fleet expansion projects for the 2010 and 2011 fiscal
years to meet population growth trends in their service area (TxDOT, Corpus Christi
District – FY 2008–2011 STIP). The seven fleet expansion projects include the
following:
Purchasing paratransit vehicles,
Purchasing service vehicles, vans and support vehicles, and
Repowering existing fleet to extend useful life.
2.8.7.4 Planned Transit for the Dallas-Fort Worth-Arlington MSA
Bus: DART is planning to reinforce key radial express bus corridors currently not
served by rail and improve cross-town express bus services. By doing this, it will allow
passengers to be connected from cross-town express bus routes to radial rail corridors
and key transit facilities. Future DART bus projects include the following:
4 Express bus projects,
9 Enhanced bus projects along Loop 12, and
2 BRT corridor projects (Northwest Highway and Ferguson Road).
According to the Fort Worth Transportation Authority’s 2005 Strategic Plan, The T’s
projected future plans, which are divided into future year segments 1 to 3 years, 4 to 10
years, and 11 to 25 years starting in 2005 include:
1 to 3 years
Research the feasibility of BRT systems,
Identify potential corridors, and
Coordinate with partner agencies to manage lanes for BRT and HOV.

The Statewide Long-Range Transportation Plan 2035
Economics, Demographics, Freight, and the Multimodal 2-76
Transportation System – Conditions and Trends
4 to 10 years
Acquire BRT funding,
Complete design and construction,
Begin circulator service for Downtown and Uptown areas, and
Manage bus priority signaling.
11 to 25 years
Establish high-capacity circulator services for Downtown and Uptown areas and
Coordinate with TxDOT to construct freeway bus-only ramps.
The T has proposed fleet replacement funding for the 2010–2011 fiscal years to meet
population growth trends in their service area, but do not give the exact number or
specification of replacement vehicles (TxDOT, Dallas-Fort Worth District – FY 2008–
2011 STIP). The proposed projects are to be funded with both local share and federal
monies.
DCTA has proposed two fleet replacement projects for the 2010 and 2011 fiscal years
to meet population growth trends in their service area (TxDOT, Dallas-Fort Worth
District – FY 2008–2011 STIP). The two fleet replacement projects include the following:
Replacing eighteen 30-foot vehicles, and
Replacing six vans.
Urban and Commuter Rail: DART, TRE and MATA have all announced expansions or
upgrades of their rail systems. In addition, Fort Worth’s The T is planning commuter rail
service from Fort Worth to DFW. In addition, the DCTA is planning rail service linking
Downtown Denton with the DART light rail transit (LRT) Green Line route in Carrollton.
DART’s 2030 Transit System Plan details the following information regarding the LRT
expansion:
By 2018, LRT mileage will increase to 93 miles,
By 2030, the LRT is projected to carry 160,000 riders a day,
By 2030 an additional 17 miles will be added to the LRT system for a system-
wide total of 110 miles,

The Statewide Long-Range Transportation Plan 2035
Economics, Demographics, Freight, and the Multimodal 2-77
Transportation System – Conditions and Trends
The expansion will include 29 additional stations in southeast Dallas, Rowlett,
Farmers Branch/Carrollton, Love Field, Irving, and DFW, and
Will expand commuter rail service along the 26-mile Cotton Belt corridor from the Red Line in Plano, Texas, to DFW.
DART is also conducting the Downtown Dallas Transit Study (D2) that seeks to identify
a preferred route for a second LRT alignment through the Central Business District
(CBD). The additional transit route would support the planned expansion of the regional
LRT and commuter rail system and would be vital to sustaining DART’s ridership
growth, mobility, and continued quality of service. The study will also address expansion
of the MATA trolley service to include modern streetcar service expansion into
Downtown Dallas.
DART and The T jointly operate the TRE commuter rail system. Proposed
improvements to the TRE system include the construction of a full double-track corridor
between Union Station in Downtown Dallas, and the ITC in Fort Worth. Construction
has begun on the east side of the corridor (Dallas County) and is planned for the west
side of the corridor (Tarrant County). The upgrades will allow for shorter service
headways across the entire corridor.
DART also supports MATA, the 5.2-mile historic trolley line (M-Line) linking Dallas’
uptown and downtown neighborhoods. MATA is planning a realignment and extension
that will cover the south end of the M-Line along Olive Street to a planned connection
with the LRT at the St. Paul Station within the Downtown Dallas CBD.
The T is planning commuter rail currently scheduled to begin service in 2013 that will
consist of:
Commuter rail service within a proposed 35-mile corridor from southwest Fort
Worth, through downtown Fort Worth, and then northeast to link with the DFW
Terminal A-B area,
Connections to the TRE at the Intermodal Transfer Center in Downtown Fort
Worth,
Connections to the DART Cotton Belt Corridor and future Orange Line at DFW,
and
Projected daily ridership of approximately 15,000 to 16,000 trips per day by 2030.
The City of Fort Worth is studying the feasibility of a modern streetcar system in
downtown Fort Worth. The system would connect downtown and the TRE to adjacent
mixed-use districts. In April 2010, the city voted to conduct a detailed streetcar study to

The Statewide Long-Range Transportation Plan 2035
Economics, Demographics, Freight, and the Multimodal 2-78
Transportation System – Conditions and Trends
examine such issues as alignments, funding, ridership, and projected economic
benefits.
DCTA is currently constructing a regional rail line linking downtown Denton with
Carrollton. The new service (the A-Train) will include:
A 21-mile regional rail line between downtown Denton and Carrollton, roughly
paralleling I-35E,
Five rail stations in Denton, Highland Village, and Lewisville,
Projected ridership of about 5,600 riders per day by 2030, and
Total DART/DCTA system-wide transit usage to increase by about 17,300
unlinked trips daily.
2.8.7.5 Planned Transit for the El Paso Area
Bus: According to the El Paso MPO, 2007 – TransBorder 2035 Metropolitan
Transportation Plan, Sun Metro has proposed to create a BRT system by 2015. The
BRT system would include ITS, signal prioritization, diamond-striped lanes, and transit
terminal interfaces. Sun Metro plans to create the BRT system incrementally, starting
with an arterial corridor and four extension corridors. The BRT projects will include, but
are not limited to, the following urban corridors within the city limits of El Paso:
International/Downtown Corridor, Alameda Corridor, Mesa Corridor, Montana Corridor,
and Dyer Corridor. Specific proposed BRT projects include:
The International/Downtown Corridor will connect the downtown international
bridges to the Oregon Street Transit Mall and on to the University of Texas at El
Paso by 2015. This BRT corridor will be the core line for the expansion of other
BRT corridors.
The Alameda Corridor is scheduled to be the first expansion of the BRT system
and will extend from the Oregon Street Mall to R.E. Thomason General Hospital
and on to the Texas Tech School of Medicine complex by 2015.
The Mesa BRT Corridor is scheduled for construction by 2015 and will connect
Baltimore Avenue to Crossroads (Doniphan Drive).
The Montana BRT Corridor is scheduled to be implemented by 2025 and would
connect the Central Business District to George Dieter Drive.
The Dyer BRT Corridor is planned to be implemented by 2025 and would
connect US 54 to Sun Valley Drive.

The Statewide Long-Range Transportation Plan 2035
Economics, Demographics, Freight, and the Multimodal 2-79
Transportation System – Conditions and Trends
Sun Metro’s other transit projects that are planned for the 2010 and 2011 fiscal years
include:
expanding ADA paratransit services, and
constructing station stops and terminals.
2.8.7.6 Planned Transit for Houston and Harris County
Bus: The 2025 METRO Solutions Plan proposes to increase the existing bus service by
50 percent, which equates to 44 new routes or 1,038 miles in new routes for their local
bus service. Other amenities that would support the increase in bus service include nine
new transit centers, upgrading existing transit centers, bus service on major streets,
longer hours of operation on major routes, and improved regional access to all activity
centers. The 2025 Plan also proposes new signature express service with major
crosstown routes. The proposed express routes will provide more frequent service with
fewer stops, distinguishable vehicles and upgraded passenger shelters, and
connections to regional activity and employment centers. Also planned by METRO are
nine new park and ride lots with over 250 miles of two-way park and ride service.
METRO has budgeted for five regionally significant transit projects for the 2010–2011
fiscal years to meet population growth trends in their service area (TxDOT, Houston
District – FY 2008–2011 STIP).
The regionally significant transit projects include the following:
Bus acquisition for express bus service,
Curb cut/intersection improvements,
250 bus maintenance facility, and
Bus pads/bus lane program.
As part of its long-range METRO Solutions plan, Houston METRO is developing
approximately 47 miles of BRT within the Greater Houston metropolitan area. The first
line, called the Bellaire Quickline signature bus service, currently operates on a 9-mile
West Houston to Texas Medical Center Transit Center Station route. The Quickline
features ultra-quiet hybrid buses, limited stops, automated announcements, and eight
state-of-the-art bus stations complete with digital ―next bus‖ signage to provide
commuters with real-time information. Additional BRT service is planned to begin
operation in 2010 or 2011 along additional commuter routes from the west and
northwest suburban areas of Houston.

The Statewide Long-Range Transportation Plan 2035
Economics, Demographics, Freight, and the Multimodal 2-80
Transportation System – Conditions and Trends
Urban and Commuter Rail: The 2025 METRO Solutions Plan forecast includes $2
billion of transit system investments as contained within the METRO Solutions Phase 2
Implementation Plan. Key rail components of the Implementation Plan include:
Expansion of five new rail lines,
Construction of 56 light rail stations within the Greater Houston area,
Purchase of 96-foot-long, double-articulated vehicles with a capacity of 72 seated
and approximately 169 standing passengers, or a total capacity of 241 per car,
Future connection opportunities for citizens and visitors to/from major activity
centers throughout the metropolitan area and additional commuting opportunities
for area residents, and
Increased ridership of approximately 15,000 to 30,000 trips per day by 2030,
Approximately 30 miles of additional LRT,
Service to the North Houston, East End, Southeast, Uptown, and University
Corridors,
Approximately 28 miles of commuter rail transit, and
Ten new transit intermodal facilities serving light rail, commuter rail, bus, and
auto modes.
The University Corridor LRT project will consist of an 11.3-mile, double-track LRT
line with 19 stations extending from the Hillcroft Transit Center on the west to the
Eastwood Transit Center on the east, with the majority of the line located within
the inner city I-610 Loop of the City of Houston. The line will include 32 light rail
vehicles, and a projected total ridership of approximately 49,200 unlinked trips
per day by 2030.
Potential commuter rail lines currently being considered include:
US 90A, from the Fannin South Station to Missouri City,
Westpark, from the Hillcroft Transit Center to FulShear,
US 290, from Downtown to Cypress, and
Within the Houston to Galveston corridor.

The Statewide Long-Range Transportation Plan 2035
Economics, Demographics, Freight, and the Multimodal 2-81
Transportation System – Conditions and Trends
2.8.7.7 Planned Transit for the San Antonio Area
Bus: VIA is currently in the process of creating a Long Range Comprehensive
Transportation Plan for Bexar County to year 2035. This comprehensive study labeled
as SmartWaySA will identify and prioritize high capacity transit corridors for a range of
transit alternatives and supporting activities.
VIA has budgeted for several transit projects for the 2010 and 2011 fiscal years to meet
population growth trends in their service area (TxDOT, San Antonio District – FY 2008–
2011 STIP).
The transit projects include the following:
Constructing bus stations,
Constructing and improving park and ride lots,
Constructing passenger centers,
Implementing job access/reverse commuting services,
Improving paratransit services,
Contracting third parties for transportation services,
Implementing super stops,
Improving traffic signal priorities for bus service,
Replacement large and small buses,
Purchasing expansion buses, and
Improving elderly and disabled program.
The proposed projects are to be funded with both local share and federal monies.
The City of San Antonio is currently planning for the implementation of BRT services
from the proposed Westside Multimodal Transit Center near downtown San Antonio to
the proposed South Texas Medical Center Transit Center. The service, called VIA
Primo, would operate along Fredericksburg Road and Medical Drive and would connect
major employment centers in the medical center area, Balcones Heights, Deco District,
and the downtown CBD. The proposed BRT route would be approximately 20 miles in
length and will serve the two transit centers, eight stations along the corridor, and local
stops in the CBD and medical center area. Service may also extend to The University of
Texas at San Antonio’s main campus in far North San Antonio.

The Statewide Long-Range Transportation Plan 2035
Economics, Demographics, Freight, and the Multimodal 2-82
Transportation System – Conditions and Trends
According to VIA, the proposed VIA Primo system would utilize diesel-electric hybrid
vehicles, and may incorporate such ITS features as automated scheduling/dispatch
systems, signal priority systems, and real-time passenger service information. VIA is
currently conducting environmental assessments along the proposed route with service
expected to begin in 2012.
2.8.8 Planning for Rural Transit Systems
Rural transit systems provide services to areas not served by urban and metropolitan
systems, providing services for special needs passengers as well as transportation for the
general public. While the majority of the population growth will be in the larger communities,
counties with less than 50,000 population are projected to grow by over 625,000 people by
2035. The growth in population over 65 years of age for Texas as a whole is 144 percent (or
nearly 3.5 million) which will lead to a higher percentage of the population within this age
bracket for most counties.
Future demand for rural transit services is generally function of the size of the elderly
population, income levels and participation in special needs programs. As the Texas
population ages and as people continue to move to fringe areas around larger cities, the
future need for rural transit will also increase. In contrast, future services are highly
dependent upon the amount of local, state, and federal funding provided to the agency.
Expansion activities for these rural transit systems are often a combination of additional
vehicles and technology upgrades to improve the efficiency of the fleet, such as the
implementation of a comprehensive ITS program to improve dispatching and
scheduling. Transportation needs are often linked to the need for medical care and
other social services only available in larger urban areas. In general, however,
expansion activities for these small urban and rural transit systems may include of the
implementation of a comprehensive ITS program to augment additional bus service
routes.
2.8.9 Texas Intercity Bus Service
Within Texas and nationwide, the largest intercity bus systems are Greyhound Lines
and the Trailways system. Greyhound had its beginnings in Minnesota in the 1920s,
and through numerous mergers and acquisitions, evolved into the present nationwide
system. The Trailways system formed in 1936 consisted of various companies working
together to form a nationwide system. However, the company underwent reorganization
in 1987 with the result that only smaller Trailways companies currently exist with many
of these companies providing charter services only. The largest regional intercity bus
services in Texas are Kerrville Bus Company and Valley Transit Company. Kerrville Bus
Company provides service to most of Texas extending into parts of western Louisiana

The Statewide Long-Range Transportation Plan 2035
Economics, Demographics, Freight, and the Multimodal 2-83
Transportation System – Conditions and Trends
and Arkansas. Valley Transit has more than 60 vehicles in its coach fleet with a service
area that extends from Houston and San Antonio in the north, southward through all of
South Texas and the Rio Grande Valley into Northern Mexico. In addition, several other
smaller companies provide intercity and coach charter service within Texas. Table 2-21
lists existing intercity transit providers in Texas along with service area, fleet
information, and type of service and Figure 2-37.
Table 2-21: Summary of Intercity Bus Providers66
Intercity Bus Providers Service Area Fleet Information Charter (Y/N) Fixed Routes
All Aboard America Midland/Odessa to Presidio,
Texas Motor-coaches Y Y
Arrow Trailways of Texas
Dallas, Houston, San Angelo, Austin, and San Antonio, and
Nationwide
Motor-coaches, mini-coaches, and vans
Y Y
Concho Coaches, Inc. San Angelo and Midland/Odessa,
Texas Motor-coaches Y N
Greyhound Lines, Inc. Nationwide and Statewide 1,250 buses Y Y
Sun Travel Trailways Lake Charles Louisiana and
Beaumont, Texas
Nine 55 passenger motor-coaches and two 29 passenger mid-sized
coaches
Y N
Gotta Go Trailways Dallas, Fort Worth, and Abilene,
Texas Motor-coaches Y N
Eagle Trailways of Texas Dallas, Fort Worth, Houston, San
Antonio, and Austin, Texas Motor-coaches with 36
to 56 passengers Y N
Kerrville Bus Company, Inc.
Texas, Arkansas, Louisiana Motor-coaches with 55
passengers Y Y
Sierra Trailways of Texas
College Station/Bryan, Freeport, Galveston, Houston, Sugar Land, Alvin, Pearland, and League City,
Texas
Motor-coaches with 44 to 55 passengers
Y N
Lone Star Trailways East Texas and Shreveport,
Louisiana 10 motor-coaches Y N
T.N.M. & O. Coaches, Inc.
Same as Greyhound Operated by Greyhound Y Y
Valley Transit Company, Inc.
Mission, Harlingen, Brownsville, Roma, South Padre Island, San Antonio, and Houston, Texas,
Northern Mexico
Vans with 10 to 14 passengers, motor-
coaches with 33 to 57 passengers
Y Y
Central Texas Trails Central Texas and Nationwide
charter service 10 motor-coaches with 29 to 57 passengers
Y N
Sun Set Stages, Inc. Del Rio, TX and Nationwide Motor-coaches Y N
Lone Star Coaches, Inc.
Local and Nationwide charter service; Serving the Greater
Northeast Texas area; based in Grand Prairie, TX
Motor-coaches with 48 to 57 passengers
Y N
66
URS, 2010; from bus provider's websites

The Statewide Long-Range Transportation Plan 2035
Economics, Demographics, Freight, and the Multimodal 2-84
Transportation System – Conditions and Trends
Figure 2-37: Intercity Bus Routes67
67
Texas Bus Association, Inc., Intercity Bus Routes as of 2007

The Statewide Long-Range Transportation Plan 2035
Economics, Demographics, Freight, and the Multimodal 2-85
Transportation System – Conditions and Trends
2.8.10 Intercity Passenger Rail
Note: Detailed Information regarding intercity passenger rail in Texas can be found in
the Texas Rail Plan available at:
http://www.txdot.gov/public_involvement/rail_plan/trp.htm
Intercity passenger rail service in Texas is provided by Amtrak. Amtrak is a common
name for the National Railroad Passenger Corporation, which is a corporation owned by
the U.S. government and several railroad companies that contributed equipment when
the corporation was chartered in 1971. Amtrak routes in Texas include:
The Texas Eagle: Chicago to San Antonio, via St. Louis, Little Rock, Texarkana, Dallas, Fort Worth, and Austin,
The Sunset Limited: New Orleans to Los Angeles, via Houston, San Antonio, Alpine, and El Paso, and
The Heartland Flyer: Daily round trip between Oklahoma City, Oklahoma and Fort Worth, Texas.
Additionally, Amtrak’s partnership with Greyhound serves other areas of the state by
providing bus connections where possible. Table 2-22 shows annual ridership for each
route for 2008 and 2009.
Table 2-22: Amtrak Ridership 2008–200968
Amtrak Line 2008
Ridership 2009
Ridership % Change
in Ridership
Texas Eagle Chicago-Dallas-San Antonio
251,518 260,467 3.6
Sunset Limited New Orleans-San Antonio-Los Angeles
71,719 78,775 9.8
Heartland Flyer Oklahoma City-Fort Worth
80,892 73,564 -9.1
The Texas Eagle and the Sunset Limited lines both experienced increases in ridership
over this period of time; however, the Heartland Flyer experienced a drop in ridership.
While the purpose for Amtrak ridership is primarily recreational, this upward trend in
ridership for the Texas Eagle and the Sunset Limited shows an interest in intercity
passenger rail transportation in Texas. Figure 2-38 illustrates these Amtrak routes.
68
USDOT, Federal Highway Administration (FRA), National Rail Plan, 2009

The Statewide Long-Range Transportation Plan 2035
Economics, Demographics, Freight, and the Multimodal 2-86
Transportation System – Conditions and Trends
Figure 2-38: Current Amtrak Routes
2.8.11 High-Speed Rail Planning in Texas
Note: Detailed Information regarding high-speed rail (HSR) in Texas can be found in the
Texas Rail Plan available at http://www.txdot.gov/public_involvement/rail_plan/trp.htm
The Federal Railroad Administration (FRA) of the USDOT released a strategic planning
document in April 2009 outlining the administration’s vision for HSR development in the
U.S. The report listed national strategic transportation goals for HSR investment.
The report’s Strategic Transportation Goals69 state that transportation investment
strategy must address several strategic goals in the coming years:
Ensure safe and efficient transportation choices. Promote the safest possible
movement of goods and people, and optimize the use of existing and new
transportation infrastructure.
Build a foundation for economic competitiveness. Lay the groundwork for
near-term and ongoing economic growth by facilitating efficient movement of
69
FRA, Vision for High-Speed Rail in America, 2009, page 1

The Statewide Long-Range Transportation Plan 2035
Economics, Demographics, Freight, and the Multimodal 2-87
Transportation System – Conditions and Trends
people and goods, while renewing critical domestic manufacturing and supply
industries.
Promote energy efficiency and environmental quality. Reinforce efforts to
foster energy independence and renewable energy, and reduce pollutants and
greenhouse gas emissions.
Support interconnected, livable communities. Improve quality of life in local
communities by promoting affordable, convenient and sustainable housing,
energy and transportation options.
As support, the plan asserts, ―each transportation mode plays a critical role in intercity passenger transportation, but the comparative advantage of each varies by market factor…‖ and provides the following table (Table 2-23) as support.
Table 2-23: FRA, Potential Modal Comparative Advantage by Market
Intercity Distance Mile
Population Density 0–100 100–600 600–3,000
Light 1) Auto 1) Auto 2) Conventional Rail
1) Auto 2) Air
Moderate 1) Auto 2) Commuter Rail
1) High Speed Rail 2) Auto
1) Auto 2) Air
High 1) Commuter Rail 2) Auto
1) High Speed Rail 2) Air
1) Air
In Texas, the large metropolitan regions all fall within the population densities and 100
to 600 mile intercity distance range needed for HSR to have a comparative market
advantage.
One of the distinguishing arguments for HSR is its ability to move people at high speeds
from major cities and attractors, thus reducing a person’s travel-time. Another benefit is
the reduction in traffic congestion on the key roadways across the State. A final benefit
that is certain to help Texans is the opportunity to move people who have limited
transportation options.
Since the approval of the American Recovery and Reinvestment Act (ARRA) by
Congress on February 13, 2009,70 the momentum for HSR projects throughout the
United States has increased considerably. HSR has been under study throughout the
U.S. in various iterations either with intrastate or interstate programs for decades. This
new funding mechanism provided states and regions with the ability to move forward
70
http://www.recovery.gov/About/Pages/The_Act.aspx

The Statewide Long-Range Transportation Plan 2035
Economics, Demographics, Freight, and the Multimodal 2-88
Transportation System – Conditions and Trends
with projects that either were currently under study or had been previously studied. After
a nationwide competitive process, ARRA awarded over $8 billion to HSR projects
throughout the U.S. The proposed FRA National High Speed Rail Map is shown on
Figure 2-39.
Figure 2-39: High Speed Rail Map from the Federal Railroad Administration71
While Texas did not have a high-speed rail project ready for the 2009 ARRA application
process, the Fort Worth area was awarded $4 million for improvements to Amtrak’s
Texas Eagle,72 which operates between Fort Worth and Austin. This award is for final
design and construction of signal timing improvements, which will improve the operating
speed and on-time performance of this important rail arterial. As of 2010, TxDOT has
prepared and submitted planning fund applications for three HSR corridors:
Austin to Houston: This corridor would incorporate five intermediate cities;
Bryan/College Station, Giddings, Brenham, and Hempstead;
71
FRA, Vision for High-Speed Rail in America, 2009, page 6 72
http://www.whitehouse.gov/sites/default/files/rss_viewer/hsr_awards_summary_public.pdf
Red - Designated High-speed Rail Corridor Blue - Northeast Corridor (NEC)
Grey - Other Passenger Rail Routes

The Statewide Long-Range Transportation Plan 2035
Economics, Demographics, Freight, and the Multimodal 2-89
Transportation System – Conditions and Trends
Dallas/Fort Worth to Houston: This corridor would parallel I-45. Intermediate
cities connected by this corridor would include; Waco, Bryan/College Station,
Corsicana, Conroe, and Huntsville;
Oklahoma City to South Texas: This would be an 850-mile corridor from
Oklahoma City to South Texas includes the cities of Dallas/Fort Worth, Waco,
Austin, San Antonio, Laredo, Corpus Christi, and Brownsville.
2.9 Texas Bicycle and Pedestrian Plans
Bicycle and pedestrian travel modes are becoming increasingly important parts of the
Texas transportation system. They provide positive benefits both for users and for the
community as a whole. Bicyclists and pedestrians experience increased levels of
physical fitness, greater mobility (especially for nondrivers), financial savings, and
enjoyment. Every trip taken by bicycle or on foot immediately benefits communities by
decreasing traffic and air pollution. Many planning elements that are designed to
increase the livability of communities, such as traffic calming, improved crossing
signals, and decreased sprawl, also benefit the bicycle and pedestrian modes by
making them safer, more practical, and more pleasant.
Unlike other transportation modes, bicycle and pedestrian movements provide more
than a means to get from one place to another for errands and work. Bike and
pedestrian travel modes also provide the community with recreational activities. Most
improvements that are made to bicycle and pedestrian facilities therefore serve the work
commute, other trip purposes, and recreation functions. The pedestrian mode is also
unique in that travel by every mode includes a pedestrian component, even if it is only a
walk from a parking place into a building.
Bicycle and pedestrian modes are not, however, appropriate for most trips. According to
national data, the bicycle mode is most often utilized for trips shorter than 2 miles and
the pedestrian mode is most often utilized for trips shorter than one-quarter of a mile,
considerably shorter than the average 12-mile commute to work. While these modes
may be appropriate for short trips near home, such as errands to local stores or visits to
nearby friends and family, three-quarters of trips shorter than 1 mile are currently made
with motor vehicles.73
What can be safely assumed is that most all trips involve some type of pedestrian
component. This may be as little as the walk from a parking place or bus stop to a final
destination, or as much as the selection of walking as a primary commuting mode.
73
Bicyclinginfo.org: Pedestrian and Bicycle Information Center, ―Bicycling Statistics: Random Numbers: National Personal
Transportation Survey,‖ http://www.bicyclinginfo.org/insight/fact_sheets/index.htm#random.

The Statewide Long-Range Transportation Plan 2035
Economics, Demographics, Freight, and the Multimodal 2-90
Transportation System – Conditions and Trends
Walking is also a common recreational activity. It can also be assumed that Texas
bicycle transportation needs involve a range of different bicyclists. The most
experienced adult riders may need bicycle facilities that support rapid travel on arterial
streets with direct access to a work destination. At the other end of the spectrum,
bicycle-riding children may need access to destinations such as schools using
residential streets with low traffic volumes.
The State of Texas has recognized that bicycle and pedestrian modes have a place in
its transportation system and has committed to their expansion and improvement.
TxDOT has adopted the AASHTO Guide for the Development of Bicycle Facilities as
official design criteria for bicycle facilities. The state has also taken advantage of new
sources of funding such as transportation enhancement funds for bicycle and
pedestrian facilities available in the Intermodal Surface Transportation Efficiency Act
(ISTEA) of 1991, the Transportation Equity Act for the 21st Century (TEA-21, and the
Safe, Accountable, Flexible, Efficient Transportation Equity Act: A Legacy for Users
(SAFETEA-LU).
Additionally, the 25 MPOs in Texas address cyclist and pedestrian needs in their
respective MTPs. Several Texas MPOs have extensive bicycle and pedestrian networks
that they promote in stand-alone plans. The need for facilities is difficult to forecast, but
based on a review of the MPOs’ MTPs, basic goals indentified include:
Improve access to the downtown, including municipal, cultural and shopping
locations
Improve access to local recreational opportunities
Provide for safe crossing of major highways
Provide access to a key inter-modal transit center
Improve bicycle and motor vehicle operator education
Promote opportunities for bicycling in the City.
2.9.1 MPO Bicycle and Pedestrian Plans
Bicycle and pedestrian travel are an increasingly important part of the Texas
transportation system. Between 1990 and 2007 Texas experienced a 38 percent
increase in commuters who bicycled to work. Similarly, between 2000 and 2007 people

The Statewide Long-Range Transportation Plan 2035
Economics, Demographics, Freight, and the Multimodal 2-91
Transportation System – Conditions and Trends
walking to work increased by 9 percent. In 2010, Texas had seven of the top 50 cities
in terms of percentage of commuters who bicycled or walked to work.74
MPOs are federally mandated and federally funded transportation policy-making
organizations in the United States that are made up of representatives from local
government and governmental transportation authorities. Each MPO is tasked with
providing a continuing, cooperative, and comprehensive planning process for federally
funded transportation projects and programs in its respective region. Of the 25 MPOS,
all include a bicycle/pedestrian section in their MTPs. Moreover, there are additional
stand-alone plans in regions that establish a system of bicycle and pedestrian routes
Table 2-24.
Table 2-24: MPO Bicycle and Pedestrian Plans
MPO Location Included in
MTP Additional Studies/Plans
Abilene MPO Abilene, TX Yes
2006 Sidewalk Master Plan
2004 Abilene Comprehensive Plan (based on The City of Abilene’s Multi-use Bicycle & Pedestrian Trail Plan)
Amarillo MPO Amarillo, TX Yes 2003 Amarillo Hike and Bike Plan
CAMPO Austin, TX Yes
2030 Regional Bicycle Map
2030 Campo Mobility Plan
2006 City of Austin Bicycle & Pedestrian Plans
SETRPC Beaumont, TX Yes
Brownsville MPO
Brownsville, TX Yes 2004 Bicycle Pedestrian Plan
BCSMPO Bryan-College
Station, TX Yes
CRP Corpus Christi, TX Yes 2004 Bicycle & Pedestrian Plan
El Paso El Paso, TX Yes Stand Alone Plan
HSB MPO Harlingen, TX Yes Stand Alone Plan
H-GAC Houston-Galveston,
TX Yes
2007 Regional Bikeway Plan 2004 Pedestrian and Bicycle Special Districts Study Standing
Bike/Ped Advisory Sub-Committee
HMPO Hidalgo, TX Yes Non-Motorized Bicycle Plan in MTP
2007 Multi-Modal Study
K-T MPO Belton, TX Yes
Laredo Laredo, TX Yes
Longview MPO
Longview, TX Yes
Lubbock Lubbock, TX Yes Comprehensive Bicycle Plan
MOTOR Odessa, TX Yes
74
Alliance for Biking and Walking. Bicycling and Walking in the United States 2010 Benchmarking Report. Available at
http://www.peoplepoweredmovement.org/site/

The Statewide Long-Range Transportation Plan 2035
Economics, Demographics, Freight, and the Multimodal 2-92
Transportation System – Conditions and Trends
Table 2-24: MPO Bicycle and Pedestrian Plans
MPO Location Included in
MTP Additional Studies/Plans
NCTCOG Dallas-Fort Worth Yes Bicycle and Pedestrian Advisory Committees
San Angelo MPO
San Angelo, TX Yes 2008 Bicycle and Pedestrian Plan
SABC MPO San Antonio, TX Yes City of San Antonio Bicycle Plan
Regional Bicycle Travel Patterns Study
SD-MPO Sherman, TX Yes
Texarkana MPO
Texarkana, TX Yes 2009 Bicycle and Pedestrian Master Plan
Tyler MPO Tyler, TX Yes 2009 Regional Trail Plan
Victoria Victoria, TX Yes
WUTS Waco Yes
WFS MPO Wichita Falls, TX Yes
Source: Association of Texas Metropolitan Planning Organization, http://www.texasmpos.org/
The Abilene MPO used the Abilene City Council’s Multi-Use Bicycle & Pedestrian Trail
Plan as a foundation for the pedestrian mobility studies in the 2004 Abilene
Comprehensive Plan. The Plan set guidelines for ―paths, lanes and routes‖ shared by
bicyclists, pedestrians and motorists. The MPO also encouraged use by facility
accessibility (i.e., bicycle parking, shower/lockers and theft reduction measures) and
suggested funding opportunities, such as, Transportation Enhancement Funds, Safe
Routes to School Program, National Park Service, Texas Park and Wildlife –
Recreational Trails Program and other private or nonprofit funding for projects.75
The City of Amarillo approved a ―Hike and Bike Master Plan‖ in July of 2003. The
Amarillo Hike and Bike Master Plan established a system of bicycle and pedestrian
routes in and around the city. Implementation of bicycle facilities included plans to stripe
86 miles of cycling lanes. The plan outlined a schedule for linking neighborhoods south
to the Rock Island Rail Trail and provides connections to selected schools.76
As a result of the large number of cyclists and pedestrians in Austin, the Capital Area
Metropolitan Planning Organization (CAMPO), through cooperative relationships with
the City of Austin and other stakeholder groups, has developed a comprehensive
planning program to manage its well-established and highly integrated network of
bicycle-pedestrian facilities.
75
Abilene Metropolitan Area Metropolitan Transportation Plan 2010–2035; http://www.abilenempo.org/ 76
Amarillo Metropolitan Transportation Plan 2010–203; http://www.amarillompo.com/

The Statewide Long-Range Transportation Plan 2035
Economics, Demographics, Freight, and the Multimodal 2-93
Transportation System – Conditions and Trends
Due to the growing number of commuters and travelers, it is no doubt that MPOs and
city councils around the state are focusing on bicycle and pedestrian transportation
modes in order to achieve a balanced multimodal transportation system.
One of the greatest challenges facing the bicycle and pedestrian field is the lack of
documentation on usage and demand. Without accurate and consistent demand and
usage figures, it is difficult to measure the positive benefits of investments in these
modes, especially when compared to the other transportation modes such as the
private automobile. The 2002 National Survey of Pedestrian and Bicyclist Attitudes and
Behaviors (U.S. Department of Transportation 2003) found only 0.9 percent of all trips in
the United States were taken by bicycle, so bicycle counts on a route can vary by a
large percentage, with only a small change in numbers. This lack of quantifiable
methodologies for the non-motorized modes is a likely reason the modes are often
under-funded and an afterthought in policy decision-making.
2.9.2 Texas Regional Trails
The most extensive and well-documented system of bicycle and walking facilities in the
State of Texas is maintained by the Texas Parks and Wildlife Department (TPWD).
While these facilities are mostly recreational in nature, some multi-purpose trails may
have utility in supporting nonrecreational trips. The statewide nature of this network and
the available connections to other bicycle and pedestrian facilities warrants
consideration as part of the Texas Transportation System.
2.9.2.1 Texas Parks and Wildlife Trails
The FHWA provides funding for the Texas Recreational Trails Program from a portion of
federal gas taxes paid on fuel used in nonhighway recreational vehicles. While TPWD
administers the program, proposed expenditures must be listed in TxDOT’s STIP.
Funds can be spent on both motorized and nonmotorized recreational trail projects such
as:
Construction of new recreational trails
Improvement of existing trails
Development of trailheads or trailside facilities, and
Acquisition of trail corridors.
Texas was the first state in the nation to create birding and wildlife viewing trails, an
idea that resulted in similar projects throughout North America. These trails provide
economic incentives for landowners and communities to conserve habitats while
The Statewide Long-Range Transportation Plan 2035
Economics, Demographics, Freight, and the Multimodal 2-94
Transportation System – Conditions and Trends
providing recreational opportunities for the traveling public. The wildlife trails of Texas
promote sustainable economic development and build public support for conservation of
wildlife and habitats.
TPWD promotes four main (eight total) birding and wildlife trails in Texas:
Great Texas Coastal Birding Trails (Upper Texas Coast, Central Texas Coast,
and Lower Texas Coast)
Heart of Texas Wildlife Trails (East and West)
Panhandle Plains Wildlife Trail
Prairies and Pineywoods Wildlife Trail (East and West)
For general information on TPWD’s Trail programs, visit http://beta-www.tpwd.
state.tx.us/.
2.9.2.2 The Texas Heritage Trails Program
A combination of historic preservation and tourism, this economic development initiative
encourages communities to partner to promote Texas’ historic and cultural resources.
These successful local preservation efforts, combined with statewide marketing of the
areas as heritage regions, increase visitation to cultural and historic sites and bring
more dollars to Texas communities, especially rural ones.
The Texas Heritage Trails Program (THTP) is based around 10 scenic driving trails
created in 1968 by Gov. John Connally and the Texas Highway Department as a
marketing tool. The trails were established in conjunction with the HemisFair, an
international exposition that commemorated the 250th anniversary of the founding of
San Antonio.
In 1997, the Texas Historical Commission (THC) was charged by the State Legislature
to create a statewide heritage tourism program. The THC based its program on the
original driving trails, creating 10 heritage regions, but included all the surrounding
counties: Texas Brazos Trail Region, Forest Trail Region, Forts Trail Region, Hill
Country Trail Region, Lakes Trail Region, Independence Trail Region, Mountain Trail
Region, Pecos Trail Region, Plains Trail Region, and Tropical Trail Region (Figure
2-40).
Several of these regions including the Mountain Region and Forts Trail Region are
promoting cycling and/or sponsoring pilot cycling programs. In particular, the Mountain

The Statewide Long-Range Transportation Plan 2035
Economics, Demographics, Freight, and the Multimodal 2-95
Transportation System – Conditions and Trends
Trail Region is promoting cycle-friendly accommodations and events. Information
regarding cycling in this region can be found at:
http://www.texasmountaintrail.com/index.aspx?page=7
And information regarding cycling in the Forts Trail Region can be found at:
http://www.texasfortstrail.com/index.aspx?page=1416
Figure 2-40: Texas Heritage Trails Program Regions
For general information on THC’s Trails program visit http://www.thc.state.tx.us/
heritagetourism/htprogram.shtml.
2.10 Texas International Border Transportation
Texas’ 1254-mile border with Mexico creates a vital and unique economic, trade, and
transportation region. Border entry points are both urban and rural between Texas and
Mexico; and some regions have multiple entry points. The crossings handle vehicular,
commercial, and pedestrian traffic. They are owned by the U.S. government, the State
of Texas, local governmental entities, and private companies. The crossings are:
El Paso, Texas – Ciudad Juárez, Chihuahua
Fabens, Texas – Práxedis G. Guerrero, Chihuahua
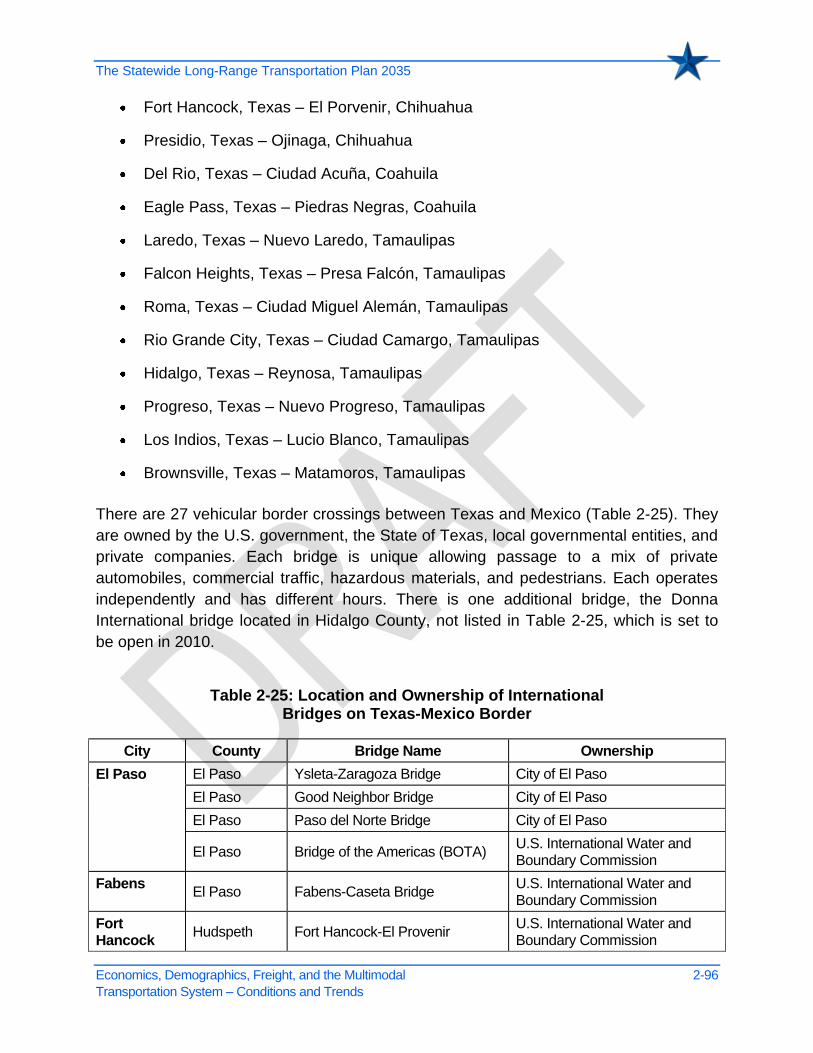
The Statewide Long-Range Transportation Plan 2035
Economics, Demographics, Freight, and the Multimodal 2-96
Transportation System – Conditions and Trends
Fort Hancock, Texas – El Porvenir, Chihuahua
Presidio, Texas – Ojinaga, Chihuahua
Del Rio, Texas – Ciudad Acuña, Coahuila
Eagle Pass, Texas – Piedras Negras, Coahuila
Laredo, Texas – Nuevo Laredo, Tamaulipas
Falcon Heights, Texas – Presa Falcón, Tamaulipas
Roma, Texas – Ciudad Miguel Alemán, Tamaulipas
Rio Grande City, Texas – Ciudad Camargo, Tamaulipas
Hidalgo, Texas – Reynosa, Tamaulipas
Progreso, Texas – Nuevo Progreso, Tamaulipas
Los Indios, Texas – Lucio Blanco, Tamaulipas
Brownsville, Texas – Matamoros, Tamaulipas
There are 27 vehicular border crossings between Texas and Mexico (Table 2-25). They
are owned by the U.S. government, the State of Texas, local governmental entities, and
private companies. Each bridge is unique allowing passage to a mix of private
automobiles, commercial traffic, hazardous materials, and pedestrians. Each operates
independently and has different hours. There is one additional bridge, the Donna
International bridge located in Hidalgo County, not listed in Table 2-25, which is set to
be open in 2010.
Table 2-25: Location and Ownership of International Bridges on Texas-Mexico Border
City County Bridge Name Ownership
El Paso El Paso Ysleta-Zaragoza Bridge City of El Paso
El Paso Good Neighbor Bridge City of El Paso
El Paso Paso del Norte Bridge City of El Paso
El Paso Bridge of the Americas (BOTA) U.S. International Water and Boundary Commission
Fabens El Paso Fabens-Caseta Bridge
U.S. International Water and Boundary Commission
Fort Hancock
Hudspeth Fort Hancock-El Provenir U.S. International Water and Boundary Commission

The Statewide Long-Range Transportation Plan 2035
Economics, Demographics, Freight, and the Multimodal 2-97
Transportation System – Conditions and Trends
Table 2-25: Location and Ownership of International Bridges on Texas-Mexico Border
City County Bridge Name Ownership
Presidio Presidio Presidio Bridge State of Texas
Del Rio Val Verde
Del Río-Cuidad Acuña International Bridge
City of Del Rio
Val Verde Lake Amistad Dam US and Mexico
Eagle Pass Maverick Camino Real International City of Eagle Pass
Maverick Eagle Pass Bridge I City of Eagle Pass
Laredo Webb Juárez-Lincoln Bridge City of Laredo
Webb Gateway to the Americas Bridge City of Laredo
Webb World Trade Bridge City of Laredo
Webb
Laredo-Colombia Solidarity Bridge
City of Laredo
Falcon Heights
Zapata Lake Falcon US and Mexico
Roma Starr
Roma-Ciudad Miguel Alemán Bridge
Starr County
Rio Grande City
Starr Starr-Camargo Bridge Private
Los Ebanos Hidalgo Los Ebanos* Private
Mission Hidalgo Anzalduas International Bridge
City of McAllen, Mission, Hidalgo, Granjeno
Hidalgo Hidalgo McAllen-Hidalgo-Reynosa Bridge City of McAllen
Pharr Hidalgo
Pharr-Reynosa International Bridge
City of Pharr
Progresso Hidalgo Progreso-Nuevo Progreso Private
Los Indios Cameron Free Trade Bridge at Los Indios
Cameron County, City of San Benito, and City of Harlingen
Brownsville Cameron B&M Bridge at Brownsville Private
Cameron Veterans International Bridge at Los Tomates
Cameron County and City of Brownsville
Cameron Gateway International Bridge Cameron County
*Los Ebanos is a ferry
Table 2-26 and Figure 2-41 show total border crossings in 1995, 2000, and 2009. As
shown in the table and figure, border crossings decreased in 2009 relative to 2000.

The Statewide Long-Range Transportation Plan 2035
Economics, Demographics, Freight, and the Multimodal 2-98
Transportation System – Conditions and Trends
Table 2-26: Texas-Mexico Personal Vehicle, Truck, and Pedestrian Crossings, 1995–2000–200977
Year Vehicles Buses Pedestrians Trucks Trains
1995 40,632,864 82,776 15,293,043 1,892,545 8,268
2000 50,367,666 105,217 19,910,809 3,113,277 5,812
2009 35,585,141 102,111 18,847,287 2,854,881 6,406
Figure 2-41: Texas-Mexico Personal Vehicle, Truck, and Pedestrian Crossings, 1995–2000–200978
Figure 2-42 and Figure 2-43 show total border crossing in 1995, 2000, and 2009 for
personal vehicles and trucks, respectively, by port region. As shown in the table and
figure, border crossings decreased in 2009 relative to 2000.
77
Bureau of Transportation Statistics 78
Bureau of Transportation Statistics
-
10,000,000
20,000,000
30,000,000
40,000,000
50,000,000
60,000,000
1995 2000 2009
To
tal Y
ea
rly C
ros
sin
gs
Year
VEHICLES
PEDESTRIANS
TRUCKS

The Statewide Long-Range Transportation Plan 2035
Economics, Demographics, Freight, and the Multimodal 2-99
Transportation System – Conditions and Trends
Figure 2-42: Personal Vehicle Border Crossings by Port, 1995–2000–200979
Figure 2-43: Truck Border Crossings by Port, 1995–2000–200980
Future border crossings are difficult to predict and will vary based on economic, social,
and political conditions.
79
U.S. Department of Transportation, Research and Innovative Technology Administration, Bureau of Transportation
Statistics, Border Crossing/Entry Data. Latest Available Data: December 2009 as of 6/1/2010 80
Ibid
0
2,000,000
4,000,000
6,000,000
8,000,000
10,000,000
12,000,000
14,000,000
16,000,000
18,000,000
1995 2000 2009
Brownsville
Del Rio
Eagle Pass
El Paso
Fabens
Hidalgo
Laredo
Presidio
Progreso
Rio Grande City
0
200,000
400,000
600,000
800,000
1,000,000
1,200,000
1,400,000
1,600,000
1995 2000 2009
Brownsville
Del Rio
Eagle Pass
El Paso
Fabens
Hidalgo
Laredo
Presidio
Progreso
Rio Grande City

The Statewide Long-Range Transportation Plan 2035
Economics, Demographics, Freight, and the Multimodal 2-100
Transportation System – Conditions and Trends
2.11 Texas Aviation
Note: Detailed Information regarding the aviation system in Texas can be found in the
Texas Airport System Plan (TASP) available at:
http://www.dot.state.tx.us/business/aviation/system_plan.htm
Texas is home to one of the most robust and active state airport systems in the nation.
The state has 292 existing airports spanning in size from large hub commercial airports
in heavily populated metropolitan areas to very small general aviation airports located in
remote areas of the state. Due to the vast size of the state, the diverse activities of
Texas businesses and residents, and the ever-present need to move people and goods
efficiently, airports are critical to the state’s economy.
The importance of aviation to Texas is highlighted by the fact that three of the world’s
largest commercial airlines (American, Continental, and Southwest) maintain
headquarters in the state and conduct major operations from Texas airports. These
airlines have certainly contributed to the growth of air transportation within the state and,
in fact, throughout the world. The growing demand for air transportation in turn, has led
to the continued development of the Texas’ commercial and general aviation (GA)
airports.
While commercial aviation may be the most visible part of the Texas airport system, it is
important to note that general aviation airports account for more than 90 percent of the
state’s airports. There are 27 existing commercial service airports and 265 general
aviation airports in Texas. As expected, there are large clusters of airports close to
population centers in Dallas-Fort Worth and Houston. While airports of all types are
generally well dispersed throughout the state, there are notably fewer airports in West
Texas given the lower population densities in that region.
As noted above, the state’s airports differ widely in size and function. For instance,
American Airlines and Continental Airlines operate some of the world’s largest hubs at
DFW and IAH, respectively. These airports handle millions of passengers and
thousands of cargo tons each year via multiple terminals and runways. On the other
hand, the primary function of many general aviation airports in Texas is to increase
system capacity by providing air access to widely dispersed economic activity centers of
the state and relieving air traffic congestion in and around major metropolitan areas.
Figure-44 shows airports in Texas.

The Statewide Long-Range Transportation Plan 2035
Economics, Demographics, Freight, and the Multimodal 2-101
Transportation System – Conditions and Trends
Figure 2-44: Texas Airports

The Statewide Long-Range Transportation Plan 2035
Economics, Demographics, Freight, and the Multimodal 2-102
Transportation System – Conditions and Trends
2.11.1 Methodology Forecast - Activity Levels: Commercial Aviation and General Aviation
In reporting forecasts for Texas aviation activity, a variety of sources were consulted.
These sources included the 2010 TASP, the Federal Aviation Administration (FAA)
Terminal Area Forecast (TAF)81 FY 2009–2030, the FAA Aerospace Forecast – FY
2009–2025, and commercial airport master plans.
The forecasts contained in the TASP are themselves sourced to the two FAA forecasts,
although in the case of the Terminal Area Forecast, TASP utilized the 2008 version of
the report, which was the latest available at the time.
The commercial airport master plans contain independent forecasts and were used to
verify FAA forecast levels. While differences between the forecasts are expected due to
varying dates of production and differing methodologies, the FAA and master plan
forecasts were compared in terms of order of magnitude as well as overall growth
trends. For commercial airports, the forecasts go out to 2030, which is very close to the
2035 forecasts required for this report. For purposes of this study, activity estimates to
2035 were extrapolated from the existing forecast data using the average annual growth
rates for each airport between 2010 and 2030. For GA airports forecasts are reported
as presented in the TASP. Commercial Aviation
The 27 commercial airports in Texas offer scheduled service by major, national, or
regional airlines. Each of these airports offers flights to domestic points in the United
States. Several Texas airports also have flights to international destinations, some of
which are operated by foreign airlines. Table 2-27 lists the locations and names of
Texas’ commercial airports.
The runway lengths of the 27 commercial airports exceed 5,000 feet and, in the case of
airports handling wide body aircraft, can exceed 12,000 feet. The Texas commercial
airports also have full parallel taxiways and high intensity runway lighting. These
airports are all capable of handling heavy transport aircraft.
The commercial aviation airports are typically owned and operated by the municipalities
or the airport authorities of their respective communities. As the owners, these
municipalities and airport authorities are responsible for developing and maintaining the
facilities, roadways, equipment, and other infrastructure on the airport property.
81
FAA, Terminal Area Forecasts FY 2009–2030, Available at FAA Terminal Area Forecast 2009, Available at
http://www.faa.gov/data_research/aviation/taf_reports/

The Statewide Long-Range Transportation Plan 2035
Economics, Demographics, Freight, and the Multimodal 2-103
Transportation System – Conditions and Trends
Table 2-27: List of Commercial Airports in Texas
Associated City Airport Name
Abilene Abilene Regional
Amarillo Rick Husband Amarillo International
Austin Austin-Bergstrom International
Beaumont-Port Arthur Southeast Texas Regional
Brownsville Brownsville/South Padre Island International
College Station Easterwood Field
Corpus Christi Corpus Christi International
Dallas Dallas Love Field
Dallas-Fort Worth Dallas-Fort Worth International
Del Rio Del Rio International
El Paso El Paso International
Harlingen Valley International
Houston William P. Hobby
Houston George Bush Intercontinental/Houston
Killeen Robert Gray Army Air Field
Laredo Laredo International
Longview East Texas Regional
Lubbock Lubbock Preston Smith International
McAllen McAllen Miller International
Midland Midland International
San Angelo San Angelo Regional/Mathis Field
San Antonio San Antonio International
Texarkana Texarkana Regional
Tyler Tyler Pounds Regional
Victoria Victoria Regional
Waco Waco Regional
Wichita Falls Sheppard Air Force Base (AFB)/Wichita Falls Municipal
2.11.1.1 Historical and Forecast Activity Levels at Commercial Aviation Airports
Table 2-28 and Figure 2-45 present historic trends and forecasts of aircraft operations
and enplanements for commercial airports in Texas and are described below.

The Statewide Long-Range Transportation Plan 2035
Economics, Demographics, Freight, and the Multimodal 2-104
Transportation System – Conditions and Trends
Table 2-28: Commercial Airports Historic and Forecast Aircraft Operations and Enplanements82
Year Aircraft Operations Enplaned Passengers
2000 4,256,364 65,146,667
2005 3,838,117 65,749,646
2009 3,514,974 65,476,384
2010 3,494,706 66,643,944
2015 3,775,722 77,892,456
2020 4,090,693 90,676,709
2025 4,413,526 103,856,306
2030 4,772,312 119,183,428
2035 5,180,910 137,898,637
Total Growth 2000–2035 924,546 72,751,970
% Change 21.7 111.7
Compound Annual Growth Rate 2000–2035
0.6% 3.2%
Figure 2-45: Commercial Airports Historic and Forecast Aircraft Operations and Enplanements – Trends83
82
FAA, Terminal Area Forecasts FY 2009–2030, Available at FAA Terminal Area Forecast 2009, Available at
http://www.faa.gov/data_research/aviation/taf_reports/; 2035 forecasts are the average annual growth rate between 2010 and 2030 extrapolated to 2035
83 FAA, Terminal Area Forecasts FY 2009–2030, Available at FAA Terminal Area Forecast 2009, Available at
http://www.faa.gov/data_research/aviation/taf_reports/; 2035 forecasts are the average annual growth rate between 2010 and 2030 extrapolated to 2035
3,000,000
3,500,000
4,000,000
4,500,000
5,000,000
5,500,000
60,000,000
70,000,000
80,000,000
90,000,000
100,000,000
110,000,000
120,000,000
130,000,000
140,000,000
150,000,000
20
00
20
05
20
09
20
10
20
15
20
20
20
25
20
30
20
35
Air
cra
ft O
pe
rati
on
s
En
pla
nem
en
ts
Year
Enplaned Passengers Aircraft Operations

The Statewide Long-Range Transportation Plan 2035
Economics, Demographics, Freight, and the Multimodal 2-105
Transportation System – Conditions and Trends
Aircraft operations at commercial airports have been on a noticeable decline over the
past 10 years. Operations peaked at 4.1 million operations in 2000 and by 2009 had
fallen below 3.4 million equating to an 18 percent drop.
There are many reasons for the decline in commercial aircraft operations. In 2000,
business travel across the entire airline industry was at an all time high. As the economy
faltered after 2000, it was somewhat natural for a slowdown in travel and, in turn aircraft
operations, to occur. Then, the events of 9/11 led to even further cuts in aviation activity.
In the years after 9/11, many airlines downsized their fleets and cut capacity to match
lower travel demand. Several airlines also implemented strategies whereby fewer small
aircraft were utilized in favor of larger aircraft with more seating capacity. These
strategies led to reductions in aircraft operations as more seats could be flown with
fewer operations. Finally, the onset of the global recession in 2008 led airlines to reduce
capacity further by removing aircraft from their fleets. It is important to note, that the
operational trends experienced by Texas’ commercial airports over the past 10 years
are not unique to Texas. These types of trends have been felt by airports across the
United States and are explained by economic events and airline strategies.
Interestingly, while aircraft operations at Texas commercial airports have been falling
since 2000, passenger enplanements have exceeded the levels of 2000 and
experienced a new peak in 2007. In 2000, Texas commercial airport enplanements
reached 65 million then fell back to 57 million in 2002 and 2003. By 2007, growth in
enplanements reached 71 million passengers before again declining to 65 million in
2009.
As with aircraft operations, the changes in Texas commercial airport passenger
enplanements can largely be explained by economic events and airline strategies. In
terms of enplanements, the effects of the high business travel environment of 2000, the
events of 9/11 and the beginning of recession in 2008 are all apparent in the historical
Texas airport data. However, primarily because of the presence of the American Airlines
hub at DFW and the Continental Airlines hub at IAH, enplanements increased
significantly at Texas commercial airports. As airline strategies changed to match
market demand, more passengers flowed through hub airports including DFW and IAH.
Again, these passengers likely flew into and out of the hubs on larger aircraft with higher
seat capacity. Thus, it is logical that at Texas’ commercial airports over the past 10
years, aircraft operations have fallen significantly even while passenger enplanements
have peaked in recent years.
The forecast of aircraft operations at Texas commercial airports shows a net increase of
1.7 million operations to 5.2 million between 2010 and 2035. This equates to total

The Statewide Long-Range Transportation Plan 2035
Economics, Demographics, Freight, and the Multimodal 2-106
Transportation System – Conditions and Trends
growth of over 48 percent with an average annual growth rate of 1.6 percent during the
forecast period.
This forecast growth compares to an 18 percent decline in aircraft operations from 2000
to 2009. Of course, these past 10 years include some of the most extraordinary (and
negative) events in commercial aviation history including the events of 9/11, record high
fuel prices, and the global recession starting in 2008. With events such as these, the
airline industry has retrenched and in doing so has generally cut capacity.
These capacity cuts have occurred disproportionately with smaller aircraft where the
cost of fuel is spread out over a much smaller passenger base than with larger aircraft.
The net effect has been negative aircraft operations growth at most airports worldwide.
In this context, Texas airports were not unique and the declines in operations at the
state’s commercial airports should not be seen as evidence of problems at the local
level.
Looking forward, the growth outlook through 2035 shows a return to more normal
patterns where the business cycle turns the corner in 2010 and airline operations show
modest year-over-year growth. During the forecast period, all Texas commercial airports
show gains in aircraft operations. Notably, the two largest Texas airports, DFW and IAH,
will account for approximately 40 percent of total growth in aircraft operations among
commercial airports from 2010 to 2035.
The forecast of enplaned passengers at Texas commercial airports shows a net
increase of 71.3 million enplanements from 2010 to 2035 to 137.9 million. This equates
to a doubling of enplanements with an average annual growth rate of 3.0 percent during
the forecast period.
2.11.2 General Aviation in Texas
The 265 GA airports in Texas do not offer scheduled air services and can function in a
variety of ways including Reliever, GA Business/Corporate, GA Community Service,
and GA Basic Service. A summary of the numbers of general aviation airports and their
locations in the state are shown in Table 2-29.
The runway lengths of the Reliever and the GA Business/Corporate airports are
typically in excess of 5,000 feet with the ability to handle business jet aircraft. The GA
Community Service airports have runways lengths of at least 4,000 feet while the GA
Basic service runways are typically at least 3,200 feet long. GA Community Service
airports must be able to handle light twin-engine aircraft, turboprops, and light business
jets. GA Basic Service airports are designed to accommodate light twin-engine aircraft

The Statewide Long-Range Transportation Plan 2035
Economics, Demographics, Freight, and the Multimodal 2-107
Transportation System – Conditions and Trends
as well as single piston airplanes. All GA level airports must have medium intensity
runway lighting.
Table 2-29: General Aviation Airports in Texas84
Airport Service Level /Role Number of Airports in Texas Airport System Plan
Reliever 24
Business/Corporate 67
Community Service 106
Basic Service 68
Total 265
2.11.2.1 Historical and Forecast Activity Levels General Aviation Airports
Table 2-30 and Figure 2-46 present historic trends and forecasts of aircraft operations
for GA airports in Texas and are described below.
Table 2-30: General Aviation Airports Historic and Forecast Aircraft Operations85
Year Single-Engine
Aircraft Other Aircraft
# Total
2000 3,949,824 1,083,901 5,033,725
2001 3,802,511 1,031,891 4,834,401
2002 3,895,825 1,067,651 4,963,477
2003 3,807,044 1,055,045 4,862,090
2004 3,635,305 1,090,172 4,725,477
2005 3,421,881 1,060,637 4,482,518
2006 3,436,412 1,097,223 4,533,635
2007 3,378,869 1,117,436 4,496,305
2008* - - -
2009* - - -
2010 3,240,039 1,184,393 4,424,432
2015 3,225,744 1,327,560 4,553,304
2020 3,316,682 1,477,947 4,794,629
2025 3,452,594 1,631,873 5,084,467
Total Growth 2000-2025 (497,231) 547,973 50,742
% Change 2000-2025 -12.6 50.6 1.0
* TASP only includes forecasts to 2025 and excludes 2008 and 2009 # Includes: multi-engine, turboprop, turbojet, and rotary aircraft
84
TxDOT, 2010 TASP, Available at http://www.dot.state.tx.us/business/aviation/system_plan.htm 85
TxDOT, 2010 TASP, Available at http://www.dot.state.tx.us/business/aviation/system_plan.htm

The Statewide Long-Range Transportation Plan 2035
Economics, Demographics, Freight, and the Multimodal 2-108
Transportation System – Conditions and Trends
Figure 2-46: General Aviation Airports Historic
and Forecast Aircraft Operations – Trends86
* TASP only includes forecasts to 2025 and excludes 2008 and 2009
# Includes: multi-engine, turboprop, turbojet, and rotary aircraft
The forecast of Texas GA aircraft operations shows a net decrease of 50,742 from 2000
to 2025. This equates to total growth of over 1 percent. However, this decrease is due
to declines in single-engine aircraft. For other types of aircraft (which include multi-
engine, turboprop, turbojet, and rotary aircraft) operations are forecasted to increase by
547,973 from 2000 to 2025 for an increase of over 50 percent.
2.12 Texas Freight Demand
The movement of freight to, from, and within the state is integral to Texas’ economy.
This movement brings food and goods to the state’s population, as well as supporting
the movement of raw materials (for example crude oil) and refined materials (for
example gasoline) to the nation and world. As shown in Table 2-31 and Figure 2-47,
according to FHWA’s Freight Analysis Framework2 database (FAF2), in 200887 the total
amount of freight shipped to, from, and within Texas was greater than 2.389 billion tons
with a combined value of greater than $1.742 trillion. By 2035, the total tons and value
86
Ibid 87
Note: The historic base year for FAF2 is 2002. Freight data for 2008 presented in this section is an estimate prepared by
FHWA. The methodology for this estimate can be found at: http://ops.fhwa.dot.gov/freight/freight_analysis/faf/faf2provisional_2008/rpt/chap2.htm#23
-
500,000
1,000,000
1,500,000
2,000,000
2,500,000
3,000,000
3,500,000
4,000,000
4,500,000
20
00
20
01
20
02
20
03
20
04
20
05
20
06
20
07
20
10
20
15
20
20
20
25
Nu
mb
er
of
Op
era
tio
ns
Year*
Other Aircraft # Single-Engine Aircraft

The Statewide Long-Range Transportation Plan 2035
Economics, Demographics, Freight, and the Multimodal 2-109
Transportation System – Conditions and Trends
of goods shipped by freight is expected to increase by approximately 82 percent and
166 percent, respectively. It should be noted that each mode presented in Table 2-29
represents the mode used prior to the good arriving at a destination and not all legs of
the movement.
Table 2-31: Texas Freight Summary by Mode, 2008–203588
Mode 2008# % of Total 2035
% of Total
% Change
Tons (millions)
Air, Air & Truck 0.8 0.03 0.9 0.02 12.50
Other Intermodal 11.2 0.47 30.6 0.70 173.21
Pipeline & Unknown* 796.2 33.31 1,351.1 31.08 69.69
Rail and Rail/Truck 307.7 12.88 545.7 12.55 77.35
Truck 1,177.3 49.27 2,251.20 51.77 91.22
Water 96.5 4.04 168.9 3.88 75.03
Total 2,389.7 100.00 4,348.4 100.00 81.96
Dollars# (millions)
Air, Air & Truck 73,102 4.19 104,697 2.25 43.22
Other Intermodal 85,816 4.93 744,670 16.07 767.75
Pipeline & Unknown* 318,339 18.26 409,725 8.86 28.71
Rail and Rail/Truck 96,605 5.54 136,436 2.95 41.23
Truck 1,157,575 66.43 3,198,219 69.06 176.29
Water 11,197 0.63 37,609 0.81 235.88
Total 1,742,634 100.00 4,631,356 100.00 165.77
*FHWA, regarding Pipeline and Unknown Shipments: ―Pipeline and unknown shipments are combined because data on region-to-region flows by pipeline are statistically uncertain.‖ #2002 Dollars (based on the earliest reported FAF
2 year, which is 2002)
88
FAF2 Commodity Origin-Destination Data: 2002–2035; Available at
http://www.ops.fhwa.dot.gov/freight/freight_analysis/faf/faf2_com.htm; and Provisional Annual Commodity Origin-Destination Data – 2008 available at http://www.ops.fhwa.dot.gov/freight/freight_analysis/faf/faf2_pro.htm

The Statewide Long-Range Transportation Plan 2035
Economics, Demographics, Freight, and the Multimodal 2-110
Transportation System – Conditions and Trends
Figure 2-47: Forecast 2035 - Texas Freight by Mode, Tons and Dollars89
2.12.1 Texas Forecast Truck Freight Demand
Trucks will play an increasingly dominant role in the movement of freight to, from, and
within Texas. As shown in Table 2-32, according to statistics published as part of the
FHWA’s FAF2, it is expected that from 2008 to 2035 the value of goods shipped by truck
within, from, and to the state will grow by 176 percent. By 2035 the weight of all freight
originating in the state shipped by trucks will increase to 49 percent and similarly the
weight of all freight destined to the state shipped by trucks will increase to 36 percent.
By value in 2035, trucks are expected to handle 80, 63, and 63 percent of goods moved
within, from, and to Texas, respectively. This equates to approximately 2.251 billion tons
of goods with a combined value of more than $3.198 trillion.
89
FAF2 Commodity Origin-Destination Data: 2002–2035; Available at
http://www.ops.fhwa.dot.gov/freight/freight_analysis/faf/faf2_com.htm; and Provisional Annual Commodity Origin-Destination Data – 2008 available at http://www.ops.fhwa.dot.gov/freight/freight_analysis/faf/faf2_pro.htm
0.9
30.6
1,3
51.1
54
5.7
2,2
51.2
0
168
.9
104
,69
7
744
,67
0
409
,72
5
136
,43
6
3,1
98,2
19
37,6
09
-
500,000
1,000,000
1,500,000
2,000,000
2,500,000
3,000,000
3,500,000
0
500
1,000
1,500
2,000
2,500
Do
lla
rs (
Millio
ns
)
To
ns
(M
illio
ns
)
Mode
Tons Dollars

The Statewide Long-Range Transportation Plan 2035
Economics, Demographics, Freight, and the Multimodal 2-111
Transportation System – Conditions and Trends
Table 2-32: Truck Tons/Dollars Within, From, To State, 2008–203590
Year Summary (Millions) Within State From State To State Total
Tons (millions) 2008
Trucks Alone 843 167 168 1,177
All Other Modes* 613 243 356 1,212
Total 1,456 410 524 2,390
Trucks Alone % of Total 58 41 32 49
2035
Trucks Alone 1,538 361 352 2,251
All Other Modes* 1,104 378 615 2,097
Total 2,641 740 967 4,348
Trucks Alone % of Total 58 49 36 52
Dollars (millions)
2008
Trucks Alone 562,946 254,504 340,126 1,157,575
All Other Modes* 194,820 190,900 199,339 585,060
Total 757,766 445,404 539,465 1,742,635
Trucks Alone % of Total 74 57 63 66
2035
Trucks Alone 1,275,690 1,092,220 830,309 3,198,219
All Other Modes* 314,491 638,104 480,542 1,433,137
Total 1,590,181 1,730,324 1,310,851 4,631,356
Trucks Alone % of Total 80 63 63 69
Trucks % Change 2008–2035 Tons
82 117 110 91
Trucks % Change 2008–2035 Dollars
127 329 144 176
*Note: Includes Multi-Modal Truck Movements #2002 Dollars (based on the earliest reported FAF
2 year, which is 2002)
As shown in Table 2-33, in 2035 trucks will remain a vital component in the shipment of
most goods. Similarly to 2008, in terms of gross tonnage, by 2035 trucks are expected
to carry the majority for most commodities with the exception of raw materials and
chemical/petroleum commodities. Additionally, in terms of dollars, in 2035 trucks are
expected to carry the majority for all commodities except for raw materials.
90
FAF2 Commodity Origin-Destination Data: 2002–2035; Available at
http://www.ops.fhwa.dot.gov/freight/freight_analysis/faf/faf2_com.htm; and Provisional Annual Commodity Origin-Destination Data – 2008 available at http://www.ops.fhwa.dot.gov/freight/freight_analysis/faf/faf2_pro.htm
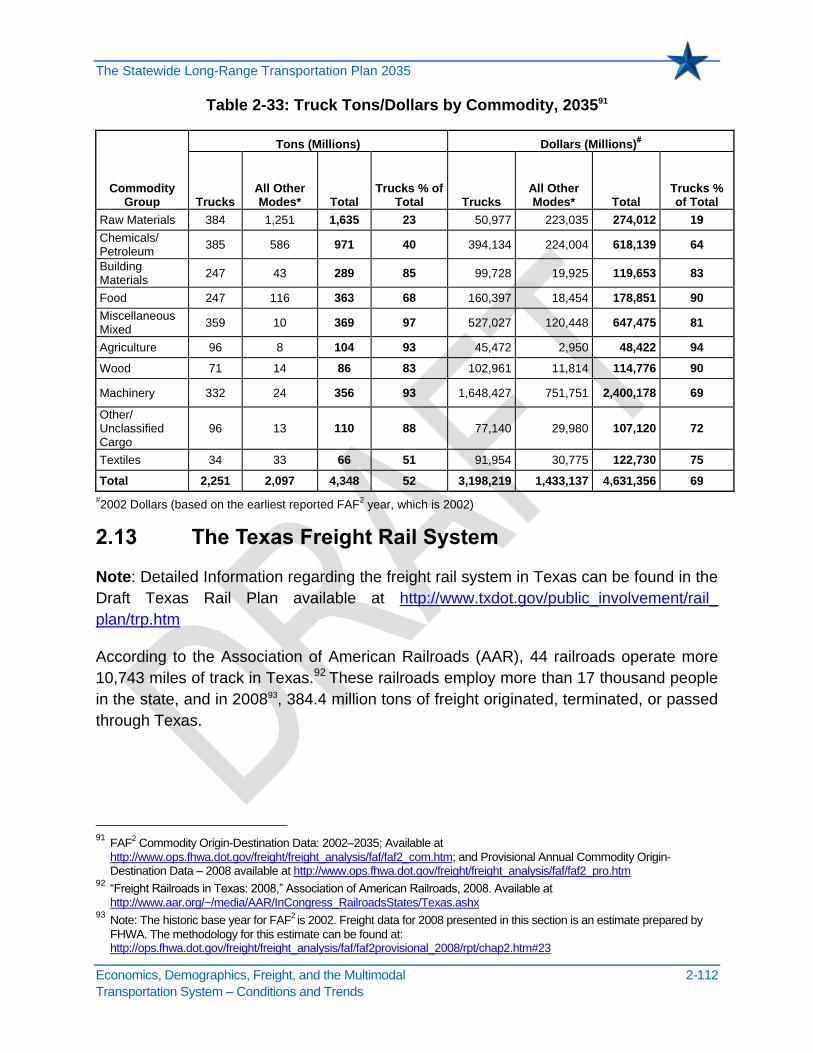
The Statewide Long-Range Transportation Plan 2035
Economics, Demographics, Freight, and the Multimodal 2-112
Transportation System – Conditions and Trends
Table 2-33: Truck Tons/Dollars by Commodity, 203591
Commodity Group
Tons (Millions) Dollars (Millions)#
Trucks All Other Modes* Total
Trucks % of Total Trucks
All Other Modes* Total
Trucks % of Total
Raw Materials 384 1,251 1,635 23 50,977 223,035 274,012 19
Chemicals/ Petroleum
385 586 971 40 394,134 224,004 618,139 64
Building Materials
247 43 289 85 99,728 19,925 119,653 83
Food 247 116 363 68 160,397 18,454 178,851 90
Miscellaneous Mixed
359 10 369 97 527,027 120,448 647,475 81
Agriculture 96 8 104 93 45,472 2,950 48,422 94
Wood 71 14 86 83 102,961 11,814 114,776 90
Machinery 332 24 356 93 1,648,427 751,751 2,400,178 69
Other/ Unclassified Cargo
96 13 110 88 77,140 29,980 107,120 72
Textiles 34 33 66 51 91,954 30,775 122,730 75
Total 2,251 2,097 4,348 52 3,198,219 1,433,137 4,631,356 69
#2002 Dollars (based on the earliest reported FAF
2 year, which is 2002)
2.13 The Texas Freight Rail System
Note: Detailed Information regarding the freight rail system in Texas can be found in the
Draft Texas Rail Plan available at http://www.txdot.gov/public_involvement/rail_
plan/trp.htm
According to the Association of American Railroads (AAR), 44 railroads operate more
10,743 miles of track in Texas.92 These railroads employ more than 17 thousand people
in the state, and in 200893, 384.4 million tons of freight originated, terminated, or passed
through Texas.
91
FAF2 Commodity Origin-Destination Data: 2002–2035; Available at
http://www.ops.fhwa.dot.gov/freight/freight_analysis/faf/faf2_com.htm; and Provisional Annual Commodity Origin-Destination Data – 2008 available at http://www.ops.fhwa.dot.gov/freight/freight_analysis/faf/faf2_pro.htm
92 ―Freight Railroads in Texas: 2008,‖ Association of American Railroads, 2008. Available at
http://www.aar.org/~/media/AAR/InCongress_RailroadsStates/Texas.ashx 93
Note: The historic base year for FAF2 is 2002. Freight data for 2008 presented in this section is an estimate prepared by
FHWA. The methodology for this estimate can be found at: http://ops.fhwa.dot.gov/freight/freight_analysis/faf/faf2provisional_2008/rpt/chap2.htm#23

The Statewide Long-Range Transportation Plan 2035
Economics, Demographics, Freight, and the Multimodal 2-113
Transportation System – Conditions and Trends
Three Class I railroads94, the BNSF, Kansas City Southern (KCF), and Union Pacific
(UPRR) account for the majority of rail miles in the state. Additionally there are two
regional railroads, Texas Northeastern Railroad and Texas Pacifico, and 39 local,
switching, and terminal railroads in Texas.
Figure 2-48 illustrates the railroad mileage and locations within Texas.
Figure 2-48: The Texas Freight Rail Network
Short lines often serve a single customer or a small set of customers and haul a very
limited set of commodities. Farm products and aggregate are among the most popular
commodities moved by short line railroads. Current estimates suggest that as much as
90 percent of all short line moves involve an interchange with a Class I railroad.
The freight rail system is used predominantly to haul low-value, high-volume
commodities over long distances. Energy products, aggregates, and chemicals are
popular rail commodities, partly due to their high-volume/low-value in combination with
94 Class I Railroad – A railroad with 2008 operating revenues of at least $401.4 million. Regional Railroad – A non-Class I
line-haul railroad operating 350 or more miles of road and/or with revenues of at least $40 million. Local Railroad – A railroad which is neither a Class I nor a Regional Railroad and is engaged primarily in line-haul service. Switching & Terminal Railroad – A non-Class I railroad engaged primarily in switching and/or terminal services for other railroads. Railroads operating are as of December 31, 2008. Some mileage figures may be estimated.

The Statewide Long-Range Transportation Plan 2035
Economics, Demographics, Freight, and the Multimodal 2-114
Transportation System – Conditions and Trends
delivery schedules that do not require precise delivery schedules. Additionally,
intermodal freight rail is popular among shippers of bulk, nonperishable consumer
goods. Containerized goods imported from the Asia-Pacific region pass through ports
on the West Coast of the U.S., are placed on trains and moved eastward. These
containers are often then placed on trucks for movement to deconsolidation facilities,
where individual shipments are separated and reloaded into trucks for delivery to retail
outlets throughout the state.
The Railroad Division within TxDOT maintains responsibility to inspect the network for
safety compliance. According to the Rail Division’s website, its responsibilities are:
―…to improve highway-rail grade crossings by partnering with railroads to install and maintain crossing signals and gates, improve crossing surfaces on state highways and consolidate crossings where possible. The division has the authority to implement rail improvements by entering into public-private partnership agreements to provide investments in freight rail relocation projects, rail facility improvements, rail line consolidations or new passenger rail developments. The division participates in the state rail safety participation program in conjunction with the Federal Railroad Administration. State rail safety inspectors coordinate investigative activities with federal authorities in the areas of hazardous materials, motive power and equipment, operating practices, signal and train control and track structures.‖
2.13.1 Freight Rail Issues
The Texas Rail Plan indicates that between 1953 and 2005 Texas lost approximately
39 percent of its total track miles.95 The plan highlights these critical issues:96
Freight Bottlenecks – Rail operational bottlenecks, such as Tower 55 in Fort
Worth, are hindering efficient movement of freight and passenger trains resulting
in heavy congestion that slows commerce.
Grade Crossings – Safety at rail grade crossings is major concern for the
Houston greater area and several crossings have been identified as being ―hot
spots‖ for auto-train collisions. Conflicts between trains and trucks at grade
crossing on the railroad mainlines are creating further reductions in mobility of
trucks that serve the Port of Brownsville. The ports of Texas City and Lavaca
also have significant grade crossing issues.
95
―Draft Texas Rail Plan‖ TxDOT, 2010. Available at http://www.txdot.gov/public_involvement/rail_plan/trp.htm 96
―Draft Texas Rail Plan‖ TxDOT, 2010, Pages 3-43,3-60, and 3-61, Available at
http://www.txdot.gov/public_involvement/rail_plan/trp.htm

The Statewide Long-Range Transportation Plan 2035
Economics, Demographics, Freight, and the Multimodal 2-115
Transportation System – Conditions and Trends
Rail Yard Capacity – Increasing amounts of freight are straining capacity at rail
yards in many parts of the state. For instance, over 95 percent of all freight trains
moving in the Houston region must stop to pick up or drop off cars. Yard capacity
is also a concern at the Union Pacific railroad interchange yard at the Port of
Beaumont.
Border Rail Operational Issues – Limited rail infrastructure and community
impacts at border crossings have contributed to delays in crossing trains
between the U.S. and Mexico.
Sidings – Longer and heavier trains also are being used by the railroads to
maximize existing capacity and improve efficiency. For example, the BNSF
prefers that all their international intermodal shipments be handled in 40-foot well
cars and all their inter-modal trains are 8,000 feet in length.
2.13.2 Freight Rail Usage Trends in Texas
The 2007 Commodity Flow Survey (CFS) conducted by the U.S. Census Bureau shows
increases in key indicators regarding the use of freight rail within the state since the
2002 CFS. According to the CFS the overall value of goods shipped by rail from the
State more than doubled during the 5-year span to more than $76 billion. During the
same period, the weight of goods increased by 5 percent to 153 million tons, and the
average length of haul via railroad decreased by 5 percent, as well, to 724 miles. Rail
handles 11.4 percent of the weight and 6.5 percent of the value of goods originating in
Texas. These figures do not include shipments where rail was one component of an
intermodal move. With the inclusion of intermodal movements (truck and rail, rail and
water), the total weight of goods shipped by rail originating in Texas climbs to 185
million tons.97
These figures differ somewhat from those compiled by the AAR for 2008. According to
the AAR, a total of 384.4 million tons of freight originated, terminated, or passed through
Texas. Of this total, 96.6 million tons of goods originated in Texas, while another 210
million tons terminated in the state. Because these datasets originate from different
sources, it is not recommended that they be compared directly to assess yearly
changes from 2007 to 2008.
The AAR also offers statistics regarding the commodities moved by rail. Figure 2-49
shows these data.
97
U.S. Census, Commodity Flow Survey, 2007, Texas, Available at:
http://www.bts.gov/publications/commodity_flow_survey/2007/states/texas/index.html

The Statewide Long-Range Transportation Plan 2035
Economics, Demographics, Freight, and the Multimodal 2-116
Transportation System – Conditions and Trends
Figure 2-49: 2008 Rail Movement Commodity Summary98
According to data compiled by the Texas Center for Border Economic and Enterprise
Development (Table 2-34), rail border crossings into Texas from Mexico and out of
Texas into Mexico decreased significantly from 2008 to 2009. These figures, which are
illustrated in the tables below, reflect the effects of the global economic downturn.
Table 2-34: Annual Rail Crossings, 2008–200999
Gateway North Bound North
Bound Total
South Bound South Bound Total 2008 2009 2008 2009
Brownsville 80,147 36,134 116,281 72,609 40,981 113,590
Eagle Pass 137,693 145,527 283,220 131,773 144,284 276,057
El Paso 168,361 102,240 270,601 - - -
Laredo 257,875 202,862 460,737 263,048 200,720 463,768
Total 644,076 486,763 1,130,839 467,430 385,985 853,415
98
―Freight Railroads in Texas: 2008,‖ Association of American Railroads, 2008. Available at
http://www.aar.org/~/media/AAR/InCongress_RailroadsStates/Texas.ashx 99
Texas Center for Border Economic and Enterprise Development, Border Trade Data, Rail Crossings, Available at
http://texascenter.tamiu.edu/texcen_services/rail_crossings.asp?framepg=datarail

The Statewide Long-Range Transportation Plan 2035
Economics, Demographics, Freight, and the Multimodal 2-117
Transportation System – Conditions and Trends
2.13.3 Texas Forecast Freight Rail Demand
As shown in Table 2-35, according to statistics published as part of the FHWA’s FAF2, it
is expected that from 2008 to 2035 the value of goods shipped by rail within, from, and
to the state will grow by 77 percent. By value in 2035, rail is expected to decrease from
2008 and handle only 1, 3, and 6 percent of the value of goods moved within, from, and
to Texas, respectively. This equates to approximately 546 million tons of goods with a
combined value of more than $136 billion (as shown in Table 2-35).
Table 2-35: Rail and Rail/Truck Tons/Dollars Within, From, To State, 2008–2035100
Year Summary (Millions) Within State From State To State Total
Tons (Millions)
2008
Rail and Rail/Truck 113 59 136 308
All Other Modes* 1,342 351 388 2,082
Total 1,456 410 524 2,390
Rail and Rail/Truck % of Total 8 14 26 13
2035
Rail and Rail/Truck 194 86 266 546
All Other Modes* 2,448 653 702 3,803
Total 2,641 740 967 4,348
Rail and Rail/Truck % of Total 7 12 27 13
Dollars (Millions)*
2008
Rail and Rail/Truck 18,597 39,751 38,257 96,605
All Other Modes* 739,169 405,653 501,208 1,646,029
Total 757,766 445,404 539,465 1,742,635
Rail and Rail/Truck % of Total 2 9 7 6
2035
Rail and Rail/Truck 17,947 44,152 74,337 136,436
All Other Modes* 1,572,234 1,686,171 1,236,514 4,494,920
Total 1,590,181 1,730,324 1,310,851 4,631,356
Rail and Rail/Truck % of Total 1 3 6 3
Rail and Rail/Truck % Change Tons 71 47 96 77
Rail and Rail/Truck % Change Dollars –3 11 94 41
*2002 Dollars (based on the earliest reported FAF
2 year, which is 2002)
As shown in Table 2-36, rail, in comparison to all other modes, will continue to play a
lesser role in the shipment of most goods in terms of both tonnage and value.
100
FAF2Commodity Origin-Destination Data: 2002–2035; Available at
http://www.ops.fhwa.dot.gov/freight/freight_analysis/faf/faf2_com.htm; and Provisional Annual Commodity Origin-Destination Data – 2008 available at http://www.ops.fhwa.dot.gov/freight/freight_analysis/faf/faf2_pro.htm

The Statewide Long-Range Transportation Plan 2035
Economics, Demographics, Freight, and the Multimodal 2-118
Transportation System – Conditions and Trends
Table 2-36: Rail and Rail/Truck Tons/Dollars by Commodity 2035101
Commodity Group
Tons (Millions) Dollars (Millions)*
Rail All Other Modes Total
Rail % of Commodity Rail
All Other Modes Total
Rail % of Commodity
Raw Materials 298 1,336 1,635 18 15,135 258,878 274,012 6
Chemicals/ Petroleum
41 930 971 4 19,464 598,675 618,139 3
Building Materials
31 258 289 11 7,791 111,862 119,653 7
Food 112 251 363 31 14,038 164,813 178,851 8
Miscellaneous Mixed
3 366 369 1 3,080 644,395 647,475 <1
Agriculture 8 96 104 7 2,817 45,605 48,422 6
Wood 13 73 86 15 4,923 109,852 114,776 4
Machinery 8 348 356 2 48,764 2,351,414 2,400,178 2
Other/ Unclassified Cargo
<1 109 110 <1 1,059 106,061 107,120 1
Textiles 31 36 66 46 19,365 103,365 122,730 16
Total 546 3,803 4,348 13 136,436 4,494,920 4,631,356 3
*2002 Dollars (based on the earliest reported FAF
2 year, which is 2002)
Figure 2-50 illustrates 2035 expected rail commodity shipments by tons and dollars. It is
expected that for 2035 the value of goods per ton shipped by rail will decrease for most
commodities with the exception of agriculture good, miscellaneous mixed goods, and
machinery.
101
FAF2 Commodity Origin-Destination Data: 2002–2035; Available at
http://www.ops.fhwa.dot.gov/freight/freight_analysis/faf/faf2_com.htm; and Provisional Annual Commodity Origin-Destination Data – 2008 available at http://www.ops.fhwa.dot.gov/freight/freight_analysis/faf/faf2_pro.htm
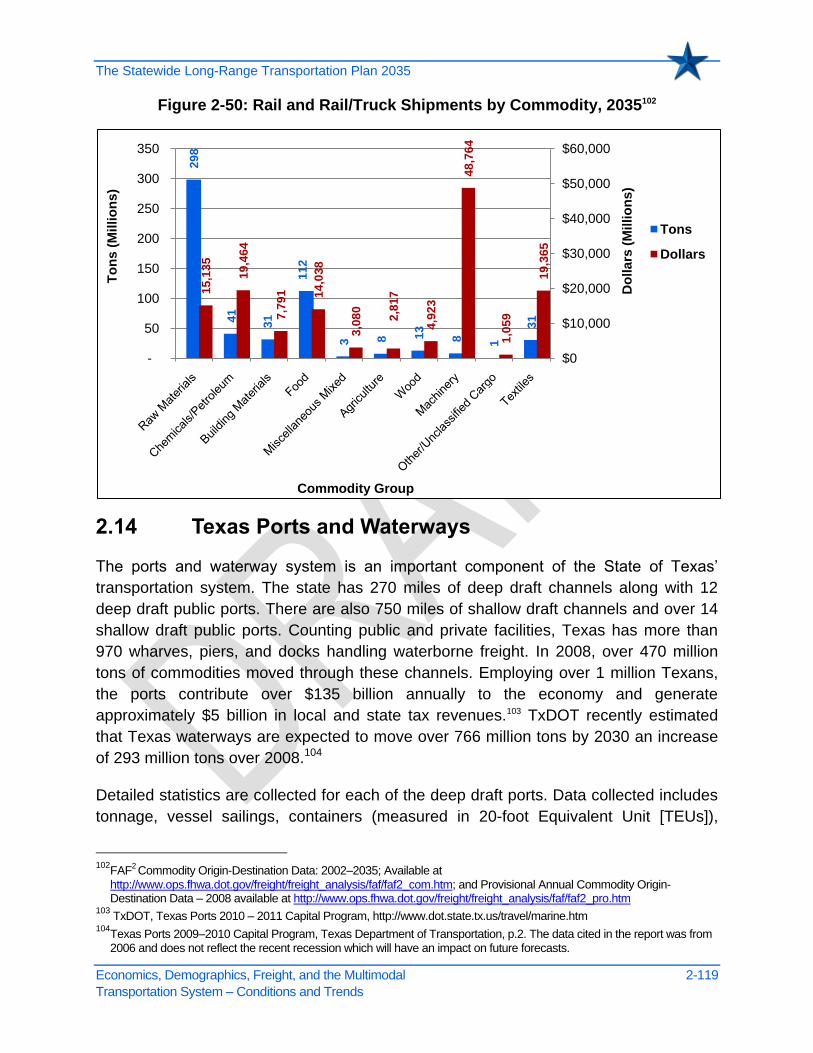
The Statewide Long-Range Transportation Plan 2035
Economics, Demographics, Freight, and the Multimodal 2-119
Transportation System – Conditions and Trends
Figure 2-50: Rail and Rail/Truck Shipments by Commodity, 2035102
2.14 Texas Ports and Waterways
The ports and waterway system is an important component of the State of Texas’
transportation system. The state has 270 miles of deep draft channels along with 12
deep draft public ports. There are also 750 miles of shallow draft channels and over 14
shallow draft public ports. Counting public and private facilities, Texas has more than
970 wharves, piers, and docks handling waterborne freight. In 2008, over 470 million
tons of commodities moved through these channels. Employing over 1 million Texans,
the ports contribute over $135 billion annually to the economy and generate
approximately $5 billion in local and state tax revenues.103 TxDOT recently estimated
that Texas waterways are expected to move over 766 million tons by 2030 an increase
of 293 million tons over 2008.104
Detailed statistics are collected for each of the deep draft ports. Data collected includes
tonnage, vessel sailings, containers (measured in 20-foot Equivalent Unit [TEUs]),
102
FAF2 Commodity Origin-Destination Data: 2002–2035; Available at
http://www.ops.fhwa.dot.gov/freight/freight_analysis/faf/faf2_com.htm; and Provisional Annual Commodity Origin-Destination Data – 2008 available at http://www.ops.fhwa.dot.gov/freight/freight_analysis/faf/faf2_pro.htm
103 TxDOT, Texas Ports 2010 – 2011 Capital Program, http://www.dot.state.tx.us/travel/marine.htm
104Texas Ports 2009–2010 Capital Program, Texas Department of Transportation, p.2. The data cited in the report was from
2006 and does not reflect the recent recession which will have an impact on future forecasts.
298
41
31
112
3 8 13
8
1
31
15,1
35
19,4
64
7,7
91
14,0
38
3,0
80
2,8
17
4,9
23
48
,76
4
1,0
59
19,3
65
$0
$10,000
$20,000
$30,000
$40,000
$50,000
$60,000
-
50
100
150
200
250
300
350
Do
lla
rs (
Millio
ns
)
To
ns
(M
illi
on
s)
Commodity Group
Tons
Dollars
The Statewide Long-Range Transportation Plan 2035
Economics, Demographics, Freight, and the Multimodal 2-120
Transportation System – Conditions and Trends
commodities, imports, and exports. A TEU (or more commonly a shipping container) is
equivalent to an 8-foot by 8-foot by 20-foot intermodal container and is used as a basic
unit to measure the volume of containerized cargo. The data is collected by the port,
U.S. Customs, Department of Commerce, the U.S. Army Corps of Engineers (USACE)
Navigation Data Center, and various private data sources. These statistics have been
historically used to forecast traffic changes through the ports. In addition, many ports
have commissioned economic impact studies for their port and these often contain
projections.
During the last decade, the national transportation system has experienced bottlenecks,
congestion, and capacity problems resulting in delay and higher shipping costs. As the
U.S. global outsourcing to Asia grew, the West Coast ports became dominant.
However, in recent years, shippers have shifted and spread out deliveries to other ports
and Texas ports have been the beneficiaries of some of this shift. Cargo through the
Panama Canal from the Pacific has also grown over the last several years.
2.14.1 Ports Inventory
Texas has more than 1,000 port facilities on 1,000 miles of channel maintained by the
Corps of Engineers. Of these, 21 ports can be considered major and are listed in Table
2-37 and ports, waterways, and channels are illustrated on Figure 2-51.

The Statewide Long-Range Transportation Plan 2035
Economics, Demographics, Freight, and the Multimodal 2-121
Transportation System – Conditions and Trends
Table 2-37: Listing of Texas Ports, 2008
Common Name Official Name Deep/Barge/
Fishing 2006 Tonnage Org. Type
1. Port of Anahuac Chambers-Liberty Counties Navigation District
Barge
Anahuac: None
Double Bayou: 36,000
Trinity River: None
Nav. Dist.
2. Aransas/Rockport/
Fulton/Cove
Aransas County Navigation District No. 1
Fishing N/A Nav. Dist.
3. Port of Bay City Port of Bay City Authority Barge 494,000 Nav. Dist.
4. Port of Beaumont Port of Beaumont Navigation District of Jefferson County
Deep 79,486,000 Nav. Dist.
5. Port of Brownsville Brownsville Navigation District
Deep 5,309,000 Nav. Dist.
6. Cedar Bayou Cedar Bayou Navigation District
Barge 1,054,000 Nav. Dist.
7. Port of Corpus Christi
Port of Corpus Christi Authority of Nueces County, Texas
Deep 77,557,000 Nav. Dist.
8. Port Freeport Port Freeport Deep 32,147,000 Nav. Dist.
9. Port of Galveston Board of Trustees of the Galveston Wharves
Deep 9,357,000 Municipal
Utility
10. Port of Harlingen Port of Harlingen Authority
Barge 349,000 Nav. Dist.
11. Port of Houston Port of Houston Authority Deep 222,147,000 Nav. Dist.
12. Port of Orange Orange County Navigation and Port District
Deep 718,000 Nav. Dist.
13. Port of Palacios Matagorda County Navigation District No. 1
Fishing N/A Nav. Dist.
14. Port of Port Arthur
Port of Port Arthur Navigation District
Deep 28,403,000 Nav. Dist.
15. Port of Port Isabel
Port Isabel-San Benito Navigation District
Deep 1,000 Nav. Dist.
16. Port of Port Lavaca
Calhoun Port Authority Deep 10,808,000 Nav. Dist.
17. Port Mansfield Willacy County Navigation District
Fishing N/A Nav. Dist.
18. Port of Sabine Pass
Sabine Pass Port Authority
Deep/Fishing 902,000 ??
19. Port of Texas City Texas City Terminal Railway Company
Deep 48,875,000 Private
20. Port of Victoria Victoria County Navigation District
Barge 3,556,000 Nav. Dist.
21. Port of West Calhoun
West Side Calhoun County Navigation District
Barge Included in Victoria Nav. Dist.
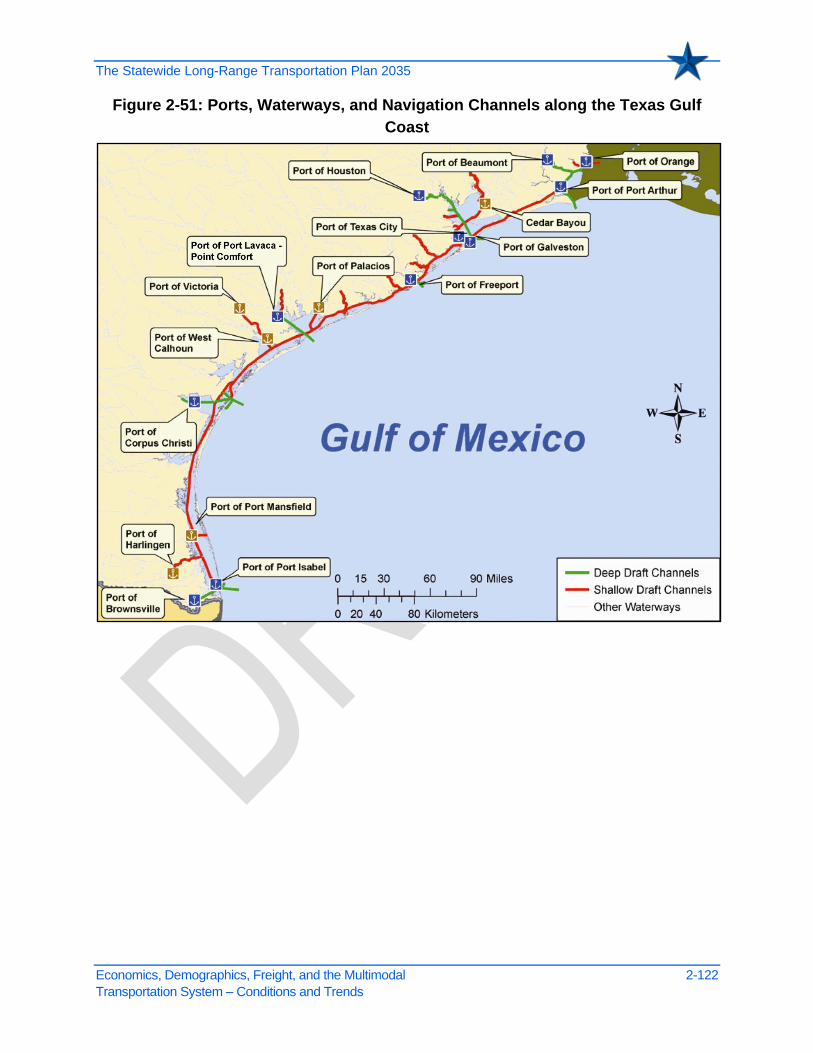
The Statewide Long-Range Transportation Plan 2035
Economics, Demographics, Freight, and the Multimodal 2-122
Transportation System – Conditions and Trends
Figure 2-51: Ports, Waterways, and Navigation Channels along the Texas Gulf
Coast

The Statewide Long-Range Transportation Plan 2035
Economics, Demographics, Freight, and the Multimodal 2-123
Transportation System – Conditions and Trends
As shown in Table 2-38 and Table 2-39, in 2009, the Port of Houston ranked second in
the nation in terms of tonnage and seventh in the nation in terms of TEUs.
Table 2-38: Texas Ports Tonnage Shipped 2008105
U.S. Rank Port Name Domestic
Foreign Imports
Foreign Exports
Foreign Total Total
2 Houston, TX 65,808,295 92,018,956 54,380,670 146,399,626 212,207,921
5 Corpus Christi, TX 21,430,962 43,373,738 11,981,473 55,355,211 76,786,173
7 Beaumont, TX 22,687,915 41,167,853 5,627,771 46,795,624 69,483,539
13 Texas City, TX 13,895,595 33,926,630 4,783,805 38,710,435 52,606,030
25 Port Arthur, TX 10,004,521 14,834,711 6,913,510 21,748,221 31,752,742
26 Freeport, TX 4,135,091 22,971,011 2,736,193 25,707,204 29,842,295
52 Matagorda-Port Lavaca-Port Comfort, TX
1,873,129 6,953,796 1,490,689 8,444,485 10,317,614
54 Galveston, TX 4,199,979 1,825,635 3,755,754 5,581,389 9,781,368
76 Brownsville, TX 1,843,662 3,541,172 284,611 3,825,783 5,669,445
94 Victoria, TX 2,861,933 0 0 0 2,861,933
136 Sabine Pass, TX 1,214,023 290 0 290 1,214,313
Table 2-39: Top 20 U.S. Container Ports106
2005–2009 (in TEUs)
Ranking Ports 2005 2006 2007 2008 2009
1 Los Angeles 4,867,073 5,743,400 5,740,261 5,670,897 5,028,998
2 Long Beach 4,395,942 4,798,617 4,994,949 4,611,671 3,765,560
3 New York 3,390,308 3,678,247 3,935,262 3,992,258 3,587,740
4 Savannah 1,482,728 1,609,131 2,041,521 2,115,986 1,914,751
5 Oakland 1,372,231 1,414,782 1,451,326 1,394,684 1,398,420
6 Norfolk 1,318,831 1,424,993 1,573,273 1,591,566 1,375,632
7 Houston 1,231,186 1,295,366 1,415,657 1,370,759 1,256,049
105
U.S. Army Corps of Engineers, Navigation Data Center, 2008 Waterborne Commerce of the United States (WCUS)
Waterways and Harbors, Available at: http://www.ndc.iwr.usace.army.mil/publications.htm 106
Journal of Commerce PIERS — Port Import/Export Reporting Service. Note: Ranking based on 2009 reported TEU
counts.

The Statewide Long-Range Transportation Plan 2035
Economics, Demographics, Freight, and the Multimodal 2-124
Transportation System – Conditions and Trends
Table 2-39: Top 20 U.S. Container Ports106
2005–2009 (in TEUs)
Ranking Ports 2005 2006 2007 2008 2009
8 Seattle 1,339,641 1,222,596 1,289,364 1,082,573 1,072,838
9 Charleston, SC 1,511,935 1,517,311 1,408,434 1,330,919 954,836
10 Tacoma 1,154,350 1,095,896 1,150,590 1,129,301 873,708
11 Miami 770,839 748,130 684,793 669,199 625,716
12 Port Everglades 580,179 639,481 691,645 680,536 543,387
13 Baltimore 380,574 409,526 427,902 435,135 405,552
14 New Orleans 174,072 177,487 254,782 239,792 229,869
15 San Juan 213,570 241,993 208,265 222,739 222.033
16 Jacksonville 144,635 153,009 151,110 158,119 197,656
17 Wilmington, NC 127,269 127,269 150,147 147,443 187,955
18 Philadelphia 158,706 176,901 196,827 218,618 180,091
19 Wilmington, DE 161,645 170,453 185,231 182,833 162,757
20 Gulfport 150,205 162,551 171,835 172,607 158,636
Top 20 U.S. Ports – Total 24,925,919 26,807,139 28,123,174 27,417,635 23,920,373
All U.S. Ports – Total 26,444,652 28,555,590 29,306,922 28,532,629 28,532,629
2.14.2 Cruise Ships
The Port of Galveston is the main cruise ship terminal in Texas. With the opening of the
Bayport terminal in 2007, the Port of Houston added additional infrastructure to attract
cruise ships to the Texas Gulf Coast. The cruise industry associations as well as the
ports have passenger and sailing statistics, which can be used for forecasting. This
industry has already modified its outlook and forecasts to account for the recession and
its lingering impacts. Included in the forecast considerations will be ships currently
under construction and planned for deployment in the U.S. market.
2.14.3 Military Traffic and Texas Ports
Texas ports have become a critical component in sustaining military operations. In
terms of tonnage shipped, the Port of Beaumont is the largest military port in the U.S.
and second largest in the world.107 Significant infrastructure investments have been
made in recent years and some are ongoing to improve the channel and the inland
infrastructure connections to the port. Forecasting this element presents some
107
Port of Beaumont

The Statewide Long-Range Transportation Plan 2035
Economics, Demographics, Freight, and the Multimodal 2-125
Transportation System – Conditions and Trends
challenges since the military does not release shipment information and need will
depend on the U.S. military presence or involvement on foreign soil.
2.14.4 Potential Effects of the Panama Canal Expansion
The opening of the expanded Panama Canal will allow larger, deeper draft vessels to
access the Gulf of Mexico via the Caribbean Sea from the Pacific Ocean, which may
affect Texas ports. The Panama Canal expansion project, started in 2007, is building
locks on both sides of the 50-mile canal, digging a new channel linking the locks and
deepening the waterway connecting the Pacific Ocean with the Caribbean Sea. As of
2010, ships loading fewer than five thousand 20-foot boxes use the canal. The
expansion will accommodate vessels carrying about 12,600 containers and may
generate cargo growth of about 5 percent a year.
Houston does not have a deep enough draft to handle some of these ships, but the port
is pursuing funding and developing plans to deepen its draft.108 Some analysts have
predicted that about 20 percent of cargo ships now serving West Coast ports could
divert to Houston once the Panama Canal is widened to handle a new breed of
container vessel known as post-Panamax ships.
Once completed, the Panama Canal will have significant impacts on shipping routes,
port development, and cargo distribution to the U.S. More ships are expected to shift to
east and gulf coast ports from the congested west coast ports. Container trade is
expected to be the single largest gainer. Houston already has 73 percent of the
container market in the Gulf of Mexico, and 94 percent of the container market in Texas.
About 14 percent of container traffic handled by the Port of Houston comes through the
Panama Canal, a percentage that port officials say could grow to about 25 percent by
2020.109 A 2006 TxDOT study said the impact of the Panama Canal expansion ―will be
felt most heavily on and around the Port of Houston, the state’s largest container port
and a key trading partner for goods shipped via the Panama Canal.‖110
Historically, dry and liquid bulk cargo have generated most of the Panama Canal's
revenues. Bulk cargo includes dry goods, such as grains (corn, soy, and wheat, among
others), minerals, fertilizers, coal, and liquid goods, such as chemical products, propane
gas, crude oil, and oil derivatives. Recently, containerized cargo has replaced dry bulk
cargo as the Panama Canal's main income generator, moving it to second place. Texas
108
Port of Houston Authority, June, July 2010 Magazine 109
―Houston eyes Asia trade as Panama Canal expands,‖ Reuters on-line article, December 14, 2009,
http://www.reuters.com/article/idUSN1016913920091214. 110
Effects of the Panama Canal Expansion on Texas Ports and Highway Corridors,‖ Cambridge Systematics, October 2006,
www.camsys.com/pubs/freight_Panama%20Canal_ExecSum.pdf

The Statewide Long-Range Transportation Plan 2035
Economics, Demographics, Freight, and the Multimodal 2-126
Transportation System – Conditions and Trends
ports handle much of the bulk goods entering the U.S., as well as most of the
containerized cargo that does not flow through the west coast ports. The growth in
Panama Canal usage over the past few years has been almost entirely driven by
increased U.S. imports from China passing through the canal en route to ports on the
U.S. east and Gulf coasts. However, it is increasingly recognized in both the United
States and China that this imbalance in trade is unsustainable, so some of the more
optimistic growth estimates should probably be trimmed back. The Panama Canal
forecasts its growth at about 3 percent annually, doubling its tonnage between 2005 and
2025.111 Approximately 70 percent of the canal’s $100 billion containerized cargo is
either destined to or coming from the United States. As the result of congestion at west
coast ports and other inland bottlenecks, shippers have moved their shipments to
alternative ports. This has resulted in the Panama Canal gaining significant market
share, now handling over 40 percent of container traffic headed to the east coast.112
One of the most significant shifts resulting from the Panama Canal expansion is the
introduction of even larger ships into the Gulf and east coast shipping lanes. The new
generation of containerships, including many of the post-Panamax ships that will be
attracted to the expanded Panama Canal, typically require channel depths of at least
50 feet, particularly for fully loaded vessels. Few Texas ports currently have the ability to
handle ships of that depth. Although at 45 feet, the Port of Houston will have one of the
deeper channels among Gulf Coast ports, it will still lag behind several of its major east
coast competitors. The Port of Houston is spending about $1.2 billion to expand its
Bayport Container Terminal to enable it to handle about 1.4 million containers per
year.113 The port is buying giant cranes capable of unloading post-Panamax cargo
ships, which can carry up to 12,600 containers, almost three times the current
number.114 The Port predicts that its container volume will increase 11 percent a year
for the next 5 years as a result of the larger, more efficient ships coming through the
Panama Canal.115 Since many Gulf and east coast ports do not have deep enough
drafts for the post–Panamax ships, it will be necessary to build transshipment facilities
to break up the cargoes from the larger ships to smaller ships that can be
accommodated. One such scenario is an initial stop in a Mexican port that does have
sufficient draft and then on to Houston, which is the closest major port.
111
―Proposal for the expansion of the Panama Canal,‖ Panama Canal Authority, April 24, 2006
http://www.pancanal.com/eng/plan/ 112
―The Implications of Panama Canal Expansion to U.S. Ports and Coastal Navigation Economic Analysis,‖ U.S. Army Corps of Engineers White Paper, December 2008. http://www.iwr.usace.army.mil/docs/iwrreports/WhitePaperPanamaCanal.pdf
113Ibid, Cambridge Systematics Study
114 Port of Houston Authority, June, July 2010 Newsletter
115―The Gulf Coast's Rising Tide,‖ Inbound Logistics, January 2009. Quote attributed to Jeff Moseley, president and CEO of
the Greater Houston Partnership http://www.inboundlogistics.com/articles/features/0109_feature07.shtml

The Statewide Long-Range Transportation Plan 2035
Economics, Demographics, Freight, and the Multimodal 2-127
Transportation System – Conditions and Trends
2.14.5 The Gulf Intracoastal Waterway
The primary shallow draft waterway in Texas is the Gulf Intracoastal Waterway (GIWW)
(Figure 2-52), which stretches from Brownsville, on the Mexican border to the Louisiana
state line at the Sabine River. There are two navigation locks on the Texas reach of the
GIWW. The entire GIWW is a 1,300-mile-long man-made canal that runs along the Gulf
of Mexico coastline from Texas’ southernmost tip at Brownsville to St. Marks, Florida.
The Texas portion of the waterway is 423 miles long. The GIWW is the nation’s third
busiest waterway with the Texas portion handling more than 58 percent of its traffic. The
GIWW requires regular dredging to maintain the waterway at optimum levels and allow
navigation without grounding for fully loaded commercial vessels. TxDOT, as the non-
federal sponsor, works cooperatively with the USACE to plan, maintain, research, and
improve the waterway.
Table 2-40 and Figure 2-52 show shipping traffic along the GIWW from 1990 to 2008.
Table 2-40: Gulf Coast Intracoastal Waterway, Shipments by Type of Traffic and Commodity116
Summary
1990 2000 2008 % of 2008 % Change 1990–2008
Type of Traffic (Millions of Tons)
Coastwise 0.7 0.8 0.2 0.2 –71.4
Internal 114.6 113 115.7 99.8 1.0
Total 115.3 113.8 115.9 100.0 0.5
Summary Commodity (Millions of Tons)
Coal 9.2 5.9 6.9 6.0 –25.0
Petroleum & Petroleum Products
62.4 53.3 59.4 51.3 –4.8
Chemical & Related Products 22.9 25.4 20.2 17.4 –11.8
Crude Materials 14.4 20.4 20.8 17.9 44.4
Primary Manufacturing Goods 3 4.4 5.6 4.8 86.7
Food & Farm Products 2.2 2.1 1 0.9 –54.5
All Manufacturing Equipment 0.4 1.3 1.1 0.9 175.0
Other 0.8 1 0.9 0.8 12.5
Total 115.3 113.8 115.9 100.0 0.5
116
USACE; 2008 Waterborne Commerce of the United States (WCUS) Waterways and Harbors on the: Part 5 – National
Summaries of Domestic and Foreign Waterborne Commerce, Table 3-13 and Table 3-14
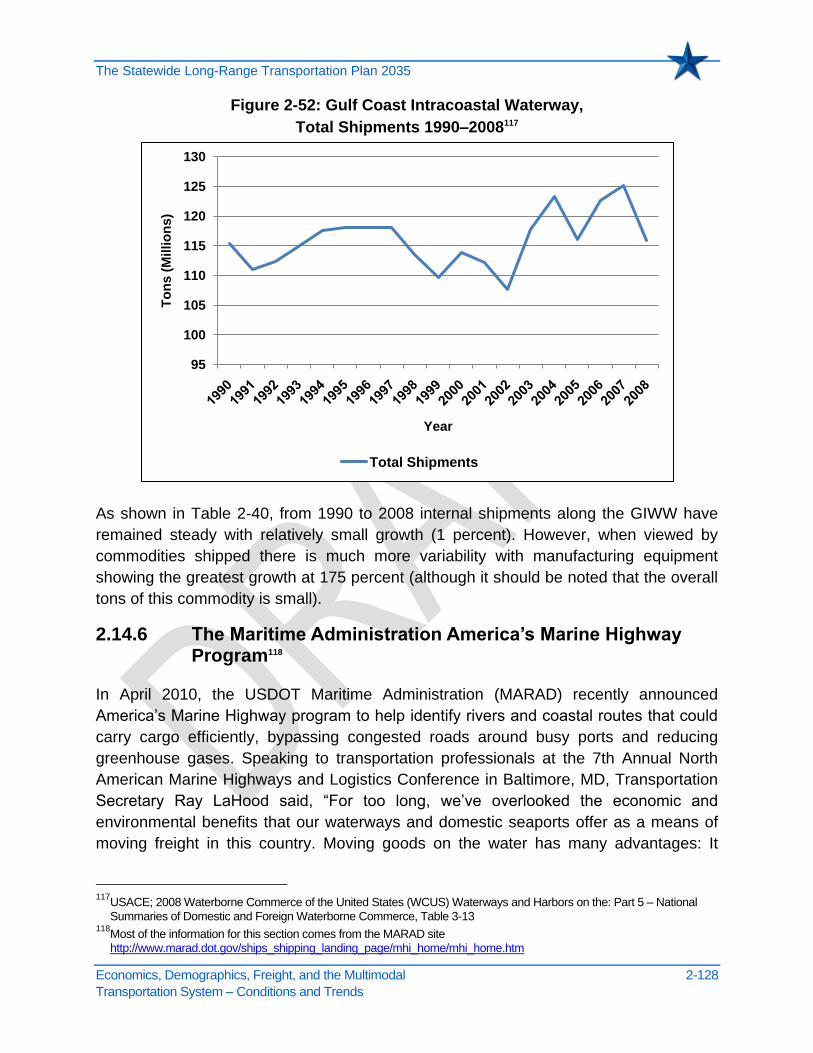
The Statewide Long-Range Transportation Plan 2035
Economics, Demographics, Freight, and the Multimodal 2-128
Transportation System – Conditions and Trends
Figure 2-52: Gulf Coast Intracoastal Waterway,
Total Shipments 1990–2008117
As shown in Table 2-40, from 1990 to 2008 internal shipments along the GIWW have
remained steady with relatively small growth (1 percent). However, when viewed by
commodities shipped there is much more variability with manufacturing equipment
showing the greatest growth at 175 percent (although it should be noted that the overall
tons of this commodity is small).
2.14.6 The Maritime Administration America’s Marine Highway Program118
In April 2010, the USDOT Maritime Administration (MARAD) recently announced
America’s Marine Highway program to help identify rivers and coastal routes that could
carry cargo efficiently, bypassing congested roads around busy ports and reducing
greenhouse gases. Speaking to transportation professionals at the 7th Annual North
American Marine Highways and Logistics Conference in Baltimore, MD, Transportation
Secretary Ray LaHood said, ―For too long, we’ve overlooked the economic and
environmental benefits that our waterways and domestic seaports offer as a means of
moving freight in this country. Moving goods on the water has many advantages: It
117
USACE; 2008 Waterborne Commerce of the United States (WCUS) Waterways and Harbors on the: Part 5 – National
Summaries of Domestic and Foreign Waterborne Commerce, Table 3-13 118
Most of the information for this section comes from the MARAD site
http://www.marad.dot.gov/ships_shipping_landing_page/mhi_home/mhi_home.htm
95
100
105
110
115
120
125
130T
on
s (
Millio
ns
)
Year
Total Shipments

The Statewide Long-Range Transportation Plan 2035
Economics, Demographics, Freight, and the Multimodal 2-129
Transportation System – Conditions and Trends
reduces air pollution. It can help reduce gridlock by getting trucks off our busy surface
corridors.‖
The Marine Highway initiative stems from a 2007 law requiring the Secretary of
Transportation to establish a short sea transportation program and designate short sea
transportation projects to mitigate surface congestion. Under the new regulation,
regional transportation officials will be able to apply to have specific transportation
corridors—and even individual projects—designated by the USDOT as a marine
highway if they meet certain criteria. Once designated, these projects will receive
preferential treatment for any future federal assistance from the department or MARAD.
In 2010, Secretary LaHood announced $58 million in grants for projects to support the
start-up or expansion of Marine Highways services, awarded through the Department’s
Transportation Investment Generating Economic Recovery (TIGER) grants program.
Congress has also set aside an additional $7 million in grants, which MARAD awarded
in August 2010. The Port of Brownsville was selected as part of the Cross Gulf
Container Expansion. This project will expand existing container-on-barge operations by
increasing the frequency and capacity of the service between Brownsville, and Port
Manatee, Florida, across the Gulf of Mexico (Figure 2-53).119
The USDOT published an interim final rule on October 9, 2008, establishing a
framework to provide federal support to expand the use of America's Marine Highway.
The four primary components of the framework are:
Marine Highway Corridors: Designated corridors will integrate the Marine
Highway into the surface transportation system and encourage the development
of multi-jurisdictional coalitions to focus public and private efforts and investment.
Marine Highway Project Designation: Designation of marine highway projects
is aimed at mitigating landside congestion by starting new or expanding existing
services to provide the greatest benefit to the public in terms of congestion relief,
improved air quality, reduced energy consumption, and other factors. Designated
Projects will receive direct support from the USDOT.
Incentives, Impediments and Solutions: The Maritime Administration, in
partnership with public and private entities, will identify potential incentives and
seek solutions to impediments to encourage utilization of the Marine Highway
and incorporate it, including ferries, in multi-state, state, and regional
transportation planning.
119
Maritime Administration News Release, August 2010
http://www.marad.dot.gov/news_room_landing_page/news_releases_summary/news_release/MARAD_13-10_Marine_highway_Projects_release.htm

The Statewide Long-Range Transportation Plan 2035
Economics, Demographics, Freight, and the Multimodal 2-130
Transportation System – Conditions and Trends
Research: The USDOT, working with the Environmental Protection Agency, will
conduct research to support America’s Marine Highway, within the limitations of
available resources. Research would include environmental and transportation
benefits, technology, vessel design, and solutions to impediments.
Figure 2-53: MARAD Gulf Coast and America's Heartland Marine Highway Corridors Map120
2.14.7 Texas Ferry Systems
There are two main ferry locations in Texas: at Port Aransas and Galveston-Port
Bolivar. Throughout the year, more than 8 million people use these TxDOT ferry
systems. The peak months for ferry use are June, July, and August. Ferry service has
been a part of the Texas transportation system since the 19th century when a skiff, The
Tarpon, began operating from Galveston Island.
120
USDOT, Maritime Administration, America’s Marine Highway Corridors, Available at:
http://www.marad.dot.gov/ships_shipping_landing_page/mhi_home/mhi_home.htm

The Statewide Long-Range Transportation Plan 2035
Economics, Demographics, Freight, and the Multimodal 2-131
Transportation System – Conditions and Trends
This ferry operation consists of five boats, each of which can carry approximately 70
vehicles, 500 passengers, and 6 crewmembers. Each ferry is capable of carrying eight
18-wheel trucks weighing 80,000 pounds each.
The Port Aransas Ferry System provides free transportation service 7 days a week, 24
hours a day connecting Mustang Island and Port Aransas with the mainland via Aransas
Pass. The number of ferryboats in service at any time depends on demand.
Port Aransas has six identical large vessels that can carry 20 regular passenger
vehicles on each trip. Each boat can move 100 vehicles per hour. A total overall length
(for combined vehicles such as a car and boat) is 85 feet. The maximum width allowed
is 96 inches. A maximum of 13 feet 6 inches in height is allowed.
There are three ferry services within the state not operated by TxDOT. They are:
Lynchburg Ferry – located near Channelview, Texas, and operated by Harris
County; provides service to historic San Jacinto State Park.
Los Ebanos Ferry – located in Los Ebanos, Texas, and privately owned and
operated. This ferry is a hand drawn ferry across the Rio Grande and provides
service between the U.S. and Mexico.
Jetty Boat – located near Port Aransas, Texas, and privately owned and
operated; provides service to St. Jo Island.
Table 2-41 presents average ferry trip time and total annual passengers and vehicles
for the ferries described above.
Table 2-41: Texas Ferries Total Annual Passengers and Vehicles121
Ferry Average Trip Time
Passengers Vehicles
2000 2006 2008 2000 2006 2008
Galveston – Port Bolivar Ferry
50 6,648,007 6,320,648 5,789,737 2,105,953 2,134,999 1,843,101
Port Aransas Ferry
6 NA 26,254 54,494 2,500,000 1,084,654 2,135,054
Lynchburg Ferry 3 1,270,200 NA NA 1,058,500 372,915 372,915
Los Ebanos 5 122,000 NA NA 77,000 NA NA
Jetty Boat. Inc. (Passenger Only)
15 18,000 18,238 NA - - -
121
National Census of Ferry Operators, 2008

The Statewide Long-Range Transportation Plan 2035
Economics, Demographics, Freight, and the Multimodal 2-132
Transportation System – Conditions and Trends
2.14.8 Texas Port Freight Forecasts
FHWA’s FAF2 provides historic and forecast freight flows (in dollars and tons) between
origins and destinations for U.S. port regions. Within this data, freight flows are
categorized by origin and destination, port region, commodity, and connecting mode
(i.e., truck, rail, etc.) of connection to the port region. The historic base year for FAF2 is
2002. Freight data for 2008 presented in this section is an estimate and may not reflect
final yearly summaries provided by the other sources such as the USACE (Table 2-38).
As shown in Table 2-42 pipelines have been, and will remain, the dominant mode of
freight transport from Texas seaport regions, followed by trucks. Rail and multiple
modes play a much smaller part in the movement of freight to/from Texas seaport
regions.
Table 2-42: Texas Seaport Regions, Foreign Tonnage (Millions of Tons) Shipped by Connecting Mode122
Mode 2008 % of 2008 2035
% of 2035
% Change 2008–2035
Truck Alone 94.5 26.5 201.9 38.7 113.8
Pipeline, Water 240.2 67.3 288.1 55.1 19.9
Rail Alone 20.2 5.7 29.8 5.7 47.5
Multiple Modes* 2.2 0.6 2.5 0.5 11.8
Total 357.1 100.0 522.3 100.0 46.3
*Includes Truck & Rail, Air & Truck, and Other Intermodal
As shown in Table 2-43, according to forecasts published as part of the FHWA’s FAF2,
from 2008 to 2035 the value of exports/imports shipped through Texas Ports is
expected to increase by 220 percent. Alternatively, the weight of exports/imports
shipped through Texas Ports is expected to increase by only 46 percent. By weight and
value, the Houston seaport region will continue to handle the bulk of exports/imports
with 41.1 percent of the total tonnage and 59.9 percent of the total value of goods in
2035. However, the remaining seaport regions will continue to play an equally important
role. Combined, these seaport regions will handle 58.9 percent of the total tonnage and
40.1 percent of the total value of exports/imports in 2035.
122
FAF2 Commodity Origin-Destination Data: 2002–2035; Available at
http://www.ops.fhwa.dot.gov/freight/freight_analysis/faf/faf2_com.htm; and Provisional Annual Commodity Origin-Destination Data – 2008 available at http://www.ops.fhwa.dot.gov/freight/freight_analysis/faf/faf2_pro.htm

The Statewide Long-Range Transportation Plan 2035
Economics, Demographics, Freight, and the Multimodal 2-133
Transportation System – Conditions and Trends
Table 2-43: Texas Seaport Regions, Seaport Foreign Exports/Imports 2008–2035123
Seaport Region*
2008 2035 %
Change Totals
Foreign Exports
Foreign Imports Total
% of Total
Foreign Exports
Foreign Imports Total
% of Total
Tons (Millions)
Brownsville/ Hidalgo
0.5 0.4 0.9 0.2 0.3 1.4 1.7 0.3 93
Houston 55.1 83.4 138.5 38.8 91.8 122.9 214.7 41.1 55
Beaumont 7.9 49.1 57.0 16.0 10.6 78.3 88.9 17.0 56
Corpus Christi
12.7 50.9 63.6 17.8 19.4 59.6 79.0 15.1 24
Texas Remaining
22.2 75.0 97.2 27.2 38.9 99.1 138.0 26.4 42
Total Tons 98.3 258.8 357.1 100 161.0 361.2 522.3 100 46
Dollars (Millions)*
Brownsville/ Hidalgo
52 130 181 0.1 109 863 972 0.2 436
Houston 48,831 37,394 86,225 58.4 169,469 113,195 282,664 59.9 228
Beaumont 3,381 10,143 13,524 9.2 13,631 26,683 40,313 8.5 198
Corpus Christi
5,852 8,600 14,451 9.8 24,929 15,901 40,830 8.6 183
Texas Remaining
15,409 17,763 33,172 22.5 65,912 41,337 107,248 22.7 223
Total Dollars 73,525 74,028 147,553 100 274,050 197,978 472,028 100 220
Note: The Freight Analysis Framework2 aggregates ports into regions.
For example, the Houston region would be inclusive of the Port of Houston and the Port of Galveston. #2002 Dollars (based on the earliest reported FAF
2 year, which is 2002)
Table 2-44 illustrates cross-tabulations of total Texas seaport exports and imports by
international origin/destination. As indicated in both figures, trade with Mexico and the
Americas will continue to make up a considerable portion of the international trade
through Texas’ seaports in 2035. Of total exports/imports combined, these two
international regions contribute 47.5 percent of tonnage and 42.1 percent of total
dollars. However, Europe and Asia (Southwest Asia and Asia East and South) will play
an equally important role. Of total exports/imports combined, these international regions
will contribute 33.1 percent of tonnage and 45.3 percent of total dollars in 2035.
123
Ibid

The Statewide Long-Range Transportation Plan 2035
Economics, Demographics, Freight, and the Multimodal 2-134
Transportation System – Conditions and Trends
Table 2-44: Total Seaport Foreign Exports/Imports by Trading Partner 2008–2035124
Summary
Tons (Millions)
2008
% of 2008 Total 2035
% of 2035 Total % Change
Americas 91.5 25.6 135.9 26.1 48.5
Asia East & South 22.9 6.3 47.3 9.1 106.9
Canada 7.4 2.1 11.6 2.2 56.6
Europe 48.3 13.5 77.7 14.9 60.8
Mexico 84.2 23.6 111.7 21.4 32.6
Southwest Asia 38.5 10.9 48.4 9.1 25.9
Rest of World 64.3 18.0 89.6 17.2 39.4
Totals 357.1 100.0 522.3 100.0 46.3
Summary Dollars (Millions)*
Americas 41,530.7 28.1 129,716.8 27.5 212.3
Asia East & South 20,774.9 14.1 79,887.2 16.9 284.5
Canada 2,885.3 2.1 10,098.7 2.2 250.0
Europe 32,380.3 21.9 111,515.8 23.6 244.4
Mexico 22,493.2 15.2 68,699.7 14.6 205.4
Southwest Asia 10,221.4 6.9 22,816.6 4.8 123.2
Rest of World 17,267.1 11.7 49,292.9 10.4 185.5
Totals 147,552.9 100.0 472,027.7 100.0 219.9
#2002 Dollars (based on the earliest reported FAF
2 year, which is 2002)
Table-45 presents exports/imports shipped though Texas’s seaports by commodity. As
shown in Table-45, in terms of 2035 tonnages raw materials will continue to make up
the largest portion of total exports/imports at 60.8 percent of total exports/imports,
followed by processed chemical/petroleum goods at 25.9 percent. However, for 2035 in
terms of value, processed chemical/petroleum goods will make up 57.0 percent of total
dollars, followed by machinery at 20.2 percent.
124
Ibid

The Statewide Long-Range Transportation Plan 2035
Economics, Demographics, Freight, and the Multimodal 2-135
Transportation System – Conditions and Trends
Table 2-45: Texas Seaport Foreign Exports/Imports by Commodity 2008–2035125
Commodity
2008 2035
Foreign Exports
Foreign Imports Total
%of Total
Foreign Exports
Foreign Imports Total
%of Total
Tons (Millions)
Agriculture 3.7 2.5 6.2 1.7 5.8 6.4 12.2 2.3
Raw Materials* 31.5 230.9 262.4 73.5 19.3 298.3 317.6 60.8
Food 15.5 0.3 15.8 4.4 13.4 0.3 13.7 2.6
Textiles 0.0 0.0 0 0.0 0 0 0 0.0
Wood 0.8 0.5 1.3 0.4 0.9 2.0 2.9 0.6
Processed Chemicals/Petroleum
41.3 9.7 51.1 14.3 112.4 23.0 135.5 25.9
Building Materials 0.6 5.0 5.6 1.6 1.4 7.9 9.4 1.8
Machinery 2.3 2.0 4.2 1.2 4.7 7.8 12.4 2.4
Miscellaneous Mixed 2.5 7.9 10.4 2.9 3.0 15.6 18.6 3.6
Other/Unclassified Cargo
0.0 0.0 0.0 0.0 0.0 0.0 0.0 0.0
Total Tons 98.3 258.8 357.1 100.0 161.0 361.2 522.3 100.0
Dollars (Millions)*
Agriculture 950 681 1,631 1.1 2,892 2,476 5,368 1.1
Raw Materials* 1,864 39,332 41,196 27.9 3,467 79,712 83,179 17.6
Food 699 13 713 0.5 1,338 42 1,381 0.3
Textiles 0 0 0 0.0 0 0 0 0.0
Wood 815 368 1,183 0.8 1,266 1,398 2,664 0.6
Processed Chemicals/Petroleum
50,510 14,179 64,688 43.8 226,210 42,718 268,928 57.0
Building Materials 222 1,534 1,757 1.2 1,125 6,297 7,422 1.6
Machinery 16,609 15,887 32,496 22.0 35,839 59,284 95,123 20.2
Miscellaneous Mixed 1,855 2,034 3,889 2.6 1,914 6,050 7,964 1.7
Other/Unclassified Cargo
- - - <1.0 - - - <1.0
Total Dollars 73,525 74,028 147,553 100.0 274,050 197,978 472,028 100.0
#2002 dollars (based on the earliest reported FAF
2 year, which is 2002)
125
Ibid

The Statewide Long-Range Transportation Plan 2035
Economics, Demographics, Freight, and the Multimodal 2-136
Transportation System – Conditions and Trends
2.15 Texas Pipelines
Texas leads the nation in refining capacity and the production of crude oil and natural
gas. Its marketed production represents 30 percent of total U. S. natural gas
production126 and 20 percent of crude oil production.127 Pipelines are a major mode of
transportation of crude oil and natural gas in Texas, providing an economic and efficient
way to move these commodities. Texas is a net exporter of natural gas both nationally
and internationally. Although oil production in the state is in decline, natural gas
production in the state continues to increase rapidly due to in increased production from
unconventional sources in Northeast Texas (Figure 2-54).
Figure 2-54: Texas Natural Gas Production and Oil Production 2000–2008128
Most of the state’s 27 oil refineries are clustered near major ports along the Gulf Coast,
including Houston, Port Arthur, and Corpus Christi. These facilities can process more
than 4.7 million barrels of crude oil per day. Refined-product pipelines spread out from
126
Energy Information Administration Independent Analysis and Statistics http://www.eia.doe.gov/oil_gas/natural_gas/info_glance/natural_gas.html
127Texas Petrofacts – Monthly Data Review from the Railroad Commission of Texas March 2010 http://www.rrc.state.tx.us/data/petrofacts/2010/petro0310.pdf
128 Ibid
0
100
200
300
400
500
600
700
0.00.51.01.52.02.53.03.54.04.55.05.56.06.57.07.58.08.5
Oil P
rod
uc
tio
n
(M
illio
ns
of
Ba
rre
ls)
Na
tura
l G
as
Pro
du
cti
on
(Tri
llio
ns
of
Cu
bic
Fe
et)
Year
Natural Gas Production Oil Production

The Statewide Long-Range Transportation Plan 2035
Economics, Demographics, Freight, and the Multimodal 2-137
Transportation System – Conditions and Trends
Houston across the country, allowing Texas petroleum products to reach virtually every
major consumption market east of the Rocky Mountains.129
2.15.1 Contribution of Pipelines to the Texas Economy
In 2006, more than 312,000 Texans, or 3.1 percent of the state work force, were
employed in the oil and natural gas industry, which accounted for $159.3 billion or
14.9 percent of Texas’ GSP. For comparison, in 2003 the industry contributed $85.6
billion to GSP, 10.3 percent of the state GSP. Likewise, oil and gas industry wages have
risen substantially in recent years. In 2006, wages totaled $30.6 billion, or about 6.9
percent of all wages in Texas. In Texas in 2003, oil and gas industry wages were $20.9
billion or 5.8 percent of all wages.
Historically, the oil and natural gas industry have accounted for approximately 10 to
25 percent of the state’s GSP, a trend that roughly tracks the price of oil (Figure 2-55).
(The price indicated in the figure is based on the taxable value of oil from in-state
production, in dollars adjusted for inflation.)
Figure 2-55: Texas Oil and Gas Industry Contribution to the Texas Economy130
129
Energy Information Administration. State Energy Profiles – Texas
http://tonto.eia.doe.gov/state/state_energy_profiles.cfm?sid=TX 130
The Energy Report 2008, Comptroller of Public Accounts http://www.window.state.tx.us/specialrpt/energy/nonrenewable/
$0
$10
$20
$30
$40
$50
$60
$70
$80
0%
5%
10%
15%
20%
25%
30%
200
7 D
olla
rs
Perc
en
t o
f T
ota
l G
SP
Year
Oil and Gas as Percentage of Total GSP
Taxable Price of Oil Inflation-adjusted price

The Statewide Long-Range Transportation Plan 2035
Economics, Demographics, Freight, and the Multimodal 2-138
Transportation System – Conditions and Trends
2.15.2 Types of Pipelines
There are three primary types of pipelines: gathering pipelines, transmission pipelines,
and distributing pipelines. Gathering pipeline systems collect raw natural gas or crude
oil from production wells. Transmission pipeline systems transport natural gas
thousands of miles across different states in the continental United States. These are
usually large diameter long-distance lines and connect supply areas to markets and
points of export. Distribution pipeline systems deliver natural gas to our homes and
businesses across several communities. In addition, refined products pipeline systems
transport products from oil refineries such as gasoline, kerosene, and other
petrochemicals to storage and distribution terminals.131
The overall total mileage of all pipelines in Texas is 222,285 miles.132 Table 2-46
provides a breakdown of pipeline mileage by use—transmission, gathering, and
distribution. Natural gas and crude oil are the major commodities transported by
pipelines—these together constitute 67 percent of pipeline miles. Other products
transported by pipeline include Carbon Dioxide, Nitrogen, and Hydrogen.
Table 2-46: Texas Pipeline Mileage133
Pipeline System Mileage (miles)
Hazardous liquid line mileage 56,375
Gas transmission line mileage 66,918
Gas gathering line mileage 6,659
Gas distribution mileage 92,333
Total Pipeline Mileage 222,285
Figure 2-56 illustrates crude petroleum and natural gas pipelines in Texas.
131
Pipeline and Hazardous Materials Safety Administration. Pipeline Significant Incidents and Mileage Overview
http://primis.phmsa.dot.gov/comm/reports/safety/PSI.html 132
Office of Pipeline Safety Statistics: http://primis.phmsa.dot.gov/comm/reports/safety/TX_detail1.html 133
Ibid

The Statewide Long-Range Transportation Plan 2035
Economics, Demographics, Freight, and the Multimodal 2-139
Transportation System – Conditions and Trends
Figure 2-56: Crude Petroleum and Natural Gas Pipeline in Texas134
2.15.3 Ownership and Maintenance
Both natural gas and oil pipeline systems are owned and operated and maintained by
several different private companies. These are constructed in response to the evolving
supply and demand dynamics of the market. Federal Energy Regulatory Commission
(FERC) regulates the construction, operation, and safety of interstate pipelines whereas
intrastate gas and petroleum pipelines are regulated by the Texas Railroad Commission
(RRC).
2.15.4 Pipeline Forecasts
As discussed in this section, oil and natural gas production and transportation are
thriving in Texas. Because pipelines are privately owned and operated, growth and
needs are determined based on market forces. Quantitative needs estimates were not
prepared for the expansion of the pipeline network. During the development of this plan,
representatives of pipeline companies expressed no concerns about needed capacity or
the ability of the industry to address future capital investment needs.
134
FHWA, TxDOT, and TTI, The Value of Pipelines to the Transportation System Of Texas: Year One Report, October 2000