20. urban density and carbon emissions in china
TRANSCRIPT

479
20. Urban Density and Carbon Emissions in ChinaJianxin Wu, Yanrui Wu and Xiumei Guo1
IntroductionAs the world’s largest emitter of carbon dioxide, China faces enormous carbon abatement challenges. These challenges are concentrated in cities, which account for the largest share of energy consumption in China. One estimate for 2006 suggested that some 84 per cent of China’s total commercial energy use occurred in urban areas (Dhakal 2009).
In economic theory, ideas from new economic geography suggest that urban agglomeration can lead to economies of scale, technological progress and transaction cost reduction—and therefore lower energy consumption and lower carbon dioxide emissions. Moreover, the spatial distribution of population and economic activities is a key factor influencing energy consumption and carbon dioxide emissions, including the distribution of people within and between urban clusters.
As the hubs of most of the energy consumption in the world’s largest carbon emitter, cities in China are fundamental to addressing global and domestic energy-related challenges. Analysis of the relationship between carbon dioxide emissions and the spatial distribution of urban populations and economic activities therefore also has important policy implications for China’s national urbanisation policy.
That urbanisation policy has instigated a process of rapid relocation that has seen more than 20 million people move from rural areas to urban areas annually over the past decade. This was supported by the implementation of preferential regional development programs and industry relocation policies. As these policies can affect the spatial distribution of population and economic activities, they may also have significant environmental consequences.
1 Work on this chapter was supported by the China National Natural Science Foundation (1333007, 71473105), China National Social Science Foundation (15ZDA054) and a BHP Billiton Visiting Professorship (University of Western Australia). The first draft was completed while Jianxin Wu was visiting the UWA Business School. We also thank Lauren Johnston and Ligang Song for helpful comments.

China’s New Sources of Economic Growth (I)
480
International institutions and national governments have long considered the idea of developing compact cities as an approach for reducing energy consumption and greenhouse gas (GHG) emissions (Gaigné et al. 2012). One assumption is that compact cities are less dependent than others on private vehicle use, which leads to lower energy consumption and lower carbon dioxide emissions. A recent theoretical and empirical literature highlights the mechanisms by which urban density affects the environment through the level of commuting (Brownstone and Golob 2009; Glaeser and Kahn 2010; Gaigné et al. 2012). Some household-level research also finds strong evidence in developed country samples that urban population density is negatively related to energy use for commuting (Brownstone and Golob 2009; Glaeser and Kahn 2010; Cirilli and Veneri 2014; Lee and Lee 2014). However, many authors argue that the impact of urban density on carbon dioxide emissions is a complicated issue (Gaigné et al. 2012; Borck and Pflüger 2013; Larson and Yezer 2014). The aggregate effect of urban density on carbon dioxide emissions remains indeterminate. As researchers debate whether compact cities perform better than dispersed ones in terms of energy efficiency, environmental policymakers may safely adopt a comprehensive urban-wide approach to such efficiency, instead of considering just the effects of commuting or transport.
In this chapter, we aim to conduct a comprehensive empirical examination of the relationship between urban density and carbon dioxide emissions. In doing so, we believe we make three contributions to the literature. First, the full panel data for China’s prefecture-level and above (PAA) cities used here allow us not only to newly control for time-invariant omitted variables that may distort the cross-sectional estimates, but also to avoid possible sample selection biases associated with the partial samples and household survey samples used in most existing studies. Second, we examine the impact of urban density on carbon dioxide emissions through three mechanisms: intra-city commuting, transport and the entire urban system. Third, our empirical results suggest that compact cities are more environmentally friendly than dispersed ones. However, we also find that denser cities in China depend more on public commuting and therefore create more carbon dioxide emissions through intra-city commuting.
The remainder of the chapter is organised as follows: the second section presents a brief literature review; the third section describes the data and variables; the fourth section reports some stylised facts about Chinese urban population density; the fifth section discusses the empirical analysis and results; and the sixth section concludes and offers some policy implications.

20. Urban Density and Carbon Emissions in China
481
Literature reviewSince transport accounts for a large and growing share of energy consumption and GHG emissions, a large body of empirical literature has focused on the effects of urban density on GHG emissions from transport, particularly in the case of intra-city commuting. Holden and Norland (2005) use household survey data from eight residential areas in the Greater Oslo region in Norway, and find that compact cities tend to be ‘greener’ than dispersed ones in terms of energy use for housing and transport. Similarly, Muñiz and Galindo (2005) use data for 163 metropolitan municipalities in Barcelona, Spain, and find that denser central areas have lower energy consumption from commuting than those on the periphery. Based on a Californian subsample from the 2001 US National Household Travel Survey, Brownstone and Golob (2009) find that a decrease in housing density by 1,000 units per square mile (2.6 sq km) (40 per cent) results in an increase of 1,200 miles (1,930 km) driven (4.8 per cent) and 65 more gallons (246 L) (5.5 per cent) of fuel used per household per year. Regarding the effects of residential density on fuel usage, increased mileage leads to a difference of 45 gallons (170 L), with the remaining 20 gallons (76 L) relating to vehicle choice. Lee and Lee (2014) find that doubling population-weighted urban density is associated with a reduction in carbon dioxide emissions from household travel and residential energy consumption, by 48 per cent and 35 per cent, respectively. Cirilli and Veneri (2014) use a cross-sectional dataset of the 111 largest Italian urban areas in 2001 and find that smaller, more compact cities are associated with lower carbon dioxide emissions per commuter. Most of these studies rely on cross-sectional, household-based survey data.
The availability of data for carbon dioxide emissions in cities across countries enables one strand of the literature to examine the effects of urban density on other pollutants (such as sulphur dioxide, nitrogen dioxide and particulate matter). Hilber and Palmer (2014) use panel data for 75 cities in 45 countries and find that increasing both vehicle and population densities can significantly reduce air pollution concentration in city centres. The negative effect of car density on pollution is due to the association of car density with decentralisation of residential and economic activities. Their results show that the impact of private vehicles on pollutant emissions is substantially more complicated than expected. Sarzynski (2012) uses a sample of 8,038 cities worldwide in 2005 and finds that compact cities are significantly correlated with lower aggregate pollutant emissions.
Transport accounts for 20 per cent of GHG emissions in the EU15 countries and 30 per cent in the United States (OECD 2008). In China’s PAA-level cities, according to our estimation, the transport sector accounts for approximately 18 per cent of carbon dioxide emissions. Although transport plays an important

China’s New Sources of Economic Growth (I)
482
role in energy consumption and carbon dioxide emissions, other factors also contribute to GHG emission levels and cannot be neglected. Recent studies have also tried to investigate the impacts of urban compactness on carbon dioxide emissions by using a more general framework. Larson and Yezer (2014) develop an urban simulation model using endogenous population, housing supply and demand and commuting. The simulation results show no significant effect on energy consumption of city size and population density. In a more general equilibrium framework, Gaigné et al. (2012) develop a model of an urban system with two cities and theoretically find that households in denser cities are not necessarily more environmentally friendly. Higher population density may reduce carbon dioxide emissions generated by commuting, but can increase the emissions because of the relocation of economic activities due to changes in prices, wages and land rents. In other words, the increase in compactness is environmentally desirable only if the intercity and intra-urban distribution of economic activities remains the same. Compactness, therefore, may not mitigate carbon dioxide emissions when one accounts for the possible relocation of activities within and between cities in response to a higher population density and its associated consequences. Unlike Larson and Yezer (2014) and Gaigné et al. (2012), Borck and Pflüger (2013) develop a new economic geography model that accounts for comprehensive pollutant emissions that arise from commuting within cities, intercity goods transport, production of manufacturing and agricultural goods and residential energy use. They find that city size has an ambiguous effect on pollution. However, these results are based on theoretical analyses or simulations and empirical research is therefore required to verify these hypotheses.
Another strand of research has tried to investigate the effect of urban layout and planning on carbon dioxide emissions in developing countries—China, in particular. Chen et al. (2008) use data from 45 large cities to analyse the costs and benefits of urban compactness from an environmental perspective, and conclude that population density in many Chinese cities is generally less than the critical density level that may maximise the environmental quality of a city. Liu et al. (2014) construct indicators of carbon dioxide economic efficiency (the ratio of gross domestic product to total carbon dioxide emissions) and carbon dioxide social efficiency (the ratio of a social welfare measure to total carbon dioxide emissions). Using panel data from 30 Chinese cities, they find that urban compactness is positively related to carbon dioxide economic efficiency, but negatively correlated with carbon dioxide social efficiency. Qin and Wu (2015) examine data from 25 provinces in China over the period 1998–2008 and find a nonlinear relationship between carbon dioxide emissions and urban concentration. More specifically, they found that as the degree of urban concentration increases, carbon dioxide emission intensity first increases and then declines. They attribute this bell-shaped relationship between carbon dioxide emission intensity and urban concentration to the interplay of economies

20. Urban Density and Carbon Emissions in China
483
of scale, technological change, institutional reform and associated changes in industrial composition. Jenks and Burgess (2000) use cases from developing countries to highlight the sustainable characteristics of compact cities; however, this strand of research is always limited by small sample sizes.
In general, due to data constraints, most existing research is based on cross-sectional household survey data from developed countries, particularly cities in the United States and Europe. This type of research has three potential limitations. First, cross-sectional data neglect technology and structural changes over time, which may radically reduce carbon dioxide emissions that arise from certain types of energy consumption. Industry composition and the structure of energy consumption in cities can also change over time. Advocates of the environmental Kuznets curve argue that as income grows, pollution first increases and then declines due to structural change and adoption of clean technologies (Stern 2014). The decline may be driven by other factors such as the enforcement of environmental regulations, increased environmental awareness and education and probably the relocation of polluting industries. Second, studies that use household data consider only carbon dioxide emissions that result from consumption, neglecting emissions from the production side. Yet carbon dioxide emissions arising from the production process account for a large share of total emissions. Therefore, neglecting carbon dioxide emissions from production may lead to significantly biased results and incorrect policy implications. Third, in developed countries, private vehicles are the predominant mode of transport, while in developing countries, public transportation modes such as buses and taxies are popular. According to Zheng et al. (2011), private cars account for only a very small proportion of energy use in China.
Most empirical studies adopt cross-sectional household data because economic data are not collected and reported at the city level in developed countries (Au and Henderson 2006). Fortunately, the Chinese Government regularly collects and reports economic data at the city level, which provide a unique database for city-level analysis. This chapter aims to analyse the impacts of urban density on carbon dioxide emissions from intra-city commuting, transport and the entire urban system.
Data and variablesOur data are drawn from a series of official publications by China’s National Bureau of Statistics (NBS). The three major sources are the China city statistical yearbook (NBS 2008–12a), China urban construction statistical yearbook (NBS 2008–12e) and China statistical yearbook (NBS 2008–12c). As of 2011, there were 287 cities in China at the PAA level. As most data for Lhasa city are not available, our panel dataset uses 286 of the 287 cities for the period 2007–11.

China’s New Sources of Economic Growth (I)
484
Energy consumption Because our estimation of carbon dioxide emissions is based on energy consumption, we need first to estimate energy consumption. In this chapter, we consider four major sources of energy consumption: electricity, coal gas and liquefied petroleum gas, transportation and heating. The China city statistical yearbook provides original annual data for electricity and coal gas and liquefied petroleum gas in each city.
As part of the welfare system, centralised heating systems provide winter heating in northern Chinese cities (those north of the Huai River), between 15 November and 15 March. Small and medium-sized industrial boilers burn coal to provide this heating. Data for central heating at the city level can be obtained from the China urban construction statistical yearbook. We adopt a 70 per cent thermal efficiency rate according to the Chinese National Standard GB/T 15317-2009 Monitoring and testing for energy saving of coal fired industrial boilers. With data for heat values, thermal efficiency and average low calorific value (20,908 kJ/kg), we can easily estimate coal consumption for winter heating in each city.
Transport accounts for a large share of energy consumption in cities. Unfortunately, no energy consumption data for transport are directly available at the city level. The China city statistical yearbook does, however, provide detailed freight traffic (t-km) and passenger traffic (passenger-km) data for road, railway, waterway and aviation. The China statistical yearbook provides data for all types of energy consumption in the transport sector. Li et al. (2013) report the types of energy consumption corresponding to different modes of transport. Thus, we can calculate the energy intensity of each transportation mode. With data for the city-level freight traffic, passenger traffic and the energy intensity of each transportation mode, we can also estimate the energy consumption by the transport sector in each city. Finally, consumption by these four transport types is converted to tonnes of standard coal equivalent (tce) using the standard conversion factors published in the China energy statistical yearbook.
Carbon dioxide emissions
Aggregate carbon dioxide emissions and carbon dioxide emissions from the transport sector
The estimation of carbon dioxide emissions is based on the energy consumption data discussed in the preceding section. Therefore, we estimate carbon dioxide emissions as follows (Equation 20.1).

20. Urban Density and Carbon Emissions in China
485
Equation 20.1
In Equation 20.1, di (i = 1, 2, 3 and 4) is the conversion factor. The computation of carbon dioxide emissions generated by the transport sector is similar to that of energy consumption. Carbon dioxide emissions from fuel and heating can be estimated using the consumption statistics for coal gas, liquefied petroleum gas and heating coal, using relevant conversion factors. The carbon dioxide emission conversion factors in this chapter are drawn from the Intergovernmental Panel on Climate Change guidelines (IPCC 2006).
As different Chinese cities use different natural resources to produce electricity, the electricity conversion factor differs significantly across regions. China’s state power grid comprises six regional power grids. Fortunately, in recent years, the baseline emission factors for each regional power grid have been estimated and reported by the National Coordination Committee on Climate Change. As electricity transmitted through a regional power grid is substitutable (Glaeser and Kahn 2010), we use regional baseline emission factors to convert electricity consumption into carbon dioxide emissions in each region.
Carbon dioxide emissions generated by intra-city commuting
In China, intra-city commuting includes buses, taxies, private vehicles and metro systems (railway). As of 2011, nine cities ran metros (Beijing, Shanghai, Guangzhou, Shenzhen, Tianjin, Nanjing, Shenyang, Chengdu and Wuhan), but only three ran a metro during the period of this study (2002–11): Beijing, Shanghai and Guangzhou. The remaining six cities introduced metros very late in our sample period and most had only one line in operation. The data for private vehicles in PAA-level cities are not available for China, and Zheng et al. (2011) estimated that private vehicles account for only a small proportion of public transport. We therefore assume that the contribution of metros and private vehicles to intra-city commuting is relatively small. Following Zheng et al. (2011), we use intra-city public transportation (buses and taxies) as a replacement for intra-city commuting. The number of buses and taxies in each city is available in the China city statistical yearbook. Fuel consumption (gasoline and diesel) is calculated according to Chinese National Standard JT 711-2008 Limits and measurement methods of fuel consumption for commercial vehicle for passenger transportation. Carbon dioxide emissions from gasoline and diesel consumption during commuting can be estimated by using conversion factors from the IPCC guidelines (2006).

China’s New Sources of Economic Growth (I)
486
Dependent variablesThe objective of this chapter is to examine the impacts of urban density on carbon dioxide emissions from intra-city commuting, transport and the entire urban system. Therefore, we use the following dependent variables: commuting-related per capita carbon dioxide emissions (CPCCEs), transport-related per capita carbon dioxide emissions (TPCCEs) and urban system-related per capita carbon dioxide emissions (UPCCEs).
Explanatory variables
Urban density
Following the literature in the field, we use urban residential population per square kilometre in a city as a proxy for urban density (denoted as density). As high population density can reduce the mean commuting distance, the impact of urban density on CPCCEs is expected to be negative. However, as argued by some authors (for example, Gaigné et al. 2012; Borck and Pflüger 2013; Larson and Yezer 2014), the impacts of urban density on carbon dioxide emissions generated by the transport sector and the entire urban system are complicated. Therefore, the effects of urban density on TPCCEs and UPCCEs are ambiguous.
Income level
We use gross city product (GCP) per capita in a city as a proxy for income level (denoted as ln(income)). As increases in income levels may lead to greater production and consumption of goods and services, it is expected that income levels will be positively related to carbon dioxide emissions.
Energy intensity
Energy intensity (energy consumption per unit of real GCP, denoted as energyintensity) is always the standard proxy for heterogeneity and variation in technological progress in environmental studies (for example, Auffhammer and Carson 2008; Du et al. 2012). It is expected that energy intensity will be positively related to carbon dioxide emissions.
Industry structure variables
Industry structure variables are measured by the income shares of secondary and tertiary industries, denoted as Sec_Share and Ter_Share, respectively. Industry composition may affect carbon dioxide emissions in two ways. First, industries differ greatly in terms of their direct energy consumption and

20. Urban Density and Carbon Emissions in China
487
carbon dioxide emissions. For example, secondary industries usually produce more carbon dioxide emissions than agricultural and tertiary industries. Second, secondary industries are more capital intensive and thus create more carbon dioxide emissions through cargo transport. Conversely, tertiary industries are more labour intensive and thus produce more carbon dioxide through passenger transport. Therefore, the output shares of secondary and tertiary industries are included to capture possible variations in industry compositions across cities over time.
Trade openness
We use the ratio of the total value of foreign trade to GCP in a city as a proxy for trade openness (denoted as openness). The relationship between foreign trade and carbon dioxide emissions is widely discussed in the literature (Halicioglu 2009; Lin and Sun 2010; Ren et al. 2014). Firms may get clean production technology from foreign trade; however, the export of energy-intensive products may increase domestic carbon dioxide emissions. Therefore, the aggregate effects of foreign trade on carbon dioxide emissions remain ambiguous.
Foreign direct investment
Considering that China is one of the largest host countries in the world for foreign direct investment (FDI), we include FDI (denoted as FDIY) as a control variable in our specification. The variable is measured by the ratio of actually utilised FDI to GCP in a city. The relationship between FDI and carbon dioxide emissions is associated with the ‘pollution haven’ theory, which says that high-emission foreign firms from developed countries with stringent environmental regulations may be attracted to developing countries with weak environmental regulations (Kellenberg 2009). Empirical evidence for this effect is, however, mixed.
Urban population density in this chapter is calculated by actual residential population rather than population recorded through the hukou (household registration) system. Data for actual residential population and foreign trade volume are drawn from the China statistical yearbook for regional economy (NBS 2008–12d), while data for jurisdiction, nominal GCP and FDI are obtained directly from the China city statistical yearbook (NBS 2008–12a). The nominal GCP is deflated using a province-specific gross regional product (GRP) deflator, with 2007 as the base year. The province-specific GRP deflator is drawn from the China statistical yearbook (NBS 2008–12c). Table 20.1 shows the descriptive statistics for major variables and reveals substantial heterogeneity across cities.

China’s New Sources of Economic Growth (I)
488
Table 20.1 Descriptive statistics for all variables
Variable Mean Std dev. Min. Max.
UPCCEs (tonnes per capita) 2.640 4.156 0.067 48.137
TPCCEs (tonnes per capita) 0.397 0.399 0.033 3.474
CPCCEs (tonnes per capita) 0.047 0.074 0.001 1.228
density (people per sq km) 413.3 311.800 4.700 2,565.100
income (RMB10,000 per capita) 1.869 2.314 0.163 32.066
energyintensity (tonnes per RMB1,000) 0.306 0.257 0.059 2.871
Sec_share 0.481 0.116 0.090 0.910
Ter_share 0.358 0.081 0.086 0.853
openness 0.278 0.779 0.000 26.970
FDIY (FDI/GCP) 0.027 0.031 0.000 0.420
Source: Authors’ own calculations.
Stylised facts about Chinese urban population densityChina has experienced rapid urbanisation in the past few decades. The country has a scarcity of arable land relative to the rest of the world. For example, in 2011, per capita arable land in China was approximately 1,023 sq m, roughly 40.9 per cent of the global average of 2,500 sq m. The Chinese Government has therefore implemented stringent land regulation policies throughout the urbanisation process, a consequence of which is a continuous increase in urban population density.
Figure 20.1 presents changes in average urban population density from 2007 to 2011. Among China’s three main regions, the eastern cities have much higher average urban population density than the central and western cities. According to the classification in the China statistical yearbook (NBS 2008–12c), we can divide cities into five types according to population: small cites (less than 500,000), medium–small cities (500,000 – 1 million), medium-sized cities (1–2 million), large cities (2–4 million) and megacities (more than 4 million). We find that urban population density is highly correlated with city size (Figure 20.2). The average urban population density of megacities is 6.11 times that of small cities. In China, the best public services—such as education, health care and public facilities—are in large cities due to the concentration of administrative power. This leads to further concentration of population in large cities and, therefore, a trend of increasing urban population density in China is expected in coming decades.

20. Urban Density and Carbon Emissions in China
489
Figure 20.1 Evolution of urban density, 2007–11Note: The unit for urban density is the number of people per square kilometre.Source: Authors’ own work.
Figure 20.2 City size and urban density, 2007–11Note: The unit for urban density is the number of people per square kilometre.Source: Authors’ own work.

China’s New Sources of Economic Growth (I)
490
Empirical analysisTo investigate the impact of urban density on carbon dioxide emissions in China, we estimate Equation 20.2.
Equation 20.2
In Equation 20.2, densityi,t represents the natural logarithm of people per square kilometre in a city. Zi,t denotes a vector of control variables, including income level, energy intensity, capital intensity, industry structure, trade openness and FDI; φ0 is a constant, φ1 is a scalar and β is a vector of parameters. The variable ηi captures city fixed effects, which are used to control for unobserved, time-unvarying city characteristics; Tt is a year fixed effect used to control for unobserved, time-varying exogenous shocks that are common to all cities; and εi,t is the error term.
Several specifications are considered for each of the PCCEs representing intra-city commuting, the transport sector and the urban system (Tables 20.2–20.4), respectively. Column 1 in each of the tables presents the pooled ordinary least squares (OLS) specification. However, the OLS estimation may be biased due to a lack of controls for possible time-unvarying city characteristics and time-varying year fixed effects. Therefore, we include city fixed effects in column 2, and then both city fixed effects and year fixed effects in column 3. Hausman tests are applied to check the fitness of the specifications. To deal with the possible problem of endogeneity, the generalised method of moments (GMM) is applied and the results are reported in column 4 as a further robustness check.
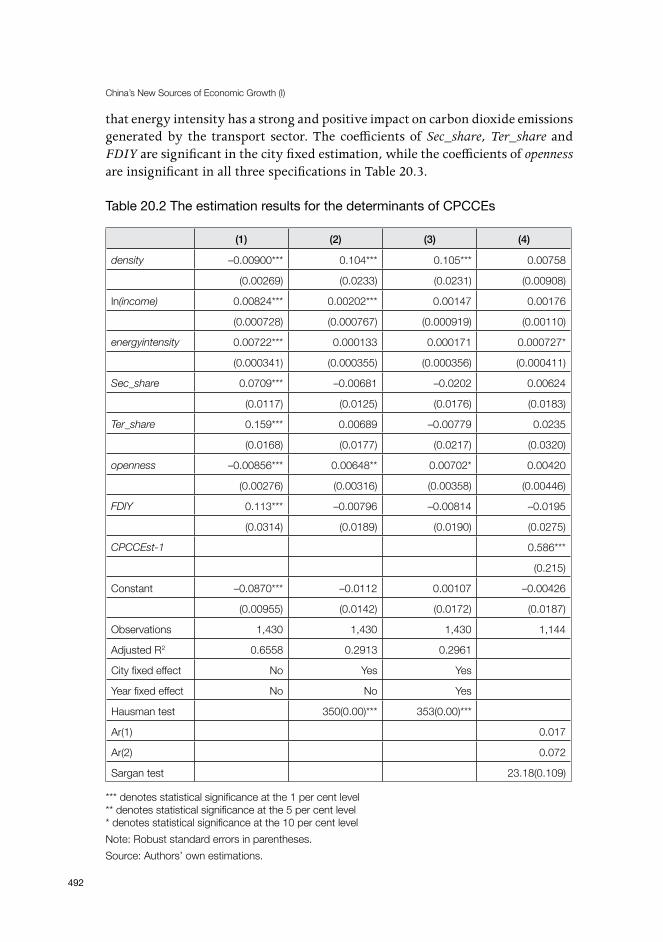
Urban density and CPCCEsThe regression results for intra-city commuting are reported in Table 20.2. It is found that urban density has a negative and statistically significant coefficient (column 1). This finding suggests that carbon dioxide emissions from intra-city commuting are lower in more densely populated cities. However, this result may be biased due to the lack of controls for various city characteristics. As shown in columns 2 and 3 of Table 20.2, the results reverse completely after controlling for city fixed effects. The estimation results in column 2 are overall reasonably consistent with those in column 3. The coefficient of urban density is positive and significant at the 1 per cent level, implying that higher urban density is associated with greater per capita carbon dioxide emissions from public commuting. Despite the differences in intra-city commuting modes, this result contrasts with the findings of previous studies (Brownstone and Golob 2009; Glaeser and Kahn 2010; Cirilli and Veneri 2014) based on household vehicle use

20. Urban Density and Carbon Emissions in China
491
data from developed countries. One possible reason is that urban residents in China are more dependent on public mass transport in bigger and denser cities, while in smaller and more dispersed cities, people depend more on bicycles and motorbikes. Our fixed effect estimation results for CPCCEs are consistent with the theoretical argument that an increase in population density may generate higher per capita carbon dioxide emissions from public commuting (Gaigné et al. 2012). However, in the GMM specification (column 4), the coefficient of urban density is not statistically significant, despite still being positive.
The coefficient of ln(income) is positive in all specifications but significant at the 1 per cent level only in column 2 in Table 20.2, indicating the existence of a positive relationship between CPCCEs and income levels. The coefficient of openness is positive and significant in the fixed effect specifications. However, the coefficients of other control variables (energyintensity, Sec_Share, Ter_Share and FDIY) are insignificant.
Urban density and TPCCEsThe estimation results for TPCCEs are reported in Table 20.3. The coefficient of urban density is negative and significant in all four specifications for TPCCEs, which implies that higher urban population density is strongly correlated with lower carbon dioxide emissions across the entire transport network. In other words, in terms of the transport sector, denser cities are more environmentally friendly than dispersed ones. This result is quite different from that in the CPCCE estimations; given that TPCCEs include intra-city and intercity passenger and cargo transportation, this is, however, not so surprising. However, contrary estimation results between CPCCE and TPCCE equations highlight the complexity of calculating carbon dioxide emissions generated by transportation. Although some theoretical studies (for example, Borck and Pflüger 2013) have tried to include intercity goods transportation in their analysis framework, many questions remain about the relationship between urban density and carbon dioxide emissions generated by transport. Moreover, in China, empirical evidence shows that local protectionism hinders market integration (Bai et al. 2004; Poncet 2005; Lu and Tao 2009). As a result, most Chinese cities tend to be more autarkic than cities in developed countries. The fragmentation of Chinese regional markets may reduce intercity transportation, particularly in larger cities. This could partially explain why more densely populated cities generate less carbon dioxide emissions from transport in China.
In contrast with the results for the CPCCEs, in the TPCCE estimations, many control variables become significant. The positive and significant coefficient of ln(income) implies that the improvement in income levels is one of the major reasons for the rapid increase in carbon dioxide emissions. The coefficient of energy intensity is positive and significant at the 1 per cent level in all four specifications, indicating
China’s New Sources of Economic Growth (I)
492
that energy intensity has a strong and positive impact on carbon dioxide emissions generated by the transport sector. The coefficients of Sec_share, Ter_share and FDIY are significant in the city fixed estimation, while the coefficients of openness are insignificant in all three specifications in Table 20.3.
Table 20.2 The estimation results for the determinants of CPCCEs
(1) (2) (3) (4)
density –0.00900*** 0.104*** 0.105*** 0.00758
(0.00269) (0.0233) (0.0231) (0.00908)
ln(income) 0.00824*** 0.00202*** 0.00147 0.00176
(0.000728) (0.000767) (0.000919) (0.00110)
energyintensity 0.00722*** 0.000133 0.000171 0.000727*
(0.000341) (0.000355) (0.000356) (0.000411)
Sec_share 0.0709*** –0.00681 –0.0202 0.00624
(0.0117) (0.0125) (0.0176) (0.0183)
Ter_share 0.159*** 0.00689 –0.00779 0.0235
(0.0168) (0.0177) (0.0217) (0.0320)
openness –0.00856*** 0.00648** 0.00702* 0.00420
(0.00276) (0.00316) (0.00358) (0.00446)
FDIY 0.113*** –0.00796 –0.00814 –0.0195
(0.0314) (0.0189) (0.0190) (0.0275)
CPCCEst-1 0.586***
(0.215)
Constant –0.0870*** –0.0112 0.00107 –0.00426
(0.00955) (0.0142) (0.0172) (0.0187)
Observations 1,430 1,430 1,430 1,144
Adjusted R2 0.6558 0.2913 0.2961
City fixed effect No Yes Yes
Year fixed effect No No Yes
Hausman test 350(0.00)*** 353(0.00)***
Ar(1) 0.017
Ar(2) 0.072
Sargan test 23.18(0.109)
*** denotes statistical significance at the 1 per cent level** denotes statistical significance at the 5 per cent level* denotes statistical significance at the 10 per cent levelNote: Robust standard errors in parentheses.Source: Authors’ own estimations.

20. Urban Density and Carbon Emissions in China
493
Table 20.3 The estimation results for the determinants of TPCCEs
(1) (2) (3) (4)
density –0.144*** –0.534*** –0.494*** –0.176***
(0.0311) (0.137) (0.134) (0.0553)
ln(income) 0.0420*** 0.0897*** 0.0450*** 0.0331***
(0.00920) (0.0118) (0.0153) (0.0125)
energyintensity 0.0378*** 0.0603*** 0.0617*** 0.0357**
(0.00615) (0.0173) (0.0170) (0.0142)
Sec_share 1.065*** 1.054*** 0.143 0.107
(0.0916) (0.214) (0.227) (0.223)
Ter_share 1.377*** 0.535* –0.254 0.119
(0.153) (0.303) (0.312) (0.287)
openness –0.0171 0.0756 0.0575 0.0314
(0.0368) (0.0684) (0.0736) (0.0695)
FDIY 1.761*** 0.952** 0.886** 0.324
(0.401) (0.409) (0.398) (0.505)
CPCCEst-1 0.984***
(0.0799)
Constant –0.774*** –0.474** 0.313 –0.171
(0.0751) (0.202) (0.229) (0.195)
Observations 1,430 1,430 1,430 1,144
Adjusted R2 0.3784 0.2589 0.3050
City fixed effect No Yes Yes
Year fixed effect No No Yes
Hausman test 53.71(0.00) 41.49(0.00)
Sargan test 26.282(0.0695)
Ar(1) P = 0.000
Ar(2) P = 0.6115
*** denotes statistical significance at the 1 per cent level** denotes statistical significance at the 5 per cent level* denotes statistical significance at the 10 per cent levelNote: Robust standard errors in parentheses. Source: Authors’ own estimations.

China’s New Sources of Economic Growth (I)
494
Urban density and UPCCEs The regression results of UPCCEs are reported in Table 20.4. Similar to the results for the TPCCE estimations, here the coefficients attached to urban density are negative and significant in all four specifications. The magnitude of the coefficients is, however, relatively larger here than in the TPCCE estimations. This could imply that the impact of urban density on carbon dioxide emissions is not restricted to the transport sector and could also come through other channels such as residential heating and airconditioning, the sharing of public facilities and so on. Together with the results observed in the preceding sections, our findings suggest that more densely populated cities in China might be less ‘green’ than dispersed ones with regard to intra-city commuting, but are more environmentally friendly in terms of their transport sectors and the entire urban system. These findings do not support arguments about the relationship between carbon dioxide emissions and urban density that have been proposed in some recent theoretical studies (for example, Gaigné et al. 2012; Borck and Pflüger 2013; Larson and Yezer 2014).
As expected, however, income level and energy intensity are still the key determinants of UPCCEs. Given that China’s income levels will continue to increase, reduction in energy intensity would be one of the key channels by which to reduce GHG emissions.
In contrast with the results for CPCCEs and TPCCEs, here the coefficients for Sec_share are positive and significant in all specifications, implying that expansion of secondary industries may create more carbon dioxide emissions in cities. Similarly, the coefficient of FDIY is positive and significant in most specifications (columns 1–3). Considering that most FDI in China is in the manufacturing industry, this may suggest that an increase in FDI volume will lead to higher carbon dioxide emissions in cities. However, the coefficients of Ter_share and openness are insignificant in most specifications, indicating that the impacts of tertiary industries and trade openness on carbon dioxide emissions are less significant.

20. Urban Density and Carbon Emissions in China
495
Table 20.4 The estimation results for the determinants of UPCCEs
(1) (2) (3) (4)
density –1.538*** –2.249*** –2.144*** –1.562***
(0.230) (0.753) (0.813) (0.350)
ln(income) 0.650*** 0.613*** 0.542*** 0.463***
(0.0637) (0.0955) (0.134) (0.0790)
energyintensity 0.855*** 0.529*** 0.528*** 0.678***
(0.0804) (0.105) (0.106) (0.142)
Sec_share 7.653*** 3.245*** 2.246** 3.418*
(0.829) (1.234) (1.110) (1.996)
Ter_share –0.527 1.659 1.283 1.716
(1.304) (1.863) (1.475) (2.298)
openness 0.435** –0.195 –0.320 0.00835
(0.221) (0.291) (0.313) (0.196)
FDIY 2.106 3.803** 3.596** 1.970
(1.898) (1.766) (1.783) (1.649)
CPCCEst-1 0.369***
(0.105)
Constant –4.363*** –1.447 –0.715 –2.949*
(0.616) (1.285) (1.174) (1.703)
Observations 1,430 1,430 1,430
Adjusted R2 0.6623 0.6062 0.5796
City fixed effect No Yes Yes
Year fixed effect No No Yes
Hausman test 59.72(0.000) 64.96(0.000)
Sargan P = 0.0000
Ar(1) P = 0.2899
Ar(2) P = 0.4657
*** denotes statistical significance at the 1 per cent level** denotes statistical significance at the 5 per cent level* denotes statistical significance at the 10 per cent levelNote: Robust standard errors in parentheses. Source: Authors’ own estimations.

China’s New Sources of Economic Growth (I)
496
ConclusionIn this chapter, we investigated the impacts of urban density on carbon dioxide emissions from intra-city public commuting, the aggregate transport sector and the aggregate urban system using a panel dataset applying to 286 Chinese cities in the period 2007–11.
The results suggest that urban population density has a negative and significant impact on carbon dioxide emissions arising from the transport sector and the aggregate urban system, but has a positive impact on carbon dioxide emissions generated by intra-city public commuting. Our results do not support arguments in some recent theoretical studies that compact cities are less environmentally friendly than dispersed ones (Gaigné et al. 2012; Borck and Pflüger 2013; Larson and Yezer 2014). Our results also highlight some significant differences in commuting patterns between China and developed countries. In particular, Chinese cities depend more on public commuting modes, whereas cities in developed countries rely more on private vehicles.
As for China, due to strict land regulations, more and more apartment towers are being constructed to accommodate the influx of rural migrants into cities that has come with the policy of rapid urbanisation. As a result of such trends, Chinese cities are much more compact than cities in most developed countries. In recent decades, increased urban density has, however, been driven mainly by land-saving policies rather than environmental concerns. But our findings suggest these compact city arrangements are positive from a carbon dioxide emissions perspective.
Broader environmental policy should, however, be based on a comprehensive assessment of various pollutants (such as sulphur dioxide, particulate matter and nitrogen dioxide) that are generated by urban systems. And to this end, studies published to date should be taken as the first step towards building a theory of ecologically and socially desirable urban systems (Gaigné et al. 2012). Our results contribute to this body of knowledge and encourage scholars, city planners and policymakers to pay greater attention to the various consequences of urban population density. The urbanisation mode we select today will have significant environmental consequences in the future, and thus should be considered as carefully as possible.
Our research findings do have some limitations. First, we acknowledge that our data are drawn from different sources, which means we were not able to distinguish directly between intra-city and intercity transport. In addition, our intra-city public commuting data excluded household vehicle usage. Given recent rapid increases in private vehicle usage in China, commuting styles could change significantly in the future and potentially displace our findings based

20. Urban Density and Carbon Emissions in China
497
on panel data that do not account for these methods of transport. On the other hand, although our city-level data are imperfect, they are the best data available at present. Second, our research is limited to the extent that the impacts of urban density on carbon dioxide emissions prove to be a nexus for multiple mechanisms. Future research is expected to shed light on more mechanisms and how they work.
References Au, C. C. and Henderson, J. V. (2006), Are Chinese cities too small?, The Review
of Economic Studies, 73(3): 549–576.
Auffhammer, M. and Carson, R. T. (2008), Forecasting the path of China’s CO2 emissions using province level information, Journal of Environmental Economics and Management, 55(3): 229–247.
Bai, C.-E., Du, Y., Tao, Z. and Tong, S. (2004), Local protectionism and regional specialization: Evidence from China’s industries, Journal of International Economics, 63(2): 397–417.
Borck, R. and Pflüger, M. (2013), Green cities? Urbanization, trade and the environment, Annual conference 2013 (Duesseldorf): Competition policy and regulation in a global economic order, No. 79763, Heidelberg: German Economic Association.
Brownstone, D. and Golob, T. F. (2009), The impact of residential density on vehicle usage and energy consumption, Journal of Urban Economics, 65(1): 91–98.
Chen, H., Jia, B. and Lau, S. S. Y. (2008), Sustainable urban form for Chinese compact cities: Challenges of a rapidly urbanized economy, Habitat International, 32(1): 28–40.
Cirilli, A. and Veneri, P. (2014), Spatial structure and carbon dioxide (CO2) emissions due to commuting: An analysis of Italian urban areas, Regional Studies, 48(12): 1993–2005.
Dhakal, S. (2009), Urban energy use and carbon emissions from cities in China and policy implications, Energy Policy, 37(11): 4208–4219.
Du, L., Wei, C. and Cai, S. (2012), Economic development and carbon dioxide emissions in China: Provincial panel data analysis, China Economic Review, 23(2): 371–384.
Gaigné, C., Riou, S. and Thisse, J. F. (2012), Are compact cities environmentally friendly?, Journal of Urban Economics, 72(2): 123–136.

China’s New Sources of Economic Growth (I)
498
Glaeser, E. L. and Kahn, M. E. (2010), The greenness of cities: Carbon dioxide emissions and urban development, Journal of Urban Economics, 67(3): 404–418.
Halicioglu, F. (2009), An econometric study of CO2 emissions, energy consumption, income and foreign trade in Turkey, Energy Policy, 37(3): 1156–1164.
Hilber, C. A. and Palmer, C. (2014), Urban development and air pollution: Evidence from a global panel of cities, Grantham Research Institute on Climate Change and the Environment Working Paper, London: London School of Economics and Political Science.
Holden, E. and Norland, I. T. (2005), Three challenges for the compact city as a sustainable urban form: Household consumption of energy and transport in eight residential areas in the greater Oslo region, Urban Studies, 42(12): 2145–2166.
Intergovernmental Panel on Climate Change (IPCC) (2006), 2006 IPCC guidelines for national greenhouse gas inventories, Geneva: Intergovernmental Panel on Climate Change. Available from: ipcc-nggip.iges.or.jp/public/2006gl/.
Jenks, M. and Burgess, R. (eds) (2000), Compact cities: Sustainable urban forms for developing countries, Abingdon, UK: Taylor & Francis.
Kellenberg, D. K. (2009), An empirical investigation of the pollution haven effect with strategic environment and trade policy, Journal of International Economics, 78(2): 242–255.
Larson, W., Liu, F. and Yezer, A. (2012), Energy footprint of the city: Effects of urban land use and transportation policies, Journal of Urban Economics, 72(2): 147–159.
Larson, W. D. and Yezer, A. M. (2014), The energy implications of city size and density, Journal of Urban Economics, 90(November): 35–49.
Lee, S. and Lee, B. (2014), The influence of urban form on GHG emissions in the US household sector, Energy Policy, 68: 534–549.
Li, H., Lu, Y., Zhang, J. and Wang, T. (2013), Trends in road freight transportation carbon dioxide emissions and policies in China, Energy Policy, 57: 99–106.
Lin, B. and Sun, C. (2010), Evaluating carbon dioxide emissions in international trade of China, Energy Policy, 38(1): 613–621.
Liu, Y., Song, Y. and Song, X. (2014), An empirical study on the relationship between urban compactness and CO2 efficiency in China, Habitat International, 41: 92–98.

20. Urban Density and Carbon Emissions in China
499
Lu, J. and Tao, Z. (2009), Trends and determinants of China’s industrial agglomeration, Journal of Urban Economics, 65(2): 167–180.
Muñiz, I. and Galindo, A. (2005), Urban form and the ecological footprint of commuting: The case of Barcelona, Ecological Economics, 55(4): 499–514.
National Bureau of Statistics (NBS) (2008–12a), China city statistical yearbook, Beijing: China Statistics Press.
National Bureau of Statistics (NBS) (2008–12b), China energy statistical yearbook, Beijing: China Statistics Press.
National Bureau of Statistics (NBS) (2008–12c), China statistical yearbook, Beijing: China Statistics Press.
National Bureau of Statistics (NBS) (2008–12d), China statistical yearbook for regional economy, Beijing: China Statistics Press.
National Bureau of Statistics (NBS) (2008–12e), China urban construction statistical yearbook, Beijing: China Statistics Press.
Organisation for Economic Co-operation and Development (OECD) (2008), Highlights of the international transport forum 2008: Transport and energy, Paris: OECD.
Poncet, S. (2005), A fragmented China: Measure and determinants of Chinese domestic market disintegration, Review of International Economics, 13(3): 409–430.
Qin, B. and Wu, J. (2015), Does urban concentration mitigate CO2 emissions? Evidence from China 1998–2008, China Economic Review, 35: 220–231.
Ren, S., Yuan, B., Ma, X. and Chen, X. (2014), International trade, FDI (foreign direct investment) and embodied CO2 emissions: A case study of China’s industrial sectors, China Economic Review, 28: 123–134.
Sarzynski, A. (2012), Bigger is not always better: A comparative analysis of cities and their air pollution impact, Urban Studies, 49(14): 3121–3138.
Stern, D. I. (2014), The environmental Kuznets curve: A primer, Canberra: Centre for Climate Economics & Policy, Crawford School of Public Policy, The Australian National University.
Zheng, S., Wang, R., Glaeser, E. L. and Kahn, M. E. (2011), The greenness of China: Household carbon dioxide emissions and urban development, Journal of Economic Geography, 11(5): 761–792.

This text is taken from China’s New Sources of Economic Growth: Reform, resources and climate change, Volume 1, edited by Ligang Song, Ross Garnaut, Cai Fang & Lauren Johnston, published 2016 by ANU Press, The Australian
National University, Canberra, Australia.