2001-2002 final hatchery escapement report -...
TRANSCRIPT

2001-2002 FINALHatchery Escapement Report
March 17, 2003
Washington Department of Fish and WildlifeFish Program/Hatcheries Division
By Stan Hammer/Hatchery Data Unit600 Capital Way NorthOlympia, WA 98501-1091E-mail: [email protected](360) 902-2665
Table of Contents
Section Page
Narrative 1
Hatchery Anadromous Fish Escapement Summary 3
Hatchery Resident Fish Escapement Summary 6
Anadromous Fish Escapement by Species 7
Resident Fish Escapement by Species 34
1
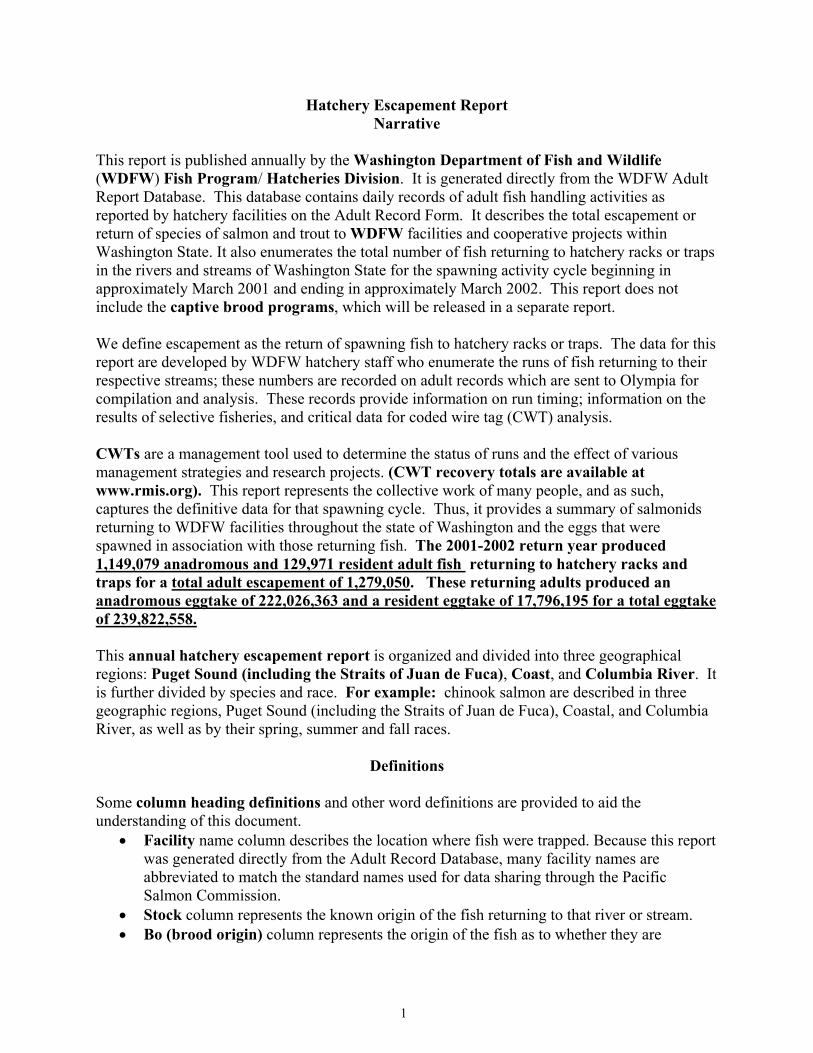
Hatchery Escapement Report Narrative
This report is published annually by the Washington Department of Fish and Wildlife (WDFW) Fish Program/ Hatcheries Division. It is generated directly from the WDFW Adult Report Database. This database contains daily records of adult fish handling activities as reported by hatchery facilities on the Adult Record Form. It describes the total escapement or return of species of salmon and trout to WDFW facilities and cooperative projects within Washington State. It also enumerates the total number of fish returning to hatchery racks or traps in the rivers and streams of Washington State for the spawning activity cycle beginning in approximately March 2001 and ending in approximately March 2002. This report does not include the captive brood programs, which will be released in a separate report. We define escapement as the return of spawning fish to hatchery racks or traps. The data for this report are developed by WDFW hatchery staff who enumerate the runs of fish returning to their respective streams; these numbers are recorded on adult records which are sent to Olympia for compilation and analysis. These records provide information on run timing; information on the results of selective fisheries, and critical data for coded wire tag (CWT) analysis. CWTs are a management tool used to determine the status of runs and the effect of various management strategies and research projects. (CWT recovery totals are available at www.rmis.org). This report represents the collective work of many people, and as such, captures the definitive data for that spawning cycle. Thus, it provides a summary of salmonids returning to WDFW facilities throughout the state of Washington and the eggs that were spawned in association with those returning fish. The 2001-2002 return year produced 1,149,079 anadromous and 129,971 resident adult fish returning to hatchery racks and traps for a total adult escapement of 1,279,050. These returning adults produced an anadromous eggtake of 222,026,363 and a resident eggtake of 17,796,195 for a total eggtake of 239,822,558. This annual hatchery escapement report is organized and divided into three geographical regions: Puget Sound (including the Straits of Juan de Fuca), Coast, and Columbia River. It is further divided by species and race. For example: chinook salmon are described in three geographic regions, Puget Sound (including the Straits of Juan de Fuca), Coastal, and Columbia River, as well as by their spring, summer and fall races.
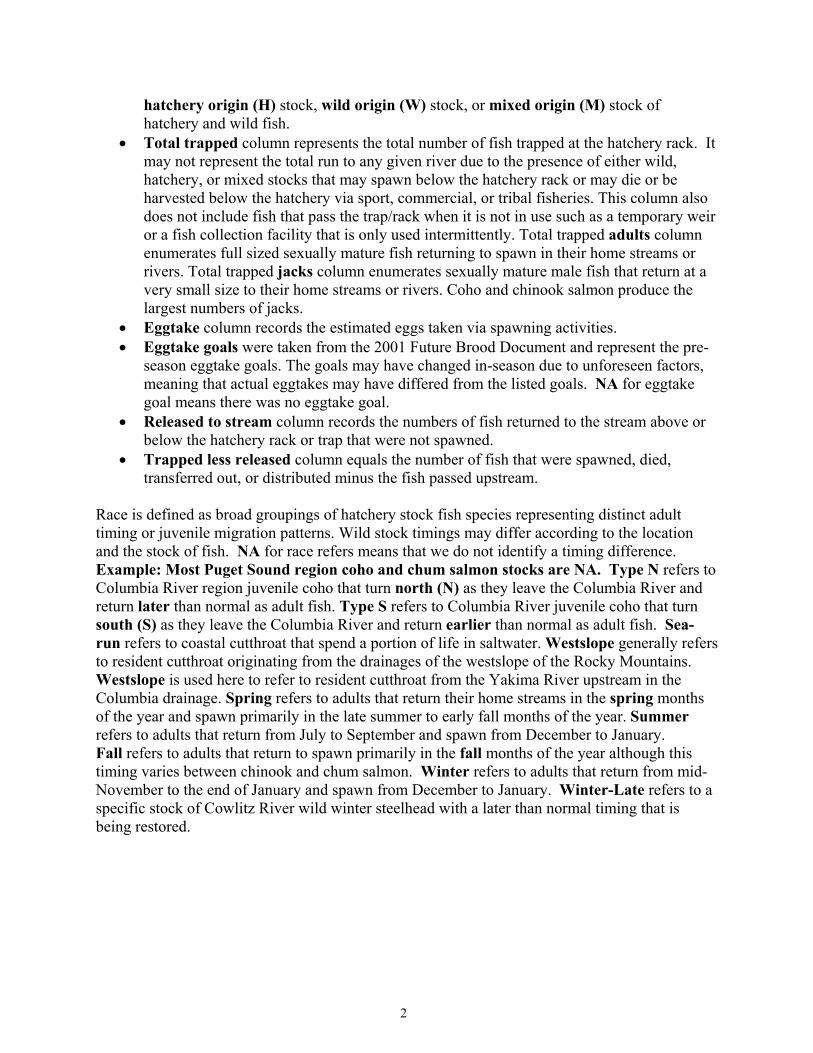
Definitions Some column heading definitions and other word definitions are provided to aid the understanding of this document.
• Facility name column describes the location where fish were trapped. Because this report was generated directly from the Adult Record Database, many facility names are abbreviated to match the standard names used for data sharing through the Pacific Salmon Commission.
• Stock column represents the known origin of the fish returning to that river or stream. • Bo (brood origin) column represents the origin of the fish as to whether they are
2
hatchery origin (H) stock, wild origin (W) stock, or mixed origin (M) stock of hatchery and wild fish.
• Total trapped column represents the total number of fish trapped at the hatchery rack. It may not represent the total run to any given river due to the presence of either wild, hatchery, or mixed stocks that may spawn below the hatchery rack or may die or be harvested below the hatchery via sport, commercial, or tribal fisheries. This column also does not include fish that pass the trap/rack when it is not in use such as a temporary weir or a fish collection facility that is only used intermittently. Total trapped adults column enumerates full sized sexually mature fish returning to spawn in their home streams or rivers. Total trapped jacks column enumerates sexually mature male fish that return at a very small size to their home streams or rivers. Coho and chinook salmon produce the largest numbers of jacks.
• Eggtake column records the estimated eggs taken via spawning activities. • Eggtake goals were taken from the 2001 Future Brood Document and represent the pre-
season eggtake goals. The goals may have changed in-season due to unforeseen factors, meaning that actual eggtakes may have differed from the listed goals. NA for eggtake goal means there was no eggtake goal.
• Released to stream column records the numbers of fish returned to the stream above or below the hatchery rack or trap that were not spawned.
• Trapped less released column equals the number of fish that were spawned, died, transferred out, or distributed minus the fish passed upstream.
Race is defined as broad groupings of hatchery stock fish species representing distinct adult timing or juvenile migration patterns. Wild stock timings may differ according to the location and the stock of fish. NA for race refers means that we do not identify a timing difference. Example: Most Puget Sound region coho and chum salmon stocks are NA. Type N refers to Columbia River region juvenile coho that turn north (N) as they leave the Columbia River and return later than normal as adult fish. Type S refers to Columbia River juvenile coho that turn south (S) as they leave the Columbia River and return earlier than normal as adult fish. Sea-run refers to coastal cutthroat that spend a portion of life in saltwater. Westslope generally refers to resident cutthroat originating from the drainages of the westslope of the Rocky Mountains. Westslope is used here to refer to resident cutthroat from the Yakima River upstream in the Columbia drainage. Spring refers to adults that return their home streams in the spring months of the year and spawn primarily in the late summer to early fall months of the year. Summer refers to adults that return from July to September and spawn from December to January. Fall refers to adults that return to spawn primarily in the fall months of the year although this timing varies between chinook and chum salmon. Winter refers to adults that return from mid-November to the end of January and spawn from December to January. Winter-Late refers to a specific stock of Cowlitz River wild winter steelhead with a later than normal timing that is being restored.
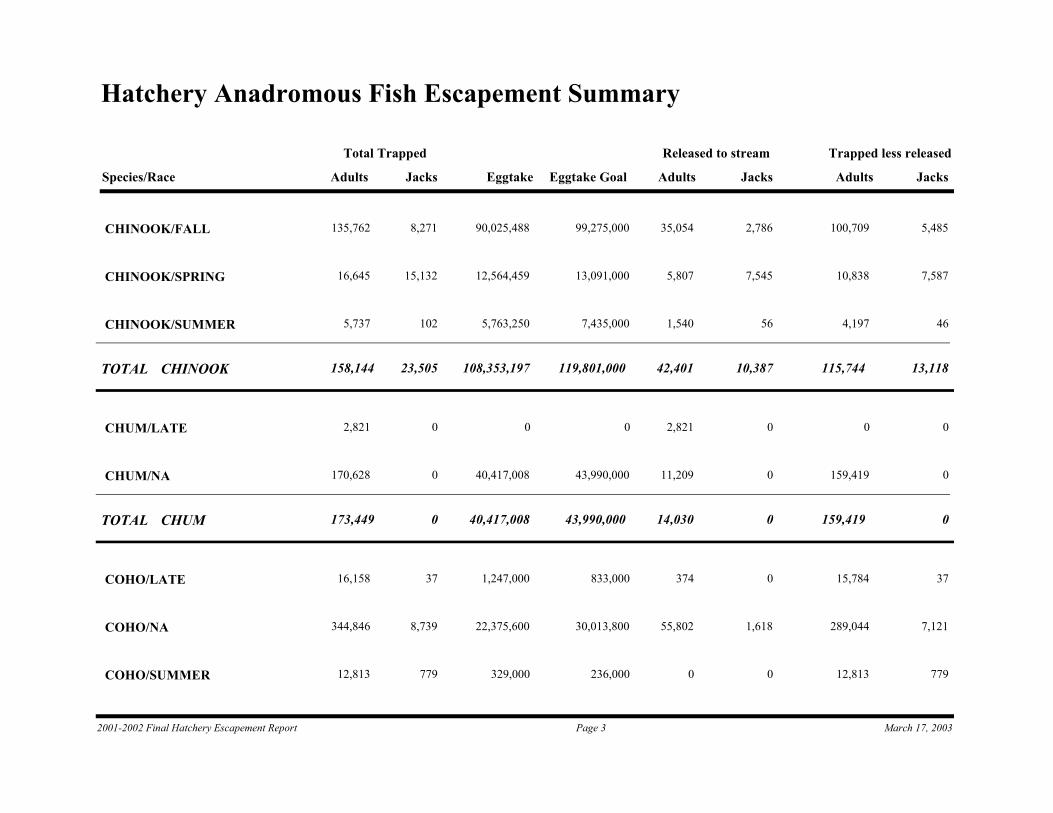
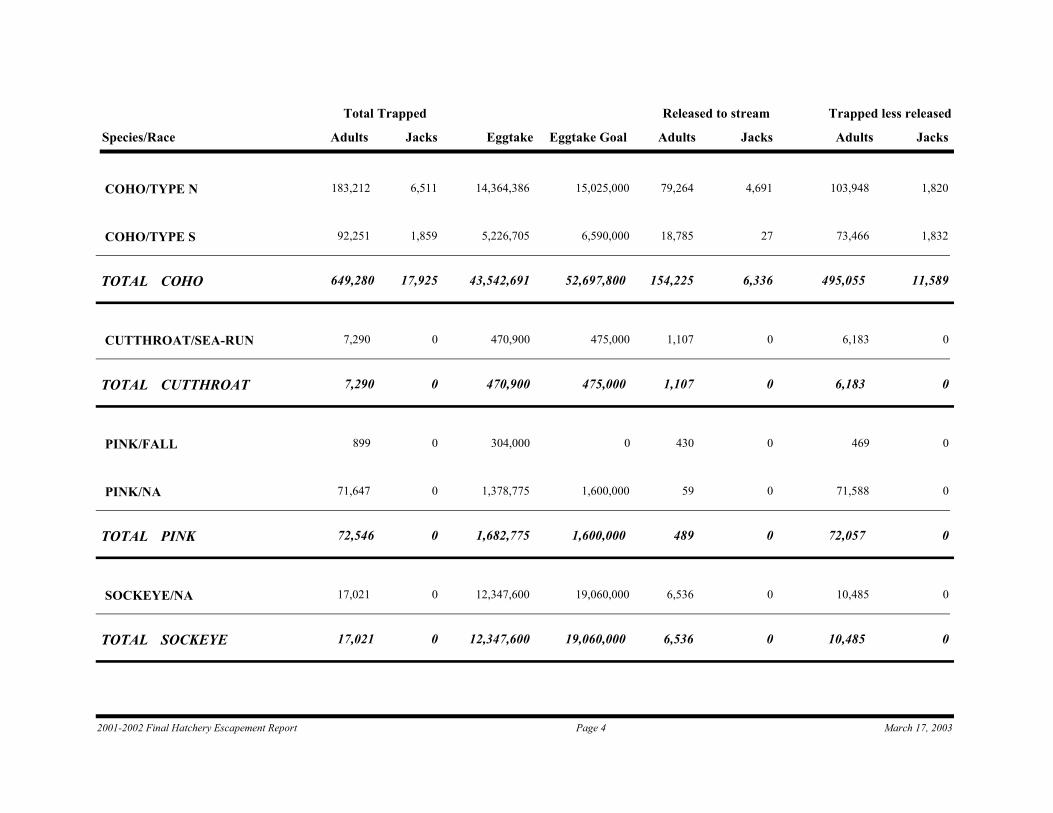
Hatchery Anadromous Fish Escapement Summary
Species/Race Adults Jacks Eggtake Adults Jacks Adults JacksEggtake Goal
Total Trapped Released to stream Trapped less released
135,762 8,271 90,025,488 35,054 2,786 100,709 5,48599,275,000CHINOOK/FALL
16,645 15,132 12,564,459 5,807 7,545 10,838 7,58713,091,000CHINOOK/SPRING
5,737 102 5,763,250 1,540 56 4,197 467,435,000CHINOOK/SUMMER
158,144CHINOOKTOTAL 23,505 108,353,197 119,801,000 42,401 10,387 115,744 13,118
2,821 0 0 2,821 0 0 00CHUM/LATE
170,628 0 40,417,008 11,209 0 159,419 043,990,000CHUM/NA
173,449CHUMTOTAL 0 40,417,008 43,990,000 14,030 0 159,419 0
16,158 37 1,247,000 374 0 15,784 37833,000COHO/LATE
344,846 8,739 22,375,600 55,802 1,618 289,044 7,12130,013,800COHO/NA
12,813 779 329,000 0 0 12,813 779236,000COHO/SUMMER
2001-2002 Final Hatchery Escapement Report Page 3 March 17, 2003
Species/Race Adults Jacks Eggtake Adults Jacks Adults JacksEggtake Goal
Total Trapped Released to stream Trapped less released
183,212 6,511 14,364,386 79,264 4,691 103,948 1,82015,025,000COHO/TYPE N
92,251 1,859 5,226,705 18,785 27 73,466 1,8326,590,000COHO/TYPE S
649,280COHOTOTAL 17,925 43,542,691 52,697,800 154,225 6,336 495,055 11,589
7,290 0 470,900 1,107 0 6,183 0475,000CUTTHROAT/SEA-RUN
7,290CUTTHROATTOTAL 0 470,900 475,000 1,107 0 6,183 0
899 0 304,000 430 0 469 00PINK/FALL
71,647 0 1,378,775 59 0 71,588 01,600,000PINK/NA
72,546PINKTOTAL 0 1,682,775 1,600,000 489 0 72,057 0
17,021 0 12,347,600 6,536 0 10,485 019,060,000SOCKEYE/NA
17,021SOCKEYETOTAL 0 12,347,600 19,060,000 6,536 0 10,485 0
2001-2002 Final Hatchery Escapement Report Page 4 March 17, 2003
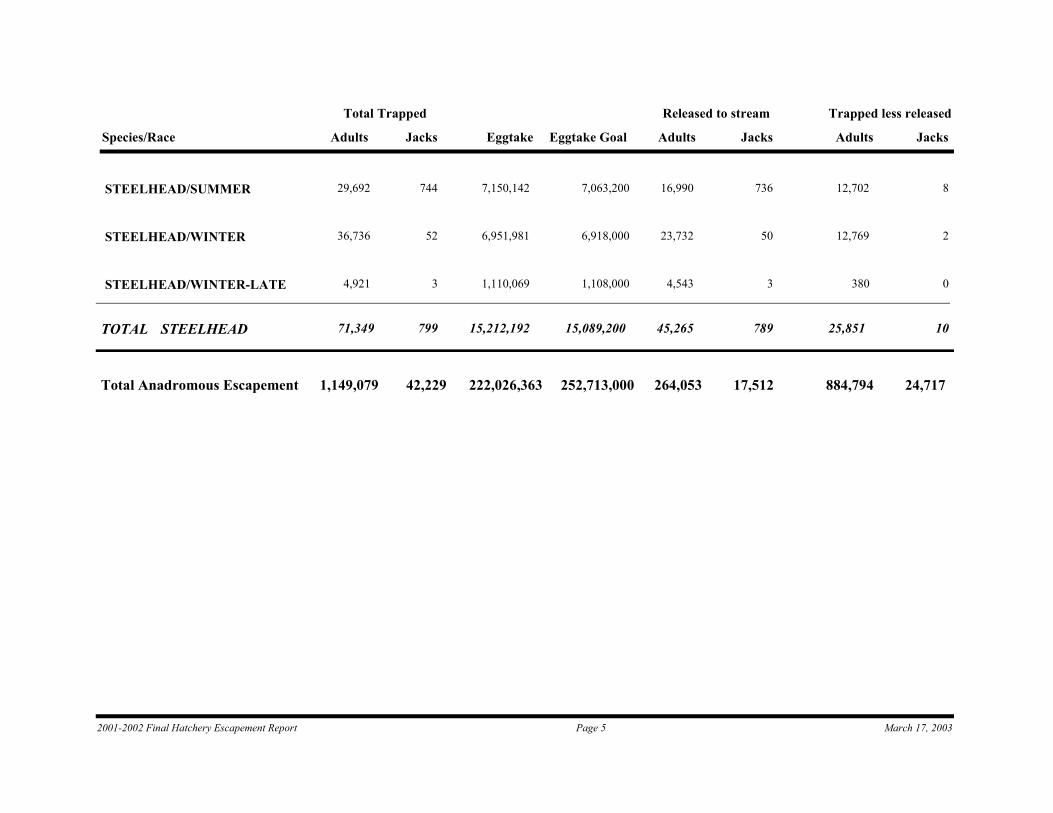
Species/Race Adults Jacks Eggtake Adults Jacks Adults JacksEggtake Goal
Total Trapped Released to stream Trapped less released
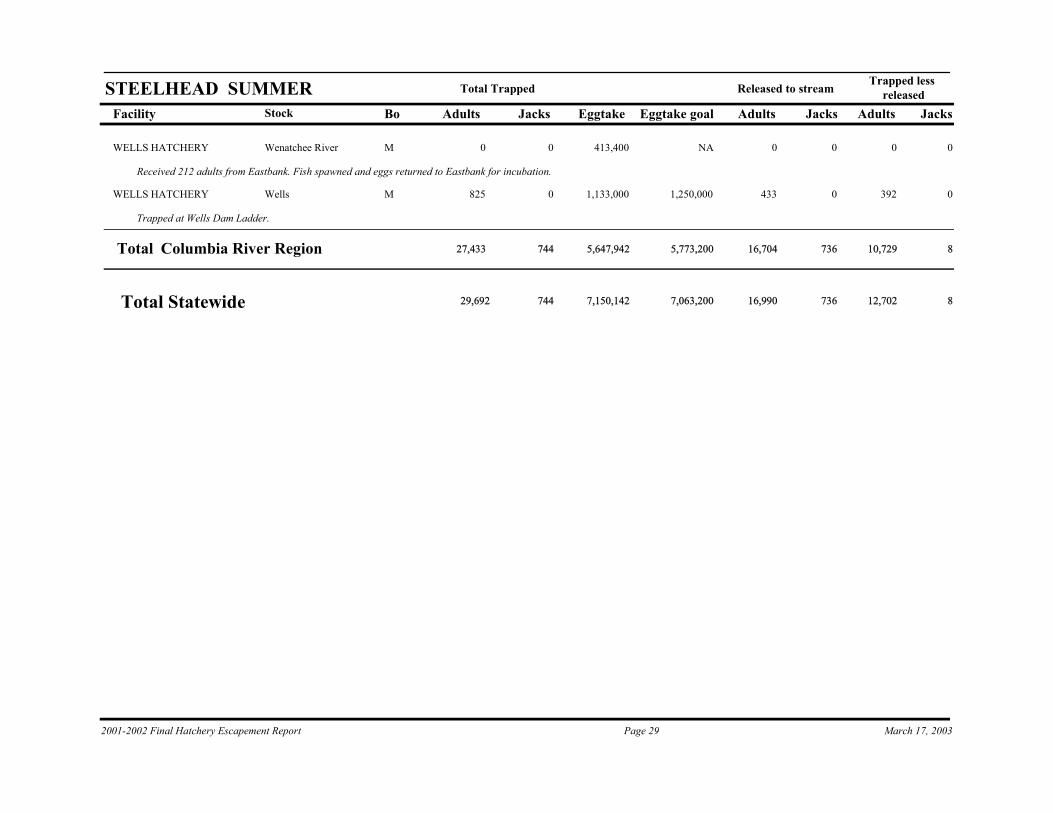
29,692 744 7,150,142 16,990 736 12,702 87,063,200STEELHEAD/SUMMER
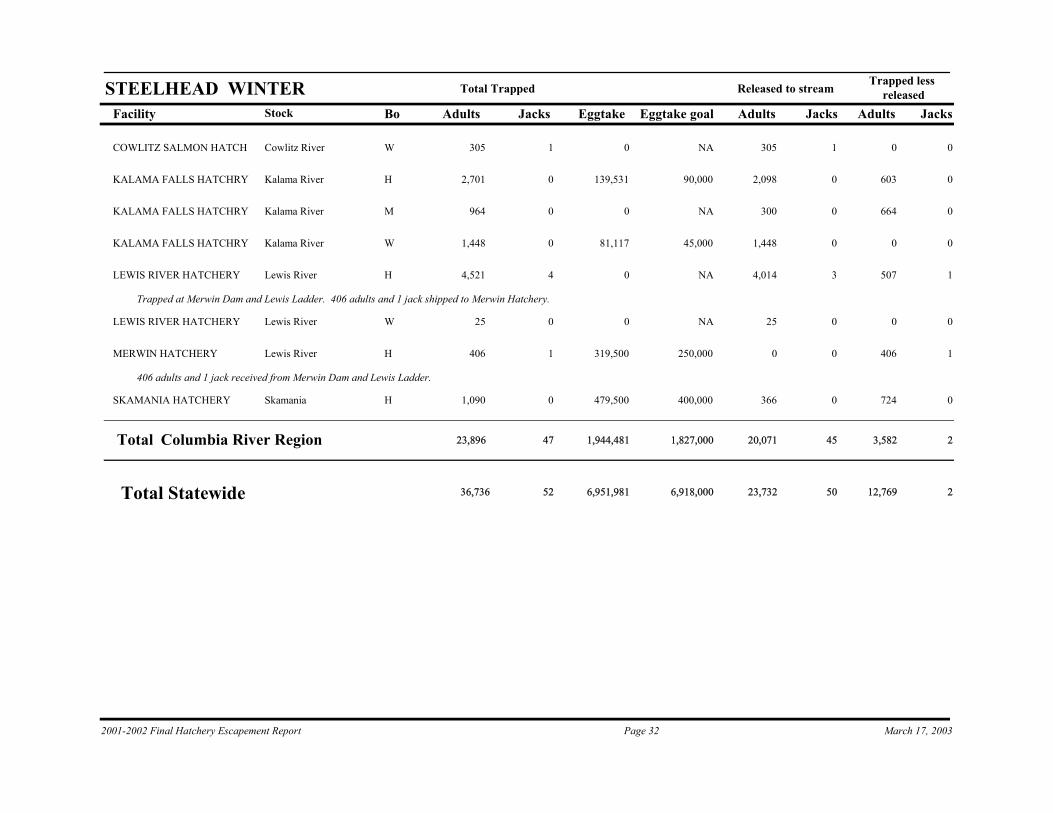
36,736 52 6,951,981 23,732 50 12,769 26,918,000STEELHEAD/WINTER
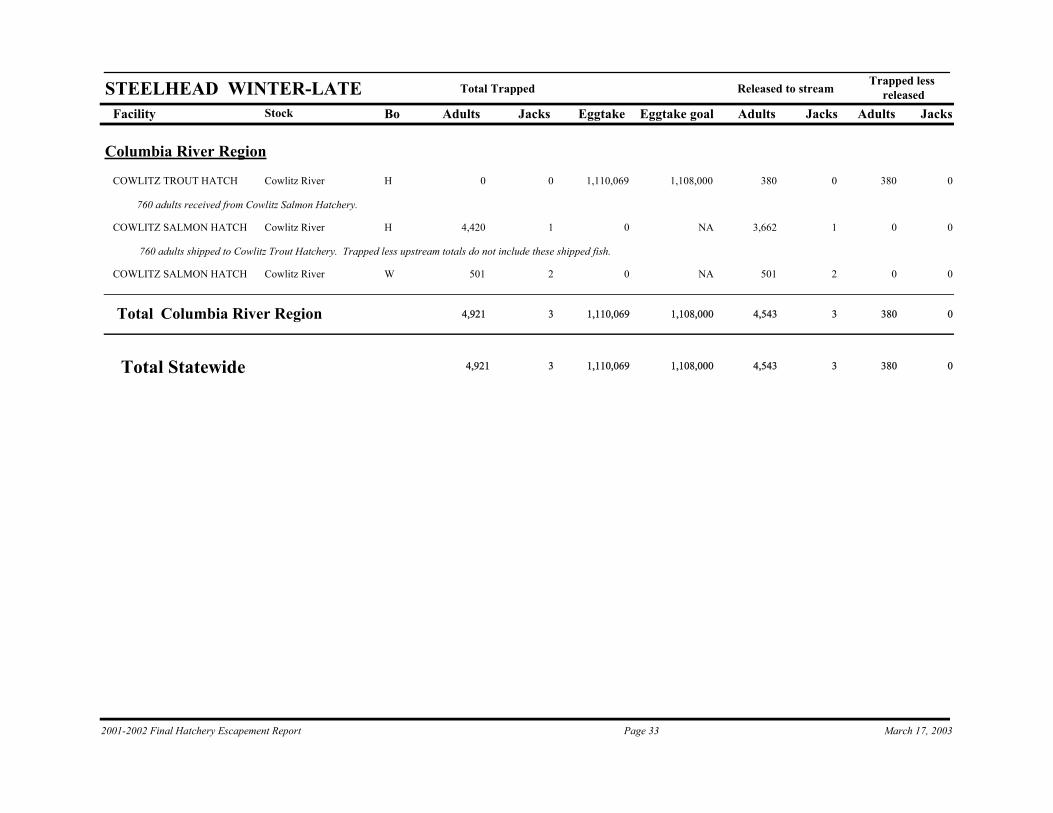
4,921 3 1,110,069 4,543 3 380 01,108,000STEELHEAD/WINTER-LATE
71,349STEELHEADTOTAL 799 15,212,192 15,089,200 45,265 789 25,851 10
1,149,079Total Anadromous Escapement 42,229 222,026,363 252,713,000 264,053 17,512 884,794 24,717
2001-2002 Final Hatchery Escapement Report Page 5 March 17, 2003
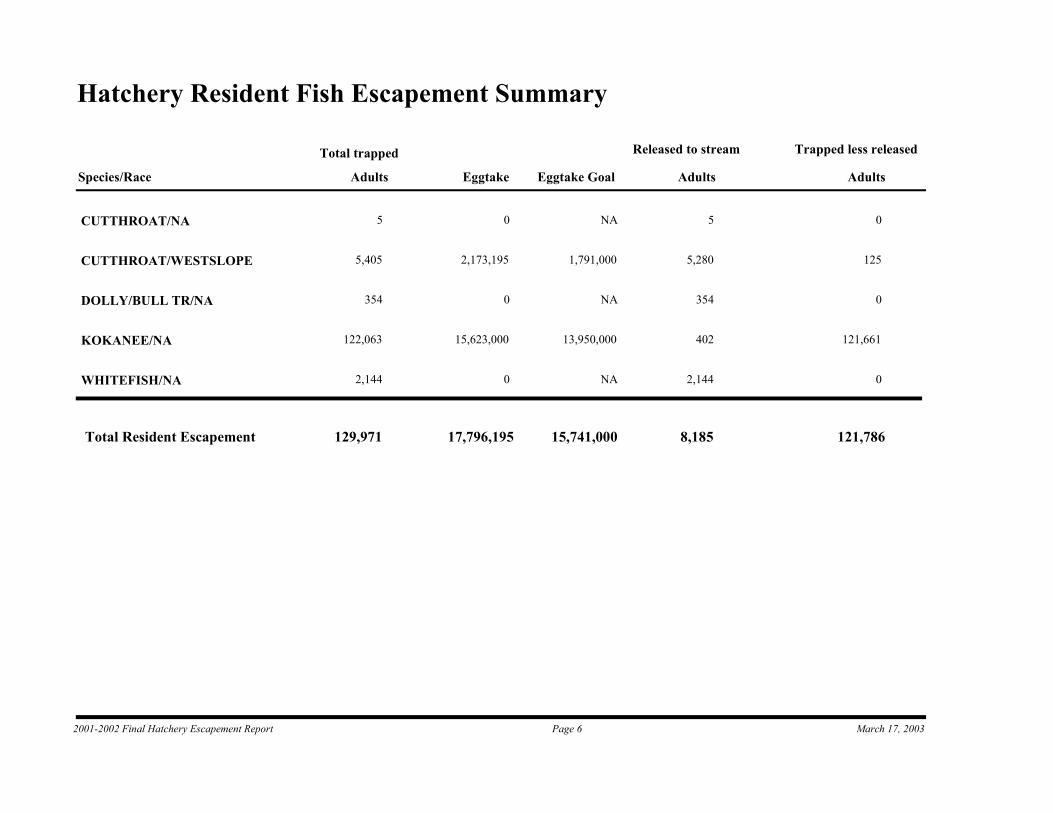
Hatchery Resident Fish Escapement Summary
Species/Race Adults Eggtake Adults AdultsEggtake Goal
Total trapped Released to stream Trapped less released
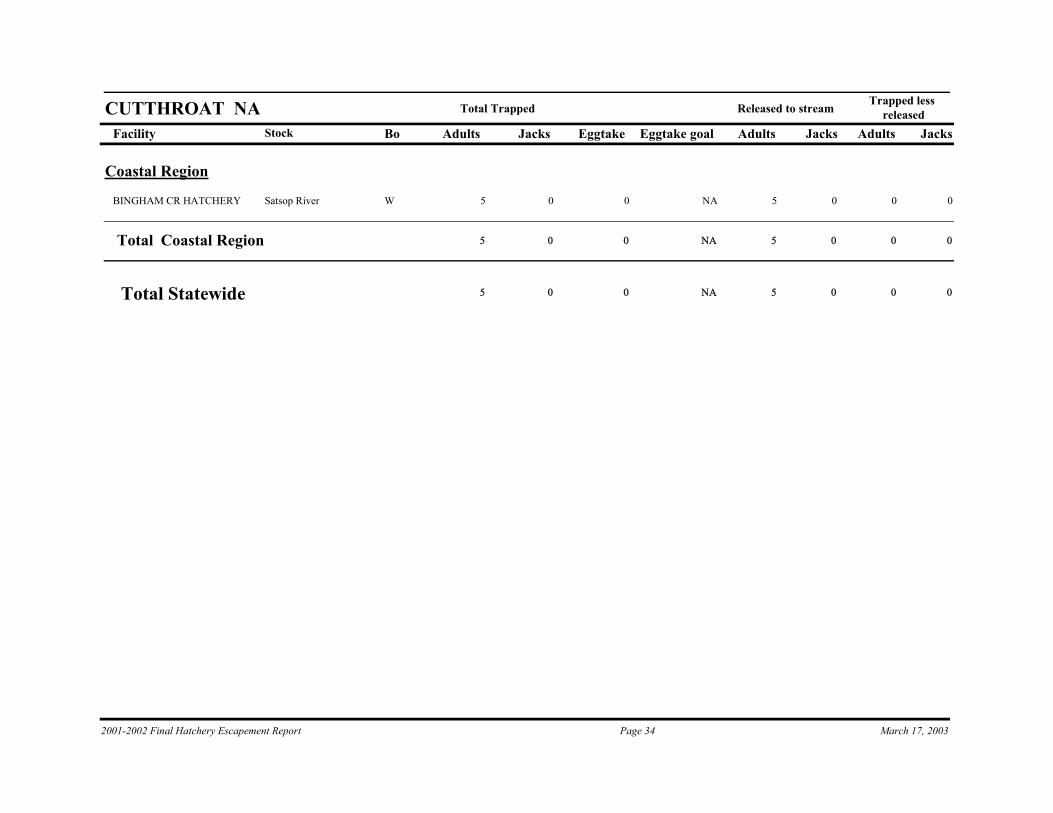
5 0 5 0NACUTTHROAT/NA
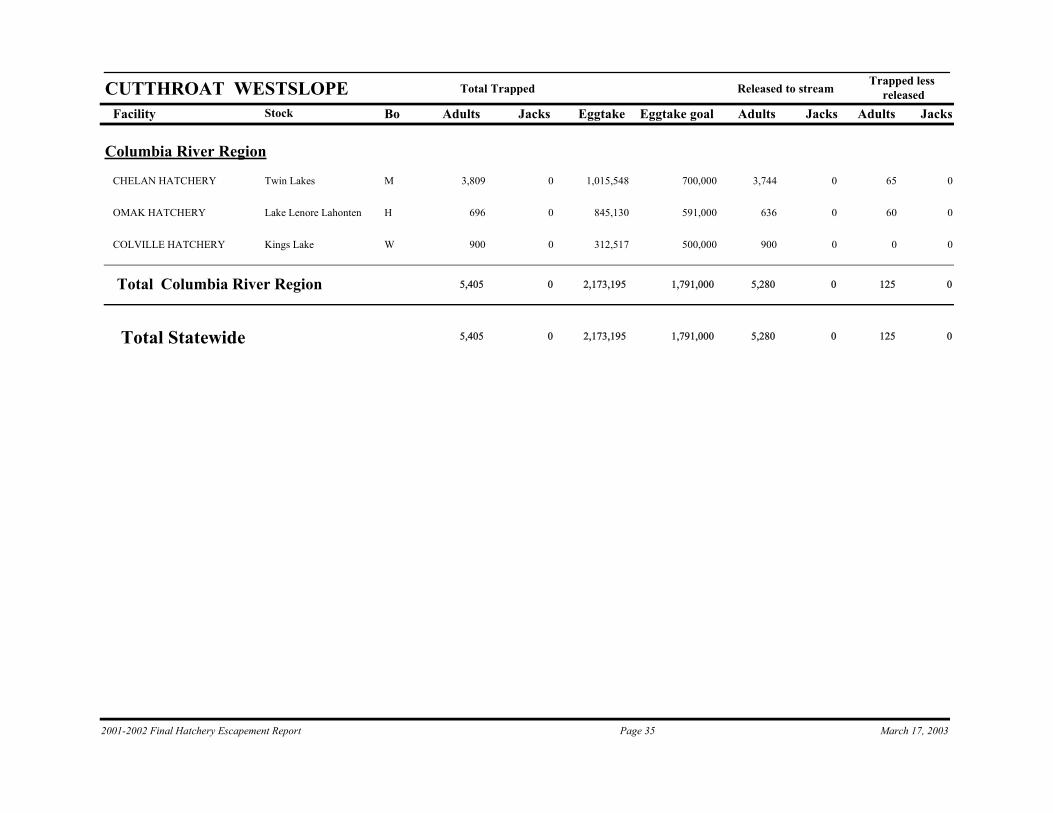
5,405 2,173,195 5,280 1251,791,000CUTTHROAT/WESTSLOPE
354 0 354 0NADOLLY/BULL TR/NA
122,063 15,623,000 402 121,66113,950,000KOKANEE/NA
2,144 0 2,144 0NAWHITEFISH/NA
129,971Total Resident Escapement 17,796,195 15,741,000 8,185 121,786
2001-2002 Final Hatchery Escapement Report Page 6 March 17, 2003
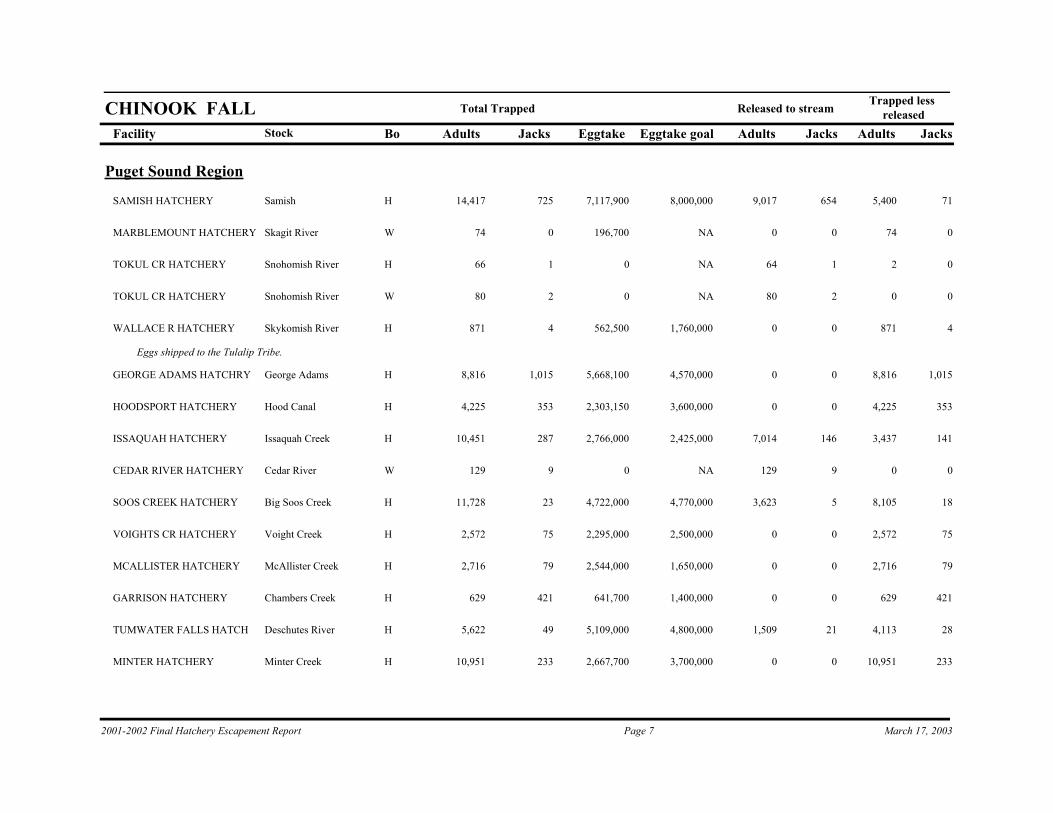
Facility Bo Adults Jacks Eggtake Adults Jacks Adults Jacks
Trapped less releasedReleased to streamTotal Trapped
Stock
CHINOOK FALLEggtake goal
Puget Sound Region
H 14,417 725 7,117,900 9,017 654 5,400 71SamishSAMISH HATCHERY 8,000,000
W 74 0 196,700 0 0 74 0Skagit RiverMARBLEMOUNT HATCHERY NA
H 66 1 0 64 1 2 0Snohomish RiverTOKUL CR HATCHERY NA
W 80 2 0 80 2 0 0Snohomish RiverTOKUL CR HATCHERY NA
H 871 4 562,500 0 0 871 4Skykomish RiverWALLACE R HATCHERY
Eggs shipped to the Tulalip Tribe.
1,760,000
H 8,816 1,015 5,668,100 0 0 8,816 1,015George AdamsGEORGE ADAMS HATCHRY 4,570,000
H 4,225 353 2,303,150 0 0 4,225 353Hood CanalHOODSPORT HATCHERY 3,600,000
H 10,451 287 2,766,000 7,014 146 3,437 141Issaquah CreekISSAQUAH HATCHERY 2,425,000
W 129 9 0 129 9 0 0Cedar RiverCEDAR RIVER HATCHERY NA
H 11,728 23 4,722,000 3,623 5 8,105 18Big Soos CreekSOOS CREEK HATCHERY 4,770,000
H 2,572 75 2,295,000 0 0 2,572 75Voight CreekVOIGHTS CR HATCHERY 2,500,000
H 2,716 79 2,544,000 0 0 2,716 79McAllister CreekMCALLISTER HATCHERY 1,650,000
H 629 421 641,700 0 0 629 421Chambers CreekGARRISON HATCHERY 1,400,000
H 5,622 49 5,109,000 1,509 21 4,113 28Deschutes RiverTUMWATER FALLS HATCH 4,800,000
H 10,951 233 2,667,700 0 0 10,951 233Minter CreekMINTER HATCHERY 3,700,000
2001-2002 Final Hatchery Escapement Report Page 7 March 17, 2003
Facility Bo Adults Jacks Eggtake Adults Jacks Adults Jacks
Trapped less releasedReleased to streamTotal Trapped
Stock
CHINOOK FALLEggtake goal
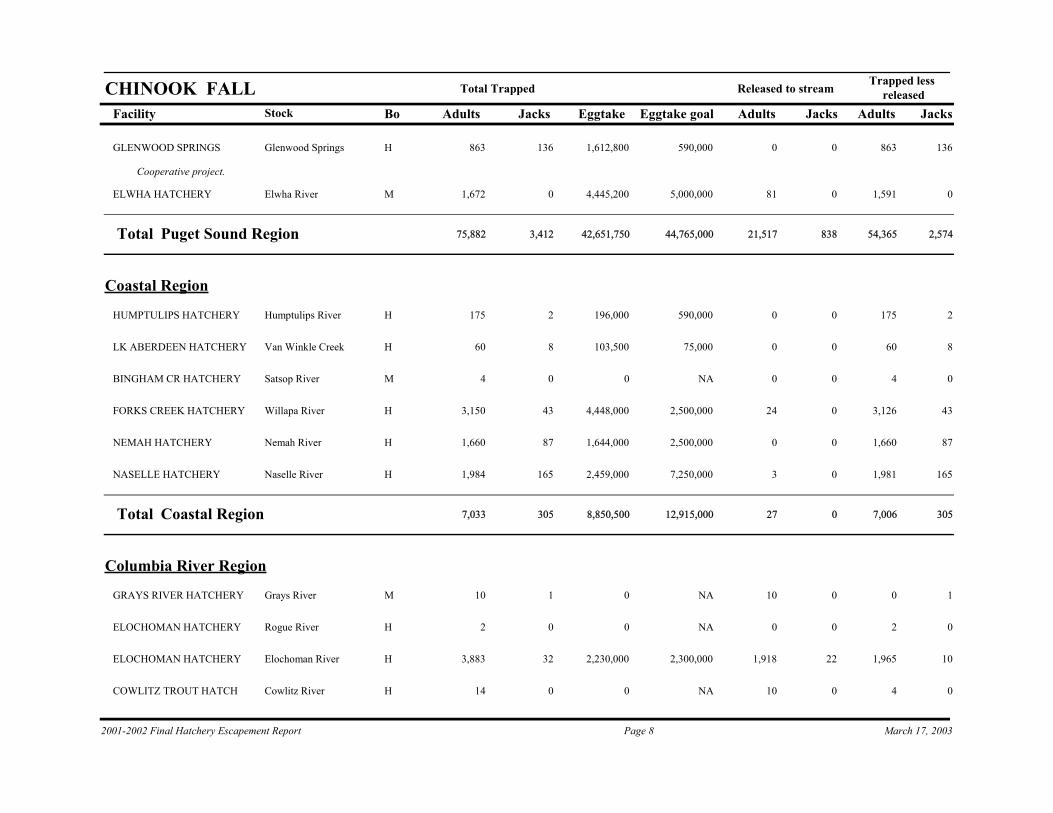
H 863 136 1,612,800 0 0 863 136Glenwood SpringsGLENWOOD SPRINGS
Cooperative project.
590,000
M 1,672 0 4,445,200 81 0 1,591 0Elwha RiverELWHA HATCHERY 5,000,000
Total 75,882Puget Sound Region 3,412 42,651,750 44,765,000 21,517 838 54,365 2,574
Coastal Region
H 175 2 196,000 0 0 175 2Humptulips RiverHUMPTULIPS HATCHERY 590,000
H 60 8 103,500 0 0 60 8Van Winkle CreekLK ABERDEEN HATCHERY 75,000
M 4 0 0 0 0 4 0Satsop RiverBINGHAM CR HATCHERY NA
H 3,150 43 4,448,000 24 0 3,126 43Willapa RiverFORKS CREEK HATCHERY 2,500,000
H 1,660 87 1,644,000 0 0 1,660 87Nemah RiverNEMAH HATCHERY 2,500,000
H 1,984 165 2,459,000 3 0 1,981 165Naselle RiverNASELLE HATCHERY 7,250,000
Total 7,033Coastal Region 305 8,850,500 12,915,000 27 0 7,006 305
Columbia River Region
M 10 1 0 10 0 0 1Grays RiverGRAYS RIVER HATCHERY NA
H 2 0 0 0 0 2 0Rogue RiverELOCHOMAN HATCHERY NA
H 3,883 32 2,230,000 1,918 22 1,965 10Elochoman RiverELOCHOMAN HATCHERY 2,300,000
H 14 0 0 10 0 4 0Cowlitz RiverCOWLITZ TROUT HATCH NA
2001-2002 Final Hatchery Escapement Report Page 8 March 17, 2003
Facility Bo Adults Jacks Eggtake Adults Jacks Adults Jacks
Trapped less releasedReleased to streamTotal Trapped
Stock
CHINOOK FALLEggtake goal
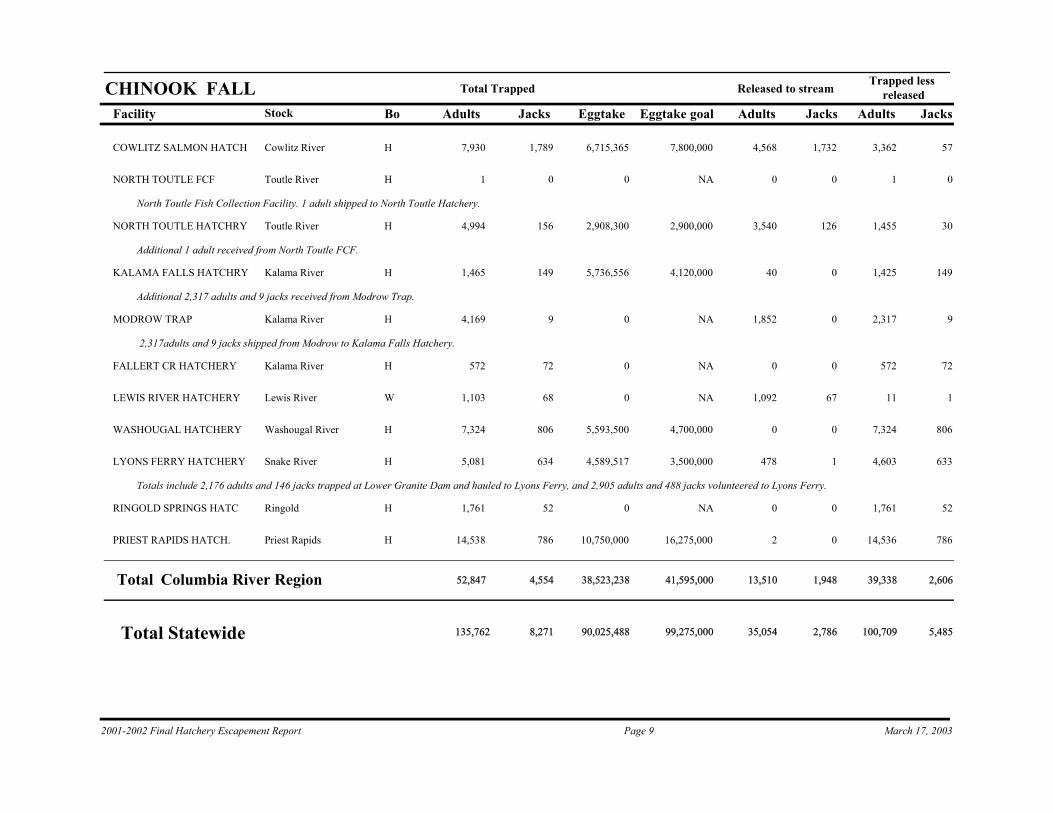
H 7,930 1,789 6,715,365 4,568 1,732 3,362 57Cowlitz RiverCOWLITZ SALMON HATCH 7,800,000
H 1 0 0 0 0 1 0Toutle RiverNORTH TOUTLE FCF
North Toutle Fish Collection Facility. 1 adult shipped to North Toutle Hatchery.
NA
H 4,994 156 2,908,300 3,540 126 1,455 30Toutle RiverNORTH TOUTLE HATCHRY
Additional 1 adult received from North Toutle FCF.
2,900,000
H 1,465 149 5,736,556 40 0 1,425 149Kalama RiverKALAMA FALLS HATCHRY
Additional 2,317 adults and 9 jacks received from Modrow Trap.
4,120,000
H 4,169 9 0 1,852 0 2,317 9Kalama RiverMODROW TRAP
2,317adults and 9 jacks shipped from Modrow to Kalama Falls Hatchery.
NA
H 572 72 0 0 0 572 72Kalama RiverFALLERT CR HATCHERY NA
W 1,103 68 0 1,092 67 11 1Lewis RiverLEWIS RIVER HATCHERY NA
H 7,324 806 5,593,500 0 0 7,324 806Washougal RiverWASHOUGAL HATCHERY 4,700,000
H 5,081 634 4,589,517 478 1 4,603 633Snake RiverLYONS FERRY HATCHERY
Totals include 2,176 adults and 146 jacks trapped at Lower Granite Dam and hauled to Lyons Ferry, and 2,905 adults and 488 jacks volunteered to Lyons Ferry.
3,500,000
H 1,761 52 0 0 0 1,761 52RingoldRINGOLD SPRINGS HATC NA
H 14,538 786 10,750,000 2 0 14,536 786Priest RapidsPRIEST RAPIDS HATCH. 16,275,000
Total 52,847Columbia River Region 4,554 38,523,238 41,595,000 13,510 1,948 39,338 2,606
Total Statewide 135,762 8,271 90,025,488 99,275,000 35,054 2,786 100,709 5,485
2001-2002 Final Hatchery Escapement Report Page 9 March 17, 2003
Facility Bo Adults Jacks Eggtake Adults Jacks Adults Jacks
Trapped less releasedReleased to streamTotal Trapped
Stock
CHINOOK SPRINGEggtake goal
Puget Sound Region
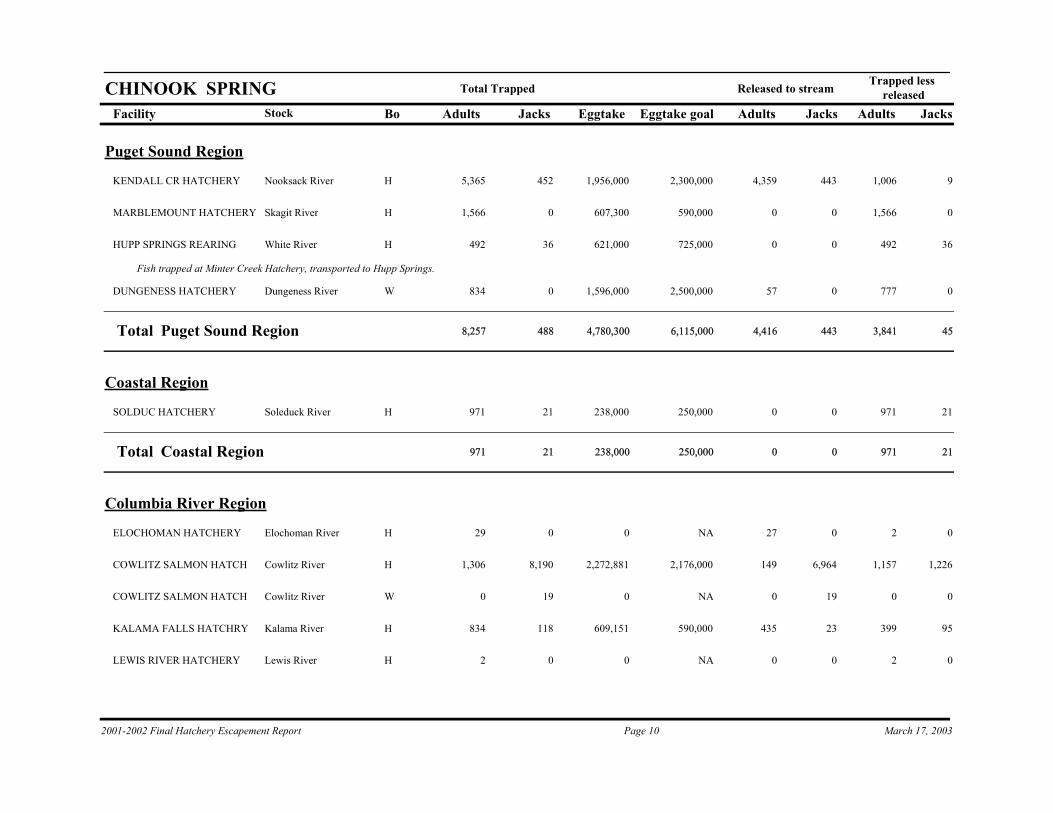
H 5,365 452 1,956,000 4,359 443 1,006 9Nooksack RiverKENDALL CR HATCHERY 2,300,000
H 1,566 0 607,300 0 0 1,566 0Skagit RiverMARBLEMOUNT HATCHERY 590,000
H 492 36 621,000 0 0 492 36White RiverHUPP SPRINGS REARING
Fish trapped at Minter Creek Hatchery, transported to Hupp Springs.
725,000
W 834 0 1,596,000 57 0 777 0Dungeness RiverDUNGENESS HATCHERY 2,500,000
Total 8,257Puget Sound Region 488 4,780,300 6,115,000 4,416 443 3,841 45
Coastal Region
H 971 21 238,000 0 0 971 21Soleduck RiverSOLDUC HATCHERY 250,000
Total 971Coastal Region 21 238,000 250,000 0 0 971 21
Columbia River Region
H 29 0 0 27 0 2 0Elochoman RiverELOCHOMAN HATCHERY NA
H 1,306 8,190 2,272,881 149 6,964 1,157 1,226Cowlitz RiverCOWLITZ SALMON HATCH 2,176,000
W 0 19 0 0 19 0 0Cowlitz RiverCOWLITZ SALMON HATCH NA
H 834 118 609,151 435 23 399 95Kalama RiverKALAMA FALLS HATCHRY 590,000
H 2 0 0 0 0 2 0Lewis RiverLEWIS RIVER HATCHERY NA
2001-2002 Final Hatchery Escapement Report Page 10 March 17, 2003
Facility Bo Adults Jacks Eggtake Adults Jacks Adults Jacks
Trapped less releasedReleased to streamTotal Trapped
Stock
CHINOOK SPRINGEggtake goal
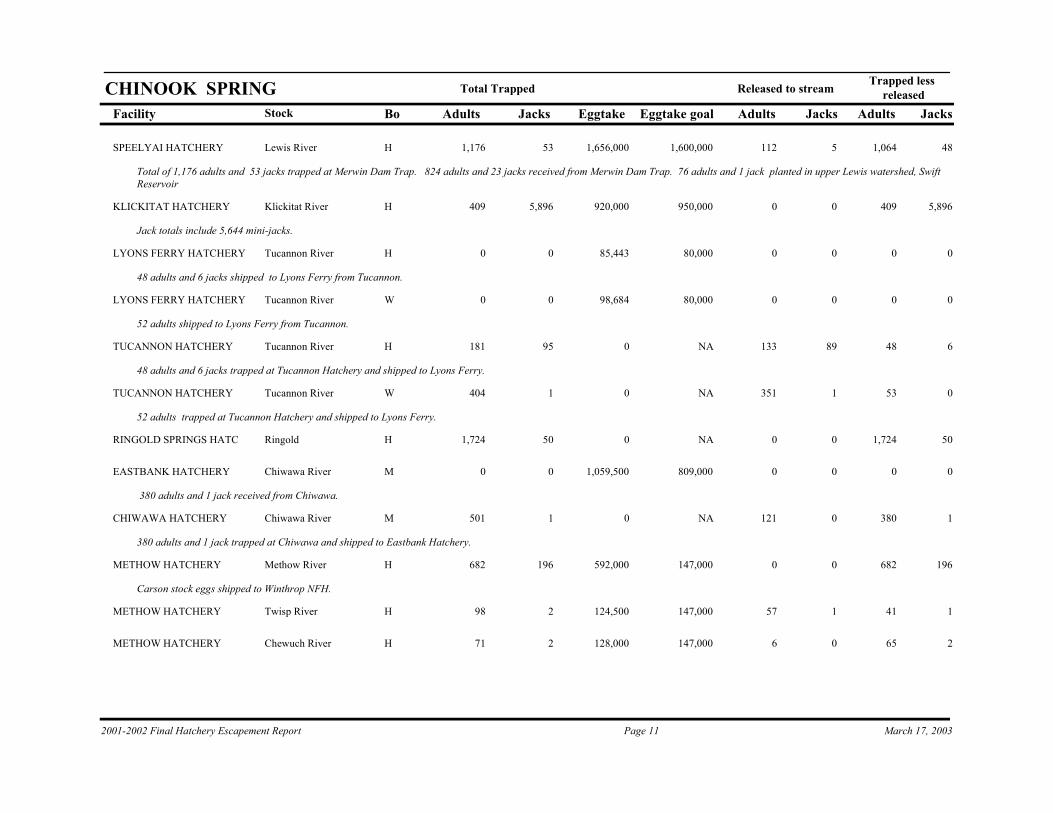
H 1,176 53 1,656,000 112 5 1,064 48Lewis RiverSPEELYAI HATCHERY
Total of 1,176 adults and 53 jacks trapped at Merwin Dam Trap. 824 adults and 23 jacks received from Merwin Dam Trap. 76 adults and 1 jack planted in upper Lewis watershed, Swift Reservoir
1,600,000
H 409 5,896 920,000 0 0 409 5,896Klickitat RiverKLICKITAT HATCHERY
Jack totals include 5,644 mini-jacks.
950,000
H 0 0 85,443 0 0 0 0Tucannon RiverLYONS FERRY HATCHERY
48 adults and 6 jacks shipped to Lyons Ferry from Tucannon.
80,000
W 0 0 98,684 0 0 0 0Tucannon RiverLYONS FERRY HATCHERY
52 adults shipped to Lyons Ferry from Tucannon.
80,000
H 181 95 0 133 89 48 6Tucannon RiverTUCANNON HATCHERY
48 adults and 6 jacks trapped at Tucannon Hatchery and shipped to Lyons Ferry.
NA
W 404 1 0 351 1 53 0Tucannon RiverTUCANNON HATCHERY
52 adults trapped at Tucannon Hatchery and shipped to Lyons Ferry.
NA
H 1,724 50 0 0 0 1,724 50RingoldRINGOLD SPRINGS HATC NA
M 0 0 1,059,500 0 0 0 0Chiwawa RiverEASTBANK HATCHERY
380 adults and 1 jack received from Chiwawa.
809,000
M 501 1 0 121 0 380 1Chiwawa RiverCHIWAWA HATCHERY
380 adults and 1 jack trapped at Chiwawa and shipped to Eastbank Hatchery.
NA
H 682 196 592,000 0 0 682 196Methow RiverMETHOW HATCHERY
Carson stock eggs shipped to Winthrop NFH.
147,000
H 98 2 124,500 57 1 41 1Twisp RiverMETHOW HATCHERY 147,000
H 71 2 128,000 6 0 65 2Chewuch RiverMETHOW HATCHERY 147,000
2001-2002 Final Hatchery Escapement Report Page 11 March 17, 2003
Facility Bo Adults Jacks Eggtake Adults Jacks Adults Jacks
Trapped less releasedReleased to streamTotal Trapped
Stock
CHINOOK SPRINGEggtake goal
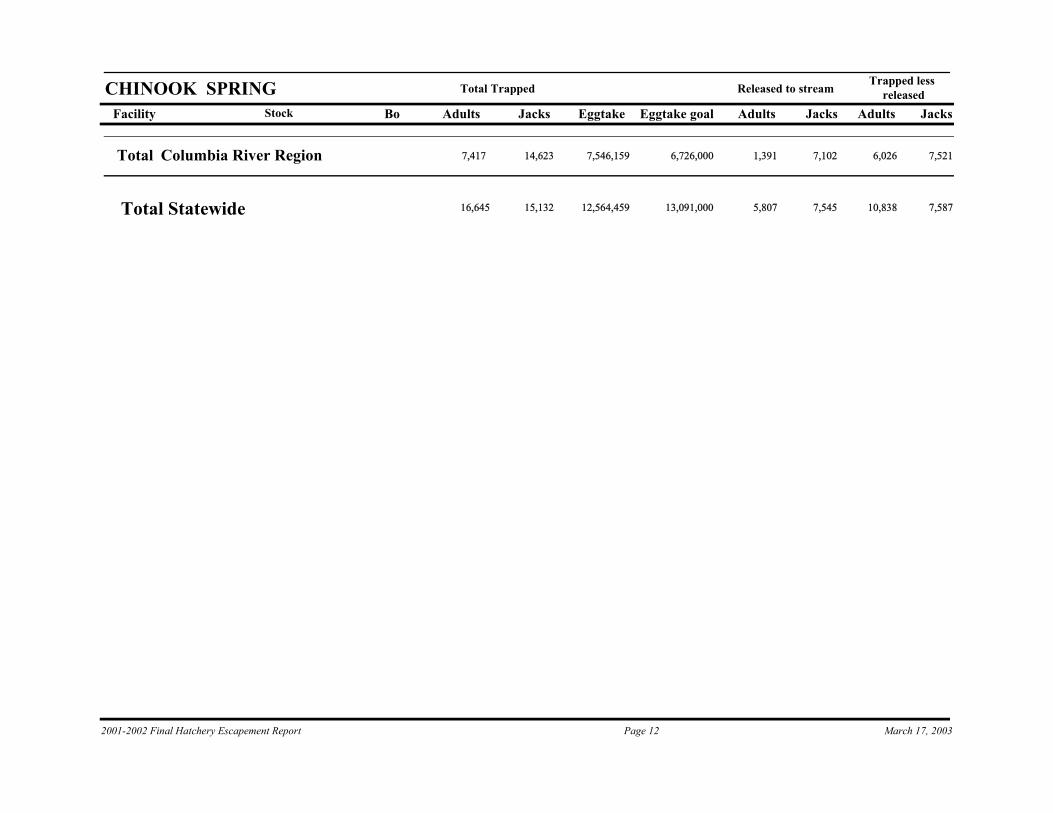
Total 7,417Columbia River Region 14,623 7,546,159 6,726,000 1,391 7,102 6,026 7,521
Total Statewide 16,645 15,132 12,564,459 13,091,000 5,807 7,545 10,838 7,587
2001-2002 Final Hatchery Escapement Report Page 12 March 17, 2003
Facility Bo Adults Jacks Eggtake Adults Jacks Adults Jacks
Trapped less releasedReleased to streamTotal Trapped
Stock
CHINOOK SUMMEREggtake goal
Puget Sound Region
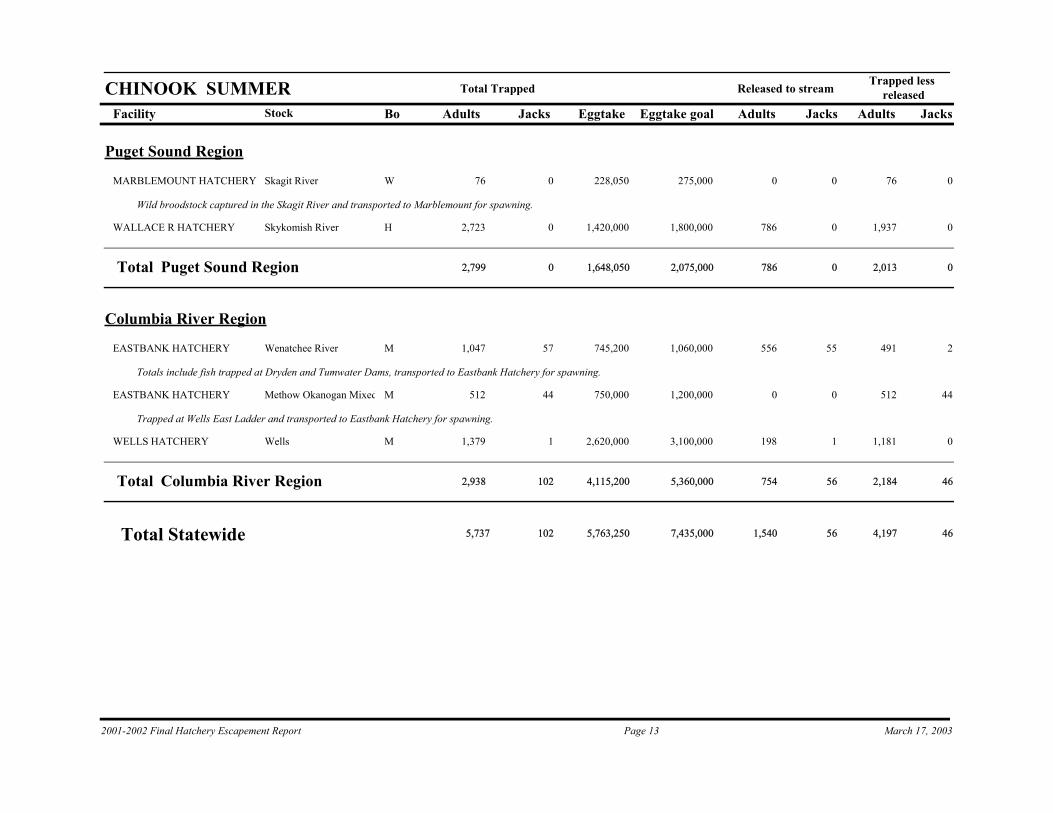
W 76 0 228,050 0 0 76 0Skagit RiverMARBLEMOUNT HATCHERY
Wild broodstock captured in the Skagit River and transported to Marblemount for spawning.
275,000
H 2,723 0 1,420,000 786 0 1,937 0Skykomish RiverWALLACE R HATCHERY 1,800,000
Total 2,799Puget Sound Region 0 1,648,050 2,075,000 786 0 2,013 0
Columbia River Region
M 1,047 57 745,200 556 55 491 2Wenatchee RiverEASTBANK HATCHERY
Totals include fish trapped at Dryden and Tumwater Dams, transported to Eastbank Hatchery for spawning.
1,060,000
M 512 44 750,000 0 0 512 44Methow Okanogan MixedEASTBANK HATCHERY
Trapped at Wells East Ladder and transported to Eastbank Hatchery for spawning.
1,200,000
M 1,379 1 2,620,000 198 1 1,181 0WellsWELLS HATCHERY 3,100,000
Total 2,938Columbia River Region 102 4,115,200 5,360,000 754 56 2,184 46
Total Statewide 5,737 102 5,763,250 7,435,000 1,540 56 4,197 46
2001-2002 Final Hatchery Escapement Report Page 13 March 17, 2003
Facility Bo Adults Jacks Eggtake Adults Jacks Adults Jacks
Trapped less releasedReleased to streamTotal Trapped
Stock
CHUM LATEEggtake goal
Puget Sound Region
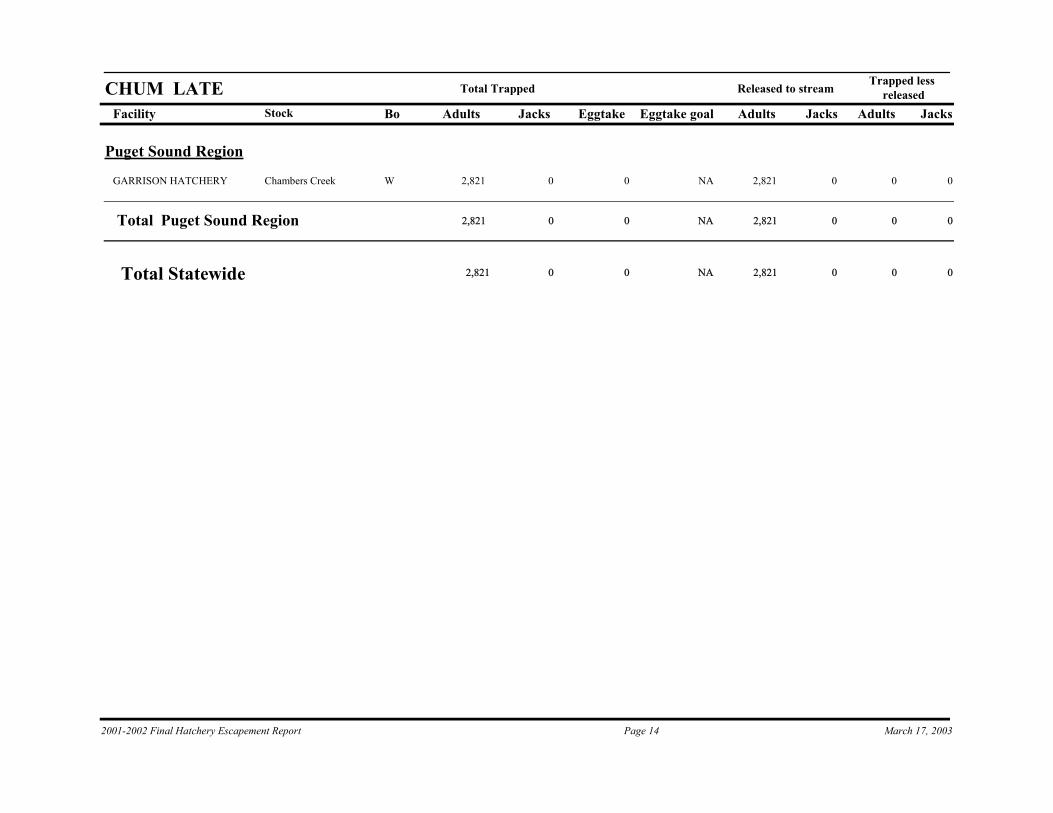
W 2,821 0 0 2,821 0 0 0Chambers CreekGARRISON HATCHERY NA
Total 2,821Puget Sound Region 0 0 NA 2,821 0 0 0
Total Statewide 2,821 0 0 NA 2,821 0 0 0
2001-2002 Final Hatchery Escapement Report Page 14 March 17, 2003
Facility Bo Adults Jacks Eggtake Adults Jacks Adults Jacks
Trapped less releasedReleased to streamTotal Trapped
Stock
CHUM NAEggtake goal
Puget Sound Region
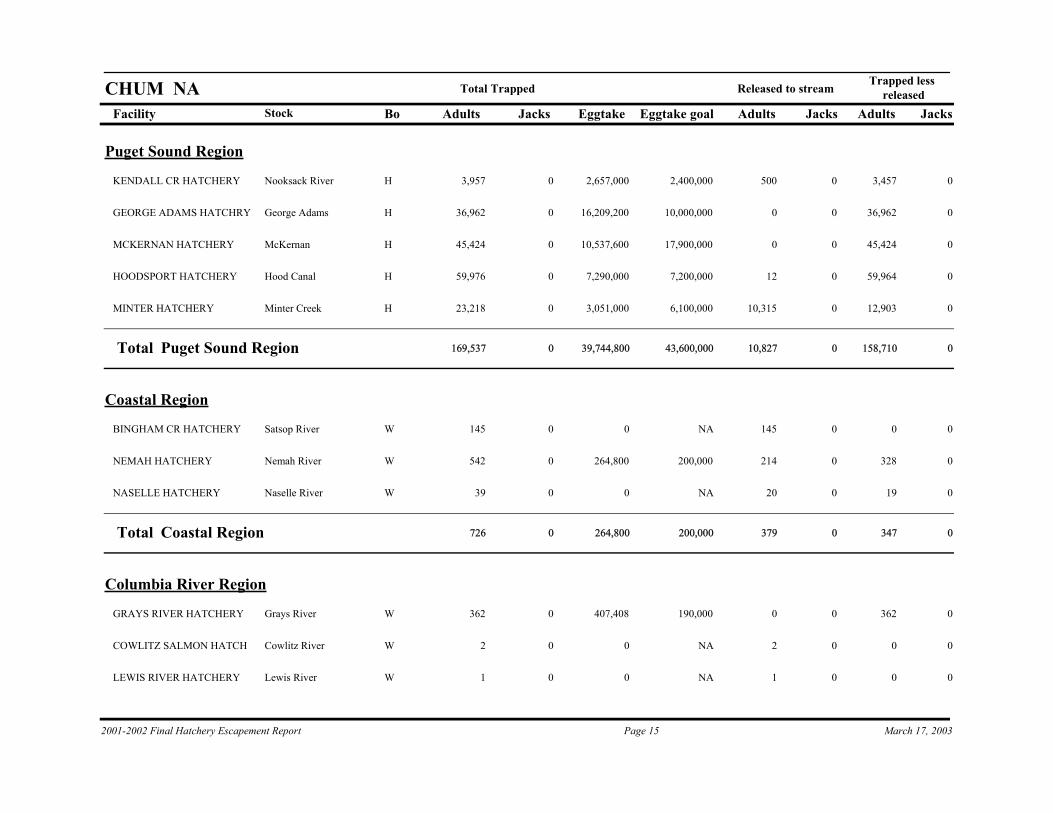
H 3,957 0 2,657,000 500 0 3,457 0Nooksack RiverKENDALL CR HATCHERY 2,400,000
H 36,962 0 16,209,200 0 0 36,962 0George AdamsGEORGE ADAMS HATCHRY 10,000,000
H 45,424 0 10,537,600 0 0 45,424 0McKernanMCKERNAN HATCHERY 17,900,000
H 59,976 0 7,290,000 12 0 59,964 0Hood CanalHOODSPORT HATCHERY 7,200,000
H 23,218 0 3,051,000 10,315 0 12,903 0Minter CreekMINTER HATCHERY 6,100,000
Total 169,537Puget Sound Region 0 39,744,800 43,600,000 10,827 0 158,710 0
Coastal Region
W 145 0 0 145 0 0 0Satsop RiverBINGHAM CR HATCHERY NA
W 542 0 264,800 214 0 328 0Nemah RiverNEMAH HATCHERY 200,000
W 39 0 0 20 0 19 0Naselle RiverNASELLE HATCHERY NA
Total 726Coastal Region 0 264,800 200,000 379 0 347 0
Columbia River Region
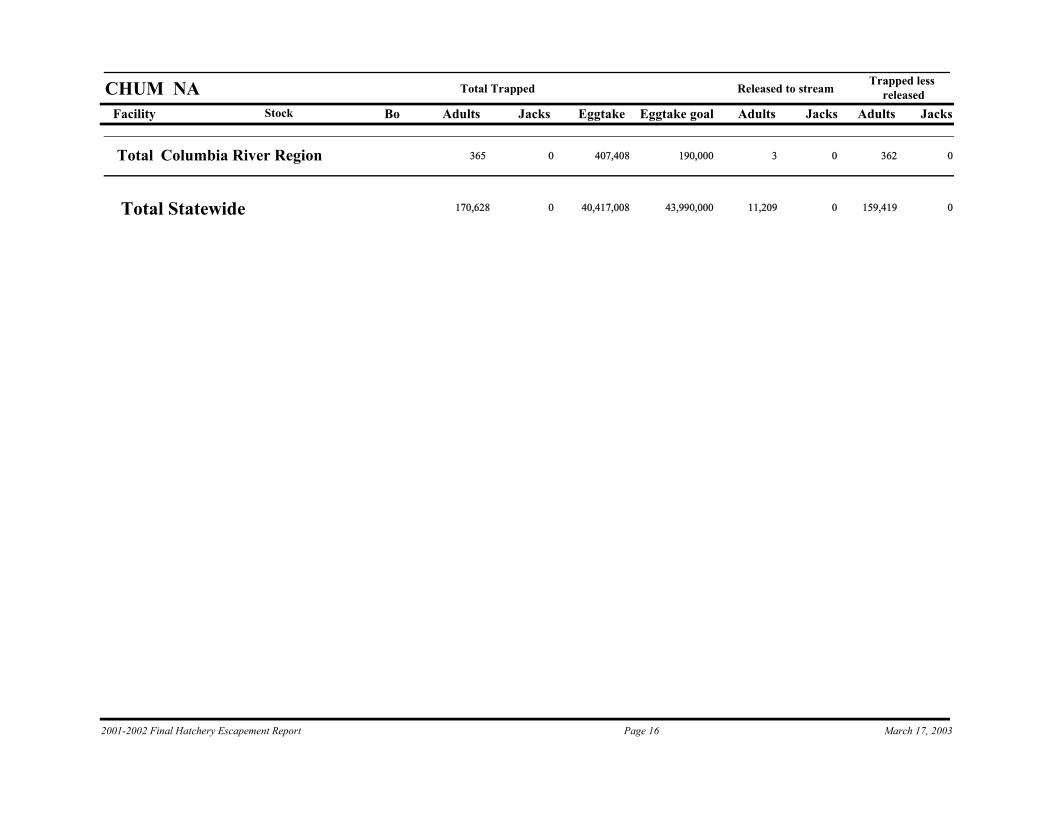
W 362 0 407,408 0 0 362 0Grays RiverGRAYS RIVER HATCHERY 190,000
W 2 0 0 2 0 0 0Cowlitz RiverCOWLITZ SALMON HATCH NA
W 1 0 0 1 0 0 0Lewis RiverLEWIS RIVER HATCHERY NA
2001-2002 Final Hatchery Escapement Report Page 15 March 17, 2003
Facility Bo Adults Jacks Eggtake Adults Jacks Adults Jacks
Trapped less releasedReleased to streamTotal Trapped
Stock
CHUM NAEggtake goal
Total 365Columbia River Region 0 407,408 190,000 3 0 362 0
Total Statewide 170,628 0 40,417,008 43,990,000 11,209 0 159,419 0
2001-2002 Final Hatchery Escapement Report Page 16 March 17, 2003
Facility Bo Adults Jacks Eggtake Adults Jacks Adults Jacks
Trapped less releasedReleased to streamTotal Trapped
Stock
COHO LATEEggtake goal
Coastal Region
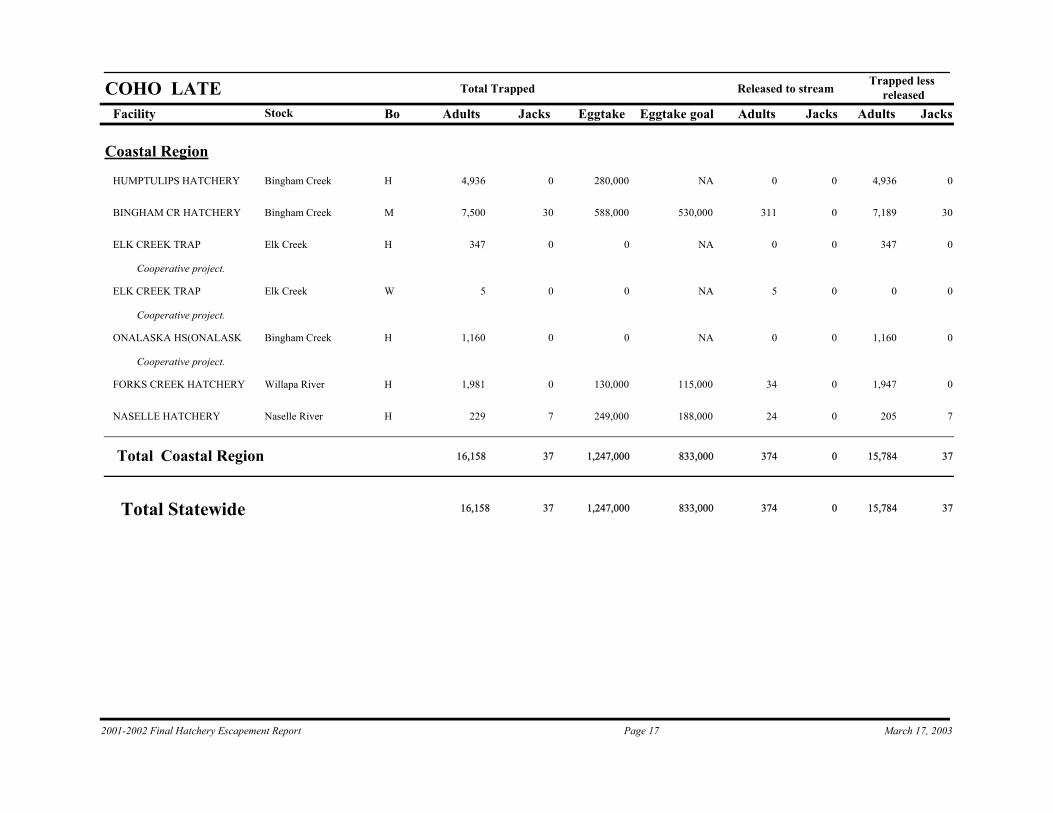
H 4,936 0 280,000 0 0 4,936 0Bingham CreekHUMPTULIPS HATCHERY NA
M 7,500 30 588,000 311 0 7,189 30Bingham CreekBINGHAM CR HATCHERY 530,000
H 347 0 0 0 0 347 0Elk CreekELK CREEK TRAP
Cooperative project.
NA
W 5 0 0 5 0 0 0Elk CreekELK CREEK TRAP
Cooperative project.
NA
H 1,160 0 0 0 0 1,160 0Bingham CreekONALASKA HS(ONALASK
Cooperative project.
NA
H 1,981 0 130,000 34 0 1,947 0Willapa RiverFORKS CREEK HATCHERY 115,000
H 229 7 249,000 24 0 205 7Naselle RiverNASELLE HATCHERY 188,000
Total 16,158Coastal Region 37 1,247,000 833,000 374 0 15,784 37
Total Statewide 16,158 37 1,247,000 833,000 374 0 15,784 37
2001-2002 Final Hatchery Escapement Report Page 17 March 17, 2003
Facility Bo Adults Jacks Eggtake Adults Jacks Adults Jacks
Trapped less releasedReleased to streamTotal Trapped
Stock
COHO NAEggtake goal
Puget Sound Region
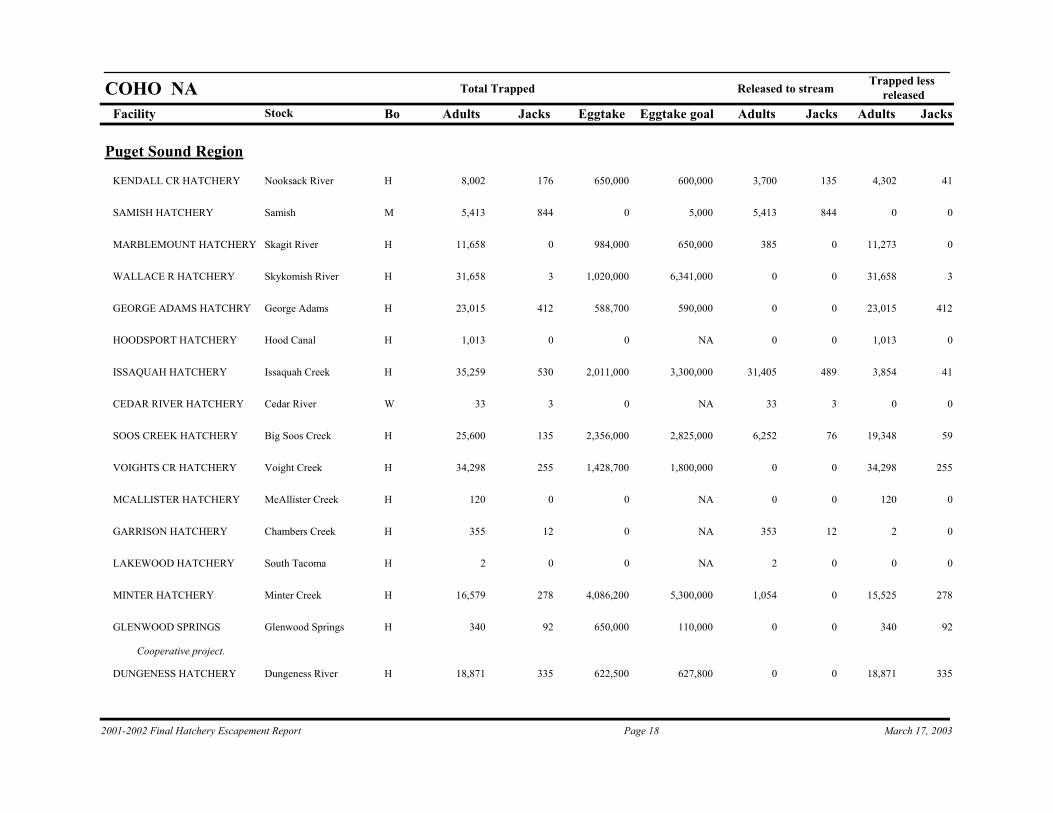
H 8,002 176 650,000 3,700 135 4,302 41Nooksack RiverKENDALL CR HATCHERY 600,000
M 5,413 844 0 5,413 844 0 0SamishSAMISH HATCHERY 5,000
H 11,658 0 984,000 385 0 11,273 0Skagit RiverMARBLEMOUNT HATCHERY 650,000
H 31,658 3 1,020,000 0 0 31,658 3Skykomish RiverWALLACE R HATCHERY 6,341,000
H 23,015 412 588,700 0 0 23,015 412George AdamsGEORGE ADAMS HATCHRY 590,000
H 1,013 0 0 0 0 1,013 0Hood CanalHOODSPORT HATCHERY NA
H 35,259 530 2,011,000 31,405 489 3,854 41Issaquah CreekISSAQUAH HATCHERY 3,300,000
W 33 3 0 33 3 0 0Cedar RiverCEDAR RIVER HATCHERY NA
H 25,600 135 2,356,000 6,252 76 19,348 59Big Soos CreekSOOS CREEK HATCHERY 2,825,000
H 34,298 255 1,428,700 0 0 34,298 255Voight CreekVOIGHTS CR HATCHERY 1,800,000
H 120 0 0 0 0 120 0McAllister CreekMCALLISTER HATCHERY NA
H 355 12 0 353 12 2 0Chambers CreekGARRISON HATCHERY NA
H 2 0 0 2 0 0 0South TacomaLAKEWOOD HATCHERY NA
H 16,579 278 4,086,200 1,054 0 15,525 278Minter CreekMINTER HATCHERY 5,300,000
H 340 92 650,000 0 0 340 92Glenwood SpringsGLENWOOD SPRINGS
Cooperative project.
110,000
H 18,871 335 622,500 0 0 18,871 335Dungeness RiverDUNGENESS HATCHERY 627,800
2001-2002 Final Hatchery Escapement Report Page 18 March 17, 2003
Facility Bo Adults Jacks Eggtake Adults Jacks Adults Jacks
Trapped less releasedReleased to streamTotal Trapped
Stock
COHO NAEggtake goal
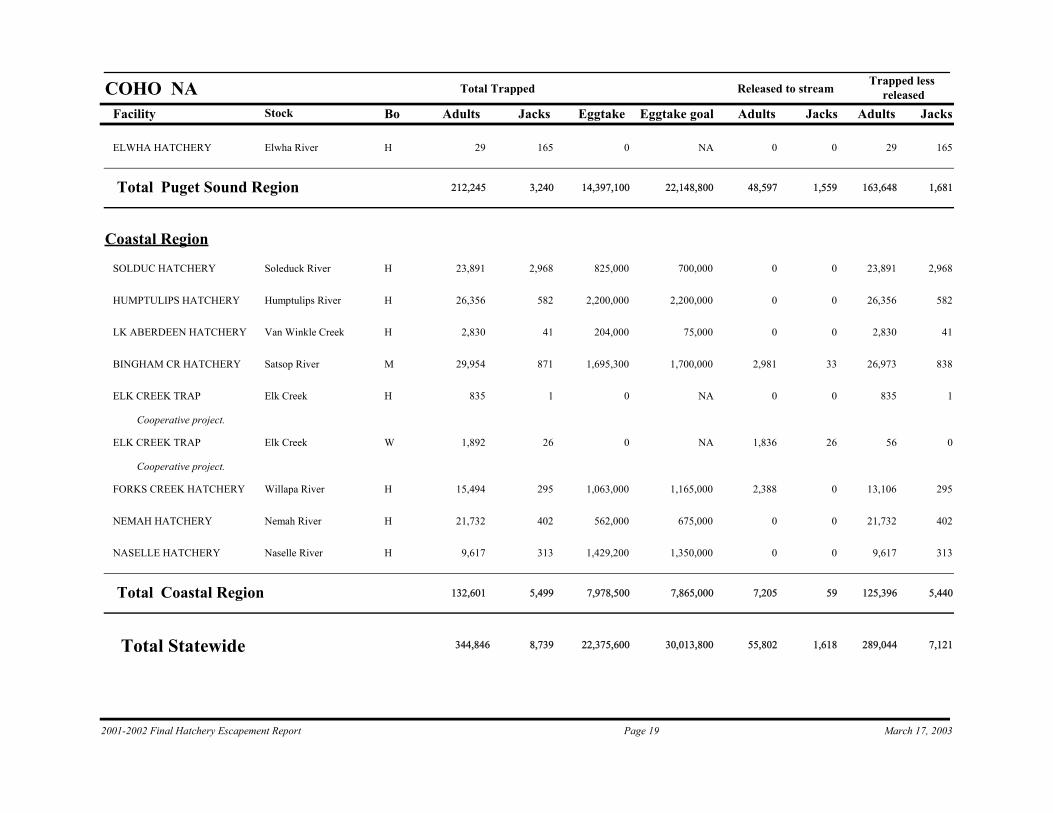
H 29 165 0 0 0 29 165Elwha RiverELWHA HATCHERY NA
Total 212,245Puget Sound Region 3,240 14,397,100 22,148,800 48,597 1,559 163,648 1,681
Coastal Region
H 23,891 2,968 825,000 0 0 23,891 2,968Soleduck RiverSOLDUC HATCHERY 700,000
H 26,356 582 2,200,000 0 0 26,356 582Humptulips RiverHUMPTULIPS HATCHERY 2,200,000
H 2,830 41 204,000 0 0 2,830 41Van Winkle CreekLK ABERDEEN HATCHERY 75,000
M 29,954 871 1,695,300 2,981 33 26,973 838Satsop RiverBINGHAM CR HATCHERY 1,700,000
H 835 1 0 0 0 835 1Elk CreekELK CREEK TRAP
Cooperative project.
NA
W 1,892 26 0 1,836 26 56 0Elk CreekELK CREEK TRAP
Cooperative project.
NA
H 15,494 295 1,063,000 2,388 0 13,106 295Willapa RiverFORKS CREEK HATCHERY 1,165,000
H 21,732 402 562,000 0 0 21,732 402Nemah RiverNEMAH HATCHERY 675,000
H 9,617 313 1,429,200 0 0 9,617 313Naselle RiverNASELLE HATCHERY 1,350,000
Total 132,601Coastal Region 5,499 7,978,500 7,865,000 7,205 59 125,396 5,440
Total Statewide 344,846 8,739 22,375,600 30,013,800 55,802 1,618 289,044 7,121
2001-2002 Final Hatchery Escapement Report Page 19 March 17, 2003
Facility Bo Adults Jacks Eggtake Adults Jacks Adults Jacks
Trapped less releasedReleased to streamTotal Trapped
Stock
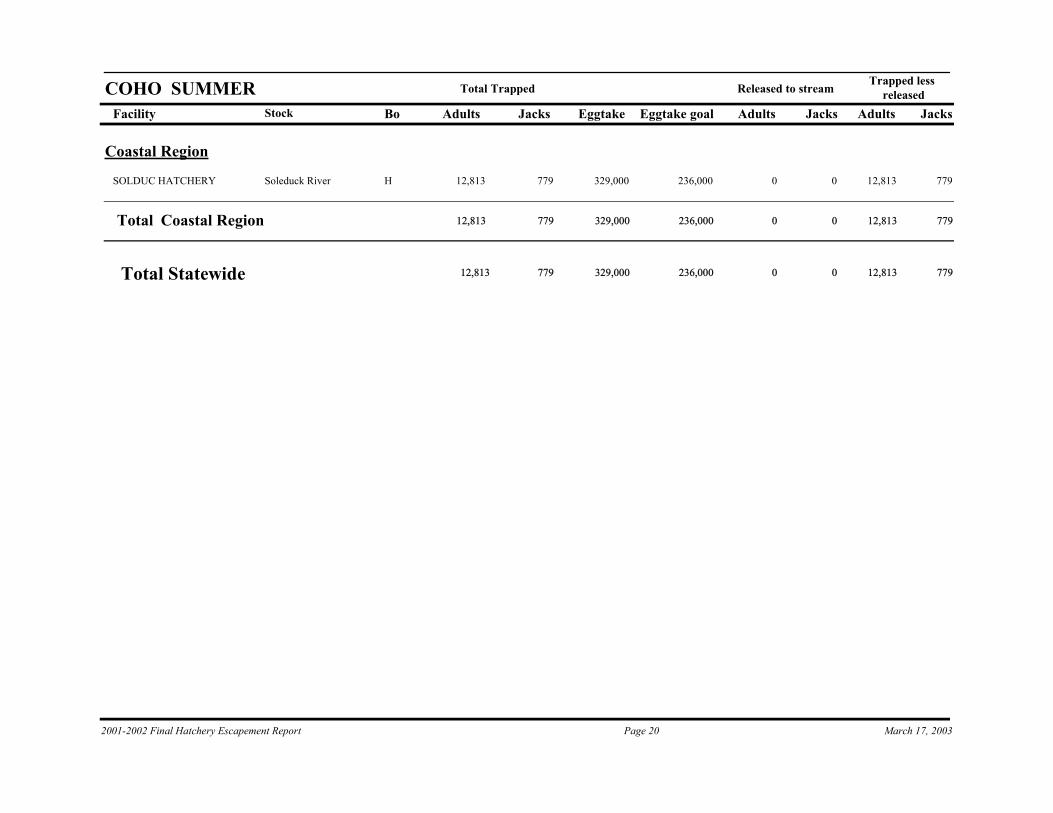
COHO SUMMEREggtake goal
Coastal Region
H 12,813 779 329,000 0 0 12,813 779Soleduck RiverSOLDUC HATCHERY 236,000
Total 12,813Coastal Region 779 329,000 236,000 0 0 12,813 779
Total Statewide 12,813 779 329,000 236,000 0 0 12,813 779
2001-2002 Final Hatchery Escapement Report Page 20 March 17, 2003
Facility Bo Adults Jacks Eggtake Adults Jacks Adults Jacks
Trapped less releasedReleased to streamTotal Trapped
Stock
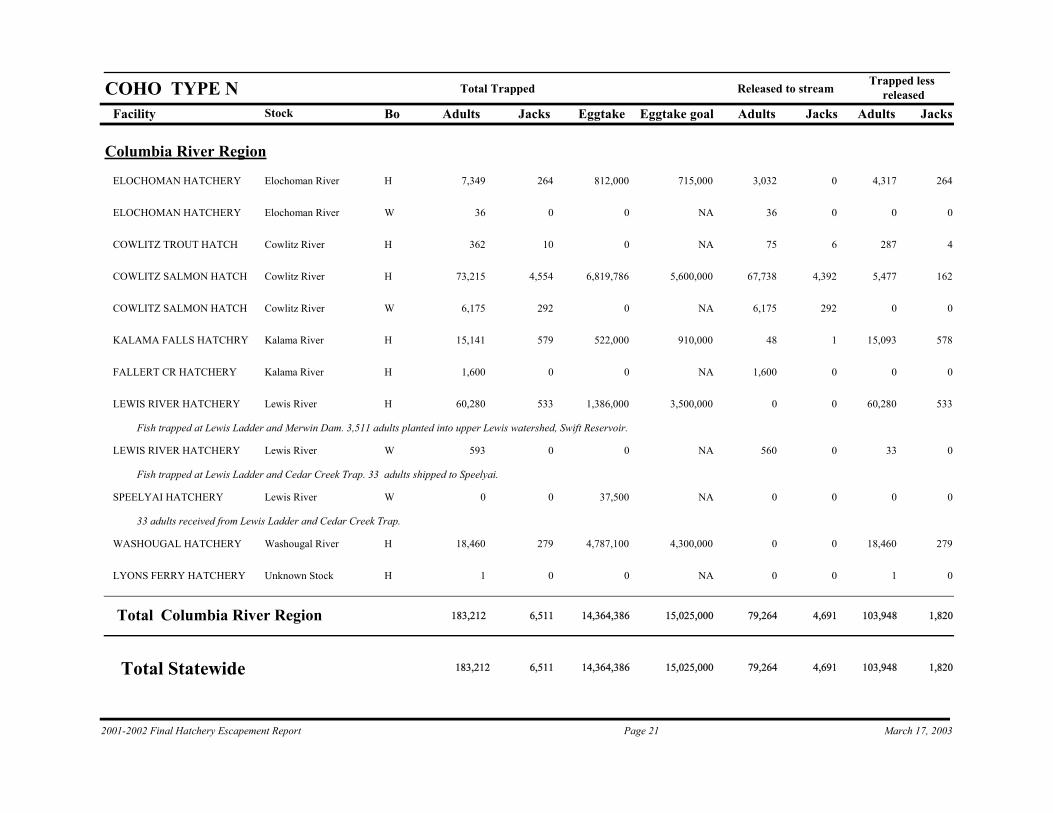
COHO TYPE NEggtake goal
Columbia River Region
H 7,349 264 812,000 3,032 0 4,317 264Elochoman RiverELOCHOMAN HATCHERY 715,000
W 36 0 0 36 0 0 0Elochoman RiverELOCHOMAN HATCHERY NA
H 362 10 0 75 6 287 4Cowlitz RiverCOWLITZ TROUT HATCH NA
H 73,215 4,554 6,819,786 67,738 4,392 5,477 162Cowlitz RiverCOWLITZ SALMON HATCH 5,600,000
W 6,175 292 0 6,175 292 0 0Cowlitz RiverCOWLITZ SALMON HATCH NA
H 15,141 579 522,000 48 1 15,093 578Kalama RiverKALAMA FALLS HATCHRY 910,000
H 1,600 0 0 1,600 0 0 0Kalama RiverFALLERT CR HATCHERY NA
H 60,280 533 1,386,000 0 0 60,280 533Lewis RiverLEWIS RIVER HATCHERY
Fish trapped at Lewis Ladder and Merwin Dam. 3,511 adults planted into upper Lewis watershed, Swift Reservoir.
3,500,000
W 593 0 0 560 0 33 0Lewis RiverLEWIS RIVER HATCHERY
Fish trapped at Lewis Ladder and Cedar Creek Trap. 33 adults shipped to Speelyai.
NA
W 0 0 37,500 0 0 0 0Lewis RiverSPEELYAI HATCHERY
33 adults received from Lewis Ladder and Cedar Creek Trap.
NA
H 18,460 279 4,787,100 0 0 18,460 279Washougal RiverWASHOUGAL HATCHERY 4,300,000
H 1 0 0 0 0 1 0Unknown StockLYONS FERRY HATCHERY NA
Total 183,212Columbia River Region 6,511 14,364,386 15,025,000 79,264 4,691 103,948 1,820
Total Statewide 183,212 6,511 14,364,386 15,025,000 79,264 4,691 103,948 1,820
2001-2002 Final Hatchery Escapement Report Page 21 March 17, 2003
Facility Bo Adults Jacks Eggtake Adults Jacks Adults Jacks
Trapped less releasedReleased to streamTotal Trapped
Stock
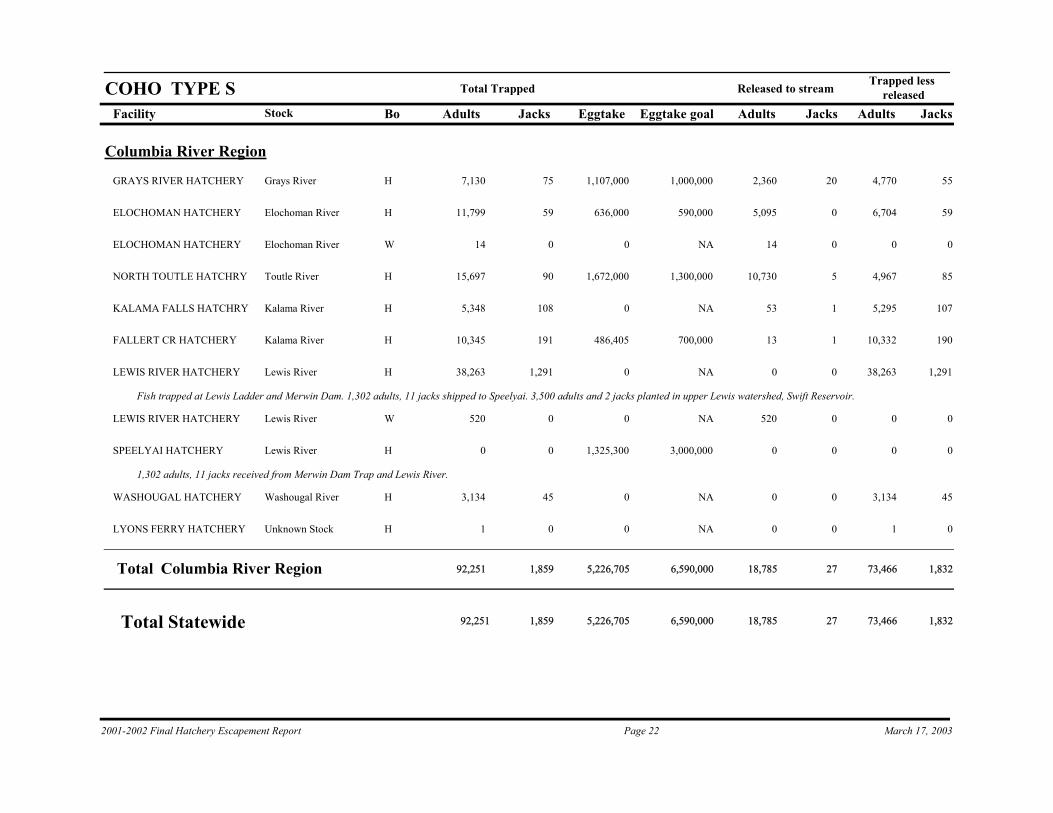
COHO TYPE SEggtake goal
Columbia River Region
H 7,130 75 1,107,000 2,360 20 4,770 55Grays RiverGRAYS RIVER HATCHERY 1,000,000
H 11,799 59 636,000 5,095 0 6,704 59Elochoman RiverELOCHOMAN HATCHERY 590,000
W 14 0 0 14 0 0 0Elochoman RiverELOCHOMAN HATCHERY NA
H 15,697 90 1,672,000 10,730 5 4,967 85Toutle RiverNORTH TOUTLE HATCHRY 1,300,000
H 5,348 108 0 53 1 5,295 107Kalama RiverKALAMA FALLS HATCHRY NA
H 10,345 191 486,405 13 1 10,332 190Kalama RiverFALLERT CR HATCHERY 700,000
H 38,263 1,291 0 0 0 38,263 1,291Lewis RiverLEWIS RIVER HATCHERY
Fish trapped at Lewis Ladder and Merwin Dam. 1,302 adults, 11 jacks shipped to Speelyai. 3,500 adults and 2 jacks planted in upper Lewis watershed, Swift Reservoir.
NA
W 520 0 0 520 0 0 0Lewis RiverLEWIS RIVER HATCHERY NA
H 0 0 1,325,300 0 0 0 0Lewis RiverSPEELYAI HATCHERY
1,302 adults, 11 jacks received from Merwin Dam Trap and Lewis River.
3,000,000
H 3,134 45 0 0 0 3,134 45Washougal RiverWASHOUGAL HATCHERY NA
H 1 0 0 0 0 1 0Unknown StockLYONS FERRY HATCHERY NA
Total 92,251Columbia River Region 1,859 5,226,705 6,590,000 18,785 27 73,466 1,832
Total Statewide 92,251 1,859 5,226,705 6,590,000 18,785 27 73,466 1,832
2001-2002 Final Hatchery Escapement Report Page 22 March 17, 2003
Facility Bo Adults Jacks Eggtake Adults Jacks Adults Jacks
Trapped less releasedReleased to streamTotal Trapped
Stock
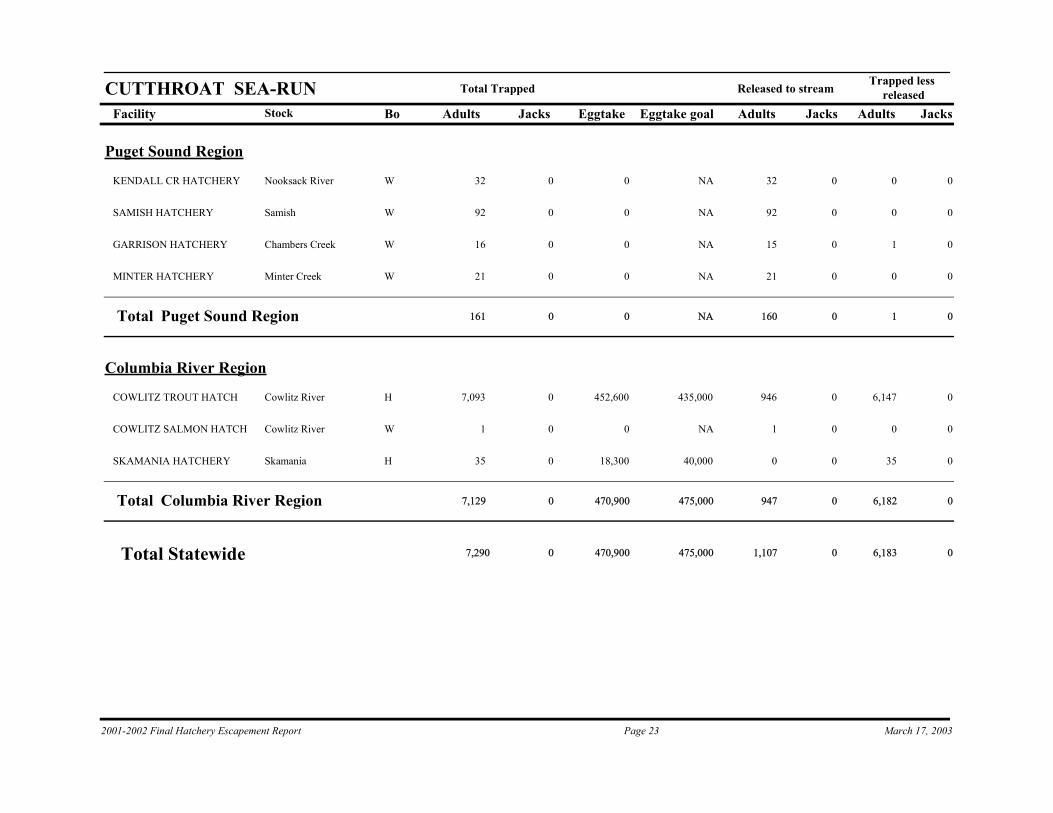
CUTTHROAT SEA-RUNEggtake goal
Puget Sound Region
W 32 0 0 32 0 0 0Nooksack RiverKENDALL CR HATCHERY NA
W 92 0 0 92 0 0 0SamishSAMISH HATCHERY NA
W 16 0 0 15 0 1 0Chambers CreekGARRISON HATCHERY NA
W 21 0 0 21 0 0 0Minter CreekMINTER HATCHERY NA
Total 161Puget Sound Region 0 0 NA 160 0 1 0
Columbia River Region
H 7,093 0 452,600 946 0 6,147 0Cowlitz RiverCOWLITZ TROUT HATCH 435,000
W 1 0 0 1 0 0 0Cowlitz RiverCOWLITZ SALMON HATCH NA
H 35 0 18,300 0 0 35 0SkamaniaSKAMANIA HATCHERY 40,000
Total 7,129Columbia River Region 0 470,900 475,000 947 0 6,182 0
Total Statewide 7,290 0 470,900 475,000 1,107 0 6,183 0
2001-2002 Final Hatchery Escapement Report Page 23 March 17, 2003
Facility Bo Adults Jacks Eggtake Adults Jacks Adults Jacks
Trapped less releasedReleased to streamTotal Trapped
Stock
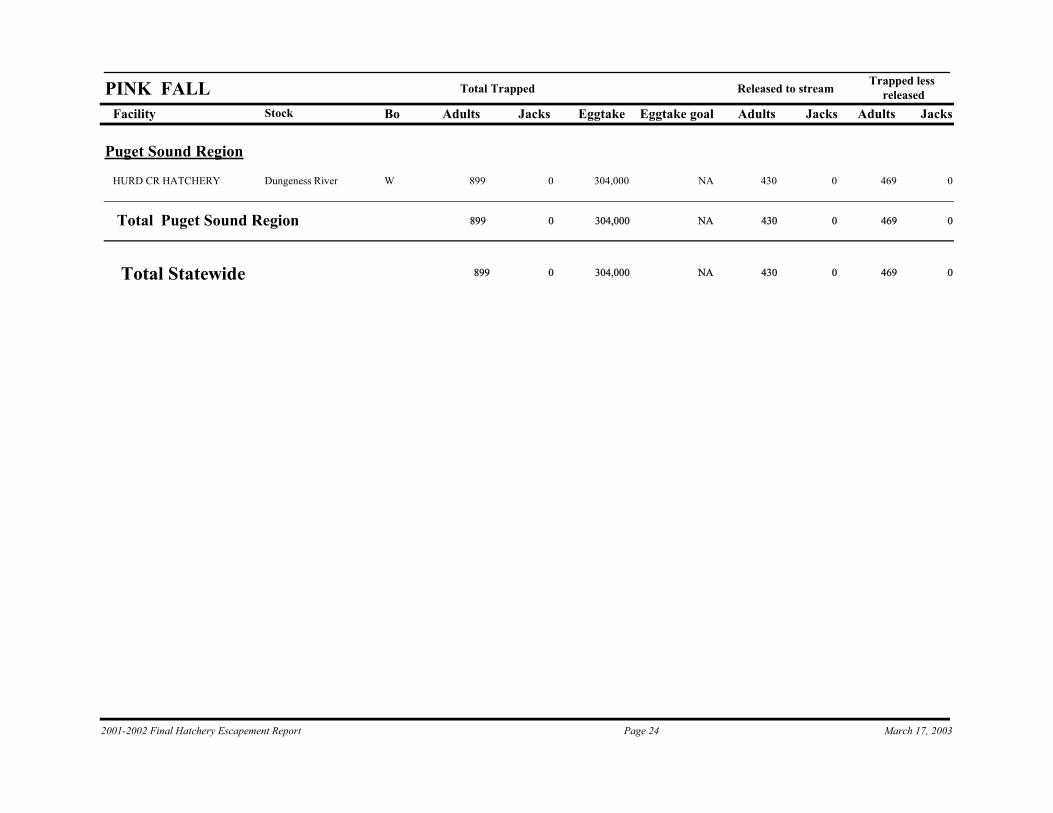
PINK FALLEggtake goal
Puget Sound Region
W 899 0 304,000 430 0 469 0Dungeness RiverHURD CR HATCHERY NA
Total 899Puget Sound Region 0 304,000 NA 430 0 469 0
Total Statewide 899 0 304,000 NA 430 0 469 0
2001-2002 Final Hatchery Escapement Report Page 24 March 17, 2003
Facility Bo Adults Jacks Eggtake Adults Jacks Adults Jacks
Trapped less releasedReleased to streamTotal Trapped
Stock
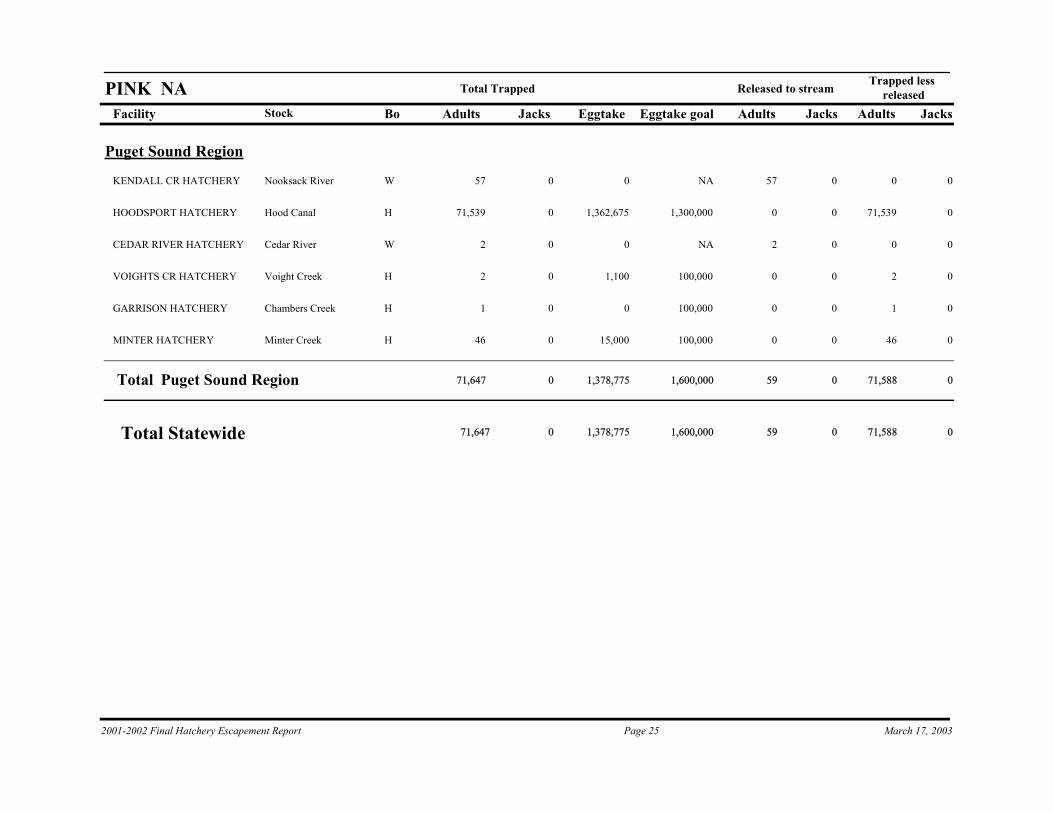
PINK NAEggtake goal
Puget Sound Region
W 57 0 0 57 0 0 0Nooksack RiverKENDALL CR HATCHERY NA
H 71,539 0 1,362,675 0 0 71,539 0Hood CanalHOODSPORT HATCHERY 1,300,000
W 2 0 0 2 0 0 0Cedar RiverCEDAR RIVER HATCHERY NA
H 2 0 1,100 0 0 2 0Voight CreekVOIGHTS CR HATCHERY 100,000
H 1 0 0 0 0 1 0Chambers CreekGARRISON HATCHERY 100,000
H 46 0 15,000 0 0 46 0Minter CreekMINTER HATCHERY 100,000
Total 71,647Puget Sound Region 0 1,378,775 1,600,000 59 0 71,588 0
Total Statewide 71,647 0 1,378,775 1,600,000 59 0 71,588 0
2001-2002 Final Hatchery Escapement Report Page 25 March 17, 2003
Facility Bo Adults Jacks Eggtake Adults Jacks Adults Jacks
Trapped less releasedReleased to streamTotal Trapped
Stock
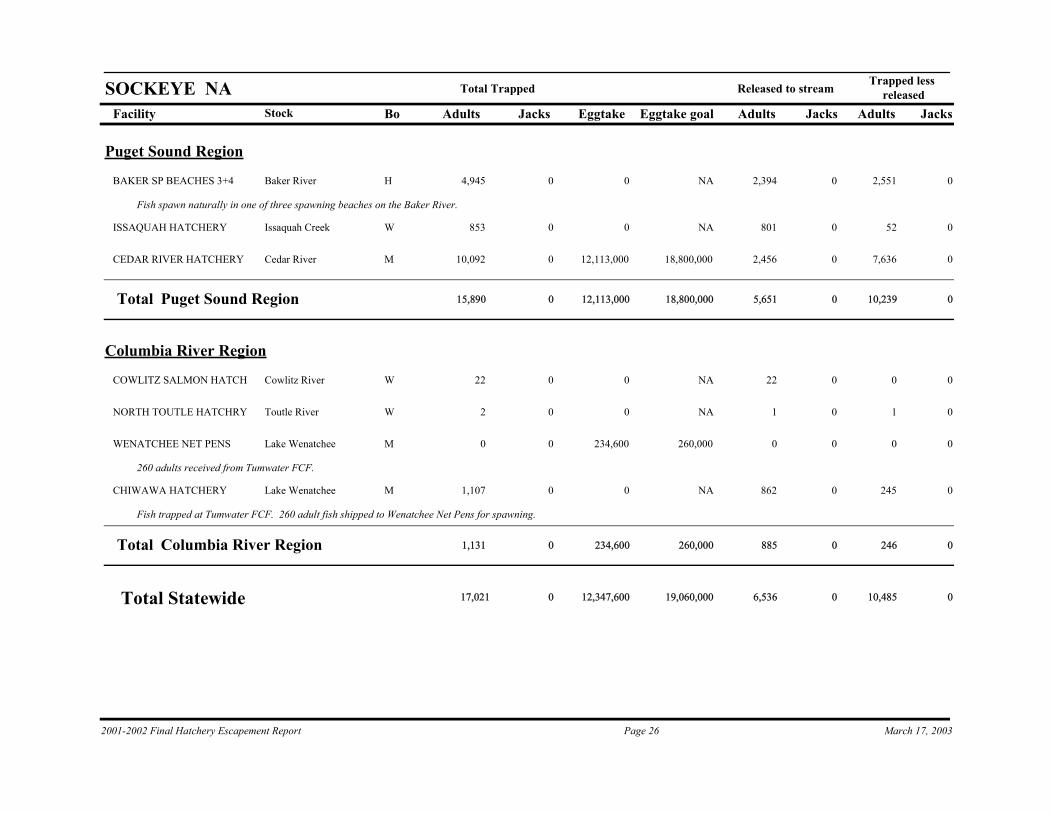
SOCKEYE NAEggtake goal
Puget Sound Region
H 4,945 0 0 2,394 0 2,551 0Baker RiverBAKER SP BEACHES 3+4
Fish spawn naturally in one of three spawning beaches on the Baker River.
NA
W 853 0 0 801 0 52 0Issaquah CreekISSAQUAH HATCHERY NA
M 10,092 0 12,113,000 2,456 0 7,636 0Cedar RiverCEDAR RIVER HATCHERY 18,800,000
Total 15,890Puget Sound Region 0 12,113,000 18,800,000 5,651 0 10,239 0
Columbia River Region
W 22 0 0 22 0 0 0Cowlitz RiverCOWLITZ SALMON HATCH NA
W 2 0 0 1 0 1 0Toutle RiverNORTH TOUTLE HATCHRY NA
M 0 0 234,600 0 0 0 0Lake WenatcheeWENATCHEE NET PENS
260 adults received from Tumwater FCF.
260,000
M 1,107 0 0 862 0 245 0Lake WenatcheeCHIWAWA HATCHERY
Fish trapped at Tumwater FCF. 260 adult fish shipped to Wenatchee Net Pens for spawning.
NA
Total 1,131Columbia River Region 0 234,600 260,000 885 0 246 0
Total Statewide 17,021 0 12,347,600 19,060,000 6,536 0 10,485 0
2001-2002 Final Hatchery Escapement Report Page 26 March 17, 2003
Facility Bo Adults Jacks Eggtake Adults Jacks Adults Jacks
Trapped less releasedReleased to streamTotal Trapped
Stock
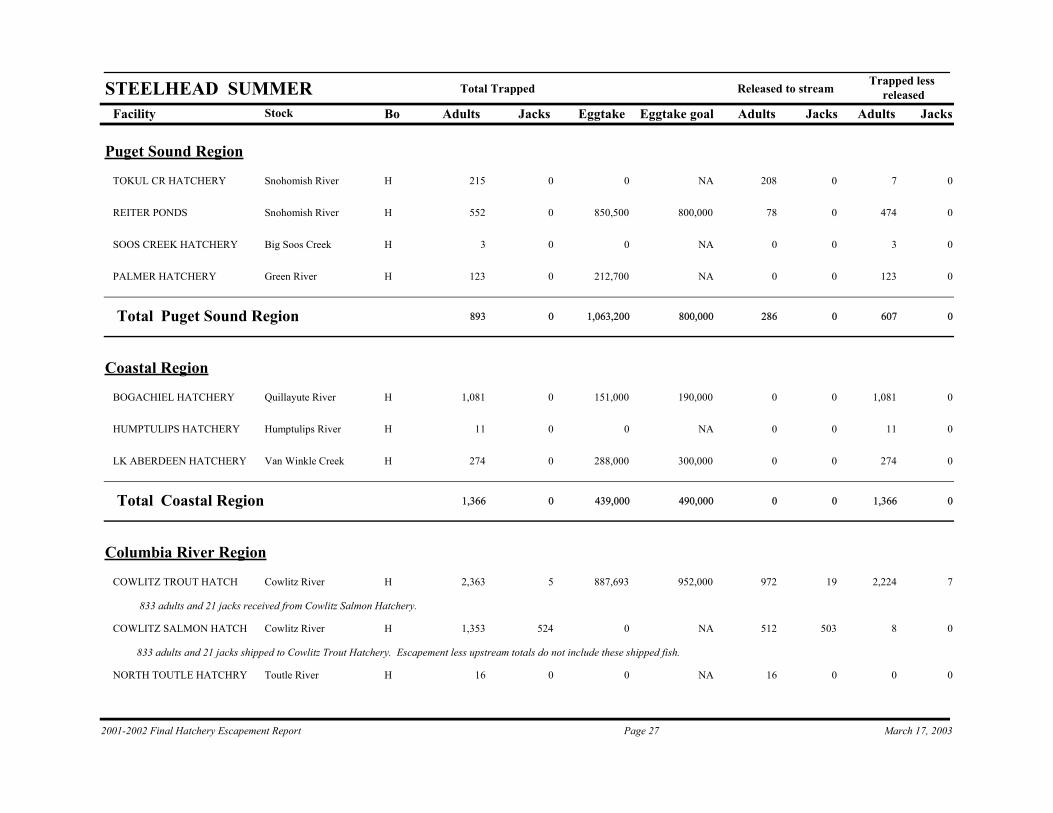
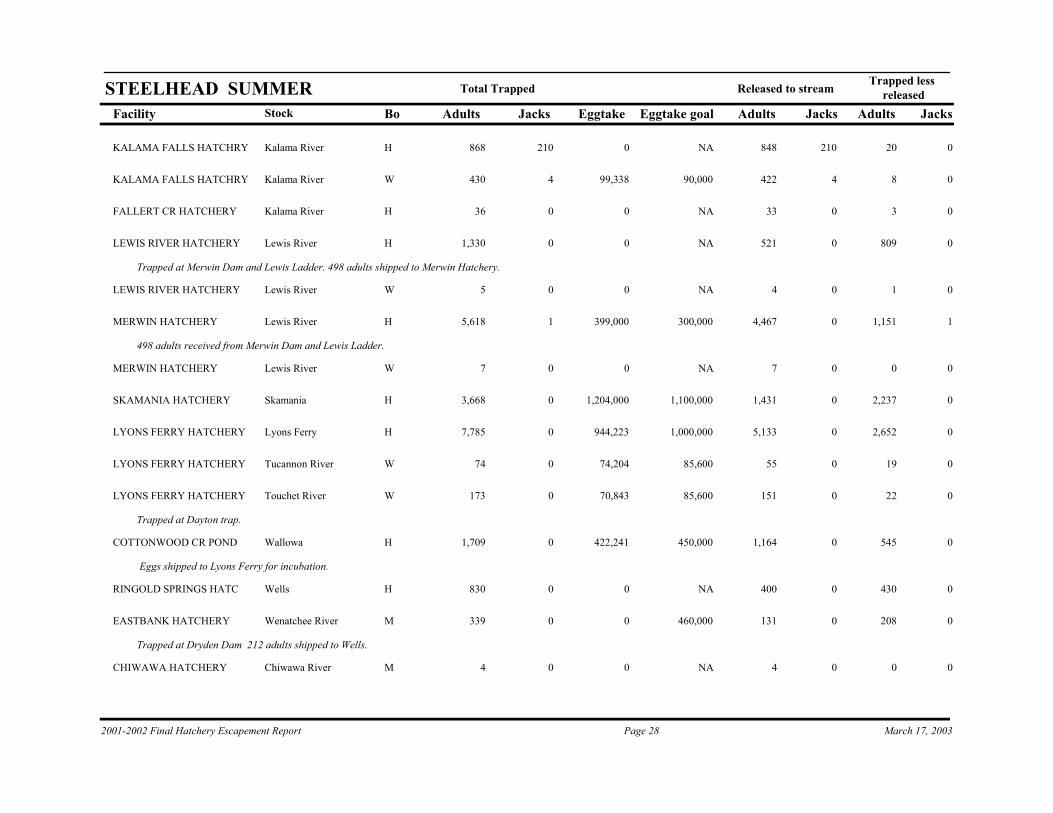
STEELHEAD SUMMEREggtake goal
Puget Sound Region
H 215 0 0 208 0 7 0Snohomish RiverTOKUL CR HATCHERY NA
H 552 0 850,500 78 0 474 0Snohomish RiverREITER PONDS 800,000
H 3 0 0 0 0 3 0Big Soos CreekSOOS CREEK HATCHERY NA
H 123 0 212,700 0 0 123 0Green RiverPALMER HATCHERY NA
Total 893Puget Sound Region 0 1,063,200 800,000 286 0 607 0
Coastal Region
H 1,081 0 151,000 0 0 1,081 0Quillayute RiverBOGACHIEL HATCHERY 190,000
H 11 0 0 0 0 11 0Humptulips RiverHUMPTULIPS HATCHERY NA
H 274 0 288,000 0 0 274 0Van Winkle CreekLK ABERDEEN HATCHERY 300,000
Total 1,366Coastal Region 0 439,000 490,000 0 0 1,366 0
Columbia River Region
H 2,363 5 887,693 972 19 2,224 7Cowlitz RiverCOWLITZ TROUT HATCH
833 adults and 21 jacks received from Cowlitz Salmon Hatchery.
952,000
H 1,353 524 0 512 503 8 0Cowlitz RiverCOWLITZ SALMON HATCH
833 adults and 21 jacks shipped to Cowlitz Trout Hatchery. Escapement less upstream totals do not include these shipped fish.
NA
H 16 0 0 16 0 0 0Toutle RiverNORTH TOUTLE HATCHRY NA
2001-2002 Final Hatchery Escapement Report Page 27 March 17, 2003
Facility Bo Adults Jacks Eggtake Adults Jacks Adults Jacks
Trapped less releasedReleased to streamTotal Trapped
Stock
STEELHEAD SUMMEREggtake goal
H 868 210 0 848 210 20 0Kalama RiverKALAMA FALLS HATCHRY NA
W 430 4 99,338 422 4 8 0Kalama RiverKALAMA FALLS HATCHRY 90,000
H 36 0 0 33 0 3 0Kalama RiverFALLERT CR HATCHERY NA
H 1,330 0 0 521 0 809 0Lewis RiverLEWIS RIVER HATCHERY
Trapped at Merwin Dam and Lewis Ladder. 498 adults shipped to Merwin Hatchery.
NA
W 5 0 0 4 0 1 0Lewis RiverLEWIS RIVER HATCHERY NA
H 5,618 1 399,000 4,467 0 1,151 1Lewis RiverMERWIN HATCHERY
498 adults received from Merwin Dam and Lewis Ladder.
300,000
W 7 0 0 7 0 0 0Lewis RiverMERWIN HATCHERY NA
H 3,668 0 1,204,000 1,431 0 2,237 0SkamaniaSKAMANIA HATCHERY 1,100,000
H 7,785 0 944,223 5,133 0 2,652 0Lyons FerryLYONS FERRY HATCHERY 1,000,000
W 74 0 74,204 55 0 19 0Tucannon RiverLYONS FERRY HATCHERY 85,600
W 173 0 70,843 151 0 22 0Touchet RiverLYONS FERRY HATCHERY
Trapped at Dayton trap.
85,600
H 1,709 0 422,241 1,164 0 545 0WallowaCOTTONWOOD CR POND
Eggs shipped to Lyons Ferry for incubation.
450,000
H 830 0 0 400 0 430 0WellsRINGOLD SPRINGS HATC NA
M 339 0 0 131 0 208 0Wenatchee RiverEASTBANK HATCHERY
Trapped at Dryden Dam 212 adults shipped to Wells.
460,000
M 4 0 0 4 0 0 0Chiwawa RiverCHIWAWA HATCHERY NA
2001-2002 Final Hatchery Escapement Report Page 28 March 17, 2003
Facility Bo Adults Jacks Eggtake Adults Jacks Adults Jacks
Trapped less releasedReleased to streamTotal Trapped
Stock
STEELHEAD SUMMEREggtake goal
M 0 0 413,400 0 0 0 0Wenatchee RiverWELLS HATCHERY
Received 212 adults from Eastbank. Fish spawned and eggs returned to Eastbank for incubation.
NA
M 825 0 1,133,000 433 0 392 0WellsWELLS HATCHERY
Trapped at Wells Dam Ladder.
1,250,000
Total 27,433Columbia River Region 744 5,647,942 5,773,200 16,704 736 10,729 8
Total Statewide 29,692 744 7,150,142 7,063,200 16,990 736 12,702 8
2001-2002 Final Hatchery Escapement Report Page 29 March 17, 2003
Facility Bo Adults Jacks Eggtake Adults Jacks Adults Jacks
Trapped less releasedReleased to streamTotal Trapped
Stock
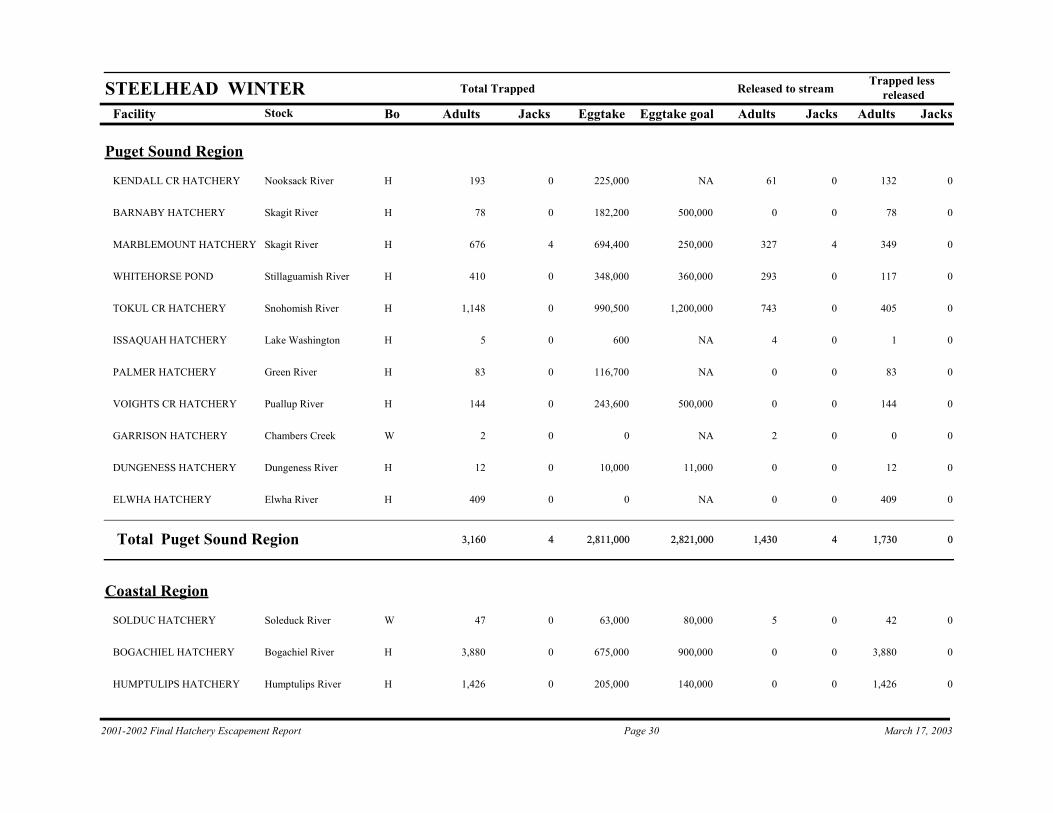
STEELHEAD WINTEREggtake goal
Puget Sound Region
H 193 0 225,000 61 0 132 0Nooksack RiverKENDALL CR HATCHERY NA
H 78 0 182,200 0 0 78 0Skagit RiverBARNABY HATCHERY 500,000
H 676 4 694,400 327 4 349 0Skagit RiverMARBLEMOUNT HATCHERY 250,000
H 410 0 348,000 293 0 117 0Stillaguamish RiverWHITEHORSE POND 360,000
H 1,148 0 990,500 743 0 405 0Snohomish RiverTOKUL CR HATCHERY 1,200,000
H 5 0 600 4 0 1 0Lake WashingtonISSAQUAH HATCHERY NA
H 83 0 116,700 0 0 83 0Green RiverPALMER HATCHERY NA
H 144 0 243,600 0 0 144 0Puallup RiverVOIGHTS CR HATCHERY 500,000
W 2 0 0 2 0 0 0Chambers CreekGARRISON HATCHERY NA
H 12 0 10,000 0 0 12 0Dungeness RiverDUNGENESS HATCHERY 11,000
H 409 0 0 0 0 409 0Elwha RiverELWHA HATCHERY NA
Total 3,160Puget Sound Region 4 2,811,000 2,821,000 1,430 4 1,730 0
Coastal Region
W 47 0 63,000 5 0 42 0Soleduck RiverSOLDUC HATCHERY 80,000
H 3,880 0 675,000 0 0 3,880 0Bogachiel RiverBOGACHIEL HATCHERY 900,000
H 1,426 0 205,000 0 0 1,426 0Humptulips RiverHUMPTULIPS HATCHERY 140,000
2001-2002 Final Hatchery Escapement Report Page 30 March 17, 2003
Facility Bo Adults Jacks Eggtake Adults Jacks Adults Jacks
Trapped less releasedReleased to streamTotal Trapped
Stock
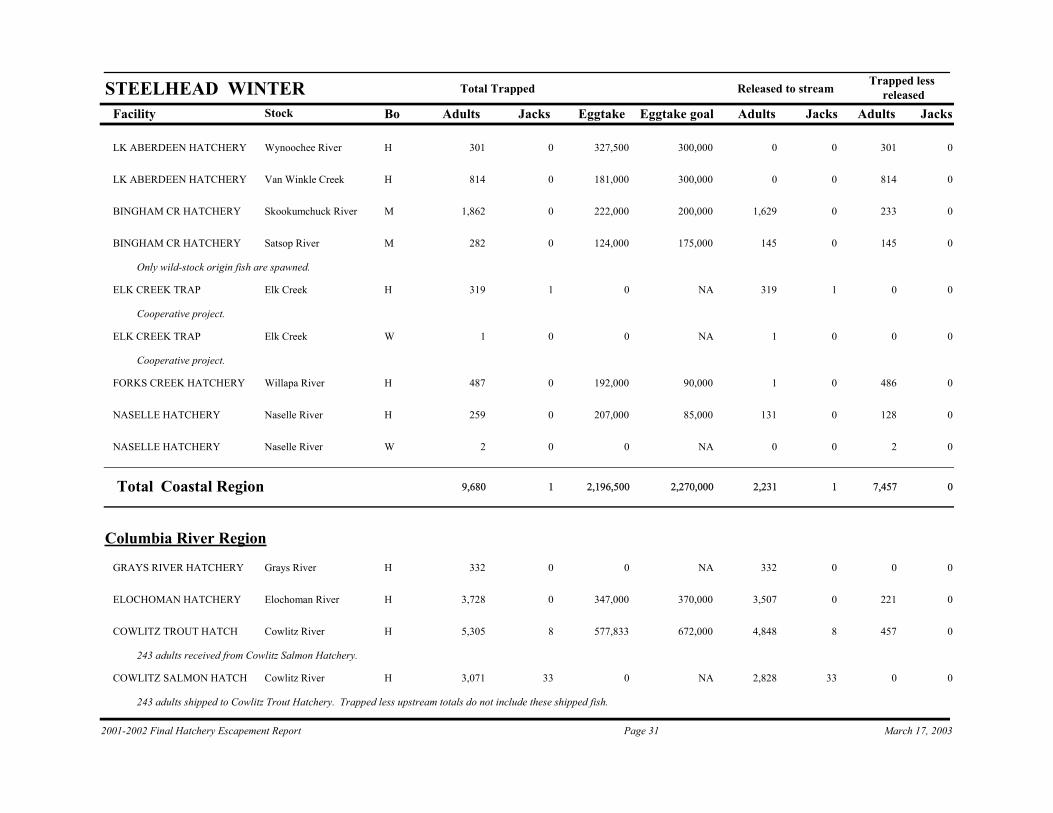
STEELHEAD WINTEREggtake goal
H 301 0 327,500 0 0 301 0Wynoochee RiverLK ABERDEEN HATCHERY 300,000
H 814 0 181,000 0 0 814 0Van Winkle CreekLK ABERDEEN HATCHERY 300,000
M 1,862 0 222,000 1,629 0 233 0Skookumchuck RiverBINGHAM CR HATCHERY 200,000
M 282 0 124,000 145 0 145 0Satsop RiverBINGHAM CR HATCHERY
Only wild-stock origin fish are spawned.
175,000
H 319 1 0 319 1 0 0Elk CreekELK CREEK TRAP
Cooperative project.
NA
W 1 0 0 1 0 0 0Elk CreekELK CREEK TRAP
Cooperative project.
NA
H 487 0 192,000 1 0 486 0Willapa RiverFORKS CREEK HATCHERY 90,000
H 259 0 207,000 131 0 128 0Naselle RiverNASELLE HATCHERY 85,000
W 2 0 0 0 0 2 0Naselle RiverNASELLE HATCHERY NA
Total 9,680Coastal Region 1 2,196,500 2,270,000 2,231 1 7,457 0
Columbia River Region
H 332 0 0 332 0 0 0Grays RiverGRAYS RIVER HATCHERY NA
H 3,728 0 347,000 3,507 0 221 0Elochoman RiverELOCHOMAN HATCHERY 370,000
H 5,305 8 577,833 4,848 8 457 0Cowlitz RiverCOWLITZ TROUT HATCH
243 adults received from Cowlitz Salmon Hatchery.
672,000
H 3,071 33 0 2,828 33 0 0Cowlitz RiverCOWLITZ SALMON HATCH
243 adults shipped to Cowlitz Trout Hatchery. Trapped less upstream totals do not include these shipped fish.
NA
2001-2002 Final Hatchery Escapement Report Page 31 March 17, 2003
Facility Bo Adults Jacks Eggtake Adults Jacks Adults Jacks
Trapped less releasedReleased to streamTotal Trapped
Stock
STEELHEAD WINTEREggtake goal
W 305 1 0 305 1 0 0Cowlitz RiverCOWLITZ SALMON HATCH NA
H 2,701 0 139,531 2,098 0 603 0Kalama RiverKALAMA FALLS HATCHRY 90,000
M 964 0 0 300 0 664 0Kalama RiverKALAMA FALLS HATCHRY NA
W 1,448 0 81,117 1,448 0 0 0Kalama RiverKALAMA FALLS HATCHRY 45,000
H 4,521 4 0 4,014 3 507 1Lewis RiverLEWIS RIVER HATCHERY
Trapped at Merwin Dam and Lewis Ladder. 406 adults and 1 jack shipped to Merwin Hatchery.
NA
W 25 0 0 25 0 0 0Lewis RiverLEWIS RIVER HATCHERY NA
H 406 1 319,500 0 0 406 1Lewis RiverMERWIN HATCHERY
406 adults and 1 jack received from Merwin Dam and Lewis Ladder.
250,000
H 1,090 0 479,500 366 0 724 0SkamaniaSKAMANIA HATCHERY 400,000
Total 23,896Columbia River Region 47 1,944,481 1,827,000 20,071 45 3,582 2
Total Statewide 36,736 52 6,951,981 6,918,000 23,732 50 12,769 2
2001-2002 Final Hatchery Escapement Report Page 32 March 17, 2003
Facility Bo Adults Jacks Eggtake Adults Jacks Adults Jacks
Trapped less releasedReleased to streamTotal Trapped
Stock
STEELHEAD WINTER-LATEEggtake goal
Columbia River Region
H 0 0 1,110,069 380 0 380 0Cowlitz RiverCOWLITZ TROUT HATCH
760 adults received from Cowlitz Salmon Hatchery.
1,108,000
H 4,420 1 0 3,662 1 0 0Cowlitz RiverCOWLITZ SALMON HATCH
760 adults shipped to Cowlitz Trout Hatchery. Trapped less upstream totals do not include these shipped fish.
NA
W 501 2 0 501 2 0 0Cowlitz RiverCOWLITZ SALMON HATCH NA
Total 4,921Columbia River Region 3 1,110,069 1,108,000 4,543 3 380 0
Total Statewide 4,921 3 1,110,069 1,108,000 4,543 3 380 0
2001-2002 Final Hatchery Escapement Report Page 33 March 17, 2003
Facility Bo Adults Jacks Eggtake Adults Jacks Adults Jacks
Trapped less releasedReleased to streamTotal Trapped
Stock
CUTTHROAT NAEggtake goal
Coastal Region
W 5 0 0 5 0 0 0Satsop RiverBINGHAM CR HATCHERY NA
Total 5Coastal Region 0 0 NA 5 0 0 0
Total Statewide 5 0 0 NA 5 0 0 0
2001-2002 Final Hatchery Escapement Report Page 34 March 17, 2003
Facility Bo Adults Jacks Eggtake Adults Jacks Adults Jacks
Trapped less releasedReleased to streamTotal Trapped
Stock
CUTTHROAT WESTSLOPEEggtake goal
Columbia River Region
M 3,809 0 1,015,548 3,744 0 65 0Twin LakesCHELAN HATCHERY 700,000
H 696 0 845,130 636 0 60 0Lake Lenore LahontenOMAK HATCHERY 591,000
W 900 0 312,517 900 0 0 0Kings LakeCOLVILLE HATCHERY 500,000
Total 5,405Columbia River Region 0 2,173,195 1,791,000 5,280 0 125 0
Total Statewide 5,405 0 2,173,195 1,791,000 5,280 0 125 0
2001-2002 Final Hatchery Escapement Report Page 35 March 17, 2003
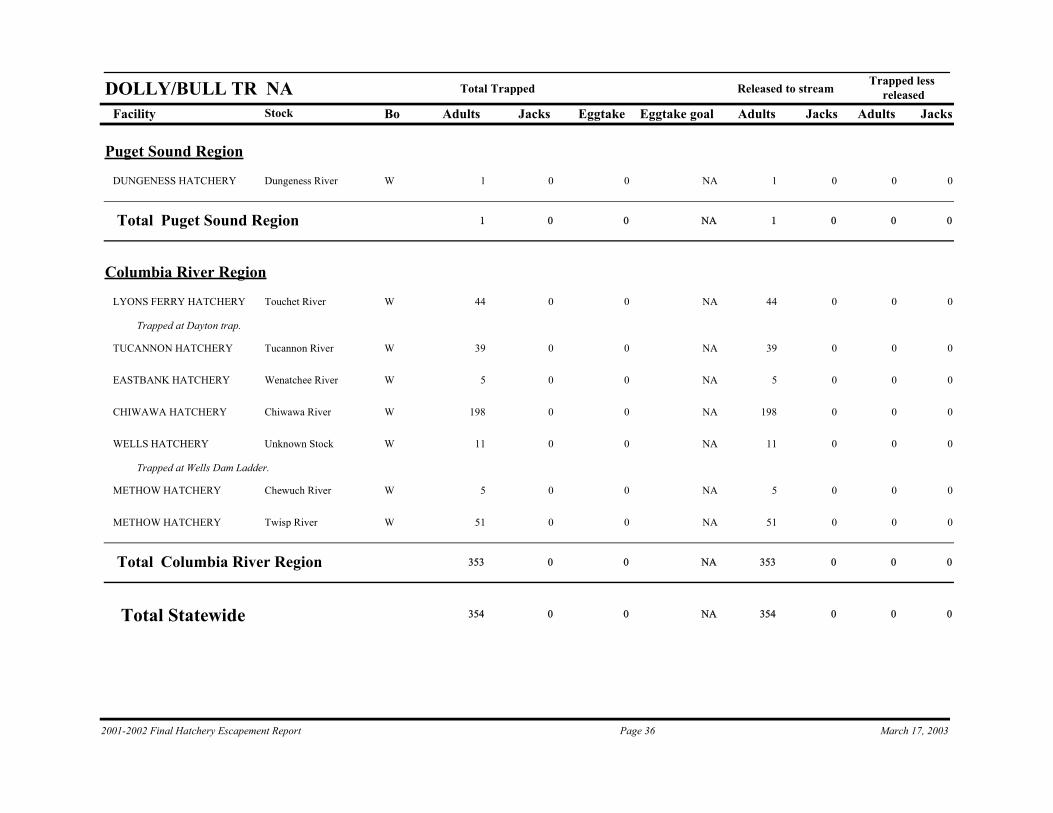
Facility Bo Adults Jacks Eggtake Adults Jacks Adults Jacks
Trapped less releasedReleased to streamTotal Trapped
Stock
DOLLY/BULL TR NAEggtake goal
Puget Sound Region
W 1 0 0 1 0 0 0Dungeness RiverDUNGENESS HATCHERY NA
Total 1Puget Sound Region 0 0 NA 1 0 0 0
Columbia River Region
W 44 0 0 44 0 0 0Touchet RiverLYONS FERRY HATCHERY
Trapped at Dayton trap.
NA
W 39 0 0 39 0 0 0Tucannon RiverTUCANNON HATCHERY NA
W 5 0 0 5 0 0 0Wenatchee RiverEASTBANK HATCHERY NA
W 198 0 0 198 0 0 0Chiwawa RiverCHIWAWA HATCHERY NA
W 11 0 0 11 0 0 0Unknown StockWELLS HATCHERY
Trapped at Wells Dam Ladder.
NA
W 5 0 0 5 0 0 0Chewuch RiverMETHOW HATCHERY NA
W 51 0 0 51 0 0 0Twisp RiverMETHOW HATCHERY NA
Total 353Columbia River Region 0 0 NA 353 0 0 0
Total Statewide 354 0 0 NA 354 0 0 0
2001-2002 Final Hatchery Escapement Report Page 36 March 17, 2003
Facility Bo Adults Jacks Eggtake Adults Jacks Adults Jacks
Trapped less releasedReleased to streamTotal Trapped
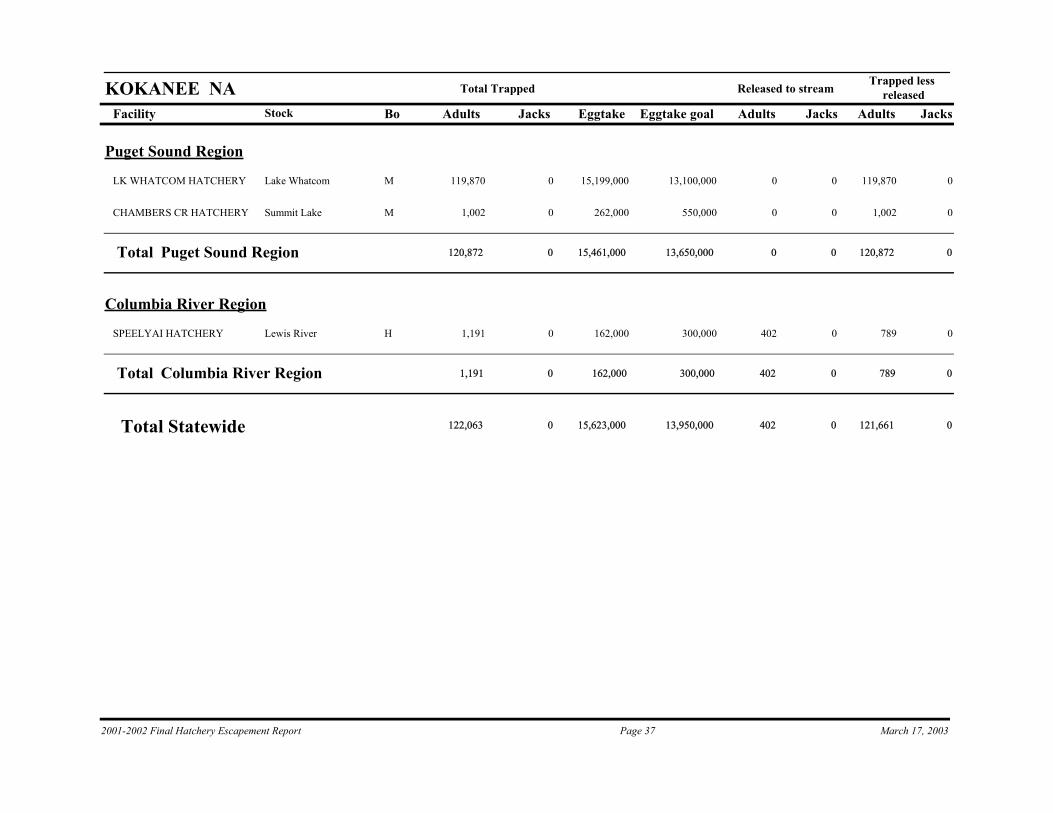
Stock
KOKANEE NAEggtake goal
Puget Sound Region
M 119,870 0 15,199,000 0 0 119,870 0Lake WhatcomLK WHATCOM HATCHERY 13,100,000
M 1,002 0 262,000 0 0 1,002 0Summit LakeCHAMBERS CR HATCHERY 550,000
Total 120,872Puget Sound Region 0 15,461,000 13,650,000 0 0 120,872 0
Columbia River Region
H 1,191 0 162,000 402 0 789 0Lewis RiverSPEELYAI HATCHERY 300,000
Total 1,191Columbia River Region 0 162,000 300,000 402 0 789 0
Total Statewide 122,063 0 15,623,000 13,950,000 402 0 121,661 0
2001-2002 Final Hatchery Escapement Report Page 37 March 17, 2003
Facility Bo Adults Jacks Eggtake Adults Jacks Adults Jacks
Trapped less releasedReleased to streamTotal Trapped
Stock
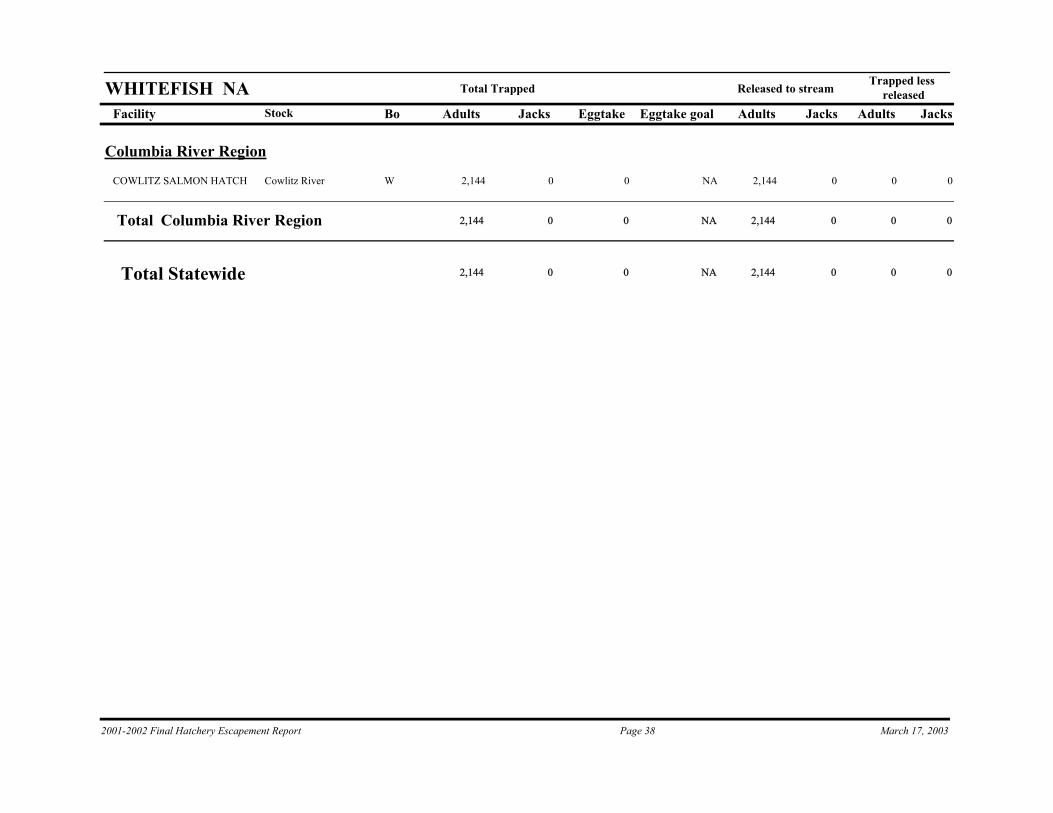
WHITEFISH NAEggtake goal
Columbia River Region
W 2,144 0 0 2,144 0 0 0Cowlitz RiverCOWLITZ SALMON HATCH NA
Total 2,144Columbia River Region 0 0 NA 2,144 0 0 0
Total Statewide 2,144 0 0 NA 2,144 0 0 0
2001-2002 Final Hatchery Escapement Report Page 38 March 17, 2003