2001 _ cherokee county _ jacksonville isd _ 2001 texas school survey of drug and alcohol use _...
Upload: texas-school-survey-of-drug-and-alcohol-use-elementary-reports
Post on 14-Apr-2018
216 views
TRANSCRIPT

7/30/2019 2001 _ cherokee county _ jacksonville isd _ 2001 texas school survey of drug and alcohol use _ elementary report
http://slidepdf.com/reader/full/2001-cherokee-county-jacksonville-isd-2001-texas-school-survey-of-drug 1/53
7/30/2019 2001 _ cherokee county _ jacksonville isd _ 2001 texas school survey of drug and alcohol use _ elementary report
http://slidepdf.com/reader/full/2001-cherokee-county-jacksonville-isd-2001-texas-school-survey-of-drug 2/53
JacksonvilleSpring 2001
______________________________________________________________________________________________
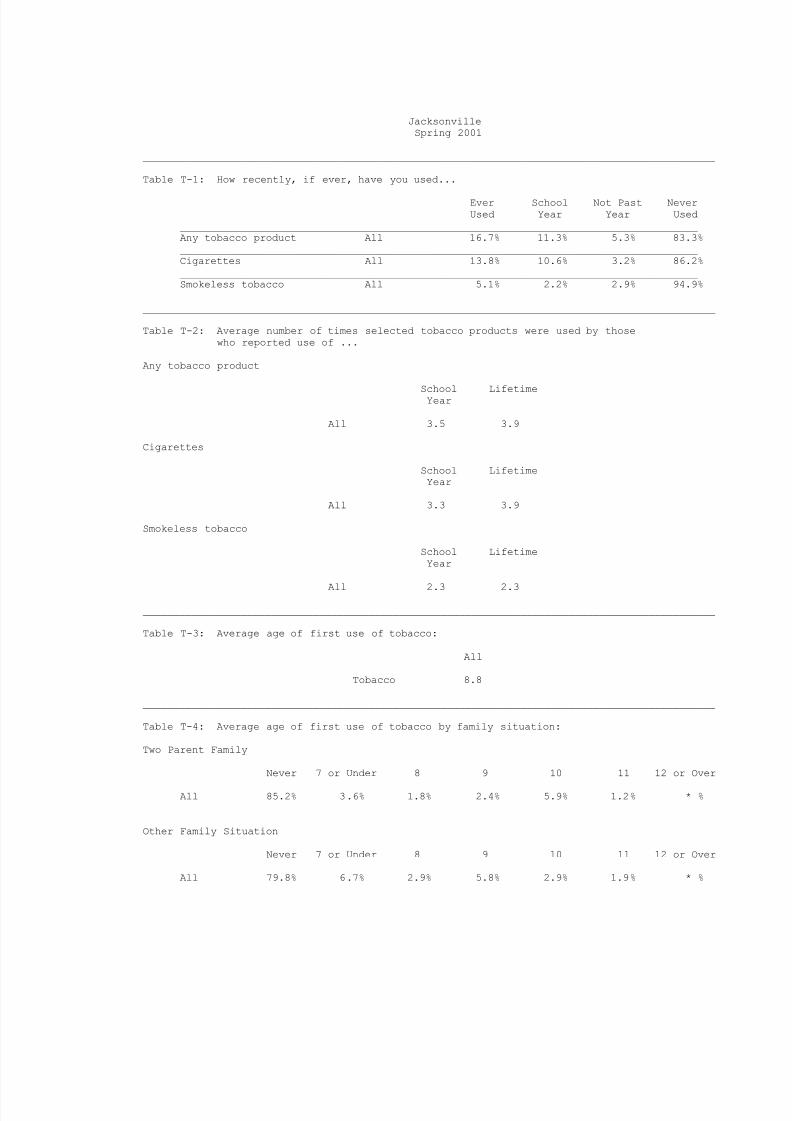
Table T-1: How recently, if ever, have you used...
Ever School Not Past NeverUsed Year Year Used
_____________________________________________________________________________________Any tobacco product All 16.7% 11.3% 5.3% 83.3%_____________________________________________________________________________________Cigarettes All 13.8% 10.6% 3.2% 86.2%_____________________________________________________________________________________Smokeless tobacco All 5.1% 2.2% 2.9% 94.9%
______________________________________________________________________________________________
Table T-2: Average number of times selected tobacco products were used by thosewho reported use of ...
Any tobacco product
School LifetimeYear
All 3.5 3.9
Cigarettes
School LifetimeYear
All 3.3 3.9
Smokeless tobacco
School LifetimeYear
All 2.3 2.3
______________________________________________________________________________________________
Table T-3: Average age of first use of tobacco:
All
Tobacco 8.8
______________________________________________________________________________________________
Table T-4: Average age of first use of tobacco by family situation:
Two Parent Family
Never 7 or Under 8 9 10 11 12 or Over
All 85.2% 3.6% 1.8% 2.4% 5.9% 1.2% * %
Other Family Situation
Never 7 or Under 8 9 10 11 12 or Over
All 79.8% 6.7% 2.9% 5.8% 2.9% 1.9% * %
7/30/2019 2001 _ cherokee county _ jacksonville isd _ 2001 texas school survey of drug and alcohol use _ elementary report
http://slidepdf.com/reader/full/2001-cherokee-county-jacksonville-isd-2001-texas-school-survey-of-drug 3/53
JacksonvilleSpring 2001
______________________________________________________________________________________________
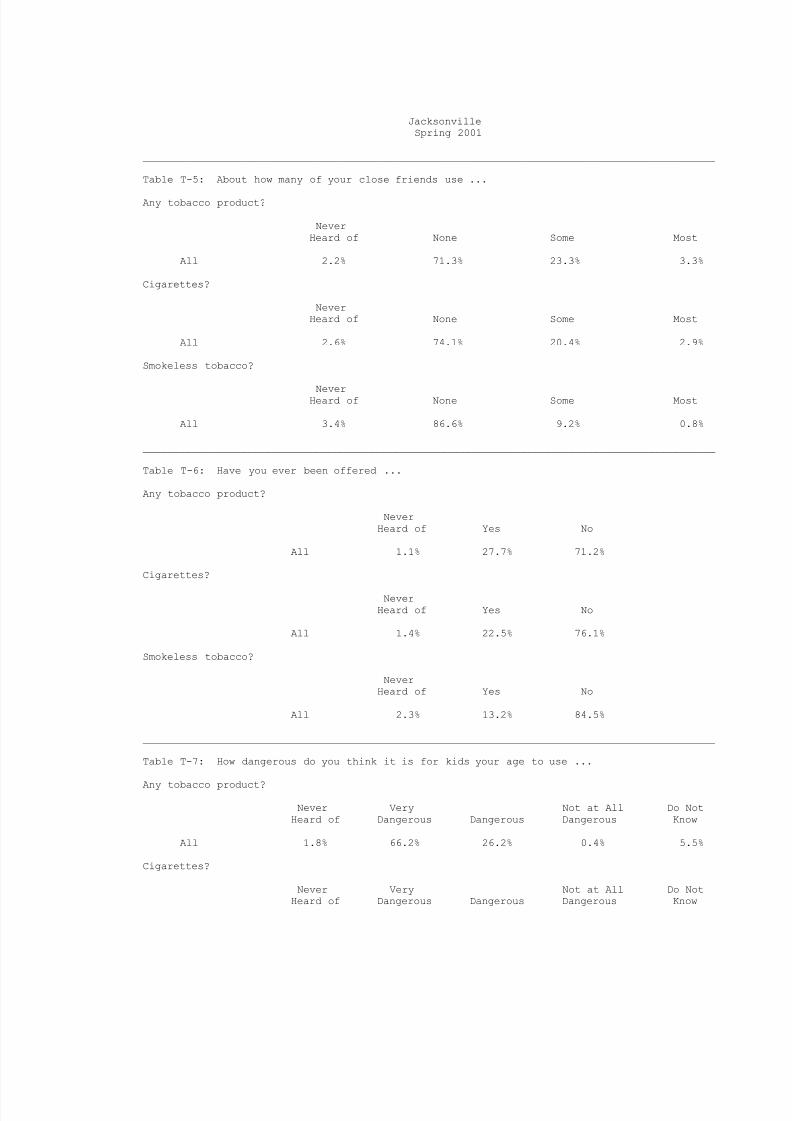
Table T-5: About how many of your close friends use ...
Any tobacco product?
NeverHeard of None Some Most
All 2.2% 71.3% 23.3% 3.3%
Cigarettes?
NeverHeard of None Some Most
All 2.6% 74.1% 20.4% 2.9%
Smokeless tobacco?
NeverHeard of None Some Most
All 3.4% 86.6% 9.2% 0.8%
______________________________________________________________________________________________
Table T-6: Have you ever been offered ...
Any tobacco product?
NeverHeard of Yes No
All 1.1% 27.7% 71.2%
Cigarettes?
NeverHeard of Yes No
All 1.4% 22.5% 76.1%
Smokeless tobacco?
NeverHeard of Yes No
All 2.3% 13.2% 84.5%
______________________________________________________________________________________________
Table T-7: How dangerous do you think it is for kids your age to use ...
Any tobacco product?
Never Very Not at All Do NotHeard of Dangerous Dangerous Dangerous Know
All 1.8% 66.2% 26.2% 0.4% 5.5%
Cigarettes?
Never Very Not at All Do NotHeard of Dangerous Dangerous Dangerous Know

7/30/2019 2001 _ cherokee county _ jacksonville isd _ 2001 texas school survey of drug and alcohol use _ elementary report
http://slidepdf.com/reader/full/2001-cherokee-county-jacksonville-isd-2001-texas-school-survey-of-drug 4/53
All 2.2% 53.5% 36.3% 0.7% 7.3%

7/30/2019 2001 _ cherokee county _ jacksonville isd _ 2001 texas school survey of drug and alcohol use _ elementary report
http://slidepdf.com/reader/full/2001-cherokee-county-jacksonville-isd-2001-texas-school-survey-of-drug 5/53
JacksonvilleSpring 2001
______________________________________________________________________________________________
Smokeless tobacco?
Never Very Not at All Do NotHeard of Dangerous Dangerous Dangerous Know
All 3.0% 61.6% 27.6% 1.5% 6.3%

7/30/2019 2001 _ cherokee county _ jacksonville isd _ 2001 texas school survey of drug and alcohol use _ elementary report
http://slidepdf.com/reader/full/2001-cherokee-county-jacksonville-isd-2001-texas-school-survey-of-drug 6/53

7/30/2019 2001 _ cherokee county _ jacksonville isd _ 2001 texas school survey of drug and alcohol use _ elementary report
http://slidepdf.com/reader/full/2001-cherokee-county-jacksonville-isd-2001-texas-school-survey-of-drug 7/53
JacksonvilleSpring 2001
______________________________________________________________________________________________
Table A-1: How recently, if ever, have you used...
Ever School Not Past NeverUsed Year Year Used
_____________________________________________________________________________________Any alcohol product All 30.6% 21.0% 9.6% 69.4%_____________________________________________________________________________________Beer All 20.3% 14.9% 5.3% 79.7%_____________________________________________________________________________________Wine coolers All 17.1% 10.5% 6.5% 82.9%_____________________________________________________________________________________Wine All 11.2% 8.6% 2.5% 88.8%_____________________________________________________________________________________Liquor All 9.1% 5.5% 3.6% 90.9%
______________________________________________________________________________________________
Table A-2: Average number of times selected alcohol products were used by those
who reported use of ...
Any alcohol product
School LifetimeYear
All 5.4 5.7
Beer
School LifetimeYear
All * 3.3
Liquor
School LifetimeYear
All 2.8 2.8
Wine
School LifetimeYear
All 2.1 3.3
Wine coolers
School LifetimeYear
All 3.5 3.2

7/30/2019 2001 _ cherokee county _ jacksonville isd _ 2001 texas school survey of drug and alcohol use _ elementary report
http://slidepdf.com/reader/full/2001-cherokee-county-jacksonville-isd-2001-texas-school-survey-of-drug 8/53
JacksonvilleSpring 2001
______________________________________________________________________________________________
Table A-3: In the past year, how many times have you had two or more drinks at one time of ...
Beer?
Never 1 Time 2 Times 3+ Times Ever
All 82.5% 8.4% 6.6% 2.6% 17.5%
Wine Coolers?
Never 1 Time 2 Times 3+ Times Ever
All 85.9% 8.2% 3.0% 3.0% 14.1%
Wine?
Never 1 Time 2 Times 3+ Times Ever
All 88.6% 6.4% 3.8% 1.1% 11.4%
Liquor?
Never 1 Time 2 Times 3+ Times Ever
All 94.4% 4.1% 1.1% 0.4% 5.6%
______________________________________________________________________________________________
Table A-4: Average age of first use of alcohol:
All
Alcohol 8.7Beer 8.6Wine Coolers 9.1
Wine 8.9Liquor 9.4
______________________________________________________________________________________________
Table A-5: Average age of first use of alcohol by family situation:
Two Parent Family
Never 7 or Under 8 9 10 11 12 or Over
All 72.7% 7.6% 4.7% 5.2% 8.7% 1.2% * %
Other Family Situation
Never 7 or Under 8 9 10 11 12 or Over
All 67.9% 7.5% 4.7% 10.4% 6.6% 2.8% * %

7/30/2019 2001 _ cherokee county _ jacksonville isd _ 2001 texas school survey of drug and alcohol use _ elementary report
http://slidepdf.com/reader/full/2001-cherokee-county-jacksonville-isd-2001-texas-school-survey-of-drug 9/53
JacksonvilleSpring 2001
______________________________________________________________________________________________
Table A-6: Lifetime prevalence of use of alcohol by reported conduct problems this
school year:
No Absences or Cut Sent toConduct Problems School Principal Both
Alcohol 18.3% 50.0% 44.9% 71.4%
______________________________________________________________________________________________
Table A-7: When you drink alcohol, do you get it from ...
Home?
Don'tDrink Yes No
All 70.8% 13.1% 16.1%
Friends?
Don'tDrink Yes No
All 74.1% 5.8% 20.2%
Somewhere else?
Don'tDrink Yes No
All 70.9% 12.7% 16.3%
______________________________________________________________________________________________
Table A-8: About how many of your close friends use ...
Any alcohol product?
NeverHeard of None Some Most
All 1.8% 65.7% 25.3% 7.2%
Beer?
NeverHeard of None Some Most
All 1.9% 71.9% 21.3% 4.9%
Wine coolers?
NeverHeard of None Some Most
All 10.5% 69.2% 16.2% 4.1%
Wine?
NeverHeard of None Some Most
All 4.2% 80.9% 12.2% 2.7%

7/30/2019 2001 _ cherokee county _ jacksonville isd _ 2001 texas school survey of drug and alcohol use _ elementary report
http://slidepdf.com/reader/full/2001-cherokee-county-jacksonville-isd-2001-texas-school-survey-of-drug 10/53
JacksonvilleSpring 2001
______________________________________________________________________________________________
Liquor?
NeverHeard of None Some Most
All 6.7% 82.5% 8.6% 2.2%
______________________________________________________________________________________________
Table A-9: Have you ever been offered ...
Any alcohol product?
NeverHeard of Yes No
All 0.7% 31.7% 67.6%
Beer?
NeverHeard of Yes No
All 1.1% 25.9% 73.0%
Wine coolers?
NeverHeard of Yes No
All 9.4% 18.8% 71.8%
Wine?
Never
Heard of Yes No
All 2.6% 12.5% 84.9%
Liquor?
NeverHeard of Yes No
All 4.3% 9.7% 86.0%
______________________________________________________________________________________________
Table A-10: How do your parents feel about kids your age drinking beer?
Don't Don't Think Don'tLike It Care It's OK Know
All 75.7% 2.2% 0.7% 21.4%

7/30/2019 2001 _ cherokee county _ jacksonville isd _ 2001 texas school survey of drug and alcohol use _ elementary report
http://slidepdf.com/reader/full/2001-cherokee-county-jacksonville-isd-2001-texas-school-survey-of-drug 11/53
JacksonvilleSpring 2001
______________________________________________________________________________________________
Table A-11: How dangerous do you think it is for kids your age to use ...
Any alcohol product?
Never Very Not at All Do NotHeard of Dangerous Dangerous Dangerous Know
All 1.8% 67.9% 22.3% 2.2% 5.8%
Beer?
Never Very Not at All Do NotHeard of Dangerous Dangerous Dangerous Know
All 1.8% 46.9% 39.1% 3.3% 8.9%
Wine coolers?
Never Very Not at All Do NotHeard of Dangerous Dangerous Dangerous Know
All 9.4% 42.1% 27.4% 7.1% 13.9%
Wine?
Never Very Not at All Do NotHeard of Dangerous Dangerous Dangerous Know
All 3.4% 47.3% 31.1% 4.5% 13.6%
Liquor?
Never Very Not at All Do NotHeard of Dangerous Dangerous Dangerous Know
All 5.4% 66.7% 19.5% 1.5% 6.9%

7/30/2019 2001 _ cherokee county _ jacksonville isd _ 2001 texas school survey of drug and alcohol use _ elementary report
http://slidepdf.com/reader/full/2001-cherokee-county-jacksonville-isd-2001-texas-school-survey-of-drug 12/53

7/30/2019 2001 _ cherokee county _ jacksonville isd _ 2001 texas school survey of drug and alcohol use _ elementary report
http://slidepdf.com/reader/full/2001-cherokee-county-jacksonville-isd-2001-texas-school-survey-of-drug 13/53
JacksonvilleSpring 2001
______________________________________________________________________________________________
Table D-1: How recently, if ever, have you used...
Ever School Not Past NeverUsed Year Year Used
_____________________________________________________________________________________Marijuana All 1.8% 1.8% * % 98.2%
______________________________________________________________________________________________
Table D-2: Average number of times marijuana was used by those reporting usage:
School LifetimeYear
All 4.4 5.1
______________________________________________________________________________________________
Table D-3: Average age of first use of marijuana:
All
Marijuana *
______________________________________________________________________________________________
Table D-4: Average age of first use of marijuana by family situation:
Two Parent Family
Never 7 or Under 8 9 10 11 12 or Over
All 99.4% * % * % * % 0.6% * % * %
Other Family Situation
Never 7 or Under 8 9 10 11 12 or Over
All 97.0% * % * % 1.0% * % 2.0% * %
______________________________________________________________________________________________
Table D-5: Lifetime prevalence of use of marijuana by reported conduct problems thisschool year:
No Absences or Cut Sent toConduct Problems School Principal Both
Marijuana * % * % 4.0% * %
______________________________________________________________________________________________
Table D-6: About how many of your close friends use marijuana?
NeverHeard of None Some Most
All 6.0% 86.5% 6.4% 1.1%

7/30/2019 2001 _ cherokee county _ jacksonville isd _ 2001 texas school survey of drug and alcohol use _ elementary report
http://slidepdf.com/reader/full/2001-cherokee-county-jacksonville-isd-2001-texas-school-survey-of-drug 14/53
JacksonvilleSpring 2001
______________________________________________________________________________________________
Table D-7: Have you ever been offered marijuana?
NeverHeard of Yes No
All 4.9% 7.9% 87.2%
______________________________________________________________________________________________
Table D-8: How do your parents feel about kids your age smoking marijuana?
Don't Don't Think Don'tLike It Care It's OK Know
All 82.0% 0.7% 0.4% 16.9%
______________________________________________________________________________________________
Table D-9: How dangerous do you think it is for kids your age to use marijuana?
Never Very Not at All Do NotHeard of Dangerous Dangerous Dangerous Know
All 5.9% 78.8% 9.7% 0.7% 4.8%

7/30/2019 2001 _ cherokee county _ jacksonville isd _ 2001 texas school survey of drug and alcohol use _ elementary report
http://slidepdf.com/reader/full/2001-cherokee-county-jacksonville-isd-2001-texas-school-survey-of-drug 15/53
JacksonvilleSpring 2001
______________________________________________________________________________________________
Table I-1: How recently, if ever, have you used...
Ever School Not Past NeverUsed Year Year Used
_____________________________________________________________________________________Inhalants All 11.2% 9.7% 1.4% 88.8%
______________________________________________________________________________________________
Table I-2: Have you ever sniffed any of the following inhalants to get high?
Correction Fluid/Whiteout
Not Used Used
All 98.1% 1.9%
Gasoline
Not Used Used
All 96.3% 3.7%
Glue
Not Used Used
All 98.1% 1.9%
Paint Thinner
Not Used Used
All 97.3% 2.7%
Spray Paint
Not Used Used
All 97.0% 3.0%
Other Inhalants
Not Used Used
All 94.5% 5.5%
______________________________________________________________________________________________
Table I-3: Average number of times inhalants were used by those reporting usage:
School Lifetime
Year
All 3.8 3.3

7/30/2019 2001 _ cherokee county _ jacksonville isd _ 2001 texas school survey of drug and alcohol use _ elementary report
http://slidepdf.com/reader/full/2001-cherokee-county-jacksonville-isd-2001-texas-school-survey-of-drug 16/53
JacksonvilleSpring 2001
______________________________________________________________________________________________
Table I-4: Number of different kinds of inhalants used:
0 1 2-3 4+
All 89.9% 6.3% 3.1% 0.7%
______________________________________________________________________________________________
Table I-5: Average age of first use of inhalants:
All
Inhalants 9.6
______________________________________________________________________________________________
Table I-6: Average age of first use of inhalants by family situation:
Two Parent Family
Never 7 or Under 8 9 10 11 12 or Over
All 96.9% * % 0.6% 1.2% 1.2% * % * %
Other Family Situation
Never 7 or Under 8 9 10 11 12 or Over
All 91.1% 1.0% 1.0% 1.0% 2.0% 4.0% * %
______________________________________________________________________________________________
Table I-7: Lifetime prevalence of use of inhalants by reported conduct problems thisschool year:
No Absences or Cut Sent toConduct Problems School Principal Both
Inhalants 2.5% 16.7% 11.7% 28.6%
______________________________________________________________________________________________
Table I-8: About how many of your close friends use inhalants?
NeverHeard of None Some Most
All 4.5% 83.8% 9.4% 2.3%
______________________________________________________________________________________________
Table I-9: Have you ever been offered inhalants?
NeverHeard of Yes No
All 4.6% 7.3% 88.2%

7/30/2019 2001 _ cherokee county _ jacksonville isd _ 2001 texas school survey of drug and alcohol use _ elementary report
http://slidepdf.com/reader/full/2001-cherokee-county-jacksonville-isd-2001-texas-school-survey-of-drug 17/53
JacksonvilleSpring 2001
______________________________________________________________________________________________
Table I-10: How dangerous do you think it is for kids your age to use inhalants?
Never Very Not at All Do NotHeard of Dangerous Dangerous Dangerous Know
All 5.3% 72.5% 14.0% 0.8% 7.5%

7/30/2019 2001 _ cherokee county _ jacksonville isd _ 2001 texas school survey of drug and alcohol use _ elementary report
http://slidepdf.com/reader/full/2001-cherokee-county-jacksonville-isd-2001-texas-school-survey-of-drug 18/53

7/30/2019 2001 _ cherokee county _ jacksonville isd _ 2001 texas school survey of drug and alcohol use _ elementary report
http://slidepdf.com/reader/full/2001-cherokee-county-jacksonville-isd-2001-texas-school-survey-of-drug 19/53
JacksonvilleSpring 2001
______________________________________________________________________________________________
Table X-1: Since school began in the fall, have you gotten information on drugs
or alcohol from ...
An Assembly Program?
No Yes
All 23.3% 76.7%
Guidance Counselor?
No Yes
All 58.7% 41.3%
Visitor to Class?
No Yes
All 13.4% 86.6%
Someone Else at School?
No Yes
All 59.5% 40.5%
Your Teacher?
No Yes
All 46.8% 53.2%
Any School Source?
No Yes
All 2.9% 97.1%

7/30/2019 2001 _ cherokee county _ jacksonville isd _ 2001 texas school survey of drug and alcohol use _ elementary report
http://slidepdf.com/reader/full/2001-cherokee-county-jacksonville-isd-2001-texas-school-survey-of-drug 20/53

7/30/2019 2001 _ cherokee county _ jacksonville isd _ 2001 texas school survey of drug and alcohol use _ elementary report
http://slidepdf.com/reader/full/2001-cherokee-county-jacksonville-isd-2001-texas-school-survey-of-drug 21/53
JacksonvilleSpring 2001
Table B1: Prevalence and recency of use of selected substances by grade--> All Students
Ever School Not Past Never
Used Year Year Used_____________________________________________________________Tobacco All 16.7% 11.3% 5.3% 83.3%_____________________________________________________________Alcohol All 30.6% 21.0% 9.6% 69.4%_____________________________________________________________Inhalants All 11.2% 9.7% 1.4% 88.8%_____________________________________________________________Marijuana All 1.8% 1.8% * % 98.2%_____________________________________________________________
Table B2: Prevalence and recency of use of selected substances by grade--> Male Students
Ever School Not Past NeverUsed Year Year Used
_____________________________________________________________Tobacco All 22.9% 15.3% 7.6% 77.1%_____________________________________________________________Alcohol All 34.1% 22.7% 11.4% 65.9%_____________________________________________________________Inhalants All 14.0% 11.6% 2.3% 86.0%_____________________________________________________________Marijuana All 2.3% 2.3% * % 97.7%_____________________________________________________________
Table B3: Prevalence and recency of use of selected substances by grade--> Female Students
Ever School Not Past NeverUsed Year Year Used
_____________________________________________________________
Tobacco All 11.3% 7.9% 3.3% 88.7%_____________________________________________________________Alcohol All 27.5% 19.5% 8.1% 72.5%_____________________________________________________________Inhalants All 8.7% 8.1% 0.7% 91.3%_____________________________________________________________Marijuana All 1.3% 1.3% * % 98.7%_____________________________________________________________
Table B4: Prevalence and recency of use of selected substances by grade--> White Students
Ever School Not Past NeverUsed Year Year Used
_____________________________________________________________Tobacco All 16.4% 10.0% 6.4% 83.6%
_____________________________________________________________Alcohol All 25.4% 15.9% 9.4% 74.6%_____________________________________________________________Inhalants All 8.6% 7.2% 1.4% 91.4%_____________________________________________________________Marijuana All 0.7% 0.7% * % 99.3%_____________________________________________________________

7/30/2019 2001 _ cherokee county _ jacksonville isd _ 2001 texas school survey of drug and alcohol use _ elementary report
http://slidepdf.com/reader/full/2001-cherokee-county-jacksonville-isd-2001-texas-school-survey-of-drug 22/53
JacksonvilleSpring 2001
Table B5: Prevalence and recency of use of selected substances by grade--> African/American Students
Ever School Not Past Never
Used Year Year Used_____________________________________________________________Tobacco All 12.5% 7.5% 5.0% 87.5%_____________________________________________________________Alcohol All 41.0% 23.1% 17.9% 59.0%_____________________________________________________________Inhalants All 7.9% 7.9% * % 92.1%_____________________________________________________________Marijuana All 2.6% 2.6% * % 97.4%_____________________________________________________________
Table B6: Prevalence and recency of use of selected substances by grade--> Mexican/American Students
Ever School Not Past NeverUsed Year Year Used
_____________________________________________________________Tobacco All 22.1% 17.6% 4.4% 77.9%_____________________________________________________________Alcohol All 40.0% 30.0% 10.0% 60.0%_____________________________________________________________Inhalants All 14.7% 14.7% * % 85.3%_____________________________________________________________Marijuana All 2.9% 2.9% * % 97.1%_____________________________________________________________
Table B7: Prevalence and recency of use of selected substances by grade--> Students Reporting A and B Grades
Ever School Not Past NeverUsed Year Year Used
_____________________________________________________________
Tobacco All 15.9% 12.0% 3.9% 84.1%_____________________________________________________________Alcohol All 29.9% 20.3% 9.5% 70.1%_____________________________________________________________Inhalants All 10.4% 9.5% 0.9% 89.6%_____________________________________________________________Marijuana All 1.3% 1.3% * % 98.7%_____________________________________________________________
Table B8: Prevalence and recency of use of selected substances by grade--> Students Reporting C, D, and F Grades
Ever School Not Past NeverUsed Year Year Used
_____________________________________________________________Tobacco All 21.6% 8.1% 13.5% 78.4%
_____________________________________________________________Alcohol All 34.2% 26.3% 7.9% 65.8%_____________________________________________________________Inhalants All 16.7% 11.1% 5.6% 83.3%_____________________________________________________________Marijuana All 2.7% 2.7% * % 97.3%_____________________________________________________________

7/30/2019 2001 _ cherokee county _ jacksonville isd _ 2001 texas school survey of drug and alcohol use _ elementary report
http://slidepdf.com/reader/full/2001-cherokee-county-jacksonville-isd-2001-texas-school-survey-of-drug 23/53
JacksonvilleSpring 2001
Table B9: Prevalence and recency of use of selected substances by grade--> Students Living With 2 Parents
Ever School Not Past Never
Used Year Year Used_____________________________________________________________Tobacco All 13.5% 10.5% 2.9% 86.5%_____________________________________________________________Alcohol All 26.7% 18.0% 8.7% 73.3%_____________________________________________________________Inhalants All 10.1% 8.9% 1.2% 89.9%_____________________________________________________________Marijuana All 0.6% 0.6% * % 99.4%_____________________________________________________________
Table B10: Prevalence and recency of use of selected substances by grade--> Students Not Living With 2 Parents
Ever School Not Past NeverUsed Year Year Used
_____________________________________________________________Tobacco All 20.4% 12.0% 8.3% 79.6%_____________________________________________________________Alcohol All 37.7% 26.4% 11.3% 62.3%_____________________________________________________________Inhalants All 13.2% 11.3% 1.9% 86.8%_____________________________________________________________Marijuana All 3.8% 3.8% * % 96.2%_____________________________________________________________
Table B11: Prevalence and recency of use of selected substances by grade--> Students Living in Town More Than 3 Years
Ever School Not Past NeverUsed Year Year Used
_____________________________________________________________
Tobacco All 16.4% 12.4% 4.0% 83.6%_____________________________________________________________Alcohol All 31.6% 21.3% 10.2% 68.4%_____________________________________________________________Inhalants All 10.4% 9.0% 1.4% 89.6%_____________________________________________________________Marijuana All 2.2% 2.2% * % 97.8%_____________________________________________________________
Table B12: Prevalence and recency of use of selected substances by grade--> Students Living in Town 3 Years or Less
Ever School Not Past NeverUsed Year Year Used
_____________________________________________________________Tobacco All 18.8% 9.4% 9.4% 81.3%
_____________________________________________________________Alcohol All 21.9% 18.8% 3.1% 78.1%_____________________________________________________________Inhalants All 18.8% 15.6% 3.1% 81.3%_____________________________________________________________Marijuana All 0.0% * % * % 100.0%_____________________________________________________________

7/30/2019 2001 _ cherokee county _ jacksonville isd _ 2001 texas school survey of drug and alcohol use _ elementary report
http://slidepdf.com/reader/full/2001-cherokee-county-jacksonville-isd-2001-texas-school-survey-of-drug 24/53
JacksonvilleSpring 2001
The FREQ Procedure
GENDER
Q1 Frequency Percent
_______________________________Female 152 52.78Male 136 47.22
GRADE LEVEL
Q2 Frequency Percent________________________________Grade 5 288 100.00
DO YOU LIVE WITH BOTH PARENTS?
Q3 Frequency Percent___________________________________No 110 38.60
Yes 175 61.40
Frequency Missing = 3
AGE
Q4 Frequency Percent______________________________________10 75 26.1311 197 68.6412 15 5.23
Frequency Missing = 1
ETHNICITY
Q5 Frequency Percent_________________________________________African/American 40 14.39Asian/American 3 1.08Mexican/American 70 25.18Native/American 4 1.44Other 19 6.83White 142 51.08
Frequency Missing = 10
WHAT GRADES DO YOU USUALLY GET
Q6 Frequency Percent___________________________________
Mostly A's 115 41.97Mostly B's 120 43.80Mostly C's 29 10.58Mostly D's 6 2.19Mostly F's 4 1.46
Frequency Missing = 14

7/30/2019 2001 _ cherokee county _ jacksonville isd _ 2001 texas school survey of drug and alcohol use _ elementary report
http://slidepdf.com/reader/full/2001-cherokee-county-jacksonville-isd-2001-texas-school-survey-of-drug 25/53
The frequencies have been weighted so that theanalysis reflects the distribution of students by grade
level in the district

7/30/2019 2001 _ cherokee county _ jacksonville isd _ 2001 texas school survey of drug and alcohol use _ elementary report
http://slidepdf.com/reader/full/2001-cherokee-county-jacksonville-isd-2001-texas-school-survey-of-drug 26/53
JacksonvilleSpring 2001
The FREQ Procedure
LIVED IN THIS TOWN FOR MORE THAN 3 YEARS
Q7 Frequency Percent
___________________________________Don't Know 22 7.77No 32 11.31Yes 229 80.92
Frequency Missing = 5
EITHER PARENT GRADUATE FROM COLLEGE
Q8 Frequency Percent___________________________________Don't Know 96 34.04No 82 29.08Yes 104 36.88
Frequency Missing = 6
QUALIFY FOR A FREE/REDUCED PRICE LUNCH?
Q9 Frequency Percent___________________________________Don't Know 87 31.07No 99 35.36Yes 94 33.57
Frequency Missing = 8
PARENTS ATTEND PTA MEETINGS?
Q10 Frequency Percent___________________________________
No 156 55.32Yes 126 44.68
Frequency Missing = 6
EVER INHALED GASOLINE TO GET HIGH?
Q11a Frequency Percent_________________________________Not Used 257 96.25Used 10 3.75
Frequency Missing = 21
EVER INHALED PAINT THINNER TO GET HIGH?
Q11b Frequency Percent_________________________________Not Used 255 97.33Used 7 2.67
Frequency Missing = 26

7/30/2019 2001 _ cherokee county _ jacksonville isd _ 2001 texas school survey of drug and alcohol use _ elementary report
http://slidepdf.com/reader/full/2001-cherokee-county-jacksonville-isd-2001-texas-school-survey-of-drug 27/53
The frequencies have been weighted so that theanalysis reflects the distribution of students by grade
level in the district

7/30/2019 2001 _ cherokee county _ jacksonville isd _ 2001 texas school survey of drug and alcohol use _ elementary report
http://slidepdf.com/reader/full/2001-cherokee-county-jacksonville-isd-2001-texas-school-survey-of-drug 28/53
JacksonvilleSpring 2001
The FREQ Procedure
EVER INHALED GLUE TO GET HIGH?
Q11c Frequency Percent
_________________________________Not Used 259 98.11Used 5 1.89
Frequency Missing = 24
EVER INHALED WHITEOUT TO GET HIGH?
Q11d Frequency Percent_________________________________Not Used 261 98.12Used 5 1.88
Frequency Missing = 22
EVER INHALED SPRAY PAINT TO GET HIGH?
Q11e Frequency Percent_________________________________Not Used 258 96.99Used 8 3.01
Frequency Missing = 22
EVER USED OTHER INHALANTS TO GET HIGH?
Q11f Frequency Percent_________________________________Not Used 256 94.46Used 15 5.54
Frequency Missing = 17
CIGARETTE USE DURING LIFETIME
Q12a Frequency Percent_______________________________________Never heard of 6 2.17Never used 234 84.781-2 times 25 9.063-10 times 4 1.4511+ times 7 2.54
Frequency Missing = 12
SNUFF/CHEWING TOBACCO USE IN LIFETIME
Q12b Frequency Percent_______________________________________Never heard of 7 2.59Never used 250 92.591-2 times 11 4.073-10 times 2 0.74
Frequency Missing = 18

7/30/2019 2001 _ cherokee county _ jacksonville isd _ 2001 texas school survey of drug and alcohol use _ elementary report
http://slidepdf.com/reader/full/2001-cherokee-county-jacksonville-isd-2001-texas-school-survey-of-drug 29/53
The frequencies have been weighted so that theanalysis reflects the distribution of students by grade
level in the district

7/30/2019 2001 _ cherokee county _ jacksonville isd _ 2001 texas school survey of drug and alcohol use _ elementary report
http://slidepdf.com/reader/full/2001-cherokee-county-jacksonville-isd-2001-texas-school-survey-of-drug 30/53
JacksonvilleSpring 2001
The FREQ Procedure
BEER USE DURING LIFETIME
Q12c Frequency Percent
_______________________________________Never heard of 1 0.37Never used 218 80.151-2 times 38 13.973-10 times 10 3.6811+ times 5 1.84
Frequency Missing = 16
WINE COOLER USE DURING LIFETIME
Q12d Frequency Percent_______________________________________Never heard of 30 11.07Never used 195 71.961-2 times 36 13.28
3-10 times 4 1.4811+ times 6 2.21
Frequency Missing = 17
WINE USE DURING LIFETIME
Q12e Frequency Percent_______________________________________Never heard of 6 2.21Never used 238 87.821-2 times 20 7.383-10 times 4 1.4811+ times 3 1.11
Frequency Missing = 17
LIQUOR USE DURING LIFETIME
Q12f Frequency Percent_______________________________________Never heard of 20 7.41Never used 227 84.071-2 times 18 6.673-10 times 4 1.4811+ times 1 0.37
Frequency Missing = 18
INHALANT USE DURING LIFETIME
Q12h Frequency Percent_______________________________________Never heard of 14 5.17Never used 241 88.931-2 times 12 4.433-10 times 2 0.7411+ times 2 0.74
Frequency Missing = 17

7/30/2019 2001 _ cherokee county _ jacksonville isd _ 2001 texas school survey of drug and alcohol use _ elementary report
http://slidepdf.com/reader/full/2001-cherokee-county-jacksonville-isd-2001-texas-school-survey-of-drug 31/53
The frequencies have been weighted so that theanalysis reflects the distribution of students by grade
level in the district

7/30/2019 2001 _ cherokee county _ jacksonville isd _ 2001 texas school survey of drug and alcohol use _ elementary report
http://slidepdf.com/reader/full/2001-cherokee-county-jacksonville-isd-2001-texas-school-survey-of-drug 32/53
JacksonvilleSpring 2001
The FREQ Procedure
MARIJUANA USE DURING LIFETIME
Q12i Frequency Percent
_______________________________________Never heard of 11 4.09Never used 254 94.421-2 times 2 0.743-10 times 1 0.3711+ times 1 0.37
Frequency Missing = 19
CIGARETTE USE IN PAST SCHOOL YEAR
Q13a Frequency Percent_______________________________________Never heard of 5 1.79Never used 244 87.461-2 times 23 8.24
3-10 times 3 1.0811+ times 4 1.43
Frequency Missing = 9
SNUFF/CHEWING TOBACCO USE IN PAST YEAR
Q13b Frequency Percent_______________________________________Never heard of 6 2.23Never used 257 95.541-2 times 5 1.863-10 times 1 0.37
Frequency Missing = 19
BEER USE IN PAST SCHOOL YEAR
Q13c Frequency Percent_______________________________________Never heard of 2 0.73Never used 229 83.881-2 times 32 11.723-10 times 7 2.5611+ times 3 1.10
Frequency Missing = 15
WINE COOLER USE IN PAST SCHOOL YEAR
Q13d Frequency Percent
_______________________________________Never heard of 31 11.70Never used 205 77.361-2 times 20 7.553-10 times 6 2.2611+ times 3 1.13
Frequency Missing = 23

7/30/2019 2001 _ cherokee county _ jacksonville isd _ 2001 texas school survey of drug and alcohol use _ elementary report
http://slidepdf.com/reader/full/2001-cherokee-county-jacksonville-isd-2001-texas-school-survey-of-drug 33/53
The frequencies have been weighted so that theanalysis reflects the distribution of students by grade
level in the district

7/30/2019 2001 _ cherokee county _ jacksonville isd _ 2001 texas school survey of drug and alcohol use _ elementary report
http://slidepdf.com/reader/full/2001-cherokee-county-jacksonville-isd-2001-texas-school-survey-of-drug 34/53
JacksonvilleSpring 2001
The FREQ Procedure
WINE USE IN PAST SCHOOL YEAR
Q13e Frequency Percent
_______________________________________Never heard of 7 2.62Never used 236 88.391-2 times 22 8.243-10 times 1 0.3711+ times 1 0.37
Frequency Missing = 21
LIQUOR USE IN PAST SCHOOL YEAR
Q13f Frequency Percent_______________________________________Never heard of 19 7.12Never used 233 87.271-2 times 12 4.49
3-10 times 2 0.7511+ times 1 0.37
Frequency Missing = 21
INHALANT USE IN PAST SCHOOL YEAR
Q13h Frequency Percent_______________________________________Never heard of 13 4.83Never used 241 89.591-2 times 9 3.353-10 times 5 1.8611+ times 1 0.37
Frequency Missing = 19
MARIJUANA USE IN PAST SCHOOL YEAR
Q13i Frequency Percent_______________________________________Never heard of 13 4.81Never used 252 93.331-2 times 3 1.113-10 times 1 0.3711+ times 1 0.37
Frequency Missing = 18
AGE WHEN FIRST USED CIGARETTES
Q14a Frequency Percent_________________________________________7 or younger 7 2.598 years old 5 1.859 years old 9 3.3310 years old 14 5.1911 years old 3 1.11Never heard/used 232 85.93
Frequency Missing = 18

7/30/2019 2001 _ cherokee county _ jacksonville isd _ 2001 texas school survey of drug and alcohol use _ elementary report
http://slidepdf.com/reader/full/2001-cherokee-county-jacksonville-isd-2001-texas-school-survey-of-drug 35/53
The frequencies have been weighted so that theanalysis reflects the distribution of students by grade
level in the district

7/30/2019 2001 _ cherokee county _ jacksonville isd _ 2001 texas school survey of drug and alcohol use _ elementary report
http://slidepdf.com/reader/full/2001-cherokee-county-jacksonville-isd-2001-texas-school-survey-of-drug 36/53
JacksonvilleSpring 2001
The FREQ Procedure
AGE WHEN FIRST USED SNUFF/CHEW TOBACCO
Q14b Frequency Percent
_________________________________________7 or younger 6 2.228 years old 3 1.119 years old 3 1.1110 years old 3 1.1111 years old 1 0.37Never heard/used 254 94.07
Frequency Missing = 18
AGE WHEN FIRST USED BEER
Q14c Frequency Percent_________________________________________7 or younger 16 5.938 years old 8 2.96
9 years old 13 4.8110 years old 16 5.9311 years old 2 0.74Never heard/used 215 79.63
Frequency Missing = 18
AGE WHEN FIRST USED WINE COOLERS
Q14d Frequency Percent_________________________________________7 or younger 7 2.588 years old 6 2.219 years old 12 4.4310 years old 9 3.3211 years old 8 2.95
Never heard/used 229 84.50
Frequency Missing = 17
AGE WHEN FIRST USED WINE
Q14e Frequency Percent_________________________________________7 or younger 4 1.538 years old 5 1.919 years old 7 2.6710 years old 7 2.6711 years old 2 0.76Never heard/used 237 90.46
Frequency Missing = 26

7/30/2019 2001 _ cherokee county _ jacksonville isd _ 2001 texas school survey of drug and alcohol use _ elementary report
http://slidepdf.com/reader/full/2001-cherokee-county-jacksonville-isd-2001-texas-school-survey-of-drug 37/53
The frequencies have been weighted so that theanalysis reflects the distribution of students by grade
level in the district

7/30/2019 2001 _ cherokee county _ jacksonville isd _ 2001 texas school survey of drug and alcohol use _ elementary report
http://slidepdf.com/reader/full/2001-cherokee-county-jacksonville-isd-2001-texas-school-survey-of-drug 38/53
JacksonvilleSpring 2001
The FREQ Procedure
AGE WHEN FIRST USED LIQUOR
Q14f Frequency Percent
_________________________________________7 or younger 2 0.748 years old 3 1.119 years old 3 1.1110 years old 6 2.2211 years old 4 1.48Never heard/used 252 93.33
Frequency Missing = 18
AGE WHEN FIRST USED INHALANTS
Q14h Frequency Percent_________________________________________7 or younger 1 0.388 years old 2 0.75
9 years old 3 1.1310 years old 4 1.5111 years old 4 1.51Never heard/used 251 94.72
Frequency Missing = 23
AGE WHEN FIRST USED MARIJUANA
Q14i Frequency Percent_________________________________________9 years old 1 0.3710 years old 1 0.3711 years old 2 0.75Never heard/used 263 98.50
Frequency Missing = 21
CLOSE FRIENDS USE CIGARETTES
Q15a Frequency Percent_______________________________________Never heard of 7 2.55None 203 74.09Some 56 20.44Most 8 2.92
Frequency Missing = 14
CLOSE FRIENDS USE SNUFF/CHEWING TOBACCO
Q15b Frequency Percent_______________________________________Never heard of 9 3.45None 226 86.59Some 24 9.20Most 2 0.77
Frequency Missing = 27

7/30/2019 2001 _ cherokee county _ jacksonville isd _ 2001 texas school survey of drug and alcohol use _ elementary report
http://slidepdf.com/reader/full/2001-cherokee-county-jacksonville-isd-2001-texas-school-survey-of-drug 39/53
The frequencies have been weighted so that theanalysis reflects the distribution of students by grade
level in the district

7/30/2019 2001 _ cherokee county _ jacksonville isd _ 2001 texas school survey of drug and alcohol use _ elementary report
http://slidepdf.com/reader/full/2001-cherokee-county-jacksonville-isd-2001-texas-school-survey-of-drug 40/53
JacksonvilleSpring 2001
The FREQ Procedure
CLOSE FRIENDS USE BEER
Q15c Frequency Percent
_______________________________________Never heard of 5 1.90None 189 71.86Some 56 21.29Most 13 4.94
Frequency Missing = 25
CLOSE FRIENDS USE WINE COOLERS
Q15d Frequency Percent_______________________________________Never heard of 28 10.53None 184 69.17Some 43 16.17Most 11 4.14
Frequency Missing = 22
CLOSE FRIENDS USE WINE
Q15e Frequency Percent_______________________________________Never heard of 11 4.20None 212 80.92Some 32 12.21Most 7 2.67
Frequency Missing = 26
CLOSE FRIENDS USE LIQUOR
Q15f Frequency Percent_______________________________________Never heard of 18 6.72None 221 82.46Some 23 8.58Most 6 2.24
Frequency Missing = 20
CLOSE FRIENDS USE INHALANTS
Q15h Frequency Percent_______________________________________Never heard of 12 4.51None 223 83.83
Some 25 9.40Most 6 2.26
Frequency Missing = 22

7/30/2019 2001 _ cherokee county _ jacksonville isd _ 2001 texas school survey of drug and alcohol use _ elementary report
http://slidepdf.com/reader/full/2001-cherokee-county-jacksonville-isd-2001-texas-school-survey-of-drug 41/53
The frequencies have been weighted so that theanalysis reflects the distribution of students by grade
level in the district

7/30/2019 2001 _ cherokee county _ jacksonville isd _ 2001 texas school survey of drug and alcohol use _ elementary report
http://slidepdf.com/reader/full/2001-cherokee-county-jacksonville-isd-2001-texas-school-survey-of-drug 42/53
JacksonvilleSpring 2001
The FREQ Procedure
CLOSE FRIENDS USE MARIJUANA
Q15i Frequency Percent
_______________________________________Never heard of 16 6.02None 230 86.47Some 17 6.39Most 3 1.13
Frequency Missing = 22
EVER BEEN OFFERED CIGARETTES
Q16a Frequency Percent_______________________________________Never heard of 4 1.45No 210 76.09Yes 62 22.46
Frequency Missing = 12
EVER BEEN OFFERED SNUFF/CHEWING TOBACCO
Q16b Frequency Percent_______________________________________Never heard of 6 2.26No 224 84.53Yes 35 13.21
Frequency Missing = 23
EVER BEEN OFFERED BEER
Q16c Frequency Percent
_______________________________________Never heard of 3 1.11No 197 72.96Yes 70 25.93
Frequency Missing = 18
EVER BEEN OFFERED WINE COOLERS
Q16d Frequency Percent_______________________________________Never heard of 25 9.40No 191 71.80Yes 50 18.80
Frequency Missing = 22
EVER BEEN OFFERED WINE
Q16e Frequency Percent_______________________________________Never heard of 7 2.64No 225 84.91Yes 33 12.45
Frequency Missing = 23

7/30/2019 2001 _ cherokee county _ jacksonville isd _ 2001 texas school survey of drug and alcohol use _ elementary report
http://slidepdf.com/reader/full/2001-cherokee-county-jacksonville-isd-2001-texas-school-survey-of-drug 43/53
The frequencies have been weighted so that theanalysis reflects the distribution of students by grade
level in the district
7/30/2019 2001 _ cherokee county _ jacksonville isd _ 2001 texas school survey of drug and alcohol use _ elementary report
http://slidepdf.com/reader/full/2001-cherokee-county-jacksonville-isd-2001-texas-school-survey-of-drug 44/53
JacksonvilleSpring 2001
The FREQ Procedure
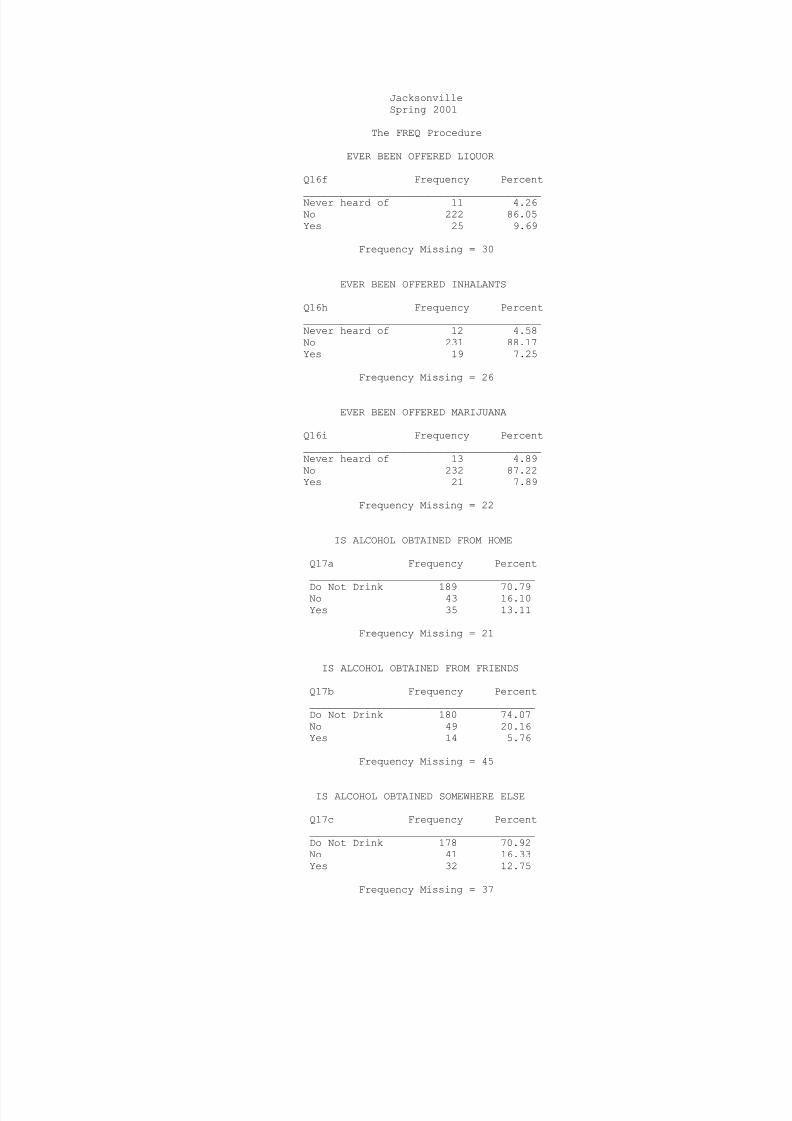
EVER BEEN OFFERED LIQUOR
Q16f Frequency Percent
_______________________________________Never heard of 11 4.26No 222 86.05Yes 25 9.69
Frequency Missing = 30
EVER BEEN OFFERED INHALANTS
Q16h Frequency Percent_______________________________________Never heard of 12 4.58No 231 88.17Yes 19 7.25
Frequency Missing = 26
EVER BEEN OFFERED MARIJUANA
Q16i Frequency Percent_______________________________________Never heard of 13 4.89No 232 87.22Yes 21 7.89
Frequency Missing = 22
IS ALCOHOL OBTAINED FROM HOME
Q17a Frequency Percent_____________________________________
Do Not Drink 189 70.79No 43 16.10Yes 35 13.11
Frequency Missing = 21
IS ALCOHOL OBTAINED FROM FRIENDS
Q17b Frequency Percent_____________________________________Do Not Drink 180 74.07No 49 20.16Yes 14 5.76
Frequency Missing = 45
IS ALCOHOL OBTAINED SOMEWHERE ELSE
Q17c Frequency Percent_____________________________________Do Not Drink 178 70.92No 41 16.33Yes 32 12.75
Frequency Missing = 37

7/30/2019 2001 _ cherokee county _ jacksonville isd _ 2001 texas school survey of drug and alcohol use _ elementary report
http://slidepdf.com/reader/full/2001-cherokee-county-jacksonville-isd-2001-texas-school-survey-of-drug 45/53
The frequencies have been weighted so that theanalysis reflects the distribution of students by grade
level in the district

7/30/2019 2001 _ cherokee county _ jacksonville isd _ 2001 texas school survey of drug and alcohol use _ elementary report
http://slidepdf.com/reader/full/2001-cherokee-county-jacksonville-isd-2001-texas-school-survey-of-drug 46/53
JacksonvilleSpring 2001
The FREQ Procedure
DANGEROUS FOR KIDS TO USE CIGARETTES
Q18a Frequency Percent
_______________________________________Very dangerous 146 53.48Dangerous 99 36.26Not at all 2 0.73Don't know 20 7.33Never heard of 6 2.20
Frequency Missing = 15
DANGEROUS TO USE SNUFF/CHEWING TOBACCO
Q18b Frequency Percent_______________________________________Very dangerous 165 61.57Dangerous 74 27.61Not at all 4 1.49
Don't know 17 6.34Never heard of 8 2.99
Frequency Missing = 20
DANGEROUS FOR KIDS TO USE BEER
Q18c Frequency Percent_______________________________________Very dangerous 127 46.86Dangerous 106 39.11Not at all 9 3.32Don't know 24 8.86Never heard of 5 1.85
Frequency Missing = 17
DANGEROUS FOR KIDS TO USE WINE COOLERS
Q18d Frequency Percent_______________________________________Very dangerous 112 42.11Dangerous 73 27.44Not at all 19 7.14Don't know 37 13.91Never heard of 25 9.40
Frequency Missing = 22
DANGEROUS FOR KIDS TO USE WINE
Q18e Frequency Percent_______________________________________Very dangerous 125 47.35Dangerous 82 31.06Not at all 12 4.55Don't know 36 13.64Never heard of 9 3.41
Frequency Missing = 24

7/30/2019 2001 _ cherokee county _ jacksonville isd _ 2001 texas school survey of drug and alcohol use _ elementary report
http://slidepdf.com/reader/full/2001-cherokee-county-jacksonville-isd-2001-texas-school-survey-of-drug 47/53
The frequencies have been weighted so that theanalysis reflects the distribution of students by grade
level in the district

7/30/2019 2001 _ cherokee county _ jacksonville isd _ 2001 texas school survey of drug and alcohol use _ elementary report
http://slidepdf.com/reader/full/2001-cherokee-county-jacksonville-isd-2001-texas-school-survey-of-drug 48/53
JacksonvilleSpring 2001
The FREQ Procedure
DANGEROUS FOR KIDS TO USE LIQUOR
Q18f Frequency Percent
_______________________________________Very dangerous 174 66.67Dangerous 51 19.54Not at all 4 1.53Don't know 18 6.90Never heard of 14 5.36
Frequency Missing = 27
DANGEROUS FOR KIDS TO USE INHALANTS
Q18h Frequency Percent_______________________________________Very dangerous 192 72.45Dangerous 37 13.96Not at all 2 0.75
Don't know 20 7.55Never heard of 14 5.28
Frequency Missing = 23
DANGEROUS FOR KIDS TO USE MARIJUANA
Q18i Frequency Percent_______________________________________Very dangerous 212 78.81Dangerous 26 9.67Not at all 2 0.74Don't know 13 4.83Never heard of 16 5.95
Frequency Missing = 19
DRUG/ALCOHOL INFO FROM TEACHER
Q19a Frequency Percent___________________________________No 116 46.77Yes 132 53.23
Frequency Missing = 40
DRUG/ALC INFO FROM VISITOR TO CLASS
Q19b Frequency Percent___________________________________No 36 13.43
Yes 232 86.57
Frequency Missing = 20
DRUG/ALC INFO FROM ASSEMBLY PROGRAM
Q19c Frequency Percent___________________________________No 59 23.32Yes 194 76.68

7/30/2019 2001 _ cherokee county _ jacksonville isd _ 2001 texas school survey of drug and alcohol use _ elementary report
http://slidepdf.com/reader/full/2001-cherokee-county-jacksonville-isd-2001-texas-school-survey-of-drug 49/53
Frequency Missing = 35
The frequencies have been weighted so that theanalysis reflects the distribution of students by grade
level in the district

7/30/2019 2001 _ cherokee county _ jacksonville isd _ 2001 texas school survey of drug and alcohol use _ elementary report
http://slidepdf.com/reader/full/2001-cherokee-county-jacksonville-isd-2001-texas-school-survey-of-drug 50/53
JacksonvilleSpring 2001
The FREQ Procedure
DRUG/ALC INFO FROM GUIDE COUNSELOR
Q19d Frequency Percent
___________________________________No 145 58.70Yes 102 41.30
Frequency Missing = 41
DRUG/ALC INF FROM SOMEONE ELSE AT SCHOOL
Q19e Frequency Percent___________________________________No 150 59.52Yes 102 40.48
Frequency Missing = 36
BEER, TWO OR MORE AT ONE TIME
Q20a Frequency Percent_________________________________Never 226 82.481 time 23 8.392 times 18 6.573+ times 7 2.55
Frequency Missing = 14
WINE COOLERS, TWO OR MORE AT ONE TIME
Q20b Frequency Percent_________________________________Never 231 85.87
1 time 22 8.182 times 8 2.973+ times 8 2.97
Frequency Missing = 19
WINE, TWO OR MORE AT ONE TIME
Q20c Frequency Percent_________________________________Never 234 88.641 time 17 6.442 times 10 3.793+ times 3 1.14
Frequency Missing = 24
LIQUOR, TWO OR MORE AT ONE TIME
Q20d Frequency Percent_________________________________Never 252 94.381 time 11 4.122 times 3 1.123+ times 1 0.37
Frequency Missing = 21

7/30/2019 2001 _ cherokee county _ jacksonville isd _ 2001 texas school survey of drug and alcohol use _ elementary report
http://slidepdf.com/reader/full/2001-cherokee-county-jacksonville-isd-2001-texas-school-survey-of-drug 51/53
The frequencies have been weighted so that theanalysis reflects the distribution of students by grade
level in the district

7/30/2019 2001 _ cherokee county _ jacksonville isd _ 2001 texas school survey of drug and alcohol use _ elementary report
http://slidepdf.com/reader/full/2001-cherokee-county-jacksonville-isd-2001-texas-school-survey-of-drug 52/53
JacksonvilleSpring 2001
The FREQ Procedure
MISSED SCHOOL WITHOUT PARENT'S CONSENT
Q21 Frequency Percent
___________________________________No 268 95.71Yes 12 4.29
Frequency Missing = 8
SENT TO PRINCIPAL/DEAN SINCE SEPTEMBER
Q22 Frequency Percent___________________________________No 172 60.99Yes 110 39.01
Frequency Missing = 6
PARENTS FEEL ABOUT KIDS DRINKING BEER
Q23 Frequency Percent________________________________________Don't like it 209 75.72Don't care 6 2.17Think it's O.K. 2 0.72Don't know 59 21.38
Frequency Missing = 12
PARENTS FEEL ABOUT KIDS USING MARIJUANA
Q24 Frequency Percent________________________________________Don't like it 228 82.01
Don't care 2 0.72Think it's O.K. 1 0.36Don't know 47 16.91
Frequency Missing = 10

7/30/2019 2001 _ cherokee county _ jacksonville isd _ 2001 texas school survey of drug and alcohol use _ elementary report
http://slidepdf.com/reader/full/2001-cherokee-county-jacksonville-isd-2001-texas-school-survey-of-drug 53/53
The frequencies have been weighted so that theanalysis reflects the distribution of students by grade
level in the district