2002-2003 draft aquatic biological survey report and...ny & nj harbor navigation project august...
TRANSCRIPT

NEW YORK AND NEW JERSEY HARBOR NAVIGATION PROJECT
AQUATIC BIOLOGICAL SURVEY REPORT 2002–2003
Report
August 2003
Prepared for:
U.S. Army Corps of Engineers – New York District Environmental Review Section
Jacob K. Javits Federal Building 26 Federal Plaza
New York, New York 10278
Prepared by:
Lawler, Matusky and Skelly Engineers, LLP 1 Blue Hill Plaza
Pearl River, New York 10965

NY & NJ Harbor Navigation Project August 2003 2002–2003 Aquatic Biological Draft Survey Report
2
Table of Contents
1.1 Background.................................................................................................... 4 1.2 Study Objectives ............................................................................................ 5 1.3 Report Organization....................................................................................... 6
2.0 METHODS............................................................................................................... 7 2.1 Sampling Locations ....................................................................................... 7 2.2 Adult Finfish Sampling (Bottom Trawls) ...................................................... 8 2.3 Ichthyoplankton Sampling (epibenthic sled tows) ............................................. 9 2.4 Water Quality Measurements ...................................................................... 10 2.5 Data Analysis ............................................................................................... 10
2.5.1 Trawl………………………………………………………………10 2.5.2 Ichthyoplankton…………………………………………………...11
3.0 RESULTS............................................................................................................... 12 3.1 All Species ................................................................................................... 12
3.1.1 Adults (Trawl Sampling)………………………………………… 12 3.1.2 Ichthyoplankton (Epibenthic Sled Sampling)……………………. 14 3.1.2.1 Eggs ........................................................................................ 14 3.1.2.2 Yolk-sac Larvae ............................................................................. 15 3.1.2.3 Post Yolk-sac Larvae...................................................................... 15 3.1.2.4 Juveniles ........................................................................................ 16
3.2 winter Flounder............................................................................................ 17 3.2.1 Adults (Trawl Sampling)………………………………………… 17 3.2.1.1 Densities ........................................................................................ 17 3.2.1.2 Size Distribution............................................................................. 17 3.2.1.3 Sex Ratio ........................................................................................ 18 3.2.2 Ichthyoplankton (Epibenthic Sled Sampling)……………………. 18
3.3 Water Quality............................................................................................... 20
4.0 DISCUSSION ........................................................................................................ 21 4.1 All Species ................................................................................................... 22 4.2 Winter Flounder ........................................................................................... 22
5.0 LITERATURE CITED........................................................................................... 25

NY & NJ Harbor Navigation Project August 2003 2002–2003 Aquatic Biological Draft Survey Report
3

NY & NJ Harbor Navigation Project August 2003 2002–2003 Aquatic Biological Draft Survey Report
4
1.0 INTRODUCTION
1.1 BACKGROUND This report summarizes and presents results of a biological sampling program conducted
in the New York and New Jersey Harbor (Harbor) from December 2002 though July
2003 (2002–2003 Aquatic Biological Sampling Program). The program’s focus was the
collection of adult and early life stages of finfish, with an emphasis on winter flounder
(Pseudopleuronectes americanus).
The 2002–2003 Biological Sampling Program supplements data gathered in the baseline
1998–1999 New York and New Jersey Harbor Navigation (NYNJHN) Study, 2000–2001
Supplemental Sampling Program and the 2001-2002 Aquatic Biological Sampling
Program. Collectively, the four studies comprise the NYNJHN Project. A primary goal
of the NYNJHN investigation is to collect biological data on Harbor finfish, shellfish,
and macroinvertebrate distribution patterns, community structure, and seasonal patterns
of habitat use, as well as data about water quality. The information collected is used in
determining the potential biological impacts of deepening existing Harbor navigation
channels, anchorages, and berthing areas to depths of 50 ft or greater.
The 1998–1999 NYNJHN Study found that the Harbor finfish community consists of a
variety of resident and migratory fish species typical of large coastal estuaries and
inshore waterways along the Mid-Atlantic Bight. The Harbor estuary serves as a
spawning ground, migratory pathway, and nursery/foraging area for many fish and
macroinvertebrate species. To obtain more information the use of Harbor habitats by
early life stages of fish, particularly winter flounder, the NYNJHN Supplemental
Sampling Program was conducted during 2000–2001.
Although both the 1998–1999 NYNJHN baseline program and the 2000–2001
Supplemental Sampling Program provided extensive information about adult and early
life stages of winter flounder in the Harbor, it was determined that additional data were
needed to further understand the species’ spatial and temporal occurrence patterns within

NY & NJ Harbor Navigation Project August 2003 2002–2003 Aquatic Biological Draft Survey Report
5
the Harbor, its use of Harbor navigation channels and shallow/shoal areas, and the role
played by Lower New York Bay (Lower Bay) with respect to winter flounder
overwintering and spawning. Furthermore, it was determined that data for multiple years
are needed to understand whether the use of navigation channels and shallow/shoal areas
by winter flounder is consistent over time. The 2001-2002 Aquatic Biological Sampling
Program was conducted to meet the need for additional data about how finfish use the
Harbor.
The 2001-2002 Aquatic Biological Sampling Program provided additional support to the
findings of the Supplemental Sampling Program (2000-2001) that winter flounder
disperse into the New York and New Jersey Harbor Estuary after hatching. These results
suggested that winter flounder eggs are laid primarily in the Lower Bay and to a lesser
degree in other areas of the Harbor. After hatching and developing into larvae, winter
flounder move from the Lower Bay into the Upper Harbor. These movement patterns
may be important to winter flounder population dynamics because larvae that move
directly to the ocean without using the nursery habitat could be lost to the population
(Chant et al. 2000).
Although there is some indication from the 2000-2001 and 2001-2002 sampling
programs that winter flounder in the New York and New Jersey Harbor Estuary exhibit
these movement patterns, more data are required to determine if this pattern is repeated
multiple years. As a result, additional sampling was conducted in 2002-2003 to expand
the temporal coverage of the Biological Monitoring Program Database, especially with
respect to the Lower Bay. To allow for direct comparisons across years, the sample
objectives in the 2002-2003 Aquatic Biological Sampling Program remained the same as
the 2001-2002 Aquatic Biological Sampling Program.
1.2 STUDY OBJECTIVES During the 2002–2003 Aquatic Biological Sampling Program data were collected on
adult and early life stages of finfish in the Harbor with an emphasis on winter flounder

NY & NJ Harbor Navigation Project August 2003 2002–2003 Aquatic Biological Draft Survey Report
6
between the months of December and July. This is typically the period when winter
flounder spawning and early lifestages occur in the Harbor.
The specific objectives were to:
• Determine the utilization and significance of Harbor habitat designated as essential
fish habitat (EFH) for adults for the months of December through June.
• Determine the utilization and significance of Harbor habitat designated as essential
fish habitat (EFH) for early life stages (eggs and larvae) from January through July.
• Determine spawning areas and periodicity by analyzing the sex ratio of adults in the
Harbor.
To meet program objectives, two sampling methodologies were employed. Bottom
trawling was conducted to address the objectives related to adult finfish, and an
epibenthic sled-mounted plankton net was used to target early life stages.
1.3 REPORT ORGANIZATION This report describes the 2002–2003 Aquatic Biological Sampling Program and presents
results. This report is organized as follows: Chapter 2 describes sampling stations and
summarizes the methods used to sample adult finfish and ichthyoplankton in the Harbor.
Chapter 3 presents the results of bottom-trawl and epibenthic-sled sampling. Chapter 4
discusses how the data collected relate to program objectives as well as to previous
NYNJHN investigations

NY & NJ Harbor Navigation Project August 2003 2002–2003 Aquatic Biological Draft Survey Report
7
2.0 METHODS
2.1 SAMPLING LOCATIONS
The same twenty-six (26) sampling locations that were selected for the 2001–2002
Aquatic Biological Sampling Program were sampled throughout the 2002-2003 Aquatic
Biological Sampling Program to optimize the evaluation of different Harbor areas and
habitat (Table 2-1 and Figure 2-1). Of these, 14 were located in shallow/shoal or
interpier areas, and 12 were located in navigation channels.
For the Biological Sampling Program, the Harbor was divided into three study areas
based on geography: Arthur Kill/Newark Bay (AKNB), Upper Bay (UB), and Lower Bay
(LB). Among the study areas, stations were established as follows:
• Arthur Kill and Newark Bay (AK and NB)
Nine stations were located in this area. Of these, two were in Arthur Kill
shallow/shoal areas (AK-1 and AK-4) and two were in channels at the Arthur
Kill/Kill Van Kull confluence area (AK-2 and AK-3). Two other stations were
located in the navigation channel in Newark Bay (NB-5, and NB-6), while the
shallow/shoal areas were represented by the three remaining Arthur Kill/Newark Bay
stations: NB-3, NB-4, and NB-7.
• Upper New York Bay
In the Upper Bay, which includes South Brooklyn (SB) and Port Jersey (PJ), 11
stations were sampled. Two were in the South Brooklyn interpier areas
(shallow/shoal area stations SB-1 and SB-2) and one was on the Bay Ridge Flats (SB-
3). Three stations were located in navigation channels—one (1) in Bay Ridge
Channel (SB-4) and two (2) in the Anchorage Channel (SB-5 and SB-6). Three (3)
shallow/shoal area stations were located in Port Jersey (PJ-l, PJ-2, PJ-3) and two (2)
were located in Port Jersey Channel (PJ-4 and PJ-5).

NY & NJ Harbor Navigation Project August 2003 2002–2003 Aquatic Biological Draft Survey Report
8
• Lower New York Bay
Six (6) stations were located in this area—three (3) in channels (LB-2, LB-4 and LB-
6) and three (3) in shallow/shoal areas (LB-1, LB-3, and LB-5). The Lower Bay sites
were added in the 2001–2002 Biological Sampling Program to provide better spatial
coverage for the evaluation of winter flounder EFH in the Harbor.
2.2 ADULT FINFISH SAMPLING (BOTTOM TRAWLS) Adult finfish were sampled via bottom trawl surveys conducted from 15 December 2002
to 15 June 2003. Trawls were conducted on a stratified sampling schedule to target the
period when adult winter flounder historically are present in the Harbor to spawn.
Sampling was conducted twice monthly on an alternating-week schedule from January
through March and once monthly during December and April through June.
Bottom trawl surveys were conducted using a 30-foot (9.1 m) otter trawl (Table 2-2), the
same trawl used during previous years of the NYNJHNP. A minimum ratio of tow cable
length to maximum station water depth of 5:1 was maintained to ensure that the trawl
was in contact with the bottom.
Bottom trawls were conducted during the night hours (from one hour after sunset to one
hour before sunrise) against the prevailing current at a bottom speed of approximately 4.9
feet/sec (150 cm/sec). Target tow duration was ten minutes, although tow times were
adjusted as needed to account for obstructions, limited interpier distances, commercial
traffic, and several other factors.
A total of 258 bottom trawls where conducted (Table 2-3) —118 at navigation channel
stations and 140 at shallow/shoal stations.
All fish were identified and enumerated directly on the research vessel. Total lengths of
each winter flounder caught were recorded to the nearest millimeter (mm). When
available, a total of 10 winter flounder per trawl that measured greater than 250 mm were

NY & NJ Harbor Navigation Project August 2003 2002–2003 Aquatic Biological Draft Survey Report
9
preserved on ice and returned to the laboratory for sex determination. A 250-mm total
length was established to limit the number of immature fish kept for analysis. Winter
flounder typically exhibit adult gonad development at 250 mm total length and reach
sexual maturity between 280 mm and 300 mm (Witherell 1993).
For each non-target species, total length was measured for a minimum of 25 individuals
in each trawl sample. An unbiased selection of 25 specimens was made for non-target
species when the number of fish collected exceeded 25. Except for winter flounder
preserved for laboratory analysis, all fish collected were released after on-board
examination.
2.3 ICHTHYOPLANKTON SAMPLING (EPIBENTHIC SLED TOWS) Ichthyoplankton sampling was conducted from 19 January to 6 July 2003. A stratified
sampling schedule was used to target winter flounder spawning and early development in
the Harbor. The 26 sampling stations were sampled twice monthly from February
through June and once monthly during January and July.
Samples were collected with an epibenthic sled-mounted 0.5-m mouth diameter plankton
net with 0.5-mm mesh (Table 2-4). Typically, a 4:1 ratio of cable length to bottom depth
was used. An inclinometer was used to determine the warp angle from the boat to
confirm that the sled was on the bottom. The net was fitted with a General Oceanics
flowmeter (Model 2030R) to calculate sample volume.
All samples were collected during daylight hours (from one hour after sunrise to one hour
before sunset). Whenever possible, each tow was conducted against the prevailing current
or tide for ten minutes. Tow direction and duration were adjusted as needed to account
for obstructions, limited transect distances, and commercial traffic.
A total of 312 epibenthic sled tows were conducted—144 at navigation channel stations
and 168 at shallow/shoal stations (Table 2-3). Each sample was washed from the

NY & NJ Harbor Navigation Project August 2003 2002–2003 Aquatic Biological Draft Survey Report
10
plankton net into containers and preserved with 5% buffered formalin containing the vital
stain rose bengal. Samples were retuned to the laboratory for sorting and identification.
All specimens were identified to the lowest taxonomic level practicable, assigned a life
stage based on morphometric characteristics (egg, yolk-sack larvae, post yolk-sac larvae,
or juvenile), and enumerated. Data about unidentified species were recorded when eggs
or larvae could not be identified to species. For some larvae, it was not possible to discern
between yolk-sac and post yolk-sac life stages because specimens were damaged.
Indiscernible larval life stages were combined with the yolk-sac larvae life stage during
analysis. Unidentified specimens were a small percentage of the total larval catch (2%).
Strict quality control (QC) procedures consisting of a continuous sampling plan (CSP) to
assure an average outgoing quality limit (AOQL) of ≥90% were followed during sample
sorting, enumeration, life-stage designation, and identification.
2.4 WATER QUALITY MEASUREMENTS On each sampling date at each station, dissolved oxygen (DO), temperature, and
conductivity and salinity were measured after each trawl and epibenthic sled tow (Table
2-5). Water quality parameters were recorded one foot (0.3 m) above the substrate using
calibrated meters.
2.5 DATA ANALYSIS
2.5.1 Trawl Catch per unit effort (CPUE), defined as number per 10 minute trawl tow, was
determined for each trawl tow based on the time each net sampled on the bottom. When
tow times were less than 10 minutes, catch data were multiplied by the appropriate factor
to standardize for a ten minute tow.
NY & NJ Harbor Navigation Project August 2003 2002–2003 Aquatic Biological Draft Survey Report
11
2.5.2 Ichthyoplankton Ichthyoplankton densities (Number per 1000 cubic meters [m³]) were determined for
each epibenthic sled tow. The volume of water sampled was determined using the area of
the net mouth and the velocity meter revolutions.
NY & NJ Harbor Navigation Project August 2003 2002–2003 Aquatic Biological Draft Survey Report
12
3.0 RESULTS
Adult finfish and ichthyoplankton data were analyzed for the two general habitat types
(navigation channels and shallow/shoal areas), and the three Harbor areas (Upper New
York Bay, Arthur Kill / Newark Bay, and Lower New York Bay). Following is a
summary of results for all species combined and for winter flounder. Detailed station data
for adult finfish, ichthyoplankton, and water quality are provided in Appendices A
through C, respectively.
Note that the following data-unit definitions apply in the figures accompanying the main
report text and in Appendices A and B:
• Trawl: Catch per unit effort (CPUE), defined as number caught per 10 minute trawl
tow.
• Epibenthic sled tow: Ichthyoplankton density (number per 1000 cubic meters).
3.1 ALL SPECIES
3.1.1 Adults (Trawl Sampling) A total of 51 fish species were identified during the bottom trawl survey. Tables 3-1a
and 3-1b report average trawl CPUEs by species for all navigation channel stations
combined and for all shallow/shoal stations combined for each month of the 2002–2003
Aquatic Biological Sampling Program. The greatest fish abundance occurred in the
Arthur Kill/Newark Bay and the most common species (e.g., spotted hake and bay
anchovy) were collected throughout the Harbor, regardless of sample area or station
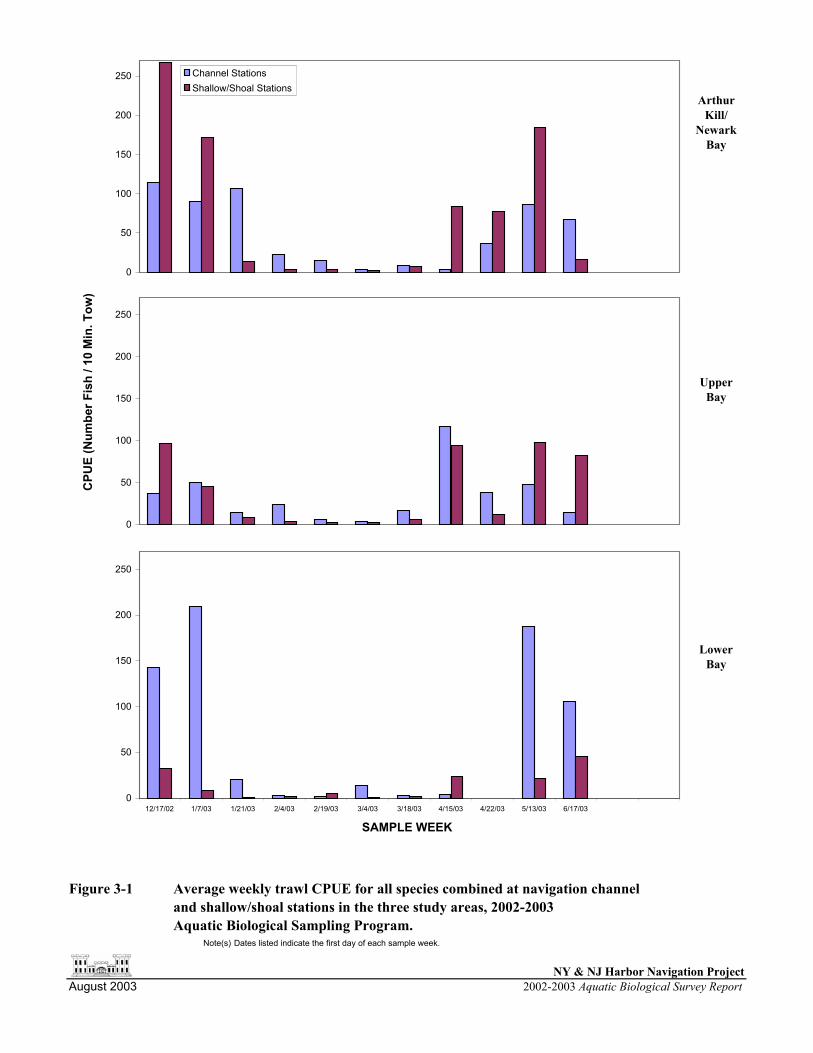
depth (Tables 3-2a to 3-2c). As shown in Figure 3-1, which plots weekly abundance by
station type (navigation channel vs. shallow/shoal) in the three Harbor areas examined,
fish abundance ranged from less than 10 to greater than 250. Two peaks in abundance,
one early in the program from December to January and another during May were

NY & NJ Harbor Navigation Project August 2003 2002–2003 Aquatic Biological Draft Survey Report
13
observed at shallow/shoal stations in the Arthur Kill/Newark Bay and at navigation
channel stations in the Lower Bay stations, where the CPUEs exceeded 150. The highest
CPUE (268 fish) was observed at the Arthur Kill/Newark Bay shallow/shoal stations
during December.
Figures 3-2 through 3-4 present monthly species composition collected via trawl
sampling in the three Harbor areas. Monthly species composition was inconsistent across
the harbor. From December through March, white perch and striped bass dominated the
Arthur Kill/Newark Bay species composition, combining for 75% of the catch, and
spotted hake and bay anchovy were most common from April to June. White perch were
not as abundant in the Upper or Lower Bays. In the Upper Bay, striped bass (December-
January), winter flounder (February), windowpane flounder (February-March), spotted
hake (April) and bay anchovy (May-June) dominated monthly species composition,
representing 28% to 50% of the catch. Spotted hake (December-January, April), little
skate (February), bay anchovy (March) and Atlantic herring (May-June) dominated the
monthly catch in the Lower Bay, representing 45% to 63% of the catch.
As can be seen in Figures 3-2 to 3-4, composition of flounder species was inconsistent
across sampling areas and months. In the Arthur Kill/Newark Bay and Lower Bay,
flounder species did not dominate any catches. Winter flounder and windowpane
flounder dominated the catch in the Upper Bay during February, and combined, they
comprised 56% of the catch.
In general, fish were collected in greater abundance at the navigation channel stations in
the Lower Bay and at shallow/shoal stations in the Arthur Kill/Newark Bay and Upper
Bay. Spotted hake and white perch had higher CPUEs at navigation channel stations,
while bay anchovy and striped bass were more common at shallow/shoal stations (Tables
3-2a through 3-2c).
NY & NJ Harbor Navigation Project August 2003 2002–2003 Aquatic Biological Draft Survey Report
14
3.1.2 Ichthyoplankton (Epibenthic Sled Sampling) Among the eggs, larvae, and juveniles collected throughout the 2002–2003 Aquatic
Biological Sampling Program, 31 species were identified.
The greatest Ichthyoplankton densities were recorded during June and July in all three
study areas regardless of station depth, except shallow/shoal stations in the Lower Bay
when the greatest densities were collected during June and April (Tables 3-3a through 3-
3f). Throughout the Harbor, fish eggs were the most abundant ichthyoplankton life stage
collected during the sampling program, followed by post yolk-sac larvae; except at
shallow/shoal stations in the Arthur Kill/Newark Bay where post yolk-sac larvae was the
most abundant lifestage. The highest egg densities were collected in the Lower Bay at
shallow/shoal stations, and the highest post yolk-sac larvae densities were collected in the
Lower Bay at navigation channel stations.
3.1.2.1 Eggs Eggs were collected in the Harbor from February to July, with the greatest densities
collected in the Lower Bay during early and late June (Figure 3-5). In each of the areas
sampled, the highest egg densities were collected in late-June, including the peak density
of 24,171/1000 m³ at shallow/shoal stations in the Lower Bay. Peak densities were
greater at navigation channel stations in the Arthur Kill/Newark Bay and Upper Bay and
at shallow/shoal stations in the Lower Bay.
No eggs were collected during January and February in the Arthur Kill/Newark Bay and
during January in the Upper Bay and Lower Bay (Figures 3-6 through 3-8). Winter
flounder dominated overall ichthyoplankton densities in the Arthur Kill/Newark Bay
during March and April, and in the Upper Bay and Lower Bay during February and
March. Windowpane flounder dominated catches during June in the Arthur Kill/Newark
Bay, from April through June in the Upper Bay, and during April and May in the Lower
Bay. Bay anchovy dominated ichthyoplankton densities during July in the Arthur
Kill/Newark Bay and Upper Bay, while Prionotus sp. (i.e. searobin) dominated in the
Lower Bay.

NY & NJ Harbor Navigation Project August 2003 2002–2003 Aquatic Biological Draft Survey Report
15
3.1.2.2 Yolk-sac Larvae Yolk-sac larvae were collected from February to June and ranged in density from 1/1000
m3 to 453/1000 m3 (Figure 3-9). The highest average yolk-sac larvae density (453/1000
m3) was observed at shallow/shoal stations in the Lower Bay during early April. Peaks in
yolk-sac larvae abundance in the Arthur Kill/Newark Bay and Upper Bay areas also
occurred during the early-April sampling period at shallow/shoal stations.
Yolk-sac larvae were not collected during January or February, except for one American
sandlance collected in the Lower Bay during February (Figures 3-10 through 3-12).
During March and April, winter flounder and grubby were the only species collected in
the Arthur Kill/Newark Bay, while four species (rock gunnel, grubby, winter flounder
and longhorn sculpin) contributed to the catch in the Lower Bay. Species diversity
increased in the Arthur Kill/Newark Bay during May and June, while it decreased in the
Lower Bay where only two species (Atlantic menhaden and windowpane flounder) were
present in catches. Species diversity was low (≤ 2 species) during each sampling month
in the Upper Bay; winter flounder dominated catches from March through May and
Atlantic menhaden dominated the catch in June. Fourspot flounder was the only species
caught during July and was collected from the Upper Bay.
3.1.2.3 Post Yolk-sac Larvae Post yolk-sac larvae were the most diverse early lifestage collected. Post yolk-sac larvae
densities were relatively low (<50/1000 m³) from December through March (Figure 3-
13). During April, densities increased throughout the Harbor, especially in the Lower
Bay where the highest density (3,795/1000 m³) was recorded at shallow/shoal stations.
The greatest densities collected from the Arthur Kill/Newark Bay (1,581/1000 m³) and
the Upper Bay (815/1000 m³) were recorded during July.
Species composition varied by Harbor area during January where Atlantic croaker
(Arthur Kill/Newark Bay), summer flounder (Upper Bay) and rock gunnel (Lower Bay)
dominated the catches (Figures 3-14 through 3-16). During February, rock gunnel
dominated catches throughout the Harbor. Rock gunnel dominated ichthyoplankton
NY & NJ Harbor Navigation Project August 2003 2002–2003 Aquatic Biological Draft Survey Report
16
densities again in the Lower Bay during March, while Atlantic herring dominated in the
Arthur Kill/Newark Bay and Upper Bay. Winter flounder dominated catches throughout
the Harbor (>88% of the catch) during April and May. Species composition shifted
during June when Atlantic menhaden dominated the catch in the Arthur Kill/Newark Bay
(40%) and was common (36%) in the Upper Bay. Windowpane flounder was common in
the Upper Bay (36%) and dominated catches in the Lower Bay (54%) during June.
Species composition was similar throughout the Harbor in July when bay anchovy (≥
64%) was the most common species recorded.
3.1.2.4 Juveniles Juveniles represented the lowest densities of all ichthyoplankton life stages collected.
Juvenile densities ranged from 1/1000 m³ to 14/1000 m³ and were more common at
navigation channel stations (Figure 3-17). The peak juvenile density (14/1000 m³) was
recorded during July in the Arthur Kill/Newark Bay at navigation channel stations.
Species composition of juveniles by Harbor area is shown in Figures 3-18 through 3-20.
Bay anchovy and Atlantic croaker were the only species recorded during January in the
Arthur Kill/Newark Bay and Upper Bay; no juveniles were collected during January in
the Lower Bay (Figures 3-18 through 3-20). No juveniles were collected during February
and March at any of the study areas. Atlantic tomcod was the only species caught during
April (Upper Bay) and May (Arthur Kill/Newark Bay). During June, windowpane
flounder and winter flounder were the only species collected throughout the harbor.
Juveniles collected during July in the Arthur Kill/Newark Bay were represented by three
species: northern pipefish (56%), winter flounder (33%) and windowpane flounder
(11%).

NY & NJ Harbor Navigation Project August 2003 2002–2003 Aquatic Biological Draft Survey Report
17
3.2 WINTER FLOUNDER
3.2.1 Adults (Trawl Sampling)
3.2.1.1 Densities Winter flounder were collected in trawls from December to June throughout the Harbor
(Table 3-2a to 3-2c). Winter flounder were caught monthly across the Arthur
Kill/Newark Bay and Upper Bay stations, whereas catches in the Lower Bay were more
sporadic. The highest winter flounder CPUE (20) was recorded in mid-June at navigation
channel stations in the Upper Bay. Overall winter flounder CPUEs were higher at
navigation channel stations in the Arthur Kill/Newark Bay and Lower Bay, while CPUEs
were similar at both navigation channel and shallow/shoal stations in the Upper Bay.
When CPUE data were analyzed on a temporal scale by sampling week, no tends in
habitat preference were observed (Figure 3-21).
3.2.1.2 Size Distribution All winter flounder caught in the trawl were measured. Of the 508 winter flounder
measured; total lengths ranged from 20 mm to 390 mm (Figure 3-22). A length frequency
plot of winter flounder lengths from all Harbor areas combined exhibited a bimodal
distribution pattern, with an initial length frequency cluster ranging from 30 to 50 mm –
representative of young-of-year fish – and a second larger cluster with lengths ranging
from 90 mm to 150 mm. The greatest frequencies of winter flounder were collected
between 110 mm and 130 mm.
Temporal occurrence of winter flounder length frequencies in the three Harbor areas is
shown in Figures 3-23 through 3-25. Winter flounder collected in the Arthur Kill/Newark
Bay area generally were less than 250 mm. Winter flounder were typically less than 250
mm in the Upper Bay from December through February, whereas larger individuals
(greater than 250 mm) were more abundant during April and May. Most winter flounder
in June samples in the Arthur Kill/Newark Bay and Upper Bay areas ranged from 20 mm
to 50 mm, and are likely young-of-year individuals. In the Lower Bay, winter flounder
were generally greater than 250 mm across all sampling months. Since relatively few

NY & NJ Harbor Navigation Project August 2003 2002–2003 Aquatic Biological Draft Survey Report
18
individuals were collected from the Lower Bay, trends in size distribution are unclear.
There were no peaks in density of small winter flounder (between 20 mm and 50 mm) in
June in the Lower Bay.
3.2.1.3 Sex Ratio Of the 108 winter flounder analyzed for sex determination ranging in preserved length
from 235 mm to 385 mm 85 were female and 23 were male. Mature winter flounder
were collected in greater numbers in the Upper Bay and Lower Bay than at Arthur
Kill/Newark Bay stations (Figure 3-26). More females than males were collected in each
area; the sex ratio was 1.6:1 females to males in the Arthur Kill/Newark Bay, 8.6:1
females to males in the Upper Bay and 2.6:1 females to males in the Lower Bay.
3.2.2 Ichthyoplankton (Epibenthic Sled Sampling)
The winter flounder egg, yolk-sac and post yolk-sac larvae life stages were collected
throughout the Harbor: the greatest abundance of each life stage was collected from the
Lower Bay, followed by the Upper Bay and then the Arthur Kill/Newark Bay (Figure 3-
27). Post yolk-sac larvae were the dominant life stage collected (80.9%), followed by
yolk-sac larvae, eggs and then juveniles. Winter flounder eggs were collected in greater
densities in the Lower Bay than any other area, constituting 74% of the winter flounder
eggs. The Upper Bay had the second highest percentage of winter flounder eggs (25%).
In the Arthur Kill/Newark Bay area, representing the lowest percentage (1%) of the total
winter flounder eggs collected, eggs were collected on only three sampling weeks.
Winter flounder eggs were collected in the Harbor from mid-February through late April
(Figure 3-28). Peak egg densities (331/1000 m³) were collected in mid-February at the
Lower Bay navigation channel stations; high egg densities (325/1000 m³) were also
collected at shallow/shoal stations in the Lower Bay. In the Upper Bay, winter flounder
egg densities were greater at the navigation channel stations.

NY & NJ Harbor Navigation Project August 2003 2002–2003 Aquatic Biological Draft Survey Report
19
Winter flounder yolk-sac larvae densities were greatest in the Lower Bay, where a peak
density (450/1000 m³) was observed at the shallow/shoal stations during early April
(Figure 3-29). Yolk-sac larvae were collected in the lowest densities in the Arthur
Kill/Newark Bay area. They were collected over the longest time frame (early March to
late April in the Upper Bay. In general, peak yolk-sac larvae densities occurred
throughout the Harbor at shallow/shoal stations during early-April.
Post yolk-sac larvae were the most abundant winter flounder life stage; it was collected in
the Harbor from mid-March to early June (Figure 3-30). Densities were highest at Lower
Bay shallow/shoal stations, where density gradually increased during the sample program
to a late-April peak (3782/1000 m³). Post yolk-sac larvae densities were similar to each
other (≤ 430/1000 m³) in the Arthur Kill/Newark Bay and Upper Bay areas.
Winter flounder juveniles were collected June at navigation channel stations in the Upper
Bay and during July at shallow/shoal stations in the Arthur Kill/Newark Bay. Station
depth preference (i.e., navigation channel vs. shallow/shoal station) could not be
determined among Harbor areas because too few winter flounder juveniles were collected
throughout the sampling program.
3.3.3 Annual Comparison
In this section, comparisons are made between the winter flounder CPUE and density
data presented above and data from the 2001-2002 Biological Monitoring Program
(USACE 2002) to identify trends across years. Because the 2001-2002 program was
conducted over a similar temporal scale and at the same stations using the same gear as
the 2002-2003 program, direct comparison were made by month.
Winter flounder CPUE was lower during 2002-2003 than in 2001-2002 (Figure 3-31).
This was especially true in the Arthur Kill/Newark Bay and Lower Bay areas. The
highest abundance of winter flounder in the Arthur Kill/Newark Bay occurred during
June 2001-2002. This catch was dominated by small (<90 mm), likely young-of-year
fish (Figure 3-32). Similarly, the winter flounder catch in the Upper Bay during June

NY & NJ Harbor Navigation Project August 2003 2002–2003 Aquatic Biological Draft Survey Report
20
2001-2002 was dominated by young-of year fish (Figure 3-33). Although June winter
flounder CPUE was lower in 2002-2003, the same trend of young-of year fish using the
Arthur Kill/Newark Bay and the Upper Bay areas during June was observed. In both
program years, the winter flounder that are expected to be sexually mature (>250 mm)
were collected throughout the Harbor from February -May (Figure 3-32 to 3-34).
The majority of these sexually mature fish were collected in the Upper Bay and Lower
Bay.
Egg densities were greater throughout the Harbor in 2002-2003 than in 2001-2002
especially in the Lower and Upper bays (Figure 3-35). In both program years, few eggs
were collected in the Arthur Kill/Newark Bay, while the greatest egg densities were
observed in the Lower Bay during February and March and to a lesser degree in the
Upper Bay.
Larval densities (YS and PYS combined) were generally greater in 2002-2003 than in
2001-2002 in all three areas (Figure 3-36). The temporal occurrence of winter flounder
shifted between years. In 2001-2002 larvae were first collected in February, whereas
larvae were not collected until March in 2002-2003 and did not peak until April. The
greatest larval densities collected during both program years were in the Lower Bay.
3.3 WATER QUALITY
Average bottom water temperatures ranged from a low of 1.6°C in the Arthur
Kill/Newark Bay during January to a high of 23.3°C during July also in the Arthur
Kill/Newark Bay (Figure 3-37). Water temperatures were lowest at the Arthur
Kill/Newark Bay and highest at the Lower Bay stations from January through February.
During March, water temperatures shifted when warmer temperatures were measured at
the Arthur Kill/Newark Bay and cooler temperatures were measured at the Lower Bay
stations throughout the remaining sampling periods.

NY & NJ Harbor Navigation Project August 2003 2002–2003 Aquatic Biological Draft Survey Report
21
Salinity recorded from near bottom depth during ichthyoplankton surveys ranged
between 13.4 ppt and 29.3 ppt over the course of the program (Figure 3-37). Salinities
were consistently lowest in the Arthur Kill/Newark Bay and highest in the Lower Bay.
Dissolved oxygen concentration in water is largely dependent on the water temperature,
and to a lesser degree, the salinity. As temperature increases, the amount of oxygen
capable of being held in solution decreases. Similarly, as salinity increases, the amount
of oxygen that can be held in solution decreases. Trends in dissolved oxygen levels were
similar across the three Harbor areas, remaining between 10 mg/L and 12.3 mg/L from
January through March and decreasing throughout the program to between 5.5 mg/L and
6.7 mg/L during July. From May through July, dissolved oxygen levels were inversely
proportional to temperatures throughout the Harbor, that is, when temperatures were
highest in the Arthur Kill/Newark Bay and lowest in the Lower Bay, then dissolved
oxygen levels were lowest in the Arthur Kill/Newark Bay and highest in the Lower Bay.
All water quality sampling data are presented in Appendix C.
4.0 DISCUSSION
The water quality and habitat characteristics of the areas sampled may affect the spatial
and temporal occurrence of finfish in the Harbor, particularly winter flounder. The
Lower Bay is more characteristic of the marine/oceanic environment (i.e., exhibit the
least variability, more stable environment) than the Arthur Kill/Newark Bay and the
Upper Bay (USACE 2002) while the Arthur Kill/Newark Bay and Upper Bay areas are
more characteristic of a nearshore, estuarine environment. Based on the water quality
data it appears that the Upper Bay may be more ocean-like than the Arthur Kill/Newark
Bay by virtue of the relatively broad connection between Lower Bay and Upper Bay
through The Narrows. As identified in previous reports (USACE 2002, USACE 2003)
the predominance of fine bottom sediments in the Arthur Kill/Newark Bay area suggests
that there is limited tidal exchange and the area is depositional area with a greater
potential for biological, chemical, and sediment oxygen demand.

NY & NJ Harbor Navigation Project August 2003 2002–2003 Aquatic Biological Draft Survey Report
22
4.1 ALL SPECIES The finfish composition is typical of Atlantic seaboard estuaries within the Middle
Atlantic Bight. White perch, spotted hake and bay anchovy dominated the species
composition in the Harbor during the bottom trawl survey. White perch are semi-
anadramous and can tolerate a range of salinities, typically preferring higher salinities in
during the winter (Able and Fahay 1998). Spotted hake and bay anchovy were more
common in the Lower and Upper bays. These species are common in shallow estuaries;
using the habitat as a nursery and for foraging (Able and Fahay 1998).
Many species spawn in the harbor seasonally, while others spawn offshore on the
continental shelf or in the Harbor tributaries. This seasonality and preference for
different spawning habitat influenced the occurrence and relative density of species
collected during the sampling program. Species that spawn in the Harbor such as
Atlantic menhaden, bay anchovy, windowpane, and winter flounder were present in high
densities during their seasonal spawning period (March through July). Other species -
American shad, bay anchovy, striped bass and white perch were less abundant because
they do not typically spawn in the harbor proper.
4.2 WINTER FLOUNDER Spatial and temporal trends observed in winter flounder abundance in 2002-2003 support
that different areas of the Harbor are important to winter flounder at different stages of
their life history. Of the three Harbor areas sampled, adult winter flounder were most
common in the Upper and Lower Bays during January to March, the peak spawning
period in the study area (Able and Fahay 1998).
Sexually mature winter flounder were collected in larger numbers in the Upper Bay and
the Lower Bay than in the Arthur Kill/Newark Bay. Sex ratios varied slightly among the
main sampling areas. The sex ratio favored females at all sites but the difference was
most pronounced in the Upper Bay and Lower Bay. Stoner et al. (1999) identified in the

NY & NJ Harbor Navigation Project August 2003 2002–2003 Aquatic Biological Draft Survey Report
23
Navesink River estuary that females outnumbered males in the middle and upper reaches
of the estuary, with males more abundant in the lower estuary.
Winter flounder adults were collected in both the shallow/shoals and navigation channel
habitats; consistent with previous Harbor studies (NMFS 1994; USACE 1999). In the
2001–2002 program, however, winter flounder adults were more common in the
navigation channels (USACE 2002). Winter flounder can spawn over depths ranging
from 2 to 80 m (NMFS 1999), thus the potential for spawning in both habitat types
throughout the Harbor exists. The differences in the depth at which eggs were found
across years may result from multiple factors (e.g. temperature, flow, sediment) acting
either alone or in combination.
The predominance of winter flounder eggs from February to March in the Lower Bay and
to a lesser degree in the Upper Bay in both the 2001-2002 and 2002-2003 programs
provides further support for the view that the Lower Bay provides important winter
flounder spawning habitat. Alternatively, few winter flounder eggs were collected in the
Arthur Kill/Newark Bay. Because winter flounder produce demersal eggs that adhere to
the substrate it is assumed that the location in which the eggs are collected is primary
spawning habitat.
Winter flounder juveniles seek nursery habitat in estuaries of the Middle Atlantic Bight to
feed and grow (Able and Fahay 1998). Juvenile winter flounder were most common in
the upper sections of the Harbor (Arthur Kill/Newark Bay and parts of the Upper Bay),
where little spawning occurred. The previous sampling programs in the Harbor identified
that young winter flounder move from the primary spawning area in the Lower Bay and
the lower reached of the Upper Bay to areas further into the Harbor estuary (USACE
2001, USACE 2002). The 2002–2003 Aquatic Biological Survey provides additional
support to these findings, which indicate that winter flounder move or disperse further
into the New York and New Jersey Harbor Estuary after hatching. This pattern suggests
that winter flounder eggs are laid primarily in the Lower Bay and to a lesser degree in

NY & NJ Harbor Navigation Project August 2003 2002–2003 Aquatic Biological Draft Survey Report
24
other areas of the Harbor. After hatching and developing into larvae, winter flounder
move from the spawning areas further into the Harbor seeking nursery habitat.

NY & NJ Harbor Navigation Project August 2003 2002–2003 Aquatic Biological Draft Survey Report
25
5.0 LITERATURE CITED
Chant, R. J., M. C. Curran, K. W. Able, and S. M. Glenn. 2000. Delivery of winter
flounder (Pseudopleuronectes americanus) larvae to settlement habitats in cover
near tidal inlets. Estuarine Coastal and Shelf Sciences 5 1:529-541.
U.S. Army Corps of Engineers - New York District (USACE-NYD). 1999. New York
Jersey Harbor navigation study. Biological Monitoring Program December 1999.
U.S. Army Corps of Engineers - New York District (USACE-NYD). 2002. New York and
New Jersey Harbor Navigation Program. Supplemental sampling program 2000–
2001.
U.S. Army Corps of Engineers - New York District (USACE-NYD) 2003. . New York
and New Jersey Harbor Navigation Program. Biological Monitoring Program
2001–2002.
U.S. Army Corps of Engineers - New York District (USACE-NYD) and the Port -
Authority of NY & NJ. 1998. Draft species profiles: winter flounder
(Pleuronectes americanus) and striped bass (Morone saxatilis), general life
history and model threshold values.
Witherell, D. 13. 1993. Growth and maturation of winter flounder, Pleuronectes
americanus, in Massachusetts. Fishery Bulletin 91:816-820.

1 NY & NJ Harbor Navigation Project August 2003 2002-2003 Aquatic Biological Survey Report
Table 2-1 Description of stations sampled during the 2002–2003 Aquatic Biological Sampling Program.
GPS Coordinates (deg., min., sec.)
Start End
Area
Station Name Type
Station Location
Average
Depth (ft)
North West North West
SB–1* Shallow/shoal Gowanus Bay Interpier South
27 40:39.45 74:00.86 40:39.56 74:01.05
SB–2 ** Shallow/shoal Gowanus Bay Interpier 30 40:39.60 74:00.48 40:39.75 74:00.75 SB–3* Shallow/shoal Bay Ridge Flats 22 40:39.36 74:02.26 40:38.91 74:02.36 SB–4 ** Navigation
Channel Bay Ridge Channel 42 40:39.28 74:01.52 40:38.98 74:01.79
SB–5* Navigation Channel
Anchorage Channel Middle
57 40:39.53 74:03.30 40:39.69 74:03.19
South Brooklyn/ Upper Bay
SB–6 ** Navigation Channel Anchorage Channel South 49 40:38.76 74:03.11 40:38.48 74:02.98
PJ–1 ** Shallow/shoal Jersey Flats 12 40:39.91 74:03.57 40:40.17 74:03.45 PJ–2* Shallow/shoal Caven Point 10 40:40.62 74:03.44 40:41.02 74:03.35 PJ–3 ** Shallow/shoal Constable Hook 13 40:39.75 74:04.75 40:39.53 74:04.19 PJ–4 ** Navigation
Channel Port Jersey Channel 39 40:39.91 74:04.11 40:40.07 74:04.51
Port Jersey
PJ–5* Navigation Channel Port Jersey Channel East 42 40:39.48 74:03.64 40:39.78 74:03.96
NB–3* Shallow/shoal Newark Bay Flats Middle 10 40:41.06 74:07.61 40:41.40 74:07.44 NB–4* Shallow/shoal Newark Bay Flats South 16 40:40.72 74:07.76 40:40.38 74:07.92 NB–5 ** Navigation
Channel Newark Bay Middle Reach
42 40:40.59 74:07.96 40:40.19 74:08.26
NB–6 ** Navigation Channel Newark Bay South Reach 46 40:39.44 74:08.52 40:39.15 74:08.75
Newark Bay
NB–7* Shallow/shoal Elizabeth Flats North 13 40:39.62 74:09.29 40:39.51 74:08.99 Lower Bay LB–1 Shallow/shoal East Bank 13 40:33.45 74:00.24 40:33.94 74:00.52
LB–2 Navigation Channel
North End Ambrose Channel
50 40:33.23 74:01.54 40:33.40 74:01.55
LB–3 Shallow/shoal Swash Channel Range 17 40:33.34 74:04.46 40 33.00 74 04.44 LB–4 Navigation
Channel Chapel Hill South Channel
30 40:31.06 74:02.41 40:30.64 74:02.39
LB–5 Shallow/shoal Old Orchard Shoals 13 40:30.59 74:04.72 40:30.75 74:05.22 LB–6 Navigation
Channel Raritan Bay East Reach 41 40 29.41 74 06.39 40 29.53 74 06.90
Arthur Kill AK-1 Shallow/shoal Elizabeth Flats South 19 40:38.84 74:10.58 40:38.85 74:10.13 AK-2 Navigation
Channel North of Shooter Island Reach
39 40:38.80 74:10.75 40:38.77 74:10.26
AK-3 Navigation Channel Elizabeth Reach 42 40:38.32 74:11.59 40:38.53 74:11.30
AK-4 Shallow/shoal Prall's Island 20 40:36.83 74:11.91 40:36.24 74:11.82 * Also sampled during the 2000 - 2001 Supplemental Sampling Program ** Also sampled during the NYNJHN 1998 – 1999 Baseline Program and 2000-2001 Supplemental Sampling Program

2 NY & NJ Harbor Navigation Project August 2003 2002-2003 Aquatic Biological Survey Report
Table 2-2 Specifications of bottom trawl used to collect adult finfish during the 2001-2002 Aquatic Biological Sampling Program.
Part Specification Headrope 25.9 ft. (7.9 m) Footrope 27.9 ft (8.5 m) Wing height 3.6 ft. (1.1 m) Total length 35.1 ft (10.7 m) Wing mesh (square) 2.0-in. (5.1 cm) Body mesh (square) 2.0-in. (5.1 cm) Cod end mesh (square) 0.75-in. (1.9 cm) Cod end liner mesh (square) 0.25-in. (0.6 cm) Trawl doors 32.0 x 17.0 x 0.75-in (79.2
x 39.6 x 3.1 cm) Tow line length 5 times maximum station
water depth

3 NY & NJ Harbor Navigation Project August 2003 2002-2003 Aquatic Biological Survey Report
Table 2-3 Specifications of epibenthic sled and plankton net used to collect early life stages of finfish during the 2001-2002 Aquatic Biological Sampling Program.
Part Specification Mouth diameter 0.5 m Overall length 3.0 m Mesh size 0.5 mm Cod-end diameter 10.1 cm Cod-end mesh 0.5 mm (PVC cod-end bucket) Epibenthic sled Constructed of PVC pipe

4 NY & NJ Harbor Navigation Project August 2003 2002-2003 Aquatic Biological Survey Report
Table 2-4 Water quality and velocity measurements made during the 2001-2002 Aquatic Biological Sampling Program.
Water Quality Parameter Units and Accuracy Sample Depths
Temperature +/- 0.2 Bottom
Dissolved oxygen +/- 0.5 mg/L Bottom
Conductivity +/- 100 microseimens Bottom

Species Dec-02 Jan-03 Feb-03 Mar-03 Apr-03 May-03 Jun-03Alewife 2.50 1.68Alosa sp. 0.04American Eel 0.08 0.09 0.25American Sandlance 0.08American Shad 0.42 0.30 0.14 0.30Atlantic Croaker 0.83 1.38Atlantic Herring 0.17 1.33 28.19 18.75Atlantic Menhaden 1.58 0.08 0.12Atlantic Silverside 0.04 0.15Atlantic Tomcod 0.04 3.64Bay Anchovy 2.46 0.54 1.74 5.46 8.98Black Sea Bass 0.04 0.08Blueback Herring 3.77 2.33 0.61 0.30 0.08 0.17 0.17Bluefish 0.12Butterfish 0.08 0.25Clearnose Skate 0.04Conger Eel 0.17 0.04Cunner 0.08 0.13 0.13 0.25 0.08Gadid unidentified 0.08Gizzard Shad 0.17 0.04 0.05Grubby 0.04 0.09 0.09Hogchocker 0.04Little Skate 2.40 4.17 0.51 0.61 0.67 0.50Naked Goby 0.04 0.09Northern Pipefish 0.25 0.29 0.09Northern Puffer 0.25Northern Searobin 0.08 0.08 0.08Northern Stargazer 0.08Oyster Toadfish 0.08Red Hake 0.60 3.46 0.29 0.39 0.33 1.42 0.25Scup 0.33 0.83Seaboard Goby 0.08Silver Hake 3.00 0.54Smallmouth Flounder 0.21 0.25 0.09 0.32Spiny Dogfish 0.08Spotted Hake 29.25 20.67 0.29 35.25 51.28 16.81Striped Bass 9.60 7.67 2.83 1.00 1.25 0.45Striped Cuskeel 0.67Striped Mullet 0.04Striped Searobin 1.01 0.42Summer Flounder 0.48 0.21 0.33 1.09 0.50Tautog 0.13 0.04 0.08Weakfish 0.50 0.08White Mullet 0.08White Perch 28.25 24.54 3.98 0.44 0.08Windowpane 0.98 2.31 1.75 1.87 3.75 2.09 0.95Winter Flounder 1.42 4.02 2.61 0.90 1.67 2.92 1.87
NY & NJ Harbor Navigation ProjectAugust 2003 2002-2003 Aquatic Biological Survey Report
Table 3-1a Monthly average trawl CPUE by species for all navigation channel stations combined during the 2002-2003 Aquatic Biological SamplingProgram.

Species Dec-02 Jan-03 Feb-03 Mar-03 Apr-03 May-03 Jun-03Alewife 8.36 0.86 1.99 0.45American Eel 0.08American Sandlance 4.92American Shad 0.62 0.04 0.06 0.04 0.09Atlantic Cod 1.67Atlantic Croaker 1.96 2.24Atlantic Herring 0.04 2.94 2.64Atlantic Menhaden 0.14 0.07Atlantic Silverside 1.41 0.07 0.10Atlantic Tomcod 8.48 14.50Bay Anchovy 0.74 0.19 0.46 78.25 29.52Black Sea Bass 0.07Blueback Herring 6.71 0.11 0.07 0.04 0.60 0.07 0.14Bluefish 0.07Conger Eel 0.04 0.12Cunner 0.31 0.12 0.07 0.04 0.07 0.07Gadid unidentified 0.07Gizzard Shad 0.65 0.04Grubby 0.19 0.04 0.04 0.14 0.07Little Skate 0.89 0.07 0.50 0.29 0.21Naked Goby 0.21 0.06 0.09Northern Pipefish 0.07 0.04 0.13 0.07Northern Puffer 0.36Northern Searobin 0.43Pollock 0.14 0.14Red Hake 0.07 0.21 0.14 0.07Scup 0.07 0.21Seaboard Goby 0.11 0.04Silver Hake 0.34 0.05Smallmouth Flounder 0.64 0.07 3.64 0.21 0.24Spiny Dogfish 0.07Spotted Hake 2.68 0.65 0.04 0.04 21.86 10.79 2.24Striped Bass 37.07 15.24 0.29 1.61 23.31 2.05 0.99Striped Cuskeel 0.43 0.07Striped Killifish 0.07 0.04Striped Mullet 0.06Striped Searobin 1.00Summer Flounder 0.97 0.14 0.08 2.50 0.66Tautog 0.07Weakfish 0.14White Mullet 0.18White Perch 73.46 19.53 0.74 0.26 4.83 0.45Windowpane 0.38 0.36 0.46 0.75 1.36 1.40 0.67Winter Flounder 1.73 3.27 0.49 0.42 6.21 3.38 0.74
NY & NJ Harbor Navigation ProjectAugust 2003 2002-2003 Aquatic Biological Survey Report
Table 3-1b Monthly average trawl CPUE by species for all shallow/shoal stations combined during the 2002-2003 Aquatic Biological Sampling Program.

Species Dec-02 Jan-03 Feb-03 Mar-03 Apr-03 May-03 Jun-03Alewife 3.75 0.41American Eel 0.28 0.75American Shad 0.16Atlantic Croaker 0.13Atlantic Herring 3.00 3.50 0.25Atlantic Menhaden 1.50 0.36Atlantic Tomcod 9.68Bay Anchovy 0.25 0.25 7.22 6.18Black Sea Bass 0.25Blueback Herring 2.50 0.25 0.43 0.50Bluefish 0.36Cunner 0.25 0.13 0.25Gizzard Shad 0.50 0.13Hogchocker 0.13Northern Pipefish 0.14Northern Searobin 0.25 0.25 0.25Northern Stargazer 0.25Oyster Toadfish 0.25Red Hake 0.25 0.21 0.50 0.25Smallmouth Flounder 0.28 0.96Spotted Hake 0.50 0.13 0.14 21.00 70.33 41.43Striped Bass 21.25 17.13 4.46 2.59 2.25 1.36Striped Searobin 0.53Summer Flounder 0.50 0.28 0.75Tautog 0.13White Perch 83.00 73.63 11.68 1.44 0.25Windowpane 0.44 0.21 0.29 1.28 1.36Winter Flounder 0.75 5.94 2.20 0.71 1.00 0.25 3.86
Species Dec-02 Jan-03 Feb-03 Mar-03 Apr-03 May-03 Jun-03Alewife 9.09 1.19 0.84 0.60American Eel 0.22American Sandlance 0.20American Shad 0.17 0.10 0.25Atlantic Croaker 0.10Atlantic Herring 8.24 0.80Atlantic Menhaden 0.40Atlantic Silverside 2.20Atlantic Tomcod 1.20 0.60Bay Anchovy 0.49 0.43 0.10 170.02 10.26Blueback Herring 1.00Cunner 0.20Gizzard Shad 1.83 0.10Naked Goby 0.20 0.17Northern Pipefish 0.20 0.10 0.20Northern Puffer 0.20Red Hake 0.20Seaboard Goby 0.10Silver Hake 0.29 0.14Smallmouth Flounder 8.60Spotted Hake 0.57 0.10 0.10 27.27 5.80 0.54Striped Bass 45.60 28.90 0.43 3.22 17.47 2.60 2.58Striped Cuskeel 1.20Striped Killifish 0.20 0.10Striped Mullet 0.17Summer Flounder 0.22 1.80 0.86Tautog 0.20White Perch 205.49 54.69 1.97 0.73 13.51 0.60Windowpane 1.00Winter Flounder 3.20 3.91 0.56 0.57 2.18 1.00 0.89
NY & NJ Harbor Navigation ProjectAugust 2003 2002-2003 Aquatic Biological Survey Report
Shallow/Shoal Stations
Navigation Channel Stations
Table 3-2 a Monthly average CPUE by species for all navigation channel and shallow/shoal stations combined at Arthur Kill/Newark Bay during the 2002-2003 Aquatic Biological Sampling Program.

Species Dec-02 Jan-03 Feb-03 Mar-03 Apr-03 May-03 Jun-03Alewife 1.60 1.30Alosa sp. 0.10American Shad 0.80 0.33 0.60Atlantic Croaker 1.40 3.20Atlantic Herring 0.30 0.80 8.44Atlantic Menhaden 0.60 0.10Atlantic Silverside 0.17Atlantic Tomcod 0.10 1.00Bay Anchovy 1.10 0.70 0.90 7.13 4.40Black Sea Bass 0.10Blueback Herring 6.85 1.30 1.37 0.40 0.20 0.40Clearnose Skate 0.10Conger Eel 0.10Cunner 0.20 0.20 0.60Gizzard Shad 0.11Grubby 0.10 0.20 0.22Little Skate 1.15 4.00 0.33 0.80 1.60 0.60Naked Goby 0.10 0.20Northern Pipefish 0.40 0.10 0.10Northern Puffer 0.60Red Hake 0.65 0.80 0.53 0.80 0.60 2.40 0.40Silver Hake 0.10Smallmouth Flounder 0.40 0.60Spotted Hake 11.80 6.10 0.57 66.60 21.20 6.00Striped Bass 5.05 4.50 3.23 0.50 1.20Striped Cuskeel 1.60Striped Mullet 0.10Striped Searobin 2.00 0.20Summer Flounder 0.75 0.10 0.40 1.20 0.40Tautog 0.20 0.20Weakfish 0.60 0.20White Perch 1.00 0.20Windowpane 0.95 4.10 3.93 3.30 8.80 2.60 0.40Winter Flounder 1.80 4.10 4.40 1.58 2.20 1.20 1.00
Species Dec-02 Jan-03 Feb-03 Mar-03 Apr-03 May-03 Jun-03Alewife 11.11 0.93 3.94 0.56American Sandlance 1.97American Shad 1.28Atlantic Cod 3.89Atlantic Croaker 4.58 5.14Atlantic Herring 4.83Atlantic Menhaden 0.17Atlantic Silverside 0.79 0.22Atlantic Tomcod 18.78 33.33Bay Anchovy 0.17 0.09 1.00 39.89 40.67Black Sea Bass 0.17Blueback Herring 15.67 0.08 0.08 0.56 0.17Conger Eel 0.08 0.28Cunner 0.56 0.28 0.17 0.08 0.17Grubby 0.44 0.08 0.08 0.33 0.17Little Skate 1.25 0.08 0.17 0.17Naked Goby 0.33 0.21Northern Pipefish 0.29Northern Puffer 0.17Northern Searobin 0.83Pollock 0.33 0.33Red Hake 0.17 0.33 0.17Scup 0.17Seaboard Goby 0.25Silver Hake 0.56Smallmouth Flounder 1.50 0.08 1.17 0.50 0.56Spotted Hake 3.61 1.28 0.08 20.78 13.33 3.44Striped Bass 48.50 11.49 0.33 1.08 39.83 2.61 0.17Striped Searobin 2.00Summer Flounder 1.60 4.00 0.83Weakfish 0.33White Mullet 0.42White Perch 0.17 0.08 0.56Windowpane 0.21 0.33 1.00 1.25 1.83 2.61 1.56Winter Flounder 1.21 4.28 0.59 0.42 10.50 6.89 0.83
NY & NJ Harbor Navigation ProjectAugust 2003 2002-2003 Aquatic Biological Survey Report
Shallow/Shoal Stations
Navigation Channel Stations
Table 3-2 b Monthly average CPUE by species for all navigation channel and shallow/shoal stations combined at Upper Bay during the 2002-2003 Aquatic Biological Sampling Program.

Species Dec-02 Jan-03 Feb-03 Mar-03 Apr-03 May-03 Jun-03Alewife 2.33 4.00American Eel 0.33American Sandlance 0.33American Shad 0.33 1.00 0.17Atlantic Croaker 1.00Atlantic Herring 0.17 94.00 74.67Atlantic Menhaden 3.33 0.17Atlantic Silverside 0.17 0.33Bay Anchovy 7.67 0.67 5.17 0.33 20.33Blueback Herring 0.33 6.83 0.17Butterfish 0.33 1.00Conger Eel 0.67Cunner 0.17Gadid unidentified 0.33Little Skate 7.67 10.00 1.50 1.00 1.00Northern Pipefish 0.33 1.00Red Hake 1.00 12.50 0.17 0.33 1.00Scup 1.33 3.33Seaboard Goby 0.33Silver Hake 12.00 2.00Smallmouth Flounder 0.17Spiny Dogfish 0.33Spotted Hake 96.67 72.33 2.00 76.00 2.00Striped Bass 1.67 0.33Striped Searobin 1.33Summer Flounder 0.67 0.67 2.00 0.33Tautog 0.17Weakfish 1.00White Mullet 0.33White Perch 0.67Windowpane 2.33 1.83 0.17 1.33 0.33 2.33 1.33Winter Flounder 1.67 1.33 0.17 1.67 9.33 0.67
Species Dec-02 Jan-03 Feb-03 Mar-03 Apr-03 May-03 Jun-03Alewife 1.67 0.17American Sandlance 18.67American Shad 0.33 0.17Atlantic Herring 0.17 1.33Atlantic Silverside 1.33 0.33Bay Anchovy 2.33 2.00 39.33Blueback Herring 0.33 0.33 0.67Bluefish 0.33Cunner 0.33Gadid unidentified 0.33Little Skate 1.67 0.17 2.33 1.00 0.67Northern Puffer 1.00Northern Searobin 0.33Red Hake 0.67Scup 1.00Smallmouth Flounder 0.17 0.33Spiny Dogfish 0.33Spotted Hake 4.33 0.33 15.00 14.00 2.67Striped Cuskeel 0.33Striped Searobin 0.67Summer Flounder 1.33 0.67 0.67Windowpane 1.33 1.00 0.17 1.00 1.00 1.33Winter Flounder 0.33 0.17 0.17 0.17 4.33 0.33 0.33
NY & NJ Harbor Navigation ProjectAugust 2003 2002-2003 Aquatic Biological Survey Report
Shallow/Shoal Stations
Navigation Channel Stations
Table 3-2 c Monthly average CPUE by species for all navigation channel and shallow/shoal stations combined at Lower Bay during the 2002-2003 Aquatic Biological Sampling Program.

Species January February March April May June JulyAtlantic menhaden 82.29 255.78Bay anchovy 189.68 966.27Fourbeard rockling 0.87Labridae 10.32 16.55 89.00Prionotus sp. 33.29Unidentified 0.53Weakfish 56.54Windowpane 41.34 304.21Winter flounder 0.91
Species January February March April May June JulyGrubby 0.68Winter flounder 0.53 63.10
Species January February March April May June JulyAmerican sandlance 0.53 1.86Atlantic croaker 2.24Atlantic herring 7.05 2.16 1.58Atlantic mackerel 3.61Atlantic menhaden 0.53Atlantic silverside 0.75 0.69Atlantic tomcod 1.53Bay anchovy 4.80 1524.12Clupeid unidentified 3.27 1.72Gobiid unidentified 40.23Grubby 1.29 26.23 1.64Northern pipefish 2.14Rock gunnel 1.10Striped bass 0.53Summer flounder 0.70Tautog 2.55Unidentified 5.96Weakfish 10.12Windowpane 2.96 2.55Winter flounder 1.06 40.73 170.74 23.96
Species January February March April May June JulyAtlantic croaker 2.11Atlantic tomcod 1.58Bay anchovy 0.99Northern pipefish 8.55Windowpane 1.43 1.72
NY & NJ Harbor Navigation ProjectAugust 2003 2002-2003 Aquatic Biological Survey Report
Egg
Juvenile
Yolk-sac Larvae
Post-yolk sac Larvae
Table 3-3 a Monthly average ichthyoplankton density (Number/1000 m³) by species for all navigation channel stations in Arthur Kill/Newark Bay, 2002-2003 Aquatic Biological Sampling Program.

Species January February March April May June JulyAtlantic menhaden 5.19 219.05Bay anchovy 127.23 41.02Hogchocker 21.93Labridae 2.67 8.95 59.79Weakfish 4.17Windowpane 9.45 315.64Winter flounder 1.15 0.55
Species January February March April May June JulyAtlantic menhaden 1.28Atlantic silverside 0.78Grubby 0.56 0.87Unidentified 0.53White perch 8.39Windowpane 0.73 0.53Winter flounder 97.65 1.60
Species January February March April May June JulyAmerican sandlance 1.80Atlantic croaker 2.46Atlantic herring 1.81 0.60Atlantic menhaden 2.99 0.56 37.48 13.46Atlantic silverside 1.03 0.95Bay anchovy 1221.90Clupeid unidentified 0.47Fourspot flounder 0.46Gobiid unidentified 0.50 166.44Grubby 1.87 12.54 1.68Longhorn sculpin 1.87Northern pipefish 3.32 15.55Rock gunnel 1.18 0.45Striped bass 5.68Unidentified 5.27Weakfish 0.49 9.60Windowpane 2.31 1.15Winter flounder 0.63 298.46 89.06 3.72
Species January February March April May June JulyBay anchovy 2.35Winter flounder 1.23
NY & NJ Harbor Navigation ProjectAugust 2003 2002-2003 Aquatic Biological Survey Report
Post-yolk sac Larvae
Lifestage: Juvenile
Egg
Yolk-sac Larvae
Table 3-3 b Monthly average ichthyoplankton density (Number/1000 m³) by species for all shallow/shoal stations in Arthur Kill/Newark Bay, 2002-2003 Aquatic Biological Sampling Program.

Species January February March April May June JulyAtlantic mackerel 26.43Atlantic menhaden 4.87 1715.34Bay anchovy 917.16 146.96Fourbeard rockling 13.16 0.57Hogchocker 41.06 2.16Labridae 3.57 1977.62 926.87Prionotus sp. 1132.56 479.08Weakfish 103.69 526.45Windowpane 11.83 233.84 4035.46Winter flounder 2.72 121.43 1.31 0.43
Species January February March April May June JulyGrubby 3.11Winter flounder 1.16 55.29 4.11
Species January February March April May June JulyAmerican sandlance 0.62 2.99 2.14Atlantic herring 8.05 7.99Atlantic mackerel 9.54Atlantic menhaden 0.53 7.86 9.98Atlantic silverside 0.76Bay anchovy 377.84Clupeid unidentified 22.14Conger eel 0.59Fourbeard rockling 0.52Gobiid unidentified 122.44Grubby 1.27 12.47 10.44Northern pipefish 11.58Northern puffer 0.82Rock gunnel 0.36 0.84 4.09 7.59Striped bass 0.59Summer flounder 2.07Tautog 5.05Unidentified 4.75Weakfish 33.40Windowpane 1.60 50.54 12.90Winter flounder 240.91 450.17 15.07
Species January February March April May June JulyAtlantic croaker 8.71Atlantic tomcod 0.37Windowpane 3.59
NY & NJ Harbor Navigation ProjectAugust 2003 2002-2003 Aquatic Biological Survey Report
Egg
Juvenile
Yolk-sac Larvae
Post-yolk sac Larvae
Table 3-3 c Monthly average ichthyoplankton density (Number/1000 m³) by species for all navigation channel stations in Upper Bay, 2002-2003 Aquatic Biological Sampling Program.

Species January February March April May June JulyAtlantic mackerel 10.93Atlantic menhaden 2417.75 23.11Bay anchovy 987.23 3047.74Fourbeard rockling 7.29Hogchocker 11.51Labridae 8.55 544.01 2137.47Prionotus sp. 169.56 335.47Unidentified 0.42Weakfish 1003.26Windowpane 25.92 168.69 2144.11Winter flounder 0.83 26.91 1.18
Species January February March April May June JulyAtlantic menhaden 2.88Fourspot flounder 1.44Grubby 5.39Longhorn sculpin 0.53Windowpane 1.23Winter flounder 9.78 90.62
Species January February March April May June JulyAmerican sandlance 0.87Atlantic croaker 1.12Atlantic herring 3.85Atlantic mackerel 2.68Atlantic menhaden 54.04 11.00Bay anchovy 1.00 517.86Gobiid unidentified 233.04Grubby 2.64 28.45Northern pipefish 3.98 31.70Northern puffer 2.34Rock gunnel 1.84 2.09Striped bass 0.96Tautog 4.19Unidentified 12.35Walleye 2.89Weakfish 10.71Windowpane 17.99 1.69Winter flounder 2.38 270.79 111.60 4.77
Species January February March April May June JulyAtlantic croaker 3.96Atlantic tomcod 0.28
NY & NJ Harbor Navigation ProjectAugust 2003 2002-2003 Aquatiac Biological Survey Report
Post-yolk sac Larvae
Juvenile
Egg
Yolk-sac Larvae
Table 3-3 d Monthly average ichthyoplankton density (Number/1000 m³) by species for all shallow/shoal stations in Upper Bay, 2002-2003 Aquatic Biological Sampling Program.

Species January February March April May June JulyAtlantic mackerel 134.97Atlantic menhaden 24.83 3412.38Bay anchovy 1769.95 127.66Gadid unidentified 0.84Labridae 16.69 1363.57 122.58Prionotus sp. 740.13 91.53Weakfish 176.86 130.49Windowpane 29.62 209.02 1640.39Winter flounder 165.72 14.78 6.46
Species January February March April May June JulyAtlantic menhaden 1.55Grubby 0.84 2.95Rock gunnel 1.68Windowpane 3.10 0.76Winter flounder 82.21
Species January February March April May June JulyAmerican sandlance 1.42 7.53Atlantic herring 1.12Atlantic mackerel 86.22Atlantic menhaden 4.66 8.80Atlantic tomcod 1.55Bay anchovy 12.45 1119.90Clupeid unidentified 0.86 66.38Gobiid unidentified 147.20Grubby 1.55 103.02Northern pipefish 5.94 53.89Rock gunnel 1.61 3.51 12.22Unidentified 3.84Walleye 1.38Weakfish 34.73Windowpane 33.14 153.13 11.21Winter flounder 347.19 676.87 5.40
Species January February March April May June JulyWindowpane 1.17
NY & NJ Harbor Navigation ProjectAugust 2003 2002-2003 Aquatic Biological Survey Report
Egg
Juvenile
Yolk-sac Larvae
Post-yolk sac Larvae
Table 3-3 e Monthly average ichthyoplankton density (Number/1000 m³) by species for all navigation channel stations in Lower Bay, 2002-2003 Aquatic Biological Sampling Program.

Species January February March April May June JulyAtlantic mackerel 104.74Atlantic menhaden 38.12 10353.47 1.82Bay anchovy 5263.38 38.60Labridae 13.20 5264.90 62.35Prionotus sp. 448.61 257.82Unidentified 8.25Weakfish 168.81 149.16Windowpane 89.06 172.50 2173.57Winter flounder 8.14 168.00 3.20
Species January February March April May June JulyAmerican sandlance 0.78Atlantic menhaden 3.49Grubby 5.98Longhorn sculpin 0.91Windowpane 1.13Winter flounder 1.26 153.51
Species January February March April May June JulyAmerican sandlance 3.79Atlantic mackerel 25.08Atlantic menhaden 22.67 9.33Bay anchovy 14.25 271.36Fourbeard rockling 1.62 0.74 2.84Gobiid unidentified 56.27Grubby 36.77 3.59Northern pipefish 8.70 14.46Rock gunnel 1.48 3.19 0.94 2.24Tautog 2.56Unidentified 8.51Weakfish 0.97 8.77Windowpane 22.67 72.44Winter flounder 1889.01 406.16 3.35
Species January February March April May June July
NY & NJ Harbor Navigation ProjectAugust 2003 2002-2003 Aquatic Biological Survey Report
Post-yolk sac Larvae
Juvenile
Egg
Yolk-sac Larvae
Table 3-3 f Monthly average ichthyoplankton density (Number/1000 m³) by species for all shallow/shoal stations in Lower Bay, 2002-2003 AquaticBiological Sampling Program.

����� �� ��
�
� � � � � � �� � � � � �
� � � �
� � � � �
� � �
� � �� � �
� � � � � �
� � �
� � �
�
�
�
� � �
� � � � � �
� � �
� �
� �
� � �
� � �� � �
� � �
� � �
� �
� � , � � � - � � .
* - ( ( / . "
� # ' # � " � � � ' " &
� ' " $ ' # # ' "
� � � � � �
� ' � � � � ( % ' # ( "
� - � & 0 � & � % $ ' " " �
� � � � � � � � � � � � � � ' � ( 1 � � ' � " 0 � � # ' # ( " � � & 2 - " 0 � # $ � � � � � 3 4 � � � � � � 5 2 ' # % � * ( ( 0 % ' � � ' � " 0 � � - ( 0 - ' � 6
� � � � �
7 � � �
ArthurKill/
NewarkBay
UpperBay
LowerBay
Figure 3-1 Average weekly trawl CPUE for all species combined at navigation channeland shallow/shoal stations in the three study areas, 2002-2003 Aquatic Biological Sampling Program. Note(s) Dates listed indicate the first day of each sample week.
NY & NJ Harbor Navigation ProjectAugust 2003 2002-2003 Aquatic Biological Survey Report
SAMPLE WEEK
CPU
E (N
umbe
r Fis
h / 1
0 M
in. T
ow)
0
50
100
150
200
250 Channel StationsShallow/Shoal Stations
0
50
100
150
200
250
0
50
100
150
200
250
12/17/02 1/7/03 1/21/03 2/4/03 2/19/03 3/4/03 3/18/03 4/15/03 4/22/03 5/13/03 6/17/03

Figure 3-2 Species composition of trawl catches from Arthur Kill/Newark Bay stations during the 2002-2003 Aquatic Biological Sampling Program.
NY & NJ Harbor Navigation ProjectAugust 2003 2002-2003 Aquatic Biological Survey Report
2003-January (total collected=1714)
Winter Flounder
5%
Atlantic Silverside
1%
Other3%
Striped Bass25%
White Perch66%
2003-April (total collected=525)
Spotted Hake43%
Striped Bass18%
Atlantic Herring
10%
Smallmouth Flounder
8%
White Perch13%
Winter Flounder
3%
Other5%
2002-December (total collected=1797)
Striped Bass17%
Alewife3%
White Perch77%
Winter Flounder
1%
Other2%
2003-February (total collected=184)
Striped Bass22%
White Perch61%
Other4%Winter
Flounder13%
2003-March (total collected=88)
Winter Flounder
12%
Windowpane2%
Striped Bass57%
Other6%
White Perch20%
Blueback Herring
3%
2003-May (total collected=1270)
Striped Bass1%
Other4%
Atlantic Herring
1%
Spotted Hake24%
Bay Anchovy70%
2003-June (total collected=349)
Spotted Hake48%
Bay Anchovy22%
Winter Flounder
6%
Striped Bass4%
Atlantic Tomcod
12%
Summer Flounder
2%
Other6%

Figure 3-3 Species composition of trawl catches from Upper Bay stationsduring the 2002-2003 Aquatic Biological Sampling Program.
NY & NJ Harbor Navigation ProjectAugust 2003 2002-2003 Aquatic Biological Survey Report
2003-January (total collected=647)Other18%
Little Skate6%
Striped Bass29%
Atlantic Croaker
14%Spotted Hake12% Winter
Flounder14%
Windowpane7%
2003-April (total collected=912)
Striped Bass27%
Winter Flounder
8%
Spotted Hake50%
Other6%
Alewife3%
Windowpane6%
2002-December (total collected=765)
Spotted Hake11%
Atlantic Croaker
5%
Alewife10%
Blueback Herring
17%
Striped Bass40%
Other17%
2003-February (total collected=181)
Winter Flounder
28%
Windowpane28%
Blueback Herring
8%
Red Hake3%
Striped Bass20%
Other13%
2003-March (total collected=160)
Other21% Windowpane
31%
Little Skate5%
Bay Anchovy13%
Winter Flounder
13%
Red Hake6%
Striped Bass11%
2003-May (total collected=826)
Windowpane3%
Striped Searobin
3%
Other6%
Atlantic Herring
9%
Winter Flounder
6%
Summer Flounder
4%
Bay Anchovy32%
Atlantic Tomcod
14%
Spotted Hake23%
2003-June (total collected=563)
Atlantic Tomcod
36%
Spotted Hake9% Bay Anchovy
48%
Other5%Windowpane
2%

Figure 3-4 Species composition of trawl catches from Lower Bay stations during the 2002-2003 Aquatic Biological Sampling Program.
NY & NJ Harbor Navigation ProjectAugust 2003 2002-2003 Aquatic Biological Survey Report
2003-January (total collected=717)
Little Skate9%
Blueback Herring
6%
Alewife3%
Red Hake10%
Spotted Hake61%
Other11%
2003-April (total collected=84)
Spotted Hake61%
Windowpane5%
Winter Flounder
21%
Other13%
2002-December (total collected=526)
Little Skate5%
Bay Anchovy6%
American Sandlance
11%
Spotted Hake57%
Other14%
Silver Hake7%
2003-February (total collected=37)
Blueback Herring
8%
Atlantic Silverside
11%
Little Skate63%
Other8%Windowpane
5%Winter
Flounder5%
2003-March (total collected=55)
Windowpane25%
Little Skate11% Bay Anchovy
57%
Other7%
2003-May (total collected=627)Other5%
Windowpane2%
Spotted Hake43%
Winter Flounder
5%
Atlantic Herring
45%
2003-June (total collected=451)
Atlantic Herring
49%
Spotted Hake3%
Bay Anchovy40%
Scup3%
Other5%

ArthurKill/
Newark Bay
UpperBay
LowerBay
Figure 3-5 Average weekly egg density of all species combined at navigation channel and shallow/shoal stations in the three study areas, 2002-2003 Aquatic Biological Sampling Program.
Note(s): Dates listed indicate the first day of each sample week. Note scale change for the three study areas.
NY & NJ Harbor Navigation ProjectAugust 2003 2002-2003 Aquatic Biological Survey Report
SAMPLE WEEK
Den
sity
(Num
ber/1
000
m3 )
0
200
400
600
800
1000
1200
1400
1600
1800Channel StationsShallow/Shoal Stations
0
2000
4000
6000
8000
10000
12000
14000
16000
18000
20000
0
5000
10000
15000
20000
25000
30000
1/21/03 2/4/03 2/19/03 3/4/03 3/18/03 4/1/03 4/15/03 4/30/03 5/13/03 6/3/03 6/17/03 7/8/03

Figure 3-6 Species composition of eggs collected at Arthur Kill/Newark Bay stations during the 2002-2003 Aquatic Biological Sampling Program.
NY & NJ Harbor Navigation ProjectAugust 2003 2002-2003 Aquatic Biological Survey Report
2003-February (total collected=0)
No Eggs Collected
2003-January (total collected=0)
No Eggs Collected
2003-March (total collected=3)
Winter flounder
73%
Unidentified27%
2003-April (total collected=3)
Fourbeard rockling
35%
Winter flounder
65%
2003-May (total collected=172)
Labridae9%
Atlantic menhaden
57%
Windowpane34%
2003-June (total collected=1951)
Bay anchovy21%
Labridae2% Hogchocker
2%
Atlantic menhaden
32%
Windowpane41%
Prionotus sp.2%
2003-July (total collected=770)
Weakfish5%
Bay anchovy82%
Labridae13%

Figure 3-7 Species composition of eggs collected at Upper Bay stations during the 2002-2003 Aquatic Biological Sampling Program.
NY & NJ Harbor Navigation ProjectAugust 2003 2002-2003 Aquatic Biological Survey Report
2003-February (total collected=7)
Winter flounder100%
2003-January (total collected=0)
No Eggs Collected
2003-March (total collected=232)
Winter flounder100%
2003-April (total collected=147)
Windowpane66%
Winter flounder
4%
Fourbeard rockling
30%
2003-May (total collected=663)Atlantic
menhaden1%Atlantic
mackerel9%
Labridae2%
Windowpane88%
2003-June (total collected=24695)
Prionotus sp.8%
Other1% Windowpane
38%
Labridae15%
Atlantic menhaden
26%
Bay anchovy12%
2003-July (total collected=7910)
Prionotus sp.9%
Labridae35%
Weakfish17%
Bay anchovy39%

Figure 3-8 Species composition of eggs collected at Lower Bay stations during the 2002-2003 Aquatic Biological Sampling Program.
NY & NJ Harbor Navigation ProjectAugust 2003 2002-2003 Aquatic Biological Survey Report
2003-February (total collected=154)
Winter flounder100%
2003-January (total collected=0)
No Eggs Collected
2003-March (total collected=193)Gadid
unidentified0.5% Winter
flounder99.5%
2003-April (total collected=208)
Windowpane92%
Winter flounder
8%
2003-May (total collected=418)
Atlantic menhaden
9%
Atlantic mackerel
34%
Labridae4%
Windowpane53%
2003-June (total collected=32292)
Weakfish1% Atlantic
menhaden42%Windowpane
12%
Bay anchovy21%
Labridae20%
Prionotus sp.4%
2003-July (total collected=361)
Other1%
Labridae19%
Weakfish28%
Bay anchovy17%
Prionotus sp.35%

ArthurKill/
NewarkBay
UpperBay
LowerBay
Figure 3-9 Average weekly yolk-sac larvae density of all species combined at navigationchannel and shallow/shoal sampling stations in the three study areas,2002-2003 Aquatic Biological Sampling Program.
Note(s): Dates listed indicate the first day of each sample week.
NY & NJ Harbor Navigation ProjectAugust 2003 2002-2003 Aquatic Biological Survey Report
SAMPLE WEEK
Den
sity
(Num
ber/1
000
m3 )
0
50
100
150
200
250
300
350
400
450
500Channel StationsShallow/Shoal Stations
0
50
100
150
200
250
300
350
400
450
500
0
50
100
150
200
250
300
350
400
450
500
1/21/03 2/4/03 2/19/03 3/4/03 3/18/03 4/1/03 4/15/03 4/30/03 5/13/03 6/3/03 6/17/03 7/8/03
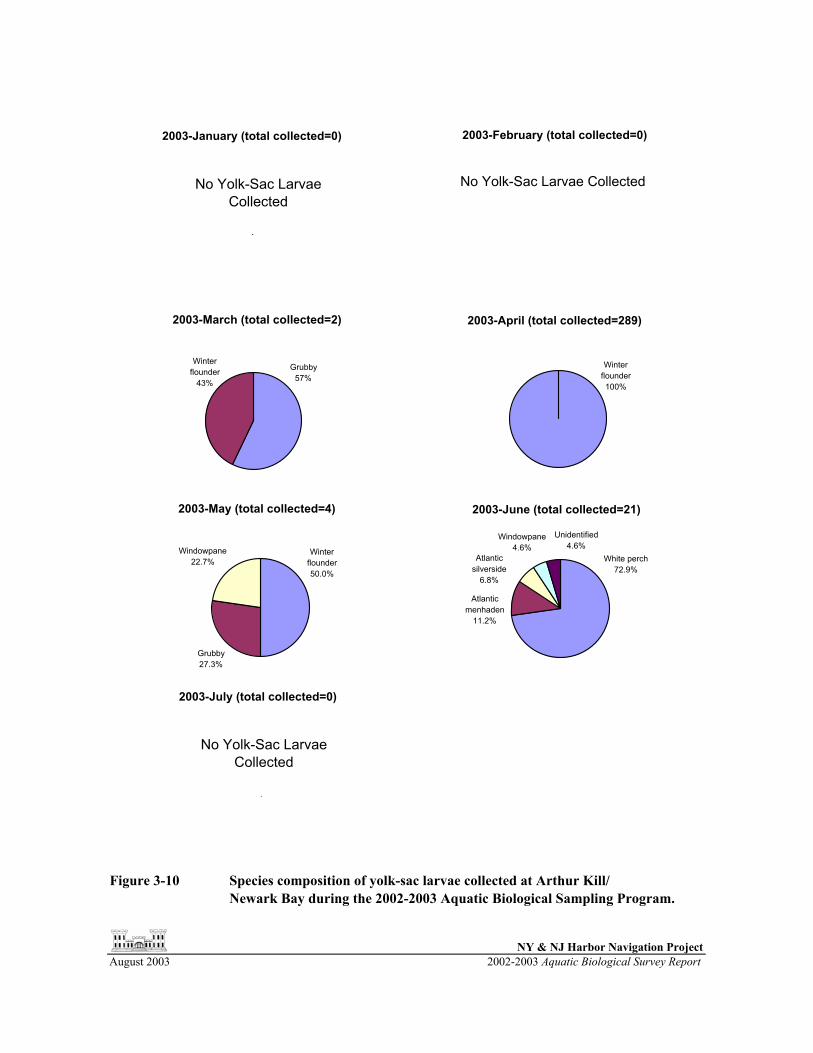
Figure 3-10 Species composition of yolk-sac larvae collected at Arthur Kill/Newark Bay during the 2002-2003 Aquatic Biological Sampling Program.
NY & NJ Harbor Navigation ProjectAugust 2003 2002-2003 Aquatic Biological Survey Report
2003-February (total collected=0)
No Yolk-Sac Larvae Collected
2003-January (total collected=0)
No Yolk-Sac Larvae Collected
2003-March (total collected=2)
Winter flounder
43%
Grubby57%
2003-April (total collected=289)
Winter flounder100%
2003-May (total collected=4)
Windowpane22.7%
Winter flounder50.0%
Grubby27.3%
2003-June (total collected=21)
Atlantic silverside
6.8%
Unidentified4.6%
Atlantic menhaden
11.2%
White perch72.9%
Windowpane4.6%
2003-July (total collected=0)
No Yolk-Sac Larvae Collected
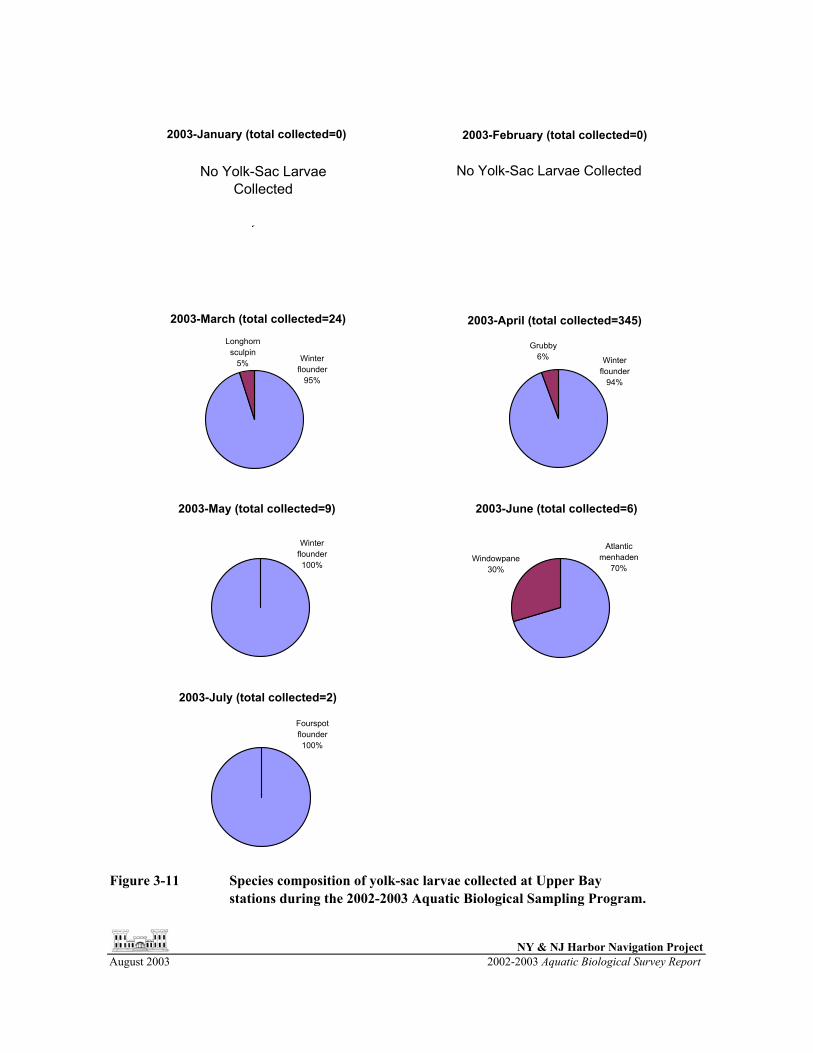
Figure 3-11 Species composition of yolk-sac larvae collected at Upper Baystations during the 2002-2003 Aquatic Biological Sampling Program.
NY & NJ Harbor Navigation ProjectAugust 2003 2002-2003 Aquatic Biological Survey Report
2003-February (total collected=0)
No Yolk-Sac Larvae Collected
2003-January (total collected=0)
No Yolk-Sac Larvae Collected
2003-March (total collected=24)
Winter flounder
95%
Longhorn sculpin
5%
2003-April (total collected=345)
Winter flounder
94%
Grubby6%
2003-May (total collected=9)
Winter flounder100%
2003-June (total collected=6)
Atlantic menhaden
70%Windowpane
30%
2003-July (total collected=2)
Fourspot flounder100%

Figure 3-12 Species composition of yolk-sac larvae collected at Lower Baystations during the 2002-2003 Aquatic Biological Sampling Program.
NY & NJ Harbor Navigation ProjectAugust 2003 2002-2003 Aquatic Biological Survey Report
2003-February (total collected=1)
American sandlance
100%
2003-January (total collected=0)
No Yolk-Sac Larvae Collected
2003-March (total collected=5)
Longhorn sculpin19%
Winter flounder
27%
Rock gunnel36%
Grubby18%
2003-April (total collected=327)
Winter flounder
96%
Grubby4%
2003-May (total collected=5)
Windowpane38%
Atlantic menhaden
62%
2003-June (total collected=2)
Windowpane100%
2003-July (total collected=0)
No Yolk-Sac Larvae Collected
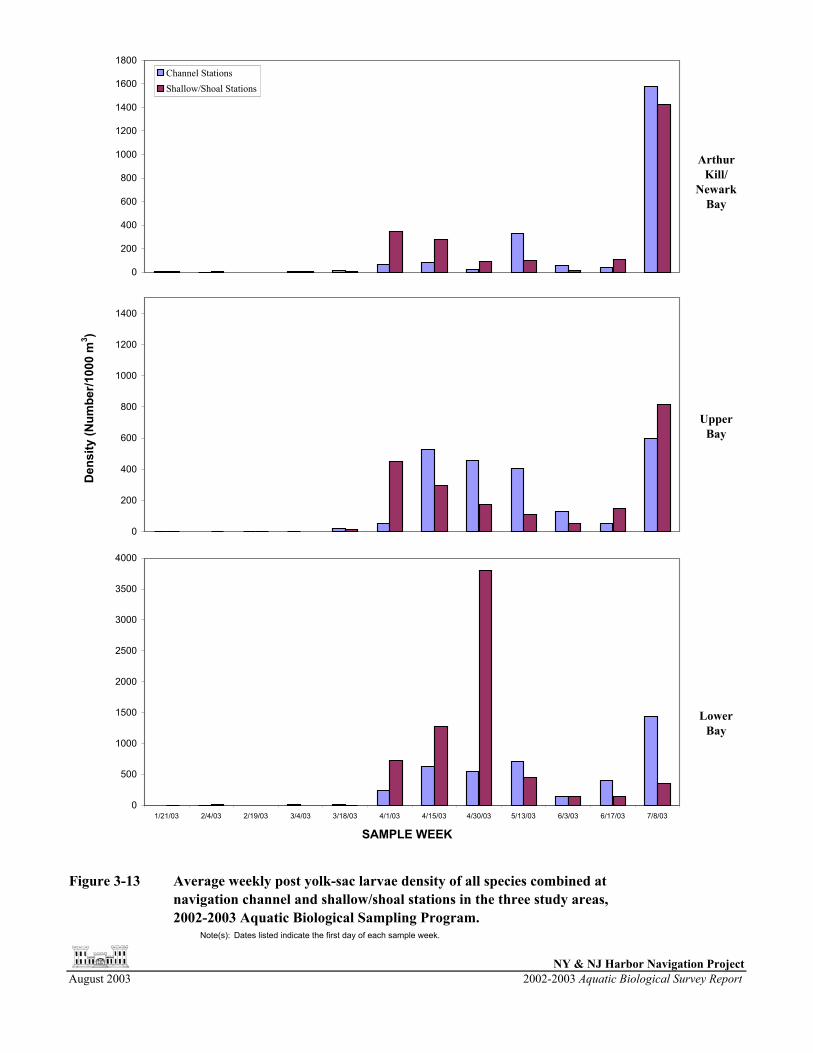
ArthurKill/
NewarkBay
UpperBay
LowerBay
Figure 3-13 Average weekly post yolk-sac larvae density of all species combined at navigation channel and shallow/shoal stations in the three study areas,2002-2003 Aquatic Biological Sampling Program.
Note(s): Dates listed indicate the first day of each sample week.
NY & NJ Harbor Navigation ProjectAugust 2003 2002-2003 Aquatic Biological Survey Report
SAMPLE WEEK
Den
sity
(Num
ber/1
000
m3 )
0
200
400
600
800
1000
1200
1400
1600
1800Channel StationsShallow/Shoal Stations
0
200
400
600
800
1000
1200
1400
0
500
1000
1500
2000
2500
3000
3500
4000
1/21/03 2/4/03 2/19/03 3/4/03 3/18/03 4/1/03 4/15/03 4/30/03 5/13/03 6/3/03 6/17/03 7/8/03

Figure 3-14 Species composition of post yolk-sac larvae collected at ArthurKill/Newark Bay stations during the 2002-2003 Aquatic BiologicalSampling Program.
NY & NJ Harbor Navigation ProjectAugust 2003 2002-2003 Aquatic Biological Survey Report
2003-February (total collected=3)
Summer flounder
32%
Rock gunnel68%
2003-January (total collected=8)
Rock gunnel11%
Atlantic menhaden
37%
Atlantic croaker
52%
2003-March (total collected=23)
Grubby21%
Atlantic herring53%
Winter flounder
10%
American sandlance
3%
Longhorn sculpin13%
2003-April (total collected=735)
Grubby9%
American sandlance
1%Winter
flounder89%
Other1%
2003-May (total collected=389)
Other2% Winter
flounder96%
Windowpane1%
Grubby1%
2003-June (total collected=170)
Northern pipefish
5%
Bay anchovy4%
Other12%
Winter flounder
23%
Unidentified10%
Atlantic menhaden
40%
Striped bass6%
2003-July (total collected=2251)
Bay anchovy91%
Other2%
Gobiid unidentified
7%
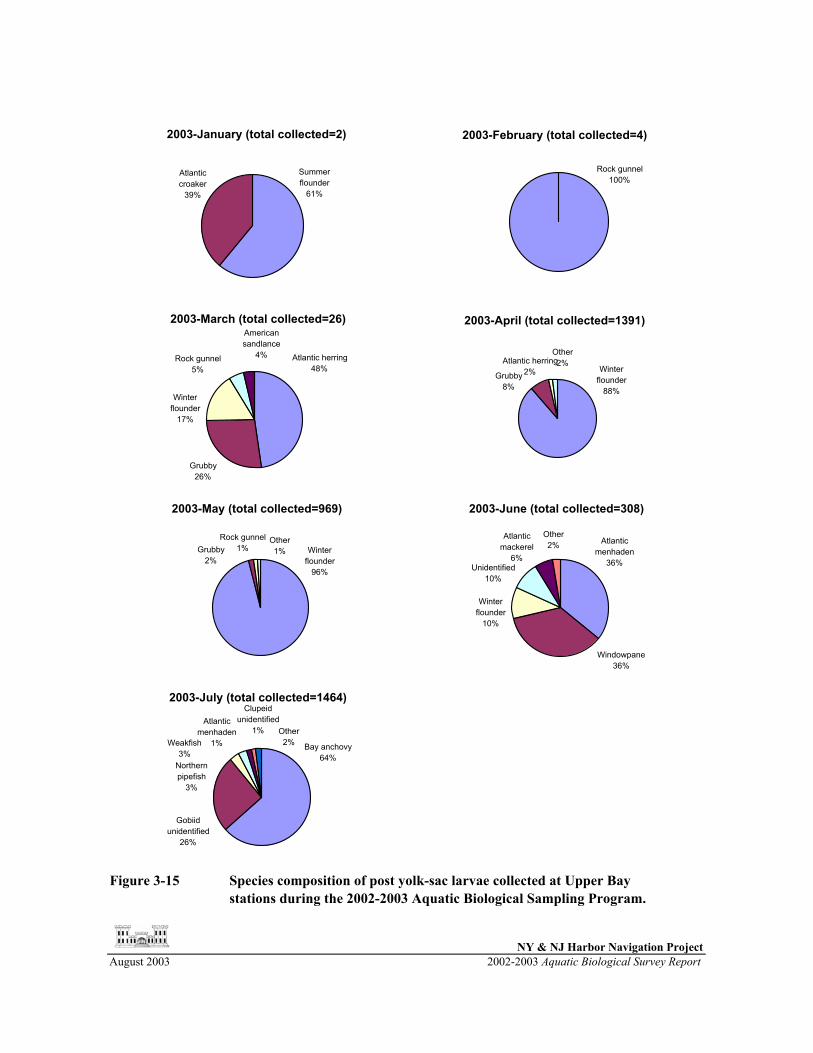
Figure 3-15 Species composition of post yolk-sac larvae collected at Upper Bay stations during the 2002-2003 Aquatic Biological Sampling Program.
NY & NJ Harbor Navigation ProjectAugust 2003 2002-2003 Aquatic Biological Survey Report
2003-February (total collected=4)
Rock gunnel100%
2003-January (total collected=2)
Atlantic croaker
39%
Summer flounder
61%
2003-March (total collected=26)
Grubby26%
Atlantic herring48%
Rock gunnel5%
American sandlance
4%
Winter flounder
17%
2003-April (total collected=1391)
Winter flounder
88%
Atlantic herring2%Grubby
8%
Other2%
2003-May (total collected=969)
Other1%Grubby
2%
Rock gunnel1% Winter
flounder96%
2003-June (total collected=308)
Other2%
Atlantic mackerel
6%
Atlantic menhaden
36%
Winter flounder
10%
Windowpane36%
Unidentified10%
2003-July (total collected=1464)Clupeid
unidentified1% Other
2%Weakfish3%
Gobiid unidentified
26%
Northern pipefish
3%
Bay anchovy64%
Atlantic menhaden
1%

Figure 3-16 Species composition of post yolk-sac larvae collected at Lower Baystations during the 2002-2003 Aquatic Biological Sampling Program.
NY & NJ Harbor Navigation ProjectAugust 2003 2002-2003 Aquatic Biological Survey Report
2003-February (total collected=6)
Rock gunnel100%
2003-January (total collected=1)
Rock gunnel100%
2003-March (total collected=9)
American sandlance
17%
Grubby18%
Rock gunnel52%
Atlantic herring13%
2003-April (total collected=3707)
Winter flounder
93%
Grubby6%
Other1%
2003-May (total collected=700)Atlantic
menhaden2%
Windowpane5%
Other1% Winter
flounder92%
2003-June (total collected=420)
Other5%
Windowpane54%
Atlantic menhaden
4%
Atlantic mackerel
27%
Bay anchovy6%
Northern pipefish
4%
2003-July (total collected=716)
Weakfish2%
Northern pipefish
4%Gobiid
unidentified11%
Clupeid unidentified
4% Bay anchovy78%
Other1%

Arthur Kill/
NewarkBay
Upper Bay
LowerBay
Figure 3-17 Average weekly juvenile density of all species combined at navigation channel and shallow/shoal stations in the three sampling areas, 2002-2003 Aquatic Biological Sampling Program.
Note(s): Dates listed indicate the first day of each sample week.
NY & NJ Harbor Navigation ProjectAugust 2003 2002-2003 Aquatic Biological Survey Report
SAMPLE WEEK
Den
sity
(Num
ber/1
000
m3 )
0
1
2
3
4
5
6
7
8
9
10Channel StationsShallow/Shoal Stations
0
1
2
3
4
5
6
7
8
9
10
0
1
2
3
4
5
6
7
8
9
10
1/21/03 2/4/03 2/19/03 3/4/03 3/18/03 4/1/03 4/15/03 4/30/03 5/13/03 6/3/03 6/17/03 7/8/03

Figure 3-18 Species composition of juveniles collected at Arthur Kill/Newark Bay stations during the 2002-2003 Aquatic Biological Sampling Program.
NY & NJ Harbor Navigation ProjectAugust 2003 2002-2003 Aquatic Biological Survey Report
2003-February (total collected=0)
No Juveniles Collected
2003-January (total collected=5)
Atlantic croaker
35%
Bay anchovy65%
2003-March (total collected=0)
No Juveniles Collected
2003-April (total collected=0)
No Juveniles Collected
2003-May (total collected=2)
Atlantic tomcod100%
2003-June (total collected=3)
Winter flounder
31%
Windowpane69%
2003-July (total collected=10)
Windowpane11%
Winter flounder
33%
Northern pipefish
56%

Figure 3-19 Species composition of juveniles collected at Upper Bay stationsduring the 2002-2003 Aquatic Biological Sampling Program.
NY & NJ Harbor Navigation ProjectAugust 2003 2002-2003 Aquatic Biological Survey Report
2003-February (total collected=0)
No Juveniles Collected
2003-January (total collected=12)
Bay anchovy7% Atlantic
croaker93%
2003-March (total collected=0)
No Juveniles Collected
2003-April (total collected=2)
Atlantic tomcod100%
2003-May (total collected=0)
No Juveniles Collected
2003-June (total collected=4)
Windowpane100%
2003-July (total collected=0)
No Juveniles Collected
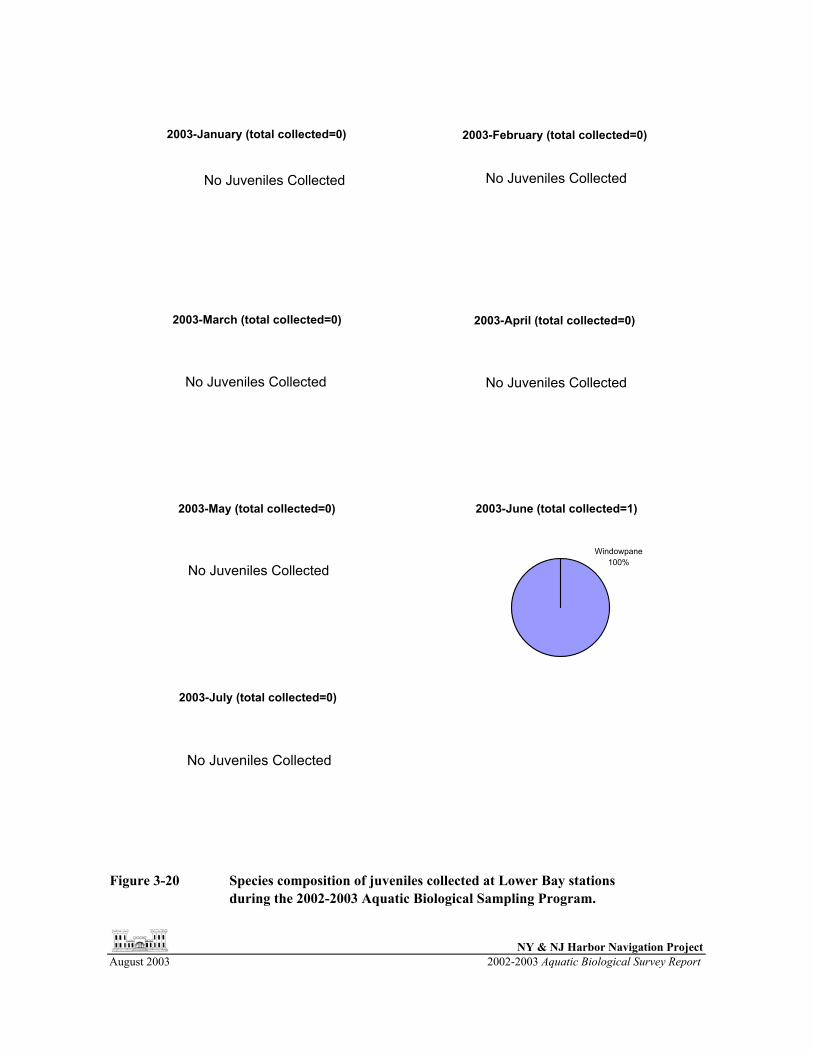
Figure 3-20 Species composition of juveniles collected at Lower Bay stationsduring the 2002-2003 Aquatic Biological Sampling Program.
NY & NJ Harbor Navigation ProjectAugust 2003 2002-2003 Aquatic Biological Survey Report
2003-February (total collected=0)
No Juveniles Collected
2003-January (total collected=0)
No Juveniles Collected
2003-March (total collected=0)
No Juveniles Collected
2003-April (total collected=0)
No Juveniles Collected
2003-May (total collected=0)
No Juveniles Collected
2003-June (total collected=1)
Windowpane100%
2003-July (total collected=0)
No Juveniles Collected

Arthur Kill/
NewarkBay
UpperBay
LowerBay
Figure 3-21 Average weekly winter flounder trawl CPUE at navigation channel and shallow/shoal stations in the three study areas during 2002-2003 AquaticBiological Sampling Program.
NY & NJ Harbor Navigation ProjectAugust 2003 2002-2003 Aquatic Biological Survey Report
SAMPLE WEEK
CPU
E (N
umbe
r Fis
h / 1
0 M
in T
ow)
0
5
10
15
20
25
Channel StationsShallow/Shoal Stations
0
5
10
15
20
25
0
5
10
15
20
25
12/17/02 1/7/03 1/21/03 2/4/03 2/19/03 3/4/03 3/18/03 4/15/03 4/22/03 5/13/03 6/17/03

Figure 3-22 Length frequency distribution of all winter flounder collected during trawl samplingduring 2002-2003 Aquatic Biological Sampling Program.
NY & NJ Harbor Navigation ProjectAugust 2003 2002-2003 Aquatic Biological Survey Report
0
10
20
30
40
50
60
20 40 60 90 110
130
150
170
190
210
230
250
270
290
310
330
350
370
Total Length (mm)
Freq
uenc
y

Figure 3-23 Length frequency distribution of winter flounder collected during trawl sampling at Arthur Kill/Newark Bay stations, 2002-2003 Aquatic Biological Sampling Program.
NY & NJ Harbor Navigation ProjectAugust 2003 2002-2003 Aquatic Biological Survey Report
Length (<=), mm
Num
ber o
f Fis
h
2002-December
0
5
10
15
20
2003-January
0
5
10
15
20
2003-February
0
5
10
15
20
2003-March
0
5
10
15
20
2003-June
0
5
10
15
20
0 20 40 60 80 100
120
140
160
180
200
220
240
260
280
300
320
340
360
380
400
2003-April
0
5
10
15
20
2003-May
0
5
10
15
20

Figure 3-24 Length frequency distribution of winter flounder collected during trawl sampling at Upper Bay stations, 2002-2003 Aquatic Biological Sampling Program.
NY & NJ Harbor Navigation ProjectAugust 2003 2002-2003 Aquatic Biological Survey Report
Num
ber o
f Fis
h
Length (<=), mm
2002-December
0
5
10
15
20
2003-January
0
5
10
15
20
2003-February
0
5
10
15
20
2003-March
0
5
10
15
20
2003-June
0
5
10
15
20
0 20 40 60 80 100
120
140
160
180
200
220
240
260
280
300
320
340
360
380
400
2003-April
0
5
10
15
20
2003-May
0
5
10
15
20

Figure 3-25 Length frequency distribution of winter flounder collected during trawl sampling at Lower Bay stations, 2002-2003 Aquatic Biological Sampling Program.
NY & NJ Harbor Navigation ProjectAugust 2003 2002-2003 Aquatic Biological Survey Report
Length (<=), mm
Num
ber o
f Fis
h
2002-December
0
5
10
15
20
2003-January
0
5
10
15
20
2003-February
0
5
10
15
20
2003-March
0
5
10
15
20
2003-June
05101520
0 20 40 60 80 100
120
140
160
180
200
220
240
260
280
300
320
340
360
380
400
2003-April
0
5
10
15
20
2003-May
0
5
10
15
20
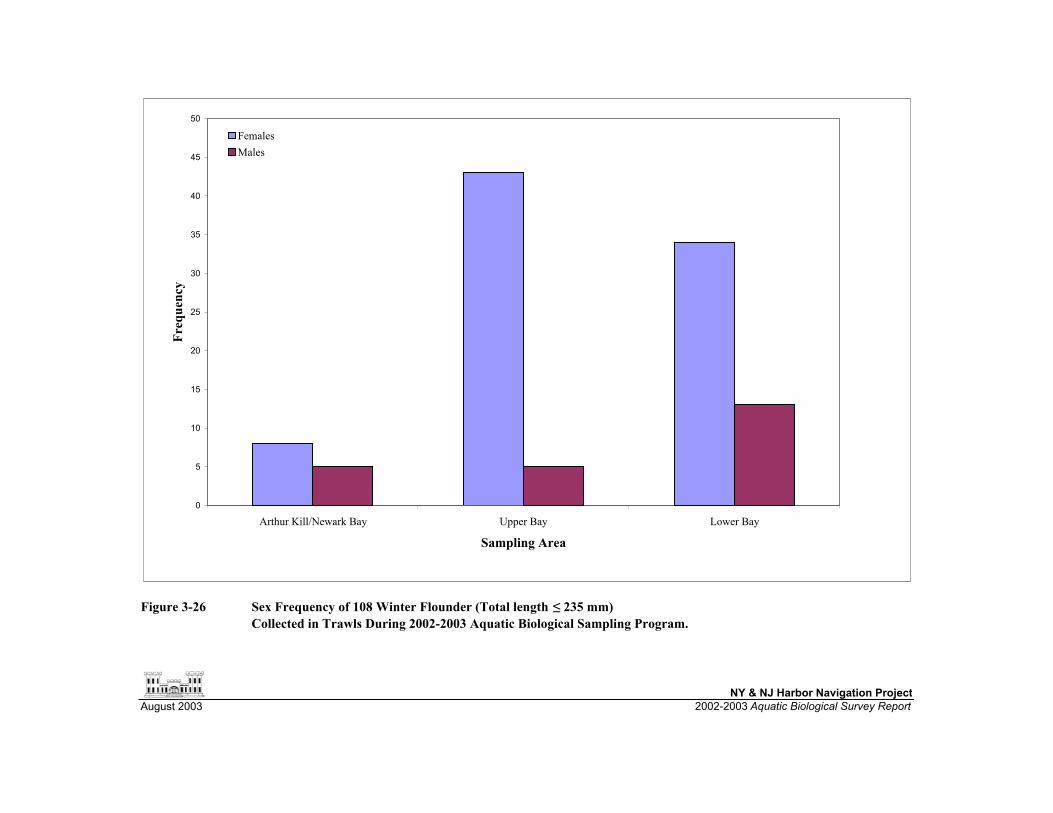
Figure 3-26 Sex Frequency of 108 Winter Flounder (Total length ≤ 235 mm) Collected in Trawls During 2002-2003 Aquatic Biological Sampling Program.
NY & NJ Harbor Navigation ProjectAugust 2003 2002-2003 Aquatic Biological Survey Report
0
5
10
15
20
25
30
35
40
45
50
Arthur Kill/Newark Bay Upper Bay Lower Bay
Sampling Area
Freq
uenc
y
FemalesMales

Figure 3-27 Distribution of winter flounder lifestages collected in the three study areas, 2002-2003 Aquatic Biological Sampling Program.
NY & NJ Harbor Navigation ProjectAugust 2003 2002-2003 Aquatic Biological Survey Report
Egg (7.14%)Arthur Kill-
Newark Bay1%Upper Bay
25%Lower Bay
74%
Yolk-Sac Larvae (11.94%)
Upper Bay37%
Lower Bay43%
Arthur Kill-Newark Bay
20%
Post Yolk-Sac Larvae (80.86%)
Upper Bay19%
Lower Bay69%
Arthur Kill-Newark Bay
12%
Juveniles (0.06%)
Upper Bay30%
Lower Bay0%
Arthur Kill-Newark Bay
70%
All Stages Combined
Upper Bay21%
Arthur Kill-Newark Bay
12%
Lower Bay67%

Arthur Kill/
NewarkBay
UpperBay
LowerBay
Figure 3-28 Average weekly winter flounder egg density at navigation channel and
shallow/shoal stations in the three study areas, 2002-2003 Aquatic Biological Sampling Program.
Note(s): Dates listed indicate the first day of each sample week.
NY & NJ Harbor Navigation ProjectAugust 2003 2002-2003 Aquatic Biological Survey Report
SAMPLE WEEK
Den
sity
(Num
ber/1
000
m3 )
0
50
100
150
200
250
300
350Channel StationsShallow/Shoal Stations
0
50
100
150
200
250
300
350
0
50
100
150
200
250
300
350
1/21/03 2/4/03 2/19/03 3/4/03 3/18/03 4/1/03 4/15/03 4/30/03 5/13/03 6/3/03 6/17/03 7/8/03
ChannelShallow

ArthurKill/
NewarkBay
UpperBay
LowerBay
Figure 3-29 Average weekly winter flounder yolk-sac density at navigation channel andshallow/shoal stations in the three study areas, 2002-2003 Aquatic BiologicalSampling Program.
Note(s): Dates listed indicate the first day of each sample week.
NY & NJ Harbor Navigation ProjectAugust 2003 2002-2003 Biological Sampling Program
SAMPLE WEEK
Den
sity
(Num
ber/1
000
m3 )
0
50
100
150
200
250
300
350
400
450
500Channel StationsShallow/Shoal Stations
0
50
100
150
200
250
300
350
400
450
500
0
50
100
150
200
250
300
350
400
450
500
1/21/03 2/4/03 2/19/03 3/4/03 3/18/03 4/1/03 4/15/03 4/30/03 5/13/03 6/3/03 6/17/03 7/8/03

ArthurKill/
NewarkBay
UpperBay
LowerBay
Figure 3-30 Average weekly winter flounder post yolk-sac density at navigation channeland shallow/shoal stations in the three study areas, 2002-2003 AquaticBiological Sampling Program.
Note(s): Dates listed indicate the first day of each sample week. Note scale change for Lower Bay.
NY & NJ Harbor Navigation ProjectAugust 2003 2002-2003 Aquatic Biological Survey Report
SAMPLE WEEK
Den
sity
(Num
ber/1
000
m3 )
0
200
400
600
800
1000
1200 Channel StationsShallow/Shoal Stations
0
200
400
600
800
1000
1200
0
500
1000
1500
2000
2500
3000
3500
4000
1/21/03 2/4/03 2/19/03 3/4/03 3/18/03 4/1/03 4/15/03 4/30/03 5/13/03 6/3/03 6/17/03 7/8/03

Figure 3-37 Average monthly water quality measurements by area in the three sampling areasduring the 2002-2003 Aquatic Biological Sampling Program.
NY & NJ Harbor Navigation ProjectAugust 2003 2002-2003 Aquatic Biological Survey Report
Sample Month
Bot
tom
Tem
pera
ture
, deg
CB
otto
m S
alin
ity, p
ptB
otto
m D
isso
lved
Oxy
gen,
mg/
L
0
5
10
15
20
25AKNBUBLB
0
5
10
15
20
25
30
35
0
2
4
6
8
10
12
14
Jan Feb Mar Apr May Jun Jul

Appendix A. Adult finfish (trawl) CPUEs by date and sample location. (page 1 of 22)
Date Station Common Name CPUE12/17/2002 LB-1 Alewife 3.012/17/2002 LB-1 American Sandlance 4.012/17/2002 LB-1 Bay Anchovy 3.012/17/2002 LB-1 Cunner 1.012/17/2002 LB-1 Little Skate 3.012/17/2002 LB-1 Spotted Hake 3.012/17/2002 LB-1 Winter Flounder 1.012/17/2002 LB-2 American Shad 1.012/17/2002 LB-2 Bay Anchovy 6.012/17/2002 LB-2 Butterfish 1.012/17/2002 LB-2 Conger Eel 1.012/17/2002 LB-2 Little Skate 3.012/17/2002 LB-2 Silver Hake 22.012/17/2002 LB-2 Spotted Hake 22.012/17/2002 LB-2 Summer Flounder 2.012/17/2002 LB-2 Weakfish 1.012/17/2002 LB-2 Windowpane 1.012/17/2002 LB-3 Alewife 1.012/17/2002 LB-3 American Sandlance 47.012/17/2002 LB-3 American Shad 1.012/17/2002 LB-3 Bay Anchovy 4.012/17/2002 LB-3 Spotted Hake 3.012/17/2002 LB-3 Summer Flounder 1.012/17/2002 LB-3 Windowpane 2.012/17/2002 LB-4 Alewife 7.012/17/2002 LB-4 Atlantic Croaker 3.012/17/2002 LB-4 Atlantic Menhaden 10.012/17/2002 LB-4 Bay Anchovy 15.012/17/2002 LB-4 Blueback Herring 1.012/17/2002 LB-4 Little Skate 10.012/17/2002 LB-4 Northern Pipefish 1.012/17/2002 LB-4 Red Hake 3.012/17/2002 LB-4 Seaboard Goby 1.012/17/2002 LB-4 Silver Hake 14.012/17/2002 LB-4 Spotted Hake 171.012/17/2002 LB-4 Striped Bass 5.012/17/2002 LB-4 Weakfish 2.012/17/2002 LB-4 White Mullet 1.012/17/2002 LB-4 Windowpane 2.012/17/2002 LB-4 Winter Flounder 1.012/17/2002 LB-5 Alewife 1.012/17/2002 LB-5 American Sandlance 5.012/17/2002 LB-5 Little Skate 2.012/17/2002 LB-5 Spotted Hake 7.012/17/2002 LB-5 Summer Flounder 3.012/17/2002 LB-5 Windowpane 2.012/17/2002 LB-6 American Eel 1.012/17/2002 LB-6 American Sandlance 1.012/17/2002 LB-6 Bay Anchovy 2.012/17/2002 LB-6 Conger Eel 1.0

Appendix A. Adult finfish (trawl) CPUEs by date and sample location. (page 2 of 22)
Date Station Common Name CPUE12/17/2002 LB-6 Little Skate 10.012/17/2002 LB-6 Spotted Hake 97.012/17/2002 LB-6 White Perch 2.012/17/2002 LB-6 Windowpane 4.012/17/2002 LB-6 Winter Flounder 4.012/17/2002 SB-3 Bay Anchovy 1.012/17/2002 SB-3 Blueback Herring 92.012/17/2002 SB-3 Naked Goby 2.012/17/2002 SB-4 Alewife 3.012/17/2002 SB-4 Atlantic Croaker 1.012/17/2002 SB-4 Bay Anchovy 1.012/17/2002 SB-4 Blueback Herring 3.012/17/2002 SB-4 Little Skate 1.012/17/2002 SB-4 Spotted Hake 9.012/17/2002 SB-4 Striped Bass 7.012/17/2002 SB-4 Winter Flounder 1.012/17/2002 SB-6 Bay Anchovy 2.512/17/2002 SB-6 Blueback Herring 1.312/17/2002 SB-6 Little Skate 3.812/17/2002 SB-6 Red Hake 1.312/17/2002 SB-6 Spotted Hake 15.012/17/2002 SB-6 Striped Bass 1.312/17/2002 SB-6 Summer Flounder 3.812/17/2002 SB-6 Windowpane 3.812/18/2002 AK-1 Bay Anchovy 1.412/18/2002 AK-1 Gizzard Shad 2.912/18/2002 AK-1 Striped Bass 157.112/18/2002 AK-1 White Perch 864.312/18/2002 AK-2 Alewife 8.012/18/2002 AK-2 Atlantic Menhaden 1.012/18/2002 AK-2 Bay Anchovy 1.012/18/2002 AK-2 Blueback Herring 5.012/18/2002 AK-2 Cunner 1.012/18/2002 AK-2 Northern Searobin 1.012/18/2002 AK-2 Red Hake 1.012/18/2002 AK-2 Spotted Hake 1.012/18/2002 AK-2 Striped Bass 1.012/18/2002 AK-2 White Perch 11.012/18/2002 AK-3 White Perch 3.012/18/2002 AK-4 Alewife 1.012/18/2002 AK-4 Northern Pipefish 1.012/18/2002 AK-4 Striped Bass 13.012/18/2002 AK-4 White Perch 2.012/18/2002 NB-3 Alewife 4.012/18/2002 NB-3 American Sandlance 1.012/18/2002 NB-3 Atlantic Menhaden 1.012/18/2002 NB-3 Bay Anchovy 1.012/18/2002 NB-3 Striped Bass 11.012/18/2002 NB-3 White Perch 72.012/18/2002 NB-3 Winter Flounder 5.0

Appendix A. Adult finfish (trawl) CPUEs by date and sample location. (page 3 of 22)
Date Station Common Name CPUE12/18/2002 NB-4 Alewife 9.012/18/2002 NB-4 Atlantic Menhaden 1.012/18/2002 NB-4 Gizzard Shad 2.012/18/2002 NB-4 Naked Goby 1.012/18/2002 NB-4 Striped Bass 24.012/18/2002 NB-4 White Perch 22.012/18/2002 NB-4 Winter Flounder 1.012/18/2002 NB-5 Alewife 2.012/18/2002 NB-5 Blueback Herring 1.012/18/2002 NB-5 Gizzard Shad 2.012/18/2002 NB-5 Striped Bass 28.012/18/2002 NB-5 White Perch 96.012/18/2002 NB-5 Winter Flounder 1.012/18/2002 NB-7 Alewife 31.412/18/2002 NB-7 Gizzard Shad 4.312/18/2002 NB-7 Silver Hake 1.412/18/2002 NB-7 Spotted Hake 2.912/18/2002 NB-7 Striped Bass 22.912/18/2002 NB-7 White Perch 67.112/18/2002 NB-7 Winter Flounder 10.012/18/2002 SB-1 Alewife 46.712/18/2002 SB-1 American Sandlance 3.312/18/2002 SB-1 American Shad 6.712/18/2002 SB-1 Atlantic Cod 23.312/18/2002 SB-1 Cunner 3.312/18/2002 SB-1 Silver Hake 3.312/18/2002 SB-1 Spotted Hake 6.712/18/2002 SB-1 Striped Bass 100.012/18/2002 SB-1 Summer Flounder 3.312/18/2002 SB-2 Alewife 10.012/18/2002 SB-2 American Sandlance 5.012/18/2002 SB-2 Atlantic Croaker 27.512/18/2002 SB-2 Little Skate 7.512/18/2002 SB-2 Spotted Hake 15.012/18/2002 SB-2 Striped Bass 110.012/18/2002 SB-2 White Mullet 2.512/19/2002 NB-6 Alewife 5.012/19/2002 NB-6 Atlantic Menhaden 5.012/19/2002 NB-6 Blueback Herring 4.012/19/2002 NB-6 Spotted Hake 1.012/19/2002 NB-6 Striped Bass 56.012/19/2002 NB-6 White Perch 222.012/19/2002 NB-6 Winter Flounder 2.012/19/2002 PJ-1 Alewife 2.012/19/2002 PJ-1 Striped Bass 18.012/19/2002 PJ-1 Summer Flounder 5.012/19/2002 PJ-2 Alewife 8.012/19/2002 PJ-2 American Sandlance 1.012/19/2002 PJ-2 American Shad 1.012/19/2002 PJ-2 Blueback Herring 2.0

Appendix A. Adult finfish (trawl) CPUEs by date and sample location. (page 4 of 22)
Date Station Common Name CPUE12/19/2002 PJ-2 Striped Bass 53.012/19/2002 PJ-2 White Perch 1.012/19/2002 PJ-2 Winter Flounder 6.012/19/2002 PJ-3 American Sandlance 2.512/19/2002 PJ-3 Striped Bass 10.012/19/2002 PJ-3 Summer Flounder 1.312/19/2002 PJ-3 Windowpane 1.312/19/2002 PJ-3 Winter Flounder 1.312/19/2002 PJ-4 Alewife 2.012/19/2002 PJ-4 American Shad 4.012/19/2002 PJ-4 Atlantic Croaker 5.012/19/2002 PJ-4 Blueback Herring 7.012/19/2002 PJ-4 Northern Pipefish 1.012/19/2002 PJ-4 Spotted Hake 12.012/19/2002 PJ-4 Striped Bass 5.012/19/2002 PJ-4 White Perch 4.012/19/2002 PJ-4 Winter Flounder 1.012/19/2002 PJ-5 Alewife 1.012/19/2002 PJ-5 Atlantic Croaker 1.012/19/2002 PJ-5 Atlantic Menhaden 1.012/19/2002 PJ-5 Bay Anchovy 2.012/19/2002 PJ-5 Blueback Herring 5.012/19/2002 PJ-5 Northern Pipefish 1.012/19/2002 PJ-5 Spotted Hake 18.012/19/2002 PJ-5 Striped Bass 12.012/19/2002 PJ-5 Weakfish 3.012/19/2002 PJ-5 White Perch 1.012/19/2002 PJ-5 Winter Flounder 6.012/19/2002 SB-5 Alewife 2.012/19/2002 SB-5 Atlantic Menhaden 2.012/19/2002 SB-5 Blueback Herring 18.012/19/2002 SB-5 Little Skate 1.012/19/2002 SB-5 Red Hake 2.012/19/2002 SB-5 Spotted Hake 5.012/19/2002 SB-5 Windowpane 1.012/19/2002 SB-5 Winter Flounder 1.01/7/2003 AK-4 Striped Bass 19.01/7/2003 NB-3 Atlantic Silverside 4.01/7/2003 NB-3 Gizzard Shad 1.01/7/2003 NB-3 Striped Bass 13.01/7/2003 NB-3 White Perch 55.01/7/2003 NB-3 Winter Flounder 3.01/7/2003 NB-4 Alewife 2.01/7/2003 NB-4 Atlantic Silverside 9.01/7/2003 NB-4 Striped Bass 13.01/7/2003 NB-4 White Perch 81.01/7/2003 NB-4 Winter Flounder 2.01/7/2003 NB-5 Bay Anchovy 1.01/7/2003 NB-5 Blueback Herring 2.01/7/2003 NB-5 Spotted Hake 1.0

Appendix A. Adult finfish (trawl) CPUEs by date and sample location. (page 5 of 22)
Date Station Common Name CPUE1/7/2003 NB-5 Striped Bass 17.01/7/2003 NB-5 White Perch 103.01/7/2003 NB-5 Winter Flounder 2.01/7/2003 NB-6 Alewife 1.01/7/2003 NB-6 Gizzard Shad 1.01/7/2003 NB-6 Striped Bass 31.01/7/2003 NB-6 White Perch 60.01/7/2003 NB-6 Winter Flounder 7.01/7/2003 NB-7 Striped Bass 86.01/7/2003 NB-7 White Perch 92.01/7/2003 NB-7 Winter Flounder 28.01/8/2003 AK-1 Naked Goby 1.71/8/2003 AK-1 Striped Bass 150.01/8/2003 AK-1 Striped Mullet 1.71/8/2003 AK-1 White Perch 295.01/8/2003 AK-1 Winter Flounder 1.71/8/2003 AK-2 Striped Bass 12.01/8/2003 AK-2 White Perch 23.01/8/2003 AK-2 Windowpane 1.01/8/2003 AK-2 Winter Flounder 7.01/8/2003 AK-3 Striped Bass 26.01/8/2003 AK-3 White Perch 66.01/8/2003 AK-3 Winter Flounder 1.01/8/2003 LB-1 Atlantic Silverside 1.01/8/2003 LB-1 Little Skate 1.01/8/2003 LB-1 Summer Flounder 3.01/8/2003 LB-1 Windowpane 5.01/8/2003 LB-1 Winter Flounder 1.01/8/2003 LB-2 Alewife 4.01/8/2003 LB-2 American Shad 6.01/8/2003 LB-2 Blueback Herring 1.01/8/2003 LB-2 Little Skate 3.01/8/2003 LB-2 Northern Pipefish 1.01/8/2003 LB-2 Red Hake 7.01/8/2003 LB-2 Silver Hake 2.01/8/2003 LB-2 Spotted Hake 37.01/8/2003 LB-2 Summer Flounder 3.01/8/2003 LB-3 Alewife 1.01/8/2003 LB-3 American Shad 1.01/8/2003 LB-3 Atlantic Silverside 6.01/8/2003 LB-3 Blueback Herring 2.01/8/2003 LB-3 Spotted Hake 2.01/8/2003 LB-3 Windowpane 1.01/8/2003 LB-4 Alewife 11.01/8/2003 LB-4 Atlantic Menhaden 1.01/8/2003 LB-4 Bay Anchovy 4.01/8/2003 LB-4 Blueback Herring 10.01/8/2003 LB-4 Little Skate 26.01/8/2003 LB-4 Northern Pipefish 4.01/8/2003 LB-4 Red Hake 68.0

Appendix A. Adult finfish (trawl) CPUEs by date and sample location. (page 6 of 22)
Date Station Common Name CPUE1/8/2003 LB-4 Silver Hake 10.01/8/2003 LB-4 Smallmouth Flounder 1.01/8/2003 LB-4 Spotted Hake 313.01/8/2003 LB-4 Striped Bass 1.01/8/2003 LB-4 Windowpane 4.01/8/2003 LB-4 Winter Flounder 2.01/8/2003 LB-6 Little Skate 21.01/8/2003 LB-6 Northern Pipefish 1.01/8/2003 LB-6 Spotted Hake 76.01/8/2003 LB-6 Windowpane 6.01/8/2003 LB-6 Winter Flounder 6.01/8/2003 PJ-2 Atlantic Silverside 2.01/8/2003 PJ-2 Smallmouth Flounder 1.01/8/2003 PJ-2 Striped Bass 25.01/8/2003 PJ-2 Windowpane 2.01/8/2003 PJ-2 Winter Flounder 24.01/8/2003 PJ-3 Atlantic Silverside 1.01/8/2003 PJ-3 Striped Bass 10.01/8/2003 PJ-3 Winter Flounder 9.01/9/2003 PJ-1 Blueback Herring 1.01/9/2003 PJ-1 Striped Bass 14.01/9/2003 PJ-1 Winter Flounder 1.01/9/2003 PJ-4 Alewife 1.01/9/2003 PJ-4 Atlantic Croaker 18.01/9/2003 PJ-4 Atlantic Menhaden 1.01/9/2003 PJ-4 Bay Anchovy 1.01/9/2003 PJ-4 Blueback Herring 1.01/9/2003 PJ-4 Conger Eel 1.01/9/2003 PJ-4 Little Skate 1.01/9/2003 PJ-4 Red Hake 1.01/9/2003 PJ-4 Spotted Hake 6.01/9/2003 PJ-4 Striped Bass 9.01/9/2003 PJ-4 Striped Mullet 1.01/9/2003 PJ-4 Windowpane 1.01/9/2003 PJ-4 Winter Flounder 7.01/9/2003 PJ-5 Alewife 2.01/9/2003 PJ-5 Atlantic Croaker 9.01/9/2003 PJ-5 Bay Anchovy 1.01/9/2003 PJ-5 Cunner 1.01/9/2003 PJ-5 Little Skate 5.01/9/2003 PJ-5 Smallmouth Flounder 1.01/9/2003 PJ-5 Spotted Hake 11.01/9/2003 PJ-5 Striped Bass 25.01/9/2003 PJ-5 Windowpane 2.01/9/2003 PJ-5 Winter Flounder 10.01/9/2003 SB-1 Alewife 3.31/9/2003 SB-1 Atlantic Croaker 36.71/9/2003 SB-1 Spotted Hake 3.31/9/2003 SB-1 Striped Bass 23.31/9/2003 SB-2 Alewife 2.5

Appendix A. Adult finfish (trawl) CPUEs by date and sample location. (page 7 of 22)
Date Station Common Name CPUE1/9/2003 SB-2 Atlantic Croaker 25.01/9/2003 SB-2 Atlantic Silverside 2.51/9/2003 SB-2 Striped Bass 12.51/9/2003 SB-3 Alewife 2.01/9/2003 SB-3 Grubby 2.01/9/2003 SB-3 Seaboard Goby 3.01/9/2003 SB-3 Smallmouth Flounder 16.01/9/2003 SB-3 Spotted Hake 2.01/9/2003 SB-3 Striped Bass 34.01/9/2003 SB-3 Windowpane 2.01/9/2003 SB-3 Winter Flounder 13.01/9/2003 SB-4 Alewife 1.01/9/2003 SB-4 Atlantic Croaker 1.01/9/2003 SB-4 Bay Anchovy 1.01/9/2003 SB-4 Spotted Hake 2.01/9/2003 SB-4 Striped Bass 1.01/9/2003 SB-5 Alewife 1.01/9/2003 SB-5 Atlantic Croaker 1.01/9/2003 SB-5 Blueback Herring 2.01/9/2003 SB-5 Little Skate 11.01/9/2003 SB-5 Northern Pipefish 1.01/9/2003 SB-5 Spotted Hake 7.01/9/2003 SB-5 Striped Bass 5.01/9/2003 SB-5 Windowpane 1.01/9/2003 SB-5 Winter Flounder 5.01/9/2003 SB-6 Alosa sp. 1.01/9/2003 SB-6 Atlantic Croaker 2.01/9/2003 SB-6 Black Sea Bass 1.01/9/2003 SB-6 Blueback Herring 7.01/9/2003 SB-6 Cunner 1.01/9/2003 SB-6 Little Skate 15.01/9/2003 SB-6 Naked Goby 1.01/9/2003 SB-6 Red Hake 7.01/9/2003 SB-6 Smallmouth Flounder 3.01/9/2003 SB-6 Spotted Hake 28.01/9/2003 SB-6 Striped Bass 2.01/9/2003 SB-6 Summer Flounder 1.01/9/2003 SB-6 Tautog 1.01/9/2003 SB-6 Windowpane 23.01/9/2003 SB-6 Winter Flounder 3.01/21/2003 LB-1 Summer Flounder 1.01/21/2003 LB-2 Alewife 1.01/21/2003 LB-2 Blueback Herring 1.01/21/2003 LB-2 Spotted Hake 6.01/21/2003 LB-2 Summer Flounder 1.01/21/2003 LB-4 Alewife 4.01/21/2003 LB-4 Atlantic Herring 1.01/21/2003 LB-4 Atlantic Silverside 1.01/21/2003 LB-4 Blueback Herring 29.01/21/2003 LB-4 Little Skate 1.0

Appendix A. Adult finfish (trawl) CPUEs by date and sample location. (page 8 of 22)
Date Station Common Name CPUE1/21/2003 LB-4 Spotted Hake 2.01/21/2003 LB-5 Atlantic Silverside 1.01/21/2003 LB-6 Alewife 4.01/21/2003 LB-6 Little Skate 9.01/21/2003 LB-6 Striped Bass 1.01/21/2003 LB-6 Windowpane 1.01/21/2003 PJ-2 Bay Anchovy 1.11/22/2003 AK-4 Alewife 5.01/22/2003 AK-4 Atlantic Silverside 1.01/22/2003 AK-4 Striped Bass 1.01/22/2003 AK-4 Striped Killifish 2.01/22/2003 AK-4 White Perch 1.01/22/2003 NB-7 Alewife 2.91/22/2003 NB-7 Bay Anchovy 4.31/22/2003 NB-7 Silver Hake 1.41/22/2003 NB-7 White Perch 2.91/22/2003 NB-7 Winter Flounder 1.41/22/2003 PJ-1 Conger Eel 1.01/22/2003 PJ-1 Striped Bass 9.01/22/2003 PJ-1 Winter Flounder 1.01/22/2003 PJ-3 Atlantic Silverside 4.01/22/2003 PJ-4 Atlantic Croaker 1.01/22/2003 PJ-4 Bay Anchovy 4.01/22/2003 PJ-4 Blueback Herring 1.01/22/2003 PJ-4 Striped Bass 2.01/22/2003 PJ-5 Alewife 3.01/22/2003 PJ-5 Little Skate 2.01/22/2003 PJ-5 Spotted Hake 3.01/22/2003 PJ-5 Windowpane 1.01/22/2003 PJ-5 Winter Flounder 9.01/22/2003 SB-1 Spotted Hake 10.01/22/2003 SB-1 Striped Bass 3.31/22/2003 SB-2 Alewife 3.31/22/2003 SB-2 Cunner 3.31/22/2003 SB-2 Grubby 3.31/22/2003 SB-2 Striped Bass 6.71/22/2003 SB-2 Winter Flounder 3.31/22/2003 SB-3 Little Skate 1.01/22/2003 SB-3 Smallmouth Flounder 1.01/22/2003 SB-4 Alewife 5.01/22/2003 SB-4 Atlantic Herring 2.01/22/2003 SB-4 Windowpane 1.01/22/2003 SB-6 Atlantic Herring 1.01/22/2003 SB-6 Blueback Herring 2.01/22/2003 SB-6 Windowpane 1.01/23/2003 AK-1 Alewife 2.01/23/2003 AK-1 Striped Bass 4.01/23/2003 AK-1 White Perch 10.01/23/2003 AK-2 Atlantic Croaker 1.01/23/2003 AK-2 Striped Bass 19.0
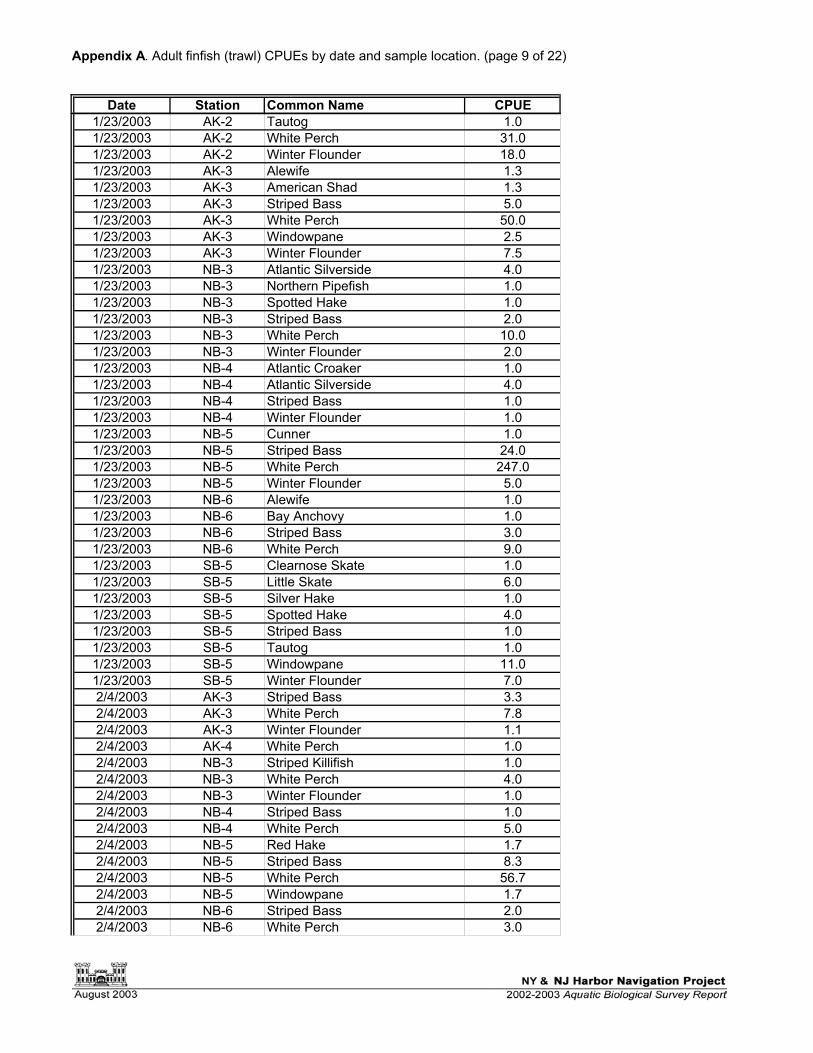
Appendix A. Adult finfish (trawl) CPUEs by date and sample location. (page 9 of 22)
Date Station Common Name CPUE1/23/2003 AK-2 Tautog 1.01/23/2003 AK-2 White Perch 31.01/23/2003 AK-2 Winter Flounder 18.01/23/2003 AK-3 Alewife 1.31/23/2003 AK-3 American Shad 1.31/23/2003 AK-3 Striped Bass 5.01/23/2003 AK-3 White Perch 50.01/23/2003 AK-3 Windowpane 2.51/23/2003 AK-3 Winter Flounder 7.51/23/2003 NB-3 Atlantic Silverside 4.01/23/2003 NB-3 Northern Pipefish 1.01/23/2003 NB-3 Spotted Hake 1.01/23/2003 NB-3 Striped Bass 2.01/23/2003 NB-3 White Perch 10.01/23/2003 NB-3 Winter Flounder 2.01/23/2003 NB-4 Atlantic Croaker 1.01/23/2003 NB-4 Atlantic Silverside 4.01/23/2003 NB-4 Striped Bass 1.01/23/2003 NB-4 Winter Flounder 1.01/23/2003 NB-5 Cunner 1.01/23/2003 NB-5 Striped Bass 24.01/23/2003 NB-5 White Perch 247.01/23/2003 NB-5 Winter Flounder 5.01/23/2003 NB-6 Alewife 1.01/23/2003 NB-6 Bay Anchovy 1.01/23/2003 NB-6 Striped Bass 3.01/23/2003 NB-6 White Perch 9.01/23/2003 SB-5 Clearnose Skate 1.01/23/2003 SB-5 Little Skate 6.01/23/2003 SB-5 Silver Hake 1.01/23/2003 SB-5 Spotted Hake 4.01/23/2003 SB-5 Striped Bass 1.01/23/2003 SB-5 Tautog 1.01/23/2003 SB-5 Windowpane 11.01/23/2003 SB-5 Winter Flounder 7.02/4/2003 AK-3 Striped Bass 3.32/4/2003 AK-3 White Perch 7.82/4/2003 AK-3 Winter Flounder 1.12/4/2003 AK-4 White Perch 1.02/4/2003 NB-3 Striped Killifish 1.02/4/2003 NB-3 White Perch 4.02/4/2003 NB-3 Winter Flounder 1.02/4/2003 NB-4 Striped Bass 1.02/4/2003 NB-4 White Perch 5.02/4/2003 NB-5 Red Hake 1.72/4/2003 NB-5 Striped Bass 8.32/4/2003 NB-5 White Perch 56.72/4/2003 NB-5 Windowpane 1.72/4/2003 NB-6 Striped Bass 2.02/4/2003 NB-6 White Perch 3.0

Appendix A. Adult finfish (trawl) CPUEs by date and sample location. (page 10 of 22)
Date Station Common Name CPUE2/4/2003 NB-6 Winter Flounder 1.02/5/2003 AK-1 American Shad 1.72/5/2003 AK-1 White Perch 1.72/5/2003 AK-2 Striped Bass 1.02/5/2003 AK-2 White Perch 1.02/5/2003 AK-2 Winter Flounder 2.02/5/2003 LB-2 Tautog 1.02/5/2003 LB-3 Little Skate 3.02/5/2003 LB-3 Smallmouth Flounder 1.02/5/2003 LB-3 Windowpane 1.02/5/2003 LB-3 Winter Flounder 1.02/5/2003 LB-6 Atlantic Silverside 2.02/5/2003 LB-6 Little Skate 4.02/5/2003 LB-6 Windowpane 1.02/5/2003 SB-6 American Shad 3.32/5/2003 SB-6 Blueback Herring 6.72/5/2003 SB-6 Little Skate 3.32/5/2003 SB-6 Red Hake 3.32/5/2003 SB-6 Windowpane 16.72/5/2003 SB-6 Winter Flounder 13.32/6/2003 PJ-1 Windowpane 1.02/6/2003 PJ-2 Winter Flounder 1.12/6/2003 PJ-4 Striped Bass 10.02/6/2003 PJ-4 Winter Flounder 6.72/6/2003 PJ-5 Striped Bass 4.02/6/2003 PJ-5 Winter Flounder 8.02/6/2003 SB-2 Naked Goby 2.52/6/2003 SB-3 Grubby 1.02/6/2003 SB-3 Striped Bass 1.02/6/2003 SB-3 Windowpane 10.02/6/2003 SB-3 Winter Flounder 6.02/6/2003 SB-4 Blueback Herring 7.02/6/2003 SB-4 Grubby 1.02/6/2003 SB-4 White Perch 1.02/6/2003 SB-5 Striped Bass 1.02/6/2003 SB-5 Windowpane 19.02/6/2003 SB-5 Winter Flounder 13.02/19/2003 LB-1 Atlantic Herring 1.02/19/2003 LB-1 Atlantic Silverside 1.02/19/2003 LB-1 Blueback Herring 1.02/19/2003 LB-1 Little Skate 10.02/19/2003 LB-3 Atlantic Silverside 1.02/19/2003 LB-3 Blueback Herring 1.02/19/2003 LB-3 Little Skate 1.02/19/2003 LB-4 Blueback Herring 1.02/19/2003 LB-4 Little Skate 4.02/19/2003 LB-4 Winter Flounder 1.02/19/2003 LB-6 Little Skate 1.02/19/2003 PJ-2 Striped Bass 2.02/20/2003 AK-1 Striped Bass 1.3

Appendix A. Adult finfish (trawl) CPUEs by date and sample location. (page 11 of 22)
Date Station Common Name CPUE2/20/2003 AK-1 White Perch 5.02/20/2003 AK-1 Winter Flounder 2.52/20/2003 AK-2 Hogchocker 1.02/20/2003 AK-2 Striped Bass 19.02/20/2003 AK-2 White Perch 18.02/20/2003 AK-2 Winter Flounder 10.02/20/2003 AK-4 White Perch 1.02/20/2003 NB-5 Striped Bass 2.02/20/2003 NB-5 White Perch 7.02/20/2003 NB-5 Winter Flounder 1.02/20/2003 PJ-1 Cunner 2.02/20/2003 PJ-1 Smallmouth Flounder 1.02/20/2003 PJ-1 Striped Bass 1.02/20/2003 PJ-3 White Perch 1.02/20/2003 PJ-5 Atlantic Tomcod 1.02/20/2003 PJ-5 Striped Bass 5.02/20/2003 PJ-5 Windowpane 1.02/20/2003 PJ-5 Winter Flounder 2.02/21/2003 NB-3 Spotted Hake 1.02/21/2003 NB-3 White Perch 1.02/21/2003 NB-3 Winter Flounder 1.02/21/2003 NB-4 Striped Bass 2.02/21/2003 NB-4 White Perch 1.02/21/2003 NB-6 Winter Flounder 2.52/21/2003 NB-7 Winter Flounder 1.12/21/2003 PJ-4 Atlantic Silverside 1.72/21/2003 PJ-4 Striped Bass 8.32/21/2003 PJ-4 Windowpane 1.72/21/2003 SB-2 Conger Eel 3.32/21/2003 SB-3 Windowpane 1.02/21/2003 SB-4 Red Hake 2.02/21/2003 SB-4 Striped Bass 3.02/21/2003 SB-4 Windowpane 1.02/21/2003 SB-4 Winter Flounder 1.02/21/2003 SB-6 Striped Bass 1.02/21/2003 SB-6 White Perch 1.03/4/2003 LB-2 Bay Anchovy 18.03/4/2003 LB-2 Windowpane 1.03/4/2003 LB-4 American Shad 1.03/4/2003 LB-4 Bay Anchovy 13.03/4/2003 LB-4 Cunner 1.03/4/2003 LB-4 Little Skate 2.03/4/2003 LB-4 Windowpane 2.03/4/2003 LB-5 Windowpane 3.03/4/2003 LB-6 Little Skate 1.03/4/2003 LB-6 Windowpane 1.03/4/2003 PJ-2 Atlantic Silverside 1.73/5/2003 AK-3 Striped Bass 1.13/5/2003 AK-3 White Perch 1.13/5/2003 NB-6 Striped Bass 6.0

Appendix A. Adult finfish (trawl) CPUEs by date and sample location. (page 12 of 22)
Date Station Common Name CPUE3/5/2003 NB-6 White Perch 1.03/5/2003 NB-6 Winter Flounder 4.03/5/2003 NB-7 Striped Bass 1.73/5/2003 NB-7 Winter Flounder 1.73/5/2003 PJ-4 Gizzard Shad 1.13/5/2003 PJ-5 Winter Flounder 1.13/6/2003 AK-1 Striped Bass 3.03/6/2003 AK-1 White Perch 1.03/6/2003 AK-1 Winter Flounder 1.03/7/2003 HR-1 Naked Goby 4.03/7/2003 PJ-1 Atlantic Silverside 1.03/7/2003 PJ-1 Grubby 1.03/7/2003 PJ-1 Winter Flounder 2.03/7/2003 SB-3 Red Hake 1.03/7/2003 SB-3 Windowpane 10.03/7/2003 SB-3 Winter Flounder 2.03/7/2003 SB-4 Blueback Herring 2.03/7/2003 SB-4 Little Skate 1.03/7/2003 SB-4 Red Hake 1.03/7/2003 SB-4 Windowpane 6.03/7/2003 SB-6 Cunner 1.03/7/2003 SB-6 Little Skate 1.03/7/2003 SB-6 Windowpane 4.03/8/2003 HR-2 Striped Killifish 5.03/8/2003 SB-5 Blueback Herring 1.03/8/2003 SB-5 Grubby 1.03/18/2003 LB-1 Winter Flounder 1.03/18/2003 LB-2 Windowpane 1.03/18/2003 LB-3 Windowpane 2.03/18/2003 LB-4 Windowpane 1.03/18/2003 LB-5 Windowpane 1.03/18/2003 LB-6 Little Skate 3.03/18/2003 LB-6 Red Hake 1.03/18/2003 LB-6 Windowpane 2.03/18/2003 SB-4 Bay Anchovy 3.03/18/2003 SB-4 Cunner 1.03/18/2003 SB-4 Grubby 1.03/18/2003 SB-4 Little Skate 1.03/18/2003 SB-4 Naked Goby 1.03/18/2003 SB-4 Red Hake 4.03/18/2003 SB-4 Spotted Hake 1.03/18/2003 SB-4 Windowpane 5.03/18/2003 SB-4 Winter Flounder 4.03/19/2003 AK-4 Bay Anchovy 1.03/19/2003 AK-4 Seaboard Goby 1.03/19/2003 AK-4 Striped Bass 1.03/19/2003 AK-4 White Perch 1.03/19/2003 SB-1 Bay Anchovy 5.03/19/2003 SB-2 Northern Pipefish 2.53/19/2003 SB-3 Bay Anchovy 7.0

Appendix A. Adult finfish (trawl) CPUEs by date and sample location. (page 13 of 22)
Date Station Common Name CPUE3/19/2003 SB-3 Blueback Herring 1.03/19/2003 SB-3 Cunner 1.03/19/2003 SB-3 Northern Pipefish 1.03/19/2003 SB-3 Red Hake 1.03/19/2003 SB-3 Windowpane 4.03/19/2003 SB-3 Winter Flounder 1.03/19/2003 SB-6 Blueback Herring 1.03/19/2003 SB-6 Little Skate 2.03/19/2003 SB-6 Naked Goby 1.03/19/2003 SB-6 Red Hake 3.03/19/2003 SB-6 Spotted Hake 2.03/19/2003 SB-6 Windowpane 17.03/19/2003 SB-6 Winter Flounder 3.03/21/2003 NB-3 American Shad 1.03/21/2003 NB-3 Striped Bass 2.03/21/2003 NB-3 White Perch 1.03/21/2003 NB-4 Striped Bass 2.03/21/2003 NB-4 White Perch 1.03/21/2003 NB-4 Winter Flounder 3.03/21/2003 NB-5 Striped Bass 2.03/21/2003 NB-5 White Perch 3.03/21/2003 NB-6 Striped Bass 3.03/22/2003 AK-1 Striped Bass 10.03/22/2003 AK-1 White Perch 3.33/22/2003 AK-3 Blueback Herring 3.03/22/2003 AK-3 Northern Pipefish 1.03/22/2003 AK-3 Spotted Hake 1.03/22/2003 AK-3 Striped Bass 6.03/22/2003 AK-3 White Perch 5.03/22/2003 AK-3 Windowpane 2.03/22/2003 AK-3 Winter Flounder 1.03/22/2003 NB-7 Striped Bass 12.53/22/2003 PJ-2 Spotted Hake 1.03/22/2003 PJ-2 Striped Bass 10.03/22/2003 PJ-2 Windowpane 1.03/23/2003 HR-1 Bay Anchovy 2.03/23/2003 HR-1 Conger Eel 4.03/23/2003 HR-1 Striped Bass 4.03/23/2003 PJ-1 Striped Bass 1.03/23/2003 PJ-3 Striped Bass 2.03/23/2003 PJ-4 Spotted Hake 1.73/23/2003 PJ-4 Striped Bass 5.03/23/2003 PJ-4 Winter Flounder 1.73/23/2003 PJ-5 Bay Anchovy 5.03/23/2003 PJ-5 Northern Pipefish 1.03/23/2003 SB-5 American Shad 6.03/23/2003 SB-5 Bay Anchovy 1.03/23/2003 SB-5 Little Skate 3.03/23/2003 SB-5 Spotted Hake 1.03/23/2003 SB-5 Windowpane 1.0

Appendix A. Adult finfish (trawl) CPUEs by date and sample location. (page 14 of 22)
Date Station Common Name CPUE3/23/2003 SB-5 Winter Flounder 6.04/15/2003 LB-6 Winter Flounder 3.04/16/2003 LB-1 Little Skate 2.04/16/2003 LB-1 Northern Puffer 2.04/16/2003 LB-1 Northern Searobin 1.04/16/2003 LB-1 Smallmouth Flounder 1.04/16/2003 LB-1 Spotted Hake 4.04/16/2003 LB-1 Windowpane 2.04/16/2003 LB-1 Winter Flounder 11.04/16/2003 LB-2 Windowpane 1.04/16/2003 LB-3 Little Skate 1.04/16/2003 LB-3 Northern Puffer 1.04/16/2003 LB-3 Red Hake 2.04/16/2003 LB-3 Spotted Hake 41.04/16/2003 LB-3 Windowpane 1.04/16/2003 LB-3 Winter Flounder 2.04/16/2003 LB-4 Red Hake 1.04/16/2003 LB-4 Spotted Hake 6.04/16/2003 LB-4 Winter Flounder 2.04/16/2003 SB-6 Cunner 2.04/16/2003 SB-6 Little Skate 5.04/16/2003 SB-6 Northern Puffer 2.04/16/2003 SB-6 Red Hake 1.04/16/2003 SB-6 Smallmouth Flounder 3.04/16/2003 SB-6 Spotted Hake 89.04/16/2003 SB-6 Striped Cuskeel 4.04/16/2003 SB-6 Summer Flounder 1.04/16/2003 SB-6 Windowpane 34.04/17/2003 AK-1 Atlantic Herring 6.04/17/2003 AK-1 Blueback Herring 2.04/17/2003 AK-1 Smallmouth Flounder 8.04/17/2003 AK-1 Spotted Hake 118.04/17/2003 AK-1 Striped Bass 34.04/17/2003 AK-1 Striped Cuskeel 6.04/17/2003 AK-1 White Perch 18.04/17/2003 AK-1 Windowpane 4.04/17/2003 AK-3 Striped Bass 1.04/17/2003 AK-3 Summer Flounder 1.04/17/2003 AK-3 Winter Flounder 1.04/17/2003 AK-4 Alewife 2.04/17/2003 AK-4 Atlantic Herring 13.04/17/2003 AK-4 Blueback Herring 2.04/17/2003 HR-2 Atlantic Herring 5.04/17/2003 HR-2 Silver Hake 5.04/17/2003 HR-2 Spotted Hake 30.04/17/2003 HR-2 Striped Bass 10.04/17/2003 PJ-1 Grubby 2.04/17/2003 PJ-1 Striped Bass 14.04/17/2003 PJ-1 Windowpane 2.04/17/2003 PJ-1 Winter Flounder 33.0

Appendix A. Adult finfish (trawl) CPUEs by date and sample location. (page 15 of 22)
Date Station Common Name CPUE4/17/2003 PJ-2 Pollock 2.04/17/2003 PJ-2 Spotted Hake 1.04/17/2003 PJ-2 Striped Bass 3.04/17/2003 PJ-2 Winter Flounder 4.04/17/2003 SB-1 Alewife 15.04/17/2003 SB-1 Northern Searobin 5.04/17/2003 SB-1 Smallmouth Flounder 5.04/17/2003 SB-1 Spotted Hake 35.04/17/2003 SB-1 Striped Bass 170.04/17/2003 SB-1 Windowpane 5.04/17/2003 SB-1 Winter Flounder 10.04/17/2003 SB-2 Alewife 6.74/17/2003 SB-2 Blueback Herring 3.34/17/2003 SB-2 Spotted Hake 76.74/17/2003 SB-2 Striped Bass 30.04/17/2003 SB-3 Little Skate 1.04/17/2003 SB-3 Northern Puffer 1.04/17/2003 SB-3 Smallmouth Flounder 2.04/17/2003 SB-3 Spotted Hake 10.04/17/2003 SB-3 Striped Bass 15.04/17/2003 SB-3 Windowpane 4.04/17/2003 SB-3 Winter Flounder 15.04/17/2003 SB-4 Little Skate 3.04/17/2003 SB-4 Northern Puffer 1.04/17/2003 SB-4 Spotted Hake 161.04/17/2003 SB-4 Striped Bass 4.04/17/2003 SB-4 Striped Cuskeel 2.04/17/2003 SB-4 Summer Flounder 1.04/17/2003 SB-4 Windowpane 9.04/17/2003 SB-4 Winter Flounder 8.04/17/2003 SB-5 Red Hake 2.04/17/2003 SB-5 Spotted Hake 14.04/17/2003 SB-5 Striped Cuskeel 2.04/17/2003 SB-5 Windowpane 1.04/17/2003 SB-5 Winter Flounder 3.04/18/2003 NB-3 Atlantic Herring 9.04/18/2003 NB-3 Blueback Herring 1.04/18/2003 NB-3 Cunner 1.04/18/2003 NB-3 Northern Puffer 1.04/18/2003 NB-3 Red Hake 1.04/18/2003 NB-3 Smallmouth Flounder 35.04/18/2003 NB-3 Spotted Hake 13.04/18/2003 NB-3 Striped Bass 10.04/18/2003 NB-3 White Perch 30.04/18/2003 NB-3 Windowpane 1.04/18/2003 NB-3 Winter Flounder 2.04/18/2003 NB-4 Atlantic Herring 1.04/18/2003 NB-4 Spotted Hake 2.04/18/2003 NB-4 Striped Bass 10.04/18/2003 NB-4 White Perch 4.0
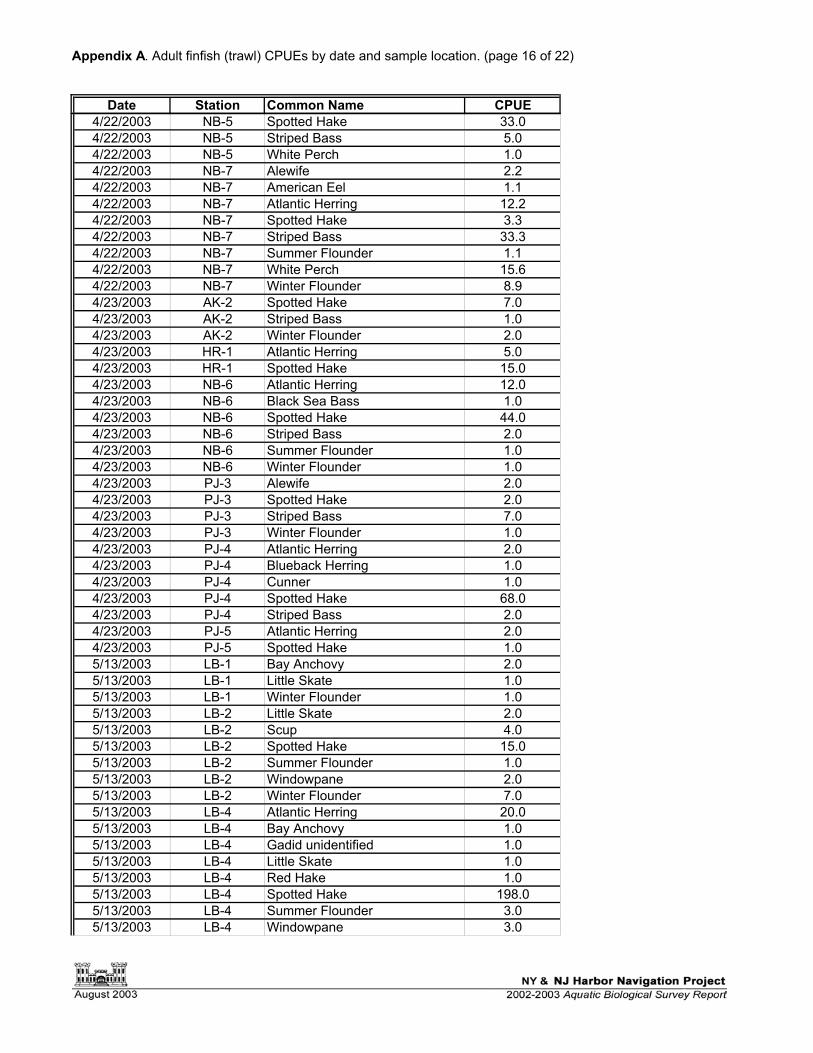
Appendix A. Adult finfish (trawl) CPUEs by date and sample location. (page 16 of 22)
Date Station Common Name CPUE4/22/2003 NB-5 Spotted Hake 33.04/22/2003 NB-5 Striped Bass 5.04/22/2003 NB-5 White Perch 1.04/22/2003 NB-7 Alewife 2.24/22/2003 NB-7 American Eel 1.14/22/2003 NB-7 Atlantic Herring 12.24/22/2003 NB-7 Spotted Hake 3.34/22/2003 NB-7 Striped Bass 33.34/22/2003 NB-7 Summer Flounder 1.14/22/2003 NB-7 White Perch 15.64/22/2003 NB-7 Winter Flounder 8.94/23/2003 AK-2 Spotted Hake 7.04/23/2003 AK-2 Striped Bass 1.04/23/2003 AK-2 Winter Flounder 2.04/23/2003 HR-1 Atlantic Herring 5.04/23/2003 HR-1 Spotted Hake 15.04/23/2003 NB-6 Atlantic Herring 12.04/23/2003 NB-6 Black Sea Bass 1.04/23/2003 NB-6 Spotted Hake 44.04/23/2003 NB-6 Striped Bass 2.04/23/2003 NB-6 Summer Flounder 1.04/23/2003 NB-6 Winter Flounder 1.04/23/2003 PJ-3 Alewife 2.04/23/2003 PJ-3 Spotted Hake 2.04/23/2003 PJ-3 Striped Bass 7.04/23/2003 PJ-3 Winter Flounder 1.04/23/2003 PJ-4 Atlantic Herring 2.04/23/2003 PJ-4 Blueback Herring 1.04/23/2003 PJ-4 Cunner 1.04/23/2003 PJ-4 Spotted Hake 68.04/23/2003 PJ-4 Striped Bass 2.04/23/2003 PJ-5 Atlantic Herring 2.04/23/2003 PJ-5 Spotted Hake 1.05/13/2003 LB-1 Bay Anchovy 2.05/13/2003 LB-1 Little Skate 1.05/13/2003 LB-1 Winter Flounder 1.05/13/2003 LB-2 Little Skate 2.05/13/2003 LB-2 Scup 4.05/13/2003 LB-2 Spotted Hake 15.05/13/2003 LB-2 Summer Flounder 1.05/13/2003 LB-2 Windowpane 2.05/13/2003 LB-2 Winter Flounder 7.05/13/2003 LB-4 Atlantic Herring 20.05/13/2003 LB-4 Bay Anchovy 1.05/13/2003 LB-4 Gadid unidentified 1.05/13/2003 LB-4 Little Skate 1.05/13/2003 LB-4 Red Hake 1.05/13/2003 LB-4 Spotted Hake 198.05/13/2003 LB-4 Summer Flounder 3.05/13/2003 LB-4 Windowpane 3.0

Appendix A. Adult finfish (trawl) CPUEs by date and sample location. (page 17 of 22)
Date Station Common Name CPUE5/13/2003 LB-4 Winter Flounder 14.05/13/2003 LB-5 Bay Anchovy 2.05/13/2003 LB-5 Spotted Hake 29.05/13/2003 LB-5 Striped Searobin 2.05/13/2003 LB-5 Summer Flounder 1.05/13/2003 LB-5 Windowpane 4.05/14/2003 AK-1 Bay Anchovy 1.15/14/2003 AK-2 Bay Anchovy 2.05/14/2003 AK-2 Blueback Herring 1.05/14/2003 AK-2 Northern Searobin 1.05/14/2003 AK-2 Red Hake 2.05/14/2003 AK-2 Spotted Hake 45.05/14/2003 AK-2 Windowpane 3.05/14/2003 AK-3 American Eel 1.15/14/2003 AK-3 Bay Anchovy 18.95/14/2003 AK-3 Smallmouth Flounder 1.15/14/2003 AK-3 Spotted Hake 63.35/14/2003 AK-3 Striped Bass 4.45/14/2003 AK-3 Striped Searobin 1.15/14/2003 AK-3 Summer Flounder 1.15/14/2003 AK-3 Windowpane 1.15/14/2003 AK-4 Atlantic Herring 1.05/14/2003 AK-4 Bay Anchovy 5.05/14/2003 AK-4 Spotted Hake 4.05/14/2003 AK-4 Striped Bass 3.05/14/2003 AK-4 White Perch 1.05/14/2003 AK-4 Winter Flounder 1.05/14/2003 LB-3 Atlantic Herring 4.05/14/2003 LB-3 Bay Anchovy 2.05/14/2003 LB-3 Gadid unidentified 1.05/14/2003 LB-3 Little Skate 1.05/14/2003 LB-3 Spotted Hake 13.05/14/2003 LB-3 Summer Flounder 1.05/14/2003 LB-6 Atlantic Herring 262.05/14/2003 LB-6 Red Hake 2.05/14/2003 LB-6 Spotted Hake 15.05/14/2003 LB-6 Summer Flounder 2.05/14/2003 LB-6 Windowpane 2.05/14/2003 LB-6 Winter Flounder 7.05/15/2003 HR-1 Atlantic Tomcod 35.05/15/2003 HR-1 Bay Anchovy 45.05/15/2003 HR-1 Naked Goby 5.05/15/2003 HR-1 Spotted Hake 60.05/15/2003 HR-1 Striped Searobin 30.05/15/2003 HR-1 Summer Flounder 5.05/15/2003 HR-1 Windowpane 5.05/15/2003 HR-1 Winter Flounder 10.05/15/2003 HR-2 Atlantic Herring 7.55/15/2003 HR-2 Bay Anchovy 15.05/15/2003 HR-2 Spotted Hake 10.0
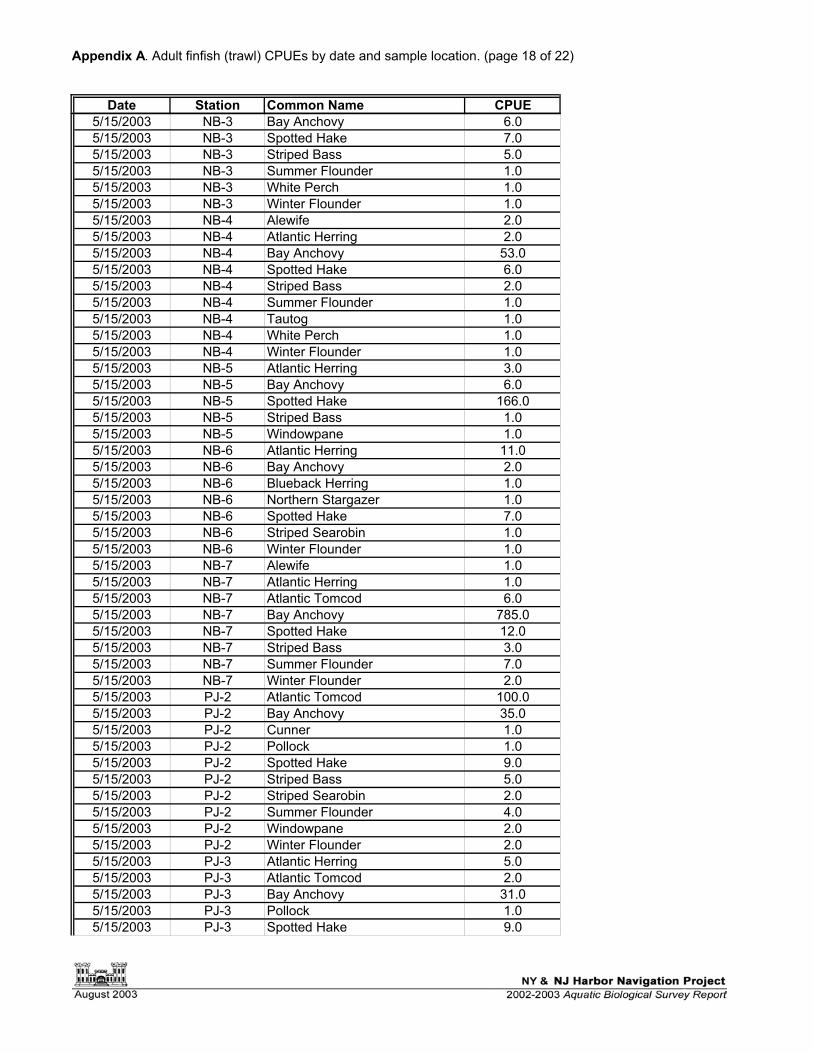
Appendix A. Adult finfish (trawl) CPUEs by date and sample location. (page 18 of 22)
Date Station Common Name CPUE5/15/2003 NB-3 Bay Anchovy 6.05/15/2003 NB-3 Spotted Hake 7.05/15/2003 NB-3 Striped Bass 5.05/15/2003 NB-3 Summer Flounder 1.05/15/2003 NB-3 White Perch 1.05/15/2003 NB-3 Winter Flounder 1.05/15/2003 NB-4 Alewife 2.05/15/2003 NB-4 Atlantic Herring 2.05/15/2003 NB-4 Bay Anchovy 53.05/15/2003 NB-4 Spotted Hake 6.05/15/2003 NB-4 Striped Bass 2.05/15/2003 NB-4 Summer Flounder 1.05/15/2003 NB-4 Tautog 1.05/15/2003 NB-4 White Perch 1.05/15/2003 NB-4 Winter Flounder 1.05/15/2003 NB-5 Atlantic Herring 3.05/15/2003 NB-5 Bay Anchovy 6.05/15/2003 NB-5 Spotted Hake 166.05/15/2003 NB-5 Striped Bass 1.05/15/2003 NB-5 Windowpane 1.05/15/2003 NB-6 Atlantic Herring 11.05/15/2003 NB-6 Bay Anchovy 2.05/15/2003 NB-6 Blueback Herring 1.05/15/2003 NB-6 Northern Stargazer 1.05/15/2003 NB-6 Spotted Hake 7.05/15/2003 NB-6 Striped Searobin 1.05/15/2003 NB-6 Winter Flounder 1.05/15/2003 NB-7 Alewife 1.05/15/2003 NB-7 Atlantic Herring 1.05/15/2003 NB-7 Atlantic Tomcod 6.05/15/2003 NB-7 Bay Anchovy 785.05/15/2003 NB-7 Spotted Hake 12.05/15/2003 NB-7 Striped Bass 3.05/15/2003 NB-7 Summer Flounder 7.05/15/2003 NB-7 Winter Flounder 2.05/15/2003 PJ-2 Atlantic Tomcod 100.05/15/2003 PJ-2 Bay Anchovy 35.05/15/2003 PJ-2 Cunner 1.05/15/2003 PJ-2 Pollock 1.05/15/2003 PJ-2 Spotted Hake 9.05/15/2003 PJ-2 Striped Bass 5.05/15/2003 PJ-2 Striped Searobin 2.05/15/2003 PJ-2 Summer Flounder 4.05/15/2003 PJ-2 Windowpane 2.05/15/2003 PJ-2 Winter Flounder 2.05/15/2003 PJ-3 Atlantic Herring 5.05/15/2003 PJ-3 Atlantic Tomcod 2.05/15/2003 PJ-3 Bay Anchovy 31.05/15/2003 PJ-3 Pollock 1.05/15/2003 PJ-3 Spotted Hake 9.0

Appendix A. Adult finfish (trawl) CPUEs by date and sample location. (page 19 of 22)
Date Station Common Name CPUE5/15/2003 PJ-3 Striped Bass 2.05/15/2003 PJ-3 Summer Flounder 3.05/15/2003 PJ-3 Windowpane 1.05/15/2003 PJ-3 Winter Flounder 5.05/15/2003 PJ-4 Atlantic Herring 17.05/15/2003 PJ-4 Bay Anchovy 2.05/15/2003 PJ-4 Spotted Hake 23.05/15/2003 PJ-4 Striped Searobin 1.05/15/2003 PJ-4 Summer Flounder 3.05/15/2003 PJ-4 Windowpane 1.05/15/2003 SB-1 Alewife 3.35/15/2003 SB-1 Atlantic Tomcod 3.35/15/2003 SB-1 Bay Anchovy 80.05/15/2003 SB-1 Spotted Hake 10.05/15/2003 SB-1 Striped Bass 6.75/15/2003 SB-1 White Perch 3.35/15/2003 SB-1 Windowpane 6.75/15/2003 SB-1 Winter Flounder 3.35/15/2003 SB-2 Atlantic Herring 20.05/15/2003 SB-2 Atlantic Tomcod 3.35/15/2003 SB-2 Bay Anchovy 63.35/15/2003 SB-3 Atlantic Herring 1.05/15/2003 SB-3 Atlantic Menhaden 1.05/15/2003 SB-3 Atlantic Tomcod 1.05/15/2003 SB-3 Bay Anchovy 19.05/15/2003 SB-3 Black Sea Bass 1.05/15/2003 SB-3 Little Skate 1.05/15/2003 SB-3 Red Hake 2.05/15/2003 SB-3 Scup 1.05/15/2003 SB-3 Smallmouth Flounder 2.05/15/2003 SB-3 Spotted Hake 28.05/15/2003 SB-3 Striped Searobin 6.05/15/2003 SB-3 Summer Flounder 12.05/15/2003 SB-3 Windowpane 4.05/15/2003 SB-3 Winter Flounder 5.05/15/2003 SB-4 Atlantic Herring 7.05/15/2003 SB-4 Bay Anchovy 13.05/15/2003 SB-4 Little Skate 1.05/15/2003 SB-4 Spotted Hake 48.05/15/2003 SB-4 Striped Searobin 8.05/15/2003 SB-4 Windowpane 2.05/15/2003 SB-4 Winter Flounder 3.05/16/2003 PJ-1 Atlantic Herring 3.05/16/2003 PJ-1 Atlantic Tomcod 3.05/16/2003 PJ-1 Bay Anchovy 11.05/16/2003 PJ-1 Blueback Herring 1.05/16/2003 PJ-1 Grubby 1.05/16/2003 PJ-1 Smallmouth Flounder 1.05/16/2003 PJ-1 Spotted Hake 24.05/16/2003 PJ-1 Striped Bass 2.0

Appendix A. Adult finfish (trawl) CPUEs by date and sample location. (page 20 of 22)
Date Station Common Name CPUE5/16/2003 PJ-1 Striped Searobin 4.05/16/2003 PJ-1 Summer Flounder 5.05/16/2003 PJ-1 Windowpane 2.05/16/2003 PJ-1 Winter Flounder 26.05/16/2003 PJ-5 Atlantic Herring 12.25/16/2003 PJ-5 Bay Anchovy 16.75/16/2003 PJ-5 Grubby 1.15/16/2003 SB-5 Red Hake 12.05/16/2003 SB-5 Spotted Hake 23.05/16/2003 SB-5 Tautog 1.05/16/2003 SB-5 Windowpane 3.05/16/2003 SB-5 Winter Flounder 2.05/16/2003 SB-6 Atlantic Herring 6.05/16/2003 SB-6 Bay Anchovy 4.05/16/2003 SB-6 Little Skate 2.05/16/2003 SB-6 Spotted Hake 12.05/16/2003 SB-6 Striped Searobin 1.05/16/2003 SB-6 Summer Flounder 3.05/16/2003 SB-6 Windowpane 7.05/16/2003 SB-6 Winter Flounder 1.06/17/2003 LB-3 Bay Anchovy 81.06/17/2003 LB-3 Blueback Herring 1.06/17/2003 LB-3 Bluefish 1.06/17/2003 LB-3 Scup 3.06/17/2003 LB-3 Spotted Hake 4.06/17/2003 LB-3 Striped Cuskeel 1.06/17/2003 PJ-2 Atlantic Tomcod 6.06/17/2003 PJ-2 Bay Anchovy 67.06/17/2003 PJ-2 Spotted Hake 1.06/17/2003 PJ-2 Summer Flounder 1.06/17/2003 PJ-2 Windowpane 1.06/18/2003 AK-1 American Shad 1.36/18/2003 AK-1 Bay Anchovy 20.06/18/2003 AK-1 Spotted Hake 1.36/18/2003 AK-1 Striped Bass 3.86/18/2003 AK-2 American Eel 2.06/18/2003 AK-2 Atlantic Tomcod 5.06/18/2003 AK-2 Bay Anchovy 3.06/18/2003 AK-2 Smallmouth Flounder 1.06/18/2003 AK-2 Spotted Hake 35.06/18/2003 AK-2 Summer Flounder 1.06/18/2003 AK-2 Windowpane 1.06/18/2003 AK-2 Winter Flounder 12.06/18/2003 AK-3 Atlantic Tomcod 7.16/18/2003 AK-3 Bay Anchovy 2.96/18/2003 AK-3 Bluefish 1.46/18/2003 AK-3 Smallmouth Flounder 2.96/18/2003 AK-3 Spotted Hake 42.96/18/2003 AK-3 Windowpane 1.46/18/2003 AK-3 Winter Flounder 1.4

Appendix A. Adult finfish (trawl) CPUEs by date and sample location. (page 21 of 22)
Date Station Common Name CPUE6/18/2003 AK-4 Bay Anchovy 4.06/18/2003 AK-4 Northern Pipefish 1.06/18/2003 HR-1 Atlantic Tomcod 125.06/18/2003 HR-1 Bay Anchovy 105.06/18/2003 HR-1 Blueback Herring 5.06/18/2003 HR-1 Red Hake 5.06/18/2003 HR-1 Shortnose Sturgeon 10.06/18/2003 HR-1 Spotted Hake 75.06/18/2003 HR-1 Summer Flounder 5.06/18/2003 HR-1 Weakfish 10.06/18/2003 HR-1 Winter Flounder 115.06/18/2003 PJ-3 Atlantic Tomcod 10.06/18/2003 PJ-3 Bay Anchovy 71.06/18/2003 PJ-3 Red Hake 1.06/18/2003 PJ-3 Spotted Hake 2.06/18/2003 PJ-3 Striped Bass 1.06/18/2003 PJ-3 Summer Flounder 3.06/18/2003 PJ-3 Weakfish 1.06/18/2003 PJ-3 Winter Flounder 4.06/18/2003 PJ-4 Atlantic Tomcod 1.06/18/2003 PJ-4 Bay Anchovy 18.06/18/2003 PJ-4 Blueback Herring 2.06/18/2003 PJ-4 Spotted Hake 2.06/18/2003 PJ-5 Atlantic Tomcod 4.06/18/2003 PJ-5 Bay Anchovy 4.06/18/2003 PJ-5 Red Hake 2.06/18/2003 PJ-5 Spotted Hake 25.06/18/2003 PJ-5 Striped Searobin 1.06/18/2003 PJ-5 Summer Flounder 1.06/18/2003 PJ-5 Weakfish 1.06/18/2003 PJ-5 Windowpane 2.06/18/2003 PJ-5 Winter Flounder 5.06/18/2003 SB-1 Atlantic Tomcod 85.06/18/2003 SB-1 Bay Anchovy 75.06/18/2003 SB-1 Spotted Hake 5.06/18/2003 SB-1 Windowpane 5.06/18/2003 SB-2 Atlantic Tomcod 60.06/18/2003 SB-2 Bay Anchovy 10.06/18/2003 SB-2 Smallmouth Flounder 3.36/18/2003 SB-2 Spotted Hake 6.76/18/2003 SB-2 Windowpane 3.36/18/2003 SB-3 Atlantic Tomcod 11.06/18/2003 SB-3 Spotted Hake 3.06/19/2003 NB-3 Atlantic Tomcod 3.06/19/2003 NB-3 Bay Anchovy 2.06/19/2003 NB-3 Striped Bass 2.06/19/2003 NB-3 Winter Flounder 1.06/19/2003 NB-4 Bay Anchovy 1.06/19/2003 NB-4 Winter Flounder 2.06/19/2003 NB-5 Atlantic Menhaden 1.4

Appendix A. Adult finfish (trawl) CPUEs by date and sample location. (page 22 of 22)
Date Station Common Name CPUE6/19/2003 NB-5 Atlantic Tomcod 8.66/19/2003 NB-5 Bay Anchovy 12.96/19/2003 NB-5 Spotted Hake 2.96/19/2003 NB-6 American Eel 1.06/19/2003 NB-6 Atlantic Herring 1.06/19/2003 NB-6 Atlantic Tomcod 18.06/19/2003 NB-6 Bay Anchovy 6.06/19/2003 NB-6 Cunner 1.06/19/2003 NB-6 Northern Searobin 1.06/19/2003 NB-6 Oyster Toadfish 1.06/19/2003 NB-6 Red Hake 1.06/19/2003 NB-6 Spotted Hake 85.06/19/2003 NB-6 Summer Flounder 2.06/19/2003 NB-6 Windowpane 3.06/19/2003 NB-6 Winter Flounder 2.06/19/2003 NB-7 Bay Anchovy 24.36/19/2003 NB-7 Spotted Hake 1.46/19/2003 NB-7 Striped Bass 7.16/19/2003 NB-7 Summer Flounder 4.36/19/2003 NB-7 Winter Flounder 1.46/19/2003 PJ-1 Atlantic Tomcod 28.06/19/2003 PJ-1 Bay Anchovy 21.06/19/2003 PJ-1 Spotted Hake 3.06/19/2003 PJ-1 Summer Flounder 1.06/19/2003 PJ-1 Weakfish 1.06/19/2003 PJ-1 Winter Flounder 1.06/19/2003 SB-5 Spotted Hake 3.06/19/2003 SB-5 Summer Flounder 1.06/20/2003 LB-1 Bay Anchovy 6.06/20/2003 LB-1 Spiny Dogfish 1.06/20/2003 LB-2 Butterfish 2.06/20/2003 LB-4 Atlantic Herring 48.06/20/2003 LB-4 Bay Anchovy 34.06/20/2003 LB-4 Butterfish 1.06/20/2003 LB-4 Scup 10.06/20/2003 LB-4 Spiny Dogfish 1.06/20/2003 LB-4 Spotted Hake 6.06/20/2003 LB-4 Striped Searobin 4.06/20/2003 LB-4 Summer Flounder 1.06/20/2003 LB-4 Windowpane 2.06/20/2003 LB-5 Bay Anchovy 31.06/20/2003 LB-5 Blueback Herring 1.06/20/2003 LB-5 Spotted Hake 4.06/20/2003 LB-5 Winter Flounder 1.06/20/2003 LB-6 Atlantic Herring 176.06/20/2003 LB-6 Bay Anchovy 27.06/20/2003 LB-6 Windowpane 2.06/20/2003 LB-6 Winter Flounder 2.0

Appendix B. Ichthyoplankton (epibenthic sled) life stage densities by date and station sampled. (page 1 of 25)
Date Station Common Name Life Stage Number Caught Density1/21/2003 LB-3 Rock gunnel PYS 1 4.41/22/2003 NB-3 Atlantic croaker PYS 1 7.91/22/2003 NB-3 Atlantic menhaden PYS 1 7.91/22/2003 NB-4 Atlantic croaker PYS 1 4.41/22/2003 NB-5 Atlantic croaker PYS 2 4.51/22/2003 NB-6 Atlantic croaker PYS 1 4.51/22/2003 NB-6 Atlantic croaker JUV 1 4.51/22/2003 NB-7 Atlantic menhaden PYS 1 7.01/22/2003 NB-7 Bay anchovy JUV 1 7.01/22/2003 AK-2 Atlantic croaker JUV 1 4.01/22/2003 AK-2 Bay anchovy JUV 1 4.01/22/2003 AK-3 Rock gunnel PYS 1 4.41/22/2003 AK-4 Bay anchovy JUV 1 4.81/23/2003 PJ-4 Atlantic croaker JUV 3 31.11/23/2003 PJ-4 Summer flounder PYS 1 10.41/23/2003 PJ-5 Atlantic croaker JUV 2 8.51/23/2003 SB-5 Atlantic croaker JUV 1 4.01/23/2003 PJ-1 Atlantic croaker PYS 1 6.71/23/2003 PJ-2 Atlantic croaker JUV 5 23.81/23/2003 PJ-2 Bay anchovy JUV 1 4.82/4/2003 LB-5 American sandlance YS 1 4.72/4/2003 LB-4 Rock gunnel PYS 1 5.22/4/2003 LB-3 Rock gunnel PYS 1 5.02/4/2003 LB-2 Rock gunnel PYS 1 4.42/4/2003 LB-1 Rock gunnel PYS 3 14.12/5/2003 AK-3 Summer flounder PYS 1 5.62/5/2003 AK-4 Rock gunnel PYS 1 5.02/5/2003 NB-7 Rock gunnel PYS 1 6.82/6/2003 SB-2 Rock gunnel PYS 1 9.12/19/2003 LB-5 Winter flounder Egg 7 43.42/19/2003 LB-4 Winter flounder Egg 146 994.32/19/2003 LB-1 Winter flounder Egg 1 5.42/19/2003 SB-6 Winter flounder Egg 3 15.02/19/2003 SB-3 Winter flounder Egg 2 9.92/19/2003 SB-4 Winter flounder Egg 2 12.22/21/2003 SB-5 Rock gunnel PYS 1 3.62/21/2003 PJ-3 Rock gunnel PYS 1 6.42/21/2003 PJ-2 Rock gunnel PYS 1 6.63/4/2003 PJ-2 Winter flounder YS 1 7.43/4/2003 LB-3 Winter flounder YS 1 7.63/4/2003 LB-5 Winter flounder Egg 3 17.33/4/2003 LB-6 Atlantic herring PYS 1 6.73/4/2003 LB-4 American sandlance PYS 2 8.53/4/2003 LB-4 Grubby PYS 1 4.33/4/2003 LB-2 Rock gunnel PYS 1 8.13/4/2003 LB-1 Winter flounder Egg 2 16.63/4/2003 PJ-5 Winter flounder Egg 3 14.03/4/2003 PJ-1 Longhorn sculpin YS 1 6.33/4/2003 PJ-1 Winter flounder Egg 3 19.03/6/2003 SB-6 Rock gunnel PYS 1 3.2

Appendix B. Ichthyoplankton (epibenthic sled) life stage densities by date and station sampled. (page 2 of 25)
Date Station Common Name Life Stage Number Caught Density3/6/2003 SB-6 Winter flounder YS 1 3.23/6/2003 HR-1 Grubby PYS 1 15.43/7/2003 AK-3 Atlantic herring PYS 2 11.13/7/2003 AK-1 Grubby PYS 1 6.33/7/2003 AK-1 Longhorn sculpin PYS 1 6.33/7/2003 AK-1 Winter flounder PYS 1 6.33/7/2003 AK-2 American sandlance PYS 1 4.23/7/2003 AK-2 Grubby PYS 1 4.23/7/2003 AK-2 Winter flounder YS 1 4.23/7/2003 AK-2 Winter flounder PYS 2 8.53/18/2003 LB-3 Longhorn sculpin YS 1 5.53/18/2003 LB-3 Winter flounder Egg 2 10.93/18/2003 LB-5 Grubby UID 1 5.63/18/2003 LB-5 Rock gunnel PYS 1 5.63/18/2003 LB-5 Winter flounder Egg 166 933.53/18/2003 LB-6 Winter flounder Egg 1 7.23/18/2003 LB-4 Gadid unidentified Egg 1 5.03/18/2003 LB-4 Grubby YS 1 5.03/18/2003 LB-4 Grubby PYS 1 5.03/18/2003 LB-4 Rock gunnel YS 2 10.13/18/2003 LB-4 Rock gunnel PYS 1 5.03/18/2003 LB-4 Winter flounder Egg 13 65.63/18/2003 LB-1 Winter flounder Egg 3 29.73/18/2003 LB-2 Rock gunnel PYS 1 7.93/18/2003 LB-2 Winter flounder Egg 2 15.83/18/2003 SB-6 Grubby PYS 1 6.53/18/2003 SB-6 Winter flounder Egg 159 1031.63/18/2003 SB-3 Winter flounder Egg 15 174.73/18/2003 SB-4 American sandlance PYS 1 6.23/18/2003 SB-4 Atlantic herring PYS 3 18.73/18/2003 SB-4 Grubby PYS 1 6.23/18/2003 SB-4 Winter flounder Egg 27 168.73/18/2003 SB-1 Grubby PYS 2 25.83/19/2003 AK-1 Atlantic herring PYS 1 12.33/19/2003 AK-1 Grubby PYS 1 12.33/19/2003 AK-1 Longhorn sculpin PYS 1 12.33/19/2003 AK-4 Atlantic herring PYS 1 5.83/19/2003 AK-4 Winter flounder Egg 2 11.53/19/2003 AK-3 Atlantic herring PYS 5 21.33/19/2003 AK-3 Unidentified Egg 1 4.33/19/2003 NB-3 Grubby YS 1 5.63/19/2003 NB-5 Atlantic herring PYS 1 5.63/19/2003 NB-6 Atlantic herring PYS 3 18.43/19/2003 NB-6 Grubby PYS 1 6.13/19/2003 SB-5 Atlantic herring PYS 6 44.13/21/2003 PJ-3 Winter flounder Egg 23 124.23/21/2003 PJ-4 Atlantic herring PYS 1 5.13/21/2003 PJ-4 Rock gunnel PYS 1 5.13/21/2003 PJ-5 Atlantic herring PYS 3 12.53/21/2003 PJ-5 Winter flounder YS 2 8.4

Appendix B. Ichthyoplankton (epibenthic sled) life stage densities by date and station sampled. (page 3 of 25)
Date Station Common Name Life Stage Number Caught Density3/21/2003 PJ-1 Winter flounder Egg 1 5.13/21/2003 PJ-1 Winter flounder YS 2 10.23/21/2003 PJ-1 Winter flounder PYS 1 5.13/21/2003 PJ-1 Unidentified Egg 1 5.13/21/2003 PJ-2 Grubby PYS 1 5.93/21/2003 PJ-2 Winter flounder YS 17 99.73/21/2003 PJ-2 Winter flounder PYS 4 23.53/21/2003 HR-3 Winter flounder YS 23 612.13/21/2003 HR-3 Winter flounder PYS 5 133.13/21/2003 HR-3 Unidentified Egg 1 26.63/21/2003 HR-2 Grubby YS 1 18.33/21/2003 HR-2 Winter flounder YS 40 733.33/21/2003 HR-2 Winter flounder PYS 4 73.33/21/2003 HR-2 Winter flounder UID 5 91.74/1/2003 LB-3 Grubby YS 1 9.94/1/2003 LB-3 Grubby PYS 6 59.34/1/2003 LB-3 Winter flounder YS 103 1018.74/1/2003 LB-3 Winter flounder PYS 93 919.84/1/2003 LB-3 Winter flounder UID 153 1513.24/1/2003 LB-5 Grubby PYS 8 46.34/1/2003 LB-5 Rock gunnel PYS 2 11.64/1/2003 LB-5 Winter flounder YS 54 312.84/1/2003 LB-5 Winter flounder PYS 156 903.74/1/2003 LB-5 Winter flounder UID 7 40.64/1/2003 LB-6 Clupeid unidentified PYS 1 7.84/1/2003 LB-6 Windowpane Egg 1 7.84/1/2003 LB-6 Winter flounder Egg 2 15.64/1/2003 LB-6 Winter flounder YS 10 77.84/1/2003 LB-6 Unidentified UID 3 23.34/1/2003 LB-4 Grubby YS 1 4.74/1/2003 LB-4 Grubby PYS 33 154.74/1/2003 LB-4 Rock gunnel PYS 4 18.84/1/2003 LB-4 Winter flounder YS 139 651.84/1/2003 LB-4 Winter flounder PYS 110 515.84/1/2003 LB-4 Winter flounder UID 30 140.74/1/2003 LB-1 American sandlance PYS 1 8.84/1/2003 LB-1 Winter flounder Egg 2 17.74/1/2003 LB-1 Winter flounder YS 2 17.74/1/2003 LB-1 Winter flounder PYS 24 212.04/1/2003 LB-1 Winter flounder UID 1 8.84/1/2003 LB-2 Winter flounder PYS 4 30.94/1/2003 LB-2 Winter flounder UID 3 23.24/1/2003 SB-6 American sandlance PYS 1 5.54/1/2003 SB-6 Rock gunnel PYS 1 5.54/1/2003 SB-6 Winter flounder YS 41 226.74/1/2003 SB-6 Winter flounder PYS 16 88.54/1/2003 SB-6 Winter flounder UID 12 66.44/1/2003 SB-3 Grubby YS 1 7.04/1/2003 SB-3 Grubby PYS 1 7.04/1/2003 SB-3 Rock gunnel PYS 1 7.0

Appendix B. Ichthyoplankton (epibenthic sled) life stage densities by date and station sampled. (page 4 of 25)
Date Station Common Name Life Stage Number Caught Density4/1/2003 SB-3 Winter flounder Egg 1 7.04/1/2003 SB-3 Winter flounder YS 78 546.94/1/2003 SB-3 Winter flounder PYS 194 1360.34/1/2003 SB-3 Winter flounder UID 11 77.14/1/2003 SB-4 Grubby PYS 3 14.94/1/2003 SB-4 Windowpane Egg 2 9.94/1/2003 SB-4 Winter flounder PYS 9 44.64/1/2003 SB-1 Grubby YS 1 9.64/1/2003 SB-1 Grubby PYS 3 28.94/1/2003 SB-1 Winter flounder YS 87 837.64/1/2003 SB-1 Winter flounder PYS 107 1030.14/1/2003 SB-1 Winter flounder UID 23 221.44/1/2003 SB-2 Grubby PYS 4 35.44/1/2003 SB-2 Rock gunnel PYS 1 8.94/1/2003 SB-2 Winter flounder YS 2 17.74/1/2003 SB-2 Winter flounder PYS 11 97.44/1/2003 SB-2 Winter flounder UID 5 44.34/1/2003 PJ-1 Grubby PYS 3 17.74/1/2003 PJ-1 Windowpane Egg 1 5.94/1/2003 PJ-1 Winter flounder PYS 5 29.54/2/2003 AK-4 Grubby PYS 2 9.84/2/2003 AK-4 Winter flounder YS 154 757.54/2/2003 AK-4 Winter flounder PYS 154 757.54/2/2003 AK-4 Winter flounder UID 28 137.74/2/2003 NB-7 Winter flounder PYS 2 11.24/2/2003 NB-7 Winter flounder UID 2 11.24/2/2003 NB-6 Atlantic herring PYS 1 5.64/2/2003 NB-6 Grubby PYS 2 11.14/2/2003 NB-6 Winter flounder YS 18 100.34/2/2003 NB-6 Winter flounder PYS 7 39.04/2/2003 NB-6 Winter flounder UID 4 22.34/2/2003 NB-4 Winter flounder YS 32 161.84/2/2003 NB-4 Winter flounder PYS 139 702.84/2/2003 NB-4 Winter flounder UID 39 197.24/2/2003 NB-3 Winter flounder PYS 23 120.54/2/2003 NB-3 Winter flounder UID 68 356.34/2/2003 NB-5 Atlantic herring PYS 2 11.74/2/2003 NB-5 Grubby PYS 2 11.74/2/2003 NB-5 Winter flounder YS 6 35.14/2/2003 NB-5 Winter flounder PYS 1 5.94/2/2003 NB-5 Winter flounder UID 2 11.74/2/2003 AK-3 Atlantic tomcod PYS 1 5.34/2/2003 AK-3 Grubby PYS 4 21.14/2/2003 AK-3 Winter flounder YS 70 369.44/2/2003 AK-3 Winter flounder PYS 17 89.74/2/2003 AK-3 Winter flounder UID 3 15.84/2/2003 AK-2 Grubby PYS 8 58.44/2/2003 AK-2 Winter flounder Egg 1 7.34/2/2003 AK-2 Winter flounder UID 4 29.24/2/2003 AK-1 Grubby PYS 6 42.9

Appendix B. Ichthyoplankton (epibenthic sled) life stage densities by date and station sampled. (page 5 of 25)
Date Station Common Name Life Stage Number Caught Density4/2/2003 AK-1 Winter flounder YS 8 57.24/2/2003 AK-1 Winter flounder PYS 13 93.04/2/2003 AK-1 Winter flounder UID 2 14.34/2/2003 SB-5 Winter flounder Egg 1 6.44/2/2003 SB-5 Winter flounder YS 18 115.04/2/2003 SB-5 Winter flounder PYS 7 44.74/2/2003 SB-5 Winter flounder UID 11 70.34/2/2003 PJ-5 Grubby PYS 5 21.74/2/2003 PJ-5 Rock gunnel PYS 1 4.34/2/2003 PJ-5 Winter flounder PYS 2 8.74/3/2003 PJ-3 Grubby PYS 2 10.14/3/2003 PJ-3 Winter flounder YS 2 10.14/3/2003 PJ-3 Winter flounder PYS 10 50.74/3/2003 PJ-3 Winter flounder UID 10 50.74/3/2003 PJ-2 Grubby PYS 3 16.44/3/2003 PJ-2 Rock gunnel PYS 1 5.54/3/2003 PJ-2 Winter flounder YS 9 49.14/3/2003 PJ-2 Winter flounder PYS 2 10.94/3/2003 PJ-2 Winter flounder UID 13 71.04/3/2003 HR-1 Grubby PYS 2 21.64/3/2003 HR-1 Winter flounder YS 16 172.64/3/2003 HR-1 Winter flounder PYS 14 151.04/3/2003 HR-1 Winter flounder UID 2 21.64/3/2003 PJ-4 Atlantic herring PYS 1 4.44/3/2003 PJ-4 Grubby YS 1 4.44/3/2003 PJ-4 Grubby PYS 3 13.14/3/2003 PJ-4 Winter flounder YS 15 65.44/3/2003 PJ-4 Winter flounder UID 5 21.84/3/2003 HR-2 Winter flounder YS 6 114.44/3/2003 HR-2 Winter flounder UID 2 38.14/15/2003 PJ-3 Fourbeard rockling Egg 1 4.94/15/2003 PJ-3 Grubby YS 1 4.94/15/2003 PJ-3 Grubby PYS 3 14.74/15/2003 PJ-3 Winter flounder PYS 76 373.44/15/2003 PJ-3 Winter flounder UID 26 127.74/15/2003 LB-3 American sandlance PYS 2 14.24/15/2003 LB-3 Grubby YS 5 35.44/15/2003 LB-3 Grubby PYS 16 113.24/15/2003 LB-3 Winter flounder YS 3 21.24/15/2003 LB-3 Winter flounder PYS 134 948.44/15/2003 LB-3 Winter flounder UID 4 28.34/15/2003 LB-5 Grubby YS 1 8.64/15/2003 LB-5 Grubby PYS 5 42.84/15/2003 LB-5 Rock gunnel PYS 1 8.64/15/2003 LB-5 Windowpane Egg 2 17.14/15/2003 LB-5 Winter flounder PYS 131 1122.54/15/2003 LB-6 American sandlance PYS 1 7.54/15/2003 LB-6 Grubby PYS 3 22.64/15/2003 LB-6 Windowpane Egg 1 7.54/15/2003 LB-6 Winter flounder PYS 100 753.0

Appendix B. Ichthyoplankton (epibenthic sled) life stage densities by date and station sampled. (page 6 of 25)
Date Station Common Name Life Stage Number Caught Density4/15/2003 LB-6 Winter flounder UID 4 30.14/15/2003 LB-4 Grubby YS 2 10.34/15/2003 LB-4 Grubby PYS 31 159.14/15/2003 LB-4 Rock gunnel PYS 7 35.94/15/2003 LB-4 Windowpane Egg 1 5.14/15/2003 LB-4 Winter flounder YS 2 10.34/15/2003 LB-4 Winter flounder PYS 109 559.54/15/2003 LB-4 Winter flounder UID 1 5.14/15/2003 LB-2 American sandlance PYS 6 43.44/15/2003 LB-2 Grubby YS 1 7.24/15/2003 LB-2 Grubby PYS 7 50.64/15/2003 LB-2 Rock gunnel PYS 1 7.24/15/2003 LB-2 Winter flounder PYS 33 238.54/15/2003 LB-1 American sandlance PYS 2 11.24/15/2003 LB-1 Grubby PYS 5 27.94/15/2003 LB-1 Winter flounder Egg 2 11.24/15/2003 LB-1 Winter flounder YS 2 11.24/15/2003 LB-1 Winter flounder PYS 278 1550.04/15/2003 LB-1 Winter flounder UID 2 11.24/15/2003 SB-3 Fourbeard rockling Egg 7 33.34/15/2003 SB-3 Grubby PYS 10 47.64/15/2003 SB-3 Windowpane Egg 1 4.84/15/2003 SB-3 Winter flounder Egg 3 14.34/15/2003 SB-3 Winter flounder YS 19 90.54/15/2003 SB-3 Winter flounder PYS 37 176.34/15/2003 SB-4 American sandlance PYS 1 4.94/15/2003 SB-4 Atlantic herring PYS 5 24.44/15/2003 SB-4 Fourbeard rockling Egg 16 78.14/15/2003 SB-4 Grubby YS 1 4.94/15/2003 SB-4 Grubby PYS 12 58.64/15/2003 SB-4 Rock gunnel PYS 2 9.84/15/2003 SB-4 Windowpane Egg 2 9.84/15/2003 SB-4 Winter flounder YS 37 180.74/15/2003 SB-4 Winter flounder PYS 146 713.14/15/2003 SB-4 Winter flounder UID 6 29.34/15/2003 SB-1 Fourbeard rockling Egg 1 11.24/15/2003 SB-1 Grubby PYS 7 78.54/15/2003 SB-1 Winter flounder PYS 12 134.54/15/2003 SB-1 Winter flounder UID 1 11.24/15/2003 SB-2 American sandlance PYS 1 9.44/15/2003 SB-2 Fourbeard rockling Egg 8 75.64/15/2003 SB-2 Grubby YS 1 9.44/15/2003 SB-2 Grubby PYS 7 66.14/15/2003 SB-2 Winter flounder YS 4 37.84/15/2003 SB-2 Winter flounder PYS 55 519.74/15/2003 PJ-1 Atlantic herring PYS 12 63.04/15/2003 PJ-1 Grubby YS 3 15.74/15/2003 PJ-1 Grubby PYS 4 21.04/15/2003 PJ-1 Rock gunnel PYS 2 10.54/15/2003 PJ-1 Windowpane Egg 1 5.2
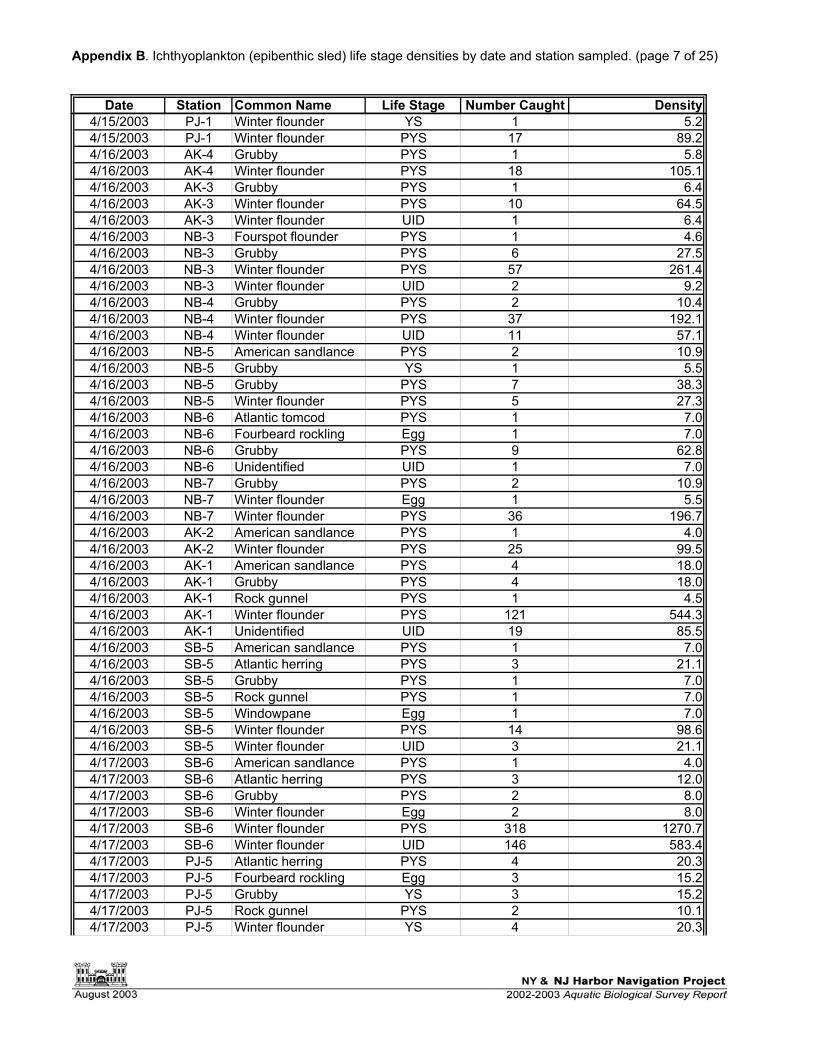
Appendix B. Ichthyoplankton (epibenthic sled) life stage densities by date and station sampled. (page 7 of 25)
Date Station Common Name Life Stage Number Caught Density4/15/2003 PJ-1 Winter flounder YS 1 5.24/15/2003 PJ-1 Winter flounder PYS 17 89.24/16/2003 AK-4 Grubby PYS 1 5.84/16/2003 AK-4 Winter flounder PYS 18 105.14/16/2003 AK-3 Grubby PYS 1 6.44/16/2003 AK-3 Winter flounder PYS 10 64.54/16/2003 AK-3 Winter flounder UID 1 6.44/16/2003 NB-3 Fourspot flounder PYS 1 4.64/16/2003 NB-3 Grubby PYS 6 27.54/16/2003 NB-3 Winter flounder PYS 57 261.44/16/2003 NB-3 Winter flounder UID 2 9.24/16/2003 NB-4 Grubby PYS 2 10.44/16/2003 NB-4 Winter flounder PYS 37 192.14/16/2003 NB-4 Winter flounder UID 11 57.14/16/2003 NB-5 American sandlance PYS 2 10.94/16/2003 NB-5 Grubby YS 1 5.54/16/2003 NB-5 Grubby PYS 7 38.34/16/2003 NB-5 Winter flounder PYS 5 27.34/16/2003 NB-6 Atlantic tomcod PYS 1 7.04/16/2003 NB-6 Fourbeard rockling Egg 1 7.04/16/2003 NB-6 Grubby PYS 9 62.84/16/2003 NB-6 Unidentified UID 1 7.04/16/2003 NB-7 Grubby PYS 2 10.94/16/2003 NB-7 Winter flounder Egg 1 5.54/16/2003 NB-7 Winter flounder PYS 36 196.74/16/2003 AK-2 American sandlance PYS 1 4.04/16/2003 AK-2 Winter flounder PYS 25 99.54/16/2003 AK-1 American sandlance PYS 4 18.04/16/2003 AK-1 Grubby PYS 4 18.04/16/2003 AK-1 Rock gunnel PYS 1 4.54/16/2003 AK-1 Winter flounder PYS 121 544.34/16/2003 AK-1 Unidentified UID 19 85.54/16/2003 SB-5 American sandlance PYS 1 7.04/16/2003 SB-5 Atlantic herring PYS 3 21.14/16/2003 SB-5 Grubby PYS 1 7.04/16/2003 SB-5 Rock gunnel PYS 1 7.04/16/2003 SB-5 Windowpane Egg 1 7.04/16/2003 SB-5 Winter flounder PYS 14 98.64/16/2003 SB-5 Winter flounder UID 3 21.14/17/2003 SB-6 American sandlance PYS 1 4.04/17/2003 SB-6 Atlantic herring PYS 3 12.04/17/2003 SB-6 Grubby PYS 2 8.04/17/2003 SB-6 Winter flounder Egg 2 8.04/17/2003 SB-6 Winter flounder PYS 318 1270.74/17/2003 SB-6 Winter flounder UID 146 583.44/17/2003 PJ-5 Atlantic herring PYS 4 20.34/17/2003 PJ-5 Fourbeard rockling Egg 3 15.24/17/2003 PJ-5 Grubby YS 3 15.24/17/2003 PJ-5 Rock gunnel PYS 2 10.14/17/2003 PJ-5 Winter flounder YS 4 20.3

Appendix B. Ichthyoplankton (epibenthic sled) life stage densities by date and station sampled. (page 8 of 25)
Date Station Common Name Life Stage Number Caught Density4/17/2003 PJ-5 Winter flounder PYS 42 213.14/17/2003 PJ-5 Winter flounder UID 4 20.34/17/2003 PJ-4 American sandlance PYS 2 11.44/17/2003 PJ-4 Atlantic herring PYS 1 5.74/17/2003 PJ-4 Fourbeard rockling Egg 9 51.44/17/2003 PJ-4 Grubby YS 1 5.74/17/2003 PJ-4 Grubby PYS 1 5.74/17/2003 PJ-4 Windowpane Egg 1 5.74/17/2003 PJ-4 Winter flounder PYS 23 131.54/17/2003 PJ-4 Winter flounder UID 3 17.14/17/2003 HR-1 Atlantic herring PYS 1 14.24/17/2003 HR-1 Fourbeard rockling Egg 1 14.24/17/2003 HR-1 Grubby YS 1 14.24/17/2003 HR-1 Grubby PYS 6 85.44/17/2003 HR-1 Rock gunnel PYS 2 28.54/17/2003 HR-1 Winter flounder PYS 1 14.24/17/2003 PJ-2 American sandlance PYS 1 6.24/17/2003 PJ-2 Atlantic herring PYS 1 6.24/17/2003 PJ-2 Fourbeard rockling Egg 1 6.24/17/2003 PJ-2 Grubby YS 4 24.94/17/2003 PJ-2 Grubby PYS 13 81.14/17/2003 PJ-2 Winter flounder YS 4 24.94/17/2003 PJ-2 Winter flounder PYS 11 68.64/17/2003 PJ-2 Winter flounder UID 1 6.24/17/2003 HR-2 Atlantic herring PYS 1 14.04/17/2003 HR-2 Winter flounder PYS 13 181.94/17/2003 HR-3 Winter flounder PYS 6 230.34/30/2003 PJ-2 Grubby PYS 1 5.94/30/2003 PJ-2 Rock gunnel PYS 1 5.94/30/2003 PJ-2 Winter flounder PYS 4 23.54/30/2003 PJ-3 Grubby PYS 1 6.84/30/2003 PJ-3 Winter flounder PYS 20 137.04/30/2003 LB-3 Windowpane Egg 44 251.74/30/2003 LB-3 Winter flounder PYS 752 4302.34/30/2003 LB-5 Grubby PYS 4 20.74/30/2003 LB-5 Windowpane Egg 88 455.64/30/2003 LB-5 Winter flounder PYS 42 217.44/30/2003 LB-6 Windowpane Egg 8 39.04/30/2003 LB-4 Grubby YS 1 4.44/30/2003 LB-4 Grubby PYS 90 396.44/30/2003 LB-4 Rock gunnel PYS 9 39.64/30/2003 LB-4 Windowpane Egg 24 105.74/30/2003 LB-4 Winter flounder Egg 2 8.84/30/2003 LB-4 Winter flounder PYS 47 207.04/30/2003 LB-2 American sandlance PYS 2 16.94/30/2003 LB-2 Grubby PYS 17 143.74/30/2003 LB-2 Rock gunnel PYS 1 8.54/30/2003 LB-2 Windowpane Egg 12 101.44/30/2003 LB-2 Winter flounder Egg 4 33.84/30/2003 LB-2 Winter flounder PYS 97 820.0
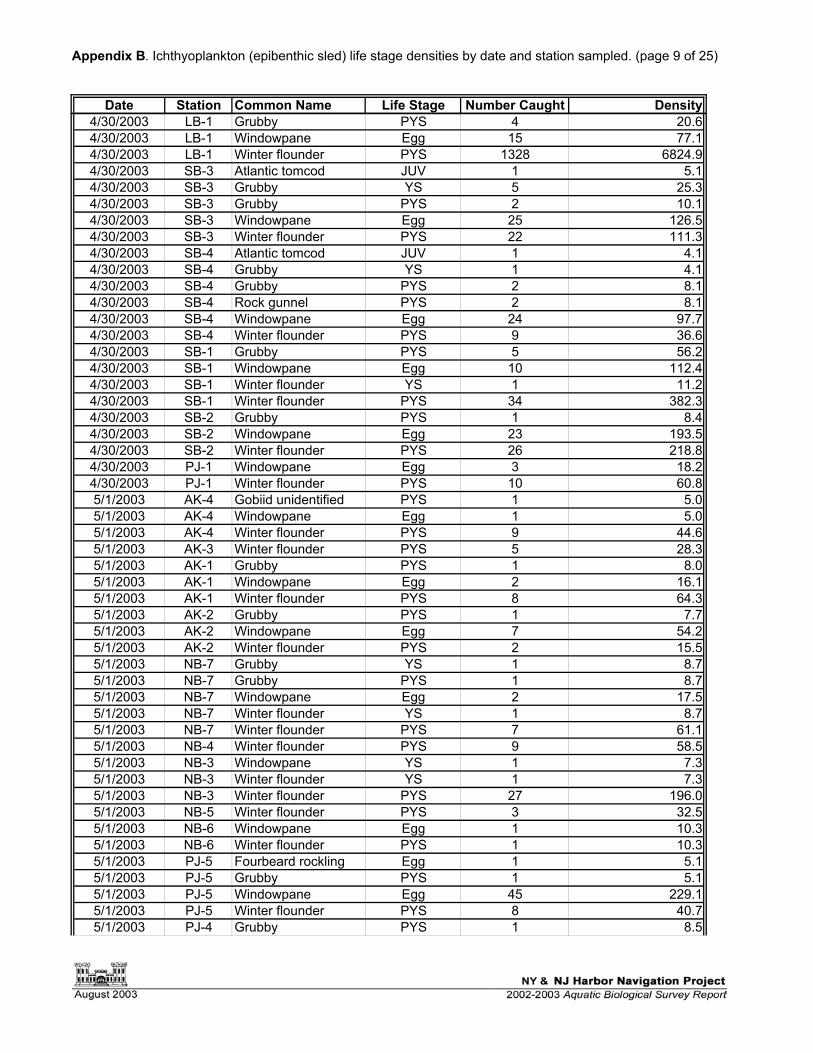
Appendix B. Ichthyoplankton (epibenthic sled) life stage densities by date and station sampled. (page 9 of 25)
Date Station Common Name Life Stage Number Caught Density4/30/2003 LB-1 Grubby PYS 4 20.64/30/2003 LB-1 Windowpane Egg 15 77.14/30/2003 LB-1 Winter flounder PYS 1328 6824.94/30/2003 SB-3 Atlantic tomcod JUV 1 5.14/30/2003 SB-3 Grubby YS 5 25.34/30/2003 SB-3 Grubby PYS 2 10.14/30/2003 SB-3 Windowpane Egg 25 126.54/30/2003 SB-3 Winter flounder PYS 22 111.34/30/2003 SB-4 Atlantic tomcod JUV 1 4.14/30/2003 SB-4 Grubby YS 1 4.14/30/2003 SB-4 Grubby PYS 2 8.14/30/2003 SB-4 Rock gunnel PYS 2 8.14/30/2003 SB-4 Windowpane Egg 24 97.74/30/2003 SB-4 Winter flounder PYS 9 36.64/30/2003 SB-1 Grubby PYS 5 56.24/30/2003 SB-1 Windowpane Egg 10 112.44/30/2003 SB-1 Winter flounder YS 1 11.24/30/2003 SB-1 Winter flounder PYS 34 382.34/30/2003 SB-2 Grubby PYS 1 8.44/30/2003 SB-2 Windowpane Egg 23 193.54/30/2003 SB-2 Winter flounder PYS 26 218.84/30/2003 PJ-1 Windowpane Egg 3 18.24/30/2003 PJ-1 Winter flounder PYS 10 60.85/1/2003 AK-4 Gobiid unidentified PYS 1 5.05/1/2003 AK-4 Windowpane Egg 1 5.05/1/2003 AK-4 Winter flounder PYS 9 44.65/1/2003 AK-3 Winter flounder PYS 5 28.35/1/2003 AK-1 Grubby PYS 1 8.05/1/2003 AK-1 Windowpane Egg 2 16.15/1/2003 AK-1 Winter flounder PYS 8 64.35/1/2003 AK-2 Grubby PYS 1 7.75/1/2003 AK-2 Windowpane Egg 7 54.25/1/2003 AK-2 Winter flounder PYS 2 15.55/1/2003 NB-7 Grubby YS 1 8.75/1/2003 NB-7 Grubby PYS 1 8.75/1/2003 NB-7 Windowpane Egg 2 17.55/1/2003 NB-7 Winter flounder YS 1 8.75/1/2003 NB-7 Winter flounder PYS 7 61.15/1/2003 NB-4 Winter flounder PYS 9 58.55/1/2003 NB-3 Windowpane YS 1 7.35/1/2003 NB-3 Winter flounder YS 1 7.35/1/2003 NB-3 Winter flounder PYS 27 196.05/1/2003 NB-5 Winter flounder PYS 3 32.55/1/2003 NB-6 Windowpane Egg 1 10.35/1/2003 NB-6 Winter flounder PYS 1 10.35/1/2003 PJ-5 Fourbeard rockling Egg 1 5.15/1/2003 PJ-5 Grubby PYS 1 5.15/1/2003 PJ-5 Windowpane Egg 45 229.15/1/2003 PJ-5 Winter flounder PYS 8 40.75/1/2003 PJ-4 Grubby PYS 1 8.5
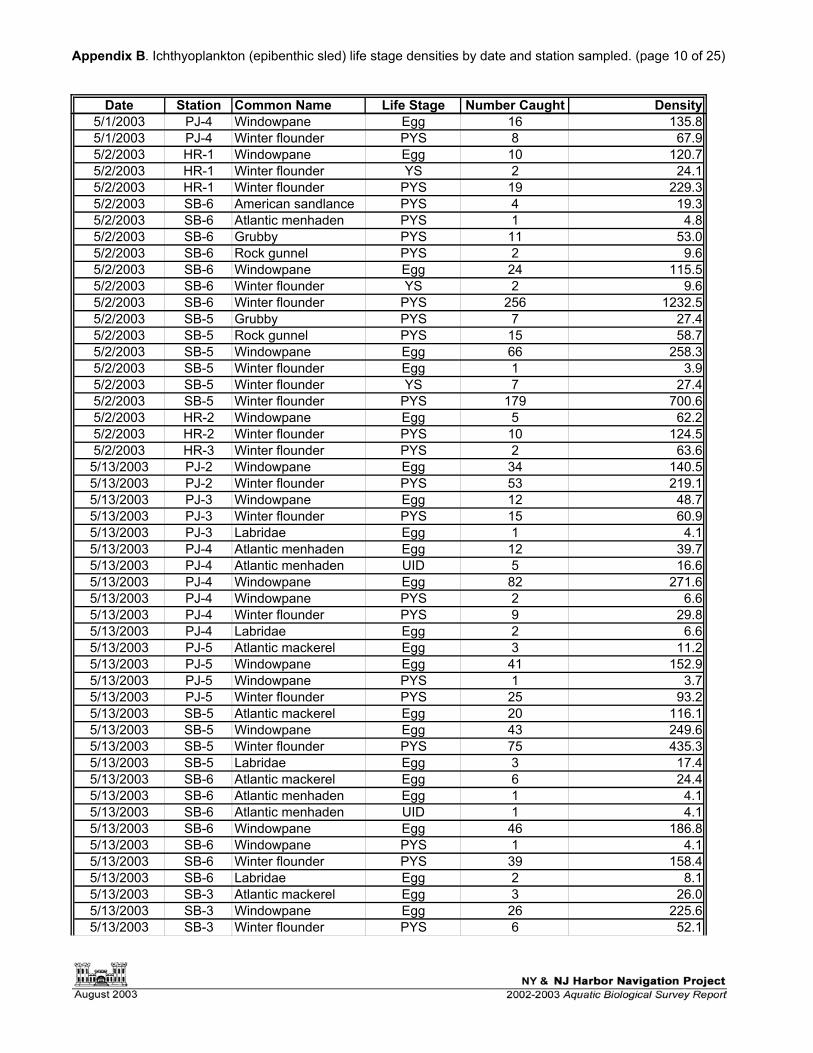
Appendix B. Ichthyoplankton (epibenthic sled) life stage densities by date and station sampled. (page 10 of 25)
Date Station Common Name Life Stage Number Caught Density5/1/2003 PJ-4 Windowpane Egg 16 135.85/1/2003 PJ-4 Winter flounder PYS 8 67.95/2/2003 HR-1 Windowpane Egg 10 120.75/2/2003 HR-1 Winter flounder YS 2 24.15/2/2003 HR-1 Winter flounder PYS 19 229.35/2/2003 SB-6 American sandlance PYS 4 19.35/2/2003 SB-6 Atlantic menhaden PYS 1 4.85/2/2003 SB-6 Grubby PYS 11 53.05/2/2003 SB-6 Rock gunnel PYS 2 9.65/2/2003 SB-6 Windowpane Egg 24 115.55/2/2003 SB-6 Winter flounder YS 2 9.65/2/2003 SB-6 Winter flounder PYS 256 1232.55/2/2003 SB-5 Grubby PYS 7 27.45/2/2003 SB-5 Rock gunnel PYS 15 58.75/2/2003 SB-5 Windowpane Egg 66 258.35/2/2003 SB-5 Winter flounder Egg 1 3.95/2/2003 SB-5 Winter flounder YS 7 27.45/2/2003 SB-5 Winter flounder PYS 179 700.65/2/2003 HR-2 Windowpane Egg 5 62.25/2/2003 HR-2 Winter flounder PYS 10 124.55/2/2003 HR-3 Winter flounder PYS 2 63.65/13/2003 PJ-2 Windowpane Egg 34 140.55/13/2003 PJ-2 Winter flounder PYS 53 219.15/13/2003 PJ-3 Windowpane Egg 12 48.75/13/2003 PJ-3 Winter flounder PYS 15 60.95/13/2003 PJ-3 Labridae Egg 1 4.15/13/2003 PJ-4 Atlantic menhaden Egg 12 39.75/13/2003 PJ-4 Atlantic menhaden UID 5 16.65/13/2003 PJ-4 Windowpane Egg 82 271.65/13/2003 PJ-4 Windowpane PYS 2 6.65/13/2003 PJ-4 Winter flounder PYS 9 29.85/13/2003 PJ-4 Labridae Egg 2 6.65/13/2003 PJ-5 Atlantic mackerel Egg 3 11.25/13/2003 PJ-5 Windowpane Egg 41 152.95/13/2003 PJ-5 Windowpane PYS 1 3.75/13/2003 PJ-5 Winter flounder PYS 25 93.25/13/2003 SB-5 Atlantic mackerel Egg 20 116.15/13/2003 SB-5 Windowpane Egg 43 249.65/13/2003 SB-5 Winter flounder PYS 75 435.35/13/2003 SB-5 Labridae Egg 3 17.45/13/2003 SB-6 Atlantic mackerel Egg 6 24.45/13/2003 SB-6 Atlantic menhaden Egg 1 4.15/13/2003 SB-6 Atlantic menhaden UID 1 4.15/13/2003 SB-6 Windowpane Egg 46 186.85/13/2003 SB-6 Windowpane PYS 1 4.15/13/2003 SB-6 Winter flounder PYS 39 158.45/13/2003 SB-6 Labridae Egg 2 8.15/13/2003 SB-3 Atlantic mackerel Egg 3 26.05/13/2003 SB-3 Windowpane Egg 26 225.65/13/2003 SB-3 Winter flounder PYS 6 52.1

Appendix B. Ichthyoplankton (epibenthic sled) life stage densities by date and station sampled. (page 11 of 25)
Date Station Common Name Life Stage Number Caught Density5/13/2003 SB-3 Labridae Egg 3 26.05/13/2003 SB-4 Atlantic mackerel Egg 14 86.25/13/2003 SB-4 Windowpane Egg 82 504.95/13/2003 SB-4 Winter flounder PYS 210 1293.15/13/2003 SB-1 Atlantic mackerel Egg 1 10.65/13/2003 SB-1 Windowpane Egg 26 275.55/13/2003 SB-1 Winter flounder PYS 11 116.65/13/2003 SB-1 Labridae Egg 2 21.25/13/2003 SB-2 Windowpane Egg 18 155.35/13/2003 SB-2 Winter flounder PYS 8 69.05/13/2003 PJ-1 Atlantic mackerel Egg 4 29.05/13/2003 PJ-1 Windowpane Egg 23 166.55/13/2003 PJ-1 Winter flounder PYS 21 152.05/14/2003 NB-7 Atlantic menhaden Egg 4 24.45/14/2003 NB-7 Windowpane Egg 3 18.35/14/2003 NB-7 Windowpane PYS 2 12.25/14/2003 NB-7 Winter flounder PYS 39 237.75/14/2003 NB-4 Atlantic silverside PYS 1 4.95/14/2003 NB-4 Windowpane Egg 2 9.85/14/2003 NB-4 Winter flounder PYS 16 78.45/14/2003 NB-4 Labridae Egg 1 4.95/14/2003 NB-3 Winter flounder PYS 6 30.65/14/2003 NB-3 Labridae Egg 1 5.15/14/2003 AK-4 Atlantic menhaden Egg 2 10.85/14/2003 AK-4 Atlantic silverside PYS 1 5.45/14/2003 AK-4 Windowpane PYS 1 5.45/14/2003 AK-4 Winter flounder PYS 16 86.05/14/2003 AK-3 Atlantic herring PYS 1 5.35/14/2003 AK-3 Atlantic tomcod JUV 1 5.35/14/2003 AK-3 Grubby PYS 1 5.35/14/2003 AK-3 Windowpane Egg 3 16.05/14/2003 AK-3 Winter flounder PYS 164 877.15/14/2003 AK-3 Labridae Egg 1 5.35/14/2003 AK-2 Atlantic menhaden Egg 1 6.05/14/2003 AK-2 Atlantic silverside PYS 1 6.05/14/2003 AK-2 Windowpane Egg 8 48.25/14/2003 AK-2 Winter flounder PYS 35 210.85/14/2003 AK-1 Atlantic menhaden Egg 3 16.75/14/2003 AK-1 Atlantic menhaden PYS 1 5.65/14/2003 AK-1 Windowpane Egg 5 27.95/14/2003 AK-1 Windowpane PYS 1 5.65/14/2003 AK-1 Winter flounder PYS 6 33.55/14/2003 AK-1 Labridae Egg 3 16.75/14/2003 NB-6 Atlantic herring PYS 1 7.35/14/2003 NB-6 Atlantic menhaden Egg 86 630.15/14/2003 NB-6 Atlantic tomcod JUV 1 7.35/14/2003 NB-6 Windowpane Egg 20 146.55/14/2003 NB-6 Winter flounder PYS 11 80.65/14/2003 NB-6 Labridae Egg 6 44.05/14/2003 NB-5 Atlantic menhaden Egg 2 22.2
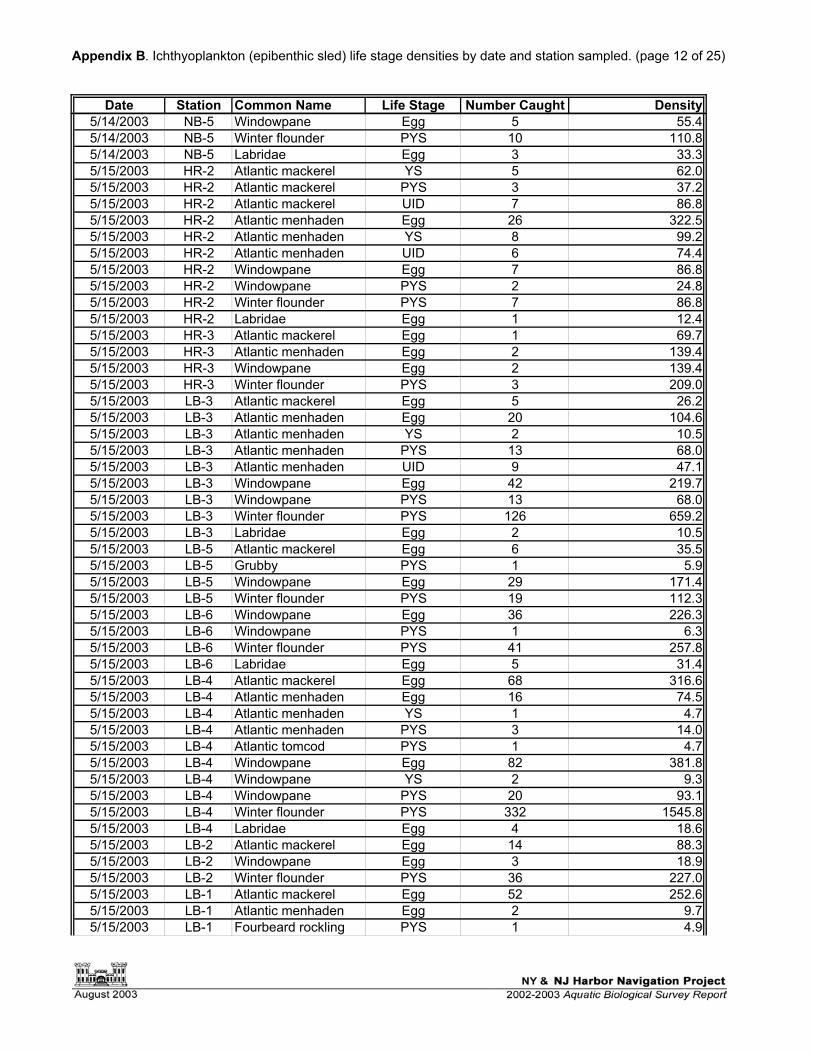
Appendix B. Ichthyoplankton (epibenthic sled) life stage densities by date and station sampled. (page 12 of 25)
Date Station Common Name Life Stage Number Caught Density5/14/2003 NB-5 Windowpane Egg 5 55.45/14/2003 NB-5 Winter flounder PYS 10 110.85/14/2003 NB-5 Labridae Egg 3 33.35/15/2003 HR-2 Atlantic mackerel YS 5 62.05/15/2003 HR-2 Atlantic mackerel PYS 3 37.25/15/2003 HR-2 Atlantic mackerel UID 7 86.85/15/2003 HR-2 Atlantic menhaden Egg 26 322.55/15/2003 HR-2 Atlantic menhaden YS 8 99.25/15/2003 HR-2 Atlantic menhaden UID 6 74.45/15/2003 HR-2 Windowpane Egg 7 86.85/15/2003 HR-2 Windowpane PYS 2 24.85/15/2003 HR-2 Winter flounder PYS 7 86.85/15/2003 HR-2 Labridae Egg 1 12.45/15/2003 HR-3 Atlantic mackerel Egg 1 69.75/15/2003 HR-3 Atlantic menhaden Egg 2 139.45/15/2003 HR-3 Windowpane Egg 2 139.45/15/2003 HR-3 Winter flounder PYS 3 209.05/15/2003 LB-3 Atlantic mackerel Egg 5 26.25/15/2003 LB-3 Atlantic menhaden Egg 20 104.65/15/2003 LB-3 Atlantic menhaden YS 2 10.55/15/2003 LB-3 Atlantic menhaden PYS 13 68.05/15/2003 LB-3 Atlantic menhaden UID 9 47.15/15/2003 LB-3 Windowpane Egg 42 219.75/15/2003 LB-3 Windowpane PYS 13 68.05/15/2003 LB-3 Winter flounder PYS 126 659.25/15/2003 LB-3 Labridae Egg 2 10.55/15/2003 LB-5 Atlantic mackerel Egg 6 35.55/15/2003 LB-5 Grubby PYS 1 5.95/15/2003 LB-5 Windowpane Egg 29 171.45/15/2003 LB-5 Winter flounder PYS 19 112.35/15/2003 LB-6 Windowpane Egg 36 226.35/15/2003 LB-6 Windowpane PYS 1 6.35/15/2003 LB-6 Winter flounder PYS 41 257.85/15/2003 LB-6 Labridae Egg 5 31.45/15/2003 LB-4 Atlantic mackerel Egg 68 316.65/15/2003 LB-4 Atlantic menhaden Egg 16 74.55/15/2003 LB-4 Atlantic menhaden YS 1 4.75/15/2003 LB-4 Atlantic menhaden PYS 3 14.05/15/2003 LB-4 Atlantic tomcod PYS 1 4.75/15/2003 LB-4 Windowpane Egg 82 381.85/15/2003 LB-4 Windowpane YS 2 9.35/15/2003 LB-4 Windowpane PYS 20 93.15/15/2003 LB-4 Winter flounder PYS 332 1545.85/15/2003 LB-4 Labridae Egg 4 18.65/15/2003 LB-2 Atlantic mackerel Egg 14 88.35/15/2003 LB-2 Windowpane Egg 3 18.95/15/2003 LB-2 Winter flounder PYS 36 227.05/15/2003 LB-1 Atlantic mackerel Egg 52 252.65/15/2003 LB-1 Atlantic menhaden Egg 2 9.75/15/2003 LB-1 Fourbeard rockling PYS 1 4.9

Appendix B. Ichthyoplankton (epibenthic sled) life stage densities by date and station sampled. (page 13 of 25)
Date Station Common Name Life Stage Number Caught Density5/15/2003 LB-1 Grubby PYS 1 4.95/15/2003 LB-1 Windowpane Egg 26 126.35/15/2003 LB-1 Winter flounder PYS 92 446.95/15/2003 LB-1 Labridae Egg 6 29.15/15/2003 HR-1 Windowpane Egg 16 181.56/3/2003 LB-3 Atlantic menhaden Egg 1376 9330.56/3/2003 LB-3 Bay anchovy Egg 768 5207.76/3/2003 LB-3 Windowpane Egg 176 1193.46/3/2003 LB-3 Windowpane YS 1 6.86/3/2003 LB-3 Windowpane PYS 15 101.76/3/2003 LB-3 Winter flounder PYS 1 6.86/3/2003 LB-3 Labridae Egg 352 2386.96/3/2003 LB-5 Atlantic menhaden Egg 4416 31269.86/3/2003 LB-5 Bay anchovy Egg 320 2265.96/3/2003 LB-5 Prionotus sp. Egg 64 453.26/3/2003 LB-5 Weakfish Egg 128 906.46/3/2003 LB-5 Windowpane Egg 576 4078.76/3/2003 LB-5 Windowpane PYS 24 169.96/3/2003 LB-5 Unidentified PYS 1 7.16/3/2003 LB-5 Labridae Egg 1600 11329.66/3/2003 LB-6 Atlantic menhaden Egg 32 163.36/3/2003 LB-6 Atlantic menhaden PYS 4 20.46/3/2003 LB-6 Bay anchovy Egg 192 979.96/3/2003 LB-6 Prionotus sp. Egg 16 81.76/3/2003 LB-6 Weakfish Egg 64 326.66/3/2003 LB-6 Windowpane Egg 32 163.36/3/2003 LB-6 Windowpane PYS 2 10.26/3/2003 LB-6 Labridae Egg 352 1796.46/3/2003 LB-4 Atlantic menhaden Egg 3136 14724.06/3/2003 LB-4 Atlantic menhaden PYS 4 18.86/3/2003 LB-4 Bay anchovy Egg 32 150.26/3/2003 LB-4 Prionotus sp. Egg 128 601.06/3/2003 LB-4 Weakfish Egg 96 450.76/3/2003 LB-4 Windowpane Egg 160 751.26/3/2003 LB-4 Windowpane PYS 33 154.96/3/2003 LB-4 Winter flounder PYS 4 18.86/3/2003 LB-4 Labridae Egg 448 2103.46/3/2003 LB-2 Atlantic menhaden Egg 40 181.76/3/2003 LB-2 Atlantic menhaden PYS 3 13.66/3/2003 LB-2 Bay anchovy Egg 16 72.76/3/2003 LB-2 Prionotus sp. Egg 12 54.56/3/2003 LB-2 Weakfish Egg 24 109.06/3/2003 LB-2 Windowpane Egg 40 181.76/3/2003 LB-2 Windowpane YS 1 4.56/3/2003 LB-2 Windowpane PYS 43 195.36/3/2003 LB-2 Winter flounder PYS 3 13.66/3/2003 LB-2 Labridae Egg 56 254.36/3/2003 LB-1 Atlantic menhaden Egg 80 354.96/3/2003 LB-1 Bay anchovy Egg 8 35.56/3/2003 LB-1 Fourbeard rockling PYS 1 4.4

Appendix B. Ichthyoplankton (epibenthic sled) life stage densities by date and station sampled. (page 14 of 25)
Date Station Common Name Life Stage Number Caught Density6/3/2003 LB-1 Prionotus sp. Egg 4 17.76/3/2003 LB-1 Weakfish Egg 24 106.56/3/2003 LB-1 Windowpane Egg 64 283.96/3/2003 LB-1 Windowpane PYS 29 128.66/3/2003 LB-1 Winter flounder PYS 3 13.36/3/2003 LB-1 Labridae Egg 68 301.66/3/2003 PJ-2 Windowpane YS 2 14.76/3/2003 PJ-2 Windowpane PYS 5 36.86/3/2003 PJ-3 Atlantic menhaden PYS 1 6.26/3/2003 PJ-3 Bay anchovy Egg 3 18.66/3/2003 PJ-3 Windowpane PYS 9 55.96/3/2003 SB-6 Atlantic menhaden Egg 16 82.76/3/2003 SB-6 Bay anchovy Egg 48 248.06/3/2003 SB-6 Fourbeard rockling PYS 1 5.26/3/2003 SB-6 Prionotus sp. Egg 32 165.46/3/2003 SB-6 Windowpane Egg 288 1488.26/3/2003 SB-6 Windowpane PYS 29 149.96/3/2003 SB-6 Winter flounder PYS 16 82.76/3/2003 SB-6 Labridae Egg 464 2397.76/3/2003 SB-4 Atlantic menhaden Egg 16 72.16/3/2003 SB-4 Atlantic menhaden PYS 6 27.06/3/2003 SB-4 Bay anchovy Egg 64 288.36/3/2003 SB-4 Windowpane Egg 80 360.46/3/2003 SB-4 Windowpane PYS 20 90.16/3/2003 SB-4 Winter flounder PYS 1 4.56/3/2003 SB-4 Labridae Egg 200 901.06/3/2003 SB-3 Windowpane PYS 2 10.96/4/2003 NB-6 Windowpane Egg 1 5.06/4/2003 NB-6 Winter flounder PYS 1 5.06/4/2003 NB-6 Winter flounder JUV 1 5.06/4/2003 NB-6 Labridae Egg 1 5.06/4/2003 NB-3 Atlantic silverside PYS 1 4.96/4/2003 NB-3 Bay anchovy Egg 2 9.76/4/2003 NB-3 Northern pipefish PYS 1 4.96/4/2003 NB-3 Weakfish PYS 1 4.96/4/2003 NB-3 White perch YS 9 43.86/4/2003 NB-3 Windowpane PYS 1 4.96/4/2003 NB-4 Atlantic menhaden Egg 2 9.26/4/2003 NB-4 Atlantic silverside PYS 1 4.66/4/2003 NB-4 Bay anchovy Egg 1 4.66/4/2003 NB-4 White perch YS 3 13.86/4/2003 NB-4 Labridae Egg 1 4.66/4/2003 NB-5 Winter flounder PYS 3 15.96/4/2003 NB-7 White perch YS 1 6.76/4/2003 NB-7 Windowpane PYS 1 6.76/4/2003 AK-4 Bay anchovy Egg 6 35.86/4/2003 AK-4 White perch YS 2 11.96/4/2003 AK-4 Winter flounder PYS 1 6.06/4/2003 AK-4 Labridae Egg 6 35.86/4/2003 AK-3 Bay anchovy Egg 7 48.8

Appendix B. Ichthyoplankton (epibenthic sled) life stage densities by date and station sampled. (page 15 of 25)
Date Station Common Name Life Stage Number Caught Density6/4/2003 AK-3 Windowpane PYS 2 14.06/4/2003 AK-3 Winter flounder PYS 4 27.96/4/2003 AK-3 Labridae Egg 2 14.06/4/2003 AK-2 Atlantic silverside PYS 1 5.56/4/2003 AK-2 Bay anchovy Egg 2 11.06/4/2003 AK-2 Windowpane PYS 1 5.56/4/2003 AK-2 Winter flounder PYS 26 142.86/4/2003 AK-2 Labridae Egg 4 22.06/4/2003 AK-1 Atlantic silverside YS 1 7.86/4/2003 AK-1 Bay anchovy Egg 6 46.86/4/2003 AK-1 White perch YS 1 7.86/4/2003 AK-1 Winter flounder PYS 4 31.26/4/2003 AK-1 Labridae Egg 4 31.26/5/2003 HR-1 Atlantic menhaden Egg 184 2691.96/5/2003 HR-1 Bay anchovy Egg 96 1404.56/5/2003 HR-1 Weakfish Egg 40 585.26/5/2003 HR-1 Windowpane Egg 56 819.36/5/2003 HR-1 Windowpane PYS 1 14.66/5/2003 HR-1 Winter flounder PYS 2 29.36/5/2003 HR-1 Labridae Egg 176 2574.96/5/2003 PJ-4 Atlantic menhaden Egg 280 2117.26/5/2003 PJ-4 Atlantic menhaden PYS 2 15.16/5/2003 PJ-4 Atlantic silverside PYS 1 7.66/5/2003 PJ-4 Bay anchovy Egg 12 90.76/5/2003 PJ-4 Prionotus sp. Egg 8 60.56/5/2003 PJ-4 Windowpane Egg 96 725.96/5/2003 PJ-4 Windowpane PYS 11 83.26/5/2003 PJ-4 Winter flounder PYS 1 7.66/5/2003 PJ-4 Labridae Egg 148 1119.16/5/2003 PJ-5 Atlantic menhaden Egg 56 330.96/5/2003 PJ-5 Atlantic menhaden PYS 1 5.96/5/2003 PJ-5 Bay anchovy Egg 24 141.86/5/2003 PJ-5 Conger eel PYS 1 5.96/5/2003 PJ-5 Prionotus sp. Egg 16 94.56/5/2003 PJ-5 Striped bass PYS 1 5.96/5/2003 PJ-5 Windowpane Egg 56 330.96/5/2003 PJ-5 Windowpane PYS 7 41.46/5/2003 PJ-5 Winter flounder PYS 7 41.46/5/2003 PJ-5 Labridae Egg 112 661.86/5/2003 SB-5 Atlantic menhaden Egg 8 71.76/5/2003 SB-5 Bay anchovy Egg 2 17.96/5/2003 SB-5 Prionotus sp. Egg 8 71.76/5/2003 SB-5 Windowpane Egg 28 251.16/5/2003 SB-5 Windowpane PYS 7 62.86/5/2003 SB-5 Windowpane JUV 4 35.96/5/2003 SB-5 Winter flounder PYS 1 9.06/5/2003 SB-5 Labridae Egg 28 251.16/5/2003 PJ-1 Atlantic menhaden Egg 4 46.16/5/2003 PJ-1 Bay anchovy Egg 64 738.26/5/2003 PJ-1 Striped bass PYS 1 11.5

Appendix B. Ichthyoplankton (epibenthic sled) life stage densities by date and station sampled. (page 16 of 25)
Date Station Common Name Life Stage Number Caught Density6/5/2003 PJ-1 Windowpane PYS 2 23.16/5/2003 PJ-1 Unidentified PYS 1 11.56/5/2003 PJ-1 Labridae Egg 8 92.36/5/2003 HR-2 Atlantic menhaden Egg 6 108.16/5/2003 HR-2 Bay anchovy Egg 10 180.26/5/2003 HR-2 Windowpane PYS 1 18.06/5/2003 HR-2 Labridae Egg 8 144.26/5/2003 HR-3 Bay anchovy Egg 6 166.06/5/2003 HR-3 Windowpane Egg 1 27.76/5/2003 HR-3 Windowpane PYS 4 110.66/5/2003 HR-3 Winter flounder PYS 1 27.76/5/2003 HR-3 Labridae Egg 8 221.36/5/2003 SB-1 Atlantic menhaden Egg 10 106.96/5/2003 SB-1 Bay anchovy Egg 100 1069.06/5/2003 SB-1 Windowpane Egg 6 64.16/5/2003 SB-1 Windowpane PYS 3 32.16/5/2003 SB-1 Labridae Egg 26 277.96/5/2003 SB-2 Atlantic menhaden Egg 32 305.16/5/2003 SB-2 Bay anchovy Egg 8 76.36/5/2003 SB-2 Windowpane PYS 6 57.26/5/2003 SB-2 Winter flounder PYS 6 57.26/5/2003 SB-2 Labridae Egg 48 457.76/17/2003 LB-6 Atlantic mackerel PYS 3 24.96/17/2003 LB-6 Atlantic menhaden Egg 528 4381.56/17/2003 LB-6 Bay anchovy Egg 560 4647.16/17/2003 LB-6 Bay anchovy PYS 9 74.76/17/2003 LB-6 Northern pipefish PYS 1 8.36/17/2003 LB-6 Prionotus sp. Egg 16 132.86/17/2003 LB-6 Walleye PYS 1 8.36/17/2003 LB-6 Windowpane Egg 416 3452.16/17/2003 LB-6 Windowpane PYS 4 33.26/17/2003 LB-6 Unidentified UID 2 16.66/17/2003 LB-6 Labridae Egg 64 531.16/17/2003 LB-5 Atlantic mackerel PYS 4 22.06/17/2003 LB-5 Atlantic menhaden Egg 2560 14064.56/17/2003 LB-5 Atlantic menhaden PYS 7 38.56/17/2003 LB-5 Bay anchovy Egg 1728 9493.56/17/2003 LB-5 Bay anchovy PYS 6 33.06/17/2003 LB-5 Northern pipefish PYS 1 5.56/17/2003 LB-5 Prionotus sp. Egg 64 351.66/17/2003 LB-5 Windowpane Egg 512 2812.96/17/2003 LB-5 Windowpane PYS 2 11.06/17/2003 LB-5 Unidentified PYS 8 44.06/17/2003 LB-5 Labridae Egg 2688 14767.76/17/2003 LB-4 Atlantic mackerel PYS 31 169.46/17/2003 LB-4 Atlantic menhaden Egg 64 349.76/17/2003 LB-4 Bay anchovy Egg 544 2972.16/17/2003 LB-4 Northern pipefish PYS 5 27.36/17/2003 LB-4 Prionotus sp. Egg 160 874.16/17/2003 LB-4 Weakfish Egg 32 174.8

Appendix B. Ichthyoplankton (epibenthic sled) life stage densities by date and station sampled. (page 17 of 25)
Date Station Common Name Life Stage Number Caught Density6/17/2003 LB-4 Windowpane Egg 352 1923.16/17/2003 LB-4 Windowpane PYS 1 5.56/17/2003 LB-4 Labridae Egg 352 1923.16/17/2003 LB-3 Atlantic menhaden Egg 1216 7101.26/17/2003 LB-3 Atlantic menhaden PYS 3 17.56/17/2003 LB-3 Bay anchovy Egg 1408 8222.46/17/2003 LB-3 Bay anchovy PYS 9 52.66/17/2003 LB-3 Prionotus sp. Egg 32 186.96/17/2003 LB-3 Weakfish PYS 1 5.86/17/2003 LB-3 Windowpane Egg 288 1681.96/17/2003 LB-3 Windowpane PYS 1 5.86/17/2003 LB-3 Unidentified UID 6 35.06/17/2003 LB-3 Labridae Egg 128 747.56/17/2003 LB-2 Atlantic mackerel PYS 46 323.06/17/2003 LB-2 Atlantic menhaden Egg 96 674.26/17/2003 LB-2 Bay anchovy Egg 256 1797.86/17/2003 LB-2 Prionotus sp. Egg 384 2696.76/17/2003 LB-2 Windowpane Egg 480 3370.96/17/2003 LB-2 Windowpane PYS 74 519.76/17/2003 LB-2 Windowpane JUV 1 7.06/17/2003 LB-2 Labridae Egg 224 1573.16/17/2003 LB-1 Atlantic mackerel PYS 22 128.56/17/2003 LB-1 Bay anchovy Egg 1088 6355.26/17/2003 LB-1 Northern pipefish PYS 8 46.76/17/2003 LB-1 Prionotus sp. Egg 288 1682.36/17/2003 LB-1 Windowpane Egg 512 2990.76/17/2003 LB-1 Windowpane PYS 3 17.56/17/2003 LB-1 Labridae Egg 352 2056.16/17/2003 PJ-3 Atlantic menhaden Egg 12 71.76/17/2003 PJ-3 Atlantic menhaden PYS 5 29.96/17/2003 PJ-3 Bay anchovy Egg 80 478.26/17/2003 PJ-3 Bay anchovy PYS 2 12.06/17/2003 PJ-3 Northern pipefish PYS 2 12.06/17/2003 PJ-3 Windowpane Egg 4 23.96/17/2003 PJ-3 Unidentified UID 4 23.96/17/2003 HR-1 Atlantic menhaden Egg 76 1208.36/17/2003 HR-1 Bay anchovy Egg 12 190.86/17/2003 HR-1 Prionotus sp. Egg 1 15.96/17/2003 HR-1 Weakfish Egg 2 31.86/17/2003 HR-1 Windowpane Egg 80 1271.96/17/2003 HR-1 Winter flounder JUV 1 15.96/17/2003 HR-1 Labridae Egg 22 349.86/17/2003 PJ-2 Atlantic menhaden Egg 64 434.86/17/2003 PJ-2 Atlantic menhaden PYS 34 231.06/17/2003 PJ-2 Bay anchovy Egg 136 924.06/17/2003 PJ-2 Northern pipefish PYS 4 27.26/17/2003 PJ-2 Windowpane Egg 8 54.46/17/2003 PJ-2 Unidentified PYS 17 115.56/17/2003 PJ-2 Labridae Egg 32 217.46/17/2003 PJ-1 Atlantic menhaden Egg 39 281.8

Appendix B. Ichthyoplankton (epibenthic sled) life stage densities by date and station sampled. (page 18 of 25)
Date Station Common Name Life Stage Number Caught Density6/17/2003 PJ-1 Atlantic menhaden PYS 5 36.16/17/2003 PJ-1 Bay anchovy Egg 13 93.96/17/2003 PJ-1 Windowpane Egg 9 65.06/17/2003 PJ-1 Unidentified UID 3 21.76/17/2003 PJ-1 Labridae Egg 3 21.76/17/2003 PJ-5 Atlantic mackerel PYS 5 29.26/17/2003 PJ-5 Atlantic menhaden Egg 288 1682.36/17/2003 PJ-5 Bay anchovy Egg 112 654.26/17/2003 PJ-5 Prionotus sp. Egg 96 560.86/17/2003 PJ-5 Weakfish Egg 48 280.46/17/2003 PJ-5 Windowpane Egg 752 4392.66/17/2003 PJ-5 Windowpane PYS 1 5.86/17/2003 PJ-5 Labridae Egg 224 1308.46/17/2003 PJ-4 Atlantic menhaden Egg 384 2167.46/17/2003 PJ-4 Atlantic menhaden PYS 2 11.36/17/2003 PJ-4 Bay anchovy Egg 432 2438.46/17/2003 PJ-4 Windowpane Egg 16 90.36/17/2003 PJ-4 Winter flounder PYS 1 5.66/17/2003 PJ-4 Unidentified PYS 2 11.36/17/2003 PJ-4 Labridae Egg 80 451.56/17/2003 SB-5 Atlantic mackerel PYS 8 39.86/17/2003 SB-5 Atlantic menhaden Egg 192 954.36/17/2003 SB-5 Bay anchovy Egg 448 2226.66/17/2003 SB-5 Prionotus sp. Egg 1344 6679.96/17/2003 SB-5 Windowpane Egg 3328 16540.76/17/2003 SB-5 Windowpane PYS 1 5.06/17/2003 SB-5 Unidentified PYS 6 29.86/17/2003 SB-5 Labridae Egg 1600 7952.26/18/2003 AK-4 Atlantic menhaden PYS 1 4.76/18/2003 AK-4 Bay anchovy Egg 56 263.56/18/2003 AK-4 Clupeid unidentified PYS 1 4.76/18/2003 AK-4 Northern pipefish PYS 1 4.76/18/2003 AK-4 Striped bass PYS 1 4.76/18/2003 AK-3 Atlantic mackerel PYS 3 14.96/18/2003 AK-3 Bay anchovy Egg 80 396.96/18/2003 AK-3 Unidentified PYS 1 5.06/18/2003 AK-2 Atlantic mackerel PYS 2 8.56/18/2003 AK-2 Atlantic menhaden Egg 6 25.66/18/2003 AK-2 Atlantic menhaden PYS 1 4.36/18/2003 AK-2 Bay anchovy Egg 38 162.36/18/2003 AK-2 Bay anchovy PYS 9 38.46/18/2003 AK-2 Clupeid unidentified PYS 1 4.36/18/2003 AK-2 Northern pipefish PYS 4 17.16/18/2003 AK-2 Striped bass PYS 1 4.36/18/2003 AK-2 Windowpane Egg 10 42.76/18/2003 AK-2 Windowpane PYS 1 4.36/18/2003 AK-2 Unidentified PYS 10 42.76/18/2003 AK-1 Atlantic menhaden Egg 224 2047.06/18/2003 AK-1 Atlantic menhaden PYS 4 36.66/18/2003 AK-1 Bay anchovy Egg 72 657.9

Appendix B. Ichthyoplankton (epibenthic sled) life stage densities by date and station sampled. (page 19 of 25)
Date Station Common Name Life Stage Number Caught Density6/18/2003 AK-1 Hogchocker Egg 24 219.36/18/2003 AK-1 Striped bass PYS 5 45.76/18/2003 AK-1 Windowpane Egg 344 3143.56/18/2003 NB-7 Atlantic menhaden Egg 20 128.46/18/2003 NB-7 Atlantic menhaden YS 2 12.86/18/2003 NB-7 Atlantic menhaden PYS 37 237.66/18/2003 NB-7 Bay anchovy Egg 16 102.86/18/2003 NB-7 Northern pipefish PYS 1 6.46/18/2003 NB-7 Striped bass PYS 1 6.46/18/2003 NB-7 Windowpane Egg 2 12.86/18/2003 NB-4 Atlantic herring PYS 1 6.06/18/2003 NB-4 Atlantic menhaden Egg 1 6.06/18/2003 NB-4 Atlantic menhaden PYS 9 53.86/18/2003 NB-4 Bay anchovy Egg 20 119.56/18/2003 NB-4 Northern pipefish PYS 2 11.96/18/2003 NB-4 Unidentified UID 4 23.96/18/2003 NB-4 Labridae Egg 3 17.96/18/2003 NB-3 Atlantic menhaden PYS 8 42.26/18/2003 NB-3 Bay anchovy Egg 6 31.66/18/2003 NB-3 Northern pipefish PYS 1 5.36/18/2003 NB-3 Windowpane YS 1 5.36/18/2003 NB-3 Unidentified YS 1 5.36/18/2003 NB-3 Unidentified PYS 10 52.76/18/2003 NB-6 Atlantic mackerel PYS 1 5.56/18/2003 NB-6 Atlantic menhaden Egg 64 349.86/18/2003 NB-6 Bay anchovy Egg 112 612.16/18/2003 NB-6 Clupeid unidentified PYS 4 21.96/18/2003 NB-6 Prionotus sp. Egg 40 218.66/18/2003 NB-6 Windowpane Egg 192 1049.36/18/2003 NB-6 Windowpane JUV 1 5.56/18/2003 NB-6 Labridae Egg 8 43.76/18/2003 NB-5 Atlantic menhaden Egg 280 1670.86/18/2003 NB-5 Bay anchovy Egg 48 286.46/18/2003 NB-5 Prionotus sp. Egg 8 47.76/18/2003 NB-5 Windowpane Egg 224 1336.76/18/2003 NB-5 Windowpane JUV 1 6.06/18/2003 NB-5 Labridae Egg 8 47.76/19/2003 SB-2 Atlantic mackerel PYS 1 10.66/19/2003 SB-2 Atlantic menhaden Egg 2112 22381.76/19/2003 SB-2 Bay anchovy Egg 320 3391.26/19/2003 SB-2 Prionotus sp. Egg 192 2034.76/19/2003 SB-2 Windowpane Egg 1920 20347.06/19/2003 SB-2 Unidentified PYS 2 21.26/19/2003 SB-2 Labridae Egg 320 3391.26/19/2003 SB-1 Atlantic mackerel PYS 1 12.96/19/2003 SB-1 Atlantic menhaden Egg 32 412.66/19/2003 SB-1 Bay anchovy Egg 328 4228.76/19/2003 SB-1 Windowpane Egg 80 1031.46/19/2003 SB-1 Labridae Egg 32 412.66/19/2003 SB-4 Atlantic mackerel PYS 3 19.2

Appendix B. Ichthyoplankton (epibenthic sled) life stage densities by date and station sampled. (page 20 of 25)
Date Station Common Name Life Stage Number Caught Density6/19/2003 SB-4 Atlantic menhaden Egg 1472 9444.26/19/2003 SB-4 Atlantic menhaden PYS 3 19.26/19/2003 SB-4 Bay anchovy Egg 352 2258.46/19/2003 SB-4 Hogchocker Egg 64 410.66/19/2003 SB-4 Prionotus sp. Egg 288 1847.86/19/2003 SB-4 Weakfish Egg 64 410.66/19/2003 SB-4 Windowpane Egg 1856 11908.06/19/2003 SB-4 Windowpane PYS 6 38.56/19/2003 SB-4 Unidentified PYS 1 6.46/19/2003 SB-4 Labridae Egg 576 3695.66/19/2003 SB-3 Atlantic mackerel PYS 1 8.66/19/2003 SB-3 Atlantic menhaden Egg 576 4972.26/19/2003 SB-3 Atlantic menhaden YS 4 34.56/19/2003 SB-3 Atlantic menhaden PYS 40 345.36/19/2003 SB-3 Bay anchovy Egg 96 828.76/19/2003 SB-3 Hogchocker Egg 16 138.16/19/2003 SB-3 Northern pipefish PYS 1 8.66/19/2003 SB-3 Windowpane Egg 480 4143.56/19/2003 SB-3 Labridae Egg 192 1657.46/19/2003 SB-6 Atlantic mackerel PYS 1 7.26/19/2003 SB-6 Atlantic menhaden Egg 32 230.66/19/2003 SB-6 Bay anchovy Egg 112 807.26/19/2003 SB-6 Prionotus sp. Egg 256 1845.06/19/2003 SB-6 Weakfish Egg 48 345.96/19/2003 SB-6 Windowpane Egg 592 4266.76/19/2003 SB-6 Windowpane PYS 4 28.86/19/2003 SB-6 Labridae Egg 144 1037.86/19/2003 HR-2 Atlantic menhaden Egg 256 2904.76/19/2003 HR-2 Atlantic menhaden PYS 6 68.16/19/2003 HR-2 Bay anchovy Egg 624 7080.36/19/2003 HR-2 Bay anchovy PYS 1 11.36/19/2003 HR-2 Prionotus sp. Egg 16 181.56/19/2003 HR-2 Weakfish Egg 16 181.56/19/2003 HR-2 Windowpane Egg 64 726.26/19/2003 HR-2 Unidentified PYS 3 34.06/19/2003 HR-2 Labridae Egg 112 1270.86/19/2003 HR-3 Atlantic menhaden Egg 36 967.16/19/2003 HR-3 Bay anchovy Egg 88 2364.06/19/2003 HR-3 Windowpane Egg 16 429.86/19/2003 HR-3 Unidentified PYS 2 53.76/19/2003 HR-3 Labridae Egg 8 214.97/8/2003 LB-3 Atlantic menhaden Egg 1 5.57/8/2003 LB-3 Bay anchovy Egg 9 49.27/8/2003 LB-3 Bay anchovy PYS 75 410.27/8/2003 LB-3 Gobiid unidentified PYS 14 76.67/8/2003 LB-3 Northern pipefish PYS 2 10.97/8/2003 LB-3 Prionotus sp. Egg 40 218.87/8/2003 LB-3 Weakfish Egg 1 5.57/8/2003 LB-3 Weakfish PYS 2 10.97/8/2003 LB-3 Labridae Egg 3 16.4
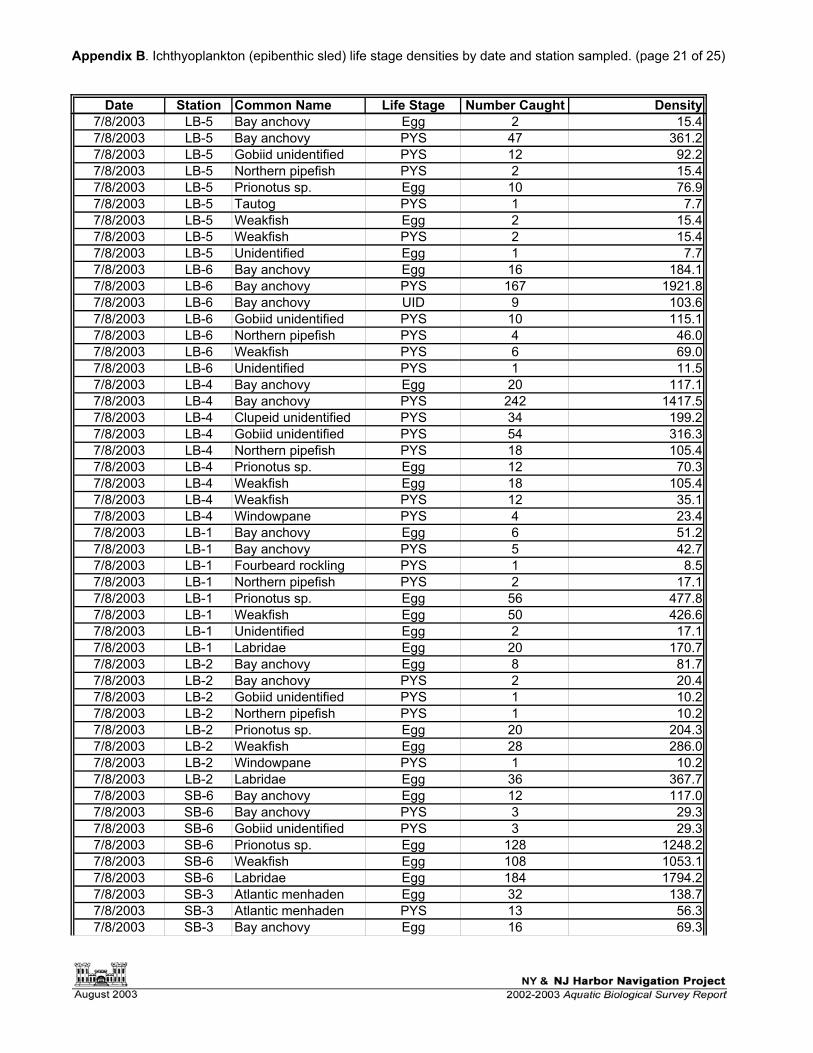
Appendix B. Ichthyoplankton (epibenthic sled) life stage densities by date and station sampled. (page 21 of 25)
Date Station Common Name Life Stage Number Caught Density7/8/2003 LB-5 Bay anchovy Egg 2 15.47/8/2003 LB-5 Bay anchovy PYS 47 361.27/8/2003 LB-5 Gobiid unidentified PYS 12 92.27/8/2003 LB-5 Northern pipefish PYS 2 15.47/8/2003 LB-5 Prionotus sp. Egg 10 76.97/8/2003 LB-5 Tautog PYS 1 7.77/8/2003 LB-5 Weakfish Egg 2 15.47/8/2003 LB-5 Weakfish PYS 2 15.47/8/2003 LB-5 Unidentified Egg 1 7.77/8/2003 LB-6 Bay anchovy Egg 16 184.17/8/2003 LB-6 Bay anchovy PYS 167 1921.87/8/2003 LB-6 Bay anchovy UID 9 103.67/8/2003 LB-6 Gobiid unidentified PYS 10 115.17/8/2003 LB-6 Northern pipefish PYS 4 46.07/8/2003 LB-6 Weakfish PYS 6 69.07/8/2003 LB-6 Unidentified PYS 1 11.57/8/2003 LB-4 Bay anchovy Egg 20 117.17/8/2003 LB-4 Bay anchovy PYS 242 1417.57/8/2003 LB-4 Clupeid unidentified PYS 34 199.27/8/2003 LB-4 Gobiid unidentified PYS 54 316.37/8/2003 LB-4 Northern pipefish PYS 18 105.47/8/2003 LB-4 Prionotus sp. Egg 12 70.37/8/2003 LB-4 Weakfish Egg 18 105.47/8/2003 LB-4 Weakfish PYS 12 35.17/8/2003 LB-4 Windowpane PYS 4 23.47/8/2003 LB-1 Bay anchovy Egg 6 51.27/8/2003 LB-1 Bay anchovy PYS 5 42.77/8/2003 LB-1 Fourbeard rockling PYS 1 8.57/8/2003 LB-1 Northern pipefish PYS 2 17.17/8/2003 LB-1 Prionotus sp. Egg 56 477.87/8/2003 LB-1 Weakfish Egg 50 426.67/8/2003 LB-1 Unidentified Egg 2 17.17/8/2003 LB-1 Labridae Egg 20 170.77/8/2003 LB-2 Bay anchovy Egg 8 81.77/8/2003 LB-2 Bay anchovy PYS 2 20.47/8/2003 LB-2 Gobiid unidentified PYS 1 10.27/8/2003 LB-2 Northern pipefish PYS 1 10.27/8/2003 LB-2 Prionotus sp. Egg 20 204.37/8/2003 LB-2 Weakfish Egg 28 286.07/8/2003 LB-2 Windowpane PYS 1 10.27/8/2003 LB-2 Labridae Egg 36 367.77/8/2003 SB-6 Bay anchovy Egg 12 117.07/8/2003 SB-6 Bay anchovy PYS 3 29.37/8/2003 SB-6 Gobiid unidentified PYS 3 29.37/8/2003 SB-6 Prionotus sp. Egg 128 1248.27/8/2003 SB-6 Weakfish Egg 108 1053.17/8/2003 SB-6 Labridae Egg 184 1794.27/8/2003 SB-3 Atlantic menhaden Egg 32 138.77/8/2003 SB-3 Atlantic menhaden PYS 13 56.37/8/2003 SB-3 Bay anchovy Egg 16 69.3

Appendix B. Ichthyoplankton (epibenthic sled) life stage densities by date and station sampled. (page 22 of 25)
Date Station Common Name Life Stage Number Caught Density7/8/2003 SB-3 Bay anchovy PYS 133 576.37/8/2003 SB-3 Fourspot flounder YS 2 8.77/8/2003 SB-3 Gobiid unidentified PYS 23 99.77/8/2003 SB-3 Northern pipefish PYS 1 4.37/8/2003 SB-3 Northern puffer PYS 1 4.37/8/2003 SB-3 Prionotus sp. Egg 120 520.07/8/2003 SB-3 Walleye PYS 4 17.37/8/2003 SB-3 Weakfish Egg 176 762.67/8/2003 SB-3 Labridae Egg 200 866.67/8/2003 SB-4 Atlantic menhaden PYS 6 25.57/8/2003 SB-4 Bay anchovy Egg 112 476.87/8/2003 SB-4 Bay anchovy PYS 272 1157.97/8/2003 SB-4 Clupeid unidentified PYS 26 110.77/8/2003 SB-4 Gobiid unidentified PYS 64 272.57/8/2003 SB-4 Northern pipefish PYS 4 17.07/8/2003 SB-4 Prionotus sp. Egg 136 579.07/8/2003 SB-4 Tautog PYS 4 17.07/8/2003 SB-4 Weakfish Egg 176 749.27/8/2003 SB-4 Weakfish PYS 2 8.57/8/2003 SB-4 Windowpane PYS 4 17.07/8/2003 SB-4 Labridae Egg 368 1566.67/8/2003 SB-1 Bay anchovy Egg 36 365.07/8/2003 SB-1 Bay anchovy PYS 12 121.77/8/2003 SB-1 Gobiid unidentified PYS 8 81.17/8/2003 SB-1 Northern pipefish PYS 1 10.17/8/2003 SB-1 Prionotus sp. Egg 92 932.87/8/2003 SB-1 Tautog PYS 2 20.37/8/2003 SB-1 Weakfish Egg 84 851.77/8/2003 SB-1 Windowpane PYS 1 10.17/8/2003 SB-1 Labridae Egg 304 3082.27/8/2003 SB-2 Bay anchovy Egg 40 329.57/8/2003 SB-2 Gobiid unidentified PYS 1 8.27/8/2003 SB-2 Northern pipefish PYS 1 8.27/8/2003 SB-2 Prionotus sp. Egg 68 560.17/8/2003 SB-2 Weakfish Egg 124 1021.37/8/2003 SB-2 Labridae Egg 344 2833.47/8/2003 PJ-3 Atlantic menhaden PYS 2 9.77/8/2003 PJ-3 Bay anchovy Egg 576 2791.57/8/2003 PJ-3 Bay anchovy PYS 29 140.57/8/2003 PJ-3 Gobiid unidentified PYS 10 48.57/8/2003 PJ-3 Northern pipefish PYS 4 19.47/8/2003 PJ-3 Northern puffer PYS 2 9.77/8/2003 PJ-3 Tautog PYS 1 4.87/8/2003 PJ-3 Weakfish Egg 120 581.67/8/2003 PJ-3 Weakfish PYS 3 14.57/8/2003 PJ-3 Labridae Egg 160 775.47/9/2003 NB-7 Atlantic menhaden PYS 12 67.37/9/2003 NB-7 Bay anchovy PYS 984 5519.47/9/2003 NB-7 Gobiid unidentified PYS 140 785.37/9/2003 NB-7 Northern pipefish PYS 12 67.3

Appendix B. Ichthyoplankton (epibenthic sled) life stage densities by date and station sampled. (page 23 of 25)
Date Station Common Name Life Stage Number Caught Density7/9/2003 NB-7 Weakfish PYS 4 22.47/9/2003 NB-7 Labridae Egg 48 269.27/9/2003 NB-4 Clupeid unidentified UID 5 30.97/9/2003 NB-4 Winter flounder JUV 1 6.27/9/2003 NB-3 Bay anchovy PYS 97 505.87/9/2003 NB-3 Gobiid unidentified PYS 9 46.97/9/2003 NB-3 Northern pipefish PYS 2 10.47/9/2003 NB-3 Weakfish Egg 4 20.97/9/2003 NB-3 Weakfish PYS 3 15.67/9/2003 NB-5 Bay anchovy Egg 6 41.37/9/2003 NB-5 Bay anchovy PYS 45 309.87/9/2003 NB-5 Clupeid unidentified PYS 1 6.97/9/2003 NB-5 Northern pipefish JUV 1 6.97/9/2003 NB-5 Weakfish Egg 1 6.97/9/2003 NB-5 Windowpane JUV 1 6.97/9/2003 NB-5 Labridae Egg 4 27.57/9/2003 NB-6 Bay anchovy Egg 3 22.77/9/2003 NB-6 Bay anchovy PYS 402 3040.97/9/2003 NB-6 Weakfish Egg 2 15.17/9/2003 NB-6 Weakfish PYS 4 30.37/9/2003 NB-6 Labridae Egg 2 15.17/9/2003 AK-1 Bay anchovy Egg 1 6.97/9/2003 AK-1 Bay anchovy PYS 5 34.77/9/2003 AK-2 Bay anchovy Egg 92 469.57/9/2003 AK-2 Bay anchovy PYS 360 1837.27/9/2003 AK-2 Gobiid unidentified PYS 14 71.47/9/2003 AK-2 Northern pipefish JUV 4 20.47/9/2003 AK-2 Tautog PYS 2 10.27/9/2003 AK-2 Weakfish Egg 40 204.17/9/2003 AK-2 Weakfish PYS 2 10.27/9/2003 AK-2 Windowpane PYS 2 10.27/9/2003 AK-2 Labridae Egg 56 285.87/9/2003 AK-3 Bay anchovy Egg 484 3331.67/9/2003 AK-3 Bay anchovy PYS 132 908.67/9/2003 AK-3 Gobiid unidentified PYS 13 89.57/9/2003 AK-3 Northern pipefish JUV 1 6.97/9/2003 AK-3 Winter flounder JUV 2 13.87/9/2003 AK-3 Labridae Egg 4 27.57/9/2003 AK-4 Bay anchovy Egg 20 198.17/9/2003 AK-4 Bay anchovy PYS 5 49.57/9/2003 AK-4 Weakfish PYS 1 9.97/9/2003 AK-4 Labridae Egg 3 29.77/9/2003 PJ-1 Bay anchovy Egg 2304 14633.87/9/2003 PJ-1 Bay anchovy PYS 158 1003.57/9/2003 PJ-1 Gobiid unidentified PYS 174 552.67/9/2003 PJ-1 Northern pipefish PYS 8 50.87/9/2003 PJ-1 Weakfish Egg 288 1829.27/9/2003 PJ-1 Weakfish PYS 4 25.47/9/2003 PJ-1 Labridae Egg 768 4877.97/10/2003 HR-3 Atlantic menhaden PYS 2 63.6

Appendix B. Ichthyoplankton (epibenthic sled) life stage densities by date and station sampled. (page 24 of 25)
Date Station Common Name Life Stage Number Caught Density7/10/2003 HR-3 Bay anchovy PYS 2 63.67/10/2003 HR-3 Gobiid unidentified PYS 5 159.17/10/2003 HR-3 Hogchocker Egg 8 254.57/10/2003 HR-3 Northern pipefish PYS 5 159.17/10/2003 HR-3 Weakfish Egg 24 763.67/10/2003 HR-2 Bay anchovy Egg 2 53.17/10/2003 HR-2 Bay anchovy PYS 1 26.57/10/2003 HR-2 Northern pipefish PYS 4 106.27/10/2003 HR-2 Weakfish Egg 10 265.57/10/2003 HR-2 Weakfish PYS 1 26.57/10/2003 HR-2 Labridae Egg 15 398.27/10/2003 PJ-2 Bay anchovy Egg 16 97.37/10/2003 PJ-2 Bay anchovy PYS 208 1265.17/10/2003 PJ-2 Gobiid unidentified PYS 100 608.27/10/2003 PJ-2 Northern pipefish PYS 16 97.37/10/2003 PJ-2 Weakfish Egg 160 973.17/10/2003 PJ-2 Weakfish PYS 4 24.37/10/2003 PJ-2 Labridae Egg 64 389.37/10/2003 PJ-5 Bay anchovy Egg 8 43.27/10/2003 PJ-5 Gobiid unidentified PYS 2 10.87/10/2003 PJ-5 Hogchocker Egg 2 10.87/10/2003 PJ-5 Prionotus sp. Egg 36 194.27/10/2003 PJ-5 Weakfish Egg 26 140.27/10/2003 PJ-5 Windowpane PYS 2 10.87/10/2003 PJ-5 Labridae Egg 14 75.57/10/2003 PJ-4 Atlantic menhaden PYS 3 24.47/10/2003 PJ-4 Bay anchovy Egg 8 65.07/10/2003 PJ-4 Bay anchovy PYS 49 398.17/10/2003 PJ-4 Gobiid unidentified PYS 1 8.17/10/2003 PJ-4 Northern pipefish PYS 2 16.27/10/2003 PJ-4 Prionotus sp. Egg 42 341.27/10/2003 PJ-4 Weakfish Egg 4 32.57/10/2003 PJ-4 Weakfish PYS 19 154.47/10/2003 PJ-4 Windowpane PYS 3 24.47/10/2003 PJ-4 Labridae Egg 14 113.77/10/2003 HR-1 Bay anchovy Egg 2 22.67/10/2003 HR-1 Bay anchovy PYS 17 192.57/10/2003 HR-1 Gobiid unidentified PYS 2 22.67/10/2003 HR-1 Northern pipefish PYS 2 22.67/10/2003 HR-1 Prionotus sp. Egg 56 634.07/10/2003 HR-1 Weakfish Egg 16 181.17/10/2003 HR-1 Weakfish PYS 6 67.97/10/2003 HR-1 Windowpane PYS 1 11.37/10/2003 HR-1 Unidentified Egg 2 22.67/10/2003 HR-1 Labridae Egg 20 226.47/10/2003 SB-5 Bay anchovy Egg 8 32.97/10/2003 SB-5 Bay anchovy PYS 74 303.97/10/2003 SB-5 Gobiid unidentified PYS 71 291.67/10/2003 SB-5 Northern pipefish PYS 6 24.67/10/2003 SB-5 Northern puffer PYS 1 4.1

Appendix B. Ichthyoplankton (epibenthic sled) life stage densities by date and station sampled. (page 25 of 25)
Date Station Common Name Life Stage Number Caught Density7/10/2003 SB-5 Prionotus sp. Egg 8 32.97/10/2003 SB-5 Tautog PYS 2 8.27/10/2003 SB-5 Weakfish Egg 160 657.17/10/2003 SB-5 Weakfish PYS 1 4.17/10/2003 SB-5 Windowpane PYS 3 12.37/10/2003 SB-5 Labridae Egg 264 1084.3

Appendix C. Water quality by date and station sampled. (page 1 of 7)
Date Station Temperature (deg C) DO (mg/L) Conductivity (SPC@25) Salinity (ppt)1/21/2003 LB-1 2.8 9.9 44700 28.01/21/2003 LB-2 4.3 9.6 45760 29.01/21/2003 LB-3 3.2 10.1 41230 25.71/21/2003 LB-4 2.8 10.7 43630 27.31/21/2003 LB-5 2.6 8.6 39250 24.31/21/2003 LB-6 1.2 11.0 41051 25.31/21/2003 SB-3 2.7 10.2 36790 22.71/21/2003 SB-4 3.0 9.9 41080 25.61/21/2003 SB-6 3.1 10.0 40030 24.91/22/2003 AK-1 1.8 11.3 33706 20.51/22/2003 AK-2 1.8 11.1 35896 19.81/22/2003 AK-3 2.0 11.0 32905 20.11/22/2003 AK-4 1.8 10.9 32808 19.81/22/2003 NB-3 1.5 10.7 31570 19.21/22/2003 NB-4 1.1 11.2 31738 19.31/22/2003 NB-5 1.7 11.3 35227 21.41/22/2003 NB-6 1.7 11.3 32606 21.01/22/2003 NB-7 1.1 11.3 32235 19.41/23/2003 PJ-1 1.3 11.3 38021 23.21/23/2003 PJ-2 1.8 11.2 37531 23.01/23/2003 PJ-3 0.9 11.6 34464 21.11/23/2003 PJ-4 1.7 10.8 37696 23.21/23/2003 PJ-5 2.3 11.0 38363 23.71/23/2003 SB-1 0.8 11.7 33211 20.11/23/2003 SB-2 0.4 11.8 34161 20.41/23/2003 SB-5 2.2 11.1 39077 24.32/4/2003 LB-1 3.8 10.7 49440 31.52/4/2003 LB-2 3.5 10.7 48730 30.92/4/2003 LB-3 2.9 11.3 45920 29.02/4/2003 LB-4 2.1 12.3 45300 28.32/4/2003 LB-5 2.6 11.3 43760 27.42/4/2003 LB-6 2.5 11.7 43600 27.32/4/2003 PJ-5 3.1 11.2 45840 28.92/4/2003 SB-5 2.9 11.2 45190 28.42/4/2003 SB-6 3.1 11.2 46010 29.12/5/2003 AK-1 1.8 11.8 36561 22.32/5/2003 AK-2 1.8 11.7 36507 22.32/5/2003 AK-3 1.7 11.6 35461 21.72/5/2003 AK-4 1.8 12.0 35340 21.62/5/2003 NB-3 1.8 12.2 30545 18.42/5/2003 NB-4 1.7 12.2 30614 18.42/5/2003 NB-5 1.8 11.8 37153 22.72/5/2003 NB-6 1.8 11.8 36378 22.62/5/2003 NB-7 1.6 11.9 35385 21.62/6/2003 PJ-1 1.6 11.3 35964 22.02/6/2003 PJ-2 1.6 11.5 33667 20.52/6/2003 PJ-3 1.5 11.7 33621 20.42/6/2003 PJ-4 1.8 11.2 38788 23.92/6/2003 SB-1 1.2 11.6 34817 21.22/6/2003 SB-2 1.8 11.1 37513 23.12/6/2003 SB-3 1.5 11.6 34274 20.82/6/2003 SB-4 1.8 11.3 39775 24.52/19/2003 LB-1 1.6 10.8 49326 31.1

Appendix C. Water quality by date and station sampled. (page 2 of 7)
Date Station Temperature (deg C) DO (mg/L) Conductivity (SPC@25) Salinity (ppt)2/19/2003 LB-2 2.1 10.3 49626 31.32/19/2003 LB-3 1.2 10.9 45231 28.32/19/2003 LB-4 1.6 11.4 47590 29.82/19/2003 LB-5 1.1 11.5 45482 28.32/19/2003 SB-1 1.5 10.8 44108 27.52/19/2003 SB-2 1.3 10.8 43356 26.82/19/2003 SB-3 1.6 10.8 44841 28.02/19/2003 SB-4 1.1 10.9 44121 27.42/19/2003 SB-6 2.0 10.8 43838 27.42/20/2003 AK-1 1.3 12.6 38386 23.52/20/2003 AK-2 1.3 12.6 39501 24.32/20/2003 AK-3 1.2 12.8 37934 23.12/20/2003 AK-4 1.7 13.5 37011 22.72/20/2003 LB-6 0.8 13.2 45279 27.92/20/2003 NB-3 2.1 12.5 37400 23.12/20/2003 NB-4 2.1 12.5 37420 23.12/20/2003 NB-5 1.8 12.5 38069 23.42/20/2003 NB-6 1.5 12.6 39300 24.12/20/2003 NB-7 1.9 12.6 38762 23.72/21/2003 PJ-1 1.1 11.8 37644 23.22/21/2003 PJ-2 1.4 11.6 38763 23.62/21/2003 PJ-3 1.4 11.9 37779 23.82/21/2003 PJ-4 1.2 11.4 42408 26.22/21/2003 PJ-5 1.1 11.5 41600 25.72/21/2003 SB-5 1.2 11.8 41289 25.33/4/2003 LB-1 1.7 11.4 43498 27.13/4/2003 LB-2 2.2 10.8 46393 29.13/4/2003 LB-3 1.5 12.0 39282 24.23/4/2003 LB-4 1.8 11.8 42002 26.13/4/2003 LB-5 1.7 11.5 38669 23.83/4/2003 LB-6 1.8 12.4 28931 23.93/4/2003 PJ-1 1.8 11.6 34711 21.23/4/2003 PJ-2 1.2 11.8 30931 18.63/4/2003 PJ-3 0.8 12.0 31425 18.93/4/2003 PJ-4 1.8 11.4 38321 23.53/4/2003 PJ-5 2.0 11.4 38368 23.73/4/2003 SB-5 1.9 11.2 40659 25.13/5/2003 SB-1 2.4 11.3 35982 21.93/5/2003 SB-2 2.3 11.3 36192 22.33/5/2003 SB-3 1.9 10.3 40301 24.83/5/2003 SB-4 2.0 11.4 39968 24.63/6/2003 HR-1 1.9 11.9 35433 21.73/6/2003 HR-2 1.9 12.2 31658 19.13/6/2003 HR-3 1.8 12.1 32161 19.33/6/2003 SB-6 2.1 12.4 31670 19.23/7/2003 AK-1 2.1 12.7 29200 17.53/7/2003 AK-2 1.7 12.8 27660 17.33/7/2003 AK-3 1.9 12.7 26504 15.83/7/2003 AK-4 2.9 12.5 27400 16.53/7/2003 NB-3 2.0 13.1 26280 15.63/7/2003 NB-4 2.0 13.1 26280 15.63/7/2003 NB-5 2.0 12.5 29340 17.53/7/2003 NB-6 1.9 12.9 30244 18.7

Appendix C. Water quality by date and station sampled. (page 3 of 7)
Date Station Temperature (deg C) DO (mg/L) Conductivity (SPC@25) Salinity (ppt)3/7/2003 NB-7 1.9 13.1 27613 16.43/18/2003 LB-1 4.0 12.0 44910 28.23/18/2003 LB-2 3.8 12.4 45320 28.63/18/2003 LB-3 3.9 12.8 41790 26.13/18/2003 LB-4 4.1 13.9 41240 25.93/18/2003 LB-5 4.0 12.7 39830 24.93/18/2003 LB-6 3.9 13.1 38690 24.23/18/2003 SB-1 4.4 12.7 37870 23.53/18/2003 SB-2 4.2 12.2 38420 24.03/18/2003 SB-3 4.3 12.5 39360 24.73/18/2003 SB-4 4.3 12.6 37750 23.63/18/2003 SB-6 4.5 12.7 38970 24.33/19/2003 AK-1 4.9 11.6 30020 18.33/19/2003 AK-2 5.5 11.5 29820 18.23/19/2003 AK-3 5.6 11.3 29750 18.23/19/2003 AK-4 5.9 11.2 29120 17.83/19/2003 NB-3 5.1 11.6 29110 17.73/19/2003 NB-4 5.0 11.5 28650 17.43/19/2003 NB-5 4.7 11.7 31080 19.03/19/2003 NB-6 5.2 11.6 31280 19.23/19/2003 NB-7 5.2 11.5 28850 17.53/19/2003 SB-5 4.2 12.2 35620 22.13/21/2003 HR-1 5.4 11.9 26810 16.23/21/2003 HR-2 5.6 11.8 23640 14.23/21/2003 HR-3 5.6 11.8 23640 14.23/21/2003 PJ-1 4.8 11.9 26220 15.83/21/2003 PJ-2 4.8 12.0 24500 14.73/21/2003 PJ-3 5.6 12.0 24920 14.93/21/2003 PJ-4 4.5 11.4 36680 22.73/21/2003 PJ-5 4.8 11.9 36300 22.54/1/2003 LB-1 3.8 10.8 41690 26.04/1/2003 LB-2 3.1 10.5 46210 29.14/1/2003 LB-3 4.8 10.9 34650 21.44/1/2003 LB-4 4.2 10.5 40400 25.34/1/2003 LB-5 4.7 11.2 32220 19.84/1/2003 LB-6 4.6 10.6 37700 23.54/1/2003 PJ-1 5.2 11.2 23040 13.84/1/2003 SB-1 4.9 10.9 30220 18.44/1/2003 SB-2 4.9 10.8 30360 18.54/1/2003 SB-3 5.0 11.2 25630 15.44/1/2003 SB-4 4.7 10.8 34420 21.34/1/2003 SB-6 4.3 10.6 38350 23.84/2/2003 AK-1 7.3 11.1 19930 11.84/2/2003 AK-2 6.6 11.0 22040 13.24/2/2003 AK-3 6.3 11.2 24680 14.94/2/2003 AK-4 7.2 11.0 19960 11.84/2/2003 NB-3 7.2 10.8 19250 11.34/2/2003 NB-4 7.2 10.8 19250 11.34/2/2003 NB-5 6.3 11.2 24140 14.54/2/2003 NB-6 5.5 11.2 27270 16.64/2/2003 NB-7 6.3 11.4 20180 12.04/2/2003 PJ-5 4.5 11.3 36980 23.04/2/2003 SB-5 4.3 11.3 38390 23.9

Appendix C. Water quality by date and station sampled. (page 4 of 7)
Date Station Temperature (deg C) DO (mg/L) Conductivity (SPC@25) Salinity (ppt)4/3/2003 HR-1 5.3 11.3 29080 17.74/3/2003 HR-2 6.0 11.7 18440 10.84/3/2003 HR-3 6.0 11.7 18470 10.84/3/2003 PJ-2 5.6 11.6 21200 12.64/3/2003 PJ-3 6.1 11.5 19560 11.54/3/2003 PJ-4 4.9 10.9 34180 21.14/15/2003 LB-1 7.1 9.1 37810 24.04/15/2003 LB-2 7.6 8.5 44500 28.14/15/2003 LB-3 6.9 8.8 37610 23.64/15/2003 LB-4 8.4 8.8 39460 24.84/15/2003 LB-5 7.0 9.1 35810 22.44/15/2003 LB-6 6.6 8.7 38190 24.04/15/2003 PJ-1 8.4 9.6 28810 17.74/15/2003 PJ-3 7.9 9.8 26910 16.24/15/2003 SB-1 8.3 9.2 31350 19.64/15/2003 SB-2 7.7 8.9 33720 21.04/15/2003 SB-3 9.1 9.0 31494 19.74/15/2003 SB-4 7.7 8.5 33020 20.54/16/2003 AK-1 11.4 10.5 24940 15.24/16/2003 AK-2 9.4 9.0 26770 16.54/16/2003 AK-3 10.0 8.8 25390 15.54/16/2003 AK-4 10.6 8.6 24350 14.84/16/2003 NB-3 9.7 9.1 23340 14.14/16/2003 NB-4 9.8 9.5 22570 13.64/16/2003 NB-5 9.3 9.0 26780 16.44/16/2003 NB-6 9.0 9.1 28280 17.44/16/2003 NB-7 10.2 9.0 24650 15.04/16/2003 SB-5 8.3 9.2 34340 21.44/17/2003 HR-1 8.1 8.4 33590 20.84/17/2003 HR-2 7.8 8.9 26570 16.24/17/2003 HR-3 7.8 8.9 26590 16.24/17/2003 PJ-2 7.9 8.6 29790 18.34/17/2003 PJ-4 8.0 8.8 30380 18.74/17/2003 PJ-5 7.5 8.7 33610 21.04/17/2003 SB-6 8.0 8.9 28840 17.74/30/2003 LB-1 9.0 8.0 43040 27.24/30/2003 LB-2 7.6 8.1 45150 29.04/30/2003 LB-3 9.2 7.7 37370 23.54/30/2003 LB-4 8.0 7.7 43190 27.64/30/2003 LB-5 9.3 8.0 36500 23.04/30/2003 LB-6 9.7 8.1 36360 23.04/30/2003 PJ-1 10.6 8.3 27700 17.64/30/2003 PJ-2 9.7 5.9 29560 18.44/30/2003 PJ-3 10.0 7.7 29190 18.04/30/2003 SB-1 9.5 7.1 35710 22.14/30/2003 SB-2 9.3 7.5 35590 22.34/30/2003 SB-3 9.9 7.6 33080 20.64/30/2003 SB-4 10.0 8.0 32900 20.55/1/2003 AK-1 11.4 7.9 28590 17.75/1/2003 AK-2 10.4 7.8 31200 19.35/1/2003 AK-3 11.9 7.8 27860 17.25/1/2003 AK-4 12.7 7.5 23670 14.35/1/2003 NB-3 11.8 8.0 27780 16.4

Appendix C. Water quality by date and station sampled. (page 5 of 7)
Date Station Temperature (deg C) DO (mg/L) Conductivity (SPC@25) Salinity (ppt)5/1/2003 NB-4 11.8 8.0 27730 16.45/1/2003 NB-5 10.6 7.8 31080 19.35/1/2003 NB-6 10.6 7.8 31280 19.35/1/2003 NB-7 11.0 8.0 29540 18.25/1/2003 PJ-4 9.4 7.6 37610 24.05/1/2003 PJ-5 9.4 8.0 39850 25.25/2/2003 HR-1 10.4 7.7 33200 21.05/2/2003 HR-2 10.8 7.4 29000 17.95/2/2003 HR-3 10.8 7.4 29000 17.95/2/2003 SB-5 9.6 7.9 39000 24.85/2/2003 SB-6 9.6 8.0 39600 25.15/13/2003 PJ-1 11.7 8.4 34250 21.55/13/2003 PJ-2 11.7 8.6 32640 21.55/13/2003 PJ-3 11.7 8.5 33700 21.15/13/2003 PJ-4 10.9 8.2 39260 25.05/13/2003 PJ-5 11.3 8.7 38690 24.65/13/2003 SB-1 11.6 8.3 35870 22.65/13/2003 SB-2 11.4 8.2 36580 23.15/13/2003 SB-3 11.2 8.5 34290 21.55/13/2003 SB-4 11.3 8.5 38430 24.45/13/2003 SB-5 11.1 8.8 39920 25.45/13/2003 SB-6 11.2 8.6 39290 24.95/14/2003 AK-1 13.0 8.3 30400 18.95/14/2003 AK-2 12.8 8.3 30700 19.15/14/2003 AK-3 12.9 8.2 30690 19.05/14/2003 AK-4 13.6 8.0 30400 18.95/14/2003 NB-3 13.3 7.8 28320 17.55/14/2003 NB-4 13.3 7.8 28320 17.55/14/2003 NB-5 12.6 8.1 31640 19.75/14/2003 NB-6 12.6 8.1 31640 19.75/14/2003 NB-7 12.7 8.2 30920 19.25/15/2003 HR-1 11.8 8.1 36000 22.75/15/2003 HR-2 11.9 7.8 30660 19.05/15/2003 HR-3 11.9 7.8 30660 19.05/15/2003 LB-1 10.9 8.9 42810 27.45/15/2003 LB-2 9.2 9.3 44830 28.85/15/2003 LB-3 11.3 8.5 38840 24.75/15/2003 LB-4 11.2 8.6 39930 25.45/15/2003 LB-5 11.4 8.4 38920 24.85/15/2003 LB-6 11.6 8.8 39600 25.26/3/2003 LB-1 13.4 7.7 41900 26.96/3/2003 LB-2 11.5 8.3 46780 30.36/3/2003 LB-3 14.3 7.5 36220 22.96/3/2003 LB-4 12.3 7.7 43730 28.26/3/2003 LB-5 14.5 7.5 35530 22.56/3/2003 LB-6 13.5 7.6 40840 26.16/3/2003 PJ-2 15.6 7.0 25100 15.46/3/2003 PJ-3 16.0 7.1 24280 14.86/3/2003 SB-3 15.0 7.2 29350 18.26/3/2003 SB-4 13.5 7.4 38710 24.76/3/2003 SB-6 13.0 7.7 41040 26.36/4/2003 AK-1 15.5 5.9 22470 13.66/4/2003 AK-2 15.2 6.1 24670 15.1

Appendix C. Water quality by date and station sampled. (page 6 of 7)
Date Station Temperature (deg C) DO (mg/L) Conductivity (SPC@25) Salinity (ppt)6/4/2003 AK-3 16.0 5.6 22510 13.66/4/2003 AK-4 16.1 5.3 23700 14.46/4/2003 NB-3 15.7 6.2 18240 10.86/4/2003 NB-4 15.7 6.2 18300 10.96/4/2003 NB-5 15.0 6.1 27590 17.06/4/2003 NB-6 15.0 6.1 26190 16.16/4/2003 NB-7 15.5 6.6 17670 10.56/5/2003 HR-1 13.9 6.2 33320 20.96/5/2003 HR-2 15.1 6.3 23780 14.56/5/2003 HR-3 15.1 6.3 23650 14.46/5/2003 PJ-1 15.5 6.8 20180 12.26/5/2003 PJ-4 13.3 6.1 35910 22.76/5/2003 PJ-5 15.2 6.8 21550 13.06/5/2003 SB-1 14.5 6.2 29930 18.66/5/2003 SB-2 14.2 6.0 31780 19.96/5/2003 SB-5 15.2 6.6 22220 13.46/17/2003 HR-1 17.2 5.5 34130 21.56/17/2003 LB-1 17.3 6.3 40830 26.26/17/2003 LB-2 16.8 6.6 40670 26.16/17/2003 LB-3 17.2 6.9 36090 22.96/17/2003 LB-4 16.6 6.3 37140 23.66/17/2003 LB-5 16.9 6.6 34370 21.86/17/2003 LB-6 16.5 6.7 37470 23.86/17/2003 PJ-1 17.8 6.0 29580 18.46/17/2003 PJ-2 17.8 5.8 28420 17.66/17/2003 PJ-3 18.2 5.8 27440 16.86/17/2003 PJ-4 17.5 5.8 31700 19.86/17/2003 PJ-5 17.1 6.0 34720 21.96/17/2003 SB-5 17.4 5.9 36810 23.36/18/2003 AK-1 18.3 5.5 24480 14.86/18/2003 AK-2 18.3 5.5 24480 14.86/18/2003 AK-3 18.7 5.6 19780 11.96/18/2003 AK-4 18.9 5.4 20820 12.56/18/2003 NB-3 19.0 5.6 19540 11.56/18/2003 NB-4 19.0 5.6 19540 11.56/18/2003 NB-5 18.5 5.5 26620 16.46/18/2003 NB-6 18.5 5.5 26620 16.46/18/2003 NB-7 18.8 5.8 16980 10.06/19/2003 HR-2 18.3 5.6 27020 16.66/19/2003 HR-3 18.3 5.6 27020 16.66/19/2003 SB-1 17.9 5.7 31460 19.66/19/2003 SB-2 17.7 5.6 33970 21.46/19/2003 SB-3 18.1 5.3 30080 18.76/19/2003 SB-4 17.9 5.5 30980 19.36/19/2003 SB-6 18.0 5.5 30640 19.07/8/2003 LB-1 18.5 6.9 42940 27.77/8/2003 LB-2 17.5 6.8 44090 28.67/8/2003 LB-3 20.5 7.1 39980 25.67/8/2003 LB-4 19.7 6.7 42280 27.27/8/2003 LB-5 20.7 6.8 38850 24.87/8/2003 LB-6 20.5 6.6 39960 25.67/8/2003 PJ-3 22.7 6.2 33550 21.17/8/2003 SB-1 21.5 5.6 36340 23.0

Appendix C. Water quality by date and station sampled. (page 7 of 7)
Date Station Temperature (deg C) DO (mg/L) Conductivity (SPC@25) Salinity (ppt)7/8/2003 SB-2 21.0 5.3 36930 23.47/8/2003 SB-3 21.7 5.1 35050 22.17/8/2003 SB-4 20.4 6.3 38980 24.97/8/2003 SB-6 20.5 6.5 39450 25.27/9/2003 AK-1 23.0 5.7 32140 20.17/9/2003 AK-2 22.8 5.7 32630 20.47/9/2003 AK-3 23.3 5.5 32020 20.07/9/2003 AK-4 24.4 5.3 30940 19.27/9/2003 NB-3 24.2 5.2 27830 17.17/9/2003 NB-4 24.2 5.2 27830 17.17/9/2003 NB-5 22.3 5.8 34100 21.47/9/2003 NB-6 22.3 5.8 34100 21.47/9/2003 NB-7 23.9 5.6 31920 19.97/9/2003 PJ-1 22.3 5.8 31690 19.87/10/2003 HR-1 20.2 5.5 38320 24.47/10/2003 HR-2 21.4 5.7 33320 20.97/10/2003 HR-3 21.4 5.7 33320 20.97/10/2003 PJ-2 21.5 5.8 32120 20.17/10/2003 PJ-4 19.8 5.6 39870 25.57/10/2003 PJ-5 18.9 6.6 41430 26.67/10/2003 SB-5 18.8 6.5 41710 26.8