2002 _ jefferson county _ beaumont isd _ 2002 texas school survey of drug and alcohol use _...
Upload: texas-school-survey-of-drug-and-alcohol-use-elementary-reports
Post on 14-Apr-2018
218 views
TRANSCRIPT

7/30/2019 2002 _ jefferson county _ beaumont isd _ 2002 texas school survey of drug and alcohol use _ elementary report
http://slidepdf.com/reader/full/2002-jefferson-county-beaumont-isd-2002-texas-school-survey-of-drug-and 1/44
7/30/2019 2002 _ jefferson county _ beaumont isd _ 2002 texas school survey of drug and alcohol use _ elementary report
http://slidepdf.com/reader/full/2002-jefferson-county-beaumont-isd-2002-texas-school-survey-of-drug-and 2/44
BeaumontSpring 2002
________________________________________________________________________________
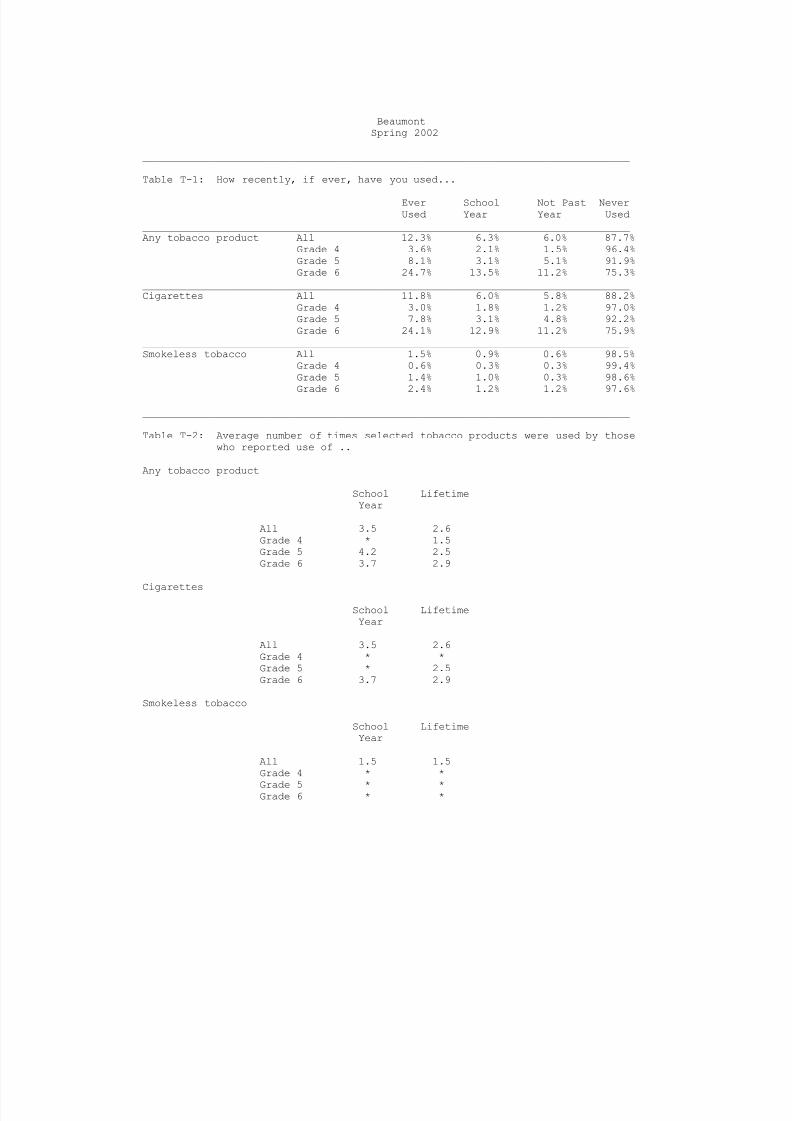
Table T-1: How recently, if ever, have you used...
Ever School Not Past NeverUsed Year Year Used
________________________________________________________________________________Any tobacco product All 12.3% 6.3% 6.0% 87.7%
Grade 4 3.6% 2.1% 1.5% 96.4%Grade 5 8.1% 3.1% 5.1% 91.9%Grade 6 24.7% 13.5% 11.2% 75.3%
________________________________________________________________________________Cigarettes All 11.8% 6.0% 5.8% 88.2%
Grade 4 3.0% 1.8% 1.2% 97.0%Grade 5 7.8% 3.1% 4.8% 92.2%Grade 6 24.1% 12.9% 11.2% 75.9%
________________________________________________________________________________Smokeless tobacco All 1.5% 0.9% 0.6% 98.5%
Grade 4 0.6% 0.3% 0.3% 99.4%Grade 5 1.4% 1.0% 0.3% 98.6%
Grade 6 2.4% 1.2% 1.2% 97.6%
________________________________________________________________________________
Table T-2: Average number of times selected tobacco products were used by thosewho reported use of ..
Any tobacco product
School LifetimeYear
All 3.5 2.6Grade 4 * 1.5Grade 5 4.2 2.5Grade 6 3.7 2.9
Cigarettes
School LifetimeYear
All 3.5 2.6Grade 4 * *Grade 5 * 2.5Grade 6 3.7 2.9
Smokeless tobacco
School LifetimeYear
All 1.5 1.5Grade 4 * *
Grade 5 * *Grade 6 * *
7/30/2019 2002 _ jefferson county _ beaumont isd _ 2002 texas school survey of drug and alcohol use _ elementary report
http://slidepdf.com/reader/full/2002-jefferson-county-beaumont-isd-2002-texas-school-survey-of-drug-and 3/44
BeaumontSpring 2002
________________________________________________________________________________
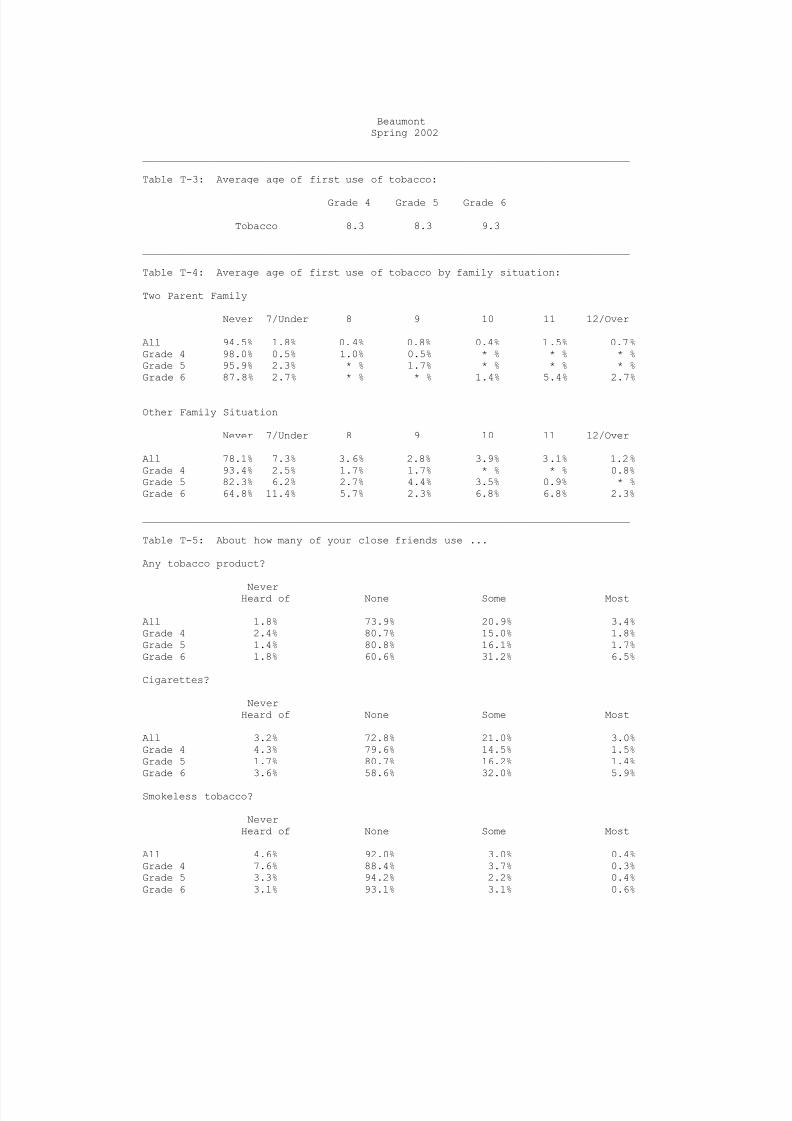
Table T-3: Average age of first use of tobacco:
Grade 4 Grade 5 Grade 6
Tobacco 8.3 8.3 9.3
________________________________________________________________________________
Table T-4: Average age of first use of tobacco by family situation:
Two Parent Family
Never 7/Under 8 9 10 11 12/Over
All 94.5% 1.8% 0.4% 0.8% 0.4% 1.5% 0.7%Grade 4 98.0% 0.5% 1.0% 0.5% * % * % * %Grade 5 95.9% 2.3% * % 1.7% * % * % * %Grade 6 87.8% 2.7% * % * % 1.4% 5.4% 2.7%
Other Family Situation
Never 7/Under 8 9 10 11 12/Over
All 78.1% 7.3% 3.6% 2.8% 3.9% 3.1% 1.2%Grade 4 93.4% 2.5% 1.7% 1.7% * % * % 0.8%Grade 5 82.3% 6.2% 2.7% 4.4% 3.5% 0.9% * %Grade 6 64.8% 11.4% 5.7% 2.3% 6.8% 6.8% 2.3%
________________________________________________________________________________
Table T-5: About how many of your close friends use ...
Any tobacco product?
NeverHeard of None Some Most
All 1.8% 73.9% 20.9% 3.4%Grade 4 2.4% 80.7% 15.0% 1.8%Grade 5 1.4% 80.8% 16.1% 1.7%Grade 6 1.8% 60.6% 31.2% 6.5%
Cigarettes?
NeverHeard of None Some Most
All 3.2% 72.8% 21.0% 3.0%Grade 4 4.3% 79.6% 14.5% 1.5%Grade 5 1.7% 80.7% 16.2% 1.4%Grade 6 3.6% 58.6% 32.0% 5.9%
Smokeless tobacco?
NeverHeard of None Some Most
All 4.6% 92.0% 3.0% 0.4%Grade 4 7.6% 88.4% 3.7% 0.3%Grade 5 3.3% 94.2% 2.2% 0.4%Grade 6 3.1% 93.1% 3.1% 0.6%
7/30/2019 2002 _ jefferson county _ beaumont isd _ 2002 texas school survey of drug and alcohol use _ elementary report
http://slidepdf.com/reader/full/2002-jefferson-county-beaumont-isd-2002-texas-school-survey-of-drug-and 4/44
BeaumontSpring 2002
________________________________________________________________________________
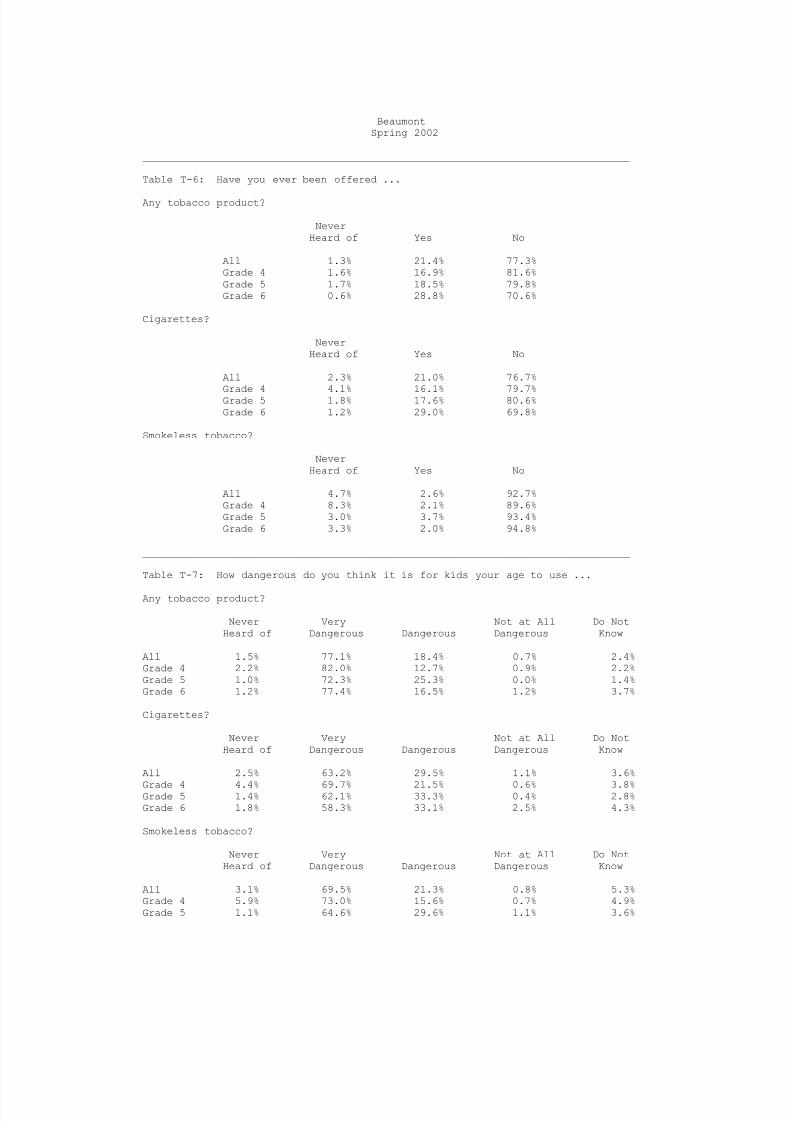
Table T-6: Have you ever been offered ...
Any tobacco product?
NeverHeard of Yes No
All 1.3% 21.4% 77.3%Grade 4 1.6% 16.9% 81.6%Grade 5 1.7% 18.5% 79.8%Grade 6 0.6% 28.8% 70.6%
Cigarettes?
NeverHeard of Yes No
All 2.3% 21.0% 76.7%
Grade 4 4.1% 16.1% 79.7%Grade 5 1.8% 17.6% 80.6%Grade 6 1.2% 29.0% 69.8%
Smokeless tobacco?
NeverHeard of Yes No
All 4.7% 2.6% 92.7%Grade 4 8.3% 2.1% 89.6%Grade 5 3.0% 3.7% 93.4%Grade 6 3.3% 2.0% 94.8%
________________________________________________________________________________
Table T-7: How dangerous do you think it is for kids your age to use ...
Any tobacco product?
Never Very Not at All Do NotHeard of Dangerous Dangerous Dangerous Know
All 1.5% 77.1% 18.4% 0.7% 2.4%Grade 4 2.2% 82.0% 12.7% 0.9% 2.2%Grade 5 1.0% 72.3% 25.3% 0.0% 1.4%Grade 6 1.2% 77.4% 16.5% 1.2% 3.7%
Cigarettes?
Never Very Not at All Do NotHeard of Dangerous Dangerous Dangerous Know
All 2.5% 63.2% 29.5% 1.1% 3.6%
Grade 4 4.4% 69.7% 21.5% 0.6% 3.8%Grade 5 1.4% 62.1% 33.3% 0.4% 2.8%Grade 6 1.8% 58.3% 33.1% 2.5% 4.3%
Smokeless tobacco?
Never Very Not at All Do NotHeard of Dangerous Dangerous Dangerous Know
All 3.1% 69.5% 21.3% 0.8% 5.3%Grade 4 5.9% 73.0% 15.6% 0.7% 4.9%Grade 5 1.1% 64.6% 29.6% 1.1% 3.6%

7/30/2019 2002 _ jefferson county _ beaumont isd _ 2002 texas school survey of drug and alcohol use _ elementary report
http://slidepdf.com/reader/full/2002-jefferson-county-beaumont-isd-2002-texas-school-survey-of-drug-and 5/44
Grade 6 2.5% 71.3% 17.8% 0.6% 7.6%

7/30/2019 2002 _ jefferson county _ beaumont isd _ 2002 texas school survey of drug and alcohol use _ elementary report
http://slidepdf.com/reader/full/2002-jefferson-county-beaumont-isd-2002-texas-school-survey-of-drug-and 6/44
7/30/2019 2002 _ jefferson county _ beaumont isd _ 2002 texas school survey of drug and alcohol use _ elementary report
http://slidepdf.com/reader/full/2002-jefferson-county-beaumont-isd-2002-texas-school-survey-of-drug-and 7/44
BeaumontSpring 2002
________________________________________________________________________________
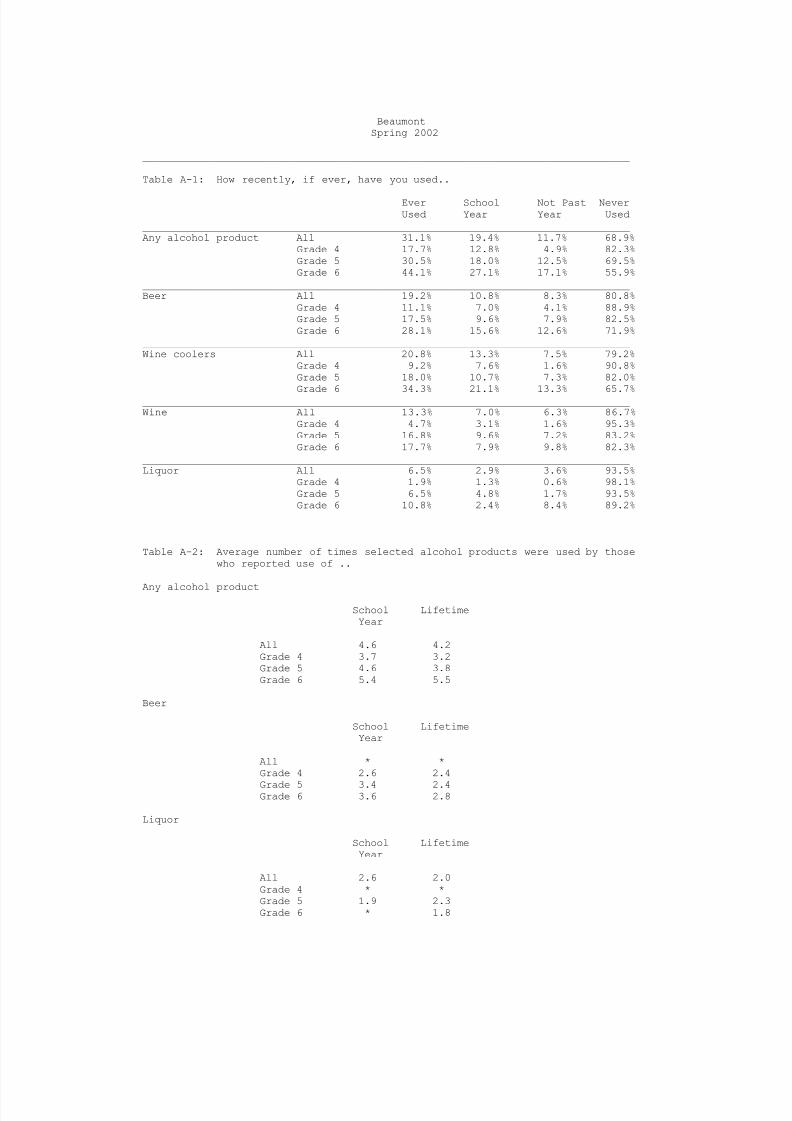
Table A-1: How recently, if ever, have you used..
Ever School Not Past NeverUsed Year Year Used
________________________________________________________________________________Any alcohol product All 31.1% 19.4% 11.7% 68.9%
Grade 4 17.7% 12.8% 4.9% 82.3%Grade 5 30.5% 18.0% 12.5% 69.5%Grade 6 44.1% 27.1% 17.1% 55.9%
________________________________________________________________________________Beer All 19.2% 10.8% 8.3% 80.8%
Grade 4 11.1% 7.0% 4.1% 88.9%Grade 5 17.5% 9.6% 7.9% 82.5%Grade 6 28.1% 15.6% 12.6% 71.9%
________________________________________________________________________________Wine coolers All 20.8% 13.3% 7.5% 79.2%
Grade 4 9.2% 7.6% 1.6% 90.8%Grade 5 18.0% 10.7% 7.3% 82.0%
Grade 6 34.3% 21.1% 13.3% 65.7%________________________________________________________________________________Wine All 13.3% 7.0% 6.3% 86.7%
Grade 4 4.7% 3.1% 1.6% 95.3%Grade 5 16.8% 9.6% 7.2% 83.2%Grade 6 17.7% 7.9% 9.8% 82.3%
________________________________________________________________________________Liquor All 6.5% 2.9% 3.6% 93.5%
Grade 4 1.9% 1.3% 0.6% 98.1%Grade 5 6.5% 4.8% 1.7% 93.5%Grade 6 10.8% 2.4% 8.4% 89.2%
________________________________________________________________________________
Table A-2: Average number of times selected alcohol products were used by thosewho reported use of ..
Any alcohol product
School LifetimeYear
All 4.6 4.2Grade 4 3.7 3.2Grade 5 4.6 3.8Grade 6 5.4 5.5
Beer
School LifetimeYear
All * *Grade 4 2.6 2.4
Grade 5 3.4 2.4Grade 6 3.6 2.8
Liquor
School LifetimeYear
All 2.6 2.0Grade 4 * *Grade 5 1.9 2.3Grade 6 * 1.8
7/30/2019 2002 _ jefferson county _ beaumont isd _ 2002 texas school survey of drug and alcohol use _ elementary report
http://slidepdf.com/reader/full/2002-jefferson-county-beaumont-isd-2002-texas-school-survey-of-drug-and 8/44
BeaumontSpring 2002
________________________________________________________________________________
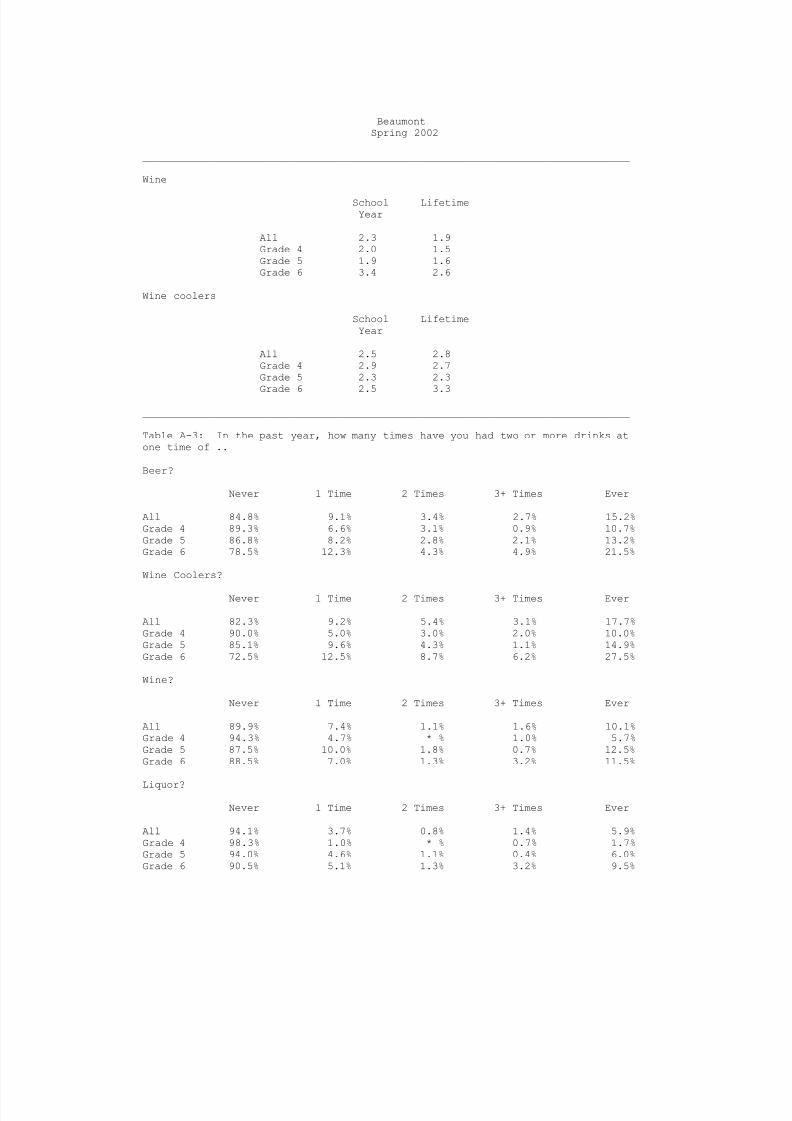
Wine
School LifetimeYear
All 2.3 1.9Grade 4 2.0 1.5Grade 5 1.9 1.6Grade 6 3.4 2.6
Wine coolers
School LifetimeYear
All 2.5 2.8Grade 4 2.9 2.7Grade 5 2.3 2.3
Grade 6 2.5 3.3
________________________________________________________________________________
Table A-3: In the past year, how many times have you had two or more drinks atone time of ..
Beer?
Never 1 Time 2 Times 3+ Times Ever
All 84.8% 9.1% 3.4% 2.7% 15.2%Grade 4 89.3% 6.6% 3.1% 0.9% 10.7%Grade 5 86.8% 8.2% 2.8% 2.1% 13.2%Grade 6 78.5% 12.3% 4.3% 4.9% 21.5%
Wine Coolers?
Never 1 Time 2 Times 3+ Times Ever
All 82.3% 9.2% 5.4% 3.1% 17.7%Grade 4 90.0% 5.0% 3.0% 2.0% 10.0%Grade 5 85.1% 9.6% 4.3% 1.1% 14.9%Grade 6 72.5% 12.5% 8.7% 6.2% 27.5%
Wine?
Never 1 Time 2 Times 3+ Times Ever
All 89.9% 7.4% 1.1% 1.6% 10.1%Grade 4 94.3% 4.7% * % 1.0% 5.7%Grade 5 87.5% 10.0% 1.8% 0.7% 12.5%Grade 6 88.5% 7.0% 1.3% 3.2% 11.5%
Liquor?
Never 1 Time 2 Times 3+ Times Ever
All 94.1% 3.7% 0.8% 1.4% 5.9%Grade 4 98.3% 1.0% * % 0.7% 1.7%Grade 5 94.0% 4.6% 1.1% 0.4% 6.0%Grade 6 90.5% 5.1% 1.3% 3.2% 9.5%
7/30/2019 2002 _ jefferson county _ beaumont isd _ 2002 texas school survey of drug and alcohol use _ elementary report
http://slidepdf.com/reader/full/2002-jefferson-county-beaumont-isd-2002-texas-school-survey-of-drug-and 9/44
BeaumontSpring 2002
________________________________________________________________________________
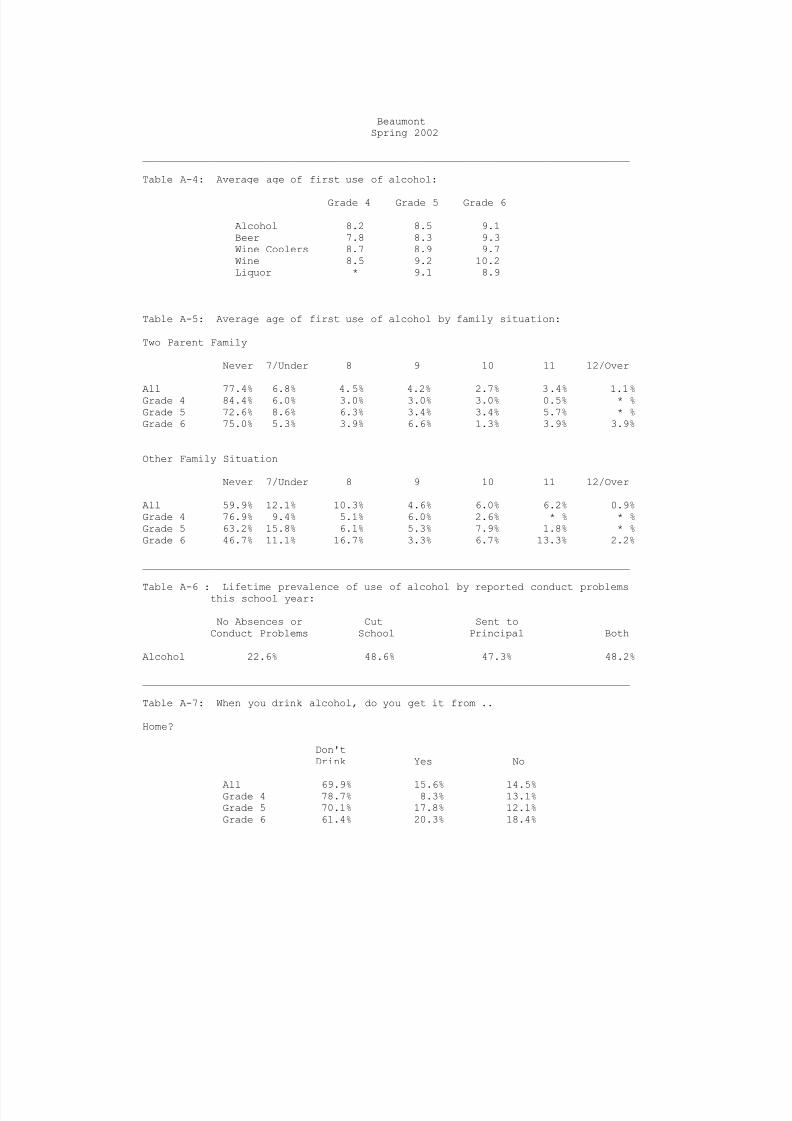
Table A-4: Average age of first use of alcohol:
Grade 4 Grade 5 Grade 6
Alcohol 8.2 8.5 9.1Beer 7.8 8.3 9.3Wine Coolers 8.7 8.9 9.7Wine 8.5 9.2 10.2Liquor * 9.1 8.9
________________________________________________________________________________
Table A-5: Average age of first use of alcohol by family situation:
Two Parent Family
Never 7/Under 8 9 10 11 12/Over
All 77.4% 6.8% 4.5% 4.2% 2.7% 3.4% 1.1%Grade 4 84.4% 6.0% 3.0% 3.0% 3.0% 0.5% * %Grade 5 72.6% 8.6% 6.3% 3.4% 3.4% 5.7% * %Grade 6 75.0% 5.3% 3.9% 6.6% 1.3% 3.9% 3.9%
Other Family Situation
Never 7/Under 8 9 10 11 12/Over
All 59.9% 12.1% 10.3% 4.6% 6.0% 6.2% 0.9%Grade 4 76.9% 9.4% 5.1% 6.0% 2.6% * % * %Grade 5 63.2% 15.8% 6.1% 5.3% 7.9% 1.8% * %Grade 6 46.7% 11.1% 16.7% 3.3% 6.7% 13.3% 2.2%
________________________________________________________________________________
Table A-6 : Lifetime prevalence of use of alcohol by reported conduct problemsthis school year:
No Absences or Cut Sent toConduct Problems School Principal Both
Alcohol 22.6% 48.6% 47.3% 48.2%
________________________________________________________________________________
Table A-7: When you drink alcohol, do you get it from ..
Home?
Don'tDrink Yes No
All 69.9% 15.6% 14.5%Grade 4 78.7% 8.3% 13.1%Grade 5 70.1% 17.8% 12.1%Grade 6 61.4% 20.3% 18.4%
7/30/2019 2002 _ jefferson county _ beaumont isd _ 2002 texas school survey of drug and alcohol use _ elementary report
http://slidepdf.com/reader/full/2002-jefferson-county-beaumont-isd-2002-texas-school-survey-of-drug-and 10/44
BeaumontSpring 2002
________________________________________________________________________________
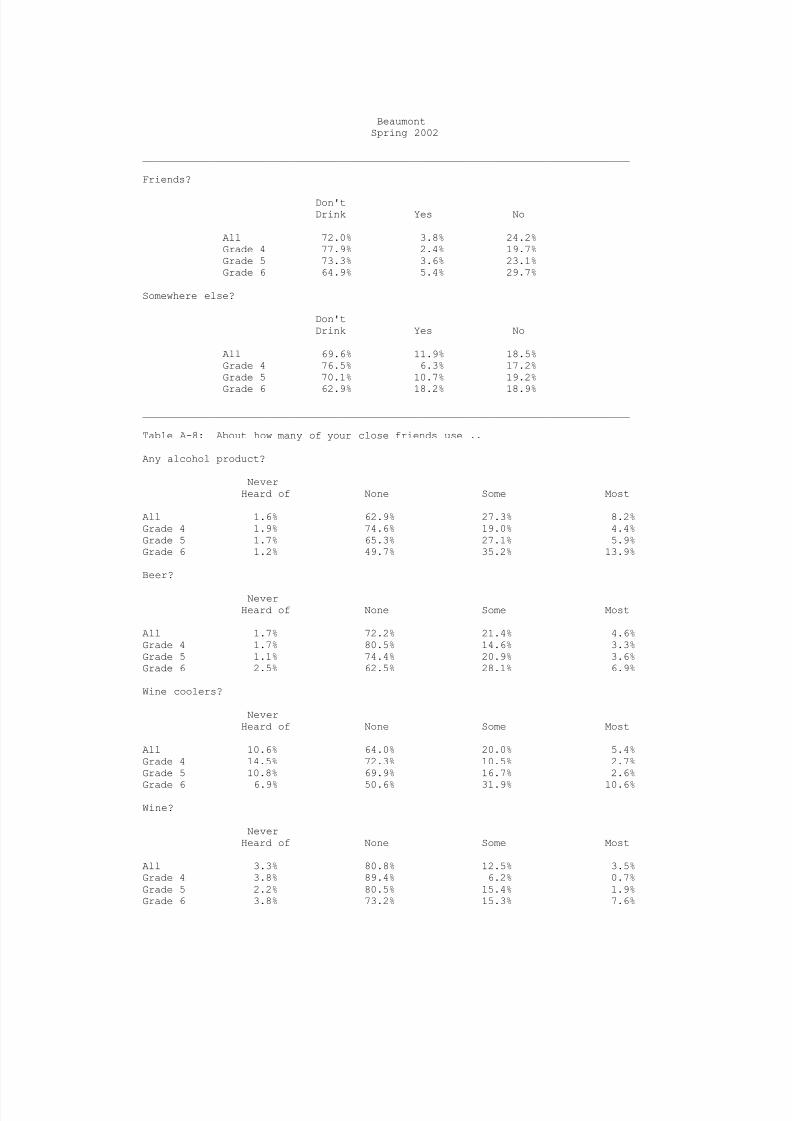
Friends?
Don'tDrink Yes No
All 72.0% 3.8% 24.2%Grade 4 77.9% 2.4% 19.7%Grade 5 73.3% 3.6% 23.1%Grade 6 64.9% 5.4% 29.7%
Somewhere else?
Don'tDrink Yes No
All 69.6% 11.9% 18.5%Grade 4 76.5% 6.3% 17.2%Grade 5 70.1% 10.7% 19.2%
Grade 6 62.9% 18.2% 18.9%
________________________________________________________________________________
Table A-8: About how many of your close friends use ..
Any alcohol product?
NeverHeard of None Some Most
All 1.6% 62.9% 27.3% 8.2%Grade 4 1.9% 74.6% 19.0% 4.4%Grade 5 1.7% 65.3% 27.1% 5.9%Grade 6 1.2% 49.7% 35.2% 13.9%
Beer?
NeverHeard of None Some Most
All 1.7% 72.2% 21.4% 4.6%Grade 4 1.7% 80.5% 14.6% 3.3%Grade 5 1.1% 74.4% 20.9% 3.6%Grade 6 2.5% 62.5% 28.1% 6.9%
Wine coolers?
NeverHeard of None Some Most
All 10.6% 64.0% 20.0% 5.4%Grade 4 14.5% 72.3% 10.5% 2.7%Grade 5 10.8% 69.9% 16.7% 2.6%
Grade 6 6.9% 50.6% 31.9% 10.6%
Wine?
NeverHeard of None Some Most
All 3.3% 80.8% 12.5% 3.5%Grade 4 3.8% 89.4% 6.2% 0.7%Grade 5 2.2% 80.5% 15.4% 1.9%Grade 6 3.8% 73.2% 15.3% 7.6%
7/30/2019 2002 _ jefferson county _ beaumont isd _ 2002 texas school survey of drug and alcohol use _ elementary report
http://slidepdf.com/reader/full/2002-jefferson-county-beaumont-isd-2002-texas-school-survey-of-drug-and 11/44
BeaumontSpring 2002
________________________________________________________________________________
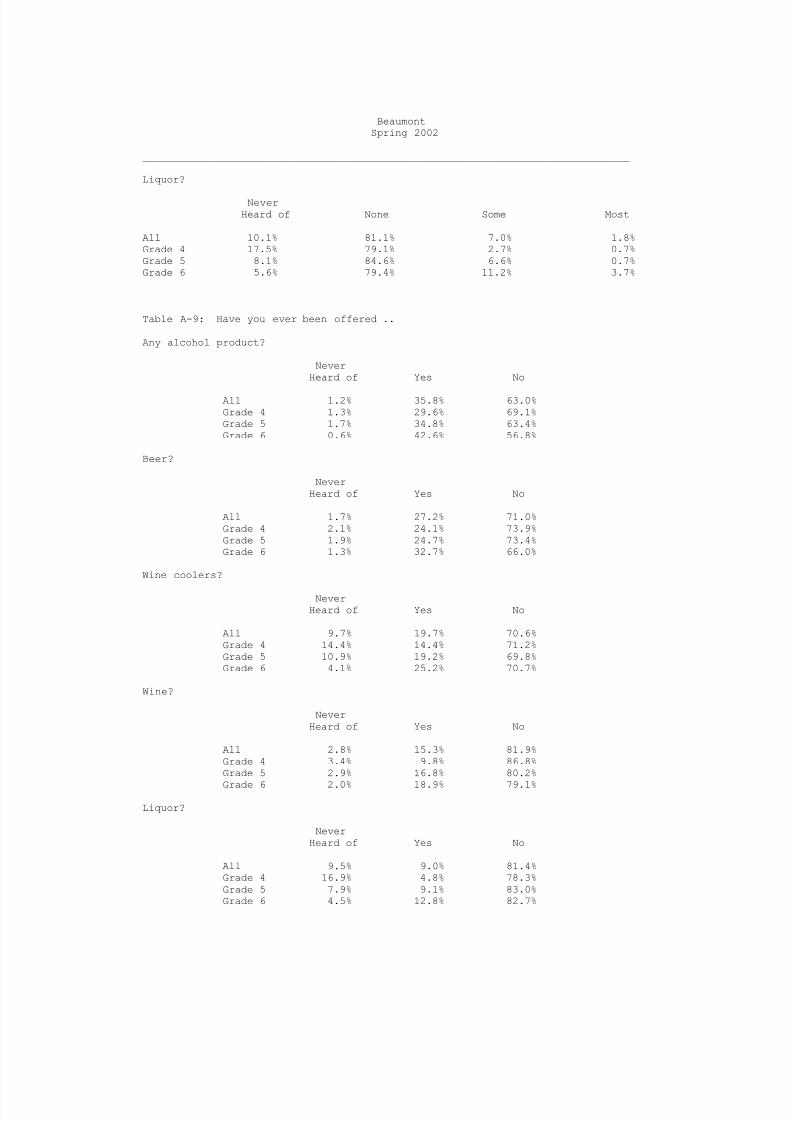
Liquor?
NeverHeard of None Some Most
All 10.1% 81.1% 7.0% 1.8%Grade 4 17.5% 79.1% 2.7% 0.7%Grade 5 8.1% 84.6% 6.6% 0.7%Grade 6 5.6% 79.4% 11.2% 3.7%
________________________________________________________________________________
Table A-9: Have you ever been offered ..
Any alcohol product?
NeverHeard of Yes No
All 1.2% 35.8% 63.0%Grade 4 1.3% 29.6% 69.1%Grade 5 1.7% 34.8% 63.4%Grade 6 0.6% 42.6% 56.8%
Beer?
NeverHeard of Yes No
All 1.7% 27.2% 71.0%Grade 4 2.1% 24.1% 73.9%Grade 5 1.9% 24.7% 73.4%Grade 6 1.3% 32.7% 66.0%
Wine coolers?
NeverHeard of Yes No
All 9.7% 19.7% 70.6%Grade 4 14.4% 14.4% 71.2%Grade 5 10.9% 19.2% 69.8%Grade 6 4.1% 25.2% 70.7%
Wine?
NeverHeard of Yes No
All 2.8% 15.3% 81.9%Grade 4 3.4% 9.8% 86.8%Grade 5 2.9% 16.8% 80.2%
Grade 6 2.0% 18.9% 79.1%
Liquor?
NeverHeard of Yes No
All 9.5% 9.0% 81.4%Grade 4 16.9% 4.8% 78.3%Grade 5 7.9% 9.1% 83.0%Grade 6 4.5% 12.8% 82.7%
7/30/2019 2002 _ jefferson county _ beaumont isd _ 2002 texas school survey of drug and alcohol use _ elementary report
http://slidepdf.com/reader/full/2002-jefferson-county-beaumont-isd-2002-texas-school-survey-of-drug-and 12/44
BeaumontSpring 2002
________________________________________________________________________________
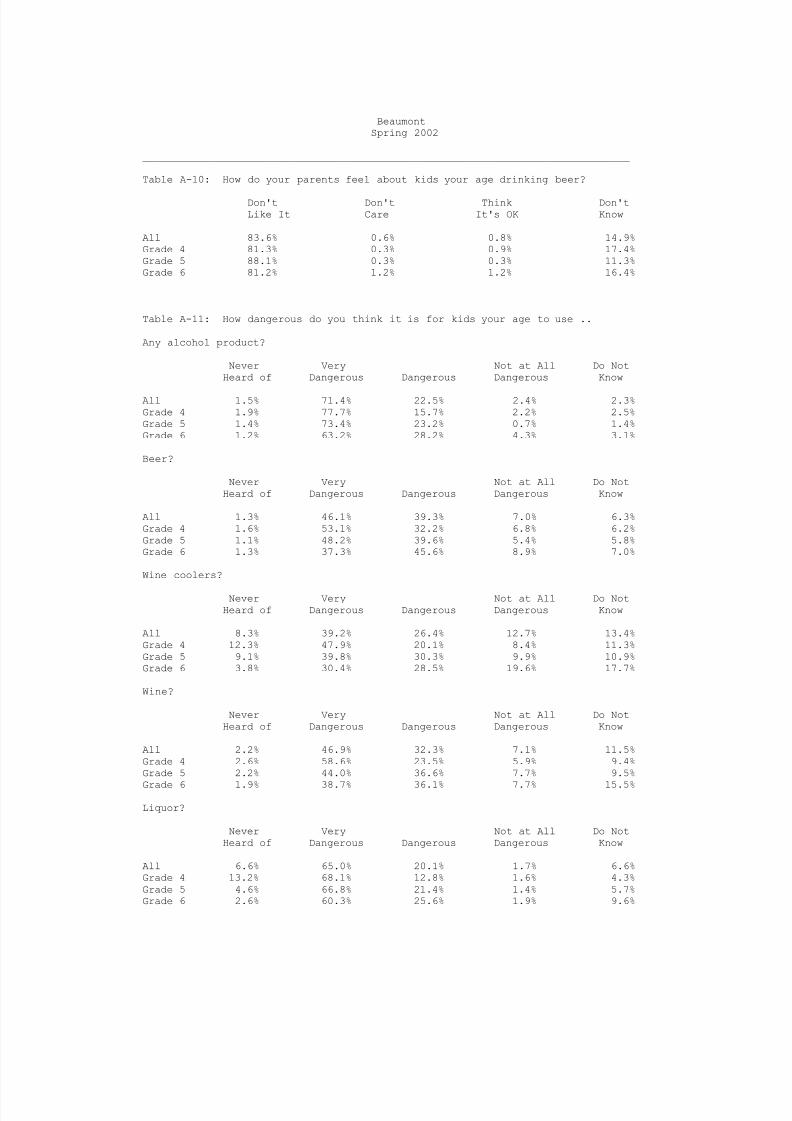
Table A-10: How do your parents feel about kids your age drinking beer?
Don't Don't Think Don'tLike It Care It's OK Know
All 83.6% 0.6% 0.8% 14.9%Grade 4 81.3% 0.3% 0.9% 17.4%Grade 5 88.1% 0.3% 0.3% 11.3%Grade 6 81.2% 1.2% 1.2% 16.4%
________________________________________________________________________________
Table A-11: How dangerous do you think it is for kids your age to use ..
Any alcohol product?
Never Very Not at All Do NotHeard of Dangerous Dangerous Dangerous Know
All 1.5% 71.4% 22.5% 2.4% 2.3%Grade 4 1.9% 77.7% 15.7% 2.2% 2.5%Grade 5 1.4% 73.4% 23.2% 0.7% 1.4%Grade 6 1.2% 63.2% 28.2% 4.3% 3.1%
Beer?
Never Very Not at All Do NotHeard of Dangerous Dangerous Dangerous Know
All 1.3% 46.1% 39.3% 7.0% 6.3%Grade 4 1.6% 53.1% 32.2% 6.8% 6.2%Grade 5 1.1% 48.2% 39.6% 5.4% 5.8%Grade 6 1.3% 37.3% 45.6% 8.9% 7.0%
Wine coolers?
Never Very Not at All Do NotHeard of Dangerous Dangerous Dangerous Know
All 8.3% 39.2% 26.4% 12.7% 13.4%Grade 4 12.3% 47.9% 20.1% 8.4% 11.3%Grade 5 9.1% 39.8% 30.3% 9.9% 10.9%Grade 6 3.8% 30.4% 28.5% 19.6% 17.7%
Wine?
Never Very Not at All Do NotHeard of Dangerous Dangerous Dangerous Know
All 2.2% 46.9% 32.3% 7.1% 11.5%Grade 4 2.6% 58.6% 23.5% 5.9% 9.4%Grade 5 2.2% 44.0% 36.6% 7.7% 9.5%
Grade 6 1.9% 38.7% 36.1% 7.7% 15.5%
Liquor?
Never Very Not at All Do NotHeard of Dangerous Dangerous Dangerous Know
All 6.6% 65.0% 20.1% 1.7% 6.6%Grade 4 13.2% 68.1% 12.8% 1.6% 4.3%Grade 5 4.6% 66.8% 21.4% 1.4% 5.7%Grade 6 2.6% 60.3% 25.6% 1.9% 9.6%
7/30/2019 2002 _ jefferson county _ beaumont isd _ 2002 texas school survey of drug and alcohol use _ elementary report
http://slidepdf.com/reader/full/2002-jefferson-county-beaumont-isd-2002-texas-school-survey-of-drug-and 13/44
BeaumontSpring 2002
________________________________________________________________________________
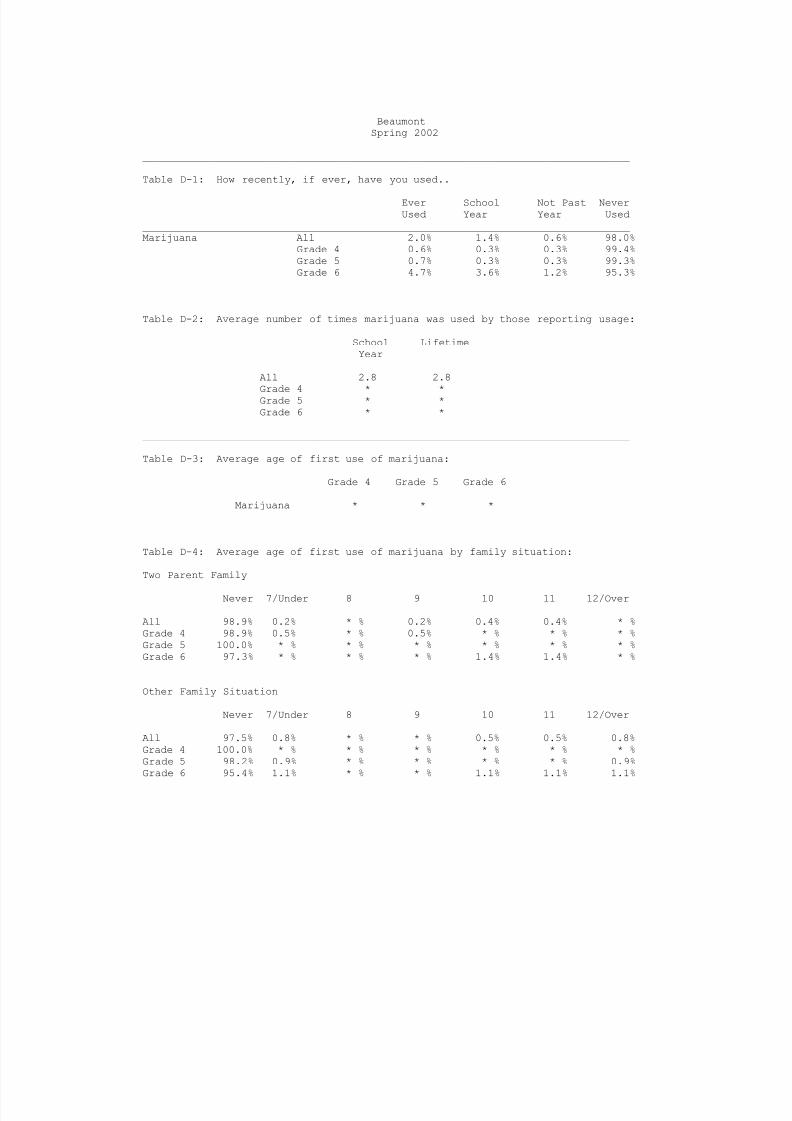
Table D-1: How recently, if ever, have you used..
Ever School Not Past NeverUsed Year Year Used
________________________________________________________________________________Marijuana All 2.0% 1.4% 0.6% 98.0%
Grade 4 0.6% 0.3% 0.3% 99.4%Grade 5 0.7% 0.3% 0.3% 99.3%Grade 6 4.7% 3.6% 1.2% 95.3%
________________________________________________________________________________
Table D-2: Average number of times marijuana was used by those reporting usage:
School LifetimeYear
All 2.8 2.8
Grade 4 * *Grade 5 * *Grade 6 * *
________________________________________________________________________________
Table D-3: Average age of first use of marijuana:
Grade 4 Grade 5 Grade 6
Marijuana * * *
________________________________________________________________________________
Table D-4: Average age of first use of marijuana by family situation:
Two Parent Family
Never 7/Under 8 9 10 11 12/Over
All 98.9% 0.2% * % 0.2% 0.4% 0.4% * %Grade 4 98.9% 0.5% * % 0.5% * % * % * %Grade 5 100.0% * % * % * % * % * % * %Grade 6 97.3% * % * % * % 1.4% 1.4% * %
Other Family Situation
Never 7/Under 8 9 10 11 12/Over
All 97.5% 0.8% * % * % 0.5% 0.5% 0.8%Grade 4 100.0% * % * % * % * % * % * %Grade 5 98.2% 0.9% * % * % * % * % 0.9%Grade 6 95.4% 1.1% * % * % 1.1% 1.1% 1.1%
7/30/2019 2002 _ jefferson county _ beaumont isd _ 2002 texas school survey of drug and alcohol use _ elementary report
http://slidepdf.com/reader/full/2002-jefferson-county-beaumont-isd-2002-texas-school-survey-of-drug-and 14/44
BeaumontSpring 2002
________________________________________________________________________________
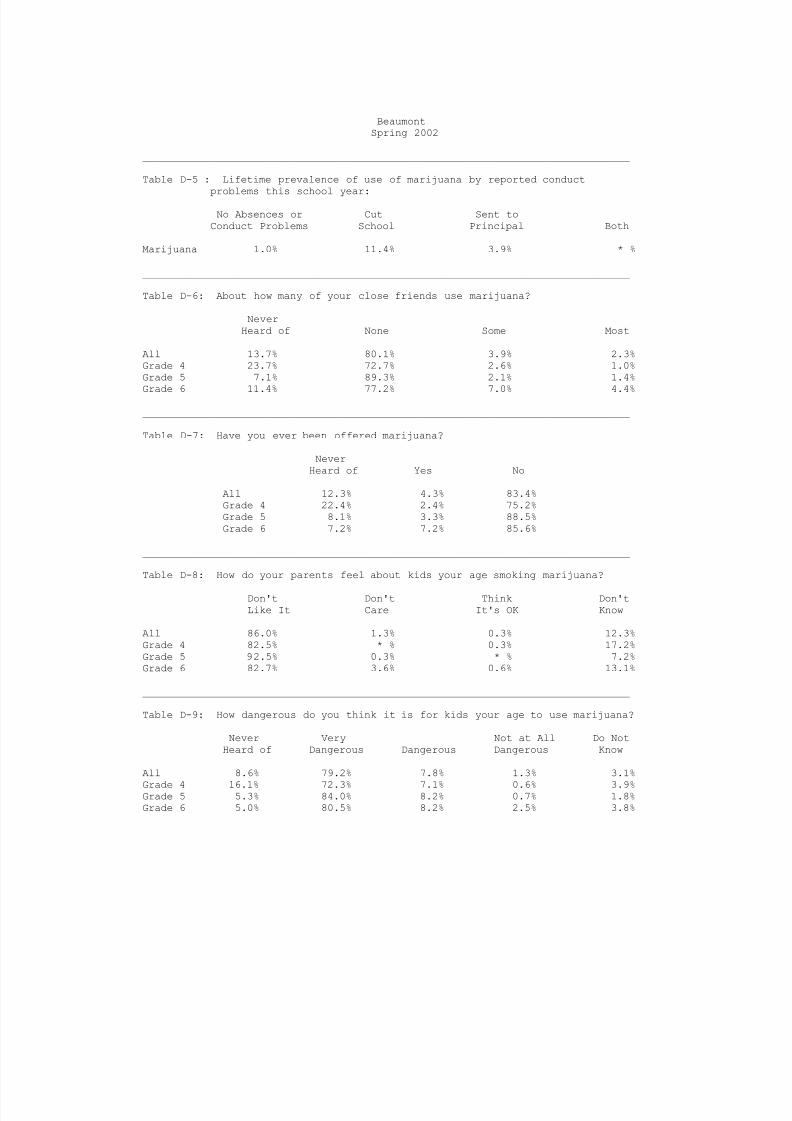
Table D-5 : Lifetime prevalence of use of marijuana by reported conduct
problems this school year:
No Absences or Cut Sent toConduct Problems School Principal Both
Marijuana 1.0% 11.4% 3.9% * %
________________________________________________________________________________
Table D-6: About how many of your close friends use marijuana?
NeverHeard of None Some Most
All 13.7% 80.1% 3.9% 2.3%Grade 4 23.7% 72.7% 2.6% 1.0%Grade 5 7.1% 89.3% 2.1% 1.4%
Grade 6 11.4% 77.2% 7.0% 4.4%
________________________________________________________________________________
Table D-7: Have you ever been offered marijuana?
NeverHeard of Yes No
All 12.3% 4.3% 83.4%Grade 4 22.4% 2.4% 75.2%Grade 5 8.1% 3.3% 88.5%Grade 6 7.2% 7.2% 85.6%
________________________________________________________________________________
Table D-8: How do your parents feel about kids your age smoking marijuana?
Don't Don't Think Don'tLike It Care It's OK Know
All 86.0% 1.3% 0.3% 12.3%Grade 4 82.5% * % 0.3% 17.2%Grade 5 92.5% 0.3% * % 7.2%Grade 6 82.7% 3.6% 0.6% 13.1%
________________________________________________________________________________
Table D-9: How dangerous do you think it is for kids your age to use marijuana?
Never Very Not at All Do NotHeard of Dangerous Dangerous Dangerous Know
All 8.6% 79.2% 7.8% 1.3% 3.1%
Grade 4 16.1% 72.3% 7.1% 0.6% 3.9%Grade 5 5.3% 84.0% 8.2% 0.7% 1.8%Grade 6 5.0% 80.5% 8.2% 2.5% 3.8%
7/30/2019 2002 _ jefferson county _ beaumont isd _ 2002 texas school survey of drug and alcohol use _ elementary report
http://slidepdf.com/reader/full/2002-jefferson-county-beaumont-isd-2002-texas-school-survey-of-drug-and 15/44
BeaumontSpring 2002
________________________________________________________________________________
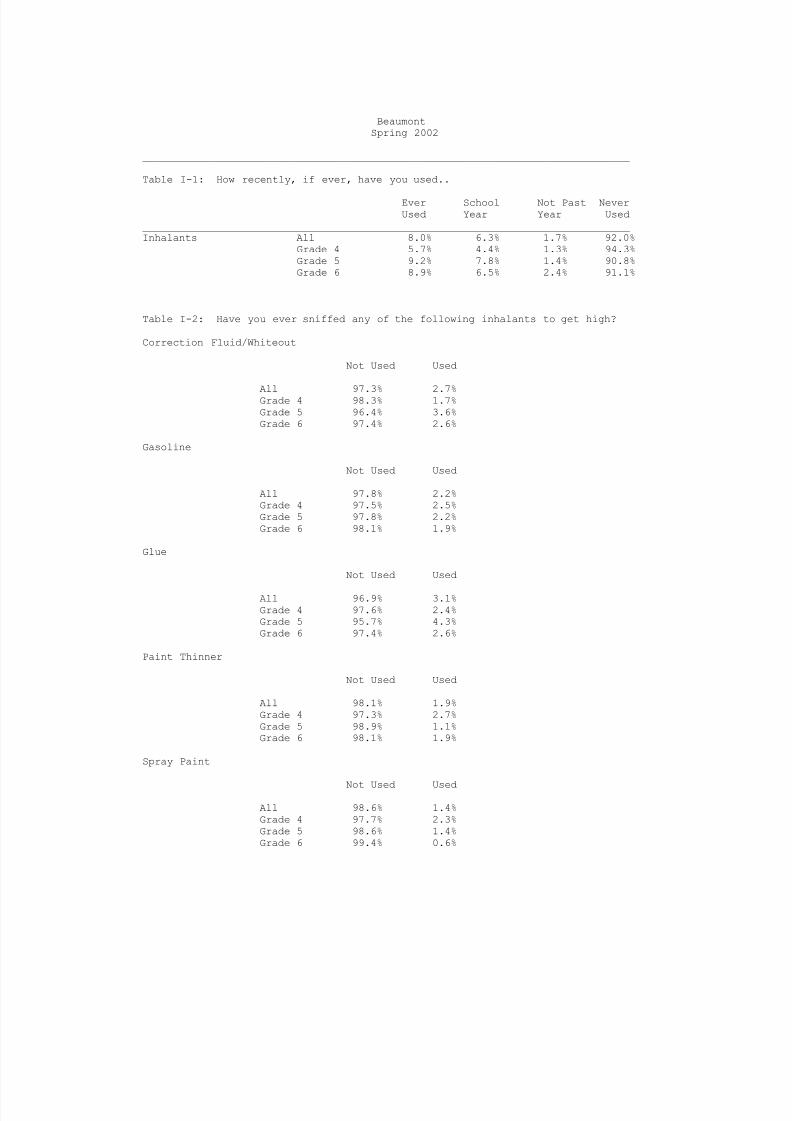
Table I-1: How recently, if ever, have you used..
Ever School Not Past NeverUsed Year Year Used
________________________________________________________________________________Inhalants All 8.0% 6.3% 1.7% 92.0%
Grade 4 5.7% 4.4% 1.3% 94.3%Grade 5 9.2% 7.8% 1.4% 90.8%Grade 6 8.9% 6.5% 2.4% 91.1%
________________________________________________________________________________
Table I-2: Have you ever sniffed any of the following inhalants to get high?
Correction Fluid/Whiteout
Not Used Used
All 97.3% 2.7%Grade 4 98.3% 1.7%Grade 5 96.4% 3.6%Grade 6 97.4% 2.6%
Gasoline
Not Used Used
All 97.8% 2.2%Grade 4 97.5% 2.5%Grade 5 97.8% 2.2%Grade 6 98.1% 1.9%
Glue
Not Used Used
All 96.9% 3.1%Grade 4 97.6% 2.4%Grade 5 95.7% 4.3%Grade 6 97.4% 2.6%
Paint Thinner
Not Used Used
All 98.1% 1.9%Grade 4 97.3% 2.7%Grade 5 98.9% 1.1%Grade 6 98.1% 1.9%
Spray Paint
Not Used Used
All 98.6% 1.4%Grade 4 97.7% 2.3%Grade 5 98.6% 1.4%Grade 6 99.4% 0.6%
7/30/2019 2002 _ jefferson county _ beaumont isd _ 2002 texas school survey of drug and alcohol use _ elementary report
http://slidepdf.com/reader/full/2002-jefferson-county-beaumont-isd-2002-texas-school-survey-of-drug-and 16/44
BeaumontSpring 2002
________________________________________________________________________________
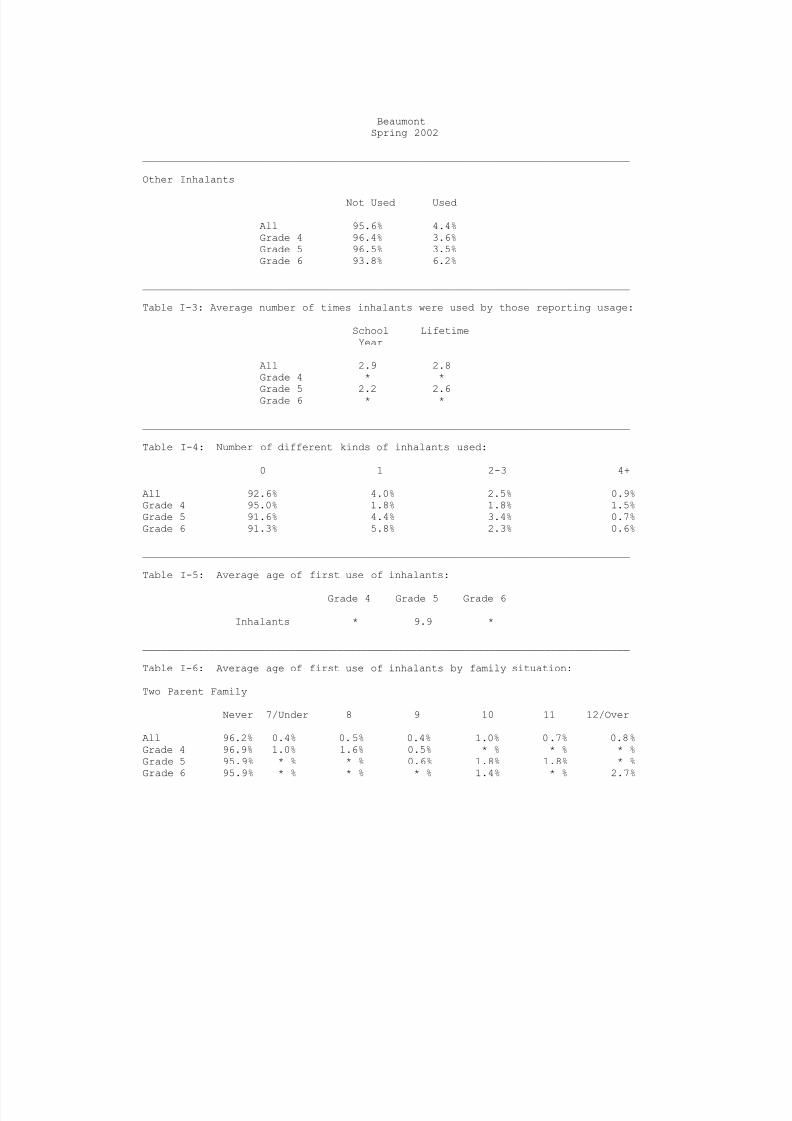
Other Inhalants
Not Used Used
All 95.6% 4.4%Grade 4 96.4% 3.6%Grade 5 96.5% 3.5%Grade 6 93.8% 6.2%
________________________________________________________________________________
Table I-3: Average number of times inhalants were used by those reporting usage:
School LifetimeYear
All 2.9 2.8Grade 4 * *
Grade 5 2.2 2.6Grade 6 * *
________________________________________________________________________________
Table I-4: Number of different kinds of inhalants used:
0 1 2-3 4+
All 92.6% 4.0% 2.5% 0.9%Grade 4 95.0% 1.8% 1.8% 1.5%Grade 5 91.6% 4.4% 3.4% 0.7%Grade 6 91.3% 5.8% 2.3% 0.6%
________________________________________________________________________________
Table I-5: Average age of first use of inhalants:
Grade 4 Grade 5 Grade 6
Inhalants * 9.9 *
________________________________________________________________________________
Table I-6: Average age of first use of inhalants by family situation:
Two Parent Family
Never 7/Under 8 9 10 11 12/Over
All 96.2% 0.4% 0.5% 0.4% 1.0% 0.7% 0.8%Grade 4 96.9% 1.0% 1.6% 0.5% * % * % * %Grade 5 95.9% * % * % 0.6% 1.8% 1.8% * %Grade 6 95.9% * % * % * % 1.4% * % 2.7%
7/30/2019 2002 _ jefferson county _ beaumont isd _ 2002 texas school survey of drug and alcohol use _ elementary report
http://slidepdf.com/reader/full/2002-jefferson-county-beaumont-isd-2002-texas-school-survey-of-drug-and 17/44
BeaumontSpring 2002
________________________________________________________________________________
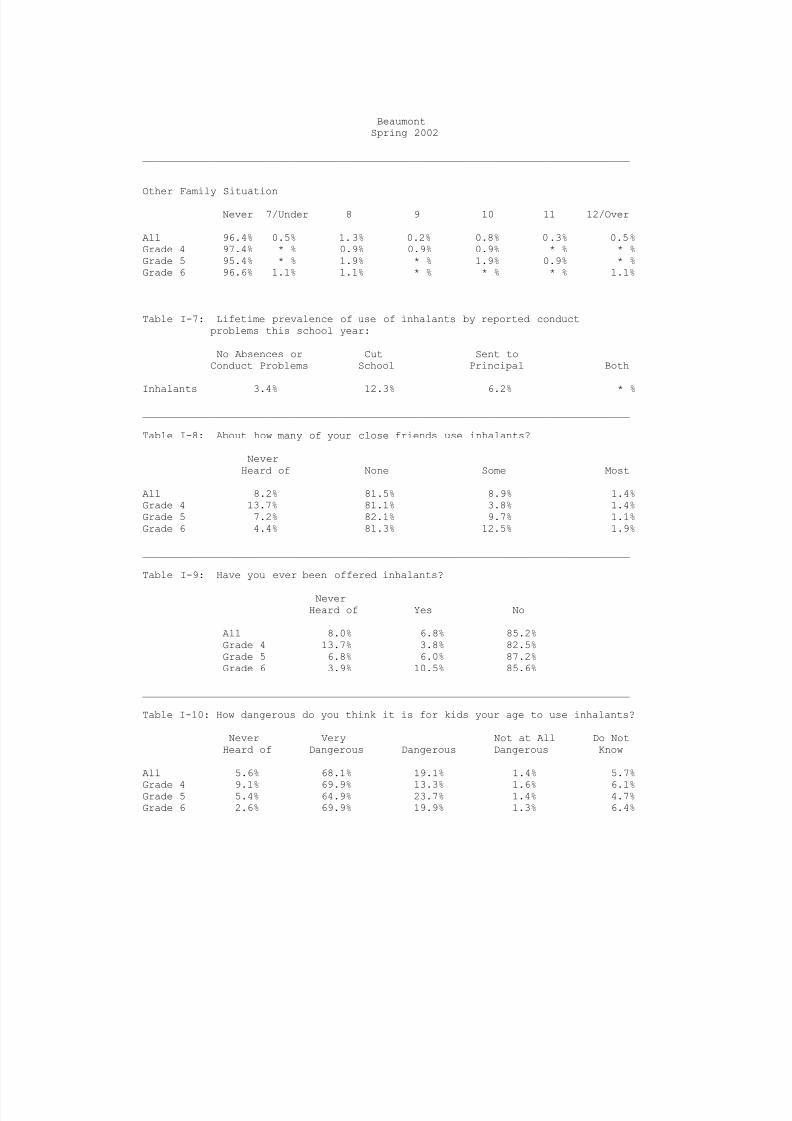
Other Family Situation
Never 7/Under 8 9 10 11 12/Over
All 96.4% 0.5% 1.3% 0.2% 0.8% 0.3% 0.5%Grade 4 97.4% * % 0.9% 0.9% 0.9% * % * %Grade 5 95.4% * % 1.9% * % 1.9% 0.9% * %Grade 6 96.6% 1.1% 1.1% * % * % * % 1.1%
________________________________________________________________________________
Table I-7: Lifetime prevalence of use of inhalants by reported conductproblems this school year:
No Absences or Cut Sent toConduct Problems School Principal Both
Inhalants 3.4% 12.3% 6.2% * %
________________________________________________________________________________
Table I-8: About how many of your close friends use inhalants?
NeverHeard of None Some Most
All 8.2% 81.5% 8.9% 1.4%Grade 4 13.7% 81.1% 3.8% 1.4%Grade 5 7.2% 82.1% 9.7% 1.1%Grade 6 4.4% 81.3% 12.5% 1.9%
________________________________________________________________________________
Table I-9: Have you ever been offered inhalants?
NeverHeard of Yes No
All 8.0% 6.8% 85.2%Grade 4 13.7% 3.8% 82.5%Grade 5 6.8% 6.0% 87.2%Grade 6 3.9% 10.5% 85.6%
________________________________________________________________________________
Table I-10: How dangerous do you think it is for kids your age to use inhalants?
Never Very Not at All Do NotHeard of Dangerous Dangerous Dangerous Know
All 5.6% 68.1% 19.1% 1.4% 5.7%
Grade 4 9.1% 69.9% 13.3% 1.6% 6.1%Grade 5 5.4% 64.9% 23.7% 1.4% 4.7%Grade 6 2.6% 69.9% 19.9% 1.3% 6.4%

7/30/2019 2002 _ jefferson county _ beaumont isd _ 2002 texas school survey of drug and alcohol use _ elementary report
http://slidepdf.com/reader/full/2002-jefferson-county-beaumont-isd-2002-texas-school-survey-of-drug-and 18/44
7/30/2019 2002 _ jefferson county _ beaumont isd _ 2002 texas school survey of drug and alcohol use _ elementary report
http://slidepdf.com/reader/full/2002-jefferson-county-beaumont-isd-2002-texas-school-survey-of-drug-and 19/44
BeaumontSpring 2002
________________________________________________________________________________
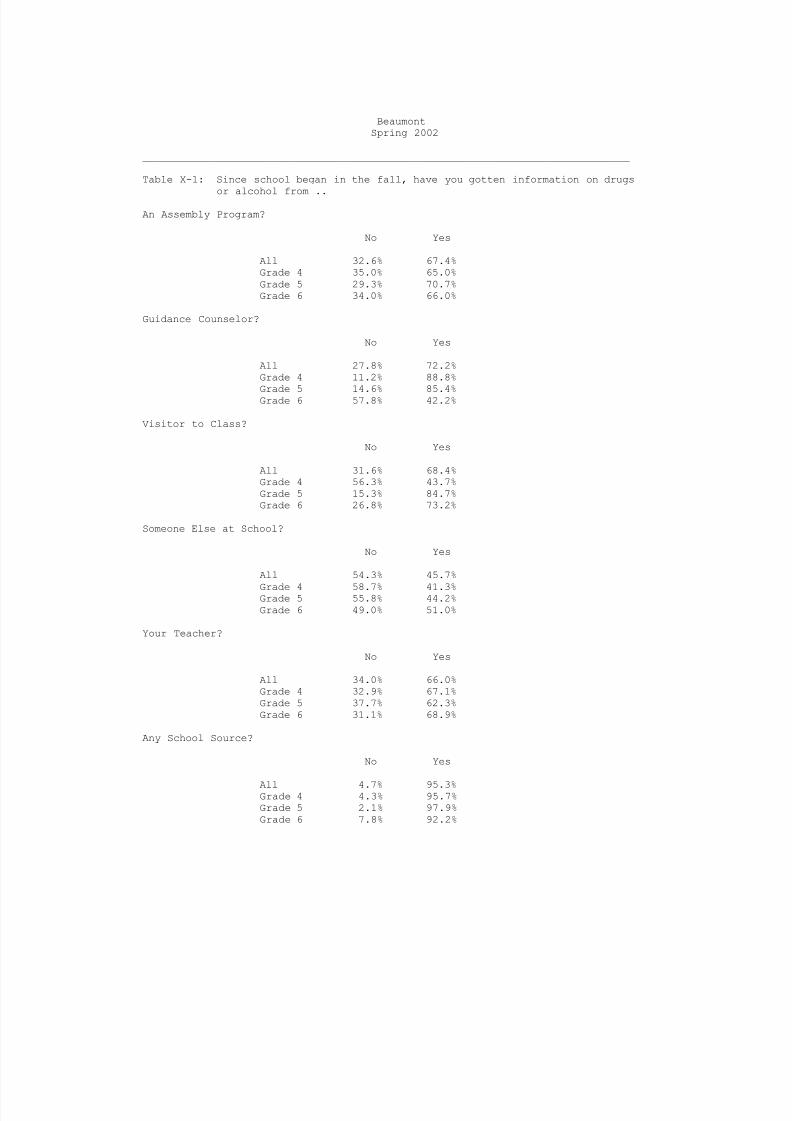
Table X-1: Since school began in the fall, have you gotten information on drugs
or alcohol from ..
An Assembly Program?
No Yes
All 32.6% 67.4%Grade 4 35.0% 65.0%Grade 5 29.3% 70.7%Grade 6 34.0% 66.0%
Guidance Counselor?
No Yes
All 27.8% 72.2%Grade 4 11.2% 88.8%
Grade 5 14.6% 85.4%Grade 6 57.8% 42.2%
Visitor to Class?
No Yes
All 31.6% 68.4%Grade 4 56.3% 43.7%Grade 5 15.3% 84.7%Grade 6 26.8% 73.2%
Someone Else at School?
No Yes
All 54.3% 45.7%
Grade 4 58.7% 41.3%Grade 5 55.8% 44.2%Grade 6 49.0% 51.0%
Your Teacher?
No Yes
All 34.0% 66.0%Grade 4 32.9% 67.1%Grade 5 37.7% 62.3%Grade 6 31.1% 68.9%
Any School Source?
No Yes
All 4.7% 95.3%Grade 4 4.3% 95.7%Grade 5 2.1% 97.9%Grade 6 7.8% 92.2%

7/30/2019 2002 _ jefferson county _ beaumont isd _ 2002 texas school survey of drug and alcohol use _ elementary report
http://slidepdf.com/reader/full/2002-jefferson-county-beaumont-isd-2002-texas-school-survey-of-drug-and 20/44

7/30/2019 2002 _ jefferson county _ beaumont isd _ 2002 texas school survey of drug and alcohol use _ elementary report
http://slidepdf.com/reader/full/2002-jefferson-county-beaumont-isd-2002-texas-school-survey-of-drug-and 21/44
BeaumontSpring 2002
Table B1: Prevalence and recency of use of selected substances by grade--> All Students
Ever School Not Past Never
Used Year Year Used________________________________________________________________________________Tobacco All 12.3% 6.3% 6.0% 87.7%
Grade 4 3.6% 2.1% 1.5% 96.4%Grade 5 8.1% 3.1% 5.1% 91.9%Grade 6 24.7% 13.5% 11.2% 75.3%
________________________________________________________________________________Alcohol All 31.1% 19.4% 11.7% 68.9%
Grade 4 17.7% 12.8% 4.9% 82.3%Grade 5 30.5% 18.0% 12.5% 69.5%Grade 6 44.1% 27.1% 17.1% 55.9%
________________________________________________________________________________Inhalants All 8.0% 6.3% 1.7% 92.0%
Grade 4 5.7% 4.4% 1.3% 94.3%Grade 5 9.2% 7.8% 1.4% 90.8%Grade 6 8.9% 6.5% 2.4% 91.1%
________________________________________________________________________________
Marijuana All 2.0% 1.4% 0.6% 98.0%Grade 4 0.6% 0.3% 0.3% 99.4%Grade 5 0.7% 0.3% 0.3% 99.3%Grade 6 4.7% 3.6% 1.2% 95.3%
________________________________________________________________________________
Table B2: Prevalence and recency of use of selected substances by grade--> Male Students
Ever School Not Past NeverUsed Year Year Used
________________________________________________________________________________Tobacco All 14.3% 7.7% 6.6% 85.7%
Grade 4 3.6% 2.2% 1.4% 96.4%Grade 5 9.8% 4.9% 4.9% 90.2%Grade 6 27.2% 14.8% 12.3% 72.8%
________________________________________________________________________________Alcohol All 33.5% 19.2% 14.3% 66.5%
Grade 4 20.3% 15.2% 5.1% 79.7%Grade 5 35.2% 18.9% 16.4% 64.8%Grade 6 43.0% 22.8% 20.3% 57.0%
________________________________________________________________________________Inhalants All 8.5% 7.6% 0.9% 91.5%
Grade 4 6.9% 5.4% 1.5% 93.1%Grade 5 6.6% 6.6% * % 93.4%Grade 6 11.4% 10.1% 1.3% 88.6%
________________________________________________________________________________Marijuana All 3.0% 2.6% 0.5% 97.0%
Grade 4 0.8% 0.8% * % 99.2%Grade 5 * % * % * % * %Grade 6 7.6% 6.3% 1.3% 92.4%
________________________________________________________________________________
7/30/2019 2002 _ jefferson county _ beaumont isd _ 2002 texas school survey of drug and alcohol use _ elementary report
http://slidepdf.com/reader/full/2002-jefferson-county-beaumont-isd-2002-texas-school-survey-of-drug-and 22/44
BeaumontSpring 2002
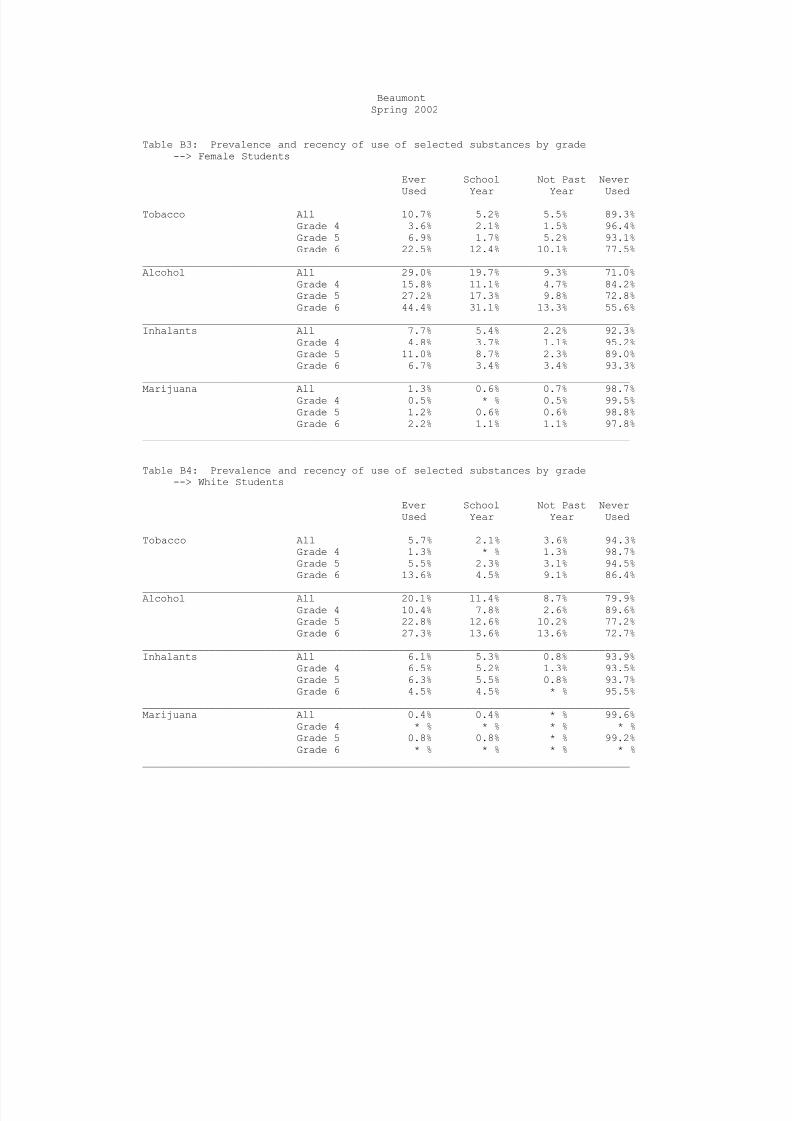
Table B3: Prevalence and recency of use of selected substances by grade--> Female Students
Ever School Not Past Never
Used Year Year Used________________________________________________________________________________Tobacco All 10.7% 5.2% 5.5% 89.3%
Grade 4 3.6% 2.1% 1.5% 96.4%Grade 5 6.9% 1.7% 5.2% 93.1%Grade 6 22.5% 12.4% 10.1% 77.5%
________________________________________________________________________________Alcohol All 29.0% 19.7% 9.3% 71.0%
Grade 4 15.8% 11.1% 4.7% 84.2%Grade 5 27.2% 17.3% 9.8% 72.8%Grade 6 44.4% 31.1% 13.3% 55.6%
________________________________________________________________________________Inhalants All 7.7% 5.4% 2.2% 92.3%
Grade 4 4.8% 3.7% 1.1% 95.2%Grade 5 11.0% 8.7% 2.3% 89.0%Grade 6 6.7% 3.4% 3.4% 93.3%
________________________________________________________________________________
Marijuana All 1.3% 0.6% 0.7% 98.7%Grade 4 0.5% * % 0.5% 99.5%Grade 5 1.2% 0.6% 0.6% 98.8%Grade 6 2.2% 1.1% 1.1% 97.8%
________________________________________________________________________________
Table B4: Prevalence and recency of use of selected substances by grade--> White Students
Ever School Not Past NeverUsed Year Year Used
________________________________________________________________________________Tobacco All 5.7% 2.1% 3.6% 94.3%
Grade 4 1.3% * % 1.3% 98.7%Grade 5 5.5% 2.3% 3.1% 94.5%Grade 6 13.6% 4.5% 9.1% 86.4%
________________________________________________________________________________Alcohol All 20.1% 11.4% 8.7% 79.9%
Grade 4 10.4% 7.8% 2.6% 89.6%Grade 5 22.8% 12.6% 10.2% 77.2%Grade 6 27.3% 13.6% 13.6% 72.7%
________________________________________________________________________________Inhalants All 6.1% 5.3% 0.8% 93.9%
Grade 4 6.5% 5.2% 1.3% 93.5%Grade 5 6.3% 5.5% 0.8% 93.7%Grade 6 4.5% 4.5% * % 95.5%
________________________________________________________________________________Marijuana All 0.4% 0.4% * % 99.6%
Grade 4 * % * % * % * %Grade 5 0.8% 0.8% * % 99.2%Grade 6 * % * % * % * %
________________________________________________________________________________

7/30/2019 2002 _ jefferson county _ beaumont isd _ 2002 texas school survey of drug and alcohol use _ elementary report
http://slidepdf.com/reader/full/2002-jefferson-county-beaumont-isd-2002-texas-school-survey-of-drug-and 23/44
BeaumontSpring 2002
Table B5: Prevalence and recency of use of selected substances by grade--> African/American Students
Ever School Not Past Never
Used Year Year Used________________________________________________________________________________Tobacco All 15.2% 6.8% 8.4% 84.8%
Grade 4 3.5% 2.3% 1.2% 96.5%Grade 5 9.6% 2.6% 7.0% 90.4%Grade 6 27.8% 13.0% 14.8% 72.2%
________________________________________________________________________________Alcohol All 34.7% 22.7% 12.0% 65.3%
Grade 4 16.0% 13.0% 3.0% 84.0%Grade 5 35.7% 21.7% 13.9% 64.3%Grade 6 48.1% 30.6% 17.6% 51.9%
________________________________________________________________________________Inhalants All 6.5% 4.0% 2.5% 93.5%
Grade 4 3.7% 3.0% 0.6% 96.3%Grade 5 9.6% 7.0% 2.6% 90.4%Grade 6 6.6% 2.8% 3.8% 93.4%
________________________________________________________________________________
Marijuana All 3.0% 1.8% 1.2% 97.0%Grade 4 1.2% 0.6% 0.6% 98.8%Grade 5 0.9% * % 0.9% 99.1%Grade 6 5.6% 3.7% 1.9% 94.4%
________________________________________________________________________________
Table B6: Prevalence and recency of use of selected substances by grade--> Mexican/American Students
Ever School Not Past NeverUsed Year Year Used
________________________________________________________________________________Tobacco All 16.5% 11.6% 4.9% 83.5%
Grade 4 6.1% 3.0% 3.0% 93.9%Grade 5 17.2% 10.3% 6.9% 82.8%Grade 6 23.8% 19.0% 4.8% 76.2%
________________________________________________________________________________Alcohol All 37.3% 26.5% 10.9% 62.7%
Grade 4 26.5% 14.7% 11.8% 73.5%Grade 5 50.0% 33.3% 16.7% 50.0%Grade 6 35.0% 30.0% 5.0% 65.0%
________________________________________________________________________________Inhalants All 14.9% 13.0% 1.8% 85.1%
Grade 4 12.9% 6.5% 6.5% 87.1%Grade 5 17.2% 17.2% * % 82.8%Grade 6 14.3% 14.3% * % 85.7%
________________________________________________________________________________Marijuana All * % * % * % * %
Grade 4 * % * % * % * %Grade 5 * % * % * % * %Grade 6 * % * % * % * %
________________________________________________________________________________
7/30/2019 2002 _ jefferson county _ beaumont isd _ 2002 texas school survey of drug and alcohol use _ elementary report
http://slidepdf.com/reader/full/2002-jefferson-county-beaumont-isd-2002-texas-school-survey-of-drug-and 24/44
BeaumontSpring 2002
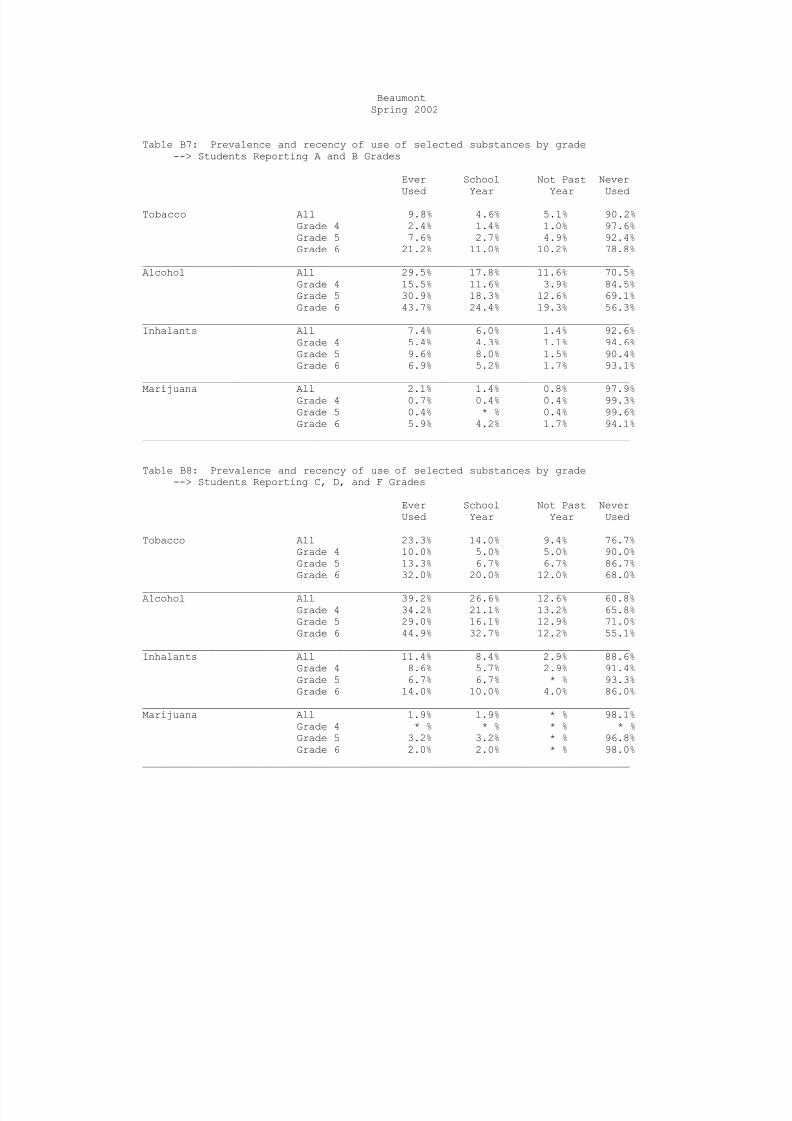
Table B7: Prevalence and recency of use of selected substances by grade--> Students Reporting A and B Grades
Ever School Not Past Never
Used Year Year Used________________________________________________________________________________Tobacco All 9.8% 4.6% 5.1% 90.2%
Grade 4 2.4% 1.4% 1.0% 97.6%Grade 5 7.6% 2.7% 4.9% 92.4%Grade 6 21.2% 11.0% 10.2% 78.8%
________________________________________________________________________________Alcohol All 29.5% 17.8% 11.6% 70.5%
Grade 4 15.5% 11.6% 3.9% 84.5%Grade 5 30.9% 18.3% 12.6% 69.1%Grade 6 43.7% 24.4% 19.3% 56.3%
________________________________________________________________________________Inhalants All 7.4% 6.0% 1.4% 92.6%
Grade 4 5.4% 4.3% 1.1% 94.6%Grade 5 9.6% 8.0% 1.5% 90.4%Grade 6 6.9% 5.2% 1.7% 93.1%
________________________________________________________________________________
Marijuana All 2.1% 1.4% 0.8% 97.9%Grade 4 0.7% 0.4% 0.4% 99.3%Grade 5 0.4% * % 0.4% 99.6%Grade 6 5.9% 4.2% 1.7% 94.1%
________________________________________________________________________________
Table B8: Prevalence and recency of use of selected substances by grade--> Students Reporting C, D, and F Grades
Ever School Not Past NeverUsed Year Year Used
________________________________________________________________________________Tobacco All 23.3% 14.0% 9.4% 76.7%
Grade 4 10.0% 5.0% 5.0% 90.0%Grade 5 13.3% 6.7% 6.7% 86.7%Grade 6 32.0% 20.0% 12.0% 68.0%
________________________________________________________________________________Alcohol All 39.2% 26.6% 12.6% 60.8%
Grade 4 34.2% 21.1% 13.2% 65.8%Grade 5 29.0% 16.1% 12.9% 71.0%Grade 6 44.9% 32.7% 12.2% 55.1%
________________________________________________________________________________Inhalants All 11.4% 8.4% 2.9% 88.6%
Grade 4 8.6% 5.7% 2.9% 91.4%Grade 5 6.7% 6.7% * % 93.3%Grade 6 14.0% 10.0% 4.0% 86.0%
________________________________________________________________________________Marijuana All 1.9% 1.9% * % 98.1%
Grade 4 * % * % * % * %Grade 5 3.2% 3.2% * % 96.8%Grade 6 2.0% 2.0% * % 98.0%
________________________________________________________________________________
7/30/2019 2002 _ jefferson county _ beaumont isd _ 2002 texas school survey of drug and alcohol use _ elementary report
http://slidepdf.com/reader/full/2002-jefferson-county-beaumont-isd-2002-texas-school-survey-of-drug-and 25/44
BeaumontSpring 2002
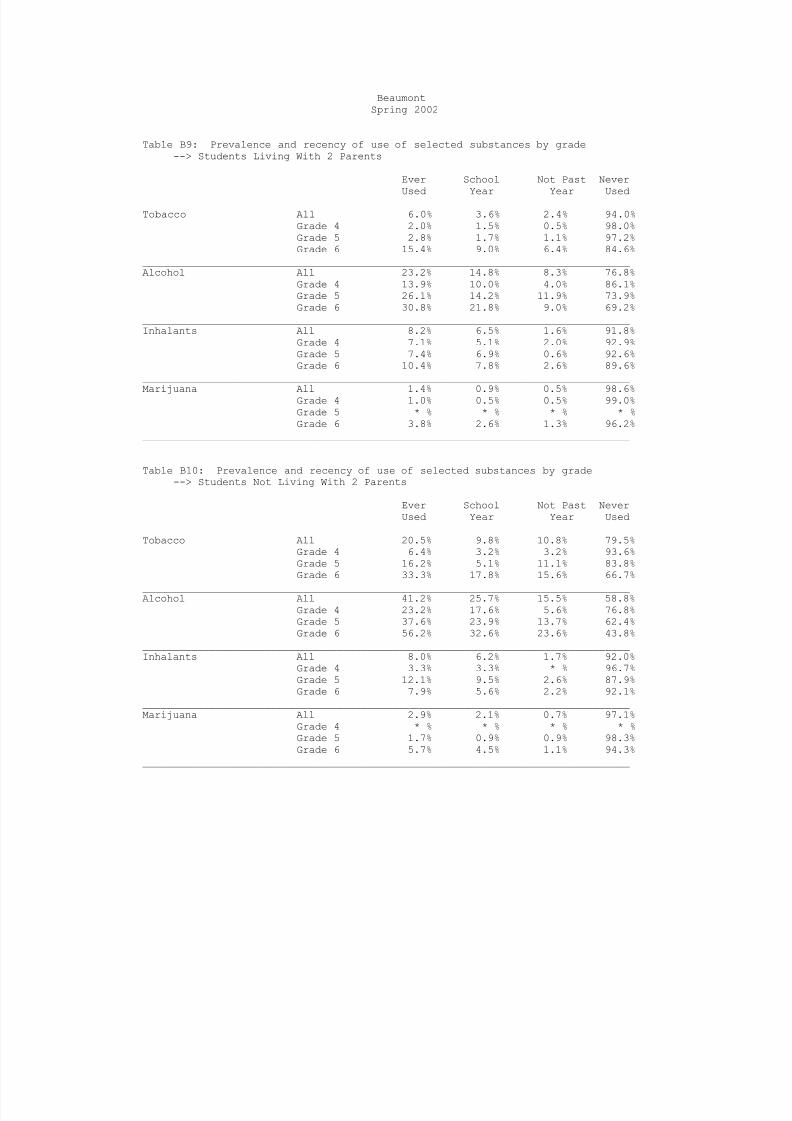
Table B9: Prevalence and recency of use of selected substances by grade--> Students Living With 2 Parents
Ever School Not Past Never
Used Year Year Used________________________________________________________________________________Tobacco All 6.0% 3.6% 2.4% 94.0%
Grade 4 2.0% 1.5% 0.5% 98.0%Grade 5 2.8% 1.7% 1.1% 97.2%Grade 6 15.4% 9.0% 6.4% 84.6%
________________________________________________________________________________Alcohol All 23.2% 14.8% 8.3% 76.8%
Grade 4 13.9% 10.0% 4.0% 86.1%Grade 5 26.1% 14.2% 11.9% 73.9%Grade 6 30.8% 21.8% 9.0% 69.2%
________________________________________________________________________________Inhalants All 8.2% 6.5% 1.6% 91.8%
Grade 4 7.1% 5.1% 2.0% 92.9%Grade 5 7.4% 6.9% 0.6% 92.6%Grade 6 10.4% 7.8% 2.6% 89.6%
________________________________________________________________________________
Marijuana All 1.4% 0.9% 0.5% 98.6%Grade 4 1.0% 0.5% 0.5% 99.0%Grade 5 * % * % * % * %Grade 6 3.8% 2.6% 1.3% 96.2%
________________________________________________________________________________
Table B10: Prevalence and recency of use of selected substances by grade--> Students Not Living With 2 Parents
Ever School Not Past NeverUsed Year Year Used
________________________________________________________________________________Tobacco All 20.5% 9.8% 10.8% 79.5%
Grade 4 6.4% 3.2% 3.2% 93.6%Grade 5 16.2% 5.1% 11.1% 83.8%Grade 6 33.3% 17.8% 15.6% 66.7%
________________________________________________________________________________Alcohol All 41.2% 25.7% 15.5% 58.8%
Grade 4 23.2% 17.6% 5.6% 76.8%Grade 5 37.6% 23.9% 13.7% 62.4%Grade 6 56.2% 32.6% 23.6% 43.8%
________________________________________________________________________________Inhalants All 8.0% 6.2% 1.7% 92.0%
Grade 4 3.3% 3.3% * % 96.7%Grade 5 12.1% 9.5% 2.6% 87.9%Grade 6 7.9% 5.6% 2.2% 92.1%
________________________________________________________________________________Marijuana All 2.9% 2.1% 0.7% 97.1%
Grade 4 * % * % * % * %Grade 5 1.7% 0.9% 0.9% 98.3%Grade 6 5.7% 4.5% 1.1% 94.3%
________________________________________________________________________________
7/30/2019 2002 _ jefferson county _ beaumont isd _ 2002 texas school survey of drug and alcohol use _ elementary report
http://slidepdf.com/reader/full/2002-jefferson-county-beaumont-isd-2002-texas-school-survey-of-drug-and 26/44
BeaumontSpring 2002
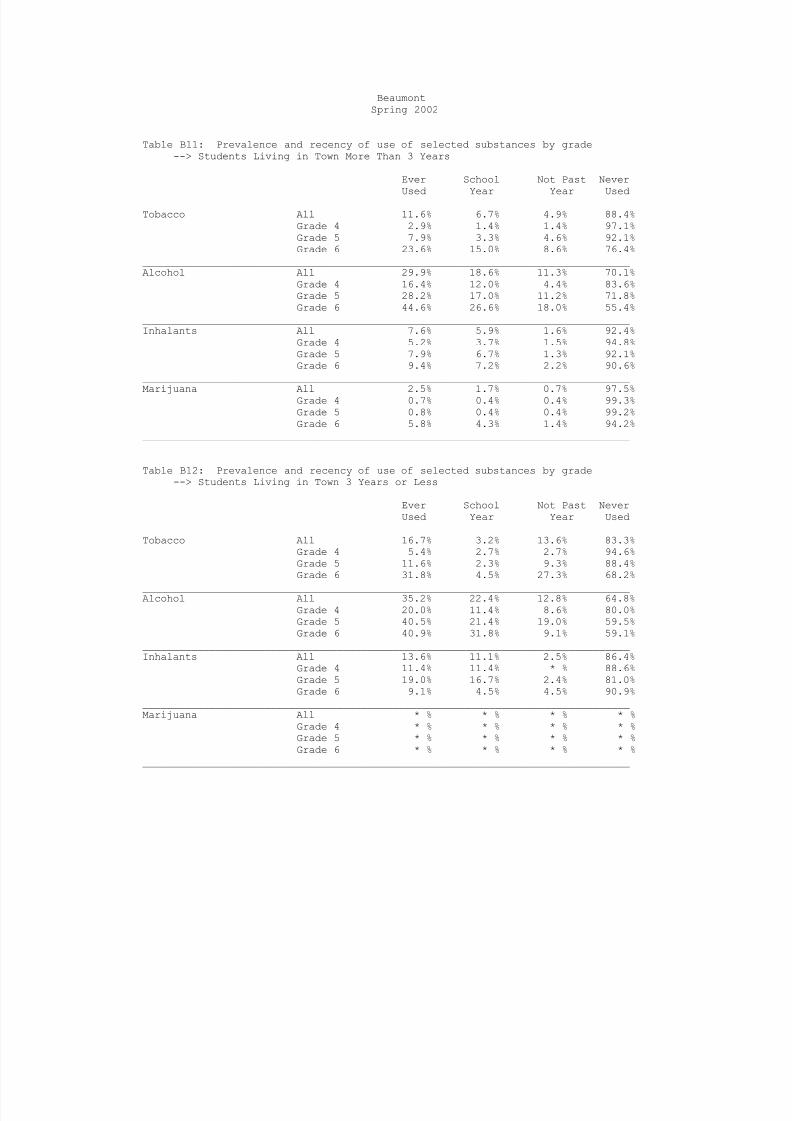
Table B11: Prevalence and recency of use of selected substances by grade--> Students Living in Town More Than 3 Years
Ever School Not Past Never
Used Year Year Used________________________________________________________________________________Tobacco All 11.6% 6.7% 4.9% 88.4%
Grade 4 2.9% 1.4% 1.4% 97.1%Grade 5 7.9% 3.3% 4.6% 92.1%Grade 6 23.6% 15.0% 8.6% 76.4%
________________________________________________________________________________Alcohol All 29.9% 18.6% 11.3% 70.1%
Grade 4 16.4% 12.0% 4.4% 83.6%Grade 5 28.2% 17.0% 11.2% 71.8%Grade 6 44.6% 26.6% 18.0% 55.4%
________________________________________________________________________________Inhalants All 7.6% 5.9% 1.6% 92.4%
Grade 4 5.2% 3.7% 1.5% 94.8%Grade 5 7.9% 6.7% 1.3% 92.1%Grade 6 9.4% 7.2% 2.2% 90.6%
________________________________________________________________________________
Marijuana All 2.5% 1.7% 0.7% 97.5%Grade 4 0.7% 0.4% 0.4% 99.3%Grade 5 0.8% 0.4% 0.4% 99.2%Grade 6 5.8% 4.3% 1.4% 94.2%
________________________________________________________________________________
Table B12: Prevalence and recency of use of selected substances by grade--> Students Living in Town 3 Years or Less
Ever School Not Past NeverUsed Year Year Used
________________________________________________________________________________Tobacco All 16.7% 3.2% 13.6% 83.3%
Grade 4 5.4% 2.7% 2.7% 94.6%Grade 5 11.6% 2.3% 9.3% 88.4%Grade 6 31.8% 4.5% 27.3% 68.2%
________________________________________________________________________________Alcohol All 35.2% 22.4% 12.8% 64.8%
Grade 4 20.0% 11.4% 8.6% 80.0%Grade 5 40.5% 21.4% 19.0% 59.5%Grade 6 40.9% 31.8% 9.1% 59.1%
________________________________________________________________________________Inhalants All 13.6% 11.1% 2.5% 86.4%
Grade 4 11.4% 11.4% * % 88.6%Grade 5 19.0% 16.7% 2.4% 81.0%Grade 6 9.1% 4.5% 4.5% 90.9%
________________________________________________________________________________Marijuana All * % * % * % * %
Grade 4 * % * % * % * %Grade 5 * % * % * % * %Grade 6 * % * % * % * %
________________________________________________________________________________
7/30/2019 2002 _ jefferson county _ beaumont isd _ 2002 texas school survey of drug and alcohol use _ elementary report
http://slidepdf.com/reader/full/2002-jefferson-county-beaumont-isd-2002-texas-school-survey-of-drug-and 27/44
BeaumontSpring 2002
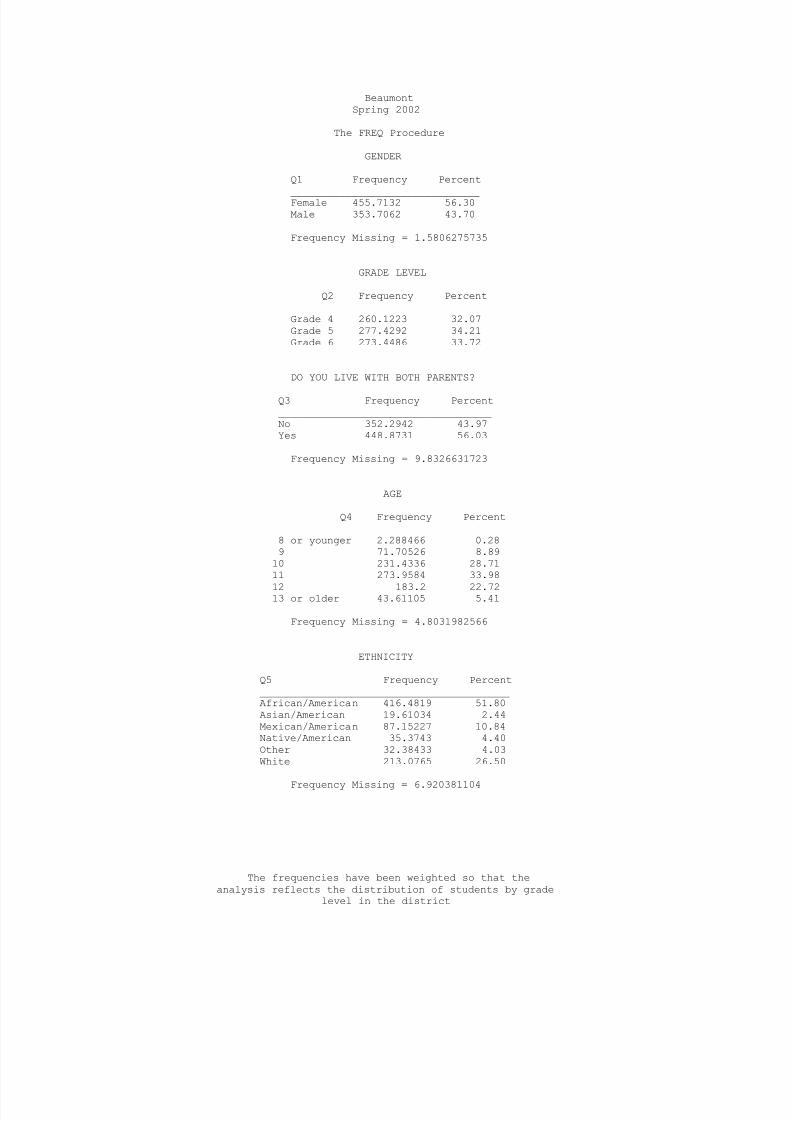
The FREQ Procedure
GENDER
Q1 Frequency Percent
_______________________________Female 455.7132 56.30Male 353.7062 43.70
Frequency Missing = 1.5806275735
GRADE LEVEL
Q2 Frequency Percent________________________________Grade 4 260.1223 32.07Grade 5 277.4292 34.21Grade 6 273.4486 33.72
DO YOU LIVE WITH BOTH PARENTS?
Q3 Frequency Percent___________________________________No 352.2942 43.97Yes 448.8731 56.03
Frequency Missing = 9.8326631723
AGE
Q4 Frequency Percent______________________________________8 or younger 2.288466 0.289 71.70526 8.8910 231.4336 28.7111 273.9584 33.98
12 183.2 22.7213 or older 43.61105 5.41
Frequency Missing = 4.8031982566
ETHNICITY
Q5 Frequency Percent_________________________________________African/American 416.4819 51.80Asian/American 19.61034 2.44Mexican/American 87.15227 10.84Native/American 35.3743 4.40Other 32.38433 4.03White 213.0765 26.50
Frequency Missing = 6.920381104
The frequencies have been weighted so that theanalysis reflects the distribution of students by grade
level in the district

7/30/2019 2002 _ jefferson county _ beaumont isd _ 2002 texas school survey of drug and alcohol use _ elementary report
http://slidepdf.com/reader/full/2002-jefferson-county-beaumont-isd-2002-texas-school-survey-of-drug-and 28/44
BeaumontSpring 2002
The FREQ Procedure
WHAT GRADES DO YOU USUALLY GET
Q6 Frequency Percent
___________________________________Mostly A's 318.8763 39.91Mostly B's 340.7932 42.66Mostly C's 103.7864 12.99Mostly D's 23.4731 2.94Mostly F's 12.00483 1.50
Frequency Missing = 12.066145264
LIVED IN THIS TOWN FOR MORE THAN 3 YEARS
Q7 Frequency Percent___________________________________Don't Know 32.08037 4.01No 103.1647 12.88Yes 665.5633 83.11
Frequency Missing = 10.191603666
EITHER PARENT GRADUATE FROM COLLEGE
Q8 Frequency Percent___________________________________Don't Know 250.6028 31.21No 122.3749 15.24Yes 429.9965 53.55
Frequency Missing = 8.0257689398
QUALIFY FOR A FREE/REDUCED PRICE LUNCH?
Q9 Frequency Percent___________________________________Don't Know 151.322 18.92No 242.6728 30.34Yes 405.7569 50.74
Frequency Missing = 11.248339623
PARENTS ATTEND PTA MEETINGS?
Q10 Frequency Percent___________________________________No 362.876 45.54Yes 434.0184 54.46
Frequency Missing = 14.105637984
The frequencies have been weighted so that theanalysis reflects the distribution of students by grade
level in the district
7/30/2019 2002 _ jefferson county _ beaumont isd _ 2002 texas school survey of drug and alcohol use _ elementary report
http://slidepdf.com/reader/full/2002-jefferson-county-beaumont-isd-2002-texas-school-survey-of-drug-and 29/44
BeaumontSpring 2002
The FREQ Procedure
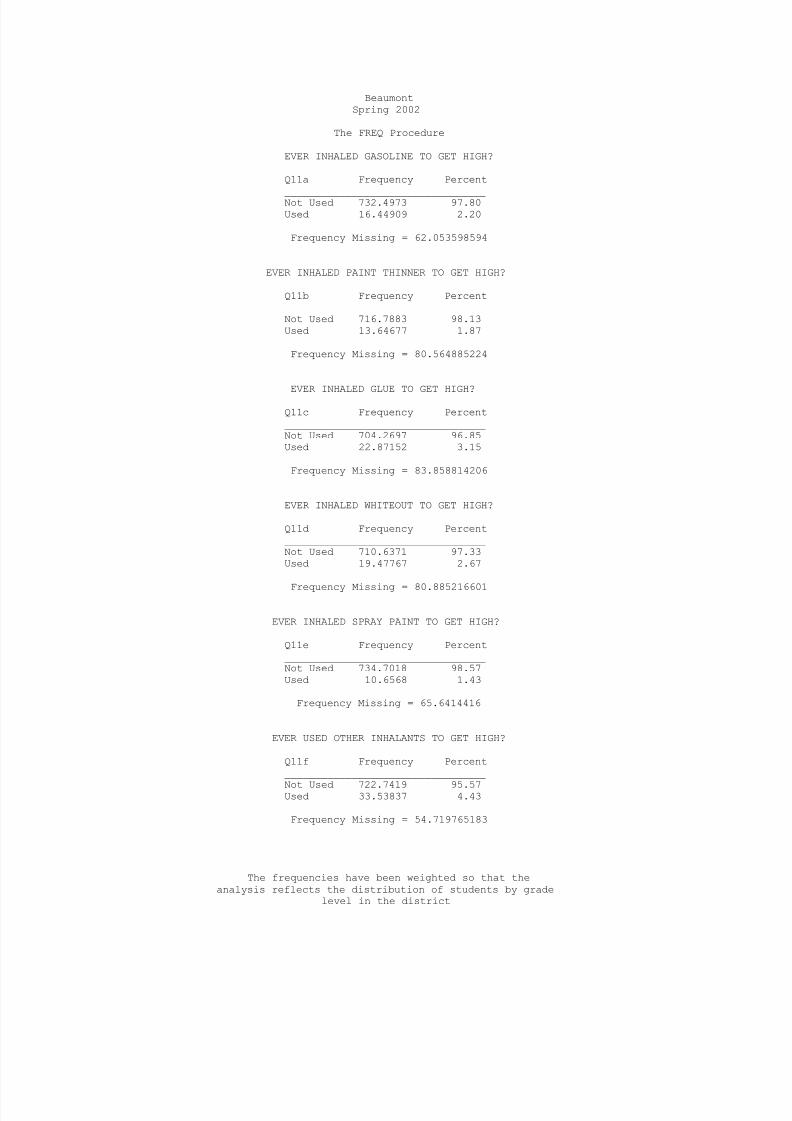
EVER INHALED GASOLINE TO GET HIGH?
Q11a Frequency Percent
_________________________________Not Used 732.4973 97.80Used 16.44909 2.20
Frequency Missing = 62.053598594
EVER INHALED PAINT THINNER TO GET HIGH?
Q11b Frequency Percent_________________________________Not Used 716.7883 98.13Used 13.64677 1.87
Frequency Missing = 80.564885224
EVER INHALED GLUE TO GET HIGH? Q11c Frequency Percent_________________________________Not Used 704.2697 96.85Used 22.87152 3.15
Frequency Missing = 83.858814206
EVER INHALED WHITEOUT TO GET HIGH?
Q11d Frequency Percent_________________________________Not Used 710.6371 97.33Used 19.47767 2.67
Frequency Missing = 80.885216601
EVER INHALED SPRAY PAINT TO GET HIGH?
Q11e Frequency Percent_________________________________Not Used 734.7018 98.57Used 10.6568 1.43
Frequency Missing = 65.6414416
EVER USED OTHER INHALANTS TO GET HIGH?
Q11f Frequency Percent_________________________________
Not Used 722.7419 95.57Used 33.53837 4.43
Frequency Missing = 54.719765183
The frequencies have been weighted so that theanalysis reflects the distribution of students by grade
level in the district
7/30/2019 2002 _ jefferson county _ beaumont isd _ 2002 texas school survey of drug and alcohol use _ elementary report
http://slidepdf.com/reader/full/2002-jefferson-county-beaumont-isd-2002-texas-school-survey-of-drug-and 30/44
BeaumontSpring 2002
The FREQ Procedure
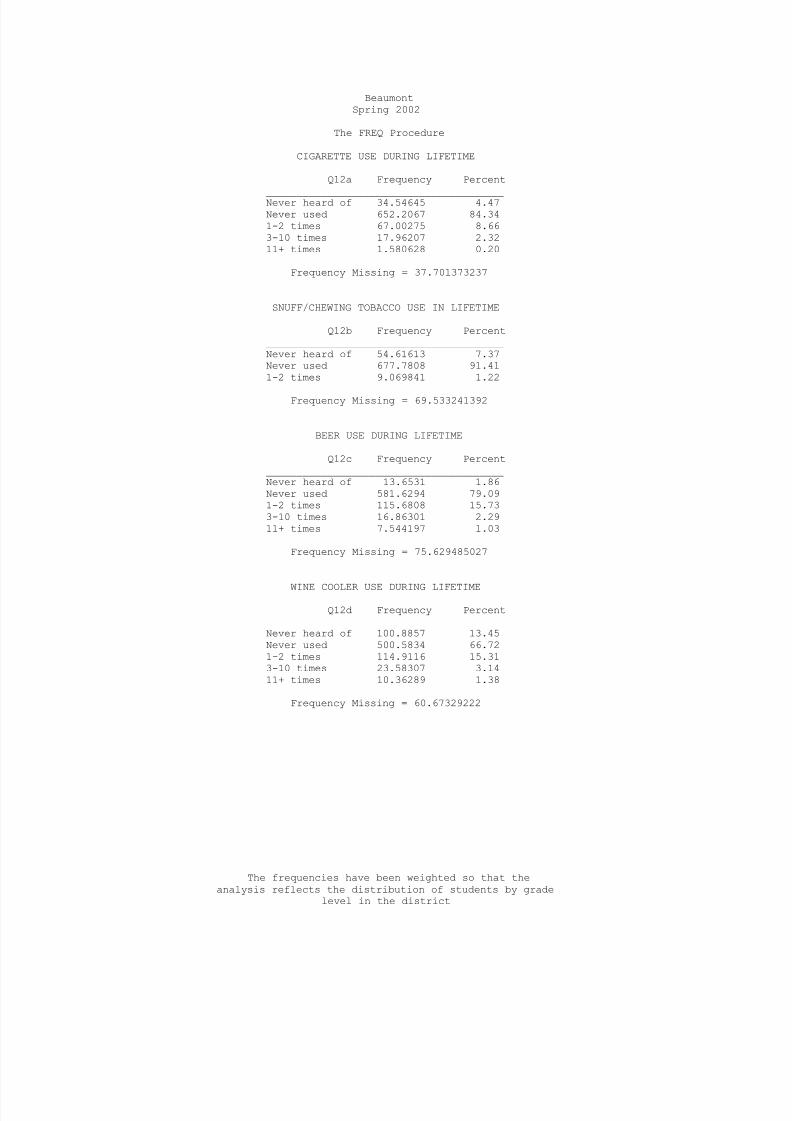
CIGARETTE USE DURING LIFETIME
Q12a Frequency Percent
_______________________________________Never heard of 34.54645 4.47Never used 652.2067 84.341-2 times 67.00275 8.663-10 times 17.96207 2.3211+ times 1.580628 0.20
Frequency Missing = 37.701373237
SNUFF/CHEWING TOBACCO USE IN LIFETIME
Q12b Frequency Percent_______________________________________Never heard of 54.61613 7.37Never used 677.7808 91.411-2 times 9.069841 1.22
Frequency Missing = 69.533241392
BEER USE DURING LIFETIME
Q12c Frequency Percent_______________________________________Never heard of 13.6531 1.86Never used 581.6294 79.091-2 times 115.6808 15.733-10 times 16.86301 2.2911+ times 7.544197 1.03
Frequency Missing = 75.629485027
WINE COOLER USE DURING LIFETIME
Q12d Frequency Percent_______________________________________Never heard of 100.8857 13.45Never used 500.5834 66.721-2 times 114.9116 15.313-10 times 23.58307 3.1411+ times 10.36289 1.38
Frequency Missing = 60.67329222
The frequencies have been weighted so that theanalysis reflects the distribution of students by grade
level in the district
7/30/2019 2002 _ jefferson county _ beaumont isd _ 2002 texas school survey of drug and alcohol use _ elementary report
http://slidepdf.com/reader/full/2002-jefferson-county-beaumont-isd-2002-texas-school-survey-of-drug-and 31/44
BeaumontSpring 2002
The FREQ Procedure
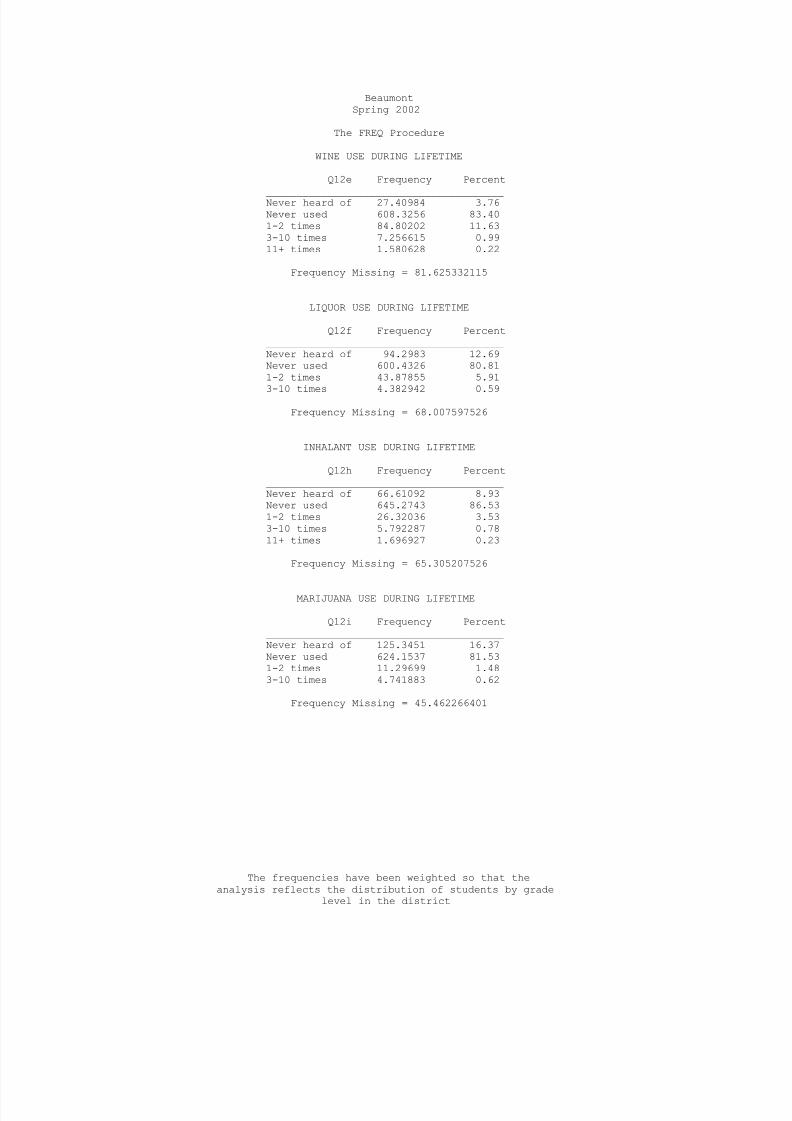
WINE USE DURING LIFETIME
Q12e Frequency Percent
_______________________________________Never heard of 27.40984 3.76Never used 608.3256 83.401-2 times 84.80202 11.633-10 times 7.256615 0.9911+ times 1.580628 0.22
Frequency Missing = 81.625332115
LIQUOR USE DURING LIFETIME
Q12f Frequency Percent_______________________________________Never heard of 94.2983 12.69Never used 600.4326 80.811-2 times 43.87855 5.91
3-10 times 4.382942 0.59
Frequency Missing = 68.007597526
INHALANT USE DURING LIFETIME
Q12h Frequency Percent_______________________________________Never heard of 66.61092 8.93Never used 645.2743 86.531-2 times 26.32036 3.533-10 times 5.792287 0.7811+ times 1.696927 0.23
Frequency Missing = 65.305207526
MARIJUANA USE DURING LIFETIME
Q12i Frequency Percent_______________________________________Never heard of 125.3451 16.37Never used 624.1537 81.531-2 times 11.29699 1.483-10 times 4.741883 0.62
Frequency Missing = 45.462266401
The frequencies have been weighted so that theanalysis reflects the distribution of students by grade
level in the district
7/30/2019 2002 _ jefferson county _ beaumont isd _ 2002 texas school survey of drug and alcohol use _ elementary report
http://slidepdf.com/reader/full/2002-jefferson-county-beaumont-isd-2002-texas-school-survey-of-drug-and 32/44
BeaumontSpring 2002
The FREQ Procedure
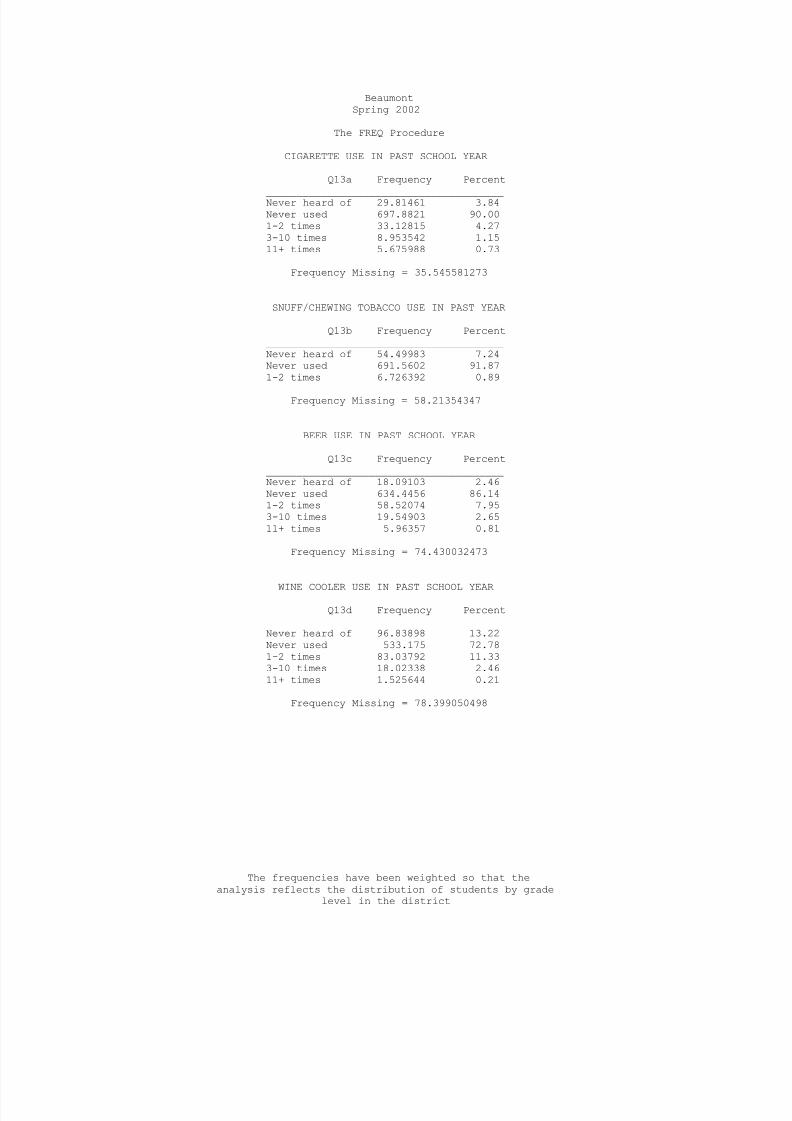
CIGARETTE USE IN PAST SCHOOL YEAR
Q13a Frequency Percent
_______________________________________Never heard of 29.81461 3.84Never used 697.8821 90.001-2 times 33.12815 4.273-10 times 8.953542 1.1511+ times 5.675988 0.73
Frequency Missing = 35.545581273
SNUFF/CHEWING TOBACCO USE IN PAST YEAR
Q13b Frequency Percent_______________________________________Never heard of 54.49983 7.24Never used 691.5602 91.871-2 times 6.726392 0.89
Frequency Missing = 58.21354347
BEER USE IN PAST SCHOOL YEAR
Q13c Frequency Percent_______________________________________Never heard of 18.09103 2.46Never used 634.4456 86.141-2 times 58.52074 7.953-10 times 19.54903 2.6511+ times 5.96357 0.81
Frequency Missing = 74.430032473
WINE COOLER USE IN PAST SCHOOL YEAR
Q13d Frequency Percent_______________________________________Never heard of 96.83898 13.22Never used 533.175 72.781-2 times 83.03792 11.333-10 times 18.02338 2.4611+ times 1.525644 0.21
Frequency Missing = 78.399050498
The frequencies have been weighted so that theanalysis reflects the distribution of students by grade
level in the district
7/30/2019 2002 _ jefferson county _ beaumont isd _ 2002 texas school survey of drug and alcohol use _ elementary report
http://slidepdf.com/reader/full/2002-jefferson-county-beaumont-isd-2002-texas-school-survey-of-drug-and 33/44
BeaumontSpring 2002
The FREQ Procedure
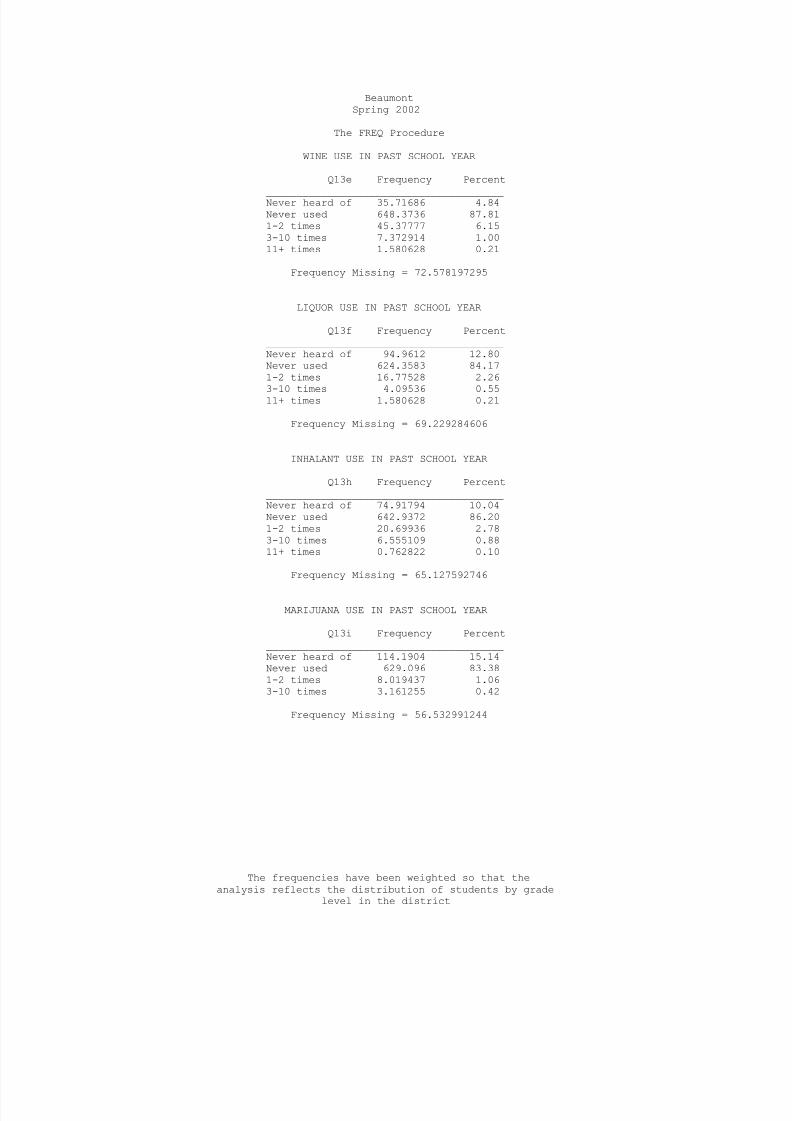
WINE USE IN PAST SCHOOL YEAR
Q13e Frequency Percent
_______________________________________Never heard of 35.71686 4.84Never used 648.3736 87.811-2 times 45.37777 6.153-10 times 7.372914 1.0011+ times 1.580628 0.21
Frequency Missing = 72.578197295
LIQUOR USE IN PAST SCHOOL YEAR
Q13f Frequency Percent_______________________________________Never heard of 94.9612 12.80Never used 624.3583 84.171-2 times 16.77528 2.26
3-10 times 4.09536 0.5511+ times 1.580628 0.21
Frequency Missing = 69.229284606
INHALANT USE IN PAST SCHOOL YEAR
Q13h Frequency Percent_______________________________________Never heard of 74.91794 10.04Never used 642.9372 86.201-2 times 20.69936 2.783-10 times 6.555109 0.8811+ times 0.762822 0.10
Frequency Missing = 65.127592746
MARIJUANA USE IN PAST SCHOOL YEAR
Q13i Frequency Percent_______________________________________Never heard of 114.1904 15.14Never used 629.096 83.381-2 times 8.019437 1.063-10 times 3.161255 0.42
Frequency Missing = 56.532991244
The frequencies have been weighted so that theanalysis reflects the distribution of students by grade
level in the district
7/30/2019 2002 _ jefferson county _ beaumont isd _ 2002 texas school survey of drug and alcohol use _ elementary report
http://slidepdf.com/reader/full/2002-jefferson-county-beaumont-isd-2002-texas-school-survey-of-drug-and 34/44
BeaumontSpring 2002
The FREQ Procedure
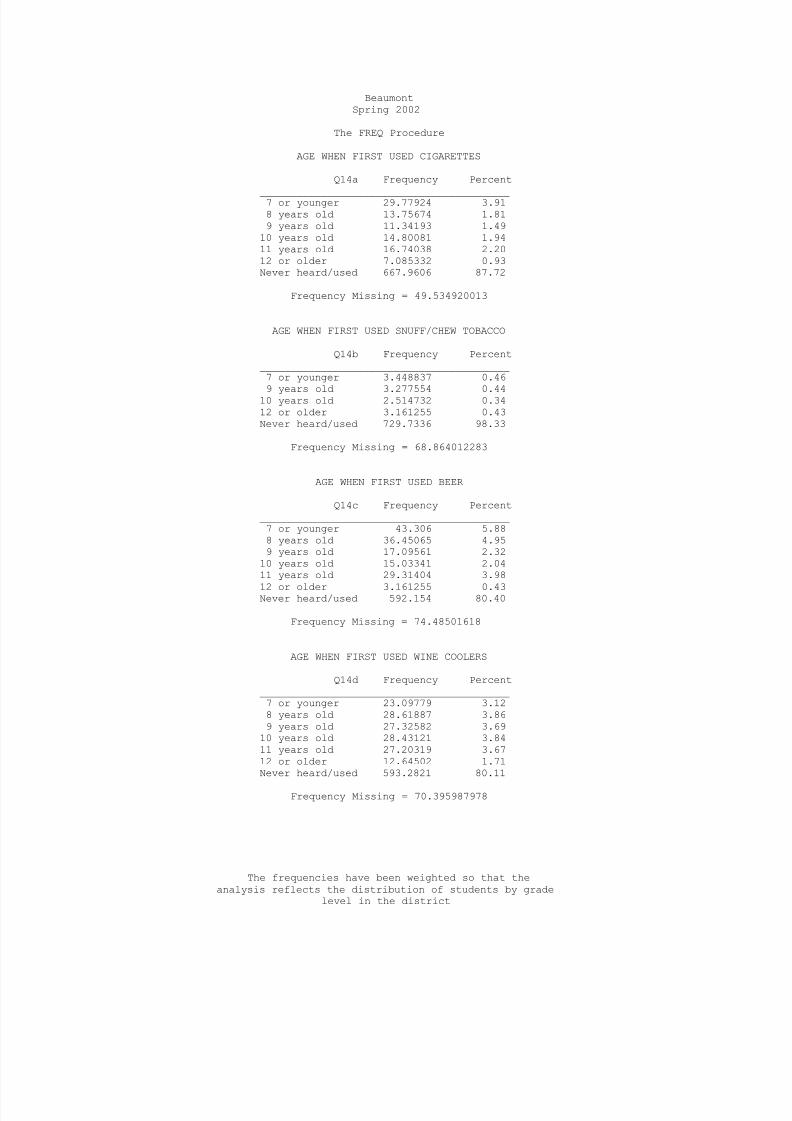
AGE WHEN FIRST USED CIGARETTES
Q14a Frequency Percent
_________________________________________7 or younger 29.77924 3.918 years old 13.75674 1.819 years old 11.34193 1.49
10 years old 14.80081 1.9411 years old 16.74038 2.2012 or older 7.085332 0.93Never heard/used 667.9606 87.72
Frequency Missing = 49.534920013
AGE WHEN FIRST USED SNUFF/CHEW TOBACCO
Q14b Frequency Percent_________________________________________7 or younger 3.448837 0.46
9 years old 3.277554 0.4410 years old 2.514732 0.3412 or older 3.161255 0.43Never heard/used 729.7336 98.33
Frequency Missing = 68.864012283
AGE WHEN FIRST USED BEER
Q14c Frequency Percent_________________________________________7 or younger 43.306 5.888 years old 36.45065 4.959 years old 17.09561 2.32
10 years old 15.03341 2.0411 years old 29.31404 3.98
12 or older 3.161255 0.43Never heard/used 592.154 80.40
Frequency Missing = 74.48501618
AGE WHEN FIRST USED WINE COOLERS
Q14d Frequency Percent_________________________________________7 or younger 23.09779 3.128 years old 28.61887 3.869 years old 27.32582 3.69
10 years old 28.43121 3.8411 years old 27.20319 3.6712 or older 12.64502 1.71Never heard/used 593.2821 80.11
Frequency Missing = 70.395987978
The frequencies have been weighted so that theanalysis reflects the distribution of students by grade
level in the district
7/30/2019 2002 _ jefferson county _ beaumont isd _ 2002 texas school survey of drug and alcohol use _ elementary report
http://slidepdf.com/reader/full/2002-jefferson-county-beaumont-isd-2002-texas-school-survey-of-drug-and 35/44
BeaumontSpring 2002
The FREQ Procedure
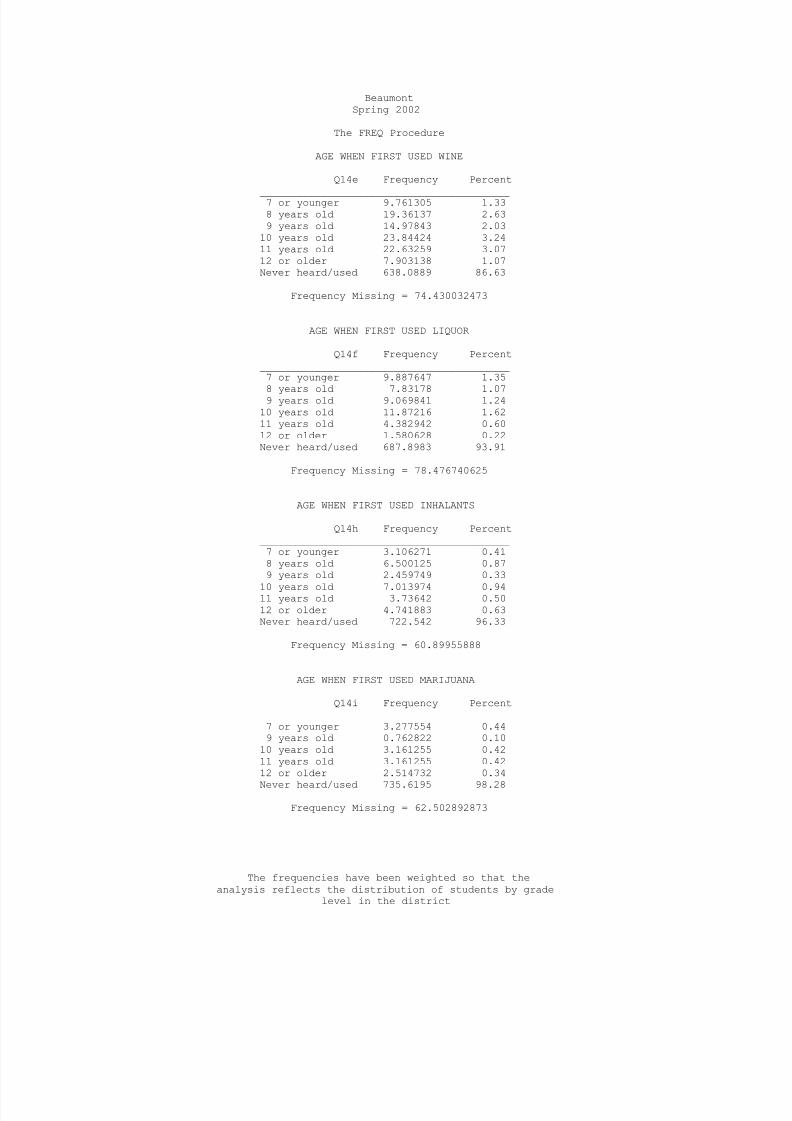
AGE WHEN FIRST USED WINE
Q14e Frequency Percent
_________________________________________7 or younger 9.761305 1.338 years old 19.36137 2.639 years old 14.97843 2.03
10 years old 23.84424 3.2411 years old 22.63259 3.0712 or older 7.903138 1.07Never heard/used 638.0889 86.63
Frequency Missing = 74.430032473
AGE WHEN FIRST USED LIQUOR
Q14f Frequency Percent_________________________________________7 or younger 9.887647 1.35
8 years old 7.83178 1.079 years old 9.069841 1.2410 years old 11.87216 1.6211 years old 4.382942 0.6012 or older 1.580628 0.22Never heard/used 687.8983 93.91
Frequency Missing = 78.476740625
AGE WHEN FIRST USED INHALANTS
Q14h Frequency Percent_________________________________________7 or younger 3.106271 0.418 years old 6.500125 0.879 years old 2.459749 0.33
10 years old 7.013974 0.9411 years old 3.73642 0.5012 or older 4.741883 0.63Never heard/used 722.542 96.33
Frequency Missing = 60.89955888
AGE WHEN FIRST USED MARIJUANA
Q14i Frequency Percent_________________________________________7 or younger 3.277554 0.449 years old 0.762822 0.10
10 years old 3.161255 0.4211 years old 3.161255 0.4212 or older 2.514732 0.34
Never heard/used 735.6195 98.28
Frequency Missing = 62.502892873
The frequencies have been weighted so that theanalysis reflects the distribution of students by grade
level in the district
7/30/2019 2002 _ jefferson county _ beaumont isd _ 2002 texas school survey of drug and alcohol use _ elementary report
http://slidepdf.com/reader/full/2002-jefferson-county-beaumont-isd-2002-texas-school-survey-of-drug-and 36/44
BeaumontSpring 2002
The FREQ Procedure
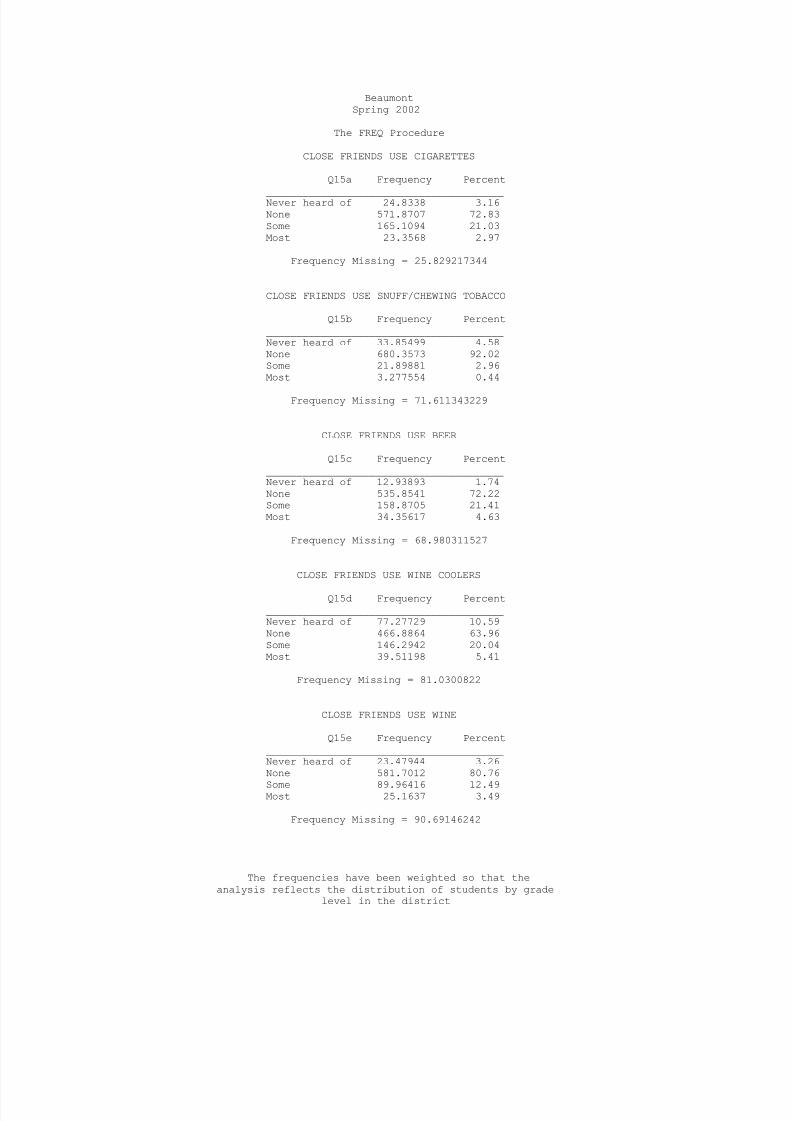
CLOSE FRIENDS USE CIGARETTES
Q15a Frequency Percent
_______________________________________Never heard of 24.8338 3.16None 571.8707 72.83Some 165.1094 21.03Most 23.3568 2.97
Frequency Missing = 25.829217344
CLOSE FRIENDS USE SNUFF/CHEWING TOBACCO
Q15b Frequency Percent_______________________________________Never heard of 33.85499 4.58None 680.3573 92.02Some 21.89881 2.96Most 3.277554 0.44
Frequency Missing = 71.611343229
CLOSE FRIENDS USE BEER
Q15c Frequency Percent_______________________________________Never heard of 12.93893 1.74None 535.8541 72.22Some 158.8705 21.41Most 34.35617 4.63
Frequency Missing = 68.980311527
CLOSE FRIENDS USE WINE COOLERS
Q15d Frequency Percent
_______________________________________Never heard of 77.27729 10.59None 466.8864 63.96Some 146.2942 20.04Most 39.51198 5.41
Frequency Missing = 81.0300822
CLOSE FRIENDS USE WINE
Q15e Frequency Percent_______________________________________Never heard of 23.47944 3.26None 581.7012 80.76
Some 89.96416 12.49Most 25.1637 3.49
Frequency Missing = 90.69146242
The frequencies have been weighted so that theanalysis reflects the distribution of students by grade
level in the district
7/30/2019 2002 _ jefferson county _ beaumont isd _ 2002 texas school survey of drug and alcohol use _ elementary report
http://slidepdf.com/reader/full/2002-jefferson-county-beaumont-isd-2002-texas-school-survey-of-drug-and 37/44
BeaumontSpring 2002
The FREQ Procedure
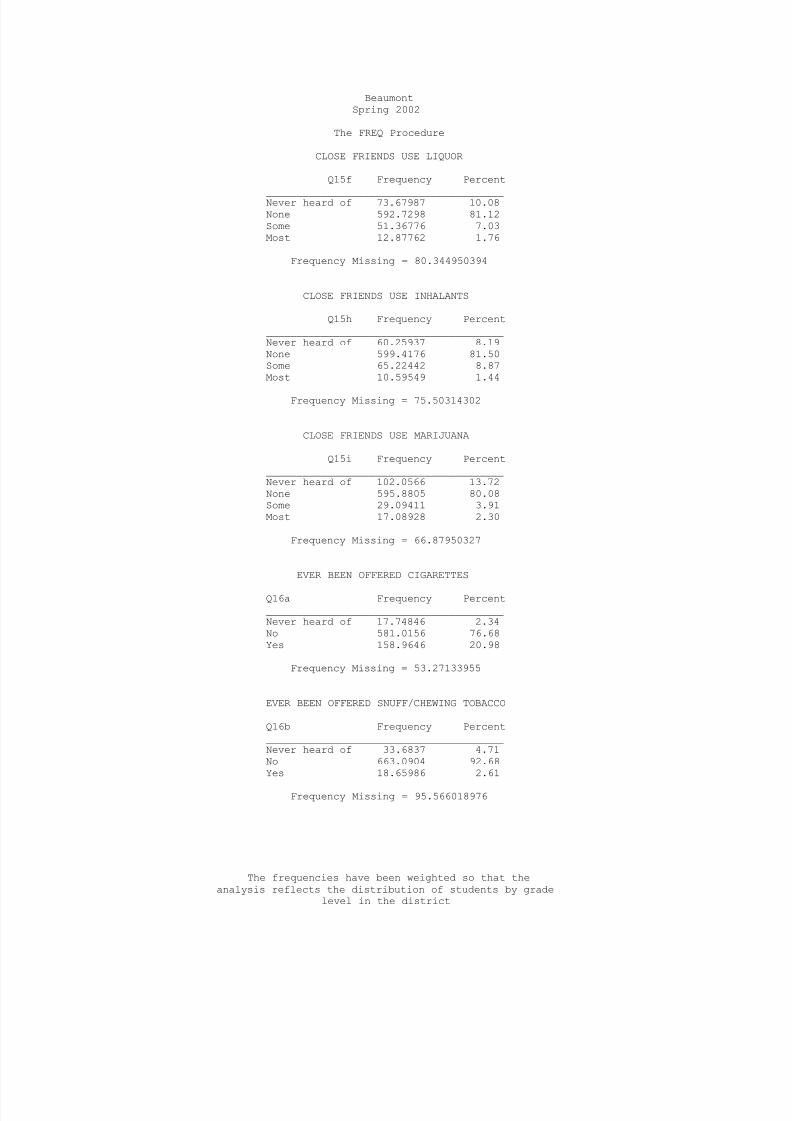
CLOSE FRIENDS USE LIQUOR
Q15f Frequency Percent
_______________________________________Never heard of 73.67987 10.08None 592.7298 81.12Some 51.36776 7.03Most 12.87762 1.76
Frequency Missing = 80.344950394
CLOSE FRIENDS USE INHALANTS
Q15h Frequency Percent_______________________________________Never heard of 60.25937 8.19None 599.4176 81.50Some 65.22442 8.87Most 10.59549 1.44
Frequency Missing = 75.50314302
CLOSE FRIENDS USE MARIJUANA
Q15i Frequency Percent_______________________________________Never heard of 102.0566 13.72None 595.8805 80.08Some 29.09411 3.91Most 17.08928 2.30
Frequency Missing = 66.87950327
EVER BEEN OFFERED CIGARETTES
Q16a Frequency Percent_______________________________________Never heard of 17.74846 2.34No 581.0156 76.68Yes 158.9646 20.98
Frequency Missing = 53.27133955
EVER BEEN OFFERED SNUFF/CHEWING TOBACCO
Q16b Frequency Percent_______________________________________Never heard of 33.6837 4.71No 663.0904 92.68Yes 18.65986 2.61
Frequency Missing = 95.566018976
The frequencies have been weighted so that theanalysis reflects the distribution of students by grade
level in the district
7/30/2019 2002 _ jefferson county _ beaumont isd _ 2002 texas school survey of drug and alcohol use _ elementary report
http://slidepdf.com/reader/full/2002-jefferson-county-beaumont-isd-2002-texas-school-survey-of-drug-and 38/44
BeaumontSpring 2002
The FREQ Procedure
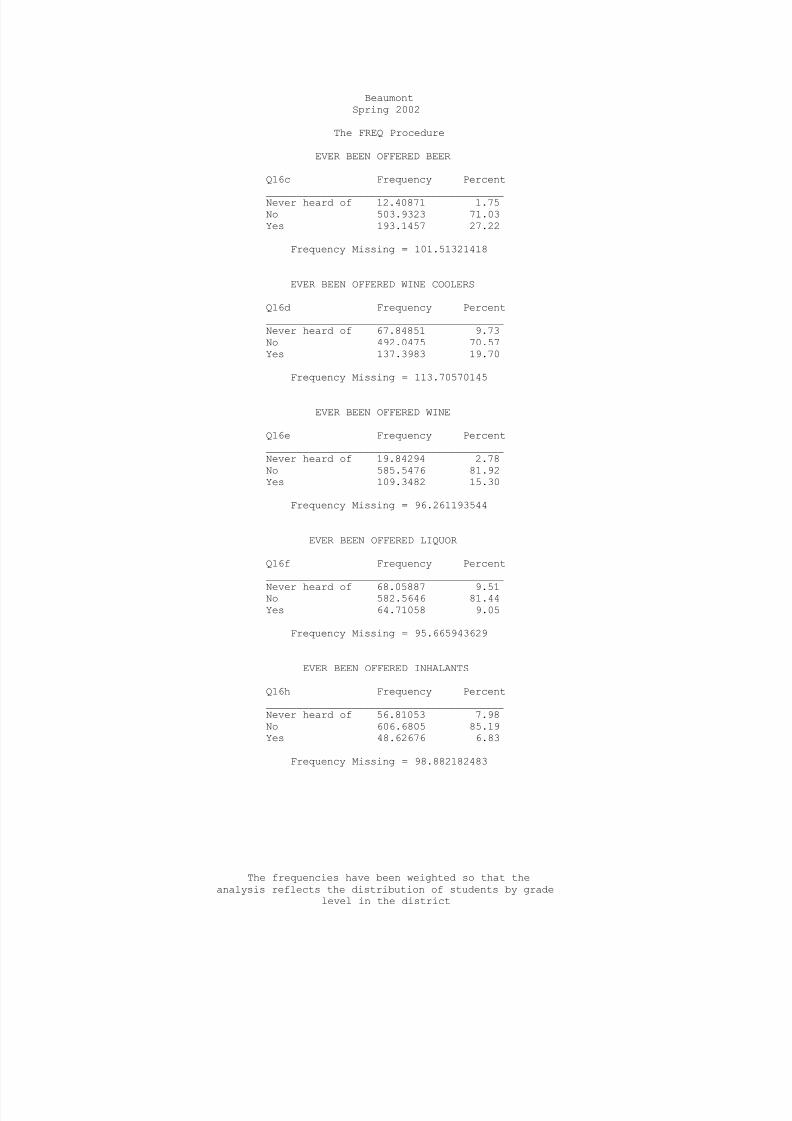
EVER BEEN OFFERED BEER
Q16c Frequency Percent
_______________________________________Never heard of 12.40871 1.75No 503.9323 71.03Yes 193.1457 27.22
Frequency Missing = 101.51321418
EVER BEEN OFFERED WINE COOLERS
Q16d Frequency Percent_______________________________________Never heard of 67.84851 9.73No 492.0475 70.57Yes 137.3983 19.70
Frequency Missing = 113.70570145
EVER BEEN OFFERED WINE
Q16e Frequency Percent_______________________________________Never heard of 19.84294 2.78No 585.5476 81.92Yes 109.3482 15.30
Frequency Missing = 96.261193544
EVER BEEN OFFERED LIQUOR
Q16f Frequency Percent_______________________________________
Never heard of 68.05887 9.51No 582.5646 81.44Yes 64.71058 9.05
Frequency Missing = 95.665943629
EVER BEEN OFFERED INHALANTS
Q16h Frequency Percent_______________________________________Never heard of 56.81053 7.98No 606.6805 85.19Yes 48.62676 6.83
Frequency Missing = 98.882182483
The frequencies have been weighted so that theanalysis reflects the distribution of students by grade
level in the district
7/30/2019 2002 _ jefferson county _ beaumont isd _ 2002 texas school survey of drug and alcohol use _ elementary report
http://slidepdf.com/reader/full/2002-jefferson-county-beaumont-isd-2002-texas-school-survey-of-drug-and 39/44
BeaumontSpring 2002
The FREQ Procedure
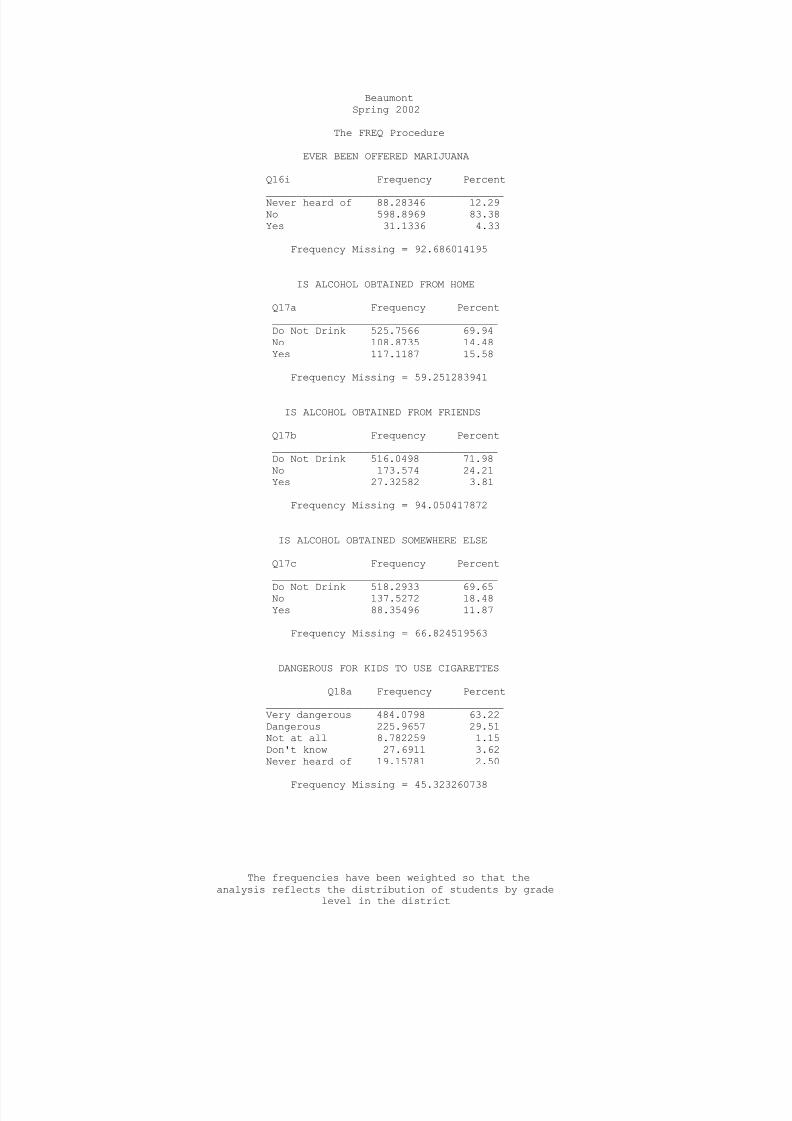
EVER BEEN OFFERED MARIJUANA
Q16i Frequency Percent
_______________________________________Never heard of 88.28346 12.29No 598.8969 83.38Yes 31.1336 4.33
Frequency Missing = 92.686014195
IS ALCOHOL OBTAINED FROM HOME
Q17a Frequency Percent_____________________________________Do Not Drink 525.7566 69.94No 108.8735 14.48Yes 117.1187 15.58
Frequency Missing = 59.251283941
IS ALCOHOL OBTAINED FROM FRIENDS
Q17b Frequency Percent_____________________________________Do Not Drink 516.0498 71.98No 173.574 24.21Yes 27.32582 3.81
Frequency Missing = 94.050417872
IS ALCOHOL OBTAINED SOMEWHERE ELSE
Q17c Frequency Percent_____________________________________
Do Not Drink 518.2933 69.65No 137.5272 18.48Yes 88.35496 11.87
Frequency Missing = 66.824519563
DANGEROUS FOR KIDS TO USE CIGARETTES
Q18a Frequency Percent_______________________________________Very dangerous 484.0798 63.22Dangerous 225.9657 29.51Not at all 8.782259 1.15Don't know 27.6911 3.62Never heard of 19.15781 2.50
Frequency Missing = 45.323260738
The frequencies have been weighted so that theanalysis reflects the distribution of students by grade
level in the district
7/30/2019 2002 _ jefferson county _ beaumont isd _ 2002 texas school survey of drug and alcohol use _ elementary report
http://slidepdf.com/reader/full/2002-jefferson-county-beaumont-isd-2002-texas-school-survey-of-drug-and 40/44
BeaumontSpring 2002
The FREQ Procedure
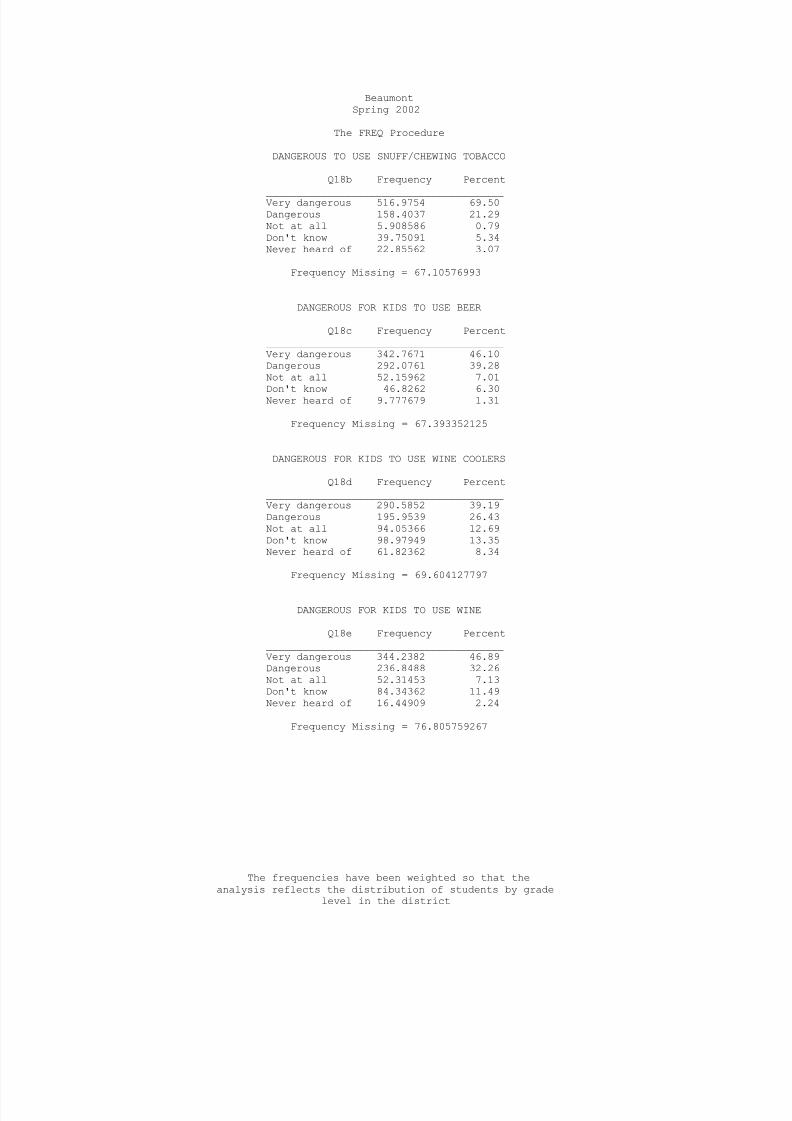
DANGEROUS TO USE SNUFF/CHEWING TOBACCO
Q18b Frequency Percent
_______________________________________Very dangerous 516.9754 69.50Dangerous 158.4037 21.29Not at all 5.908586 0.79Don't know 39.75091 5.34Never heard of 22.85562 3.07
Frequency Missing = 67.10576993
DANGEROUS FOR KIDS TO USE BEER
Q18c Frequency Percent_______________________________________Very dangerous 342.7671 46.10Dangerous 292.0761 39.28Not at all 52.15962 7.01
Don't know 46.8262 6.30Never heard of 9.777679 1.31
Frequency Missing = 67.393352125
DANGEROUS FOR KIDS TO USE WINE COOLERS
Q18d Frequency Percent_______________________________________Very dangerous 290.5852 39.19Dangerous 195.9539 26.43Not at all 94.05366 12.69Don't know 98.97949 13.35Never heard of 61.82362 8.34
Frequency Missing = 69.604127797
DANGEROUS FOR KIDS TO USE WINE
Q18e Frequency Percent_______________________________________Very dangerous 344.2382 46.89Dangerous 236.8488 32.26Not at all 52.31453 7.13Don't know 84.34362 11.49Never heard of 16.44909 2.24
Frequency Missing = 76.805759267
The frequencies have been weighted so that theanalysis reflects the distribution of students by grade
level in the district
7/30/2019 2002 _ jefferson county _ beaumont isd _ 2002 texas school survey of drug and alcohol use _ elementary report
http://slidepdf.com/reader/full/2002-jefferson-county-beaumont-isd-2002-texas-school-survey-of-drug-and 41/44
BeaumontSpring 2002
The FREQ Procedure
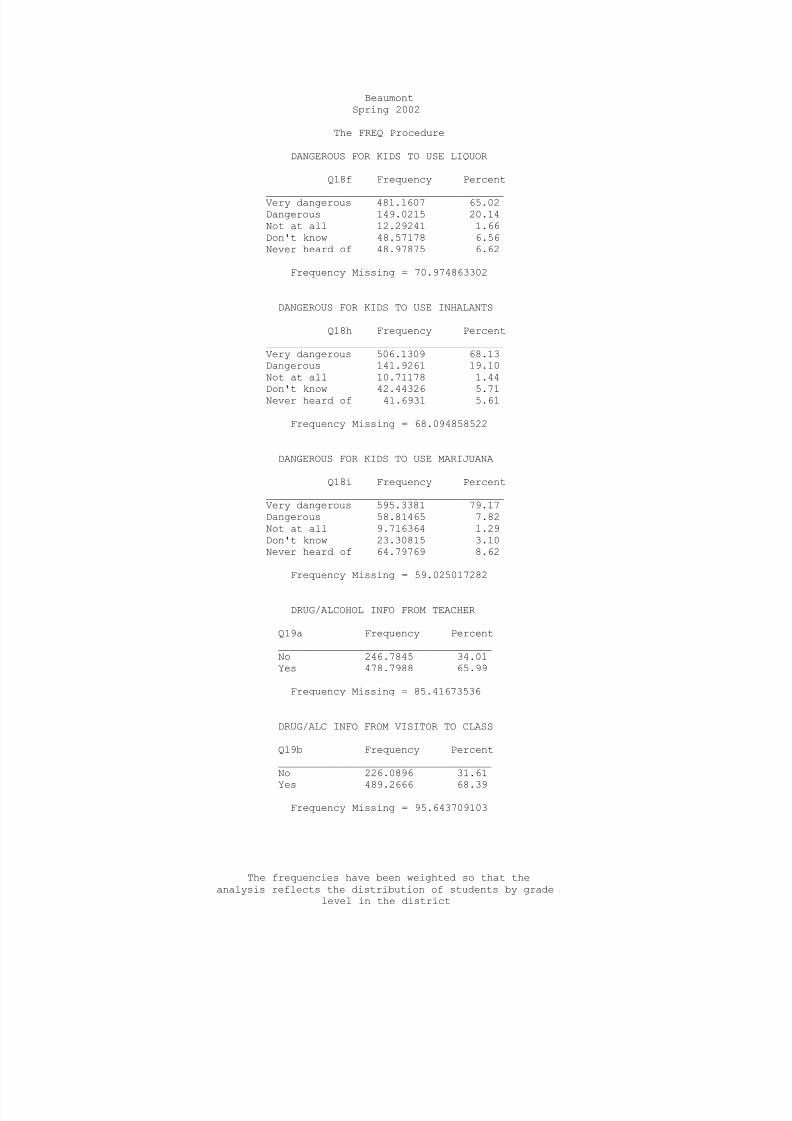
DANGEROUS FOR KIDS TO USE LIQUOR
Q18f Frequency Percent
_______________________________________Very dangerous 481.1607 65.02Dangerous 149.0215 20.14Not at all 12.29241 1.66Don't know 48.57178 6.56Never heard of 48.97875 6.62
Frequency Missing = 70.974863302
DANGEROUS FOR KIDS TO USE INHALANTS
Q18h Frequency Percent_______________________________________Very dangerous 506.1309 68.13Dangerous 141.9261 19.10Not at all 10.71178 1.44
Don't know 42.44326 5.71Never heard of 41.6931 5.61
Frequency Missing = 68.094858522
DANGEROUS FOR KIDS TO USE MARIJUANA
Q18i Frequency Percent_______________________________________Very dangerous 595.3381 79.17Dangerous 58.81465 7.82Not at all 9.716364 1.29Don't know 23.30815 3.10Never heard of 64.79769 8.62
Frequency Missing = 59.025017282
DRUG/ALCOHOL INFO FROM TEACHER
Q19a Frequency Percent___________________________________No 246.7845 34.01Yes 478.7988 65.99
Frequency Missing = 85.41673536
DRUG/ALC INFO FROM VISITOR TO CLASS
Q19b Frequency Percent___________________________________No 226.0896 31.61
Yes 489.2666 68.39
Frequency Missing = 95.643709103
The frequencies have been weighted so that theanalysis reflects the distribution of students by grade
level in the district
7/30/2019 2002 _ jefferson county _ beaumont isd _ 2002 texas school survey of drug and alcohol use _ elementary report
http://slidepdf.com/reader/full/2002-jefferson-county-beaumont-isd-2002-texas-school-survey-of-drug-and 42/44
BeaumontSpring 2002
The FREQ Procedure
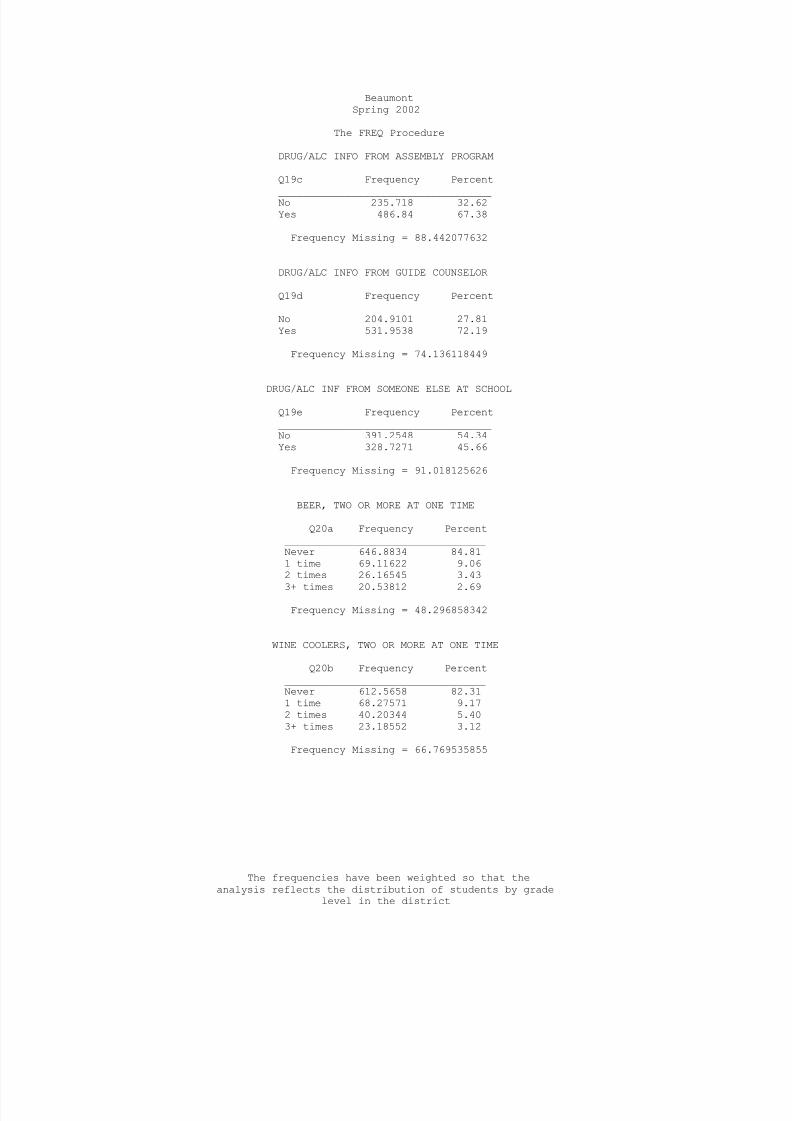
DRUG/ALC INFO FROM ASSEMBLY PROGRAM
Q19c Frequency Percent
___________________________________No 235.718 32.62Yes 486.84 67.38
Frequency Missing = 88.442077632
DRUG/ALC INFO FROM GUIDE COUNSELOR
Q19d Frequency Percent___________________________________No 204.9101 27.81Yes 531.9538 72.19
Frequency Missing = 74.136118449
DRUG/ALC INF FROM SOMEONE ELSE AT SCHOOL Q19e Frequency Percent___________________________________No 391.2548 54.34Yes 328.7271 45.66
Frequency Missing = 91.018125626
BEER, TWO OR MORE AT ONE TIME
Q20a Frequency Percent_________________________________Never 646.8834 84.811 time 69.11622 9.062 times 26.16545 3.43
3+ times 20.53812 2.69
Frequency Missing = 48.296858342
WINE COOLERS, TWO OR MORE AT ONE TIME
Q20b Frequency Percent_________________________________Never 612.5658 82.311 time 68.27571 9.172 times 40.20344 5.403+ times 23.18552 3.12
Frequency Missing = 66.769535855
The frequencies have been weighted so that theanalysis reflects the distribution of students by grade
level in the district
7/30/2019 2002 _ jefferson county _ beaumont isd _ 2002 texas school survey of drug and alcohol use _ elementary report
http://slidepdf.com/reader/full/2002-jefferson-county-beaumont-isd-2002-texas-school-survey-of-drug-and 43/44
BeaumontSpring 2002
The FREQ Procedure
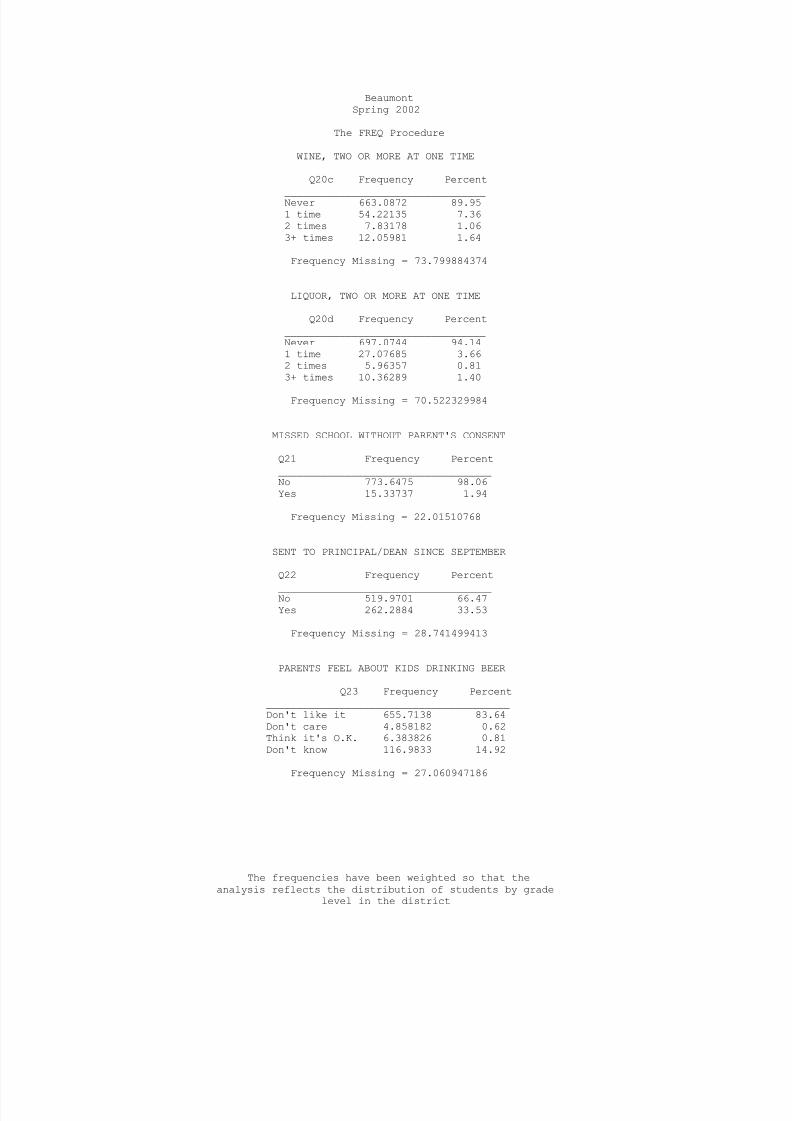
WINE, TWO OR MORE AT ONE TIME
Q20c Frequency Percent
_________________________________Never 663.0872 89.951 time 54.22135 7.362 times 7.83178 1.063+ times 12.05981 1.64
Frequency Missing = 73.799884374
LIQUOR, TWO OR MORE AT ONE TIME
Q20d Frequency Percent_________________________________Never 697.0744 94.141 time 27.07685 3.662 times 5.96357 0.813+ times 10.36289 1.40
Frequency Missing = 70.522329984
MISSED SCHOOL WITHOUT PARENT'S CONSENT
Q21 Frequency Percent___________________________________No 773.6475 98.06Yes 15.33737 1.94
Frequency Missing = 22.01510768
SENT TO PRINCIPAL/DEAN SINCE SEPTEMBER
Q22 Frequency Percent
___________________________________No 519.9701 66.47Yes 262.2884 33.53
Frequency Missing = 28.741499413
PARENTS FEEL ABOUT KIDS DRINKING BEER
Q23 Frequency Percent________________________________________Don't like it 655.7138 83.64Don't care 4.858182 0.62Think it's O.K. 6.383826 0.81Don't know 116.9833 14.92
Frequency Missing = 27.060947186
The frequencies have been weighted so that theanalysis reflects the distribution of students by grade
level in the district
7/30/2019 2002 _ jefferson county _ beaumont isd _ 2002 texas school survey of drug and alcohol use _ elementary report
http://slidepdf.com/reader/full/2002-jefferson-county-beaumont-isd-2002-texas-school-survey-of-drug-and 44/44
BeaumontSpring 2002
The FREQ Procedure
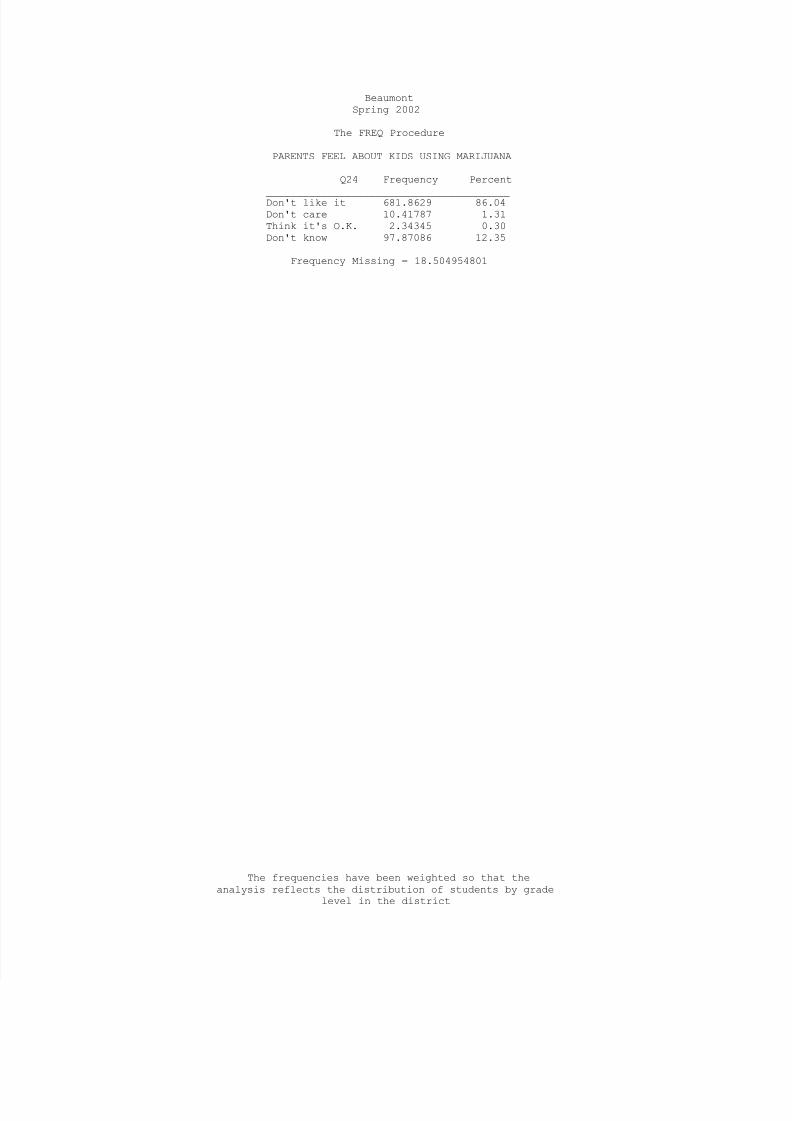
PARENTS FEEL ABOUT KIDS USING MARIJUANA
Q24 Frequency Percent
________________________________________Don't like it 681.8629 86.04Don't care 10.41787 1.31Think it's O.K. 2.34345 0.30Don't know 97.87086 12.35
Frequency Missing = 18.504954801
The frequencies have been weighted so that the