2003-2004 comprehensive annual financial report
TRANSCRIPT
Annual Financial Report
2003-2004
City of Palo Alto, California
Fiscal Year Ended June 30, 2004
Comprehensive

This page is intentionally left blank.
●●●●●●●●●●●●●●●●●●●●●●●●●●●●●●●●●●●●●●●●●●●●●●●●●●●●●●●●●●●●●●●●●●●●●●●●●●●●●●●●●●●●●●●●●●●●●●●●●●●●●●●●●●●●●●●●●●●●●●●●●●●●●●●●●●●
●●●●●●●●●●●●●●●●●●●●●●●●●●●●●●●●●●●●●●●●●●●●●●●●●●●●●●●●●●●●●●●●●●●●●●●●●●●●●●●●●●●●●●●●●●●●●●●●●●●●●●●●●●●●●●●●●●●●●●
City of Palo AltoCalifornia
Comprehensive Annual Financial
Report
For the fiscal year endedJune 30, 2004Prepared by: Administrative Services Department

This page is intentionally left blank.
Table of Contents
Table of Contents…………………………………
INTRODUCTION Letter of Transmittal .............................................................................................................. v City Officials ......................................................................................................................... ix Organizational Structure ........................................................................................................ x Administrative Services Department Organization .............................................................. xi GFOA Certificate of Achievement for Excellence in Financial Reporting ......................... xii CSMFO Certificate of Award for Outstanding Financial Reporting ................................. xiii
FINANCIAL SECTION Independent Auditor’s Report on Basic Financial Statements ......................................……xv
M D & A Management’s Discussion and Analysis................................................................................. 1
BASIC FINANCIAL STATEMENTS
Citywide Financial Statements Statement of Net Assets .............................................................................................. 21 Statement of Activities ................................................................................................ 24
Fund Financial Statements
Major Governmental Funds: Balance Sheet........................................................................................................... .. 27 Reconciliation of Fund Balances to Governmental Activities Net Assets............... .. 28 Statement of Revenues, Expenditures, and Changes in Fund Balance ..................... 29 Reconciliation of the Statement of Revenues, Expenditures and Changes in Fund Balances of Governmental Funds to the Statement of Activities................ 30 Statement of Revenues, Expenditures, and Changes in Fund Balances – Budget and Actual: ..................................................................................................... 31 Housing In-Lieu Special Revenue Fund, Statement of Revenues, Expenditures and Changes in Fund Balance – Budget and Actual.................................................. 32
……….……………………………………………………………………………………………. City of Palo Alto i
Table of Contents
BASIC FINANCIAL STATEMENTS (Continued)
Major Proprietary Funds:
Statement of Net Assets ........................................................................................34 Statements of Revenues, Expenses and Changes in Net Assets ...........................36 Statement of Cash Flows.......................................................................................38
Fiduciary Funds:
Statement of Fiduciary Net Assets ........................................................................43
NOTES TO FINANCIAL STATEMENTS
Index to the Notes to the Financial Statements ...................................................45 Notes to Basic Financial Statements .....................................................................47
SUPPLEMENTAL INFORMATION
Non-major Governmental Funds
Combining Balance Sheets ....................................................................................98 Combining Statements of Revenues, Expenditures, and Changes in Fund Balances........................................................................... 102 Combining Schedule of Revenues, Expenditures, and Changes in Fund Balance—Budget and Actual.................................................................. 106
Internal Service Funds
Combining Statements of Net Assets ................................................................. 114 Combining Statements of Revenues, Expenses and Changes in Net Assets...... 115 Combining Statements of Cash Flows................................................................ 116
Fiduciary Funds
Statement of Changes in Assets and Liabilities – All Agency Funds.................. 118
………………………………………………………………………………………………… ii City of Palo Alto

Table of Contents
STATISTICAL SECTION General Governmental Revenues by Source - Last Ten Fiscal Years..................... 121 General Governmental Expenditures by Function - Last Ten Fiscal Years ........... 122 General Fund Tax Revenues by Source – Last Ten Fiscal Years ........................... 123 Property Tax Levies and Collections - Last Ten Fiscal Years ................................. 124 Assessed Value of Taxable Property - Last Ten Fiscal Years .................................. 125 Property Tax Rates - All Overlapping Governments -Last Ten Fiscal Years ............................................................................................. 126 Taxable Transactions by Type of Business – Last Ten Fiscal Years and Sales Tax Rates................................................................................................ 127 Special Assessment Billings and Collections – Last Ten Fiscal Years ................... 128 Ratio of Net Certificates of Participation Bonded Debt to Assessed Value and Net Certificates of Participation Bonded Debt per Capita – Last Ten Fiscal Years.............................................................................................. 129 Computation of Legal Debt Margin ...................................................................... 130 Computation of Direct and Overlapping Bonded Debt ....................................... 131 Ratio of Annual Debt Service Expenditures for General Bonded Debt to Total General Expenditures – Last Ten Fiscal Years................................ 132 Revenue Bond Coverage - Water, Electric, Gas, Wastewater Collection, Wastewater Treatment, Storm Drainage Funds and External Service Funds – Last Ten Fiscal Years.............................................................................................. 133 Demographic Statistics - Last Ten Fiscal Years ...................................................... 134 Construction Activity - Last Ten Fiscal Years ........................................................ 135 Insurance Coverage................................................................................................ 136 Top Ten Property Taxpayers.................................................................................. 137 Miscellaneous Statistics.......................................................................................... 138
……….……………………………………………………………………………………………. City of Palo Alto iii
Table of Contents
SINGLE AUDIT SECTION Summary of Findings and Questioned Costs........................................................ 143 Schedule of Expenditures of Federal Awards........................................................ 145 Notes to the Schedule of Expenditures of Federal Awards................................... 147 Report on Compliance and on Internal Control Over Financial Reporting Based on an Audit of Financial Statements Performed in Accordance with Government Auditing Standards .................................................................. 149
Report on Compliance and Internal Control Over Compliance Applicable to Each Major
Federal Award Program......................................................................................... 150
………………………………………………………………………………………………… iv City of Palo Alto

Introduction

This page is intentionally left blank.

Introduction
City of Palo Alto Office of the City Manager
Transmittal Letter………………………………… December 14, 2004
THE HONORABLE CITY COUNCIL
Palo Alto, California Attention: Finance Committee
COMPREHENSIVE ANNUAL FINANCIAL REPORT
YEAR ENDED JUNE 30, 2004
Members of the Council and Citizens of Palo Alto: Transmittal: The Comprehensive Annual Financial Report (CAFR) for the fiscal year ended June 30, 2004, is submitted for Council review in accordance with Article IV, Section 13 of the City of Palo Alto Charter and published as a matter of public record for interested citizens. This transmittal letter provides information regarding the economy and the governing structure in Palo Alto. An overview of the City’s financial activities for the fiscal year is discussed in detail in the Management’s Discussion and Analysis section of the CAFR. While the independent auditor has expressed an opinion on the financial statements contained in this report, management takes sole responsibility for the contents of the CAFR. To the best of its knowledge, staff believes the CAFR information is accurate in all material respects.
INDEPENDENT AUDIT
The City of Palo Alto’s financial statements have been audited by Maze and Associates, a firm of licensed certified public accountants. The goal of the audit is to obtain reasonable assurance that the financial statements are free of material misstatement. Maze and Associates concluded, based on the audit, that there was a reasonable basis for rendering an unqualified opinion for the fiscal year ended June 30, 2004, and that the financial statements are fairly presented in conformity with generally accepted accounting principals (GAAP). The independent auditor’s report is presented as the first component of the financial section of this report. In addition, Maze and Associates also conducts the federally mandated “Single Audit” designed to meet the special needs of federal grantor agencies. The standards governing the Single Audit require the independent auditor to report on the fair presentation of the financial statements, government’s internal controls and compliance with legal requirements. These reports are available in the Single Audit section of the CAFR.
……….……………………………………………………………………………………………. City of Palo Alto v
Introduction
THE PALO ALTO ECONOMY
Local Trends: The City of Palo Alto, population 60,246, is a largely “built-out” community in the heart of Silicon Valley and the greater San Francisco and San Jose areas. The adjacent Stanford University, one of the premier institutions of higher education in the nation, has produced much of the talent that founded many successful high-tech companies in Palo Alto and Silicon Valley. With varied and relatively stable employers such as Stanford University, the Stanford Medical Center, the Palo Alto Medical Foundation, the Palo Alto Unified School District, and businesses such as the Stanford Shopping Center, Hewlett-Packard/Compaq, and Roche Pharmaceuticals; Palo Alto has enjoyed a diverse employment and revenue base. The City, however, was not immune from the pervasive economic downturn that began in January 2001. This downturn, manifested by layoffs in the technology sector, lack of capital investment, curtailed venture capital activity, and weaker consumer spending persisted into 2003-04. While unemployment rates soared in Santa Clara County and in Palo Alto, economically sensitive revenue sources such as sales and transient occupancy tax revenues declined. Since January 2001, the City has engaged in a series of “Strengthening the Bottom Line” efforts whereby expenses were brought into alignment with available revenues. Because of its budget discipline, the City is fortunate to report that it has not relied on General Fund reserves to meet its commitments. Toward the latter part of 2003-04, the economic downturn appears to have abated somewhat. Sales and transient occupancy tax revenues appeared to have stopped declining and county and local unemployment levels decreased. While these are positive signs, they do not provide evidence of a resurgent local economy. In fact, State financial difficulties causing local revenue “take-backs,” strong competition from neighboring City retail outlets, high commercial vacancy rates, rising employee benefit costs, and higher oil prices make it unlikely the Palo Alto economy will improve dramatically in the near future. As a consequence of continued pressure on revenue sources, the City anticipates taking additional measures to control expenditures in the next year. Employment Trends: Palo Alto is home to a strong mix of large, medium and small firms. The number of jobs in Palo Alto total around 100,000. With a local workforce somewhat over 35,000, commuters hold almost two-thirds of Palo Alto jobs. Palo Alto employment opportunities are much sought after and include: education at Stanford University, high technology at the Stanford Research Park, and health care at two medical facilities of national stature. Numerous institutions that have more than 1,000 employees include: the University, the Veterans Affairs Palo Health Care facility, the Medical Foundation, Agilent Technologies, Hewlett Packard/Compaq, and the City of Palo Alto.
Even with this employment base, Palo Alto’s unemployment rate increased from 2.3 percent in 2000 to 4.4 percent in July 2003. During the same period, the Santa Clara County unemployment rate went from 2.0 percent to 8.4 percent. Layoffs occurred at technology firms such as Agilent, Apple, Sun Microsystems, Oracle, Hewlett Packard/Compaq and other businesses. The trend of outsourcing high-paying technology jobs to India and China is also of growing concern. Being a regional destination point because of its vibrant downtown and state of the art Shopping Center, Palo Alto’s economy and revenues were adversely affected by lost jobs. Some improvement in the employment picture was seen in late 2003-04 as unemployment rates in the City and County fell to 3.2 percent and 6.3 percent, respectively. Real Estate Market: Assessed property valuation in Santa Clara County experienced an anemic growth rate of 2.28 percent in 2003-04. This was the slowest rate of growth in the last decade. A significant decline in real estate values occurred in office buildings, industrial property, and research and development campuses. Residential property remained relatively stable. In Palo Alto actual secured property receipts came in 2.5 percent over 2002-03 levels, but unsecured receipts (based on machinery, equipment and computers) fell by 13.2 percent. Secured valuations in Palo Alto for 2004-…………………………………………………………………………………………………
City of Palo Alto vi

Introduction
05 will improve, primarily as a consequence of a long-term lease transaction for the Stanford Shopping Center. Cash and Investments: The City of Palo Alto invests funds prudently and has adopted an investment policy as prescribed by State law that restricts the City to investments emphasizing , in the following priority order: safety, liquidity and yield. Staff provides a quarterly report of investments for Council and Finance Committee review. The City’s investment practice is to buy securities and hold them to maturity to avoid potential losses from a sale. During 2003-04, staff complied with all aspects of the investment policy.
THE PALO ALTO GOVERNMENT
As a charter city delivering a full range of municipal services and public utilities under the council-manager form of government, Palo Alto offers an outstanding quality of life for its residents. The independent Palo Alto Unified School District (PAUSD) has achieved state and national recognition for the excellence of its programs. The City has dedicated 4,000 acres of open space to parks and wildlife preserves. Public facilities include five libraries, four community centers, a cultural arts center, adult and children’s theater, a junior museum and zoo, and a golf course. The City provides a diversity of human services for seniors and youths, an extensive continuing education program, concerts, exhibits, team sports and special events. City Council: The Council consists of nine members elected at-large for four-year, staggered terms. At the first meeting of each calendar year, the Council elects a Mayor and Vice-Mayor from its membership, with the Mayor having the duty of presiding over Council meetings. The Council is the appointing authority for the City Manager and three other officials, the City Attorney, City Clerk, and City Auditor, who all report directly to it. Finance Committee: While retaining the authority to approve all actions, the City Council has established a subcommittee to review financial matters. Staff provides the CAFR, the results of external and internal audits, periodic budget-versus-actual, investment and performance measure reports to the Finance Committee and Council to assist in their evaluation of the City’s financial performance. City Manager: The City Manager directs administrative services, human resources, public works, planning and community environment, public safety, community services departments and also the municipal electric, water, gas, wastewater collection, wastewater treatment, storm drainage, and refuse utilities (the utilities represent almost two-thirds of the City’s revenues).
……….……………………………………………………………………………………………. City of Palo Alto vii

Introduction
SUMMARY
Awards: During the past year, the City received two awards for the prior fiscal year CAFR, one from the Government Finance Officers Association (GFOA) for “excellence in financial reporting” and one from the California Society of Municipal Finance Officers (CSMFO) for “outstanding financial reporting”. This is the tenth consecutive year the City has received both of these awards and the current certificates appear immediately after the end of this transmittal letter. The 2003-04 CAFR also has been submitted to the GFOA and CSMFO award programs and management believes that, once again, it will meet the criteria for these distinguished financial reporting awards. Acknowledgment: This CAFR reflects the hard work, talent and commitment of the staff members of the Administrative Services Department. This document could not have been accomplished without their efforts and each contributor deserves sincere appreciation. Management wishes to acknowledge the support of Trudy Eikenberry, Accounting Manager, and the Senior Accountants, Staff Accountants, and Accounting Specialists for the high level of professionalism and dedication they bring to the City of Palo Alto. Management would also like to express its appreciation to Maze & Associates, the City’s independent auditors, who assisted and contributed to the preparation of this Comprehensive Annual Financial Report. Special acknowledgment must be given to the City Council Finance Committee for its support and interest in directing the financial affairs of the City in a responsible, professional and progressive manner. Respectfully submitted,
CARL YEATS, FRANK BENEST, Administrative Services Director City Manager
………………………………………………………………………………………………… City of Palo Alto viii

Introduction
City of Palo Alto City Officials ………………..
Victor OjakianHillary Freeman
Yoriko Kishimoto
Jack Morton
City Council
Bern Beecham, Mayor Jim Burch, Vice-Mayor
Dena Mossar Judy Kleinberg LaDoris Cordell
Policy and Services CommitteeYoriko Kishimoto, Chair
Jim Burch LaDoris Cordell
Jack Morton
Finance Committee Judy Kleinberg, Chair
Hillary Freeman Dena Mossar Vic Ojakian
Council-Appointed Officers
City Manager Frank Benest
City Attorney Gary Baum
City Clerk
Donna Rogers
City Auditor Sharon Winslow Erickson
……….……………………………………………………………………………………………. City of Palo Alto ix
Introduction
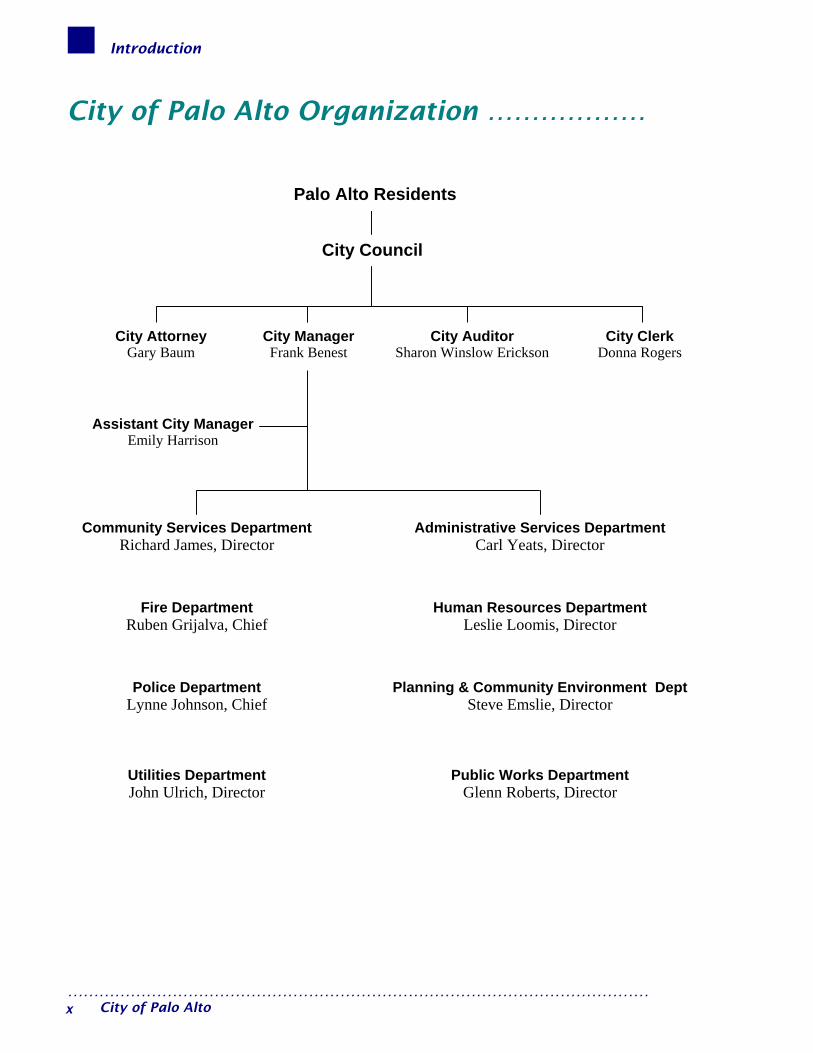
City of Palo Alto Organization ………………
Community Services Department Richard James, Director
City Clerk Donna Rogers
Assistant City Manager Emily Harrison
City Attorney Gary Baum
City Manager Frank Benest
City Auditor Sharon Winslow Erickson
City Council
Palo Alto Residents
Administrative Services Department Carl Yeats, Director
Fire Department Ruben Grijalva, Chief
Human Resources Department Leslie Loomis, Director
Police Department Lynne Johnson, Chief
Planning & Community Environment DeptSteve Emslie, Director
Utilities Department John Ulrich, Director
Public Works Department Glenn Roberts, Director
………………………………………………………………………………………………… City of Palo Alto x

Introduction
Administrative Services Organization ………
Administrative Services Department
Money Management DivisionAdministrative Division
Financial Support Services Division Financial Planning & Analysis Division
Information Technology Division Property Management Division
Mission Statement
To provide proactive administrative and technical support to City departments and decision makers, and to safeguard and
facilitate the optimal use of City resources.
……….……………………………………………………………………………………………. City of Palo Alto xi

Introduction
Government Finance Officers Association of the United States and Canada – Award …….
………………………………………………………………………………………………… City of Palo Alto xii
Introduction
California Society of Municipal Finance Officers – Award …………………………………
……….……………………………………………………………………………………………. City of Palo Alto xiii

Introduction
This page is intentionally left blank.
………………………………………………………………………………………………… City of Palo Alto xiv

Financial Section

This page is intentionally left blank.

This page is intentionally left blank.

Management’s Discussion & Analysis

This page is intentionally left blank.

Management Discussion and Analysis
Management’s Discussion and Analysis With the 2003-04 Comprehensive Annual Financial Report (CAFR), the City will have implemented the provisions of Government Accounting Standards Board Statement 34 (GASB 34), “Basic Financial Statements—and Management’s Discussion & Analysis—for State and Local Governments” for three consecutive years. GASB 34 required municipalities to make fundamental changes in accounting and reporting in an effort to make government financial performance clearer and more understandable to readers. GASB 34 has required the City to make substantial changes to its financial statement format. Moreover, the City must provide more detailed discussion and analysis of its financial activities, particularly in comparing results to the prior fiscal year and to the 2003-04 fiscal year budget. Other required changes will be described in the financial statements below. To obtain a complete picture of the City’s financial condition, this document should be read in conjunction with the accompanying Transmittal Letter and Basic Financial Statements.
OVERVIEW OF THE COMPREHENSIVE ANNUAL FINANCIAL REPORT The CAFR is presented in six sections:
An introductory section which includes the Transmittal Letter and general information;
Management’s Discussion and Analysis;
The Basic Financial Statements which include the Citywide and Fund Financial Statements, along with the Notes to these statements;
Supplemental Information;
Statistical information; and
Single Audit
Basic Financial Statements The Basic Financial Statements contain the Citywide Financial Statements and the Fund Financial Statements. These statements provide long and short-term views of the City’s financial activities and financial position. The Citywide Financial Statements provide a longer-term view of the City’s activities as a whole. They include the Statement of Net Assets and the Statement of Activities. The Statement of Net Assets includes the City’s capital assets and long-term liabilities on a full accrual basis of accounting similar to that used by private-sector companies. The Statement of Activities provides information about the City’s revenues and expenses on a full accrual basis, with an emphasis on measuring net revenues or expenses for each of the City’s programs. The Statement of Activities explains in detail the change in net assets for the year. The amounts in the Statement of Net Assets and the Statement of Activities are separated into Governmental and Business-type Activities in order to provide a summary of these activities for the City.
………………………………………………………………………………………………………………………… City of Palo Alto 1
Management Discussion and Analysis
The Fund Financial Statements display the City’s operations in more detail than the Citywide statements. They focus primarily on the short-term activities of the City’s General Fund and other major funds such as the Capital Projects Fund, Housing In-Lieu Fund, Water Services Fund, Electric Services Fund, Gas Services Fund, Wastewater Collection Fund, Wastewater Treatment Fund, Refuse Services Fund, Storm Drainage Services Fund and External Services Fund. For certain entities and funds, the City acts solely as a depository agent. For example, the City has several Assessment Districts for which it provides fiduciary statements showing the cash balances and activities of these districts. These statements are separate from, and their balances are excluded from, the City’s financial statements. Together, all these statements are called Basic Financial Statements.
Citywide Financial Statements Governmental Activities - All of the City’s basic services are considered to be governmental activities. These include the City Council, City Manager, City Attorney, City Clerk, City Auditor, Administrative Services, Human Resources, Public Works, Planning and Community Development, Police, Fire, Community Services, and non-departmental services. These services are supported by general City revenues such as taxes and by specific program revenues such as fees. The City’s governmental activities include the activities of the Palo Alto Public Improvement Corporation and Redevelopment Agency, separate legal entities financially accountable to the City. Business-Type Activities - All of the City’s enterprise activities are reported here, including Water, Electric, Gas, Wastewater Collection, Wastewater Treatment, Refuse, Storm Drainage, and External services. Unlike governmental services, these services are supported by charges paid by users based on services used. Citywide Financial Statements are prepared on the accrual basis of accounting, which means they measure the flow of all economic resources of the City as a whole.
Fund Financial Statements The Fund Financial Statements provide detailed information about each of the City’s most significant funds, called Major Funds. The concept of Major Funds, and the determination of which are Major Funds, was established by GASB 34 and replaces the concept of combining like funds and presenting them in total. Instead, each Major Fund is presented individually, with all Non-major Funds combined in a single column on each fund statement. Subordinate schedules present the detail of these Non-major Funds. Major Funds present the major activities of the City for the year. The General Fund is always a Major Fund, but other funds may change from year to year as a result of changes in the pattern of City activities. Fund Financial Statements include Governmental, Enterprise and Internal Service Funds. Governmental Fund financial statements are prepared on the modified accrual basis of accounting, which means they measure only current financial resources and uses. Capital assets and other long-lived assets, along with long-term liabilities, are presented only in the Citywide Financial
………………………………………………………………………………………………………………………… 2 City of Palo Alto
Management Discussion and Analysis
Statements. In 2003-04, the City has three Major Governmental Funds, the General Fund, Housing In-Lieu Fund and the Capital Projects Fund. Enterprise and Internal Service Fund financial statements are prepared on the full accrual basis of accounting, as in the past, and include all their assets and liabilities, current and long-term. Since the City’s Internal Service Funds provide goods and services only to the City’s Governmental and Business-type activities, their activities are reported only in total at the Fund level. Internal Service Funds, such as Printing and Mailing services, may not be considered Major Funds because their revenues are derived from other City Funds. These revenues are eliminated in the Citywide Financial Statements and any related profits or losses are returned to the activities that created them, along with any residual net assets of the Internal Service Funds. Comparisons of Budget and Actual financial information are presented only for the General Fund and any Major Special Revenue Funds.
Fiduciary Statements The City is the agent for certain assessment districts, holding amounts collected from property owners which await transfer to these Districts’ bond trustees. The City’s fiduciary activities are reported in the separate Statements of Fiduciary Net Assets and the Agency Funds Statement of Changes in Assets and Liabilities. These activities are excluded from the City’s other financial statements because the City cannot use these assets to finance its own operations.
FINANCIAL HIGHLIGHTS
Economic Background The significant decline in the local and State economy experienced in the past three years appeared to have abated somewhat toward the end of 2003-04. Unemployment levels have decreased slightly. At the beginning of 2003-04, the unemployment rates were 4.2 percent and 6.7 percent for the City and State, respectively. At the end of 2003-04, these rates were 3.2 percent and 6.4 percent, respectively. In the latter months of 2003-04, economically sensitive revenue sources such as sales and transient occupancy taxes stopped declining and appeared to plateau at their recent lows. Mirroring the national and state economies, there is evidence, however, that an expected economic “turnaround” is running into resistance. Local job and economic growth has been slow to materialize as technology firms have been reluctant to hire new employees and appear to prefer outsourcing highly skilled and high paying jobs. Corporate demand for new technology such as computers, servers, and telecommunications equipment has slowed causing major regional businesses such as Intel and Cisco to lower profit forecasts. These outcomes have led, in turn, to lower City revenues. The State’s financial dilemmas have compounded pressures on the City’s resources as the State reduced vehicle license fee revenue in 2003-04 by $1.1 million to solve its budget problems. Over the next two years, the State will take away another $3.1 million in City revenues.
………………………………………………………………………………………………………………………… City of Palo Alto 3
Management Discussion and Analysis
Other pressures on the City’s budget include: Competition from surrounding city “big-box” stores and upscale malls reducing sales
tax revenues.
The potential departure of major revenue generating businesses such as auto dealerships.
Weakening property tax revenues due to commercial and office vacancies
Rising employee benefit costs such as health and retirement expenses.
These pressures, along with the tentative economy and State fiscal woes, will compel the City to maintain its “Strengthening The Bottom Line” balanced budget program into 2004-05 and beyond.
The comparisons in the discussion and analysis below are between 2003-04 and 2002-03. All increases and decreases are expressed relative to 2002-03 results. Fiscal year 2003-04 financial highlights include the following: Citywide
The City’s total net assets increased to $973.5 million, a $16.7 million increase.
The City’s total capital assets, net of related debt, increased to $591.3 million, a $32.1 million increase.
The City’s total restricted net assets decreased to $32.2 million, a $6.6 million drop.
The City’s total unrestricted net assets decreased to $350.0 million, a $8.7 million decrease.
Citywide revenues totaled $291.5 million, a decrease of $17.5 from the prior year. This total consists of $227.6 million in program revenues and $63.9 million in general revenues. Program revenues increased by $9.4 million while general revenues decreased by $26.9 million.
Total Citywide expenses were $268.9 million, a $7.3 million increase.
Citywide total assets increased to $1,083.4 million, a $23.3 million increase.
Citywide capital assets, net of depreciation, increased by $30.9 million to $639.1 million.
Citywide other assets decreased $7.6 million to $444.3 million.
Citywide total liabilities were $109.9 million, an increase of $6.6 million.
Citywide long-term debt decreased $2.0 million to $57.5 million.
Citywide other liabilities were $52.4 million, an increase of $8.6 million.
Fund Level – Governmental Funds
Governmental Fund balances decreased to $109.9, a $15.7 million change.
Governmental Fund revenues decreased to $93.6 million, a $10.3 million drop.
Governmental Fund expenditures were $118.8, a $14.1 million decrease.
………………………………………………………………………………………………………………………… 4 City of Palo Alto
Management Discussion and Analysis
General Fund revenues came in at $86.2 million, a drop of $10.1 million over prior year levels.
General Fund expenditures are $94.4 million, a drop of $4.5 million.
The General Fund balance of $66.8 million at June 30, 2004 was an increase of $0.5 million from the prior year.
Fund Level – Enterprise Funds
Enterprise Fund net assets increased to $522.7 million, a $12.6 million increase.
Enterprise Fund revenues increased to $191.5 million, a $3.8 million increase over prior year revenues.
Enterprise Fund expenses increased to $158.2 million, a $6.7 million decrease.
………………………………………………………………………………………………………………………… City of Palo Alto 5
Management Discussion and Analysis
FINANCIAL PERFORMANCE
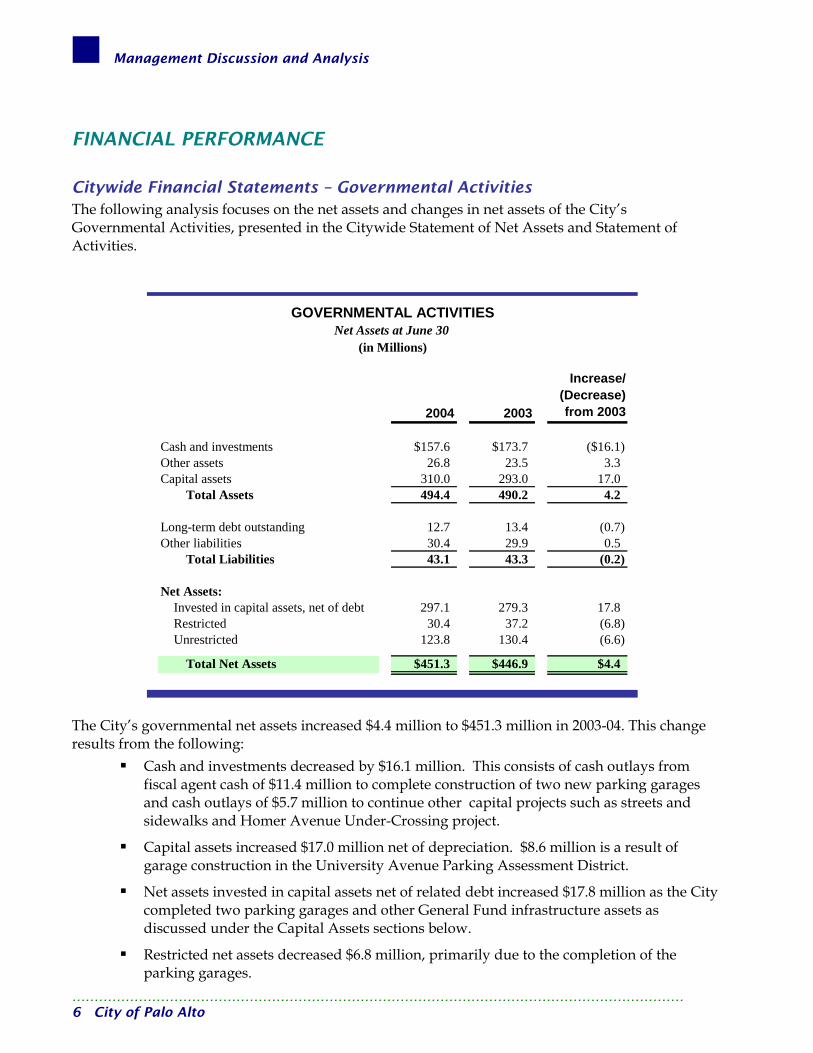
Citywide Financial Statements – Governmental Activities The following analysis focuses on the net assets and changes in net assets of the City’s Governmental Activities, presented in the Citywide Statement of Net Assets and Statement of Activities.
2004 2003
Increase/ (Decrease) from 2003
Cash and investments $157.6 $173.7 ($16.1)Other assets 26.8 23.5 3.3Capital assets 310.0 293.0 17.0
Total Assets 494.4 490.2 4.2
Long-term debt outstanding 12.7 13.4 (0.7)Other liabilities 30.4 29.9 0.5
Total Liabilities 43.1 43.3 (0.2)
Net Assets:Invested in capital assets, net of debt 297.1 279.3 17.8Restricted 30.4 37.2 (6.8)Unrestricted 123.8 130.4 (6.6)
Total Net Assets $451.3 $446.9 $4.4
GOVERNMENTAL ACTIVITIESNet Assets at June 30
(in Millions)
The City’s governmental net assets increased $4.4 million to $451.3 million in 2003-04. This change results from the following:
Cash and investments decreased by $16.1 million. This consists of cash outlays from fiscal agent cash of $11.4 million to complete construction of two new parking garages and cash outlays of $5.7 million to continue other capital projects such as streets and sidewalks and Homer Avenue Under-Crossing project.
Capital assets increased $17.0 million net of depreciation. $8.6 million is a result of garage construction in the University Avenue Parking Assessment District.
Net assets invested in capital assets net of related debt increased $17.8 million as the City completed two parking garages and other General Fund infrastructure assets as discussed under the Capital Assets sections below.
Restricted net assets decreased $6.8 million, primarily due to the completion of the parking garages.
………………………………………………………………………………………………………………………… 6 City of Palo Alto
Management Discussion and Analysis
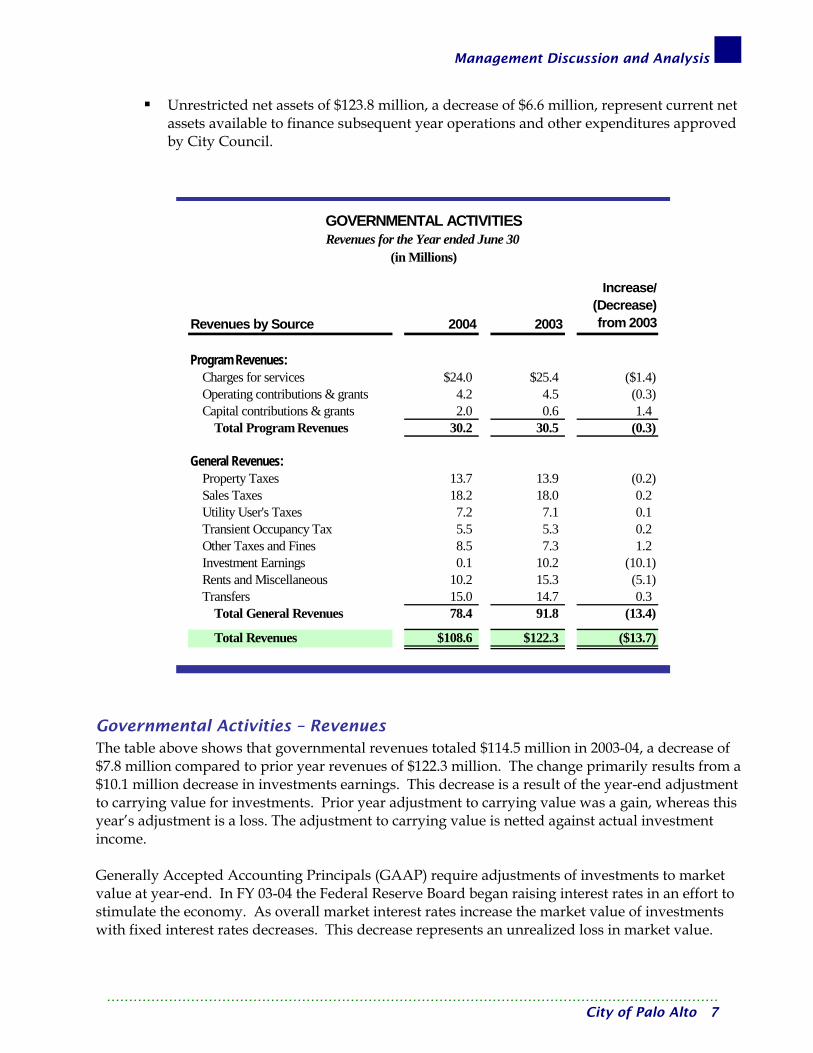
Unrestricted net assets of $123.8 million, a decrease of $6.6 million, represent current net assets available to finance subsequent year operations and other expenditures approved by City Council.
2004 2003
Increase/ (Decrease) from 2003
Program Revenues:Charges for services $24.0 $25.4 ($1.4)Operating contributions & grants 4.2 4.5 (0.3)Capital contributions & grants 2.0 0.6 1.4
Total Program Revenues 30.2 30.5 (0.3)
General Revenues:Property Taxes 13.7 13.9 (0.2)Sales Taxes 18.2 18.0 0.2Utility User's Taxes 7.2 7.1 0.1Transient Occupancy Tax 5.5 5.3 0.2Other Taxes and Fines 8.5 7.3 1.2Investment Earnings 0.1 10.2 (10.1)Rents and Miscellaneous 10.2 15.3 (5.1)Transfers 15.0 14.7 0.3
Total General Revenues 78.4 91.8 (13.4)
Total Revenues $108.6 $122.3 ($13.7)
Revenues by Source
GOVERNMENTAL ACTIVITIESRevenues for the Year ended June 30
(in Millions)
Governmental Activities – Revenues The table above shows that governmental revenues totaled $114.5 million in 2003-04, a decrease of $7.8 million compared to prior year revenues of $122.3 million. The change primarily results from a $10.1 million decrease in investments earnings. This decrease is a result of the year-end adjustment to carrying value for investments. Prior year adjustment to carrying value was a gain, whereas this year’s adjustment is a loss. The adjustment to carrying value is netted against actual investment income. Generally Accepted Accounting Principals (GAAP) require adjustments of investments to market value at year-end. In FY 03-04 the Federal Reserve Board began raising interest rates in an effort to stimulate the economy. As overall market interest rates increase the market value of investments with fixed interest rates decreases. This decrease represents an unrealized loss in market value.
………………………………………………………………………………………………………………………… City of Palo Alto 7
Management Discussion and Analysis
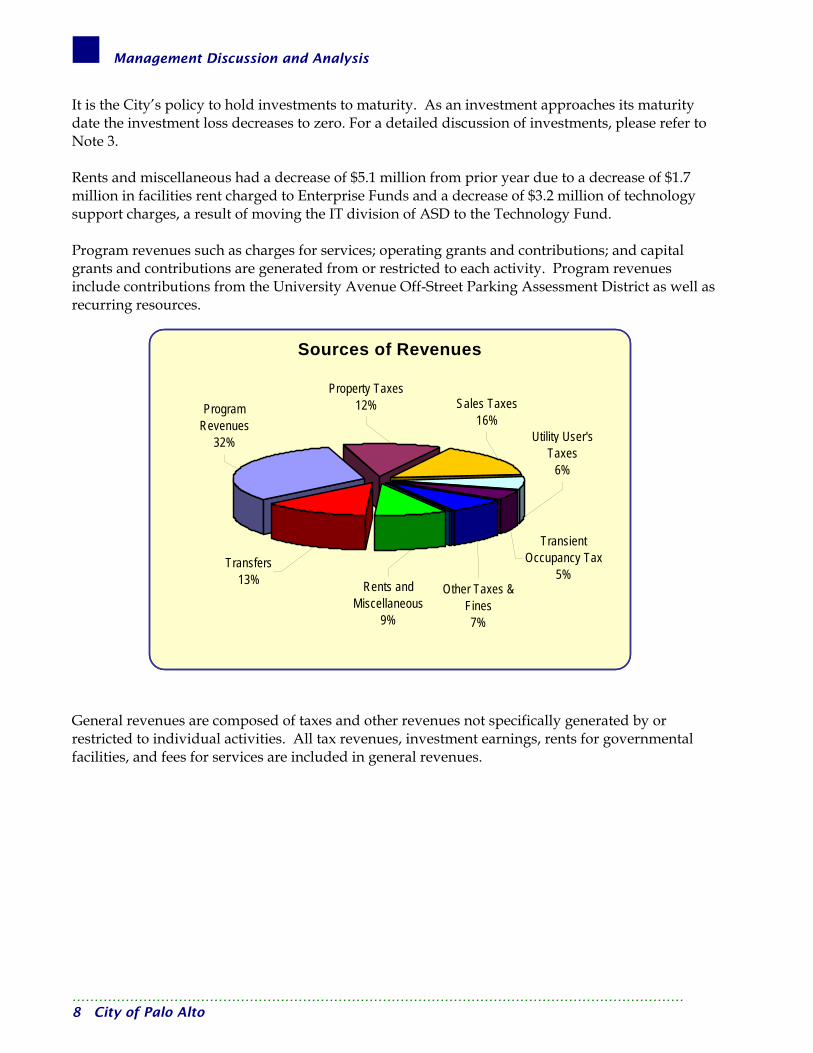
It is the City’s policy to hold investments to maturity. As an investment approaches its maturity date the investment loss decreases to zero. For a detailed discussion of investments, please refer to Note 3. Rents and miscellaneous had a decrease of $5.1 million from prior year due to a decrease of $1.7 million in facilities rent charged to Enterprise Funds and a decrease of $3.2 million of technology support charges, a result of moving the IT division of ASD to the Technology Fund. Program revenues such as charges for services; operating grants and contributions; and capital grants and contributions are generated from or restricted to each activity. Program revenues include contributions from the University Avenue Off-Street Parking Assessment District as well as recurring resources.
Sources of Revenues
Transient Occupancy Tax
5%Other Taxes &
Fines7%
Rents and Miscellaneous
9%
Utility User's Taxes
6%
Sales Taxes16%
Transfers13%
Program Revenues
32%
Property Taxes12%
General revenues are composed of taxes and other revenues not specifically generated by or restricted to individual activities. All tax revenues, investment earnings, rents for governmental facilities, and fees for services are included in general revenues.
………………………………………………………………………………………………………………………… 8 City of Palo Alto

Management Discussion and Analysis
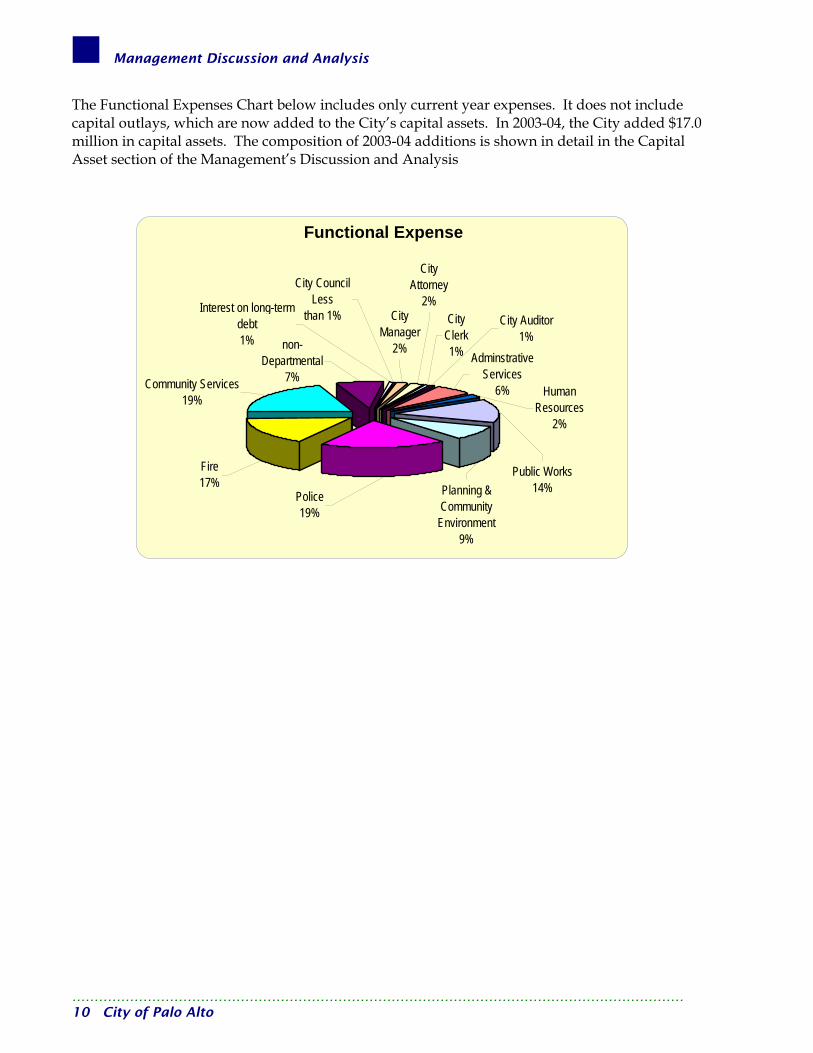
Governmental Activities – Expenses The table below presents a comparison of 2003-04 and 2002-03 expenses (does not include encumbrances and reappropriations) by Governmental Activities and interest on long-term debt. Total Governmental Activities expense was $104.2 million in 2003-04, an increase of $2.6 million.
Activities 2004 2003
Increase/ (Decrease) from 2003
City Council $0.2 $0.2City Manager 1.7 1.5 $0.2City Attorney 2.3 2.0 0.3City Clerk 0.8 0.6 0.2City Auditor 0.7 0.6 0.1Adminstrative Services 6.3 9.7 (3.4)Human Resources 2.1 1.7 0.4Public Works 14.4 13.7 0.7Planning and Community Environment 8.9 7.5 1.4Police 20.4 19.3 1.1Fire 17.3 16.9 0.4Community Services 20.9 19.7 1.2non-Departmental 7.6 7.5 0.1Interest on long-term debt 0.6 0.7 (0.1)
Total Revenues $104.2 $101.6 $2.6
GOVERNMENTAL ACTIVITIESExpenses for the Year ended June 30
(in Millions)
………………………………………………………………………………………………………………………… City of Palo Alto 9
Management Discussion and Analysis
The Functional Expenses Chart below includes only current year expenses. It does not include capital outlays, which are now added to the City’s capital assets. In 2003-04, the City added $17.0 million in capital assets. The composition of 2003-04 additions is shown in detail in the Capital Asset section of the Management’s Discussion and Analysis
Functional Expense
City CouncilLess
than 1% City Manager
2%
City Attorney
2%City
Clerk1%
City Auditor1%
Adminstrative Services
6% Human Resources
2%
Interest on long-term debt1%
Public Works14%Planning &
Community Environment
9%
Police19%
non-Departmental
7%
Fire17%
Community Services19%
………………………………………………………………………………………………………………………… 10 City of Palo Alto
Management Discussion and Analysis
Citywide Financial Statements – Business-Type Activities The following analysis focuses on the net assets and changes in net assets of the City’s Business- Type Activities presented in the Citywide Statement of Net Assets and Statement of Activities.
2004 2003
Increase/ (Decrease) from 2003
Cash and investments $238.2 $233.5 $4.7Other assets 21.7 21.2 0.5Capital assets 329.1 315.2 13.9 Total Assets 589.0 569.9 19.1
Long-term debt outstanding 44.9 46.1 (1.2)Other liabilities 21.9 13.9 8.0 Total Liabilities 66.8 60.0 6.8
Net assets: Invested in capital assets, net of debt 294.2 279.9 14.3 Restricted 1.8 1.7 0.1 Unrestricted 226.2 228.3 (2.1)
Total Net Assets $522.2 $509.9 $12.3
(in Millions)
BUSINESS-TYPE ACTIVITIESNet Assets at June 30
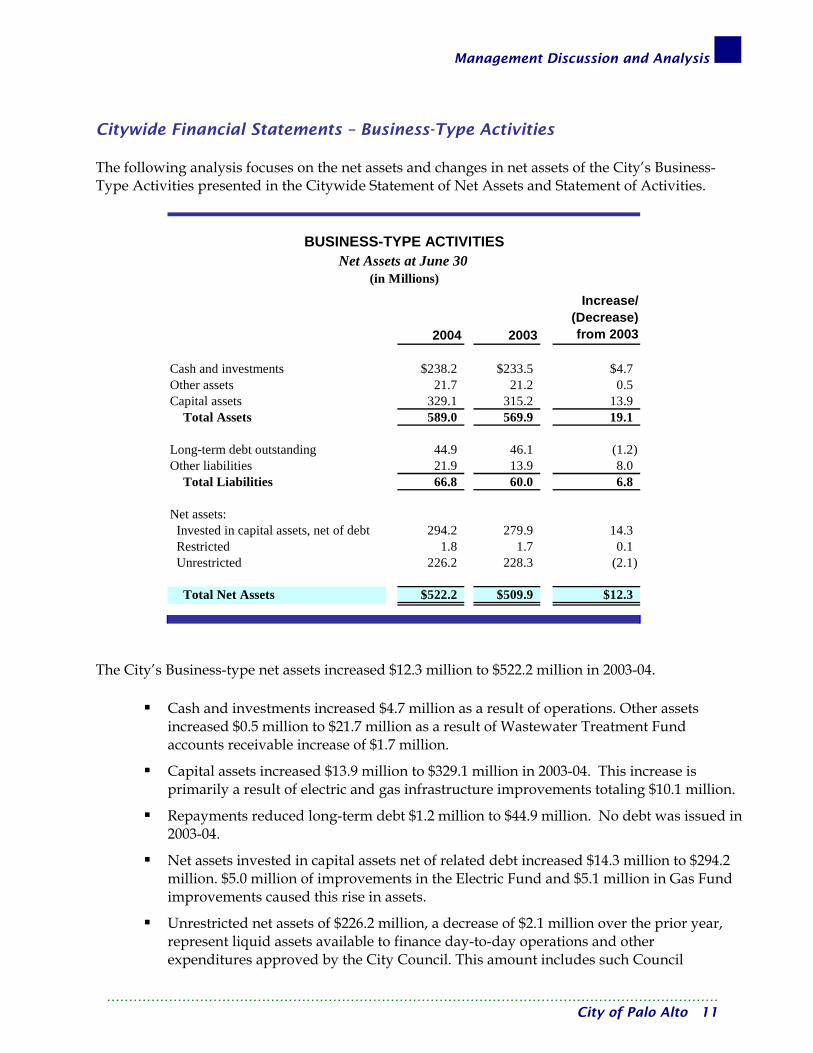
The City’s Business-type net assets increased $12.3 million to $522.2 million in 2003-04.
Cash and investments increased $4.7 million as a result of operations. Other assets increased $0.5 million to $21.7 million as a result of Wastewater Treatment Fund accounts receivable increase of $1.7 million.
Capital assets increased $13.9 million to $329.1 million in 2003-04. This increase is primarily a result of electric and gas infrastructure improvements totaling $10.1 million.
Repayments reduced long-term debt $1.2 million to $44.9 million. No debt was issued in 2003-04.
Net assets invested in capital assets net of related debt increased $14.3 million to $294.2 million. $5.0 million of improvements in the Electric Fund and $5.1 million in Gas Fund improvements caused this rise in assets.
Unrestricted net assets of $226.2 million, a decrease of $2.1 million over the prior year, represent liquid assets available to finance day-to-day operations and other expenditures approved by the City Council. This amount includes such Council
………………………………………………………………………………………………………………………… City of Palo Alto 11
Management Discussion and Analysis
designated reserves as rate stabilization reserves of $99.6 million, the Calaveras reserve for stranded costs of $70.4 million and the emergency plant replacement reserve of $6.7 million.
2004 2003
Increase/ (Decrease) from 2003
Water $5.9 $4.4 $1.5Electric 19.1 17.9 1.2Gas 1.8 7.4 (5.6)Wastewater Collection 3.4 2.0 1.4Wastewater Treatment (0.1) (0.8) 0.7Refuse (2.3) (2.9) 0.6Storm Drainage (0.8) (0.3) (0.5)External Services (0.1) 0.0 0
Totals $26.9 $27.7 ($0.8)
From Services
BUSINESS-TYPE ACTIVITIES
(in Millions)
Net (Expense) Revenue
For the Year Ended June 30
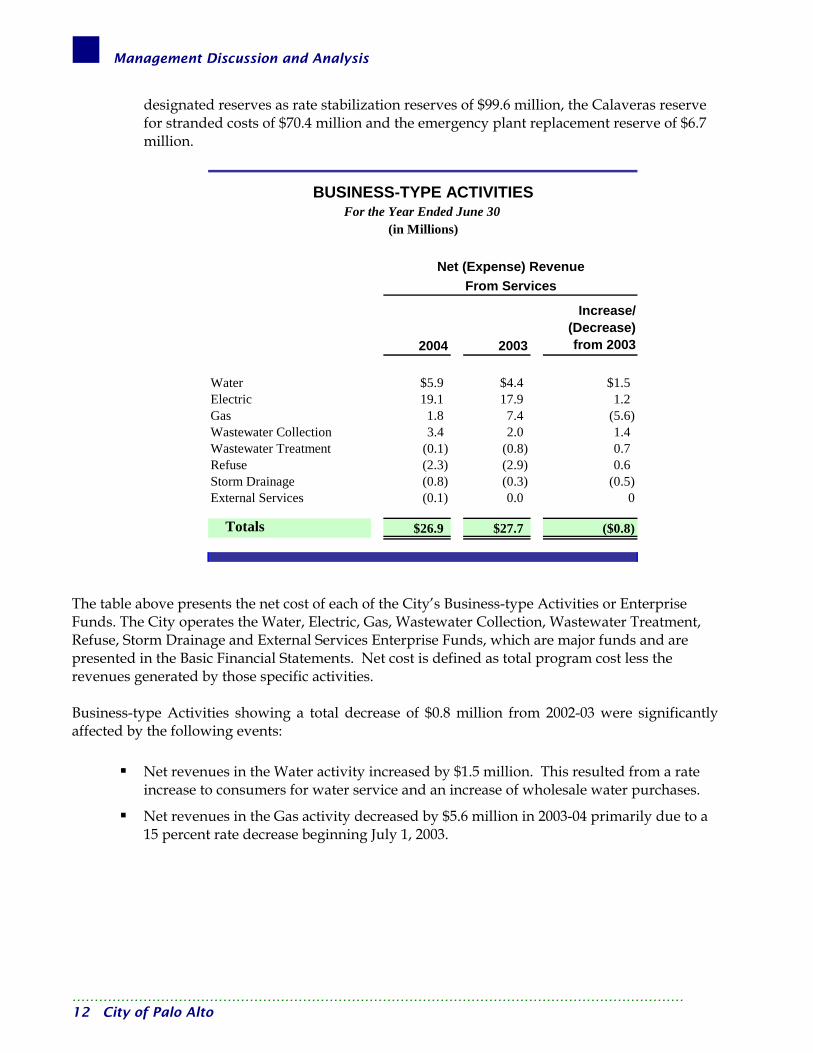
The table above presents the net cost of each of the City’s Business-type Activities or Enterprise Funds. The City operates the Water, Electric, Gas, Wastewater Collection, Wastewater Treatment, Refuse, Storm Drainage and External Services Enterprise Funds, which are major funds and are presented in the Basic Financial Statements. Net cost is defined as total program cost less the revenues generated by those specific activities. Business-type Activities showing a total decrease of $0.8 million from 2002-03 were significantly affected by the following events:
Net revenues in the Water activity increased by $1.5 million. This resulted from a rate increase to consumers for water service and an increase of wholesale water purchases.
Net revenues in the Gas activity decreased by $5.6 million in 2003-04 primarily due to a 15 percent rate decrease beginning July 1, 2003.
………………………………………………………………………………………………………………………… 12 City of Palo Alto
Management Discussion and Analysis
FUND FINANCIAL STATEMENTS
Performance of Governmental Funds At June 30, 2004, the City’s Governmental Funds reported combined fund balances of $109.9 million, a decrease of $15.7 million or 12.5 percent compared with the prior year Governmental Fund revenues and other financing sources decreased $13.5 million for a total of $122.2 million. Revenues and other financing sources in the General Fund decreased $8.3 million; Capital Project Fund decreased $2.4 million as a result of a decrease of operating transfers from the General Fund of $3.9 million. Non-major Fund revenues and other financing sources decreased by $2.3 million. Governmental Fund expenditures and other uses decreased $11.6 million this year to $137.9 million. General Fund expenditures decreased $5.9 million. Capital Projects Fund expenditures decreased by $5.0 million; and non-major fund expenditures and other uses dropped by $0.7 million. General Fund – The General Fund ended the year with a $0.5 million addition to fund balance, compared to $2.9 million in the prior year. The $0.5 million excess of revenues over expense is due mainly to the $0.8 million Utilities payment to an Equity Transfer Stabilization Reserve. During this period of slow economic recovery, the City has continued to closely monitor its expenditures. Palo Alto’s General Fund revenues and other financing sources reached $104.1 million in 2003-04, a decline of $8.3 million. Sales tax, the City’s largest revenue source, totaled $18.2 million in 2003-04 compared to $18.0 million in 2002-03. After controlling for prior year one-time adjustments in both years, actual revenues were $17.6 and $17.4 million, respectively. From an economic perspective, this data appears to indicate a more stable local economy compared to the past three years. From a structural perspective, however, there are challenges to this revenues source from competition from new malls and big box stores, and the potential exodus of additional auto dealerships. Compared to the adopted budget, which was based on an economic rebound in 2003-04, sales tax revenue growth did not materialize. This caused a downward adjustment in budget at midyear from $19.3 million to $17.4 million. Sales tax at year-end came in $0.7 million or 4.3 percent above the adjusted budget. The increase is attributable to one-time payment in the electronics sector. The City saw modest growth in sectors such as general consumer goods and restaurants. This growth was somewhat offset by declines in auto sales and leases and from office equipment. Documentary transfer tax revenues performed well in 2003-04, increasing by $2.1 million or 59.4 percent from 2002-03. The City received a sizeable, one-time transfer tax from a transaction whereby Stanford University entered into a long-term lease with a private party to manage the Stanford Shopping Center. In addition, a moderation in home prices and a low interest rate environment boosted residential sales. Another indication of a slightly more stable economy in late 2003-04, was the performance of transient occupancy tax. It increased by $0.2 million or 2.9 percent compared to 2002-03. The City was forced, however, to adjust its $6.3 million budget downward by $0.75 million due to a sluggish
………………………………………………………………………………………………………………………… City of Palo Alto 13
Management Discussion and Analysis
hotel market. With a modest occupancy rate increase toward the end of 2003-04, revenues totaled a $5.5 million, a modest $0.06 million or 1.1 percent below the adjusted budget. Average vacancy rates increased from 54.2 percent in 2002-03 to 56.8 percent in 2003-04. More significantly, average daily rates fell from $122 to $114 during the same period. Motor vehicle in-lieu license fees (VLF) came in $0.4 million or 16.7 percent above the adjusted budget. This positive variance was primarily due to consumers postponing car purchases until the Governor indicated he would not raise VLF fees. It is important to note that the adjusted budget included a $1.1 million downward adjustment due to a state take away. Without the $1.1 million State reduction, VLF revenues would have exceeded prior year receipts. Offsetting the positive variances described above were declines in property taxes and interest income. Due to a high volume of appeals and assessed value reductions, property taxes fell well below budget in 2003-04. These adjustments primarily came from commercial properties that sought to adjust their secured and unsecured (personal) property values downward. The high level of commercial vacancy rates had a negative influence on commercial values. Revenues were $0.36 million or 2.5 percent under budget and were $0.01 million or 0.7 percent below the prior year. Interest Income was $0.1 million or 3.7 percent below the adjusted budget and $0.5 million or 11.4 percent below the prior year. The decline is primarily due to reinvestment of older, maturing securities in a low interest rate environment. At June 30, 2004, the General Fund Balance totaled $66.8 million. This represents 70.8 percent of direct General Fund expenditures, providing a buffer against unexpected financial events. Of this, $6.7 million is reserved and $60.1 is unreserved. A substantial portion of the unreserved amount is designated by the Council for budget stabilization, $21.5 million at year-end; and infrastructure improvements, $35.9 million at year-end. The equity transfer stabilization designation, established in 2001-02, totaled $2.3 million at year-end. This reserve would be used in the event that the Electric or Gas Fund was unable to make its required equity transfer to the General Fund. The City has continued to closely monitor revenues and expenditures, making adjustments as needed to maintain a balanced budget. In addition, the City has continued to make efforts to reduce expenditures without impacting services to the public. This proactive approach was established with the ongoing “Strengthening the Bottom Line” (SBL) efforts established in 2001-02. Continued maintenance of these service levels will be jeopardized if the economy continues to have a slow recovery , State financial problems continue, and employee benefit costs rise significantly. The City continues to maintain a strong position of liquidity or cash flow to cover expenditures. General Fund expenditures and other uses totaled $103.6 million, a decrease of $5.9 million from prior year. This decline was primarily from the $4.1 million decrease in ASD (due to reclassification of Information Technology division to the Technology Fund) and a decrease in Public Works expenditures of $1.9 million. Nearly all City departments had savings compared to the adjusted budget, Community Services ($1.4 million primarily from contract expenditures), Police ($1.7 million primarily from salary expenditures), Public Works ($1.1 million primarily from salaries and expenditures being recognized in the Capital Fund). Housing In-Lieu Fund – The Housing In-Lieu Fund met the criteria for a major fund in 2003-04 primarily due to the loan of $5.874 million and $1.96 million to Palo Alto Housing Corporation for the purchase of land and construction of the Oak Court Apartments (for details refer to Note 5). ………………………………………………………………………………………………………………………… 14 City of Palo Alto

Management Discussion and Analysis
Housing In-Lieu revenues were $0.4 million, a decline of $0.7 from prior year. Expenditures were $0.3 an increase of $0.1 from prior year. Housing In-Lieu Fund balance totaled $10.9 million, an increase of $0.1 million from the prior year. Capital Projects Fund – Capital Projects Fund expenditures and other uses were $28.2 million in 2003-04, which is a decrease of $5.0 million from the prior year. This level of expenditure is consistent with the City’s effort to rehabilitate and maintain its existing infrastructure and to complete the construction of two new downtown parking structures. Capital expenditures include $8.6 million on the garages, $4.3 million on streets and sidewalks, and $2.5 million on the Homer Avenue Under-Crossing project. Other important expenditures include, for example, park and facility improvements, library master planning efforts, traffic calming and bike lane improvements. Non-major Funds -These funds are not presented separately in the Basic Financial statements, but are individually presented as Supplemental Information.
Performance of Enterprise Funds At June 30, 2004, the City’s Enterprise Funds reported total net assets of $522.7 million, an increase of $12.6 million or 2.5 percent compared with last year. The Electric and Gas Funds contributed net assets of $291.4 million and $60.8, respectively, to total net assets. These assets constitute 67.4 percent of the Enterprise Funds’ total net assets. Unrestricted net assets for these two funds total $173.5 million, a $0.6 million or .3 percent decrease over 2002-03. Water Fund – Revenue increased by $4.3 million in 2003-04. The Water Fund ended the year with net income of $3.2 million, compared to $3.0 million in the prior year, a $.2 million or 5.8 percent increase. The rise in net income is primarily due to a 15 percent rate increase effective July 1, 2003. There will be a series of rate increases to consumers in coming years as commodity costs rise to pay for major capital improvements related to the Hetch-Hetchy distribution system Electric Fund – Operating revenues increased to $92.6 million, a $1.0 million rise from 2002-03. This slight increase resulted from relatively flat price and volume as compared to 2002-03. A $2.0 million increase in excess capacity (surplus energy) sales due to market price increases offset a $1.5 million decrease in other operating revenue. Central Valley Project loan repayments and a one-time only legal settlement affected other operating revenue in the prior year. Operating expenses increased from $67.1 million in 2002-03 to $68.7 in 2003-04, an increase of $1.6 million. The retail purchase of utilities increased $4.2 million; this was mainly due to an $8.5 million accrual for SCS Tariff charge backs to be paid in 2004-05. Due to lower legal expenses in 2003-04, resource management expenses declined by $2.1 million. The Electric Fund ended the year with a net gain of $10.9 million compared to a net gain of $18.4 million in 2002-03. Gas Fund – A 15 percent rate decrease for 2003-04 caused revenues to decrease by $4.9 million compared to the prior year. In June 2001, Gas Fund rates increased 67 percent to cover dramatically increased commodity prices; the 2003-04-rate decrease is the second phase of rate adjustments that began in 2002-03 as commodity prices fell. Natural gas prices were higher than expected in 2003-04
………………………………………………………………………………………………………………………… City of Palo Alto 15
Management Discussion and Analysis
and commodity expenditure increased $.6 million. Year-end results show net loss of $1.4 million in 2003-04 compared to net income of $5.4 million in 2002-03. Wastewater Collection Fund - In 2003-04 collection rates increased by 15 percent. Compared to the prior year, revenues rose by $2.0 million or 18.5 percent. Operating costs rose by $0.6 million due to higher utility costs. Utility costs in this Fund increased by $.4 million or 7.9 percent. Net income increased to $3.3 million, a rise of $0.8 million over 2002-03. Wastewater Treatment Fund – Revenues increased by $1.2 million in 2003-04, while operating expenses increased by $0.2 million. This increase was due to higher salary and benefit increases. The Fund ended the year with net income of $0.1 million, compared to a net loss of $0.2 million in the prior year. Total net assets at year-end totaled a solid $33.7 million. Refuse Fund – Refuse operating revenues increased $.2 million in 2003-04. Greenwaste charges to the General Fund were restored in 2003-04. Operating and maintenance expenses rose by $.8 million due to $1.0 million transfer to the General Fund for interest on deferred rent. Rent decreased by $1.0 million because of a payment for deferred rent made in the prior year. The fund ended the year with a net loss of $3.0 million, compared to a $1.9 million loss in the prior year. Total net assets at year-end totaled $13.7 million. Storm Drainage Fund - The Storm Drainage Fund continues to experience a net loss before transfers due to insufficient revenue from existing fees. Supplemental funding from the General Fund is required in order to maintain the current level of service. In 2003-04, operating revenues remained stable at $2.2 million. The Fund required a transfer of $.3 million from the General Fund to continue basic services and maintain water quality standards. External Services Fund - Created in 2001-02, this Fund provides information technology and training services to neighboring municipalities and other community organizations. As part of the City’s effort to enhance revenues, the Fund added three outside contracts in 2003-04. The Fund had an operating loss of $0.1 million in 2003-04 as it positions itself to expand services.
………………………………………………………………………………………………………………………… 16 City of Palo Alto
Management Discussion and Analysis
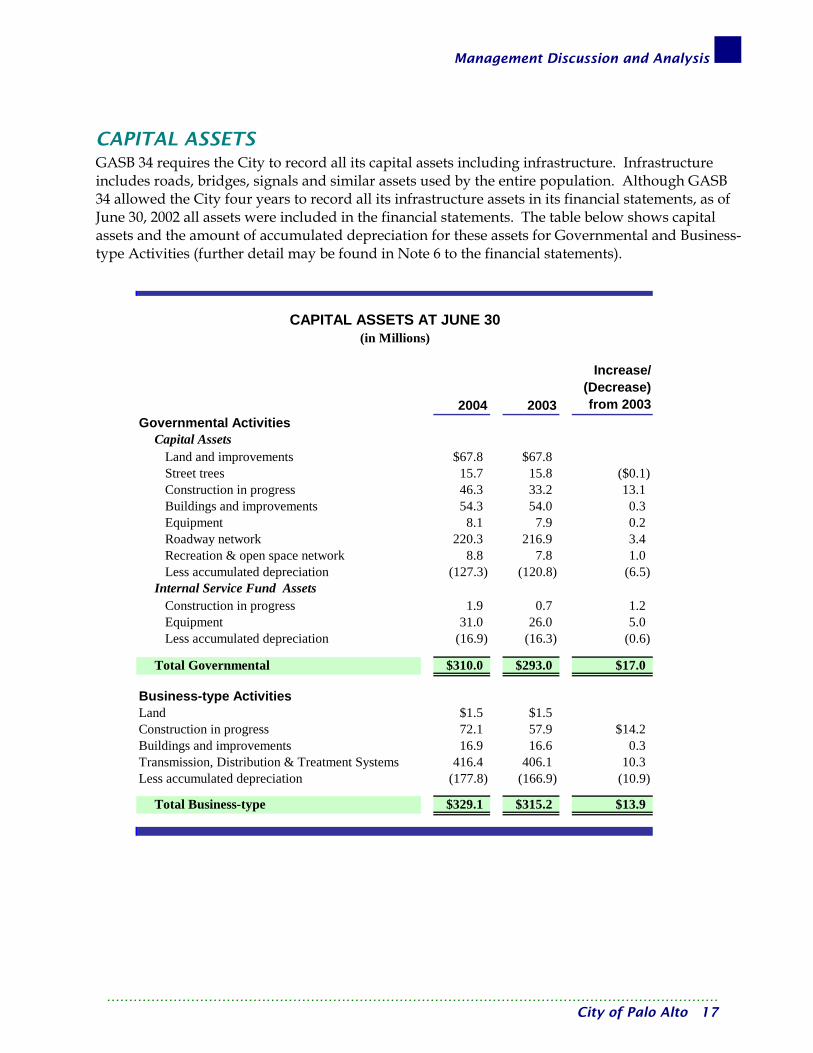
CAPITAL ASSETS GASB 34 requires the City to record all its capital assets including infrastructure. Infrastructure includes roads, bridges, signals and similar assets used by the entire population. Although GASB 34 allowed the City four years to record all its infrastructure assets in its financial statements, as of June 30, 2002 all assets were included in the financial statements. The table below shows capital assets and the amount of accumulated depreciation for these assets for Governmental and Business-type Activities (further detail may be found in Note 6 to the financial statements).
2004 2003
Increase/ (Decrease) from 2003
Capital AssetsLand and improvements $67.8 $67.8Street trees 15.7 15.8 ($0.1)Construction in progress 46.3 33.2 13.1Buildings and improvements 54.3 54.0 0.3Equipment 8.1 7.9 0.2Roadway network 220.3 216.9 3.4Recreation & open space network 8.8 7.8 1.0Less accumulated depreciation (127.3) (120.8) (6.5)
Internal Service Fund AssetsConstruction in progress 1.9 0.7 1.2Equipment 31.0 26.0 5.0Less accumulated depreciation (16.9) (16.3) (0.6)
Total Governmental $310.0 $293.0 $17.0
Land $1.5 $1.5Construction in progress 72.1 57.9 $14.2Buildings and improvements 16.9 16.6 0.3Transmission, Distribution & Treatment Systems 416.4 406.1 10.3Less accumulated depreciation (177.8) (166.9) (10.9)
Total Business-type $329.1 $315.2 $13.9
CAPITAL ASSETS AT JUNE 30(in Millions)
Governmental Activities
Business-type Activities
………………………………………………………………………………………………………………………… City of Palo Alto 17
Management Discussion and Analysis
Governmental Activities capital assets net of depreciation, increased by $17.0 million compared to 2002-03. Significant increases occurred in construction in progress ($13.1 million) and in the roadway network ($3.4 million). Construction activity is due to the two new downtown parking structures and roadway improvements as a consequence of the City’s enhanced infrastructure efforts and additional State funding. Total Business-type activities capital assets net of depreciation, increased by $13.9 million. Areas of increase included construction in progress and equipment. The increase of $14.2 million in construction in progress mainly consisted of $3.2 million in the Water Enterprise Fund, $2.9 million in the Electric Enterprise Fund, $4.8 million in the Gas Enterprise Fund and $2.7 million in the Wastewater Enterprise Collection Fund. The change in transmission, distribution and treatment systems of $10.3 million is comprised mostly of $7.4 million in the Electric Enterprise Fund, $0.8 million in the Wastewater Treatment Enterprise Fund and $0.8 million in the Gas Enterprise Fund. During 2003-04, Palo Alto’s capital improvement projects focused on the completion of the downtown parking structures as well as continued work on the rehabilitation and replacement of the City’s General Fund infrastructure. Work on the City’s infrastructure is a continuation of the ten-year plan, costing $100 million, developed to address the needs of the City’s aging infrastructure. The ten-year plan included an assessment and prioritization of work needed on buildings, facilities, streets, sidewalks, medians, bikeways, parks and open space. Key infrastructure projects include improvements to streets and sidewalks, refurbishing of park playgrounds and irrigation systems, upgrading athletic fields, open space and trail improvements, and facility renovations. The City depreciates all its capital assets over their estimated useful lives, as required by GASB 34. The purpose of depreciation is to spread the cost of a capital asset over the years of its useful life so that an allocable portion of the cost of the asset is borne by all users. Additional information on capital assets and depreciable lives may be found in Note 6.
………………………………………………………………………………………………………………………… 18 City of Palo Alto
Management Discussion and Analysis
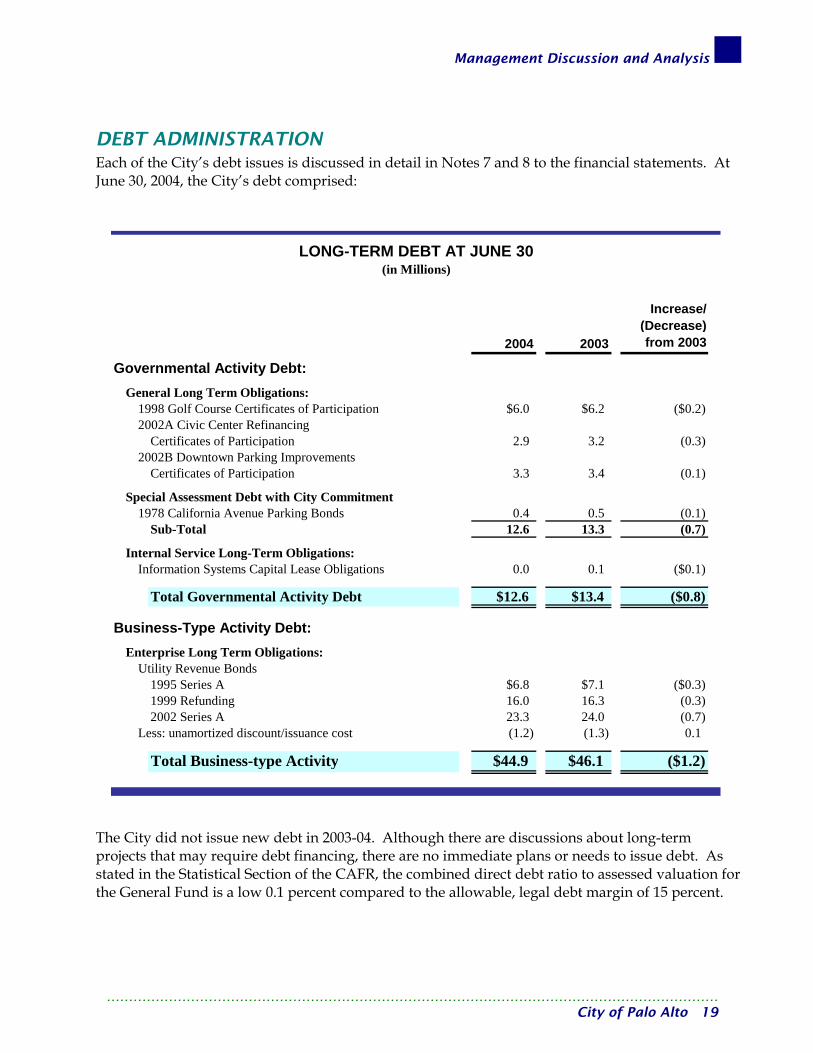
DEBT ADMINISTRATION Each of the City’s debt issues is discussed in detail in Notes 7 and 8 to the financial statements. At June 30, 2004, the City’s debt comprised:
2004 2003
Increase/ (Decrease) from 2003
General Long Term Obligations:1998 Golf Course Certificates of Participation $6.0 $6.2 ($0.2)2002A Civic Center Refinancing
Certificates of Participation 2.9 3.2 (0.3)2002B Downtown Parking Improvements
Certificates of Participation 3.3 3.4 (0.1)
Special Assessment Debt with City Commitment1978 California Avenue Parking Bonds 0.4 0.5 (0.1)
Sub-Total 12.6 13.3 (0.7)
Internal Service Long-Term Obligations:Information Systems Capital Lease Obligations 0.0 0.1 ($0.1)
Total Governmental Activity Debt $12.6 $13.4 ($0.8)
Enterprise Long Term Obligations:Utility Revenue Bonds
1995 Series A $6.8 $7.1 ($0.3)1999 Refunding 16.0 16.3 (0.3)2002 Series A 23.3 24.0 (0.7)
Less: unamortized discount/issuance cost (1.2) (1.3) 0.1
Total Business-type Activity $44.9 $46.1 ($1.2)
Governmental Activity Debt:
Business-Type Activity Debt:
LONG-TERM DEBT AT JUNE 30(in Millions)
The City did not issue new debt in 2003-04. Although there are discussions about long-term projects that may require debt financing, there are no immediate plans or needs to issue debt. As stated in the Statistical Section of the CAFR, the combined direct debt ratio to assessed valuation for the General Fund is a low 0.1 percent compared to the allowable, legal debt margin of 15 percent.
………………………………………………………………………………………………………………………… City of Palo Alto 19

Management Discussion and Analysis
In 2001-02, Standard & Poors (S&P) reaffirmed the City’s overall AAA rating (a rating based on issuing General Obligation bond debt), the highest general city credit rating possible. The City also received an AA+ rating from S&P Investor Services for its 2002 COPs. The AA+ rating, one notch below the highest possible AAA rating is considered “high-quality grade” and works to lower interest rate and other debt issuance costs. Finally, S&P and Moody’s have given an AA- and Aa3 rating, respectively, to the City’s 2002 Utility Revenue bonds. While at the lower end of the “high-quality grade” rating, the rating received is excellent given the volatile utility markets. The rating agencies are recognizing the City’s strong reserves, solid revenues, and sound management in the light of significant upheaval in the commodity markets. Although the past two years have brought significant revenue challenges to the City’s General Fund, it has made the necessary alignments in its cost structures to maintain solid reserves and sound financial management of its resources.
SPECIAL ASSESSMENT DISTRICT DEBT
Special assessment districts in different parts of the City have also issued debt to finance infrastructure and facilities construction entirely in those districts. At June 30, 2004, a total of $0.4 million in special assessment district debt was outstanding, issued by the California Avenue Parking Special Assessment District. The City is contingently obligated for this debt and it has been included in the City’s governmental long-term debt. Throughout this analysis, references have been made to two new parking garages funded by University Avenue Off-Street Parking Assessment District Improvement Bonds. These bonds were issued in 2000-01 and in 2001-02 and the resulting debt is secured only by special assessments on the real property in the district issuing the debt. The debt is not the City’s responsibility, although the City does act as these Districts’ agent in the collection and remittance of assessments and mangers the two parking garages that were opened in 2003.
ECONOMIC OUTLOOK The economy of the City is discussed in the accompanying Transmittal Letter and in this Discussion and Analysis.
CONTACTING THE CITY’S FINANCIAL MANAGEMENT The CAFR is intended to provide citizens, taxpayers, investors, and creditors with a general overview of the City’s finances. Questions about this report should be directed to the Administrative Services Department, at 250 Hamilton Avenue, 4th Floor, Palo Alto, California. This report and other financial reports can be viewed on the City of Palo website at: www.cityofpaloalto.org. On the home page, under “Browse by Topic” select City Departments, select Administrative Services. Within Administrative Services there are reports under “Finance” and there are links to reports by division (such as Purchasing or Budget).
………………………………………………………………………………………………………………………… 20 City of Palo Alto

Financial Statements

This page is intentionally left blank.
Basic Financial Statements
Citywide Statement of Net Assets and Statement of Activities…………………………..
The Citywide Statement of Net Assets and the Statement of Activities purpose is to summarize the entire City’s financial activities and financial position. They are prepared on the same basis as is used by most businesses, which means they include all the City’s assets and all its liabilities, as well as all its revenues and expenses. This is known as the full accrual basis—the effect of all the City’s transactions is taken into account, regardless of whether or when cash changes hands. All material internal transactions between City funds have been eliminated. The Statement of Net Assets reports the difference between the City’s total assets and the City’s total liabilities, including all the City’s capital assets and all its long-term debt. The Statement of Net Assets focuses the reader on the composition of the City’s net assets, by subtracting total liabilities from total assets. The Statement of Net Assets summarizes the financial position of all the City’s Governmental Activities in a single column, and the financial position of all the City’s Business-type Activities in a single column; these columns are followed by a Total column that presents the financial position of the entire City. The City’s Governmental and Business-type Activities include the activities of its General Fund, along with all its Special Revenue, Capital Projects, Debt Service Funds, and Enterprise Funds. Since the City’s Internal Service Funds service these Funds, their activities are consolidated with Governmental and Business-type Activities, after eliminating inter-fund transactions and balances. The Statement of Activities reports increases and decreases in the City’s net assets. It is also prepared on the full accrual basis, which means it includes all the City’s revenues and all its expenses, regardless of when cash changes hands. This differs from the “modified accrual” basis used in the Fund financial statements, which reflect only current assets, current liabilities, available revenues and measurable expenditures. The format of the Statement of Activities presents the City’s expenses first, listed by program, and follows these with the expenses of its Business-type Activities. Program revenues—that is, revenues which are generated directly by these programs—are then deducted from program expenses to arrive at the net expense of each governmental and Business-type program. The City’s general revenues are then listed in the Governmental Activities or Business-type Activities column, as appropriate, and the Change in Net Assets is computed and reconciled with the Statement of Net Assets. Both these Statements include the financial activities of the City and the Public Improvement Corporation, which is a legally separate component unit of the City because it is controlled by the City, which is financially accountable for its activities. These financial statements along with the fund financial statements and footnotes are called Basic Financial Statements.
……………….……….……………………………………………………………………………………………. City of Palo Alto 21

Basic Financial Statements
…………………………………………………………………………………………………………… 22 City of Palo Alto
This page is intentionally left blank.

Basic Financial Statements
City of Palo Alto - Statement of Net Assets ……………………June 30, 2004
(In thousands of dollars)
Governmental Business-type Activities Activities Totals
ASSETSCash and investments (Note 3) $150,155 $226,451 $376,606Cash and investments with fiscal agents (Note 3) 7,447 11,758 19,205Receivables:
Accounts and intergovernmental 7,947 19,659 27,606Interest receivable 2,067 2,796 4,863Loans receivable (Note 5) 13,235 13,235
Internal balances (Note 4) 705 (705)Inventory of materials and supplies 2,809 2,809Capital assets, net of depreciation (Note 6) 310,016 329,099 639,115
Total assets 494,381 589,058 1,083,439
LIABILITIESAccounts payable and accrued liabilities 3,729 14,010 17,739Accrued salaries and benefits 4,136 1,358 5,494Accrued compensated absences 12,004 12,004Claims payable (Note 14) 10,548 10,548Accrued landfill closure liability (Note 9) 6,555 6,555Long-term debt (Notes 7 and 8)
Due in one year 840 1,367 2,207Due in more than one year 11,820 43,495 55,315
Total liabilities 43,077 66,785 109,862
NET ASSETS (Note 10)Invested in capital assets, net of related debt 297,125 294,197 591,322Restricted for:
Special revenue programs 17,854 17,854Capital projects:
Downtown parking structure 1,300 1,300Other capital projects 9,315 9,315
Debt service 1,948 1,798 3,746
Restricted 30,417 1,798 32,215
Unrestricted net assets 123,762 226,278 350,040
Total net assets $451,304 $522,273 $973,577
See accompanying notes to financial statements
……………….……….……………………………………………………………………………………………. City of Palo Alto 23
Basic Financial Statements
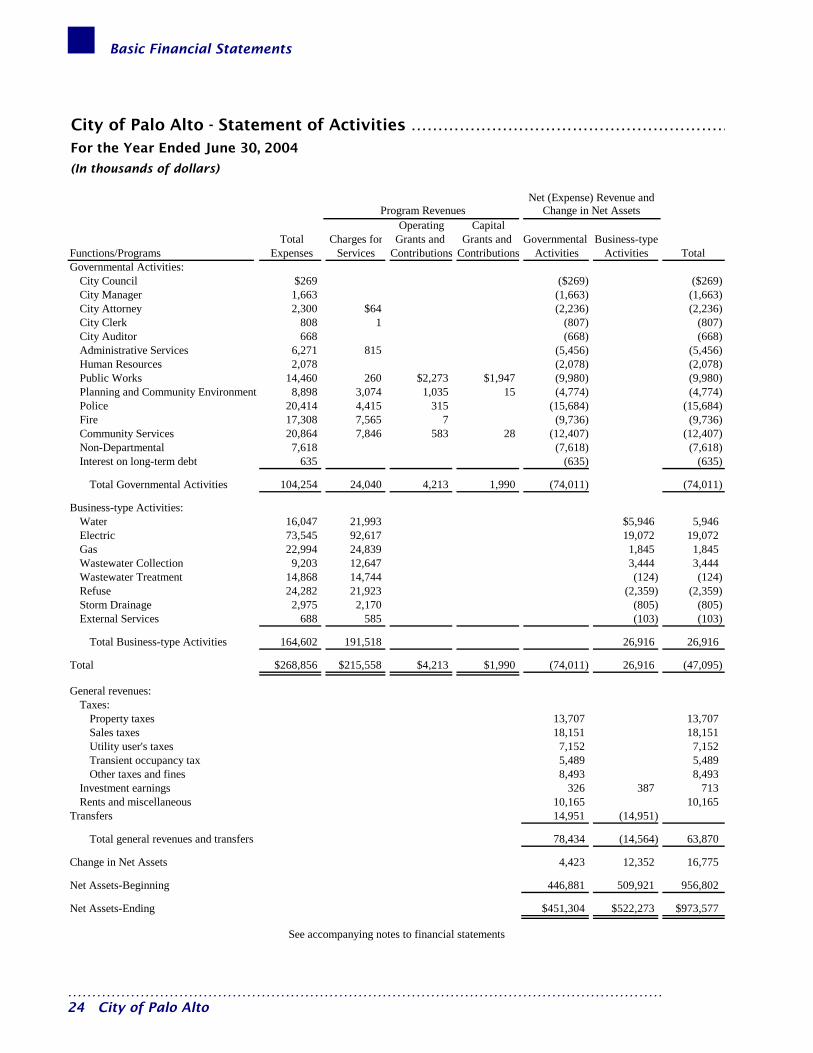
City of Palo Alto - Statement of Activities ……………………………………………………For the Year Ended June 30, 2004
(In thousands of dollars)
Net (Expense) Revenue andProgram Revenues Change in Net Assets
Operating CapitalTotal Charges for Grants and Grants and Governmental Business-type
Functions/Programs Expenses Services Contributions Contributions Activities Activities TotalGovernmental Activities:
City Council $269 ($269) ($269)City Manager 1,663 (1,663) (1,663)City Attorney 2,300 $64 (2,236) (2,236)City Clerk 808 1 (807) (807)City Auditor 668 (668) (668)Administrative Services 6,271 815 (5,456) (5,456)Human Resources 2,078 (2,078) (2,078)Public Works 14,460 260 $2,273 $1,947 (9,980) (9,980)Planning and Community Environment 8,898 3,074 1,035 15 (4,774) (4,774)Police 20,414 4,415 315 (15,684) (15,684)Fire 17,308 7,565 7 (9,736) (9,736)Community Services 20,864 7,846 583 28 (12,407) (12,407)Non-Departmental 7,618 (7,618) (7,618)Interest on long-term debt 635 (635) (635)
Total Governmental Activities 104,254 24,040 4,213 1,990 (74,011) (74,011)
Business-type Activities:Water 16,047 21,993 $5,946 5,946Electric 73,545 92,617 19,072 19,072Gas 22,994 24,839 1,845 1,845Wastewater Collection 9,203 12,647 3,444 3,444Wastewater Treatment 14,868 14,744 (124) (124)Refuse 24,282 21,923 (2,359) (2,359)Storm Drainage 2,975 2,170 (805) (805)External Services 688 585 (103) (103)
Total Business-type Activities 164,602 191,518 26,916 26,916
Total $268,856 $215,558 $4,213 $1,990 (74,011) 26,916 (47,095)
General revenues:Taxes:
Property taxes 13,707 13,707Sales taxes 18,151 18,151Utility user's taxes 7,152 7,152Transient occupancy tax 5,489 5,489Other taxes and fines 8,493 8,493
Investment earnings 326 387 713Rents and miscellaneous 10,165 10,165
Transfers 14,951 (14,951)
Total general revenues and transfers 78,434 (14,564) 63,870
Change in Net Assets 4,423 12,352 16,775
Net Assets-Beginning 446,881 509,921 956,802
Net Assets-Ending $451,304 $522,273 $973,577
See accompanying notes to financial statements
…………………………………………………………………………………………………………… 24 City of Palo Alto

Basic Financial Statements
Fund Financial Statements……………………
Introduction GASB 34 revises the format of the Fund Financial Statements so that only individual major funds are presented, while non-major funds are combined in a single column. Major funds are defined generally as having significant activities or balances in the current year. The practice of combining like funds and presenting their totals in separate columns (Combined Financial Statements) has been discontinued, along with the use of the General Fixed Assets and General Long-term Debt Groups of Accounts.
Major Governmental Funds The funds described below were determined to be Major Funds by the City in fiscal year 2003-04. Individual non-major funds may be found in the Supplemental section.
General Fund The General Fund is used for all the general revenues of the City not specifically levied or collected for other City funds, and related expenditures.
Housing In-Lieu Special Revenue Fund The Housing In-Lieu Special Revenue Fund is used to account for revenues from commercial and residential developers to provide housing under the City’s Below Market Rate program.
Capital Projects Fund The Capital Projects Fund is utilized to account for resources used for the acquisition and construction of capital facilities by the City, with the exception of those assets financed by proprietary funds.
……………….……….……………………………………………………………………………………………. City of Palo Alto 25
Basic Financial Statements
…………………………………………………………………………………………………………… 26 City of Palo Alto
This page is intentionally left blank.

Basic Financial Statements
Balance Sheet - June 30, 2004
(In thousands of dollars)
Housing Capital Other Total In-Lieu Projects Governmental Governmental
General Fund Fund Funds Funds
Cash and investments (Note 3):Available for operations $59,779 $3,719 $15,299 $5,024 $83,821Cash and investments with fiscal agent 6,034 1,413 7,447
ReceivablesAccounts and intergovernmental 6,848 243 428 7,519Special Assessment 420 420Interest receivable 1,239 46 4 71 1,360Notes receivable (Note 5) 1,256 7,312 4,667 13,235
Interfund receivables and advances (Note 4) 439 439Inventory of materials and supplies 2,506 2,506
Total Assets $72,067 $11,077 $21,580 $12,023 $116,747
Accounts payable and accrued liabilities $1,990 $156 $478 $162 $2,786Accrued salaries and benefits 3,086 69 3,155Deferred revenue 137 420 557Interfund payable and advances (Note 4) 32 311 343
Total Liabilities 5,245 156 547 893 6,841
Reserved for: (Note 10):Encumbrances 2,973 940 9,314 796 14,023Downtown parking structure 1,300 1,300Notes 1,256 7,312 4,667 13,235Inventory of materials and supplies 2,506 2,506Debt service 1,461 1,461Debt proceeds
Unreserved, designated for:Special revenue projects 2,625 4,080 6,705Equity transfer stabilization 2,338 2,338Reappropriations 401 44 10,419 10,864Budget stabilization 21,467 21,467Infrastructure 35,881 35,881
Unreserved undesignated, reported inSpecial Revenue Funds 126 126
Total Fund Balances 66,822 10,921 21,033 11,130 109,906
Total Liabilities and Fund Balances $72,067 $11,077 $21,580 $12,023 $116,747
LIABILITIES
ASSETS
City of Palo Alto - Governmental Funds ………………..…………………..……………
FUND BALANCES
See accompanying notes to financial statements
……………….……….……………………………………………………………………………………………. City of Palo Alto 27
Basic Financial Statements
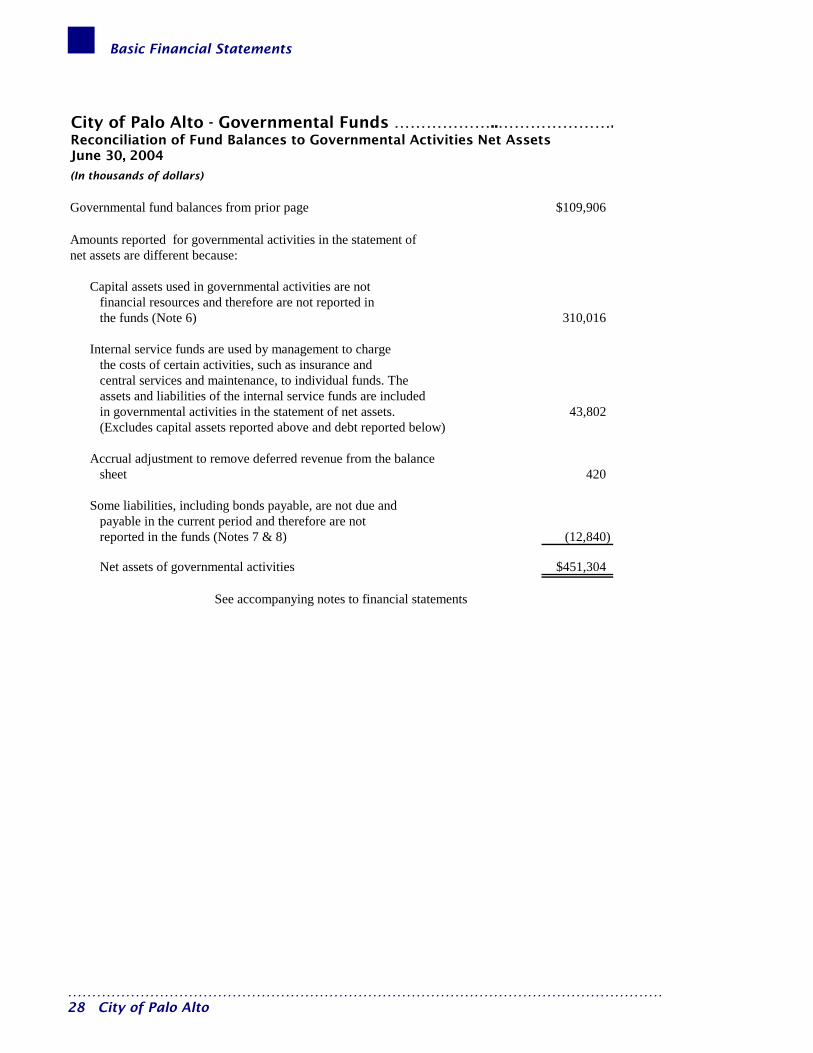
City of Palo Alto - Governmental Funds ………………..………………….Reconciliation of Fund Balances to Governmental Activities Net Assets
Governmental fund balances from prior page $109,906
Amounts reported for governmental activities in the statement of net assets are different because:
Capital assets used in governmental activities are not financial resources and therefore are not reported in the funds (Note 6) 310,016
Internal service funds are used by management to chargethe costs of certain activities, such as insurance and central services and maintenance, to individual funds. Theassets and liabilities of the internal service funds are includedin governmental activities in the statement of net assets. 43,802(Excludes capital assets reported above and debt reported below)
Accrual adjustment to remove deferred revenue from the balancesheet 420
Some liabilities, including bonds payable, are not due and payable in the current period and therefore are not reported in the funds (Notes 7 & 8) (12,840)
Net assets of governmental activities $451,304
See accompanying notes to financial statements
June 30, 2004
(In thousands of dollars)
…………………………………………………………………………………………………………… 28 City of Palo Alto
Basic Financial Statements
……………….……….……………………………………………………………………………………………. City of Palo Alto 29
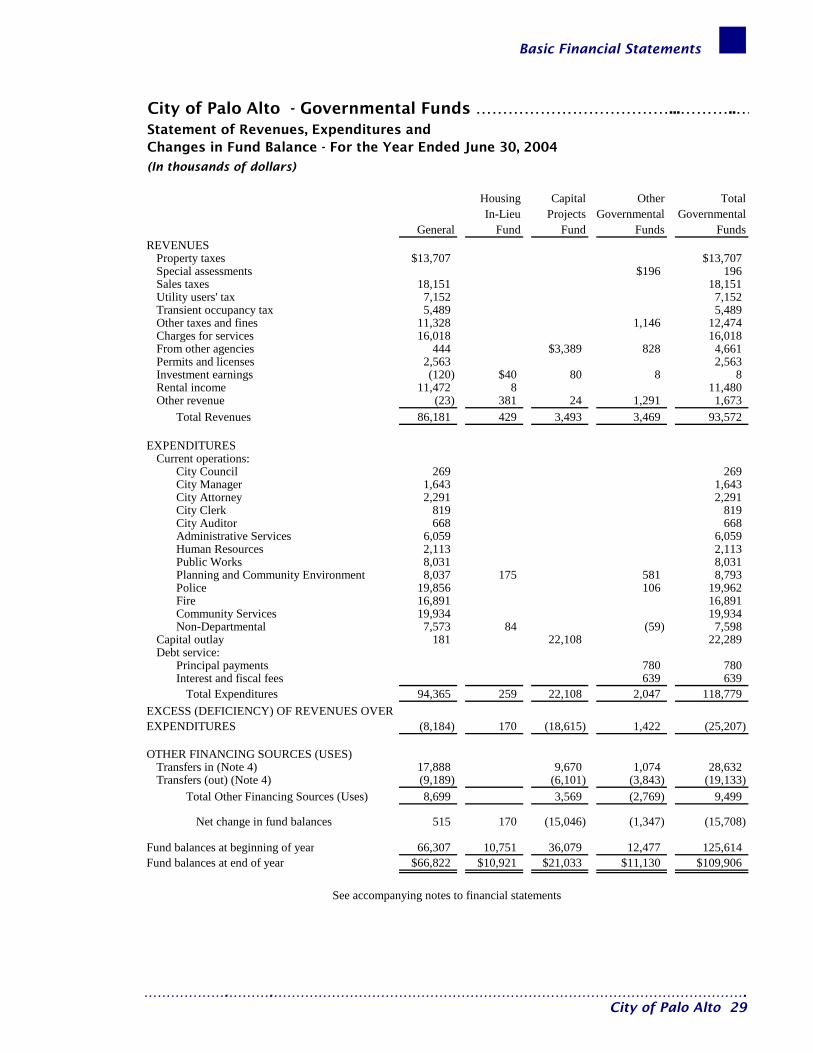
City of Palo Alto - Governmental Funds ………………………………...………..…Statement of Revenues, Expenditures and Changes in Fund Balance - For the Year Ended June 30, 2004
(In thousands of dollars)
Housing Capital Other TotalIn-Lieu Projects Governmental Governmental
General Fund Fund Funds FundsREVENUES
Property taxes $13,707 $13,707Special assessments $196 196Sales taxes 18,151 18,151Utility users' tax 7,152 7,152Transient occupancy tax 5,489 5,489Other taxes and fines 11,328 1,146 12,474Charges for services 16,018 16,018From other agencies 444 $3,389 828 4,661Permits and licenses 2,563 2,563Investment earnings (120) $40 80 8 8Rental income 11,472 8 11,480Other revenue (23) 381 24 1,291 1,673
Total Revenues 86,181 429 3,493 3,469 93,572
EXPENDITURESCurrent operations:
City Council 269 269City Manager 1,643 1,643City Attorney 2,291 2,291City Clerk 819 819City Auditor 668 668Administrative Services 6,059 6,059Human Resources 2,113 2,113Public Works 8,031 8,031Planning and Community Environment 8,037 175 581 8,793Police 19,856 106 19,962Fire 16,891 16,891Community Services 19,934 19,934Non-Departmental 7,573 84 (59) 7,598
Capital outlay 181 22,108 22,289Debt service:
Principal payments 780 780Interest and fiscal fees 639 639
Total Expenditures 94,365 259 22,108 2,047 118,779
(8,184) 170 (18,615) 1,422 (25,207)
OTHER FINANCING SOURCES (USES)Transfers in (Note 4) 17,888 9,670 1,074 28,632Transfers (out) (Note 4) (9,189) (6,101) (3,843) (19,133)
Total Other Financing Sources (Uses) 8,699 3,569 (2,769) 9,499
Net change in fund balances 515 170 (15,046) (1,347) (15,708)
Fund balances at beginning of year 66,307 10,751 36,079 12,477 125,614Fund balances at end of year $66,822 $10,921 $21,033 $11,130 $109,906
EXCESS (DEFICIENCY) OF REVENUES OVER EXPENDITURES
See accompanying notes to financial statements
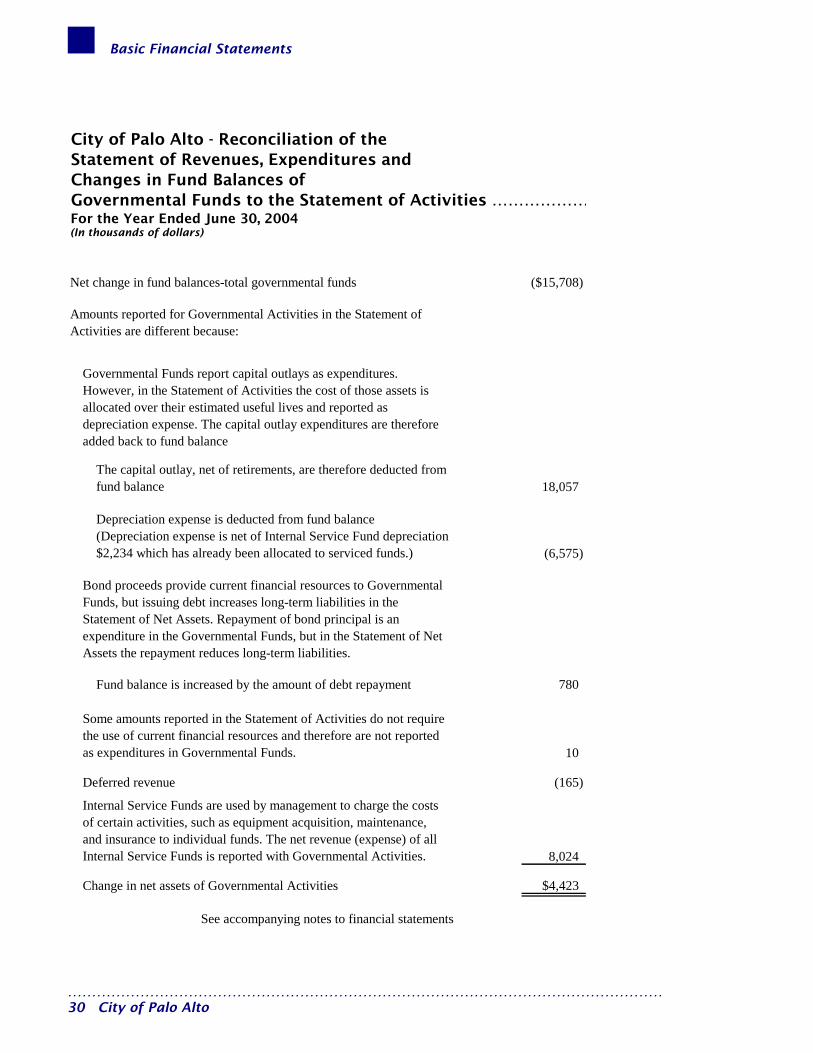
Basic Financial Statements
City of Palo Alto - Reconciliation of the Statement of Revenues, Expenditures and Changes in Fund Balances of Governmental Funds to the Statement of Activities ………………For the Year Ended June 30, 2004(In thousands of dollars)
Net change in fund balances-total governmental funds ($15,708)
18,057
(6,575)
Fund balance is increased by the amount of debt repayment 780
10
Deferred revenue (165)
8,024
Change in net assets of Governmental Activities $4,423
Amounts reported for Governmental Activities in the Statement of Activities are different because:
Some amounts reported in the Statement of Activities do not require the use of current financial resources and therefore are not reported as expenditures in Governmental Funds.
See accompanying notes to financial statements
Governmental Funds report capital outlays as expenditures. However, in the Statement of Activities the cost of those assets is allocated over their estimated useful lives and reported as depreciation expense. The capital outlay expenditures are therefore added back to fund balance
Depreciation expense is deducted from fund balance (Depreciation expense is net of Internal Service Fund depreciation $2,234 which has already been allocated to serviced funds.)
Bond proceeds provide current financial resources to Governmental Funds, but issuing debt increases long-term liabilities in the Statement of Net Assets. Repayment of bond principal is an expenditure in the Governmental Funds, but in the Statement of Net Assets the repayment reduces long-term liabilities.
Internal Service Funds are used by management to charge the costs of certain activities, such as equipment acquisition, maintenance, and insurance to individual funds. The net revenue (expense) of all Internal Service Funds is reported with Governmental Activities.
The capital outlay, net of retirements, are therefore deducted from fund balance
…………………………………………………………………………………………………………… 30 City of Palo Alto

Basic Financial Statements
City of Palo Alto - General Fund …………………………………..….…………Statement of Revenues, Expenditures and Changes in Fund Balance Budget and Actual - For the Year Ended June 30, 2004
(In thousands of dollars)
Variance fromBudgeted Amount Final Budget
Actual Amount PositiveAdopted Adjusted Budgetary Basis (Negative)
REVENUESProperty taxes $13,556 $14,100 $13,740 ($360)Sales taxes 19,335 17,400 18,151 751Utility users' tax 7,498 7,300 7,152 (148)Transient occupancy tax 6,300 5,549 5,489 (60)Other taxes, fines & penalties 6,724 9,305 11,295 1,990Charges for services 17,678 17,755 16,018 (1,737)Permits and licenses 4,721 3,403 2,560 (843)Charges to other funds 8,816 9,396 9,309 (87)Rental income 11,658 11,658 11,472 (186)Other revenues 10,462 6,967 2,225 (4,742)Transfers in 14,476 14,383 17,888 3,505Prior year encumbrance and reappropriations 4,279 4,279
Total Revenues 121,224 121,495 119,578 (1,917)
EXPENDITURESCurrent operations:
Administrative Departments 14,738 16,595 15,902 693Community Services 24,946 25,660 24,273 1,387Fire 18,917 19,054 18,979 75Planning and Community Environment 8,946 10,309 9,313 996Police 23,609 23,999 22,282 1,717Public Works 11,348 11,634 10,517 1,117Non-Departmental 6,459 6,242 7,677 (1,435)Transfers out 11,747 7,403 9,180 1,777
Total Use of Funds 120,710 120,896 118,123 6,327
EXCESS OF REVENUES - BUDGETARY BASIS $514 $599 1,455 $856
Adjustments to Budgetary Basis:Current year encumbrance/reappropriations 3,244Prior year encumbrance/reappropriations (4,289)Current year stores adjustment, net (14)Prior year stores adjustment 119
EXCESS OF REVENUES - GAAP BASIS 515
Fund balances at beginning of year 66,307
Fund balances at end of year, GAAP basis $66,822
See accompanying notes to financial statements
……………….……….……………………………………………………………………………………………. City of Palo Alto 31
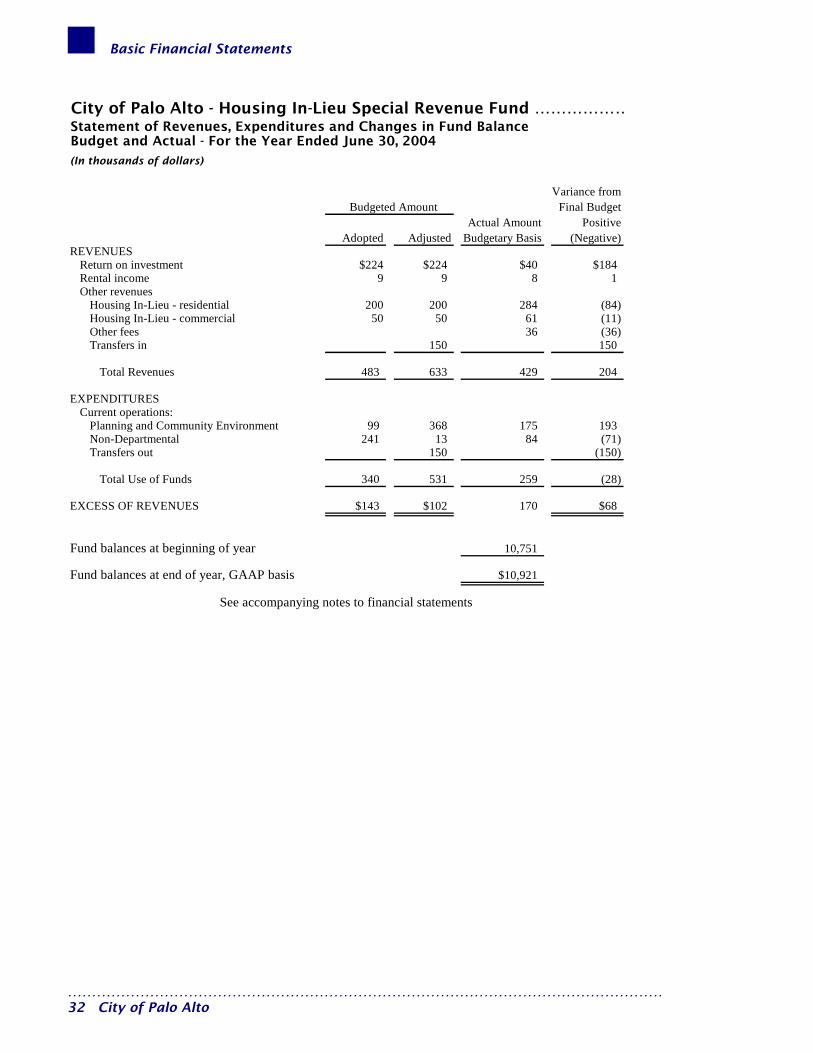
Basic Financial Statements
…………………………………………………………………………………………………………… 32 City of Palo Alto
City of Palo Alto - Housing In-Lieu Special Revenue Fund ………………Statement of Revenues, Expenditures and Changes in Fund Balance Budget and Actual - For the Year Ended June 30, 2004
(In thousands of dollars)
Variance fromBudgeted Amount Final Budget
Actual Amount PositiveAdopted Adjusted Budgetary Basis (Negative)
REVENUESReturn on investment $224 $224 $40 $184Rental income 9 9 8 1Other revenues
Housing In-Lieu - residential 200 200 284 (84)Housing In-Lieu - commercial 50 50 61 (11)Other fees 36 (36)Transfers in 150 150
Total Revenues 483 633 429 204
EXPENDITURESCurrent operations:
Planning and Community Environment 99 368 175 193Non-Departmental 241 13 84 (71)Transfers out 150 (150)
Total Use of Funds 340 531 259 (28)
EXCESS OF REVENUES $143 $102 170 $68
Fund balances at beginning of year 10,751
Fund balances at end of year, GAAP basis $10,921
See accompanying notes to financial statements

Basic Financial Statements
Proprietary Funds……………………………………..
Introduction Proprietary Funds account for City operations financed and operated in a manner similar to a private business enterprise. The intent of the City is that the cost of providing goods and services be financed primarily through user charges. The concept of Major Funds established by GASB Statement 34 extends to Enterprise Funds. The City has elected to treat all of its Enterprise Funds as Major Funds in fiscal year 2003-04. GASB 34 does not provide for the disclosure of budget versus actual comparisons for the Proprietary Funds.
Water Services Fund This fund accounts for all financial transactions relating to the City’s Water service. Services are on a user charge basis to residents and business owners located in Palo Alto.
Electric Services Fund This fund accounts for all financial transactions relating to the City’s Electric service. Services are on a user charge basis to residents and business owners located in Palo Alto.
Gas Services Fund This fund accounts for all financial transactions relating to the City’s Gas service. Services are on a user charge basis to residents and business owners located in Palo Alto.
Wastewater Collection Fund This fund accounts for all financial transactions relating to the City’s Wastewater Collection service. Collections are on a user charge basis to residents and business owners located in Palo Alto.
Wastewater Treatment Fund This fund accounts for all financial transactions relating to the City’s Wastewater Treatment. Services are on a user charge basis to residents and business owners located in Palo Alto.
Refuse Services Fund This fund accounts for all financial transactions relating to the City’s Refuse service. Services are on a user charge basis to residents and business owners located in Palo Alto.
Storm Drainage Services Fund This fund accounts for all financial transactions relating to the City’s Storm Drain service. Services are on a user charge basis to residents and business owners located in Palo Alto.
External Service Fund This fund accounts for all financial transactions relating to the City’s External Services provided to surrounding communities. Service charges are established on a case-by-case basis.
……………….……….…………………………………………………………………………………………….
City of Palo Alto 33
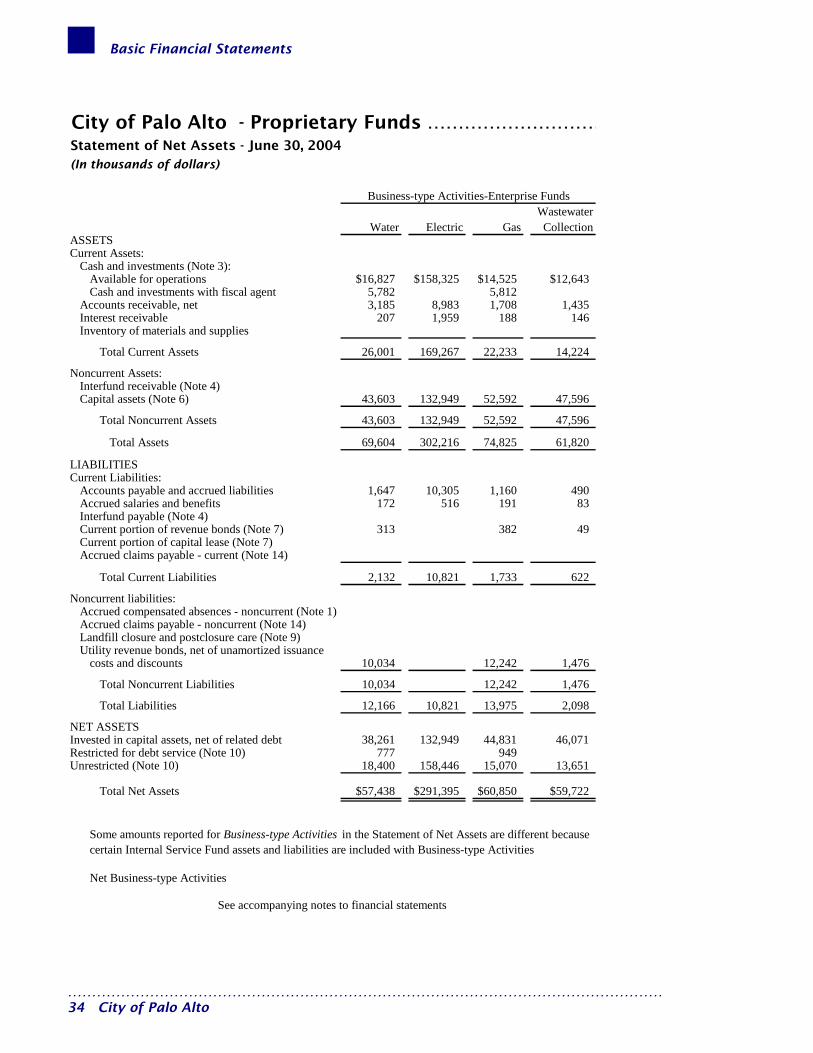
Basic Financial Statements
City of Palo Alto - Proprietary Funds ………………………Statement of Net Assets - June 30, 2004(In thousands of dollars)
WastewaterWater Electric Gas Collection
Current Assets:Cash and investments (Note 3):
Available for operations $16,827 $158,325 $14,525 $12,643Cash and investments with fiscal agent 5,782 5,812
Accounts receivable, net 3,185 8,983 1,708 1,435Interest receivable 207 1,959 188 146Inventory of materials and supplies
Total Current Assets 26,001 169,267 22,233 14,224
Noncurrent Assets:Interfund receivable (Note 4)Capital assets (Note 6) 43,603 132,949 52,592 47,596
Total Noncurrent Assets 43,603 132,949 52,592 47,596
Total Assets 69,604 302,216 74,825 61,820
Current Liabilities:Accounts payable and accrued liabilities 1,647 10,305 1,160 490Accrued salaries and benefits 172 516 191 83Interfund payable (Note 4)Current portion of revenue bonds (Note 7) 313 382 49Current portion of capital lease (Note 7)Accrued claims payable - current (Note 14)
Total Current Liabilities 2,132 10,821 1,733 622
Noncurrent liabilities:Accrued compensated absences - noncurrent (Note 1)Accrued claims payable - noncurrent (Note 14)Landfill closure and postclosure care (Note 9)Utility revenue bonds, net of unamortized issuance
costs and discounts 10,034 12,242 1,476
Total Noncurrent Liabilities 10,034 12,242 1,476
Total Liabilities 12,166 10,821 13,975 2,098
Invested in capital assets, net of related debt 38,261 132,949 44,831 46,071Restricted for debt service (Note 10) 777 949Unrestricted (Note 10) 18,400 158,446 15,070 13,651
Total Net Assets $57,438 $291,395 $60,850 $59,722
Net Business-type Activities
Business-type Activities-Enterprise Funds
Some amounts reported for Business-type Activities in the Statement of Net Assets are different because certain Internal Service Fund assets and liabilities are included with Business-type Activities
See accompanying notes to financial statements
ASSETS
LIABILITIES
NET ASSETS
…
…………………………………………………………………………………………………………… 34 City of Palo Alto
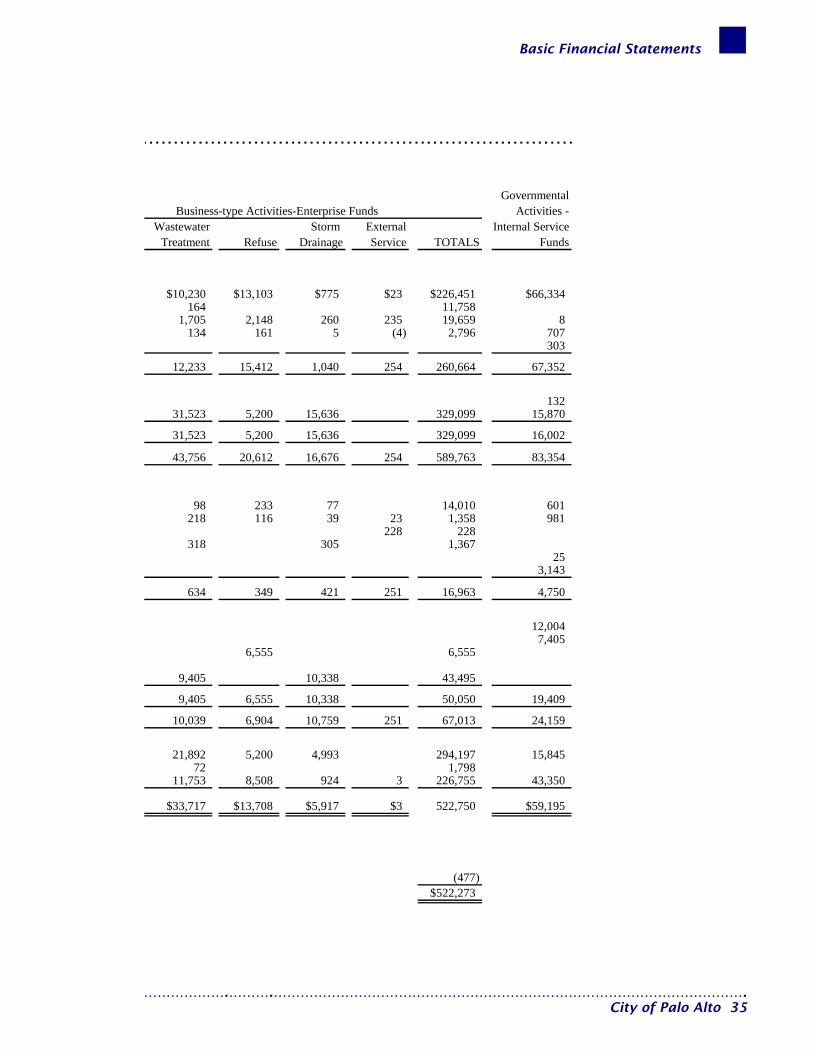
Basic Financial Statements
………………………………………………………………
GovernmentalActivities -
Wastewater Storm External Internal ServiceTreatment Refuse Drainage Service TOTALS Funds
$10,230 $13,103 $775 $23 $226,451 $66,334164 11,758
1,705 2,148 260 235 19,659 8134 161 5 (4) 2,796 707
303
12,233 15,412 1,040 254 260,664 67,352
13231,523 5,200 15,636 329,099 15,870
31,523 5,200 15,636 329,099 16,002
43,756 20,612 16,676 254 589,763 83,354
98 233 77 14,010 601218 116 39 23 1,358 981
228 228318 305 1,367
253,143
634 349 421 251 16,963 4,750
12,0047,405
6,555 6,555
9,405 10,338 43,495
9,405 6,555 10,338 50,050 19,409
10,039 6,904 10,759 251 67,013 24,159
21,892 5,200 4,993 294,197 15,84572 1,798
11,753 8,508 924 3 226,755 43,350
$33,717 $13,708 $5,917 $3 522,750 $59,195
(477)$522,273
Business-type Activities-Enterprise Funds
……………….……….……………………………………………………………………………………………. City of Palo Alto 35
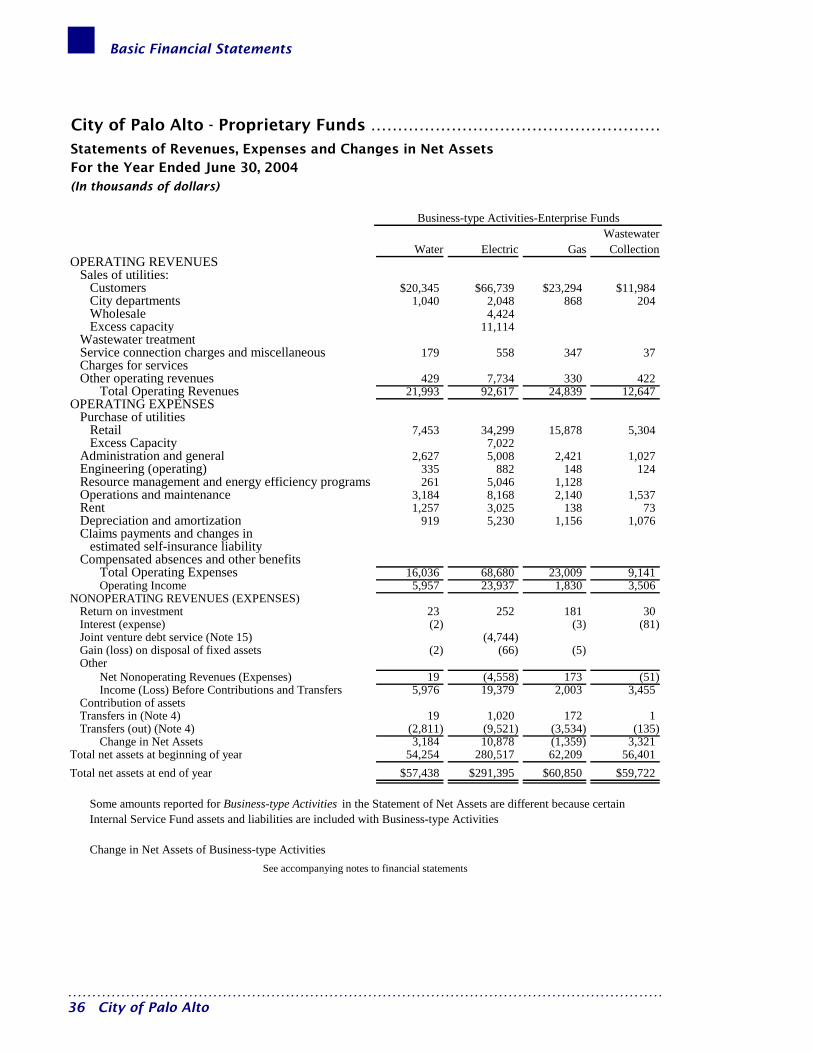
Basic Financial Statements
City of Palo Alto - Proprietary Funds ………………………………………………
For the Year Ended June 30, 2004(In thousands of dollars)
WastewaterWater Electric Gas Collection
OPERATING REVENUESSales of utilities:
Customers $20,345 $66,739 $23,294 $11,984City departments 1,040 2,048 868 204Wholesale 4,424Excess capacity 11,114
Wastewater treatmentService connection charges and miscellaneous 179 558 347 37Charges for servicesOther operating revenues 429 7,734 330 422
Total Operating Revenues 21,993 92,617 24,839 12,647OPERATING EXPENSES
Purchase of utilitiesRetail 7,453 34,299 15,878 5,304Excess Capacity 7,022
Administration and general 2,627 5,008 2,421 1,027Engineering (operating) 335 882 148 124Resource management and energy efficiency programs 261 5,046 1,128Operations and maintenance 3,184 8,168 2,140 1,537Rent 1,257 3,025 138 73Depreciation and amortization 919 5,230 1,156 1,076Claims payments and changes in
estimated self-insurance liabilityCompensated absences and other benefits
Total Operating Expenses 16,036 68,680 23,009 9,141Operating Income 5,957 23,937 1,830 3,506
NONOPERATING REVENUES (EXPENSES)Return on investment 23 252 181 30Interest (expense) (2) (3) (81)Joint venture debt service (Note 15) (4,744)Gain (loss) on disposal of fixed assets (2) (66) (5)Other
Net Nonoperating Revenues (Expenses) 19 (4,558) 173 (51)Income (Loss) Before Contributions and Transfers 5,976 19,379 2,003 3,455
Contribution of assetsTransfers in (Note 4) 19 1,020 172 1Transfers (out) (Note 4) (2,811) (9,521) (3,534) (135)
Change in Net Assets 3,184 10,878 (1,359) 3,321Total net assets at beginning of year 54,254 280,517 62,209 56,401Total net assets at end of year $57,438 $291,395 $60,850 $59,722
Change in Net Assets of Business-type ActivitiesSee accompanying notes to financial statements
Statements of Revenues, Expenses and Changes in Net Assets
Business-type Activities-Enterprise Funds
Some amounts reported for Business-type Activities in the Statement of Net Assets are different because certain Internal Service Fund assets and liabilities are included with Business-type Activities
…………………………………………………………………………………………………………… 36 City of Palo Alto
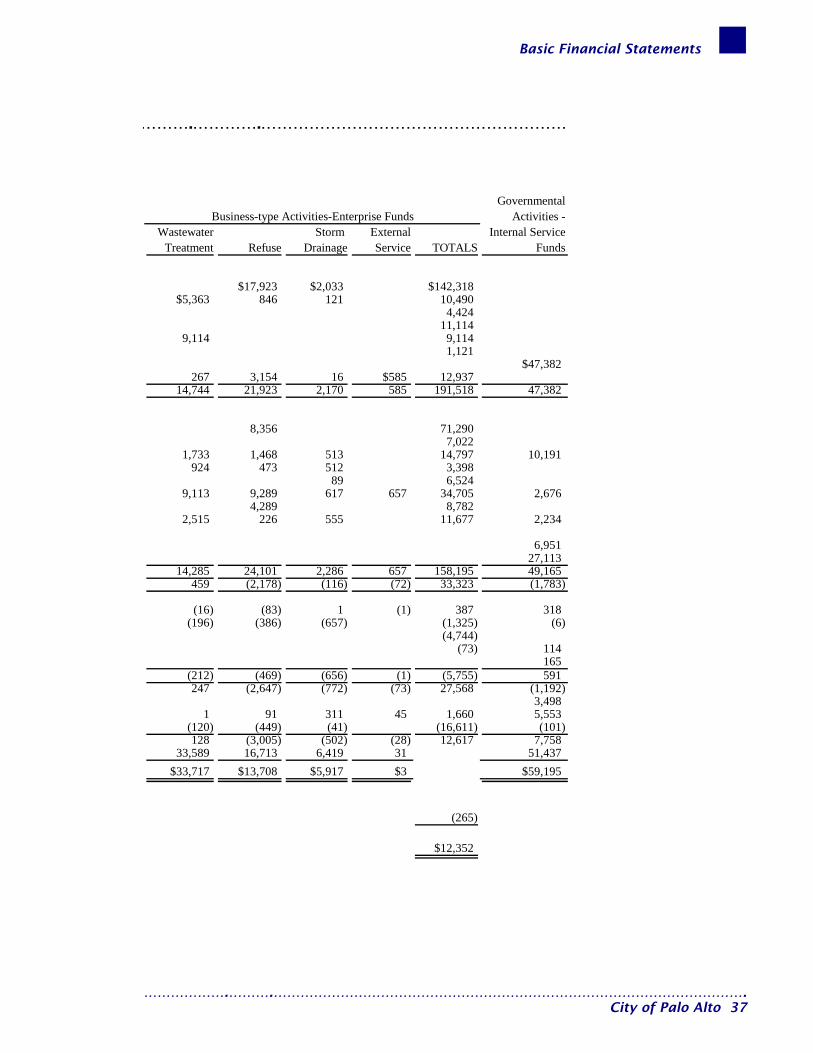
Basic Financial Statements
……….………….…………………………………………………
GovernmentalActivities -
Wastewater Storm External Internal ServiceTreatment Refuse Drainage Service TOTALS Funds
$17,923 $2,033 $142,318$5,363 846 121 10,490
4,42411,114
9,114 9,1141,121
$47,382267 3,154 16 $585 12,937
14,744 21,923 2,170 585 191,518 47,382
8,356 71,2907,022
1,733 1,468 513 14,797 10,191924 473 512 3,398
89 6,5249,113 9,289 617 657 34,705 2,676
4,289 8,7822,515 226 555 11,677 2,234
6,95127,113
14,285 24,101 2,286 657 158,195 49,165459 (2,178) (116) (72) 33,323 (1,783)
(16) (83) 1 (1) 387 318(196) (386) (657) (1,325) (6)
(4,744)(73) 114
165(212) (469) (656) (1) (5,755) 591247 (2,647) (772) (73) 27,568 (1,192)
3,4981 91 311 45 1,660 5,553
(120) (449) (41) (16,611) (101)128 (3,005) (502) (28) 12,617 7,758
33,589 16,713 6,419 31 51,437$33,717 $13,708 $5,917 $3 $59,195
(265)
$12,352
Business-type Activities-Enterprise Funds
……………….……….……………………………………………………………………………………………. City of Palo Alto 37

Basic Financial Statements
City of Palo Alto - Proprietary Funds ………………………………………………
Statement of Cash Flows - For the Year Ended June 30, 2004
(In thousands of dollars)
WastewaterWater Electric Gas Collection
CASH FLOWS FROM OPERATING ACTIVITIES:Receipts from customers $19,918 $90,604 $24,589 $11,961Payments to suppliers (12,044) (52,272) (19,639) (6,922)Payments to employees (2,455) (4,492) (2,230) (944)Internal activity - receipts from other funds 1,040 2,048 868 204Claims paidOther receipts (payments) 429 330 422
Net Cash From Operating Activities 6,888 35,888 3,918 4,721
CASH FLOWS FROM NONCAPITAL FINANCING ACTIVITIES:Interfund receipts (payments)Transfers in 19 1,020 172 1Transfers (out) (2,811) (9,521) (3,534) (135)
Net Cash From Noncapital Financing Activities (2,792) (8,501) (3,362) (134)
CASH FLOWS FROM CAPITAL FINANCING ACTIVITIES:Acquisition and construction of fixed assets (4,076) (10,327) (6,264) (3,248)Proceeds from sale of capital assetsPrincipal paid on long-term debt (296) (360) (33)Interest paid on long-term debt (2) (4,744) (3) (81)
Cash Flows From Capital Financing Activities (4,374) (15,071) (6,627) (3,362)
CASH FLOWS FROM INVESTING ACTIVITIES:Interest on investments 37 218 258 23
Net Cash Flows (241) 12,534 (5,813) 1,248Cash and cash equivalents at beginning of year 22,850 145,791 26,150 11,395Cash and cash equivalents at end of year $22,609 $158,325 $20,337 $12,643
FINANCIAL STATEMENT PRESENTATION:Cash and investments available for operations $16,827 $158,325 $14,525 $12,643Cash and investments with fiscal agent 5,782 5,812
Cash and cash equivalents at end of year $22,609 $158,325 $20,337 $12,643
Reconciliation of operating income (loss) to Cash Flows from Operating ActivitiesOperating income (loss) $5,957 $23,937 $1,830 $3,506
Depreciation and amortization 919 5,230 1,156 1,076OtherChanges in assets and liabilities:
Accounts receivable (606) 35 948 (60)Inventory of materials and suppliesAccounts and other payables 618 6,686 (16) 199Accrued claims payable and other liabilitiesNet Cash From Operating Activities $6,888 $35,888 $3,918 $4,721
Capital Asset contributions
Business-type Activities-Enterprise Funds
Adjustments to reconcile operating income (loss) to cash flows from operating activities:
See accompanying notes to financial statements
…………………………………………………………………………………………………………… 38 City of Palo Alto
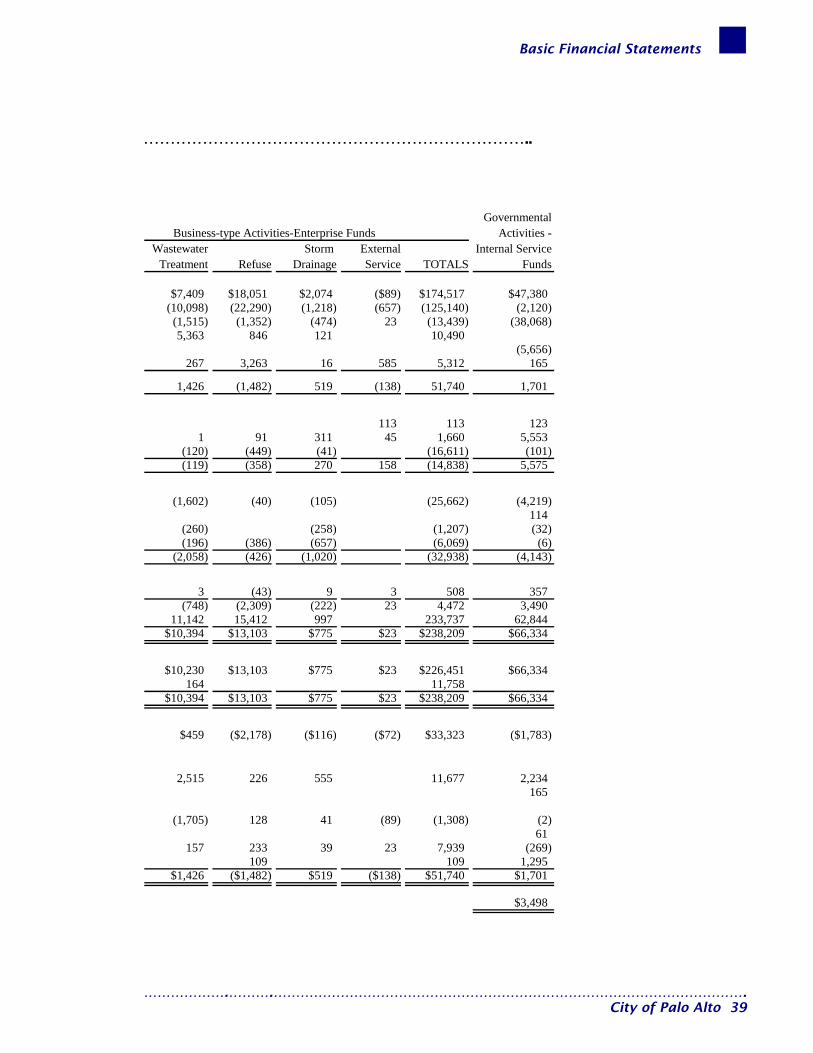
Basic Financial Statements
………………………………………………………………..
GovernmentalActivities -
Wastewater Storm External Internal ServiceTreatment Refuse Drainage Service TOTALS Funds
$7,409 $18,051 $2,074 ($89) $174,517 $47,380(10,098) (22,290) (1,218) (657) (125,140) (2,120)
(1,515) (1,352) (474) 23 (13,439) (38,068)5,363 846 121 10,490
(5,656)267 3,263 16 585 5,312 165
1,426 (1,482) 519 (138) 51,740 1,701
113 113 1231 91 311 45 1,660 5,553
(120) (449) (41) (16,611) (101)(119) (358) 270 158 (14,838) 5,575
(1,602) (40) (105) (25,662) (4,219)114
(260) (258) (1,207) (32)(196) (386) (657) (6,069) (6)
(2,058) (426) (1,020) (32,938) (4,143)
3 (43) 9 3 508 357(748) (2,309) (222) 23 4,472 3,490
11,142 15,412 997 233,737 62,844$10,394 $13,103 $775 $23 $238,209 $66,334
$10,230 $13,103 $775 $23 $226,451 $66,334164 11,758
$10,394 $13,103 $775 $23 $238,209 $66,334
$459 ($2,178) ($116) ($72) $33,323 ($1,783)
2,515 226 555 11,677 2,234165
(1,705) 128 41 (89) (1,308) (2)61
157 233 39 23 7,939 (269)109 109 1,295
$1,426 ($1,482) $519 ($138) $51,740 $1,701
$3,498
Business-type Activities-Enterprise Funds
……………….……….……………………………………………………………………………………………. City of Palo Alto 39
Basic Financial Statements
This page is intentionally left blank.
…………………………………………………………………………………………………………… 40 City of Palo Alto
Basic Financial Statements
Fiduciary Funds ……………………………………
Introduction These funds account for assets held by the City in trust or as an agent for various assessment and community facilities districts. The financial activities of these funds are excluded from the Citywide financial statements, but are presented in separate Fiduciary Fund financial statements.
……………….……….……………………………………………………………………………………………. City of Palo Alto 41

Basic Financial Statements
…………………………………………………………………………………………………………… 42 City of Palo Alto
This page is intentionally left blank.
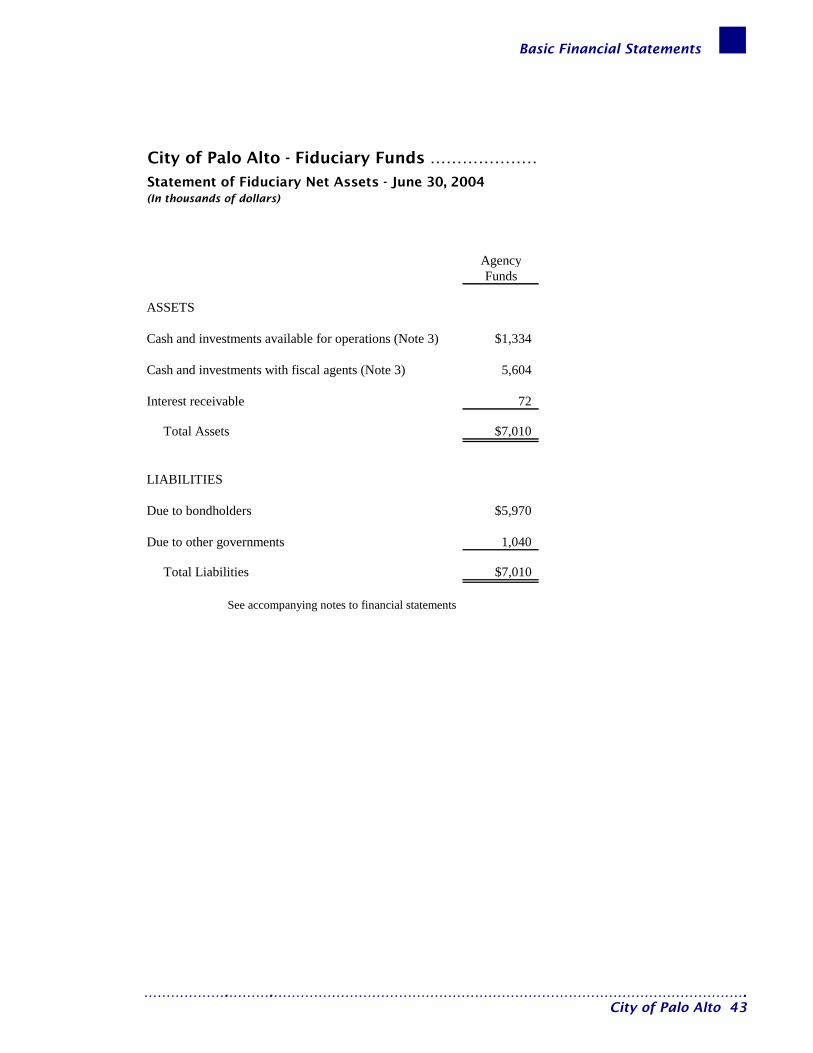
Basic Financial Statements
City of Palo Alto - Fiduciary Funds …………………
Statement of Fiduciary Net Assets - June 30, 2004(In thousands of dollars)
AgencyFunds
ASSETS
Cash and investments available for operations (Note 3) $1,334
Cash and investments with fiscal agents (Note 3) 5,604
Interest receivable 72
Total Assets $7,010
LIABILITIES
Due to bondholders $5,970
Due to other governments 1,040
Total Liabilities $7,010
See accompanying notes to financial statements
……………….……….……………………………………………………………………………………………. City of Palo Alto 43
Basic Financial Statements
This page is intentionally left blank.
…………………………………………………………………………………………………………… 44 City of Palo Alto

Notes

This page is intentionally left blank.

Notes to Basic Financial Statements
Index………………………………………………
Page
1. Summary of Significant Accounting Polices 47
2. Budgets and Budgetary Accounting 52
3. Cash and Investments 53
4. Interfund Transactions 57
5. Notes and Loans Receivable 60
6. Capital Assets 64
7. General Long-Term Obligations 69
8. Special Assessment Debt 73
9. Landfill Closure and Post-closure Care 75
10. Net Assets and Fund Balances 76
11. Pension Plans 79
12. Retiree Health Benefits 82
13. Deferred Compensation Plan 83
14. Risk Management 83
15. Joint Ventures 85
16. Commitments and Contingencies 89
Notes are essential to present fairly the information contained in the overview level of basic financial statements. Narrative explanations are intended to communicate information that is not readily apparent or cannot be included in the statements and schedules themselves, and to provide additional disclosures as required by the Governmental Accounting Standards Board.
……….……………………………………………………………………………………………. City of Palo Alto 45

Notes to Basic Financial Statements
This page is intentionally left blank.
………………………………………………………………………………………………… City of Palo Alto 46

Notes to Basic Financial Statements – Note 1
Note 1………………………………………………
SUMMARY OF SIGNIFICANT ACCOUNTING POLICIES
The City of Palo Alto was incorporated in 1894 and operates as a charter city, having had its first charter granted by the State of California in 1909. The City operates under the Council-Manager form of government and provides the following services: public safety (police and fire), public works, electric, water, gas, wastewater, storm drain, refuse, golf course, planning and zoning, general administration services, library, open space and science, recreational and human services.
Reporting Entity The City is governed by a nine-member council, elected by City residents. The City is legally separate and fiscally independent which means it can issue debt, set and modify budgets and fees and sue or be sued. The accompanying Basic Financial Statements present the financial activity of the City, which is the primary government presented, along with the financial activities of its component units, which are entities for which the City is financially accountable. Although they are separate legal entities, blended component units are in substance part of the City’s operations and are reported as an integral part of the City’s financial statements. This City’s component units, which are described below are blended. The Palo Alto Public Improvement Corporation provides financing of public capital improvements for the City through the issuance of Certificates of Participation (COPs), a form of debt, which allows investors to participate in a stream of future lease payments. Proceeds from the COPs are used to construct projects which are leased to the City. The lease payments are sufficient in timing and amount to meet the debt service requirements of the COPs. The Corporation is controlled by the City, which performs all accounting and administrative functions for the Corporation. The financial activities of the Corporation are included in the Golf Course and Civic Center Debt Service Funds and the Capital Projects Fund.
The Palo Alto Redevelopment Agency is a separate government entity whose purpose is to prepare and implement plans for improvement, rehabilitation, and development of certain areas within the City. The City Council and the Redevelopment Agency Board are composed of the same individuals. Certain administrative and accounting functions are performed by City staff. The financial activities of the Agency have been included in these financial statements in the Redevelopment Agency Special Revenue Fund. Financial statements for the Palo Alto Public Improvement Corporation and Redevelopment Agency may be obtained from the City of Palo Alto, Administrative Services Department, 250 Hamilton Avenue, Palo Alto, CA 94301.
Basis of Presentation The City’s Basic Financial Statements are prepared in conformity with accounting principles generally accepted in the United States of America. The Government Accounting Standards Board is the acknowledged standard setting body for establishing accounting and financial reporting standards followed by governmental entities in the United States. The accompanying financial statements are presented on the basis set forth in GASB Statements No. 34, Basic Financial Statements—and Management’s Discussion and Analysis—for State and Local Governments, No. 36, Recipient Reporting for Certain Non-exchange Revenues, an Amendment of GASB Statement No. 33, No. 37, Basic Financial Statements—and Management’s Discussion and Analysis—for State and Local Governments; Omnibus, and No. 38, Certain Financial Statement Note Disclosures.
……….………………………………………………………………………………………….. City of Palo Alto 47
Notes to Basic Financial Statements – Note 1
These Statements require that the financial statements described below be presented.
Citywide Statements: The Statement of Net Assets and the Statement of Activities display information about the primary government (the City) and its component units. These statements include the financial activities of the overall City government, except for fiduciary activities. Eliminations have been made to minimize the double counting of internal activities. These statements distinguish between the Governmental and Business-type Activities of the City. Governmental Activities generally are financed through taxes, intergovernmental revenues, and other non-exchange transactions. Business-type Activities are financed in whole or in part by fees charged to external parties. The Statement of Activities presents a comparison between direct expenses and program revenues for each segment of the Business-type Activities of the City and for each function of the City’s Governmental Activities. Direct expenses are those that are specifically associated with a program or function and, therefore, are clearly identifiable to a particular function. Program revenues include (a) charges paid by the recipients of goods or services offered by the programs, (b) grants and contributions that are restricted to meeting the operational needs of a particular program and (c) fees, grants and contributions that are restricted to financing the acquisition or construction of capital assets. Revenues that are not classified as program revenues, including all taxes, are presented as general revenues. Fund Financial Statements: The Fund financial statements provide information about the City's funds, including fiduciary funds and blended component units. Separate statements for each fund category—governmental, proprietary, and fiduciary—are presented. The emphasis of Fund financial statements is on major individual governmental and enterprise funds, each of which is displayed in a separate column. All remaining governmental and enterprise funds are aggregated and reported as non-major funds. Proprietary Fund operating revenues, such as charges for services, result from exchange transactions associated with the principal activity of the fund. Exchange transactions are those in which each party receives and gives up essentially equal values. Non-operating revenues, such as subsidies and investment earnings, result from non-exchange transactions or ancillary activities.
Major Funds GASB Statement 34 defines Major Funds and requires that the City’s Major Governmental and Business-type Funds be identified and presented separately in the Fund financial statements. All other funds, called Non-major Funds, are combined and reported in a single column, regardless of their fund-type. Major Funds are defined as funds that have either assets, liabilities, revenues or expenditures/expenses equal to ten percent of their fund-type total and five percent of the grand total. The General Fund is always a Major Fund. The City may also select other funds it believes should be presented as Major Funds. The City reported the following Major Governmental Funds in the accompanying financial statements:
……………..…………………………………………………………………………………………..
General Fund - This is the City’s primary operating fund. It accounts for all financial resources of the general government, except those required to be accounted for in another fund.
Housing In-Lieu Fund - This fund accounts for revenues from commercial and residential developers to provide housing under the City’s Below Market Rate program.
City of Palo Alto 48

Notes to Basic Financial Statements – Note 1
Capital Projects Fund – This fund accounts for resources used for the acquisition and construction of capital facilities by the City, with the exception of those assets financed by Proprietary Funds. The City reported all its Enterprise Funds as Major Funds in the accompanying financial statements: Water Services Fund- This fund accounts for all financial transactions relating to the City’s Water service. Services are on a user charge basis to residents and business owners located in Palo Alto. Electric Services Fund - This fund accounts for all financial transactions relating to the City’s Electric service. Services are on a user charge basis to residents and business owners located in Palo Alto. Gas Services Fund- This fund accounts for all financial transactions relating to the City’s Gas service. Services are on a user charge basis to residents and business owners located in Palo Alto. Wastewater Collection Services Fund - This fund accounts for all financial transactions relating to the City’s Wastewater Collection. Collections are on a user charge basis to residents and business owners located in Palo Alto. Wastewater Treatment Services Fund- This fund accounts for all financial transactions relating to the City’s Wastewater Treatment. Services are on a user charge basis to residents and business owners located in Palo Alto. Refuse Services Fund- This fund accounts for all financial transactions relating to the City’s Refuse service. Services are on a user charge basis to residents and business owners located in Palo Alto. Storm Drainage Services Fund - This fund accounts for all financial transactions relating to the City’s Storm Drain service. Services are on a user charge basis to residents and business owners located in Palo Alto. External Services Fund- This fund accounts for all financial transactions relating to the City’s External services provided to surrounding communities. The City also reports the following fund types: Internal Service Funds - These funds account for fleet replacement and maintenance, technology, central duplicating, printing and mailing services, administration of compensated absences and health benefits, and the City’s self-insured workers’ compensation and general liability programs, all of which are provided to other departments on a cost-reimbursement basis. Also included is the Retiree Health Benefits Internal Service Fund which accounts for benefits when the amount of actual benefits exceed one and one—half percent of the City’s gross payroll cost in any fiscal period. Fiduciary Funds- These funds account for assets held by the City in trust or as an agent for various assessment and community facilities districts. The financial activities of these funds are excluded from the Citywide financial statements, but are presented in separate Fiduciary Fund financial statements. Agency Funds - These funds are custodial in nature and do not involve measurement of results of operations. The City maintains four agency funds.
……….………………………………………………………………………………………….. City of Palo Alto 49

Notes to Basic Financial Statements – Note 1
Basis of Accounting The Citywide and Proprietary fund financial statements are reported using the economic resources measurement focus and the full accrual basis of accounting. Revenues are recorded when earned and expenses are recorded at the time liabilities are incurred, regardless of when the related cash flows take place. Governmental Funds are reported using the current financial resources measurement focus and the modified accrual basis of accounting. Under this method, revenues are recognized when measurable and available. The City considers all revenues reported in the Governmental Funds to be available if the revenues are collected within ninety days after year-end. Expenditures are recorded when the related fund liability is incurred, except for principal and interest on general long-term debt, claims and judgments, and compensated absences, which are recognized as expenditures to the extent they have matured. General capital asset acquisitions are reported as expenditures in Governmental Funds. Proceeds of general long-term debt and acquisitions under capital leases are reported as other financing sources. Those revenues susceptible to accrual include taxes, intergovernmental revenues, interest and charges for services. Grant revenues are recognized in the fiscal year in which all eligibility requirements are met. Under the terms of grant agreements, the City may fund certain programs with a combination of cost-reimbursement grants, categorical block grants, and general revenues. Thus, both restricted and unrestricted net assets may be available to finance program expenditures. The City’s policy is to first apply restricted grant resources to such programs, followed by general revenues if necessary. Certain indirect costs are included in program expenses reported for individual functions and activities. The City follows those Financial Accounting Standard Board Statements issued before November 30, 1989, which do not conflict with Governmental Accounting Standards Board Statements.
Inventory of Materials and Supplies Materials and supplies are held for consumption and are valued at average cost. The consumption method is used to account for inventories. Under the consumption method, inventories are recorded as an expenditure at the time inventory items are used, rather than purchased.
Compensated Absences The liability for compensated absences includes the vested portions of vacation, sick leave, and overtime compensation pay. The City’s liability for accrued compensated absences is recorded in the General Benefits and Insurance Internal Service Fund. The Fund is reimbursed through payroll charges to all other funds. Earned but unpaid vacation and overtime compensation pay is recognized as an expense or expenditure in the Proprietary and Governmental Fund types when earned because the City has provided financial resources for the full amount through its budgetary process. Vested accumulated sick pay is paid in the event of termination due to disability and under certain conditions specified in employment agreements primarily restricted to individuals with fifteen or more years of continuous service. The City had accumulated vacation and overtime compensation pay of $8.547 million, and vested accumulated sick pay of $3.457 million as of June 30, 2004.
……………..………………………………………………………………………………………….. City of Palo Alto 50
Notes to Basic Financial Statements – Note 1
Property Tax Santa Clara County assesses properties and bills, collects, and distributes property taxes to the City. The County remits the entire amount levied and handles all delinquencies, retaining interest and penalties. Secured and unsecured property taxes are levied on January 1 of the preceding fiscal year. Secured property tax is due in two installments, on November 1 and February 1, and becomes a lien on those dates. It becomes delinquent on December 10 and April 10, respectively. Unsecured property tax is due on July 1, and becomes delinquent on August 31. Collection of delinquent accounts is the responsibility of the County, which retains all penalties. The term “unsecured” refers to taxes on personal property other than real estate, land and buildings. These taxes are secured by liens on the property being taxed. Property tax revenues are recognized by the City in the fiscal year they are assessed, provided they become available as defined above.
New Funds Downtown Business Improvement District Fund was established to account for the activities of the Palo Alto Downtown Business Improvement District, which was established to enhance the viability of the downtown business district.
Rounding All amounts included on the basic financial statements, combining statements, fiduciary statements, footnotes and schedules are presented to the nearest thousands in accordance with the City’s policy.
……….………………………………………………………………………………………….. City of Palo Alto 51

Notes to Basic Financial Statements – Note 2
Note 2………………………………………………
BUDGETS AND BUDGETARY ACCOUNTING 1. The City Manager submits to the City Council a proposed operating budget for the fiscal year
commencing the following July 1. The operating budget includes proposed expenditures and the means of financing them.
2. Public hearings are conducted to obtain public comments.
3. The Adopted budget is legally enacted through passage of a budget ordinance for all funds except for
Agency Funds. 4. The City Manager is authorized to reallocate funds from a contingent account maintained in the
General Fund in conformance with the adopted policies set by the City Council. Additional appropriations to departments in the General Fund, or to total appropriations for all other budgeted funds, or transfers of appropriations between funds, require approval by the City Council. These amendments are added to the Adopted budget and the resulting totals are reflected as Adjusted budget amounts.
5. Expenditures may not legally exceed budgeted appropriations at the department level for the
General Fund, and at the fund level for Special Revenue and Debt Service Funds.
6. Formal budgetary integration is employed as a management control device during the year in all funds except Agency Funds and the Civic Center Refinancing and Downtown Parking Improvement Debt Service Funds.
7. Budgets for governmental funds are adopted on a basis consistent with generally accepted
accounting principles (GAAP) for all funds, except that General Fund encumbrances are treated as budgetary expenditures when incurred and stores (materials, parts and supplies) transactions included in the General Fund are not budgeted.
8. Expenditures for the Capital Projects Fund are budgeted and managed on a project length basis
and budget to actual comparisons for these expenditures have been excluded from the accompanying financial statements.
Excess of Expenditures over Appropriations The funds below incurred expenditures and operating transfers in excess of their budgets in the amounts indicated as the result of unanticipated expenses. Sufficient resources were available within each fund to finance these excesses. The Street Improvement Special Revenue Fund, Golf Course Debt Service Fund, Civic Center Refinancing Debt Service Fund and Parking COP Debt Service Fund actual expenditures and operating transfers out exceeded budget in the amounts of $1 million, $14 thousand, $2 thousand and $4 thousand, respectively.
…………………………………………………………………..……………………………………… City of Palo Alto 52

Notes to Basic Financial Statements – Note 3
Note 3…………………………………………….
CASH AND INVESTMENTS The City pools cash from all sources and all funds except Restricted Cash and Investments with Fiscal Agents so that it can be invested at the maximum yield, consistent with safety and liquidity, while individual funds can make expenditures at any time. Investment income is allocated among funds on the basis of average month-end cash and investment balances in these funds.
Categorization of Credit Risk of Securities Instruments The City invests in individual investments and in investment pools. Individual investments are evidenced by specific identifiable pieces of paper called securities instruments, or by an electronic entry registering the owner in the records of the institution issuing the security, called the book entry system. In order to maximize security, the City employs the Trust Department of a bank as the custodian of all its investments, regardless of their form. The City categorizes its individual securities instruments in ascending order to reflect the relative risk of loss of these instruments. This risk is called Credit Risk, the lower the number, the lower the risk. The three levels of risk prescribed by generally accepted accounting principles are described below: Category 1 - The City is the registered owner of securities held in book entry form by the bank’s Trust Department. Securities instruments in this category are in the City’s name and are in the possession of the Trust Department of the bank employed by the City solely for this purpose. Category 2 - Securities instruments and book entry form securities in this category are in the bank’s name but are held by the Bank’s Trust Department in a separate account in the City’s name. Category 3 - None of the City’s investments are in this category, which would include only City-owned securities instruments or book entry form securities, which were not in the City’s name and not held by the bank’s Trust Department. Pooled Investments - Pooled investments are not categorized because of their pooled rather than individual nature.
……….……………………………………………………………………………………………. City of Palo Alto 53

Notes to Basic Financial Statements – Note 3
Investments are carried at fair value, which is the same as fair market value and are categorized as follows at June 30, 2004 (in thousands):
Cash and InvestmentsAvailable for With FiscalOperations Agents Total
Category 1 Investments: U.S. Treasury and Agency Obligations $354,167 $6,485 $360,652Pooled Investments (non Categorized): Local Agency Investment Fund 23,618 23,618 California Asset Management Program 16,447 16,447 Mutual funds (government securities) 766 1,877 2,643 Total Investments 378,551 24,809 403,360 Cash in banks (overdraft) and on hand (611) (611)Total Cash and Investments $377,940 $24,809 $402,749
The City must maintain required amounts of cash and investments with trustees under the terms of certain debt issues. These funds are unexpended bond proceeds or are pledged as reserves to be used if the City fails to meet its obligations under these debt issues. The California Government Code requires these funds to be invested in accordance with City ordinance, bond indentures or State statute. All these funds have been invested as permitted under the Code. Cash and investments maturing in three months or less at the time of purchase are considered to be liquid assets for purposes of measuring cash flows.
Classification Cash and investments are classified in the financial statements as shown below, based on whether or not their use is restricted under the terms of City debt instruments or Agency agreements (in thousands):
Cash and investments available for operations $376,606Cash and investments with fiscal agents 19,205City cash and investments 395,811Cash and investments available for operations in Fiduciary Funds (separate Statement) 1,334Cash and investments with fiscal agents Fiduciary Funds (separate Statement) 5,604Total cash and investments $402,749
Cash Deposits California Law requires banks and savings and loan institutions to pledge government securities with a market value of 110% of the City’s cash on deposit or first trust deed mortgage notes with a value of 150% of the deposit as collateral for these deposits. Under California Law this collateral is held in the City’s name and places the City ahead of general creditors of the institution. The City has waived collateral requirements for the portion of deposits covered by federal deposit insurance. Cash in banks is entirely insured (Category 1) or collateralized by the institution holding the deposit (Category 2), as discussed above. Bank balances before reconciling items were $1.849 million, of which $100 thousand was insured (Category 1) and $1.749 million was collateralized as discussed above (Category 2) at June 30, 2004. ………………………………………………………………………………………………… 54 City of Palo Alto
Notes to Basic Financial Statements – Note 3
Market Risk and Investment Maturities Market risk is the risk that investments will decline in market value. The City limits market risk by limiting the types and maturities of its investments and by not borrowing against its investments. Investment yield is ranked after safety and liquidity in making investment decisions. All investments are held to maturity and maturities are matched to the City’s projected cash flow needs. Investments managed by the City mature as follows at June 30, 2004 (in thousands):
FairType of Investment Value
Local Agency Investment Fund $23,618Mutual funds (government securities) 766U.S. Treasury and Agency Obligations:
Maturities of less than 1 year 52,069Maturities of 1 to 3 years 178,713Maturities of 3 to 5 years 97,201Maturities of 5 to 10 years 26,125Mortgage Backed Securities, Maturing in 15 Years 59
Total Investments Available for Operations $378,551
Authorized City Investments Investment instruments authorized for purchase include: 1. Securities of the U.S. Government or its agencies. The maximum stated final maturity of
individual securities in the portfolio shall not exceed ten years. No limit on purchase of these securities, except for Callable and Multi-step-up agency securities, limited to no more than twenty percent of the City’s portfolio, provided that: • the potential call dates are known at the time of purchase; • the interest rates at which they “step-up” are known at the time of purchase; and • the entire face value of the security is redeemed at the call date.
2. Certificates of Deposit (or Time Deposits) with federally insured institutions. No more than twenty
percent of the City’s portfolio may be invested in CD’s. Rollovers are not permitted without specific instruction from authorized City staff.
3. Bankers Acceptance Notes. Purchases from any one bank may not exceed $5 million, and total
bankers acceptance notes may not exceed thirty percent of the City’s investment portfolio. 4. Short-term Commercial Paper. Purchases of commercial paper may not exceed 180 days maturity
or more than fifteen percent of the City’s investment portfolio, and purchases from any one institution may not exceed $3 million.
5. State of California Local Agency Investment Fund. 6. Short-term Repurchase Agreements (REPO). Agreement shall not exceed one year and market
value of securities that underlay a repurchase agreement shall be valued at 102 percent or greater of the funds borrowed against those securities.
……….……………………………………………………………………………………………. City of Palo Alto 55
Notes to Basic Financial Statements – Note 3
7. City of Palo Alto Bonds. 8. California Asset Management Program. 9. Money Market Deposit Accounts. 10. Mutual Funds which are limited essentially to the above investments, registered with the Federal
Securities and Exchange Commission (SEC), and which are rated in the highest rating category by a nationally recognized rating service. No more than twenty percent of the City’s portfolio may be invested in mutual funds, and no more than ten percent of the portfolio may be in any one Mutual Fund.
11. Medium-Term Corporate Notes. No more than ten percent of the City’s investment portfolio may
be invested in Medium-Term Corporate Notes, and purchases may not exceed $5 million invested in any single issuer, other than the U.S. Government, its agencies and instrumentality.
The City is a voluntary participant in the Local Agency Investment Fund (LAIF) that is regulated by California Government Code Section 16429 under the oversight of the Treasurer of the State of California. LAIF management calculates the fair value and cost of the entire LAIF pool. The City adjusts its cost basis invested in LAIF to fair value based on this ratio. The balance available for withdrawal is based on the accounting records maintained by LAIF, which are recorded on an amortized cost basis. Included in LAIF’s investment portfolio are collateralized mortgage obligation, mortgage-backed securities, other asset-backed securities, loans to certain state funds, and floating rate securities issued by Federal agencies, government-sponsored enterprises, and corporations.
Investments Carrying Value The City adjusts the carrying value of its investments to reflect their fair value at each fiscal year end, and it includes the effects of these adjustments in income for that fiscal year.
………………………………………………………………………………………………… 56 City of Palo Alto
Notes to Basic Financial Statements – Note 4
Note 4……………………………………………
INTERFUND TRANSACTIONS Transfers Between Funds With Council approval, resources may be transferred from one City fund to another. The purpose of the majority of transfers is to reimburse a fund, which has made an expenditure on behalf of another fund. Less often, a transfer may be made to open or close a fund. Transfers between City funds during fiscal year 2003-04 were as follows (in thousands):
AmountFund Receiving Transfer Fund Making Transfer Transferred
General Fund Special Districts Special Revenue Fund $460Transportation Mitigation Special Revenue Fund 150Law Enforcement Block Grant Special Revenue Fund 19Downtown Planned Community Special Revenue Fund 25Redevelopment Agency Special Revenue Fund 9Capital Projects Fund 3,157Golf Course Improvement Debt Service Fund 14Civic Center Refinancing Debt Service Fund 2Downtown Parking Improvement Debt Service Fund 3Water Enterprise Fund 2,306 AElectric Enterprise Fund 8,611 AGas Enterprise Fund 2,914 AWastewater Collection Enterprise Fund 4 ARefuse Enterprise Fund 166 ATechnology Internal Service Fund 48 A
Local Law Enforcement Special Revenue Fund General Fund 2
Redevelopment Agency Special Revenue Fund General Fund 9
Debt Service Funds:Parking COP General Fund 318Civic Center Financing General Fund 341
Special Districts Special Revenue Fund 80Golf Course Improvements General Fund 324
Capital Projects Fund General Fund 6,551 CStreet Improvement Special Revenue Fund 2,791 BSpecial Districts Special Revenue Fund 111Local Law Enforcement Special Revenue Fund 89Electric Enterprise Fund 128
……….……………………………………………………………………………………………. City of Palo Alto 57

Notes to Basic Financial Statements – Note 4
Enterprise FundWater Fund Water Enterprise Fund 1
Gas Enterprise Fund 9Wastewater Collection Enterprise Fund 9
Electric General Fund 276Water Enterprise Fund 215Gas Enterprise Fund 358Wastewater Collection Enterprise Fund 50Refuse Enterprise Fund 102Storm Drainage Enterprise Fund 17Technology Internal Service Fund 2
Gas Water Enterprise Fund 170Technology Internal Service Fund 2
Wastewater Treatment Technology Internal Service Fund 1Wastewater Collection Technology Internal Service Fund 1Refuse Special Districts Special Revenue Fund 91Storm Drainage General Fund 310
Technology Internal Service Fund 1External Service Technology Internal Service Fund 45
Internal Service Funds:Computer Equipment General Fund 1,038 D
Capital Projects Fund 2,426 DWater Enterprise Fund 120Electric Enterprise Fund 783Gas Enterprise Fund 252Wastewater Collection Enterprise Fund 72Wastewater Treatment Enterprise Fund 120Refuse Enterprise Fund 171Storm Drainage Enterprise Fund 24
Vehicle Replacement General Fund 20Capital Projects Fund 517Refuse Enterprise Fund 10
$35,845The reasons for these transfers are set forth below: (A) Transfer to reimburse the General Fund for costs incurred for the benefit of funds making the transfer.(B) Transfer to return unspent construction funds.(C) Allocation of funds to construct capital assets.(D) Allocation of funds for costs incurred for improving network infrastructure.
Current Interfund Balance Current interfund balances arise in the normal course of business and are expected to be repaid shortly after the end of the fiscal year. At June 30, 2004, the Federal Revenue Special Revenue Fund, the Local Law Enforcement Special Revenue Fund, the Downtown Planned Community Special Revenue Fund and the External Services Business-type Fund owed the General Fund $282 thousand, $25 thousand, $4 thousand, and $128 thousand, respectively. Long-Term Interfund Advances The City has a long-term interfund advance which the General Fund owes the Vehicle Replacement and Maintenance Internal Service Fund $32 thousand. The amount is expected to be repaid over two fiscal years commencing with 2003-2004 from General Fund Community Services Department resources. The City also has a long-term interfund advance which the External Services Enterprise Fund owes the Technology Internal Service Fund $100 thousand. The amount is expected to be repaid over four fiscal years commencing in 2004-05 from External Service Fund resources.
………………………………………………………………………………………………… 58 City of Palo Alto

Notes to Basic Financial Statements – Note 4
Interfund Commitment During fiscal year 2001-02, the City established the Palo Alto Redevelopment Agency. The Agency and the City have an agreement whereby the City will advance funds to the Agency in support of start up and formation costs. However, the interfund advances have no specific repayment date. Generally accepted accounting principals require that such amounts be treated as transfers in the year made. Advances without specified repayment terms total $338 thousand as of June 30, 2004. Internal Balances Internal balances represent the net interfund receivables and payables remaining after the elimination of all such balances within Governmental and Business-type Activities.
……….……………………………………………………………………………………………. City of Palo Alto 59

Notes to Basic Financial Statements – Note 5
Note 5……………………………………………
Notes and Loans Receivable At June 30, 2004, the City's notes and loans receivable totaled (in thousands):
Palo Alto Housing Corporation:Oak Manor Townhouse $1,204Emerson Street Project 375Alma Single Room Occupancy Development 2,222Barker Hotel 1,400Sheridan Apartments 2,248
Mid-Peninsula Housing Coalition:Palo Alto Gardens Apartments 1,000
Oak Court Apartments, L.P. 1,960Community Working Group, Inc 1,280Home Rehabilitation Loans 141Executive Relocation Assistance Loans 1,256Below Market Rate Assessment Loans 54Adolescent Counseling 56Palo Alto Senior Housing 28Clara-Mateo Alliance 11
Total $13,235
Housing Loans The City engages in programs designed to encourage construction or improvement in low-to-moderate income housing or other projects. Under these programs, grants or loans are provided under favorable terms to homeowners or developers who agree to spend these funds in accordance with the City’s terms. These loans have been offset by reserved fund balances, as they are not expected to be repaid immediately.
Oak Manor Townhouse On January 7, 1991, the City loaned $2.1 million to assist in the acquisition of an apartment complex to be used to provide rental housing for low and very low income households. This loan bears interest at three percent, is due in annual installments until 2011 and is collateralized by a subordinated deed of trust. Under the terms of the loan agreement, loan payments are forgiven if the Corporation meets the objective of this project. During the year ended June 30, 2004 the obligation was not met. The annual loan payment was not forgiven.
Emerson Street Project On November 8, 1994 the City loaned $375 thousand for expenses necessary to acquire an apartment complex for the preservation of rental housing for low and very low-income households in the City. This loan is collateralized by a second deed of trust. The loan bears no interest until 2009 after which the loan bears interest at three percent per year. The principal balance is due in 2034.
………………………………………………………………………………………………… 60 City of Palo Alto
Notes to Basic Financial Statements – Note 5
Alma Single Room Occupancy Development On December 13, 1996 the City loaned $2.695 million to the Alma Place Association for the development of a 107 unit single room occupancy development. This loan bears interest at three percent and is collateralized by a subordinated deed of trust. Loan payments are deferred until 2014. The principal balance is due in 2041. Barker Hotel On April 12, 1994 the City loaned a total of $2.07 million for the preservation, rehabilitation and expansion of a low income, single room occupancy hotel. This loan was funded by three sources: $400 thousand from the Housing In-Lieu Special Revenue Fund, $1 million from HOME Investment Partnership Program Funds, and $670 thousand from Community Development Block Grant Funds. All three notes bear no interest and are collateralized by a deed of trust, which is subordinated to private financing. Loan repayments are deferred until 2035. The City does not expect to collect the entire loan balance and has therefore recorded an allowance for doubtful accounts amounting to $670 thousand to reduce the carrying value of the loans to $1.4 million.
Sheridan Apartments On December 8, 1998 the City loaned $2.45 million to the Palo Alto Housing Corporation for the purchase and rehabilitation of a 57 unit apartment complex to be used for senior and low income housing. The loan is funded by $1.625 million in Community Development Block Grant Funds, and $825 thousand in Housing In-Lieu funds. The note bears interest at nine percent when available surplus cash from the project equals or exceeds twenty-five percent of interest calculated using nine percent. When available surplus cash falls below this level the note bears interest at three percent. The note is collateralized by a second deed of trust and an Affordability Reserve Account held by the Corporation. Annual loan payments are deferred until the Corporation accumulates $1 million in an Affordability Reserve Account. The principal balance is due in 2033.
Oak Court Apartments On August 18, 2003, in connection with the loan to Oak Court Apartments L.P. discussed below, the City loaned $5.874 million to the Palo Alto Housing Corporation for the purchase of land on which Oak Court Apartments, L.P. will construct a 53-unit rental apartment complex for low and very low-income households with children. The note bears interest of five percent and is secured by a deed of trust. Annually accrued interest is added to the principal balance and note payments are due annually after 55 years, or beginning in 2058, unless the Corporation elects to extend the note until 2102, as define in the regulatory agreement. The city does not expect to collect the loan balance and has therefore recorded an allowance for doubtful account amounting to $5.874 million.
Palo Alto Gardens Apartments On April 22, 1999 the City loaned $1 million to the Mid-Peninsula Housing Coalition for the purchase and rehabilitation of a 155 unit complex for the continuation of low income housing. This loan is funded by $659 thousand in Community Development Block Grant funds and $341 thousand in Housing In-Lieu funds. There are two notes that bear interest at three percent and are secured by second deeds of trust and a City Affordability Reserve Account held by the Coalition. Annual loan payments are deferred until certain criteria defined in the notes are reached. The principal balance is due in 2039.
……….……………………………………………………………………………………………. City of Palo Alto 61

Notes to Basic Financial Statements – Note 5
Oak Court Apartments, L.P. On August 18, 2003 the City loaned $1.960 million to Oak Court Apartments, L.P. for the construction of a 53-unit rental apartment complex for low and very low-income households with children. The note bears no interest until certain criteria defined in the note are satisfied, at which time the note will bear an interest rate not to exceed three percent. The note is secured by a subordinate deed of trust. The principal balance is due in 2058. Community Working Group, Inc On May 13, 2002 the City loaned $1.280 million to the Community Working Group, Inc for the predevelopment, relocation and acquisition of a 95 unit complex for the continuation of very low-income households. The loan is funded by $1.280 million dollars of Community Development Block Grant funds. The note bears no interest and is secured by a first deed of trust. No repayment of the $1.280 million will be required, provided that compliance with the City’s agreement is maintained. After 89 years of compliance with the regulatory agreement, the City’s loan would convert to a grant and its deed of trust would be reconveyed. Home Rehabilitation The City administers a closed housing rehabilitation loan program initially funded with Community Development Block Grant funds. Under this program, individuals with incomes below a certain level are eligible to receive low interest loans, for rehabilitation work on their homes. These loans are secured by deeds of trusts, which may be subordinated to subsequent encumbrances upon said real property with the prior written consent of the City. The loan repayments may be amortized over the life of the loans, deferred or a combination of both.
Executive Relocation Assistance Loans The City Council may authorize a mortgage loan as part of a relocation assistance package to executive staff. The loans are secured by first deeds of trust and interest is adjusted annually based on the rate of return of the invested funds of the City for the year ending June 30 plus one quarter of 1 percent. Principal and interest payments are due bi-weekly. Employees must pay off any outstanding balance of their loans within a certain period after ending employment with the City. As of June 30, 2004, the City had two outstanding employee home loans due in 2030 and 2031 respectively.
Below Market Rate Assessment Loans In December 2002 the City loaned $53 thousand to Below Market Rate home owners with low incomes and /or very limited assets for capital repairs and improvements of their property. The loan bears interest at three percent and is secured by a deed of trust on the property. Loan payments are deferred until 2032. In 2004, the City did not accrue interest.
Adolescent Counseling Services Loans In October 2003 the City agreed to loan up to $111 thousand to Adolescent Counseling Services for rehabilitation expenses in connection with a rental housing facility for teenage girls. The loan is funded entirely by Community Development Block Grant funds, bears interest at three percent and is secured by a deed of trust on the property.
………………………………………………………………………………………………… 62 City of Palo Alto

Notes to Basic Financial Statements – Note 5
Palo Alto Senior Housing Project Loans In July 2003 the City agreed to loan up to $45.2 thousand to Palo Alto Senior Housing Project for home improvements in the independent living facility for low-income seniors. The loan is funded entirely by Community Development Block Grant funds, bears interest at six percent and is secured by a deed of trust on the property. Principal and interest payments are deferred until 2009. Principal and interest on the loan shall be forgiven if the borrower satisfactorily complies with all the terms set forth in the July 2003 agreement.
Clara-Mateo Alliance Loans In July 2003 the City agreed to loan up to $200 thousand to Clara-Mateo Alliance for rehabilitation of the kitchen and the Elsa Segovia Center to provide services for the homeless. The loan is funded entirely by Community Development Block Grant funds, bears interest at six percent and is secured by a deed of trust on the property. Principal and interest payments are deferred until 2009. Principal and interest on the loan shall be forgiven if the borrower satisfactorily complies with all the terms and conditions set forth in the July 2003 agreement.
……….……………………………………………………………………………………………. City of Palo Alto 63
Notes to Basic Financial Statements – Note 6
Note 6……………………………………………
CAPITAL ASSETS
Valuation All capital assets are valued at historical cost or estimated historical cost if actual historical cost is not available. Contributed capital assets are valued at their estimated fair market value on the date contributed. The City’s policy is to capitalize all assets when costs are equal to/or exceed $5,000 and the useful life exceeds three years. Infrastructure assets are capitalized when costs are equal to/or exceed $100,000. Proprietary Fund capital assets are recorded at cost including significant interest costs incurred under restricted tax-exempt borrowings, which finance the construction of capital assets. These interest costs, net of interest earned on investment of the proceeds of such borrowings are capitalized and added to the cost of capital assets during the construction period. Maintenance and repairs are expensed as incurred.
GASB 34 Changes With the implementation of GASB Statement 34 last year, the City has recorded all its public domain (infrastructure) capital assets, which consists of the following networks: Roadway, Recreation and Open Space in its Citywide financial statements. Capital assets formerly reported in the General Fixed Assets
ccount Group are now reported in the Citywide financial statements. A GASB Statement 34 requires that all capital assets with limited useful lives be depreciated over their estimated useful lives. Alternatively, the “modified approach” may be used for certain capital assets. Depreciation is not provided under this approach, but all expenditures on these assets are expensed, unless they are additions or improvements. The City has elected to use the depreciation method for its capital assets. The purpose of depreciation is to spread the cost of capital assets equitably among all users over the life of these assets. The amount charged to depreciation expense each year represents that year’s pro rata share of the cost of capital assets. Depreciation has been provided on capital assets. Depreciation of all capital assets is charged as an expense against operations each year and the total amount of depreciation taken over the years, called accumulated depreciation, is reported on the balance sheet as a reduction in the book value of capital assets. Depreciation is provided using the straight line method which means the cost of the asset is divided by its expected useful life in years and the result is charged to expense each year until the asset is fully depreciated. The City has assigned the useful lives listed below to capital assets.
…………………………………………………………………………………………………………… 64 City of Palo Alto
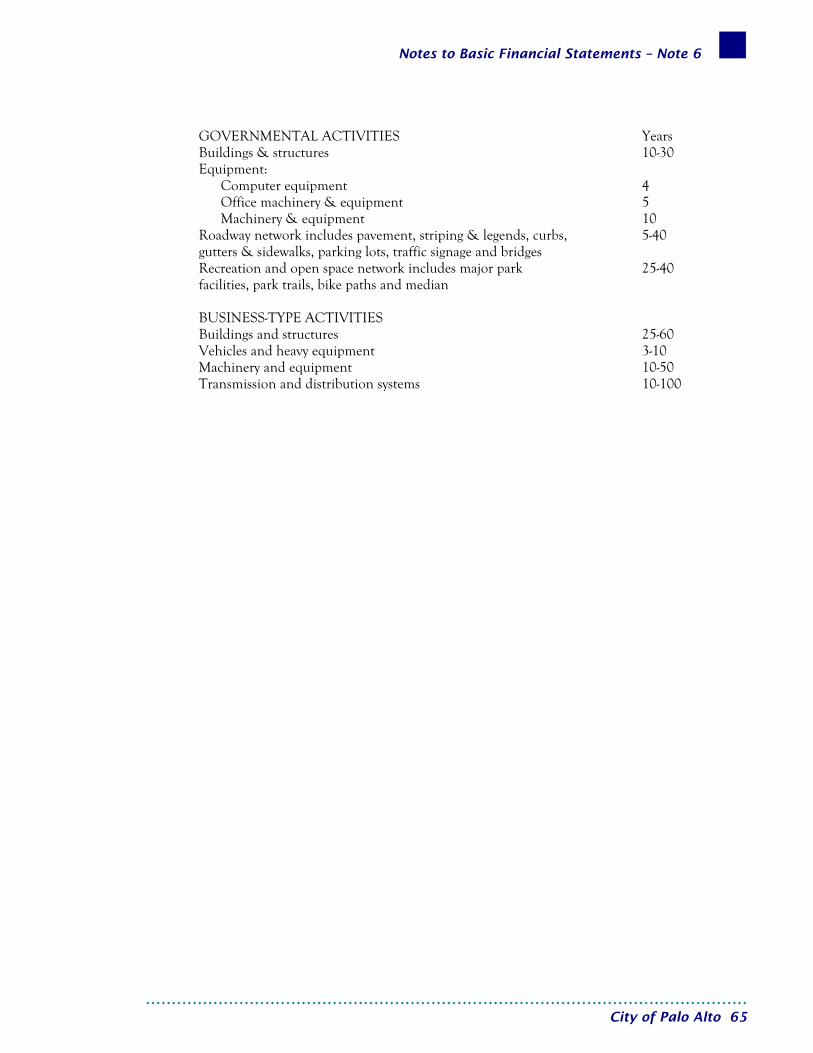
Notes to Basic Financial Statements – Note 6
GOVERNMENTAL ACTIVITIES Years Buildings & structures 10-30 Equipment: Computer equipment 4 Office machinery & equipment 5 Machinery & equipment 10 Roadway network includes pavement, striping & legends, curbs, gutters & sidewalks, parking lots, traffic signage and bridges
5-40
Recreation and open space network includes major park facilities, park trails, bike paths and median
25-40
BUSINESS-TYPE ACTIVITIES Buildings and structures 25-60 Vehicles and heavy equipment 3-10 Machinery and equipment 10-50 Transmission and distribution systems 10-100
……….……………………………………………………………………………………………. City of Palo Alto 65

Notes to Basic Financial Statements – Note 6
General Capital Assets Changes in the City’s general capital assets during the year ended June 30, 2004 were (in thousands):
Balance BalanceJune 30, 2003 Additions Retirements Transfers June 30, 2004
Governmental activitiesCapital assets not being depreciated:
Land and improvements $67,847 $67,847Street trees 15,846 $149 ($274) 15,721Construction in progress 33,950 24,211 ($9,911) 48,250
Total capital assets not being depreciated 117,643 24,360 (274) (9,911) 131,818
Capital assets being depreciatedBuildings and improvements 54,016 299 54,315Equipment 33,865 1,978 (1,924) 5,115 39,034Roadway network 216,899 3,459 220,358Recreation & open space network 7,793 1,038 8,831
Total capital assets being depreciated 312,573 1,978 (1,924) 9,911 322,538
Less accumulated depreciationBuildings and improvements (50,016) (305) (50,321)Equipment (22,568) (2,596) 1,634 (23,530)Roadway network (60,889) (5,704) 58 (66,535)Recreation & open space network (3,692) (204) (58) (3,954)
Net capital assets being depreciated (137,165) (8,809) 1,634 (144,340)
Total depreciable assets 175,408 (6,831) (290) 9,911 178,198
Governmental activity capital assets, net $293,051 $17,529 ($564) $310,016
…………………………………………………………………………………………………………… 66 City of Palo Alto
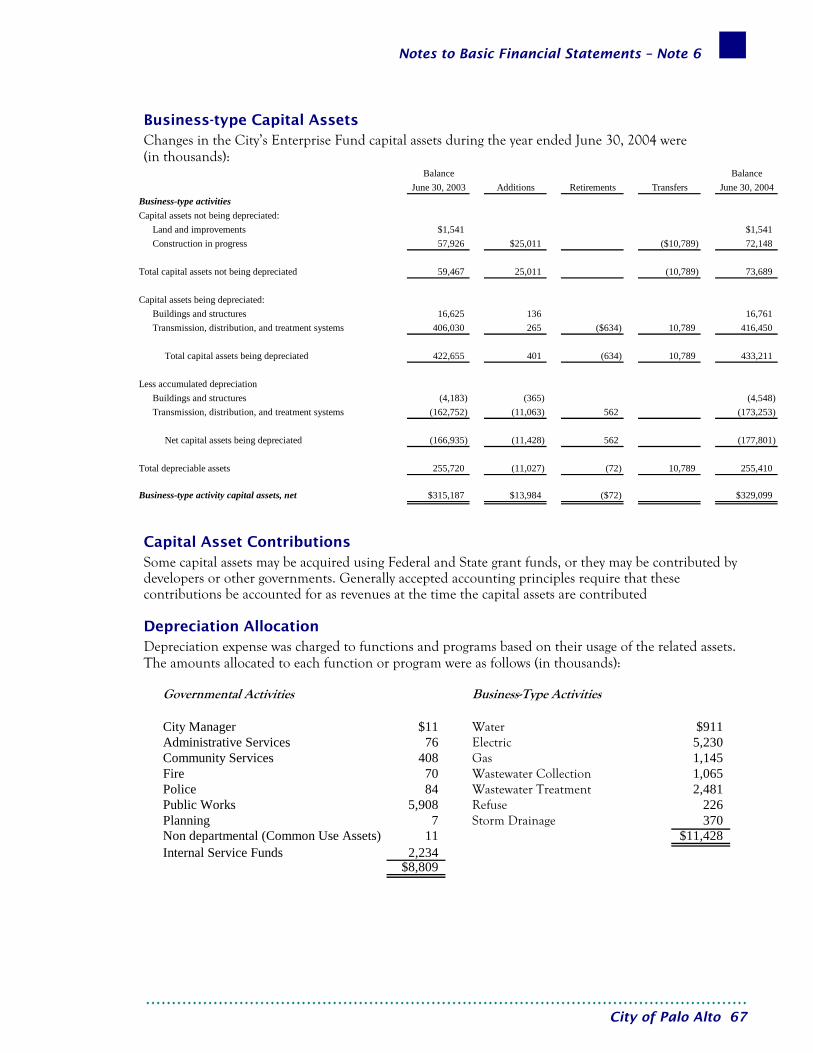
Notes to Basic Financial Statements – Note 6
Business-type Capital Assets Changes in the City’s Enterprise Fund capital assets during the year ended June 30, 2004 were (in thousands):
Balance BalanceJune 30, 2003 Additions Retirements Transfers June 30, 2004
Business-type activitiesCapital assets not being depreciated:
Land and improvements $1,541 $1,541Construction in progress 57,926 $25,011 ($10,789) 72,148
Total capital assets not being depreciated 59,467 25,011 (10,789) 73,689
Capital assets being depreciated:Buildings and structures 16,625 136 16,761Transmission, distribution, and treatment systems 406,030 265 ($634) 10,789 416,450
Total capital assets being depreciated 422,655 401 (634) 10,789 433,211
Less accumulated depreciationBuildings and structures (4,183) (365) (4,548)Transmission, distribution, and treatment systems (162,752) (11,063) 562 (173,253)
Net capital assets being depreciated (166,935) (11,428) 562 (177,801)
Total depreciable assets 255,720 (11,027) (72) 10,789 255,410
Business-type activity capital assets, net $315,187 $13,984 ($72) $329,099
Capital Asset Contributions Some capital assets may be acquired using Federal and State grant funds, or they may be contributed by developers or other governments. Generally accepted accounting principles require that these contributions be accounted for as revenues at the time the capital assets are contributed
Depreciation Allocation Depreciation expense was charged to functions and programs based on their usage of the related assets. The amounts allocated to each function or program were as follows (in thousands):
Governmental Activities Business-Type Activities
City Manager $11 Water $911Administrative Services 76 Electric 5,230Community Services 408 Gas 1,145Fire 70 Wastewater Collection 1,065Police 84 Wastewater Treatment 2,481Public Works 5,908 Refuse 226Planning 7 Storm Drainage 370Non departmental (Common Use Assets) 11 $11,428Internal Service Funds 2,234
$8,809
……….……………………………………………………………………………………………. City of Palo Alto 67
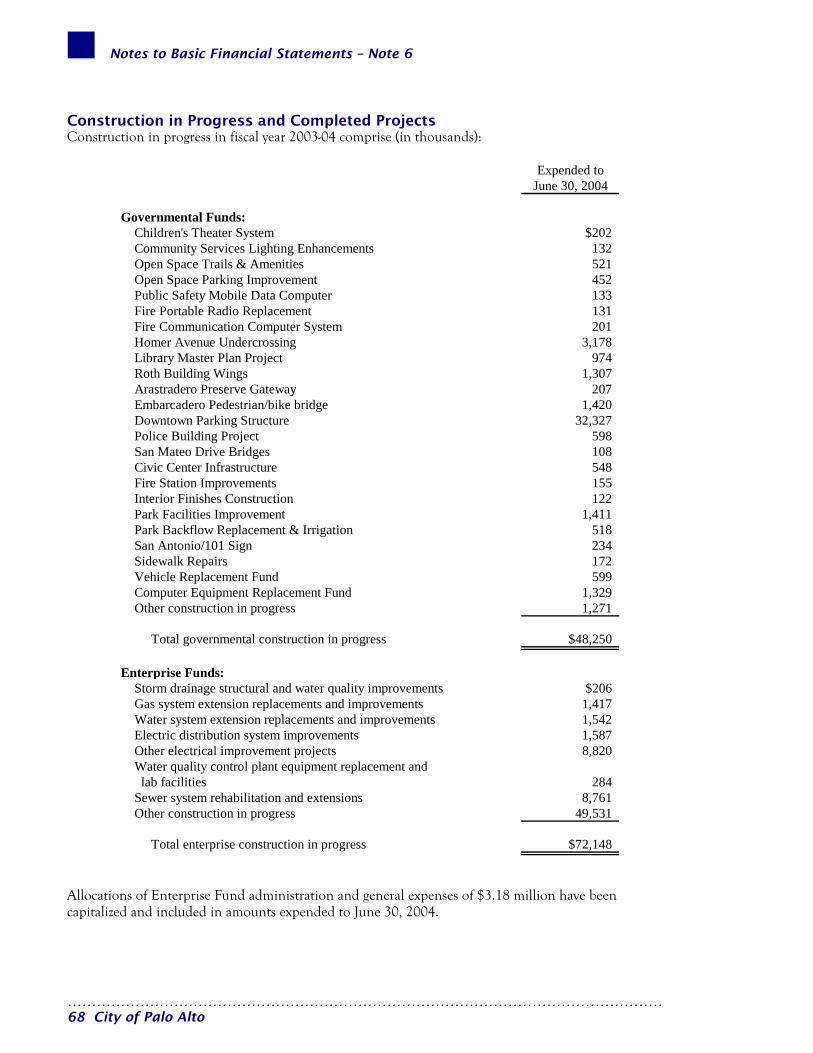
Notes to Basic Financial Statements – Note 6
Construction in Progress and Completed Projects Construction in progress in fiscal year 2003-04 comprise (in thousands):
Expended toJune 30, 2004
Governmental Funds:Children's Theater System $202Community Services Lighting Enhancements 132Open Space Trails & Amenities 521Open Space Parking Improvement 452Public Safety Mobile Data Computer 133Fire Portable Radio Replacement 131Fire Communication Computer System 201Homer Avenue Undercrossing 3,178Library Master Plan Project 974Roth Building Wings 1,307Arastradero Preserve Gateway 207Embarcadero Pedestrian/bike bridge 1,420Downtown Parking Structure 32,327Police Building Project 598San Mateo Drive Bridges 108Civic Center Infrastructure 548Fire Station Improvements 155Interior Finishes Construction 122Park Facilities Improvement 1,411Park Backflow Replacement & Irrigation 518San Antonio/101 Sign 234Sidewalk Repairs 172Vehicle Replacement Fund 599Computer Equipment Replacement Fund 1,329Other construction in progress 1,271
Total governmental construction in progress $48,250
Enterprise Funds:Storm drainage structural and water quality improvements $206Gas system extension replacements and improvements 1,417 Water system extension replacements and improvements 1,542 Electric distribution system improvements 1,587 Other electrical improvement projects 8,820 Water quality control plant equipment replacement and lab facilities 284 Sewer system rehabilitation and extensions 8,761 Other construction in progress 49,531
Total enterprise construction in progress $72,148
Allocations of Enterprise Fund administration and general expenses of $3.18 million have been capitalized and included in amounts expended to June 30, 2004.
…………………………………………………………………………………………………………… 68 City of Palo Alto
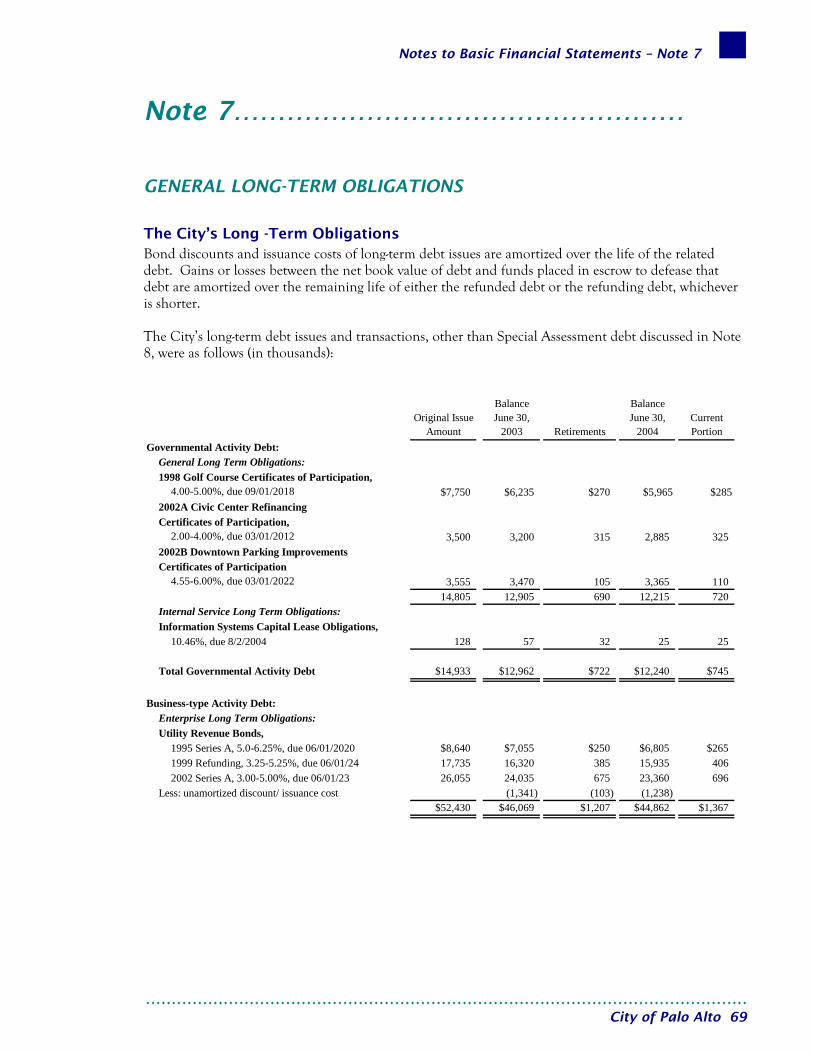
Notes to Basic Financial Statements – Note 7
Note 7……………………………………………
GENERAL LONG-TERM OBLIGATIONS
The City’s Long -Term Obligations Bond discounts and issuance costs of long-term debt issues are amortized over the life of the related debt. Gains or losses between the net book value of debt and funds placed in escrow to defease that debt are amortized over the remaining life of either the refunded debt or the refunding debt, whichever is shorter. The City’s long-term debt issues and transactions, other than Special Assessment debt discussed in Note 8, were as follows (in thousands):
Original Issue Amount
Balance June 30,
2003 Retirements
Balance June 30,
2004Current Portion
Governmental Activity Debt:General Long Term Obligations:1998 Golf Course Certificates of Participation,
4.00-5.00%, due 09/01/2018 $7,750 $6,235 $270 $5,965 $2852002A Civic Center Refinancing Certificates of Participation,
2.00-4.00%, due 03/01/2012 3,500 3,200 315 2,885 3252002B Downtown Parking Improvements Certificates of Participation
4.55-6.00%, due 03/01/2022 3,555 3,470 105 3,365 11014,805 12,905 690 12,215 720
Internal Service Long Term Obligations:Information Systems Capital Lease Obligations,
10.46%, due 8/2/2004 128 57 32 25 25
Total Governmental Activity Debt $14,933 $12,962 $722 $12,240 $745
Business-type Activity Debt:Enterprise Long Term Obligations:Utility Revenue Bonds,
1995 Series A, 5.0-6.25%, due 06/01/2020 $8,640 $7,055 $250 $6,805 $2651999 Refunding, 3.25-5.25%, due 06/01/24 17,735 16,320 385 15,935 4062002 Series A, 3.00-5.00%, due 06/01/23 26,055 24,035 675 23,360 696
Less: unamortized discount/ issuance cost (1,341) (103) (1,238)$52,430 $46,069 $1,207 $44,862 $1,367
……….……………………………………………………………………………………………. City of Palo Alto 69
Notes to Basic Financial Statements – Note 7
Description of the City’s Long-Term Debt Issues 1998 Golf Course COPS - In August 1998, the City’s Public Improvement Corporation issued Golf Course Improvement COPS, Series 1998 in the amount of $7.75 million to retire the 1978 Golf Course Lease Revenue Bonds, and to finance various improvements at the Palo Alto Public Golf Course, including upgrading five fairways and various traps, trees and greens, constructing new storm drain facilities, replacing the existing irrigation system, upgrading the driving range, and installing new cart paths. The 1998 COPs are secured by lease revenues received by the Public Improvement Corporation from golf course revenues or other unrestricted revenues of the City. Principal and interest are payable semi-annually each March 1 and September 1.
………………………………………………………………………………………………………………………
i
t
t
2002A Civic Center Ref nancing COPS – On January 16, 2002 the City issued $3.5 million of COPS to refund the City’s 1992 COPS which were subsequently retired. Principal payments for the 2002A COPs are due annually on March 1 and interest payments semi-annually on March 1 and September 1 and are payable from lease revenues received by the Palo Alto Public Improvement Corporation from the City from available funds. 2002B Downtown Parking Improvement Project COPS – On January 16, 2002 the City issued $3.555 million of COPS to finance the construction of certain improvements to the non-parking area contained in the City’s Bryant /Florence Garage complex. Principal payments are due annually on March 1 and interest payments semi-annually on March 1 and September 1 from 4.55% - 6.5%, and are payable from lease revenues received by the Palo Alto Public Improvement Corporation from the City from available funds. Information Systems Capital Lease – In fiscal year 2000-01, the City signed a lease to finance the acquisitions of certain information systems hardware and software. Debt service is repayable from the Technology Internal Service Fund revenues. 1995 U ility Revenue Bonds, Series A – The City issued Utility Revenue Bonds on February 1, 1995 to finance certain extensions and improvements to the City’s Storm Drainage and Surface Water System. The Bonds are special obligations of the City payable solely from and secured by a pledge of and lien upon the revenues derived by the City from the funds, services and facilities of all Enterprise Funds except the Refuse Fund. Principal payments are payable annually on June 1 and interest payments semi-annually on June 1 and December 1. A $2.86 million 6.25% term bond is due June 1, 2020. In lieu of a reserve fund, the Bonds are secured by a Surety Bond issued by AMBAC Indemnity Corporation. 1999 U ility Revenue and Refunding Bonds, Series A – The City issued Utility Revenue Bonds on June 1, 1999 to refund the 1990 Utility Revenue Refunding Bonds, Series A and the 1992 Utility Revenue Bonds, Series A, and to finance rehabilitation of the Wastewater Treatment System’s two sludge incinerators. The 1990 Utility Revenue Refunding Bonds, Series A and the 1992 Utility Revenue Bonds, Series A, were subsequently retired.
70 City of Palo Alto

Notes to Basic Financial Statements – Note 7
The 1999 Bonds are special obligations of the City payable solely from and secured by a pledge of and lien upon certain net revenues derived by the City’s Sewer System and its storm and surface water system (the “Storm Drain System”). As of June 30, 2001, the 1999 Bonds had been allocated to and were repayable from net revenues of the following enterprise funds: Wastewater Collection (10.2%), Wastewater Treatment (64.6%) and Storm Drain (25.2%). Principal payments are payable annually on June 1 and interest payments semi-annually on June 1 and December 1. A $3.125 million 5.25% term bond, and a $5.12 million 5.25% term bond are due June 1, 2021 and 2024, respectively. In lieu of a reserve fund, the Bonds are secured by a Surety Bond issued by AMBAC Indemnity Corporation.
……….…………………………………………………………………………………………….
t2002 U ility Revenue Bonds, Series A – On January 24, 2002 the City issued Utility Revenue Bonds to finance certain improvements to the City’s water utility system, and the City’s natural gas utility system. Principal payments are due annually on June 1 and interest payments are due semi-annually on June 1 and December 1 from 3% to 5%. The 2002 Revenue Bonds are secured by net revenues generated by the Water Services and Gas Services Funds. Debt Service Requirements (in thousands): Debt service and capitalized lease requirements are shown below for all long-term debt.
Governmental Activities Business-Type ActivitiesFor the Year
Ending June 30 Principal Interest Principal Interest2005 $745 $580 $1,367 $2,2562006 740 555 1,410 2,2032007 770 528 1,465 2,1472008 805 497 1,525 2,0882009 835 464 1,590 2,025
2010-2014 3,920 1,741 9,095 8,9682015-2019 3,580 823 11,564 6,4932020-2024 845 113 14,884 3,1742025-2026 3,200 242
Total $12,240 $5,301 46,100 $29,596
Reconciliation of long-term debt Less unamortized original issue discount (1,238)
Net long-term debt $44,862
City of Palo Alto 71

Notes to Basic Financial Statements – Note 7
Debt Call Provisions Long-term debt as of June 30, 2004 is callable on the following terms and conditions:
Initial Call Date
Governmental Activities Long-Term
1998 Certificates of Participation 09/01/2008 (3) 2002B Certificates of Participation 03/01/2011 (2)
Business-Type Activities Long-Term Utility Revenue Bonds -1995 Series A 06/01/2004 (1) 1999 Refunding 06/01/2009 (1) 2002 Series A 06/01/2012 (1)
(1) Callable in inverse numerical order of maturity at par plus a premium of 2% beginning on the
initial call date. The call price declines subsequent to the initial date. (2) Callable in any order specified by the City at par plus a premium of 1% beginning on the initial
call date. The call price declines subsequent to the initial date. (3) Callable in any order specified by the Trustee at par plus a premium of 1% beginning on the initial
call date. The call price declines subsequent to the initial date.
Leasing Arrangements COPS and Capital Leases are issued for the purpose of financing the construction or acquisition of projects defined in each leasing arrangement. Projects are leased to the City for lease payments which, together with unspent proceeds of the leasing arrangement, will be sufficient to meet the debt service obligations of the leasing arrangement. At the termination of the leasing arrangement title to the project will pass to the City.
………………………………………………………………………………………………………………………
Leasing arrangements are similar to debt; they allow investors to participate in a share of guaranteed payments which are made by the City. Because they are similar to debt, the present value of the total of the payments to be made by the City is recorded as long-term debt. The City’s leasing arrangements are included in long-term obligations discussed above.
Conduit Financing On December 15, 1996, the City acted as a financial intermediary in order to assist Lytton Gardens Health Care Center in issuing Insured Revenue Refunding Bonds. The Bonds are payable solely from revenues collected by Lytton Gardens Health Care Center. The City has not included these Bonds in its basic financial statements since it is not legally or morally obligated for the repayment of the Bonds. At June 30, 2004 the amount of Bonds outstanding was $10.455 million.
72 City of Palo Alto
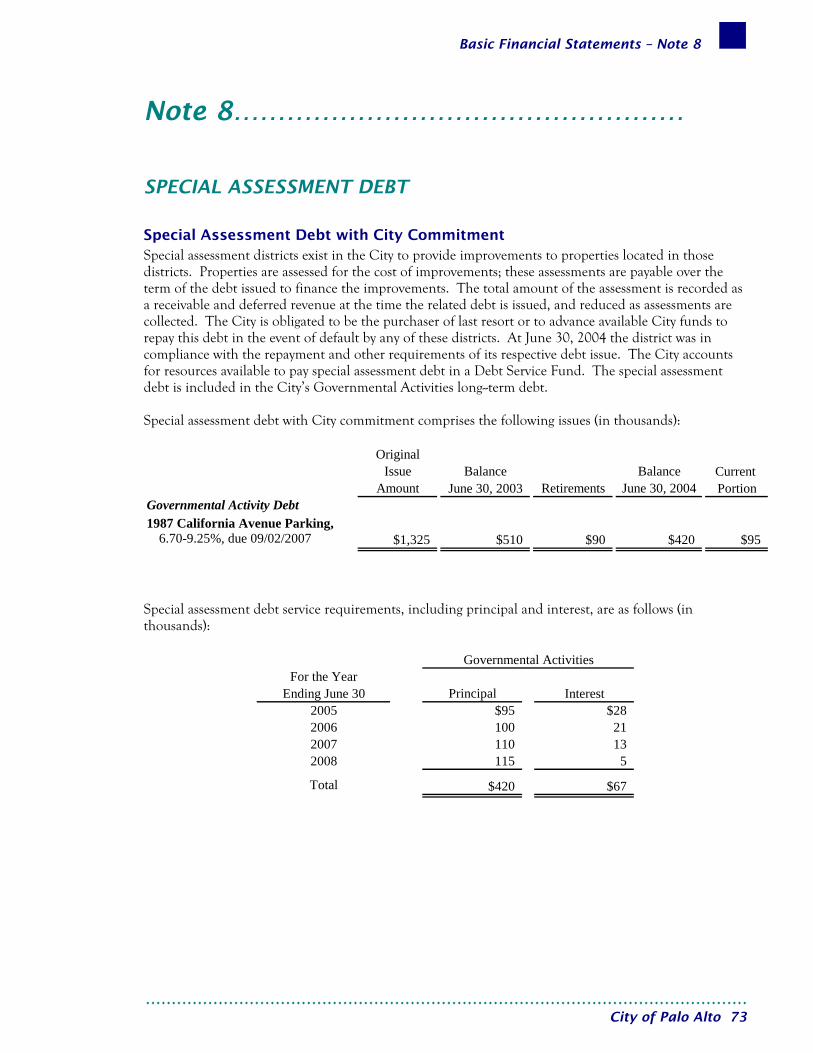
Basic Financial Statements – Note 8
Note 8……………………………………………
SPECIAL ASSESSMENT DEBT
Special Assessment Debt with City Commitment Special assessment districts exist in the City to provide improvements to properties located in those districts. Properties are assessed for the cost of improvements; these assessments are payable over the term of the debt issued to finance the improvements. The total amount of the assessment is recorded as a receivable and deferred revenue at the time the related debt is issued, and reduced as assessments are collected. The City is obligated to be the purchaser of last resort or to advance available City funds to repay this debt in the event of default by any of these districts. At June 30, 2004 the district was in compliance with the repayment and other requirements of its respective debt issue. The City accounts for resources available to pay special assessment debt in a Debt Service Fund. The special assessment debt is included in the City’s Governmental Activities long--term debt. Special assessment debt with City commitment comprises the following issues (in thousands):
OriginalIssue Balance Balance Current
Amount June 30, 2003 Retirements June 30, 2004 PortionGovernmental Activity Debt1987 California Avenue Parking,
6.70-9.25%, due 09/02/2007 $1,325 $510 $90 $420 $95
Special assessment debt service requirements, including principal and interest, are as follows (in thousands):
Governmental ActivitiesFor the Year
Ending June 30 Principal Interest2005 $95 $282006 100 212007 110 132008 115 5
Total $420 $67
……….……………………………………………………………………………………………. City of Palo Alto 73

Notes to Basic Financial Statements – Note 8
Description of Special Assessment Debt with City’s Commitment 1987 California Avenue Parking Assessment District Assessment Bonds – The City issued Special Assessment Bonds on April 13, 1987 to finance the acquisition of land and related improvements for the purpose of providing public parking in the City. Principal payments are payable annually on September 2 and interest payments semi-annually on March 2 and September 2.
Special Assessment Debt with no City Commitment The California Avenue Parking Assessment District No. 92-13 issued Assessment Bonds of 1993, but the City has no legal or moral liability with respect to the payment of this debt, which is secured only by assessments on the properties in this District. Therefore, this debt is not included in Governmental Activities long-term debt of the City. At June 30, 2004, the District’s outstanding debt amounted to $1.465 million. The University Avenue Area Off-Street Parking Assessment District issued Assessment Bonds of Series 2001-A, but the City has no legal or moral liability with respect to the payment of this debt, which is secured only by assessments on the properties in the District. Therefore, this debt is not included in Governmental Activities long-term debt of the City. At June 30, 2004, the District’s outstanding debt amounted to $9.120 million. A portion of the proceeds from the 2001 Bonds amounting to $3.2 million was used to defease the 1977 University Avenue Area Off-Street Parking Assessment District Bonds and the 1989 University Avenue Area Off-street Parking Assessment District Refunding and Improvement Bonds. The University Avenue Area Off-Street Parking Assessment District issued Assessment Bonds of Series 2002-A, but the City has no legal or moral liability with respect to the payment of this debt, which is secured only by assessments on the properties in the District. Therefore, this debt is not included in Governmental Activities long-term debt of the City. At June 30, 2004, the District’s outstanding debt amounted to $35.460 million.
………………………………………………………………………………………………… 74 City of Palo Alto
Basic Financial Statements – Note 9
Note 9……………………………………………
LANDFILL CLOSURE AND POST-CLOSURE CARE
State and Federal laws and regulations require the City to place a final cover on the remaining open areas of the Palo Alto Refuse Disposal Site when it stops accepting waste and to perform certain maintenance and monitoring functions at the site for thirty years after closure. Closure costs of $1.561 million were reported in fiscal 1991-92, when a section of the refuse area was capped with a final cover and Byxbee Park was constructed on top of that section. A second section of the refuse area was capped with a final cover during fiscal year 1992-93, with closure costs of $904 thousand. The remaining closure and post-closure care costs are expected to be paid only near and after the date that the refuse site stops accepting waste. An updated cost estimate for the landfill closure and post-closure, based on landfill capacity, was performed during 2001. The estimates of these costs were based upon 2001 cost and are adjusted annually for inflation as mandated by the State of California. The 2004 amount is $6.555 million. Currently, 90.1 percent of the landfill capacity has been used to date. Total cost estimates are based on what it would cost to perform all currently mandated closure and post-closure care in 2001. The City expects to close the refuse area in the year 2013. Actual closure and post-closure care costs may be higher due to inflation variances, changes in technology, or changes in State or Federal regulations. The City is required by State and federal laws and regulations to make annual funding contributions to finance closure and post-closure care. The City is in compliance with these requirements for the year ended June 30, 2004 with the establishment of the fully-funded liability for this purpose.
……….……………………………………………………………………………………………. City of Palo Alto 75

Notes to Basic Financial Statements – Note 10
Note 10……………………………………………
NET ASSETS AND FUND BALANCES
Net Assets Net assets are the excess of all the City’s assets over all its liabilities, regardless of fund. Net assets are divided into three categories under GASB Statement 34. These categories apply only to net assets, and are described below: Invested in Capital Assets, net of related debt describes the portion of net assets which is represented by the current net book value of the City’s capital assets, less the outstanding balance of any debt issued to finance these assets. Restricted describes the portion of net assets which is restricted as to use by the terms and conditions of agreements with outside parties, governmental regulations, laws, or other restrictions which the City cannot unilaterally alter. These principally include bond proceeds received for use on capital projects, debt service requirements, and special revenue programs subject to limitations defined regulations and laws underlying such programs. Unrestricted describes the portion of net assets which is not restricted as to use.
Fund Balances, Reserves and Designations In the Fund financial statements, fund balances represent the net current assets of each fund. Net current assets generally represent a fund’s cash and receivables, less its liabilities. Portions of a fund’s balance may be reserved or designated for future expenditure. At June 30, 2004, Governmental Funds reservations and designations included (in thousands):
Major FundsHousing Capital
General In Lieu Projects Non-MajorFund Fund Fund Funds
Reserved for:Encumbrances $2,973 $940 $9,314 $796Downtown parking structure 1,300Notes 1,256 7,312 4,667Inventory of materials and supplies 2,506Debt service 1,461
Total Reserved Fund Balance $6,735 $8,252 $10,614 $6,924
Unreserved; designated for:Special revenue projects 2,625 4,080Equity transfer stabilization 2,338Reappropriations 401 44 10,419Budget stabilization 21,467Infrastructure 35,881
Total Unreserved/Designated Fund Balances $60,087 $2,669 $10,419 $4,080
…………………………………………………………………………………………………………… 76 City of Palo Alto

Notes to Basic Financial Statements – Note 10
Reserve for encumbrances represents the portion of fund balance set aside for open purchase orders. Reserve for downtown parking structure represents a portion of fund balance for the Downtown Parking Improvement Project. The project was funded with debt proceeds. Reserves for notes and inventory are the portions of fund balance set aside to indicate these items do not represent available, spendable resources even though they are a component of assets. Reserve for debt service is the portion of fund balance legally restricted for the payment of principal and interest on long-term liabilities. Reserve for debt proceeds is the portion of fund balance legally restricted for the expenditure of bond proceeds on authorized project costs. Designated for unrealized gain on investments is the portion of fund balance used to accumulate gains on the market values of investments. Designated for capital and special revenue projects is the portion of fund balance for use on capital outlay projects. Designated for equity transfer stabilization is the portion of fund balance to replace required equity transfer by Gas, or Electric Enterprise Funds in the event the fund was unable to make its required equity transfer. Designated for reappropriations is the portion of fund balance set aside for subsequent years’ appropriations. Designated for budget stabilization is the portion of fund balance to be used to supplement the regular budget when unexpected events such as state government action, a downturn in the economy or a natural disaster reduces revenue or creates obligations that significantly impact the current year budget. Designated for infrastructure is the portion of fund balance to be used for financing future capital improvements.
Internal Service Funds At June 30, 2004, internal service fund net assets reservations and designations included (in thousands): Reserved net assets-
Commitments and reappropriations $2,433Unreserved:
Designated for: Future catastrophic losses 3,852 Retiree health care 18,178 Interfund advances/payables 132Undesignated 18,755
Net assets unrestricted $43,350
Reserve for commitments and reappropriations represents the portion of net assets set aside for open purchase orders. Designated for future catastrophic losses is the portion of net assets to be used for unforeseen future losses.
……….……………………………………………………………………………………………. City of Palo Alto 77

Notes to Basic Financial Statements – Note 10
Designated for retiree health care represents the portion of net assets set aside to defer future costs of retiree health care coverage.
Enterprise Funds At June 30, 2004, Enterprise Fund net assets reservations included (in thousands):
Wastewater Wastewater Storm ExternalWater Electric Gas Collection Treatment Refuse Drainage Services Total
Reserved net assets:Rate stabilization
Supply $58,562 $6,822 $65,384Distribution 7,557 6,703 14,260Operations $6,178 $2,723 $4,625 $6,135 $336 19,997
6,178 66,119 13,525 2,723 4,625 6,135 336 99,641Emergency plant
replacement 1,129 2,451 896 555 1,719 6,750Calaveras 70,464 70,464Reappropriations 13,622 8,758 1,146 7,995 2,233 997 235 34,986Commitments 2,163 7,698 3,946 2,329 2,951 786 46 $1 19,920Restricted bond proceeds 72 72Conservation loan 34 34Underground loan 664 664Refuse Water
Resources Board 590 590Shasta rewind loan 64 64Public benefit program 2,082 2,082Central Valley Project 149 149Debt Service 777 948 1,725External Service -
Information Technology 2 2
Total $23,869 $158,449 $20,495 $13,602 $11,600 $8,508 $617 $3 $237,143
The City Council has committed unreserved net assets for general contingencies, future capital and debt service expenditures including operating and capital contingencies for unusual or emergency expenditures.
…………………………………………………………………………………………………………… 78 City of Palo Alto
Notes to Basic Financial Statements – Note 11
Note 11……………………………………………
PENSION PLANS
CALPERS Safety and Miscellaneous Employees Plans Substantially all permanent City employees are eligible to participate in pension plans offered by California Public Employees Retirement System (CALPERS) an agent multiple employer defined benefit pension plan which acts as a common investment and administrative agent for its participating member employers. CALPERS provides retirement and disability benefits, annual cost of living adjustments and death benefits to plan members, who must be public employees and beneficiaries. The City’s employees participate in the separate Safety (police and fire) and Miscellaneous (all other) Employee Plans. Benefit provisions under both Plans are established by State statute and City resolution. Benefits are based on years of credited service, equal to one year of full time employment. Funding contributions for both Plans are determined annually on an actuarial basis as of June 30 by CALPERS. The City contributes these amounts and has no pension benefit obligation. The Plans’ provisions and benefits in effect at June 30, 2004, are summarized as follows:
SafetyPolice Fire Miscellaneous
Benefit vesting schedule 5 years service 5 years service 5 years serviceBenefit payments monthly for life monthly for life monthly for lifeRetirement age 50 50 50Monthly benefits, as a % of annual salary 3% 3% 1.426-2.418%Required employee contribution rates 9% 9% 7%Required employer contribution rates 21.312% 7.775% 0% The City’s labor contracts require it to pay employee contributions as well as its own. CALPERS determines contribution requirements using a modification of the Entry Age Normal Method. Under this method, the City’s total normal benefit cost for each employee from date of hire to date of retirement is expressed as a level percentage of the related total payroll cost. Normal benefit cost under this Method is the level amount the employer must pay annually to fund an employee’s projected retirement benefit. This level percentage of payroll method is used to amortize any unfunded actuarial liabilities. The actuarial assumptions used to compute contribution requirements are also used to compute the actuarial accrued liability. The City does not have a net pension obligation since it pays these actuarially required contributions monthly. CALPERS uses the market related value method of valuing the Plan’s assets. An investment rate of return of 8.25 percent is assumed, including inflation at 3.5 percent. Annual salary increases are assumed to vary by duration of service. Changes in liability due to plan amendments, changes in actuarial assumptions, or changes in actuarial methods are amortized as a level percentage of payroll on a closed basis over twenty years. Investment gains and losses are accumulated as they are realized and ten percent of the net balance is amortized annually.
……….……………………………………………………………………………………………. City of Palo Alto 79

Notes to Basic Financial Statements – Note 11
The Plans’ actuarial value (which differs from market value) and funding progress over the most recently available three years is set forth below at their actuarial valuation date of June 30, 2002 (in thousands): Safety Police Plan:
ActuarialUnfunded
Entry Age Unfunded Annual (Overfunded)Valuation Accrued Value of (Overfunded) Funded Covered Liability as a %
Date Liability Assets Liability Ratio Payroll of Payroll2000 $70,289 $69,998 $291 99.6% $6,858 4.2%2001 74,102 72,195 1,907 97.4% 7,007 27.2%2002 79,375 68,767 10,608 86.6% 7,426 142.8%
Safety Fire Plan:
ActuarialUnfunded
Entry Age Unfunded Annual (Overfunded)Valuation Accrued Value of (Overfunded) Funded Covered Liability as a %
Date Liability Assets Liability Ratio Payroll of Payroll2000 $87,651 $104,220 ($16,569) 118.9% $8,805 (188.2%)2001 95,116 106,757 (11,641) 112.2% 10,426 (111.7%)2002 103,493 101,355 2,138 97.9% 10,871 19.7%
Miscellaneous Plan:
ActuarialUnfunded
Entry Age Unfunded Annual (Overfunded)Valuation Accrued Value of (Overfunded) Funded Covered Liability as a %
Date Liability Assets Liability Ratio Payroll of Payroll2000 $194,552 $262,285 ($67,733) 134.8% $47,866 (141.5%)2001 211,510 272,025 (60,515) 128.6% 51,933 (116.5%)2002 235,232 258,317 (23,085) 109.8% 57,445 (40.2%)
Audited annual financial statements and ten-year trend information are available from CALPERS at P.O. Box 942709, Sacramento, CA 94229-2709.
…………………………………………………………………………………………………………… 80 City of Palo Alto
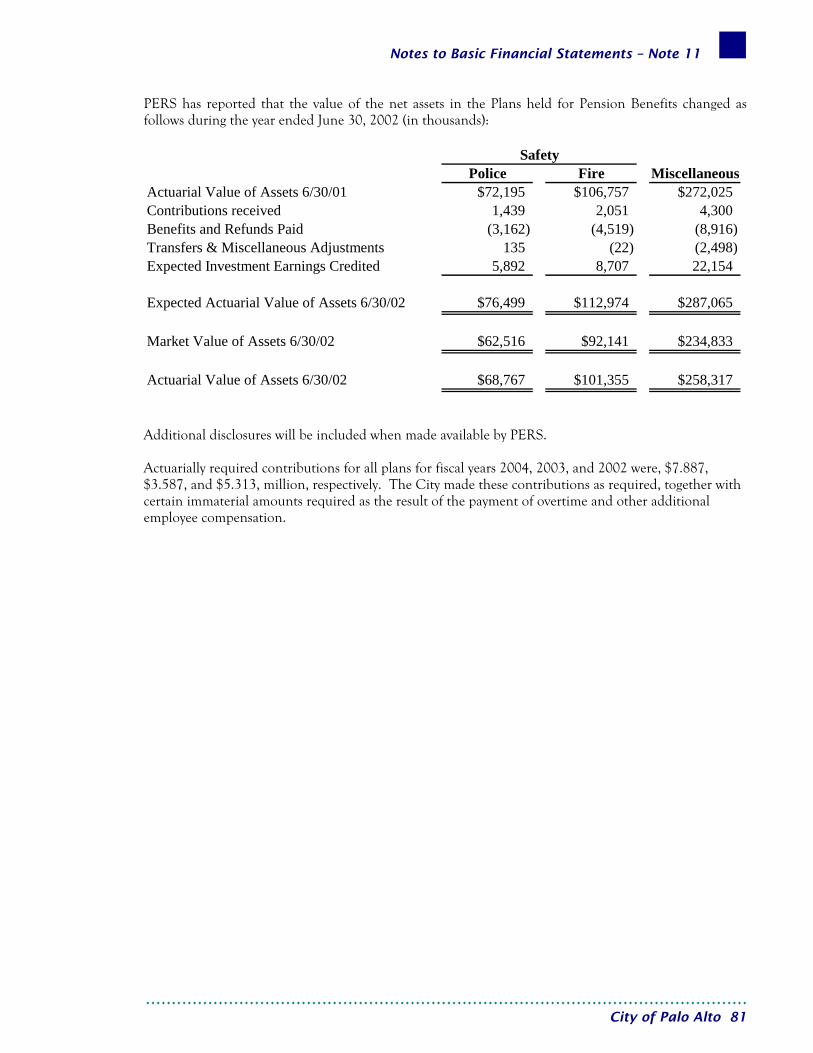
Notes to Basic Financial Statements – Note 11
PERS has reported that the value of the net assets in the Plans held for Pension Benefits changed as follows during the year ended June 30, 2002 (in thousands):
SafetyPolice Fire Miscellaneous
Actuarial Value of Assets 6/30/01 $72,195 $106,757 $272,025Contributions received 1,439 2,051 4,300Benefits and Refunds Paid (3,162) (4,519) (8,916)Transfers & Miscellaneous Adjustments 135 (22) (2,498)Expected Investment Earnings Credited 5,892 8,707 22,154
Expected Actuarial Value of Assets 6/30/02 $76,499 $112,974 $287,065
Market Value of Assets 6/30/02 $62,516 $92,141 $234,833
Actuarial Value of Assets 6/30/02 $68,767 $101,355 $258,317
Additional disclosures will be included when made available by PERS. Actuarially required contributions for all plans for fiscal years 2004, 2003, and 2002 were, $7.887, $3.587, and $5.313, million, respectively. The City made these contributions as required, together with certain immaterial amounts required as the result of the payment of overtime and other additional employee compensation.
……….……………………………………………………………………………………………. City of Palo Alto 81
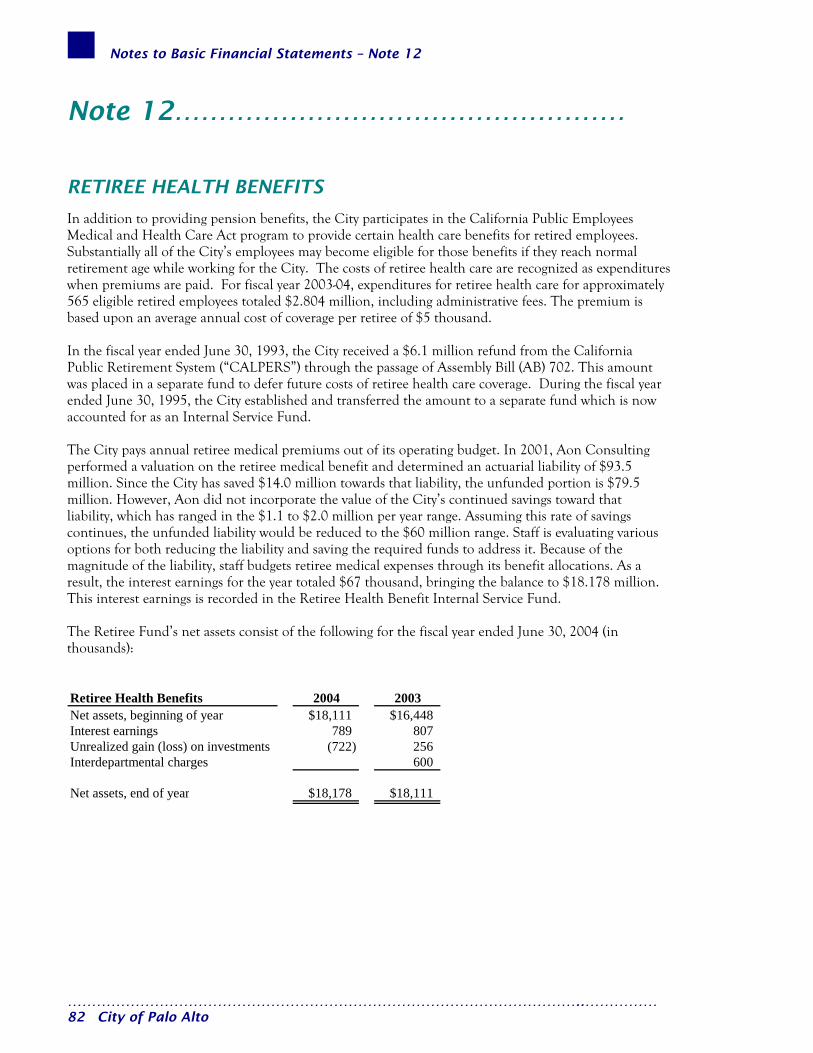
Notes to Basic Financial Statements – Note 12
Note 12……………………………………………
RETIREE HEALTH BENEFITS
In addition to providing pension benefits, the City participates in the California Public Employees Medical and Health Care Act program to provide certain health care benefits for retired employees. Substantially all of the City’s employees may become eligible for those benefits if they reach normal retirement age while working for the City. The costs of retiree health care are recognized as expenditures when premiums are paid. For fiscal year 2003-04, expenditures for retiree health care for approximately 565 eligible retired employees totaled $2.804 million, including administrative fees. The premium is based upon an average annual cost of coverage per retiree of $5 thousand. In the fiscal year ended June 30, 1993, the City received a $6.1 million refund from the California Public Retirement System (“CALPERS”) through the passage of Assembly Bill (AB) 702. This amount was placed in a separate fund to defer future costs of retiree health care coverage. During the fiscal year ended June 30, 1995, the City established and transferred the amount to a separate fund which is now accounted for as an Internal Service Fund. The City pays annual retiree medical premiums out of its operating budget. In 2001, Aon Consulting performed a valuation on the retiree medical benefit and determined an actuarial liability of $93.5 million. Since the City has saved $14.0 million towards that liability, the unfunded portion is $79.5 million. However, Aon did not incorporate the value of the City’s continued savings toward that liability, which has ranged in the $1.1 to $2.0 million per year range. Assuming this rate of savings continues, the unfunded liability would be reduced to the $60 million range. Staff is evaluating various options for both reducing the liability and saving the required funds to address it. Because of the magnitude of the liability, staff budgets retiree medical expenses through its benefit allocations. As a result, the interest earnings for the year totaled $67 thousand, bringing the balance to $18.178 million. This interest earnings is recorded in the Retiree Health Benefit Internal Service Fund. The Retiree Fund’s net assets consist of the following for the fiscal year ended June 30, 2004 (in thousands): Retiree Health Benefits 2004 2003Net assets, beginning of year $18,111 $16,448Interest earnings 789 807Unrealized gain (loss) on investments (722) 256Interdepartmental charges 600
Net assets, end of year $18,178 $18,111
……………………………………………………………………………………………..…………… 82 City of Palo Alto
Notes to Basic Financial Statements – Note 14
Note 13……………………………………………
DEFERRED COMPENSATION PLAN
City employees may defer a portion of their compensation under City sponsored Deferred Compensation Plans created in accordance with Internal Revenue Code Section 457. Under these Plans, participants are not taxed on the deferred portion of their compensation until distributed to them; distributions may be made only at termination, retirement, death or in an emergency as defined by the Plans. The laws governing deferred compensation plan assets now require plan assets to be held by a Trust for the exclusive benefit of plan participants and their beneficiaries. Since the assets held under these plans are not the City’s property and are not subject to City control, they have been excluded from these financial statements.
Note 14……………………………………………
RISK MANAGEMENT
Coverage The City provides dental coverage to employees through programs which are administered by a service agent. The City is self-insured for the dental coverage. The City has a workers’ compensation insurance policy with coverage up to the statutory limit set by the State of California. The City retains the risk for the first $750 thousand in losses for each accident and employee under this policy. The City also has public employee dishonesty insurance with a $5 thousand deductible and coverage up to $1 million per loss. The City’s property and machinery insurance policy has various deductibles and various coverages based on the kind of machinery. The City is a member of the Authority for California Cities Excess Liability (ACCEL) which provides general liability, including auto liability, insurance coverage up to $22 million per occurrence. The City retains the risk for the first $1 million in losses for each occurrence under this policy. ACCEL was established for the purpose of creating a risk management pool for central California municipalities. ACCEL is governed by a Board of Directors consisting of representatives of its member cities. The board controls the operations of ACCEL, including selection of management and approval of the annual budget. The City’s deposits with ACCEL equal the ratio of the City’s payroll to the total payrolls of all entities. Actual surpluses or losses are shared according to a formula developed from overall loss costs and spread to member entities on a percentage basis after a retrospective rating.
……….……………………………………………………………………………………………. City of Palo Alto 83
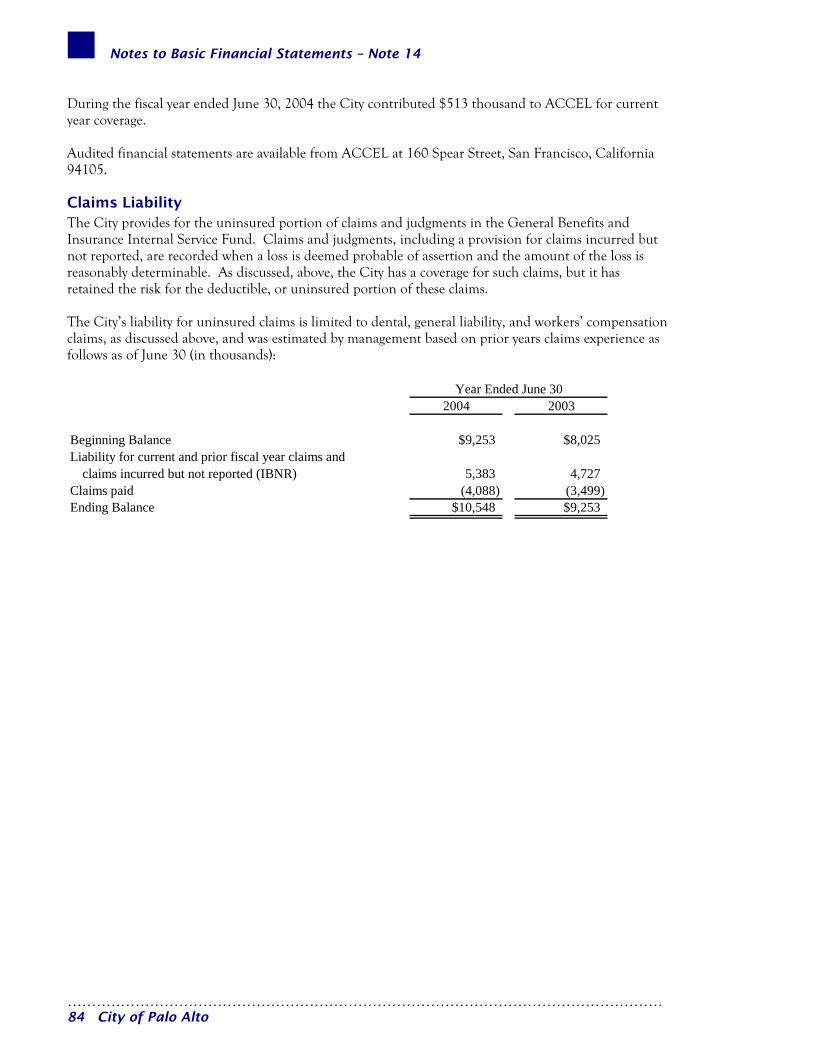
Notes to Basic Financial Statements – Note 14
During the fiscal year ended June 30, 2004 the City contributed $513 thousand to ACCEL for current year coverage. Audited financial statements are available from ACCEL at 160 Spear Street, San Francisco, California 94105.
Claims Liability The City provides for the uninsured portion of claims and judgments in the General Benefits and Insurance Internal Service Fund. Claims and judgments, including a provision for claims incurred but not reported, are recorded when a loss is deemed probable of assertion and the amount of the loss is reasonably determinable. As discussed, above, the City has a coverage for such claims, but it has retained the risk for the deductible, or uninsured portion of these claims. The City’s liability for uninsured claims is limited to dental, general liability, and workers’ compensation claims, as discussed above, and was estimated by management based on prior years claims experience as follows as of June 30 (in thousands):
Year Ended June 302004 2003
Beginning Balance $9,253 $8,025Liability for current and prior fiscal year claims and
claims incurred but not reported (IBNR) 5,383 4,727Claims paid (4,088) (3,499)Ending Balance $10,548 $9,253
…………………………………………………………………………………………………………… 84 City of Palo Alto
Notes to Basic Financial Statements – Note 15
Note 15……………………………………………
JOINT VENTURES
General The City participates in joint ventures through Joint Powers Authorities (JPAs) established under the Joint Exercise of Powers Act of the State of California. As separate legal entities, these JPAs exercise full powers and authorities within the scope of the related Joint Powers Agreement, including the preparation of annual budgets, accountability for all funds, the power to make and execute contracts and the right to sue and be sued. Obligations and liabilities of the JPAs are not those of the City. Each JPA is governed by a board consisting of representatives from each member agency. Each board controls the operations of its respective JPA, including selection of management and approval of operating budgets, independent of any influence by member agencies beyond their representation on the Board.
Northern California Power Agency The City is a member of Northern California Power Agency (NCPA), a joint powers agency which operates under a joint powers agreement among fifteen public agencies. The purpose of NCPA is to use the combined strength of its members to purchase, generate, sell and interchange electric energy and capacity through the acquisition and use of electrical generation and transmission facilities. Each agency member has agreed to fund a pro rata share of certain assessments by NCPA and enter into take-or-pay power supply contracts with NCPA. While NCPA is governed by its members, none of its obligations are those of its members unless expressly assumed by them. During the year ended June 30, 2004, the City incurred expenses totaling $14.727 million for purchased power and assessments earned by NCPA. The City’s interest in NCPA projects and reserves, as computed by NCPA, was $3.082 million at June 30, 2004. This amount represents the City’s portion of funds which resulted from the settlement with third parties of issues with financial consequences and reconciliations of several prior years’ budgets for programs. It is recognized that all the funds credited to the City are linked to the collection of revenue from the City’s ratepayers, or to the settlement of disputes relating to electric power supply and that the money was collected from the City’s ratepayers to pay power bills. Additionally, the NCPA Commission identified and approved the funding of specific reserves for working capital, accumulated employees post-retirement medical benefits, and billed property taxes for the geothermal project. The Commission also identified a number of contingent liabilities that may or may not be realized, the cost of which in most cases is difficult to estimate at this time. One such contingent liability is the steam field depletion which will require funding to cover debt service and operational costs in excess of the expected value of the electric power. The General Operating Reserve is intended to minimize the number and amount of individual reserves needed for each project, protect NCPA’s financial condition and maintain its credit worthiness. These funds are available on demand, but the City has left them with NCPA as a reserve against these contingencies identified by NCPA. Members of NCPA may participate in an individual project of NCPA without obligation for any other project. Member assessments collected for one project may not be used to finance other projects of NCPA without the member’s permission.
…………….………………………………………………………………………………………. City of Palo Alto 85

Notes to Basic Financial Statements – Note 15
Geothermal Projects A purchased power agreement with NCPA obligated the City for 6.158% and 6.158%, respectively, of the operating costs and debt service of the two NCPA 110-megawatt geothermal steam powered generating plants, Project Number 2 and Project Number 3. The City’s participation in the Geothermal Project was sold to Turlock Irrigation District in October 1984. Accordingly, the City is liable for payment of outstanding geothermal related debt only in the event that Turlock fails to make specified payments. Total outstanding debt of the NCPA Geothermal Project at June 30, 2004 is $261.349 million. The City’s participation in this project was 6.158%, or $16.094 million. NCPA’s Geothermal Project has experienced a greater than originally anticipated decline in steam production from geothermal wells on its leasehold property. Results of the continuing well analysis program indicate that the potential productive capacity of the geothermal steam reservoir is less than originally estimated. Therefore, NCPA has modified the operations of the Geothermal Project to reduce the average annual output from past levels. As a result, the per unit cost of energy generated by the projects will be higher than anticipated. NCPA will continue to monitor the wells while pursuing alternatives for improving and extending reservoir performance, including supplemental water re-injection, plant equipment modifications, and changes in operating methodology. NCPA, along with other steam field operators, has observed a substantial increase in steam production in the vicinity of re-injection wells and is attempting to increase water re-injection at strategic locations. NCPA, other steam developers, and the Lake County Sanitation District are constructing a wastewater pipeline project that will greatly increase the amount of water available for re-injection.
Calaveras Hydroelectric Project In July 1981, NCPA agreed with Calaveras County Water District to purchase the output of the North Fork Stanislaus River Hydroelectric Development Project and to finance its construction. Debt service payments to NCPA began in February 1990 when the project was declared substantially complete and power was delivered to the participants. Under its power purchase agreement with NCPA, the City is obligated to pay 22.92% of this Project’s debt service and operating costs. At June 30, 2004, the book value of this Project’s plant, equipment and other assets was $517.398 million, while its long-term debt totaled $514.127 million and other liabilities totaled $978 thousand. The City’s share of the Project’s long term-debt amounted to $117.838 million at that date. In April 1991, the City signed an agreement with the City of Roseville to sell a 6.52% portion of its capacity share of NCPA’s Calaveras hydroelectric plant for a period of 14 years. Under the terms of the sale agreement, Roseville pays all the operation and maintenance costs associated with 6.52% of the plant. In addition, Roseville will also pay the City a portion of the net debt service obligations of the current long-term debt associated with the
………………………………………………………………..………………………………………… 86 City of Palo Alto

Notes to Basic Financial Statements – Note 15
Hydroelectric Project No. 1. However, if Roseville defaults, the City is secondarily liable for the outstanding debt service obligations.
Geothermal Public Power Line In 1983, NCPA, Sacramento Municipal Utility District, the City of Santa Clara and the Modesto Irrigation District (joint owners) initiated studies for a Geothermal Public Power Line (GPPL) which would carry power generated at several existing and planned geothermal plants in the Geysers area to a location where the joint owners could receive it for transmission to their load centers. NCPA has an 18.5% share of this Project and the City has an 11.0736% participation in NCPA’s share. In 1989, the development of the proposed Geothermal Public Power Line was discontinued because NCPA was able to contract for sufficient transmission capacity to meet its needs in the Geysers. However, because the project financing provided funding for an ownership interest in a PG&E transmission line, a central dispatch facility and a performance bond pursuant to the Interconnection Agreement with PG&E, as well as an ownership interest in the proposed GPPL, NCPA issued $16 million in long-term, fixed-rate revenue bonds in November 1989 to defease the remaining variable rate refunding bonds used to refinance this project. The City is obligated to pay its 11.0736% share of the related debt service, but debt service costs are covered through NCPA billing mechanisms that allocate the costs to members based on use of the facilities and services. At June 30, 2004, the book value of this Project’s plant, equipment and other assets was $5.533 million, while its long term debt totaled $4.759 million. The City’s share of the Project’s long-term debt amounted to $527 thousand at that date.
Northwest Power Purchase Contract The City’s participation with other NCPA members in a long-term contract for purchase of power from the Washington Water Power Company was approved in 1993. At that date the City did not have a share of the Project’s long-term debt. On February 1, 1997, the NCPA issued $18.310 million in Northwest Resource Revenue Bonds. The proceeds were used to finance a portion of a payment made under the Northwest Power Purchase Contract and costs of issuance of the debt. Under the NCPA Agreement for Financing Electric Capacity, the City was obligated to pay 13.61% of this debt service. At June 30, 2004 the book value of this Project’s plant, equipment and other assets was $9.955 million, while its long-term debt was retired.
NCPA Financial Information NCPA’s financial statements can be obtained from NCPA, 180 Cirby Way, Roseville, CA 95678.
Transmission Agency of Northern California (TANC) The City is a member of a joint powers agreement with 14 other entities in the Transmission Agency of Northern California (TANC). TANC’s purpose is to provide electrical transmission or other facilities for the use of its members. While governed by its members, none of TANC’s obligations are those of its members unless expressly assumed by them. The City is obligated to pay 4% of TANC’s debt-service and operating costs. According to the 1985 Project Agreement with TANC for the development of the California-Oregon Transmission Project (COTP) and subsequent related project agreements, the City is obligated to pay its share of the project’s costs, including debt service and is entitled to the use of a percentage of the project’s transmission or transfer capacity. TANC has issued four series of Revenue Bonds and Commercial Paper Notes totaling $440.112 million as of June 30, 2004. The City’s share of this debt is $17.604 million.
…………….……………………………………………………………………………………….
City of Palo Alto 87
Notes to Basic Financial Statements – Note 15
Construction of the COTP was complete as of June 30, 1993. The transmission line was energized March 24, 1993. Because funding of certain project participants’ shares in the project was needed pending approval of their applications for participation, TANC issued $93.781 million of Commercial Paper debt backed by a Letter of Credit. The City’s share of the Commercial Paper was $1.295 million at June 30, 2004, which is included in the share of debt discussed above. Shares and obligations of the existing participants could increase pending final project subscription.
TANC Financial Information TANC’s financial statements can be obtained from TANC, P.O. Box 15129, Sacramento, CA 95851.
………………………………………………………………..………………………………………… 88 City of Palo Alto

Notes to Basic Financial Statements – Note 16
Note 16……………………………………………
COMMITMENTS AND CONTINGENCIES
Palo Alto Unified School District – The City leases the former Cubberley School site and eleven extended day care sites from the Palo Alto Unified School District (PAUSD). The lease is part of a larger agreement which includes a covenant not to develop certain properties owned by the PAUSD. The lease term expires in December 2004 with an option for an additional ten year term. The City’s rent for the facilities is $4.963 million per year plus insurance, repairs and maintenance work to be completed, which are not to exceed $250 thousand per year. This lease is cancelable upon 90 days’ written notice in the event funds are not appropriated by the City. In addition, the lease is contingent upon authorization by the Palo Alto electorate if it exceeds the City’s Proposition 4 (Gann) appropriations limitation in any fiscal year. Lease expenditures for the year ended June 30, 2004 amounted to $5.820 million. Future minimum annual lease and covenant payments are as follows (in thousands): Year ending June 30: Payments
2005 $5,9662006 6,1162007 6,2992008 6,4882009 6,680
2010-2015 44,498$76,047
Palo Alto Sanitation Company – In 1999 the City, under the provisions of a new agreement, contracted with the Palo Alto Sanitation Company (PASCO) for services related to residential and commercial refuse collection, curbside recycling, and other operation special programs. The new agreement has a term of seven years and ten months from the effective date of September 1, 1999. The new contract revised the method by which compensation is paid to PASCO to be more in-line with the industry standard. The method establishes compensation based on the relationship between costs and profits and includes periodic performance reviews. In 2003-04 this resulted in payments to PASCO of $8.356 million. City of Palo Alto Regional Water Quality Control Plant – The cities of Palo Alto, Mountain View and Los Altos (the Partners) participate jointly in the cost of maintaining and operating the City of Palo Alto Regional Water Quality Control Plant and related system (the Plant). The City is the owner and administrator of the Plant which provides the transmission, treatment and disposal of sewage for the Partners. The cities of Mountain View and Los Altos are entitled to use a portion of the capacity of the Plant for a specified period of time. Each partner has the right to rent unused capacity from/to the other partners. The expenses of operations and maintenance are paid quarterly by each partner based on its pro rata share of treatment costs. Additionally, joint system revenues are shared by the partners in the same ratio as expenses are paid. The amended agreement has a term of fifty years beginning from the original signing in October 1968, but may be terminated by any partner upon ten years’ notice to the other partners. All sewage treatment property, plant and equipment are included in the Wastewater Treatment Enterprise Fund’s capital assets balance at June 30, 2004. If the City initiates the termination of the contracts, it is required to pay the other partners their unamortized contribution towards the capital assets.
…………….………………………………………………………………………………………. City of Palo Alto 89

Notes to Basic Financial Statements – Note 16
Solid Waste Materials Recovery and Transfer Station (SMaRT Station) – On June 9, 1992, the City, along with the City of Mountain View, signed a Memorandum of Understanding (MOU) with the City of Sunnyvale (Sunnyvale) to participate in the construction and operation of the SMaRT station which recovers recyclable materials from the municipal solid waste delivered from participating cities. Per the MOU, the City has capacity share of 21.27 percent of this facility and reimburses its proportionate capacity share of design, construction, and operation costs to Sunnyvale. On December 1, 1992, the Sunnyvale Financing Authority issued $24.6 million in revenue bonds to finance the design and construction costs of the SMaRT Station. During the fiscal year ending June 30, 2003 the 1992 bonds were refunded by issuing the 2003 Solid Waste Revenue Bonds in the amount of $20.575 million. Even though these bonds are payable from and secured by the net revenues of Sunnyvale’s Utilities Enterprise, the City is obligated to reimburse Sunnyvale 21.27 percent of total debt service payments related to these bonds. The City’s portion of remaining principal balance for SMaRT revenue bonds as of June 30, 2004 is $4.158 million. During the year ended June 30, 2004, the City paid $413 thousand as its portion of current debt service.
UTILITIES ENERGY RESOURCE MANAGEMENT
The Energy Markets in the United States and California Electric and gas energy prices that have stabilized since the energy crisis during 2000-01, showed an up-tick since January 2003. For example, the NYMEX natural gas futures price for January 2005 deliveries rose from $4.50 in January 2003 to $5.50 in January 2004, and to $6.50/MMBtu in September 2004. This increase is closely tied to the rise in world crude oil prices. Rising natural gas prices have also triggered the doubling of coal prices in the U.S over the past 18 months, the primary fuel for electricity production in the U.S. The increase in national coal and natural gas prices has caused higher electricity prices, with forward prices of electricity in Northern California for the year 2005 rising from approximately 4.2¢/kWh in January 2003 to 5.1¢/kWh in September 2004. The California Independent System Operator (CASIO) - the state’s electric transmission grid operator, the California Public Utilities Commission (CPUC), and the Federal Energy Regulatory Commission (FERC) continue to forge ahead in their efforts to reform electricity markets to ensure reliability and spur economic growth. Ensuring that adequate generation and transmission resources are built competitively; mandating investor owned utilities to contract for supplies in the forward markets and reducing over-reliance on the spot energy market; and increasing transparency in transmission and energy markets are different facets of this reform. Though all stakeholders agree on the need for reform to ensure stable markets and avoid re-occurrence of the 2000-01 energy crisis, the CAISO is facing considerable resistance to the implementation of Locational Marginal Pricing (LMP) as a tool to achieve such reform. Governor Schwarzenegger also has developed an energy plan. In his January 2004 State of the State speech, the Governor pinpointed the need for regulatory reform; reform of the wholesale power market to attract new energy investment; reform of the retail power market so large customers can get competitive prices; renegotiation of the high-priced electricity contracts that were locked in at the market's peak; and promotion of the State’s commitment to the environment. The CPUC has acted on the Governor’s request to accelerate resource adequacy requirements, and the Governor has also requested that the CPUC implement existing legislation (AB 57) that mandates a procurement process for investor owned utilities. In spite of the emergence of Pacific Gas and Electric Company (PG&E) from bankruptcy protection on April 12, 2004 and the Governor’s plan and various CPUC/CAISO initiatives for the re-establishment of a robust and healthy energy market in California, there still remains a lack of a cohesive energy policy. A failure to act quickly could result in another 2000-01 like energy crisis with rolling blackouts by 2006,
..…………………………………………………………….…………………………………………… 90 City of Palo Alto
Notes to Basic Financial Statements – Note 16
particularly since the nascent economic recovery has resulted in higher electric and natural gas loads in California. California electric loads in 2003-04 have increased by 2% compared to the prior year and has increased 5% since 2001-02. The electric loads at present are 2% above the all time highs experienced in year 2000. Future Outlook
Electric
The City has entered into a number of new long-term electricity supply commitments to meet anticipated energy deficits caused by reduced energy availability from the Western Area Power Administration (Western) in January 2005. The Palo Alto City Council approved the Long-Term Electric Acquisition Plan ("LEAP") in October 2002 and the LEAP Implementation Plan in August 2003. LEAP is designed to meet the City's objectives of continuing to provide low and stable electric rates to retail customers. As part of LEAP, the City has negotiated a number of energy contracts with suppliers and has obtained a number of supply commitments. The City expects to meet 10% of its electricity needs from new renewable resources such as wind and landfill gas generation by 2008, with the target rising to 20% by 2015. In conformance with LEAP Guidelines, the City is investigating the potential of setting local generation within City limits. A public outreach effort to gauge local support for such an initiative is underway. Depending upon the findings of the outreach efforts, the City Council is expected to make a decision in 2005 on whether to proceed with a detailed setting feasibility study. The expiration of the current Western contract in December 2004 will result in higher energy costs. These higher costs have been incorporated into the City's long-term electric rate projections. Electric rates are projected to increase starting in January 2005. The City’s electric rates, however, are projected to continue to be substantially lower than PG&E rates. The Utility Department’s energy procurement efforts conform to Council approved Energy Risk Management Policies. These include a formal oversight role (middle office) within the Administrative Services Department. A quarterly energy risk management report is provided to the Council as part of this oversight role. As of September 21, 2004, 19 of the 24 risk management program recommendations made by the City Auditor in her July 2002 audit report have been implemented. As stated earlier, California’s grid operator (CAISO) is in the process of implementing a number of initiatives with the goals of efficient operation of the transmission grid and creation of incentives for transmission grid investment. The initiative, formally known as Market Design 2002 (MD02), has recently been renamed Market Redesign and Technology Update (MRTU). The latest estimate for full implementation of MRTU is February 2007. An underlying component of MRTU is the use of LMP or location specific prices for the scheduling of energy transactions, which could lead to significant cost increases for transmission services for entities located in relatively transmission-congested areas such as the Bay Area. The City is actively participating in efforts to ensure fair market design and fair treatment of costs allocated to Bay Area municipal loads by the CAISO and regulatory agencies. The City also is working with the cities of Santa Clara and Alameda to advocate for higher electric transmission reliability standards and building additional transmission into the Bay Area.
Natural Gas
Declining production in the U.S. and Canada is barely being replaced by new drilling and as a result, gas prices in the range of $6 per MMBtu are likely for the next few years. While liquefied natural gas (LNG) imports are expected to relieve prices somewhat, the impact of those imports will not be realized until 2007 at the earliest. Market price volatility has increased and is expected to remain high in the short term.
…………….………………………………………………………………………………………. City of Palo Alto 91

Notes to Basic Financial Statements – Note 16
Staff completed and Council approved a Gas Utility Long-Term Plan (GULP). In the final report, staff made six recommendations that included: 1) Pursue any low-cost, high-value prospects to acquire supply-related resources that may arise from time to time, and (2) Develop comprehensive demand-side management goals and an implementation plan. (3) Do not contract for natural gas storage capacity at this time, (4) Do not acquire additional natural gas pipeline capacity at this time, (5) Undertake initial steps related to gas reserve acquisition, (6) Do not participate in a gas prepay deal at this time. As part of the GULP process, staff reviewed the gas commodity laddering strategy and implemented some revisions to the purchase plan.
Water
The outlook for water supply costs indicates an upward trend as the San Francisco Public Utilities Commission (SFPUC) embarks on a much delayed, but essential, upgrade to its wholesale facilities. In the November 2002 elections, the San Francisco electorate voted in favor of a bond measure to pay for San Francisco’s one-third share of the approximately $3 billion cost of a capital improvement program. A new state water agency, the Bay Area Water Supply and Conservation Agency (BAWSCA), and a Regional Financing Authority were created in 2003 to provide the funding for the two-thirds share of the CIP costs allocated to the agencies that purchase water from the SFPUC. Estimates for these increased costs have been factored into Palo Alto’s long-term rate projections. As of September 2004, however, the SFPUC has indicated that the costs could be even higher after new estimates for the cost to fix the regional water system emerged. In addition, the wholesale agencies (including Palo Alto) may be asked to make an up-front capital commitment, rather than pay for their share of the improvements over time through increased SFPUC wholesale water rates.
Contingent Liabilities There are a number of major uncertainties facing City utility operations. These uncertainties are periodically evaluated by staff and have been considered in developing the Reserve Guidelines approved by Council in October 2003. These uncertainties are discussed below. The FERC’s inquiry into the events and actions that may have caused or contributed to high market prices during the 2000-01 energy crisis has yet to be completed. It is possible that Palo Alto may have to refund some of the revenues from the surplus sales generated by the Northern California Power Agency (NCPA), the City’s resource scheduler and operator. These surplus sales were recognized and the contingencies were noted in the City’s financial statements since 2000-01. The long standing dispute between PG&E and NCPA regarding PG&E’s rights to pass-through CAISO charges (related to Scheduling Coordinator Services (SCS) under the PG&E-NCPA Transmission Interconnection Agreement) has not been settled. PG&E claims that it incurred, approximately $21.3 million in SCS Tariff charges plus accrued interest (methodology is in dispute) on behalf of NCPA pool loads between April 1998 and August 2002. Of this amount, approximately $8.5 million is estimated by NCPA to be Palo Alto’s share. This amount and PG&E’s contractual rights to pass various SCS Tariff charges are being disputed by NCPA along with other entities that had similar interconnection agreements with PG&E. Proceedings are now underway before the FERC to resolve the dispute. Additional claims related to the period September 2003 to December 2004 are unknown at this point in time. Palo Alto’s share of $8.5 million for the period prior to September 2002 has been deposited into an escrow account with NCPA and has been recognized and reflected in the financial statements this year. The Western Area Power Administration and PG&E have a dispute regarding PG&E’s ability to pass through higher transmission costs to Western customers such as Palo Alto. This dispute has continued since 2001, but FERC has consistently ruled in favor of Western. A recent Court ruling, however, in response to PG&E’s appeal, has asked FERC to reconsider its past decision. There is some risk that if
..…………………………………………………………….…………………………………………… 92 City of Palo Alto

Notes to Basic Financial Statements – Note 16
PG&E prevails, transmission rates to deliver Western energy to Palo Alto may be increased by approximately $2.5 million per year for all or part of the period prior to January 2005. During 2001, Enron North America (“ENA”) supplied natural gas and provided gas acquisition and transportation services to the City pursuant to three contracts, and Enron Power Marketing, Inc. (“EPMI”) provided power to the City pursuant to one contract (the “Power Agreement”). The purchase represented approximately 20 percent of the City’s projected need for power during the specified contract period. In inducing the City to enter into the several agreements, Enron Corporation and its affiliates, ENA and EPMI, each made representations about their net worth, financial strength and other material matters and in audited financial statements. Enron Corporation has publicly admitted and acknowledged a number of financial irregularities and conflicts of interest, and has made representations which are apparently false and misleading. The Enron entities have also failed to disclose information concerning certain off-balance sheet limited partnerships. At the end of November 2001, the City gave notice of defaults to EPMI and ENA in connection with the electric and gas contracts with the City. In early December 2001, Enron Corporation, ENA, and EPMI filed for protection under Chapter 11 of the United States Bankruptcy Code. Those cases, and the bankruptcy cases of other Enron affiliates, are pending in the United States Bankruptcy Court for the Southern District of New York. Contemporaneously with the receipt of notices of default and filing their Chapter 11 petitions, the Enron affiliates ceased to perform their obligations under the agreements. The City has arranged for alternative sources of supply. Service disruptions to the City's utility customers have not occurred and are not expected. The agreements for the supply of gas and power provide for early termination payments under certain circumstances. The amounts of such payments would be based on the present value of the difference between the contract price and market prices. The Enron affiliates could contend that the City is obligated to pay early termination payments under the terms of the agreements upon termination. The City denies any and all liability to the Enron affiliates under the agreements, including any liability for early termination payments. The City asserts that those agreements are void, unenforceable and subject to rescission, and any obligations that it may have had have been excused. In the event of litigation, which is unfavorable to the City, a resolution of the termination of the agreements is not expected to have a material adverse impact on the City’s electric or gas retail rates and charges or electric utility or gas utility operations. Litigation – The City is subject to litigation arising in the normal course of business. In the opinion of the City Attorney there is no pending litigation which is likely to have a material adverse effect on the financial position of the City. Sales Tax Adjustment – On April 14, 1999 the State Board of Equalization informed the City that it had been allocated and paid $594 thousand in sales and use taxes in error and that the City was obligated to refund these taxes from future sales tax revenues. The City is in the process of challenging the Board’s finding. However, as of June 30, 2004, the issue had not been settled and the refund had not been returned. Grant Programs – The City participates in Federal and State grant programs. These programs have been audited by the City’s independent accountants in accordance with the provisions of the Federal Single Audit Act amendments of 1996 and applicable State requirements. No cost disallowances were proposed as a result of these audits; however, these programs are still subject to further examination by the grantors and the amount, if any, of expenditures which may be disallowed by the granting agencies cannot be determined at this time. The City expects such amounts, if any, to be immaterial.
…………….………………………………………………………………………………………. City of Palo Alto 93

Notes to Basic Financial Statements – Note 16
This page is intentionally left blank.
..…………………………………………………………….…………………………………………… 94 City of Palo Alto

Supplemental

This page is intentionally left blank.
Non-major Governmental Funds
Non-major Governmental Funds………….
STREET IMPROVEMENT This fund accounts for revenues received from state gas tax, allocations must be spent on the construction and maintenance of the road network system of the City. FEDERAL REVENUE This fund accounts for grant funds received under the Community Development Act of 1974 and HOME Investment Grant Programs, for activities approved and subject to federal regulations. SPECIAL DISTRICTS This fund accounts for revenues from parking permits and for maintenance of various parking lots within the City’s parking districts. TRANSPORTATION MITIGATION This fund accounts for revenues from fees or contributions required for transportation mitigation issues encountered as a result of City development. LOCAL LAW ENFORCEMENT This fund accounts for revenues received in support of City’s law enforcement program. DOWNTOWN PLANNED COMMUNITY This fund accounts for revenues received from contributions and fees that will be used to implement downtown improvements. ASSETS SEIZURE This fund accounts for seized property and funds associated with drug trafficking. Under California Assembly Bill No. 4162, the monies are released to the City for specific expenditures related to law enforcement activities. DEVELOPER’S IMPACT FEE This fund accounts for fees imposed on new developments for parks, community centers and libraries. DOWNTOWN BUSINESS IMPROVEMENT DISTRICT The Downtown Business Improvement District Fund was established to account for the activities of the Palo Alto Downtown Business Improvement District, which was established to enhance the viability of the downtown business district. REDEVELOPMENT AGENCY ADMINISTRATION This fund accounts for the activities of administrating the Redevelopment Agency. GOLF COURSE This fund accounts for revenues received from the General Fund to provide payment of principal and interest associated with general obligation debt issued for the City’s golf course.
……....……………………………………………………………………………………………. City of Palo Alto 95
Non-major Governmental Funds
CIVIC CENTER REFINANCING This fund accounts for revenues received from the General Fund to provide payment of principal and interest associated with the 2002A Civic Center Refinancing Certificates of Participation as they become due. DOWNTOWN PARKING IMPROVEMENT This fund accounts for revenues received from the General Fund to provide payment of principal and interest associated with the 2002B Downtown Parking Improvement Certificate of Participation as they become due. SPECIAL ASSESSMENT DEBT This fund accumulate monies for payments of special assessment improvement bonds which are financed by assessments placed on property owners within the University Avenue and California Avenue Parking district.
…………………………………………………………………………………………………………… 96 City of Palo Alto
Non-major Governmental Funds
This page is intentionally left blank.
……....……………………………………………………………………………………………. City of Palo Alto 97
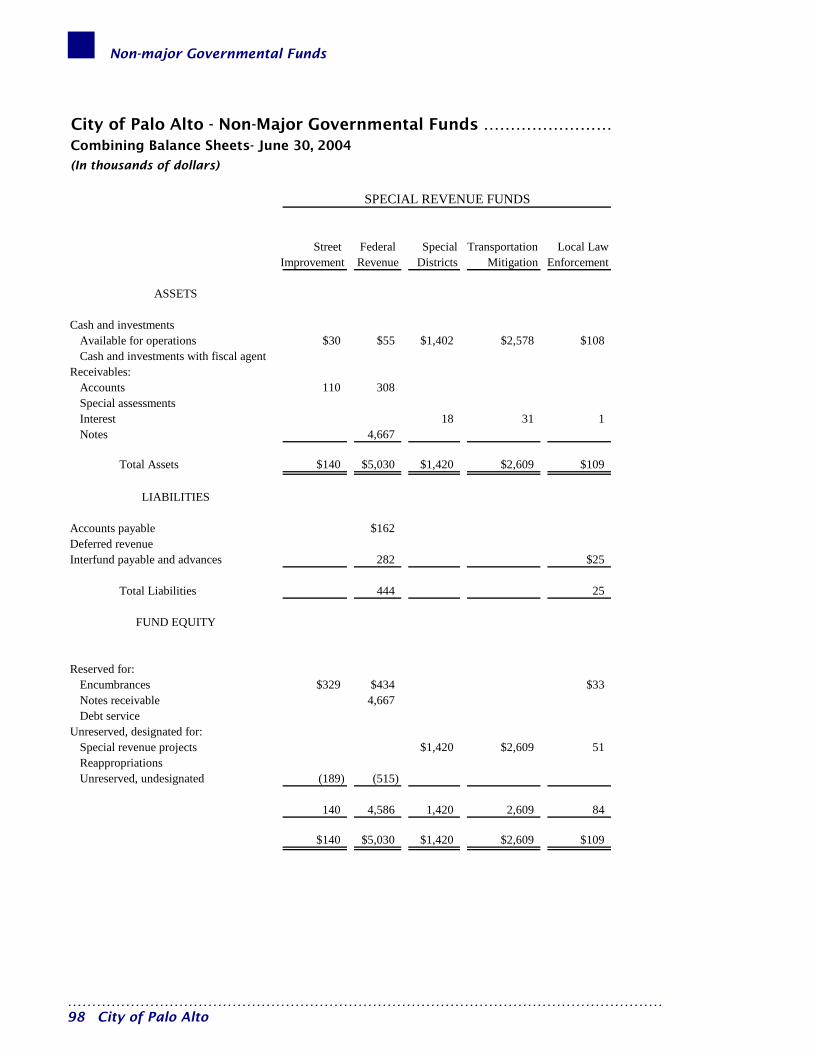
Non-major Governmental Funds
City of Palo Alto - Non-Major Governmental Funds ……………………Combining Balance Sheets- June 30, 2004
(In thousands of dollars)
Street Federal Special Transportation Local Law
Improvement Revenue Districts Mitigation Enforcement
ASSETS
Cash and investments Available for operations $30 $55 $1,402 $2,578 $108Cash and investments with fiscal agent
Receivables:Accounts 110 308Special assessmentsInterest 18 31 1Notes 4,667
Total Assets $140 $5,030 $1,420 $2,609 $109
LIABILITIES
Accounts payable $162Deferred revenueInterfund payable and advances 282 $25
Total Liabilities 444 25
FUND EQUITY
Reserved for:Encumbrances $329 $434 $33Notes receivable 4,667Debt service
Unreserved, designated for:Special revenue projects $1,420 $2,609 51Reappropriations Unreserved, undesignated (189) (515)
140 4,586 1,420 2,609 84
$140 $5,030 $1,420 $2,609 $109
SPECIAL REVENUE FUNDS
…………………………………………………………………………………………………………… 98 City of Palo Alto
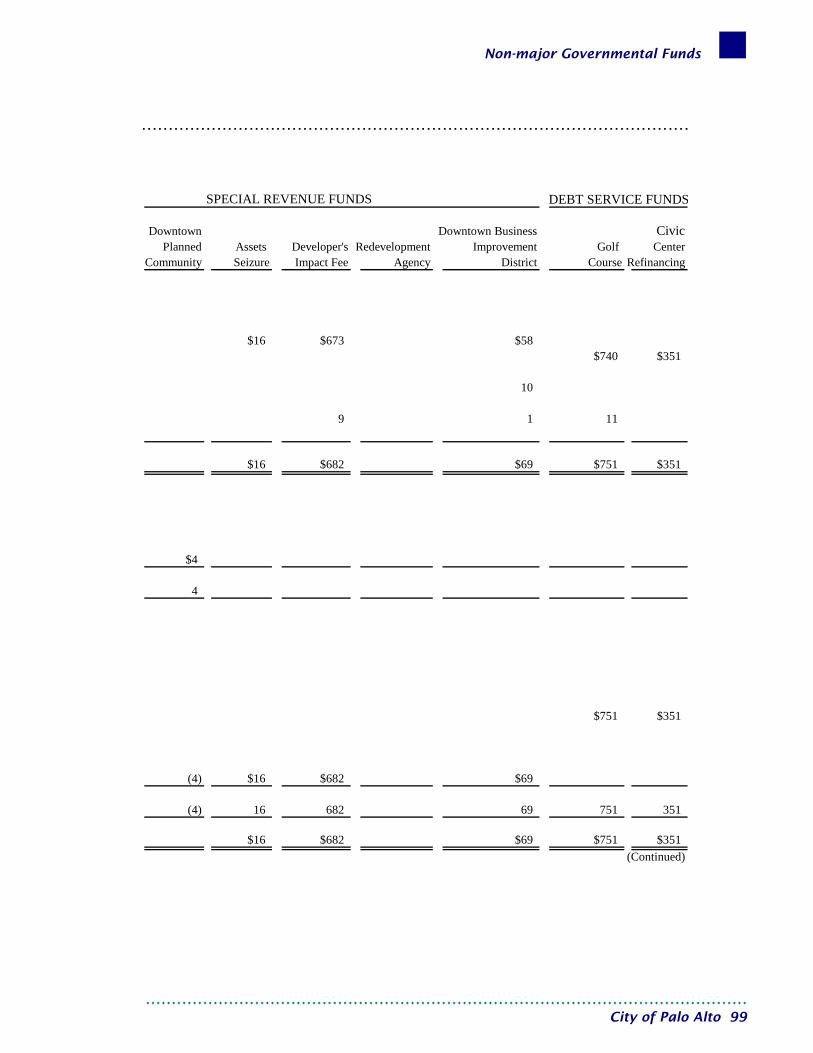
Non-major Governmental Funds
……………………………………………………………………………………………
DEBT SERVICE FUNDS
Downtown Downtown Business CivicPlanned Assets Developer's Redevelopment Improvement Golf Center
Community Seizure Impact Fee Agency District Course Refinancing
$16 $673 $58$740 $351
10
9 1
$16 $682 $69 $751 $351
$4
4
$751 $351
(4) $16 $682 $69
(4) 16 682 69 751 351
$16 $682 $69 $751 $351(Continued)
SPECIAL REVENUE FUNDS
11
……....……………………………………………………………………………………………. City of Palo Alto 99

Non-major Governmental Funds
City of Palo Alto - Non-Major Governmental Funds …Combining Balance Sheets- June 30, 2004
(Continued)
DEBT SERVICE FUNDSTotal
Downtown Special Non-majorParking Assessment Governmental
Improvement Debt Funds
Cash and investments Available for operations $104 $5,024Cash and investments with fiscal agent $322 1,413
Receivables:Accounts 428Special assessments 420 420Interest 71Notes 4,667
Total Assets $322 $524 $12,023
Accounts payable $162Deferred revenue $420 420Interfund payable and advances 311
Total Liabilities 420 893
Reserved for:Encumbrances 796Notes receivable 4,667Debt service $324 35 1,461
Unreserved, designated for:Special revenue projects 4,080ReappropriationsUnreserved, undesignated (2) 69 126
322 104 11,130
$322 $524 $12,023
FUND EQUITY
(In thousands of dollars)
ASSETS
LIABILITIES
…………………………………………………………………………………………………………… 100 City of Palo Alto
Non-major Governmental Funds
This page is intentionally left blank.
……....……………………………………………………………………………………………. City of Palo Alto 101

Non-major Governmental Funds
City of Palo Alto - Non-Major Governmental Funds ……………………
Combining Statements of Revenues, Expenditures andChanges in Fund Balances - For the Year Ended June 30, 2004(In thousands of dollars)
Street Federal Special TransportationImprovement Revenue Districts Mitigation
REVENUESSpecial assessmentsOther taxes and fines $1,146From other agencies:
Community Development Block Grant $643Local Law Enforcement Block GrantState of California 41Other revenue from other agencies 32
Return on investment (55) 18 $10 $9Other:
Housing In-Lieu - residentialHousing In-Lieu - commercialUniversity Avenue Parking 651 42California Avenue Parking 105Other fees
Total Revenues 1,132 693 766 51
EXPENDITURESCurrent:
Planning and Community Environment 581Public Safety - PoliceNon Departmental (59)
Capital outlayDebt service:
Principal retirementInterest and fiscal charges
Total Expenditures 522
EXCESS (DEFICIENCY) OF REVENUESOVER EXPENDITURES 1,132 171 766 51
OTHER FINANCING SOURCES (USES)Transfers in Transfers (out) (2,791) (741) (150)
Total Other Financing Sources (Uses) (2,791) (741) (150)
EXCESS (DEFICIENCY) OF REVENUES ANDOTHER FINANCING SOURCES OVEREXPENDITURES AND OTHER USES (1,659) 171 25 (99)
Fund balances at the beginning of year 1,799 4,415 1,395 2,708
Fund balances at end of year $140 $4,586 $1,420 $2,609
SPECIAL REVENUE FUNDS
…
…………………………………………………………………………………………………………… 102 City of Palo Alto

Non-major Governmental Funds
………………………………………………………………………………………………
DEBT SERVICE FUNDS
Downtown Downtown Business CivicLocal Law Planned Assets Developer's Redevelopment Improvement Golf Center
Enforcement Community Seizure Impact Fee Agency District Course Refinancing
$68
$12100
(9) ($1) ($1) $11 1 $21 $2
493
103 (1) (1) 504 69 21 2
106
270 315284 106
106 554 421
(3) (1) (1) 504 69 (533) (419)
2 $9 324 421(108) (25) (9) (14) (2)
(106) (25) 310 419
(109) (26) (1) 504 69 (223)
193 22 17 178 974 351
$84 ($4) $16 $682 $69 $751 $351(Continued)
SPECIAL REVENUE FUNDS
…
……....……………………………………………………………………………………………. City of Palo Alto 103

Non-major Governmental Funds
City of Palo Alto - Non-Major Governmental Funds ……………………
Combining Statements of Revenues, Expenditures andChanges in Fund Balances - For the Year Ended June 30, 2004(In thousands of dollars)
(Continued) DEBT SERVICE FUNDS Total
Downtown Special Non-majorParking Assessment Governmental
Improvement District FundsREVENUES
Special assessments $128 $196Other taxes and fines 1,146From other agencies:
Community Development Block Grant 643Local Law Enforcement Block Grant 12State of California 141Other revenue from other agencies 32
Return on investment $2 8Other:
Housing In-Lieu - residentialHousing In-Lieu - commercialUniversity Avenue Parking 693California Avenue Parking 105Other fees 493
Total Revenues 2 128 3,469
EXPENDITURESCurrent:
Planning and Community Environment 581Public Safety - Police 106Non Departmental (59)
Capital outlayDebt service:
Principal retirement 105 90 780Interest and fiscal charges 214 35 639
Total Expenditures 319 125 2,047
EXCESS (DEFICIENCY) OF REVENUESOVER EXPENDITURES (317) 3 1,422
OTHER FINANCING SOURCES (USES)Transfers in 318 1,074Transfers (out) (3) (3,843)
Total Other Financing Sources (Uses) 315 (2,769)
EXCESS (DEFICIENCY) OF REVENUES ANDOTHER FINANCING SOURCES OVEREXPENDITURES AND OTHER USES (2) 3 (1,347)
Fund balances at the beginning of year 324 101 12,477
Fund balances at end of year $322 $104 $11,130
…
…………………………………………………………………………………………………………… 104 City of Palo Alto

Non-major Governmental Funds
……....……………………………………………………………………………………………. City of Palo Alto 105
This page is intentionally left blank.

Non-major Governmental Funds
City of Palo Alto - Non-major Governmental Funds ………………………………Combining Schedule of Revenues, Expenditures andChanges in Fund Balances -Budget and ActualFor the Year Ended June 30, 2004(In thousands of dollars)
Variance VariancePositive Positive
Budget Actual (Negative) Budget Actual (Negative)REVENUES
Property taxesSpecial assessmentsOther taxes and fines $1,126 $1,146 $20From other agencies:
Community Development Block Grant $791 $643 ($148)County Measure A/BLocal Law Enforcement Block GrantState of California 34 41 7Other revenue from other agencies 10 32 22
Return on investment 137 (55) (192) 5 18 13Other:
Great Western Bank - loan payoffHousing In-Lieu - residentialHousing In-Lieu - commercialUniversity Avenue Parking California Avenue ParkingOther fees 7 (7)
Total Revenues 1,297 1,132 (165) 813 693 (120)
EXPENDITURESCurrent operations:
Planning and Community Environment 373 581 (208)Public Safety - PoliceNon Departmental 1,052 (59) 1,111
Capital outlayDebt service:
Principal retirementInterest and fiscal charges
Total Expenditures 1,425 522 903
EXCESS (DEFICIENCY) OF REVENUESOVER EXPENDITURES 1,297 1,132 (165) (612) 171 783
OTHER FINANCING SOURCES (USES)Transfers in 218 (218) 15 (15)Transfers (out) (1,761) (2,791) (1,030) (34) 34
Total Other Financing Sources (Uses) (1,543) (2,791) (1,248) (19) 19
EXCESS (DEFICIENCY) OF REVENUES ANDOTHER FINANCING SOURCES OVEREXPENDITURES AND OTHER USES ($246) (1,659) ($1,413) ($631) 171 $802
Fund balances at the beginning of year 1,799 4,415
Fund balances at end of year $140 $4,586
Federal RevenueStreet Improvement
SPECIAL REVENUE FUNDS
…………………………………………………………………………………………………………… 106 City of Palo Alto
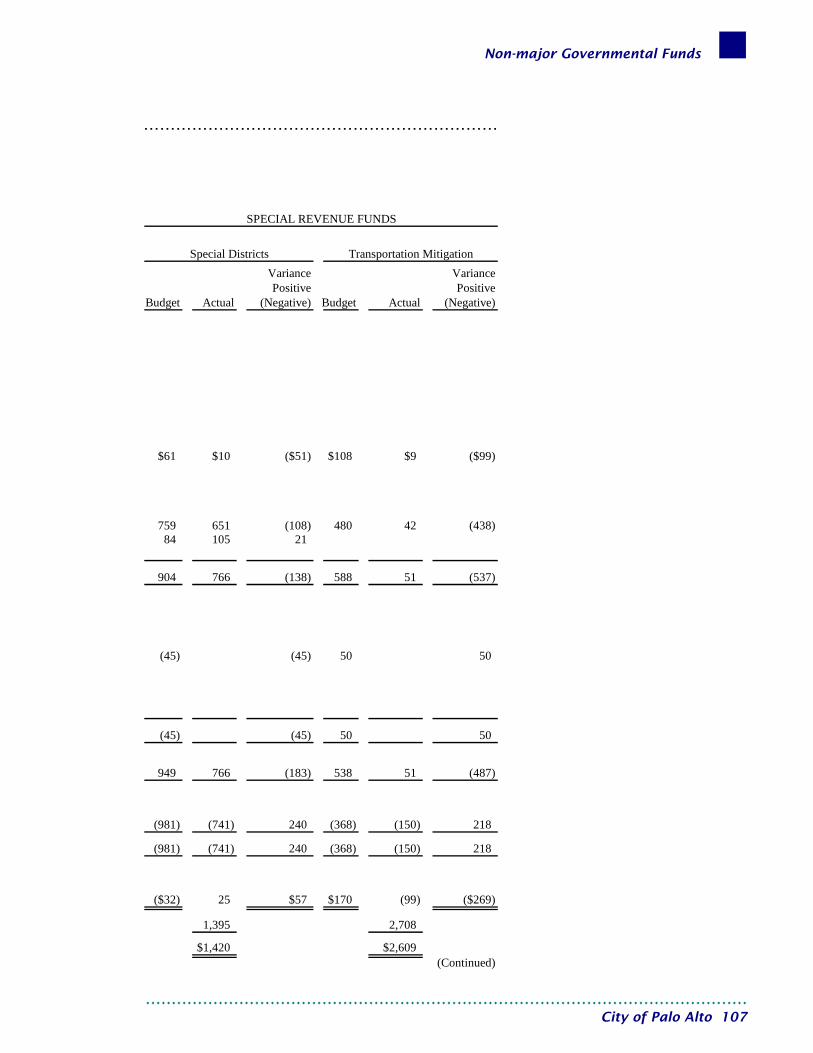
Non-major Governmental Funds
…………………………………………………………
Variance VariancePositive Positive
Budget Actual (Negative) Budget Actual (Negative)
$61 $10 ($51) $108 $9 ($99)
759 651 (108) 480 42 (438)84 105 21
904 766 (138) 588 51 (537)
(45) (45) 50 50
(45) (45) 50 50
949 766 (183) 538 51 (487)
(981) (741) 240 (368) (150) 218
(981) (741) 240 (368) (150) 218
($32) 25 $57 $170 (99) ($269)
1,395 2,708
$1,420 $2,609(Continued)
SPECIAL REVENUE FUNDS
Transportation MitigationSpecial Districts
……....……………………………………………………………………………………………. City of Palo Alto 107
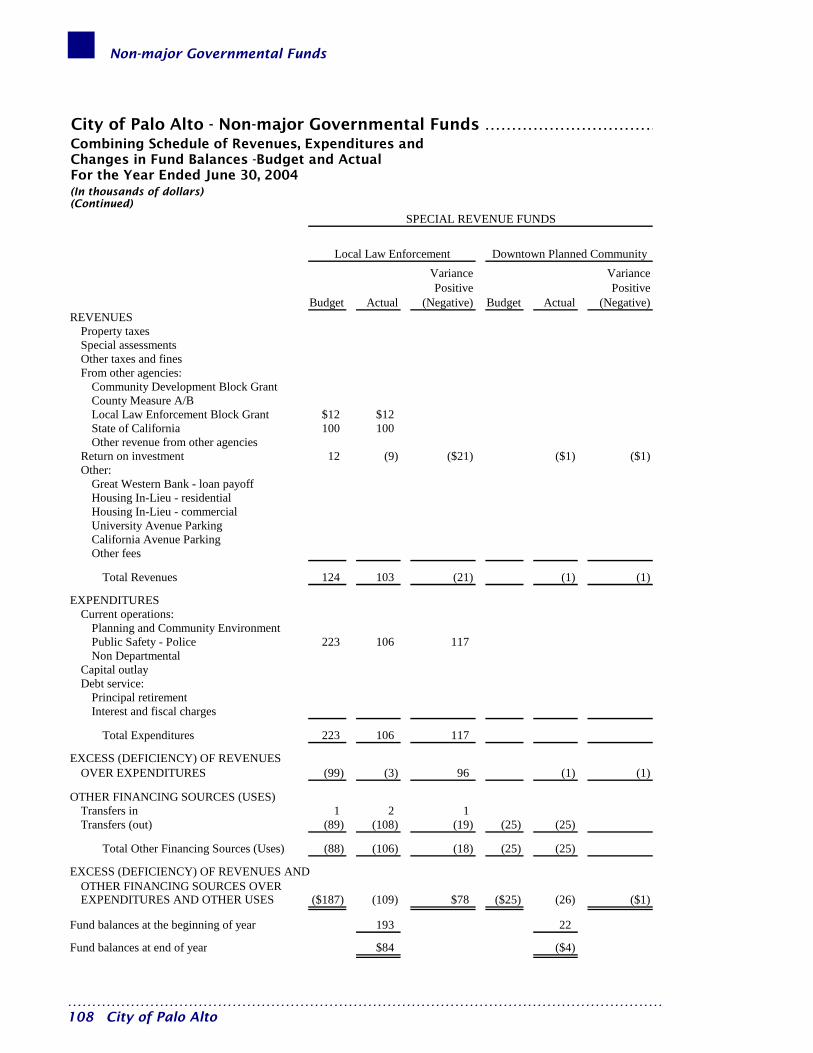
Non-major Governmental Funds
City of Palo Alto - Non-major Governmental Funds ……………………………Combining Schedule of Revenues, Expenditures andChanges in Fund Balances -Budget and ActualFor the Year Ended June 30, 2004(In thousands of dollars)(Continued)
SPECIAL REVENUE FUNDS
Variance VariancePositive Positive
Budget Actual (Negative) Budget Actual (Negative)REVENUES
Property taxesSpecial assessmentsOther taxes and finesFrom other agencies:
Community Development Block GrantCounty Measure A/BLocal Law Enforcement Block Grant $12 $12State of California 100 100Other revenue from other agencies
Return on investment 12 (9) ($21) ($1) ($1)Other:
Great Western Bank - loan payoffHousing In-Lieu - residentialHousing In-Lieu - commercialUniversity Avenue Parking California Avenue ParkingOther fees
Total Revenues 124 103 (21) (1) (1)
EXPENDITURESCurrent operations:
Planning and Community EnvironmentPublic Safety - Police 223 106 117Non Departmental
Capital outlayDebt service:
Principal retirementInterest and fiscal charges
Total Expenditures 223 106 117
EXCESS (DEFICIENCY) OF REVENUESOVER EXPENDITURES (99) (3) 96 (1) (1)
OTHER FINANCING SOURCES (USES)Transfers in 1 2 1Transfers (out) (89) (108) (19) (25) (25)
Total Other Financing Sources (Uses) (88) (106) (18) (25) (25)
EXCESS (DEFICIENCY) OF REVENUES ANDOTHER FINANCING SOURCES OVEREXPENDITURES AND OTHER USES ($187) (109) $78 ($25) (26) ($1)
Fund balances at the beginning of year 193 22
Fund balances at end of year $84 ($4)
Local Law Enforcement Downtown Planned Community
…………………………………………………………………………………………………………… 108 City of Palo Alto

Non-major Governmental Funds
……………………………………………………………………………………
SPECIAL REVENUE FUNDS
Variance Variance VariancePositive Positive Positive
Budget Actual (Negative) Budget Actual (Negative) Budget Actual (Negative)
($1) ($1) $2 $11 $9
553 493 (60)
(1) (1) 555 504 (51)
$9 $9
9 9
(1) (1) 555 504 (51) (9) 9
9 $9(9) (9)
9 (
(1) ($1) $555 504 ($51)
17 178
$16 $682(Continued)
Developer's Impact FeeAssets Seizure Redevelopment Agency
9)
……....……………………………………………………………………………………………. City of Palo Alto 109
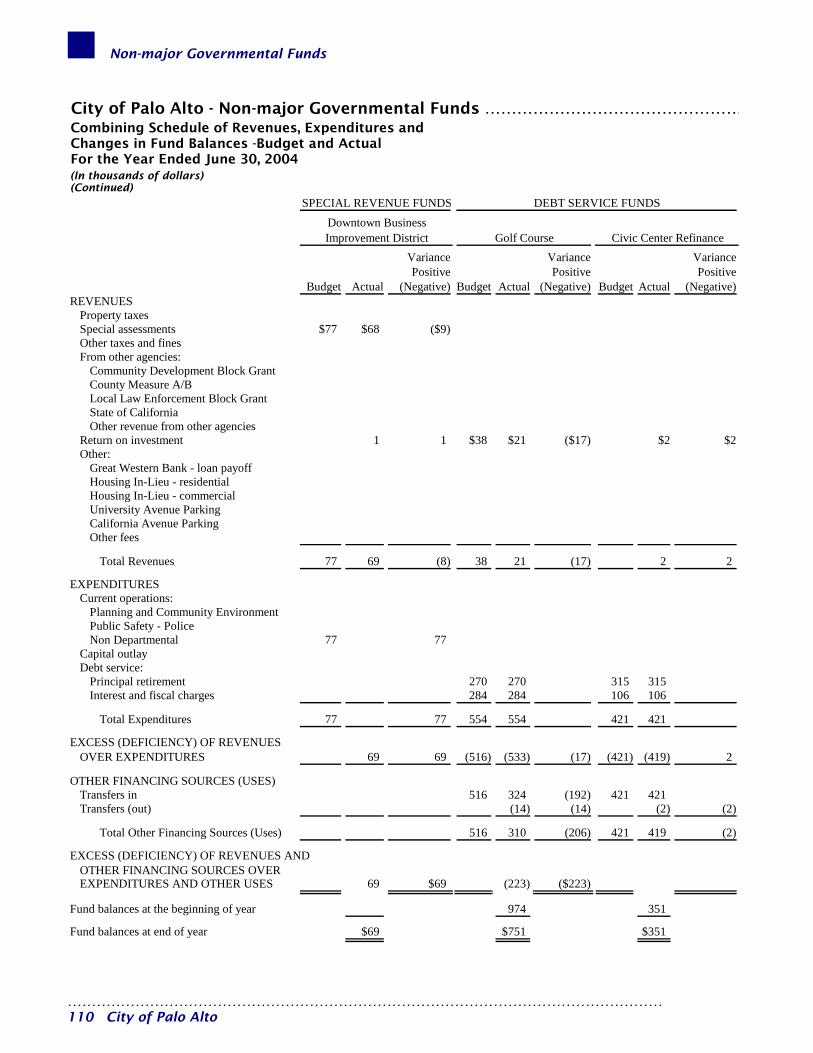
Non-major Governmental Funds
…………………………………………………………………………………………………………… 110 City of Palo Alto
City of Palo Alto - Non-major Governmental Funds …………………………………………Combining Schedule of Revenues, Expenditures andChanges in Fund Balances -Budget and ActualFor the Year Ended June 30, 2004(In thousands of dollars)(Continued)
Variance Variance VariancePositive Positive Positive
Budget Actual (Negative) Budget Actual (Negative) Budget Actual (Negative)REVENUES
Property taxesSpecial assessments $77 $68 ($9)Other taxes and finesFrom other agencies:
Community Development Block GrantCounty Measure A/BLocal Law Enforcement Block GrantState of CaliforniaOther revenue from other agencies
Return on investment 1 1 $38 $21 ($17) $2 $2Other:
Great Western Bank - loan payoffHousing In-Lieu - residentialHousing In-Lieu - commercialUniversity Avenue Parking California Avenue ParkingOther fees
Total Revenues 77 69 (8) 38 21 (17) 2 2
EXPENDITURESCurrent operations:
Planning and Community EnvironmentPublic Safety - PoliceNon Departmental 77 77
Capital outlayDebt service:
Principal retirement 270 270 315 315Interest and fiscal charges 284 284 106 106
Total Expenditures 77 77 554 554 421 421
EXCESS (DEFICIENCY) OF REVENUESOVER EXPENDITURES 69 69 (516) (533) (17) (421) (419) 2
OTHER FINANCING SOURCES (USES)Transfers in 516 324 (192) 421 421Transfers (out) (14) (14) (2) (2)
Total Other Financing Sources (Uses) 516 310 (206) 421 419 (2)
EXCESS (DEFICIENCY) OF REVENUES ANDOTHER FINANCING SOURCES OVEREXPENDITURES AND OTHER USES 69 $69 (223) ($223)
Fund balances at the beginning of year 974 351
Fund balances at end of year $69 $751 $351
Downtown Business Improvement District
SPECIAL REVENUE FUNDS DEBT SERVICE FUNDS
Golf Course Civic Center Refinance
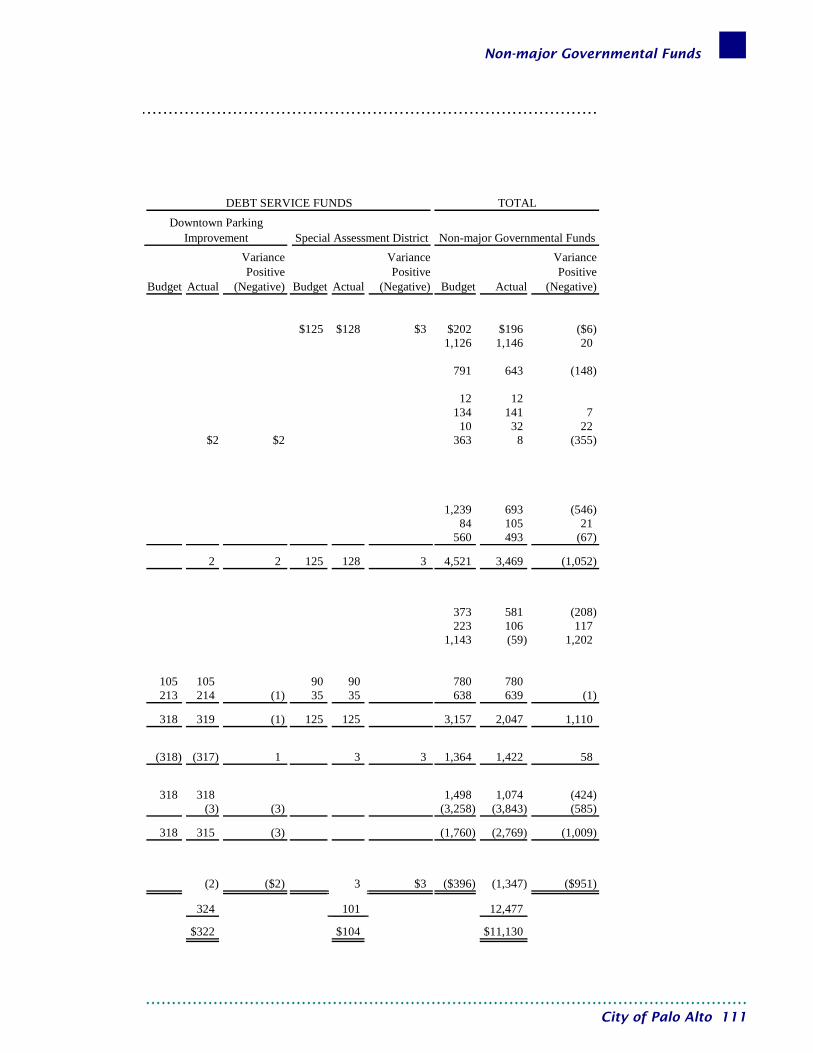
Non-major Governmental Funds
Variance Variance VariancePositive Positive Positive
Budget Actual (Negative) Budget Actual (Negative) Budget Actual (Negative)
$125 $128 $3 $202 $196 ($6)1,126 1,146 20
791 643 (148)
12 12134 141 7
10 32 22$2 $2 363 8 (355)
1,239 693 (546)84 105 21
560 493 (67)
2 2 125 128 3 4,521 3,469 (1,052)
373 581 (208)223 106 117
1,143 (59) 1,202
105 105 90 90 780 780213 214 (1) 35 35 638 639 (1)
318 319 (1) 125 125 3,157 2,047 1,110
(318) (317) 1 3 3 1,364 1,422 58
318 318 1,498 1,074 (424)(3) (3) (3,258) (3,843) (585)
318 315 (3) (1,760) (2,769) (1,009)
(2) ($2) 3 $3 ($396) (1,347) ($951)
324 101 12,477
$322 $104 $11,130
Non-major Governmental FundsDowntown Parking
Improvement Special Assessment District
DEBT SERVICE FUNDS TOTAL
………………………………………………………………………………
……....……………………………………………………………………………………………. City of Palo Alto 111

Non-major Governmental Funds
This page is intentionally left blank.
…………………………………………………………………………………………………………… 112 City of Palo Alto
Internal Service Funds
Internal Service Funds ………………………
Introduction Internal Service Funds are used to finance and account for special activities and services performed by a designated department for other departments in the City on a cost reimbursement basis. The concept of Major Funds introduced by GASB Statement 34 does not extend to Internal Service Funds because they do not do business with outside parties. GASB Statement 34 requires that for the Statement of Activities, the net revenues or expenses of each Internal Service Fund be eliminated by netting them against the operations of the other City departments which generated them. The remaining balance sheet items are consolidated with these same funds in the Statement of Net Assets. However, Internal Service Funds are still presented separately in the Fund financial statements, including the funds below. VEHICLE REPLACEMENT AND MAINTENANCE This fund accounts for the maintenance and replacement of vehicles and equipment used by all City departments. The source of revenue is an accumulation of resources. TECHNOLOGY This fund accounts for replacement and upgrade of technology, and covers four primary areas used by all City departments: desktop, infrastructure, applications, and technology research and development. The source of revenue is an accumulation of resources. PRINTING AND MAILING SERVICES This fund accounts for central duplicating, printing and mailing services provided to all City departments. Source of revenue for this fund is on reimbursement of costs for services and supplies purchased by other departments. GENERAL BENEFITS AND INSURANCE This fund accounts for the administration of compensated absences and health benefits, and the City’s self-insured workers’ compensation and general liability programs. RETIREE HEALTH BENEFITS This fund accounts for the retiree health benefits when the amount of actual benefits exceed one and one-half percent of the City’s gross payroll costs in any fiscal period.
…………………………………………………………………….. City of Palo Alto 113

Internal Service Funds
City of Palo Alto - Internal Service Funds ………………………………………………Combining Statements of Net Assets - June 30, 2004(In thousands of dollars)
Vehicle Printing General Replacement and Benefits Retiree
and Mailing and HealthMaintenance Technology Services Insurance Benefit Total
Current AssetsCash and investments available for operations $4,774 $16,013 $689 $26,903 $17,955 $66,334Accounts receivable, net 8 8Interest receivable 59 141 8 276 223 707Inventory of materials and supplies 303 303
Total Current Assets 5,136 16,154 697 27,187 18,178 67,352
Noncurrent Assets:Interfund receivables 32 100 132Capital assets, net of depreciation 10,342 5,528 15,870
Total Noncurrent Assets 10,374 5,628 16,002
Total Assets 15,510 21,782 697 27,187 18,178 83,354
Current LiabilitiesAccounts payable and accrued liabilities 534 49 18 601Accrued salaries and benefits 46 159 11 765 981Accrued claims payable - current 3,143 3,143Capital lease obligation - current 25 25
Total Current Liabilities 580 233 11 3,926 4,750
Long-term LiabilitiesAccrued compensated absences 12,004 12,004Accrued claims payable 7,405 7,405
Total Long-term Liabilities 19,409 19,409
Total Liabilities 580 233 11 23,335 24,159
Investment in capital assets, net of related debt 10,342 5,503 15,845Unrestricted 4,588 16,046 686 3,852 18,178 43,350
Total Net Assets $14,930 $21,549 $686 $3,852 $18,178 $59,195
ASSETS
LIABILITIES
NET ASSETS
..…………………………………………………………………… 114 City of Palo Alto
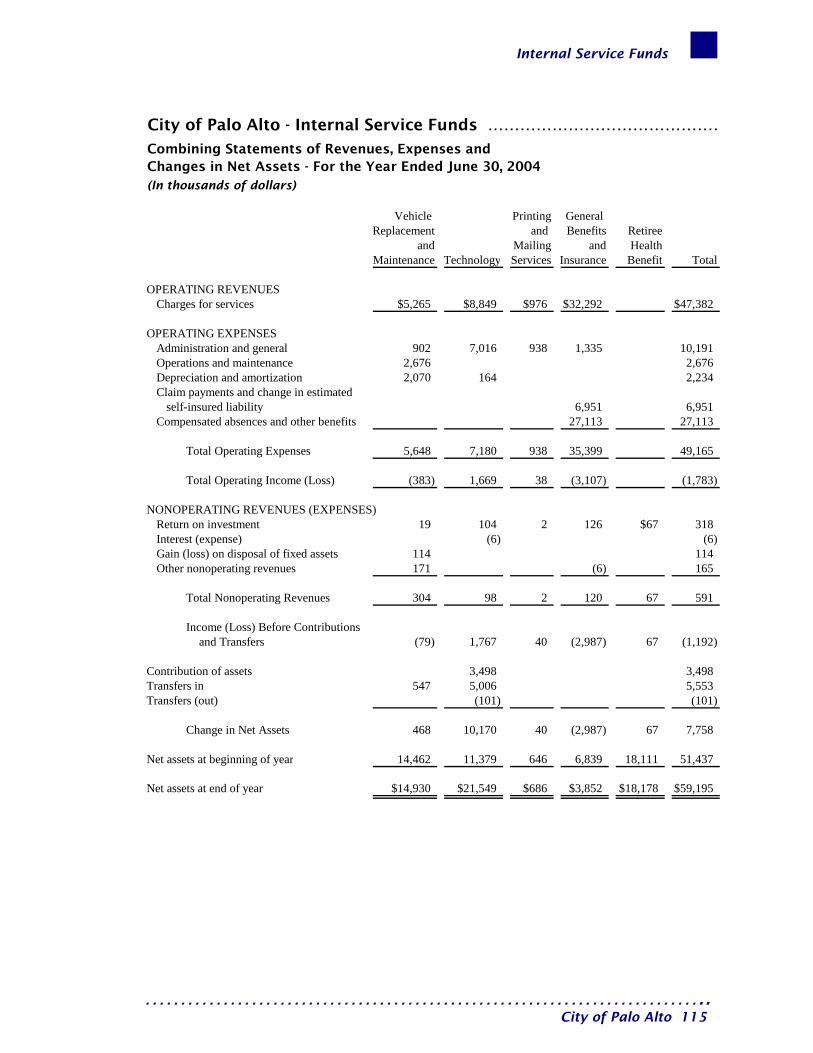
Internal Service Funds
City of Palo Alto - Internal Service Funds ………………………………………
Combining Statements of Revenues, Expenses and Changes in Net Assets - For the Year Ended June 30, 2004(In thousands of dollars)
Vehicle Printing General Replacement and Benefits Retiree
and Mailing and HealthMaintenance Technology Services Insurance Benefit Total
OPERATING REVENUESCharges for services $5,265 $8,849 $976 $32,292 $47,382
OPERATING EXPENSESAdministration and general 902 7,016 938 1,335 10,191Operations and maintenance 2,676 2,676Depreciation and amortization 2,070 164 2,234Claim payments and change in estimated
self-insured liability 6,951 6,951Compensated absences and other benefits 27,113 27,113
Total Operating Expenses 5,648 7,180 938 35,399 49,165
Total Operating Income (Loss) (383) 1,669 38 (3,107) (1,783)
NONOPERATING REVENUES (EXPENSES)Return on investment 19 104 2 126 $67 318Interest (expense) (6) (6)Gain (loss) on disposal of fixed assets 114 114Other nonoperating revenues 171 (6) 165
Total Nonoperating Revenues 304 98 2 120 67 591
Income (Loss) Before Contributions and Transfers (79) 1,767 40 (2,987) 67 (1,192)
Contribution of assets 3,498 3,498Transfers in 547 5,006 5,553Transfers (out) (101) (101)
Change in Net Assets 468 10,170 40 (2,987) 67 7,758
Net assets at beginning of year 14,462 11,379 646 6,839 18,111 51,437
Net assets at end of year $14,930 $21,549 $686 $3,852 $18,178 $59,195
…………………………………………………………………….. City of Palo Alto 115

Internal Service Funds
City of Palo Alto - Internal Service Funds ……………………………………………………
Combining Statements of Cash Flows - For the Year Ended June 30, 2004(In thousands of dollars)
Vehicle Printing General Replacement and Benefits Retiree
and Mailing and HealthMaintenance Technology Services Insurance Benefit Total
CASH FLOW FROM OPERATING ACTIVITIESReceipts from customers $5,266 $8,849 $976 $32,289 $47,380Payments to suppliers (2,092) (28) (2,120)Payments to employees (856) (6,857) (927) (29,428) (38,068)Claims paid (5,656) (5,656)Other receipts 171 (6) 165
Net cash provided by operating activities 2,489 1,964 49 (2,801) 1,701
CASH FLOWS FROM NONCAPITALFINANCING ACTIVITIES
Interfund payments 123 123Transfers in 547 5,006 5,553Transfers (out) (101) (101)
Cash flows from noncapital financing activities 670 4,905 5,575
CASH FLOWS FROM CAPITALFINANCING ACTIVITIES
Acquisition and construction of fixed assets (2,211) (2,008) (4,219)Proceeds from sale of capital assets 114 114Principal paid on long term obligation (32) (32)Interest paid on long term obligation (6) (6)
Cash flows from capital financing activities (2,097) (2,046) (4,143)
CASH FLOWS FROM INVESTING ACTIVITIESInterest and dividends on pooled investments 9 110 2 165 $71 357
Net Cash Flows 1,071 4,933 51 (2,636) 71 3,490
Cash and investments at beginning of year 3,703 11,080 638 29,539 17,884 62,844
Cash and investments at end of year $4,774 $16,013 $689 $26,903 $17,955 $66,334
CASH FLOWS FROM OPERATING ACTIVITIESOperating income (loss) ($383) $1,669 $38 ($3,107) ($1,783)
Adjustments to reconcile operating income (loss) tocash flows from operating activities:
Depreciation and amortization 2,070 164 2,234Other 171 (6) 165Changes in assets and liabilities:
Accounts receivable 1 (3) (2)Inventory of materials and supplies 61 61Accounts and other payables 569 131 11 (980) (269)Accrued claims payable 1,295 1,295
Net cash provided by operating activities $2,489 $1,964 $49 ($2,801) $1,701
Capital Asset contributions $3,498 $3,498
..…………………………………………………………………… 116 City of Palo Alto

Fiduciary Funds
….……………………………………………………………………………………………. City of Palo 117
Fiduciary Funds…………………….………….
Introduction Fiduciary Funds are used to account for assets held by the City acting in a fiduciary capacity for other entities and individuals. The funds are operated to carry out the specific actions required by the trust agreements, ordinances and other governing regulations. GASB Statement 34 requires that the Fiduciary Funds the City has, be presented separately from the Citywide and Fund financial statements. Agency Funds are custodial in nature and do not involve measurement of results of operations. The City maintains four agency funds, as follows: CALIFORNIA AVENUE PARKING ASSESSMENT DISTRICT This fund accounts for receipts and disbursements associated with the 1993 Parking District No. 92-13 Assessment Bonds. CABLE JOINT POWERS AUTHORITY The fund was established to account for the activities of the cable television system on behalf of the members. UNIVERSITY AVENUE AREA PARKING ASSESSMENT DISTRICT The fund accounts for the receipts and disbursements associated with the Series 2001-A University Avenue Are Off-Street Parking Assessments Bonds.
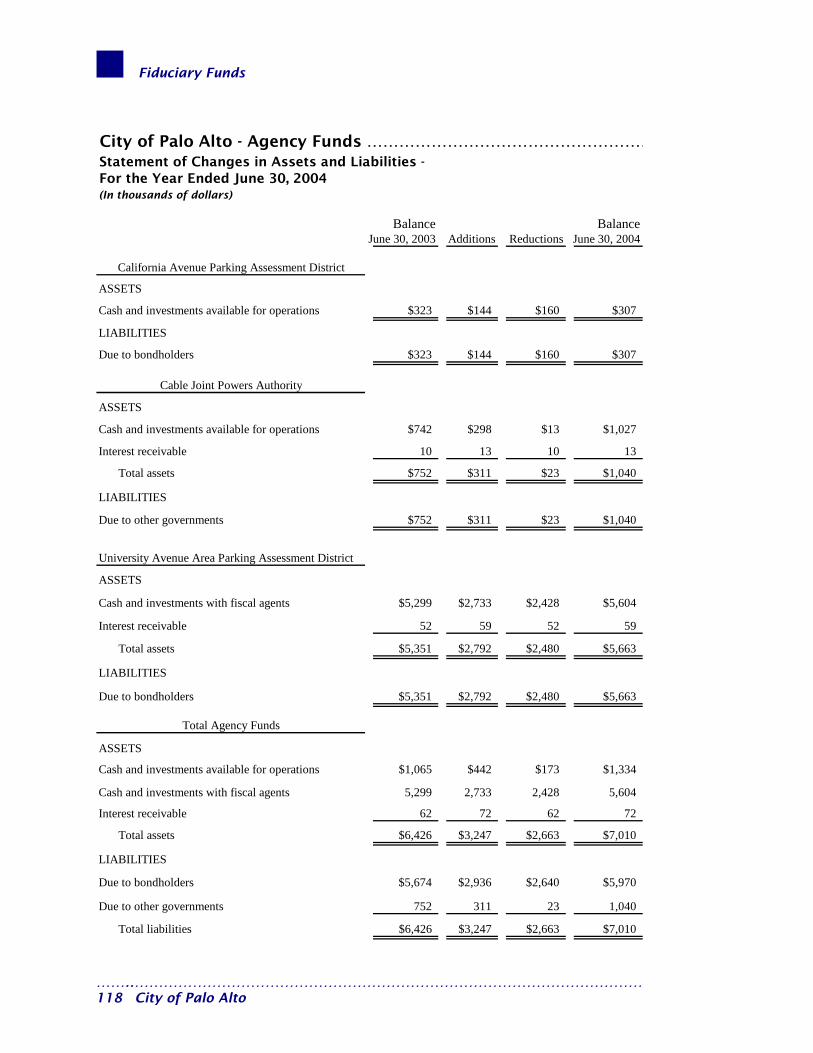
Fiduciary Funds
City of Palo Alto - Agency Funds ……………………………………………Statement of Changes in Assets and Liabilities - For the Year Ended June 30, 2004(In thousands of dollars)
Balance BalanceJune 30, 2003 Additions Reductions June 30, 2004
California Avenue Parking Assessment District
Cash and investments available for operations $323 $144 $160 $307
Due to bondholders $323 $144 $160 $307
Cable Joint Powers Authority
Cash and investments available for operations $742 $298 $13 $1,027
Interest receivable 10 13 10 13
Total assets $752 $311 $23 $1,040
Due to other governments $752 $311 $23 $1,040
University Avenue Area Parking Assessment District
Cash and investments with fiscal agents $5,299 $2,733 $2,428 $5,604
Interest receivable 52 59 52 59
Total assets $5,351 $2,792 $2,480 $5,663
Due to bondholders $5,351 $2,792 $2,480 $5,663
Total Agency Funds
Cash and investments available for operations $1,065 $442 $173 $1,334
Cash and investments with fiscal agents 5,299 2,733 2,428 5,604
Interest receivable 62 72 62 72
Total assets $6,426 $3,247 $2,663 $7,010
Due to bondholders $5,674 $2,936 $2,640 $5,970
Due to other governments 752 311 23 1,040
Total liabilities $6,426 $3,247 $2,663 $7,010
ASSETS
LIABILITIES
ASSETS
LIABILITIES
ASSETS
LIABILITIES
ASSETS
LIABILITIES
…
……..…………………………………………………………………………………………… 118 City of Palo Alto

Statistical

This page is intentionally left blank.
Statistical
Statistical Section………………………………
The statistical section contains comprehensive statistical data which relates to physical, economic, social and political characteristics of the City. It is intended to provide users with a broader and more complete understanding of the City and its financial affairs than is possible from the financial statements and supporting schedules included in the financial section. In this section, readers will find comparative information related to the City’s revenue sources, expenditures, property tax valuations, levies and collections, general obligation bonded debt, utility revenue debt service, demographics and pension plan funding. Where available, the comparative information is presented for the last ten fiscal years. In addition, this section presents information related to the City’s legal debt margin computation, principal taxpayers, notary and security bond coverages, and other miscellaneous statistics pertaining to services provided by the City. In contrast to the financial section, the statistical section information is not usually subject to independent audit.
………………………………………………………………………… City of Palo Alto 119
Statistical
………………………………………………………………………… 120 City of Palo Alto
This page is intentionally left blank.

Statistical
This page is intentionally left blank.
FiscalYear Sales Tax
PropertyTax
OtherTaxes
Permits &Licenses
Fines,Forfeits &Penalties
Interest &Rentals
Chargesfor
Services
FromOther
Agencies Other Total
1995 $14,765 $7,485 $14,682 $7,955 $1,179 $12,528 $4,097 $2,007 $2,938 $67,6361996 17,895 7,854 15,469 8,380 1,032 12,953 4,073 1,144 2,445 71,2451997 18,277 7,735 16,654 9,087 1,219 12,966 4,193 2,239 4,380 76,7501998 20,011 8,903 19,150 8,984 1,161 14,525 4,507 1,732 6,354 85,3271999 20,225 9,521 20,393 8,810 1,475 13,992 4,751 3,374 4,376 86,9172000 22,867 10,770 23,582 12,408 1,703 13,874 5,053 3,282 6,213 99,7522001 25,786 12,110 26,160 12,743 1,873 17,432 5,466 2,208 7,590 111,3682002 20,085 13,231 20,485 2,901 2,181 19,547 16,667 3,860 8,580 107,537
** 2003 18,041 13,821 21,070 3,161 2,124 19,981 16,798 3,776 5,095 103,8672004 18,151 13,707 22,427 2,563 2,884 11,480 16,018 4,661 1,681 93,572
Source: Annual Financial Statements ** Revenue categories were changed to align with budget classifications in 2002
City of Palo Alto - General Governmental Revenues by Source
Last Ten Fiscal Years ($000s)
All Governmental Fund Types
$0
$5,000
$10,000
$15,000
$20,000
$25,000
$30,000
1995 1996 1997 1998 1999 2000 2001 2002 2003 2004
Sales Tax Property Tax Other Taxes
Permits & Licenses Fines, Forfeits & Penalties Interest & Rentals
Charges for Services From Other Agencies Other
………………………………………………………………………… City of Palo Alto 121

Statistical
FiscalYear
Administ-ration (1)
PublicWorks
Planning &Community
Environment Police Fire Community
Services Non-
Departmental
SpecialRevenue &
CapitalProjects
DebtServices Total
(2) 1995 $10,340 $7,517 $3,842 $14,058 $11,437 $12,435 $5,884 $7,722 $2,415 $75,6501996 11,133 6,614 3,901 14,066 11,739 13,019 5,992 6,296 2,490 75,2501997 11,689 7,339 4,320 14,804 12,292 13,972 6,086 7,581 2,319 80,4021998 12,987 8,172 4,832 16,093 13,100 15,050 6,298 6,749 2,293 85,5741999 15,066 9,202 5,674 16,705 13,949 16,820 6,520 16,605 2,509 103,0502000 15,772 8,827 6,639 17,666 14,512 17,858 6,927 13,151 2,801 104,1532001 18,557 9,522 6,652 18,306 15,973 18,469 14,487 11,089 2,817 115,8722002 18,235 9,549 7,378 19,047 16,722 19,499 8,259 16,960 1,151 116,8002003 17,521 9,858 7,721 19,719 16,841 19,793 7,442 33,584 1,571 134,0502004 13,862 8,031 8,793 19,962 16,891 19,934 7,598 22,289 1,419 118,779
Source: Annual Financial StatementsNOTE
(2) During fiscal year 1993-94 the City implemented GASB Statement No.14. The Reporting Entity, and as a result, the Palo Alto Centennial 1994, Inc., was included in the beginning of this year. Data prior to 1993-94 has not been restated.
City of Palo Alto - General Governmental Expenditures by Function………………
All Governmental Fund TypesLast Ten Fiscal Years ($000s)
(1) Comprised of the following departments: City Council, City Manager, City Attorney, City Clerk, City Auditor, Administrative Services and Human Resources
$0
$5,000
$10,000
$15,000
$20,000
$25,000
$30,000
$35,000
$40,000
1995 1996 1997 1998 1999 2000 2001 2002 2003 2004Administ-ration (1) Public WorksPlanning & Community Environment PoliceFire Community ServicesNon-Departmental Special Revenue & Capital ProjectsDebt Services
………………………………………………………………………… 122 City of Palo Alto
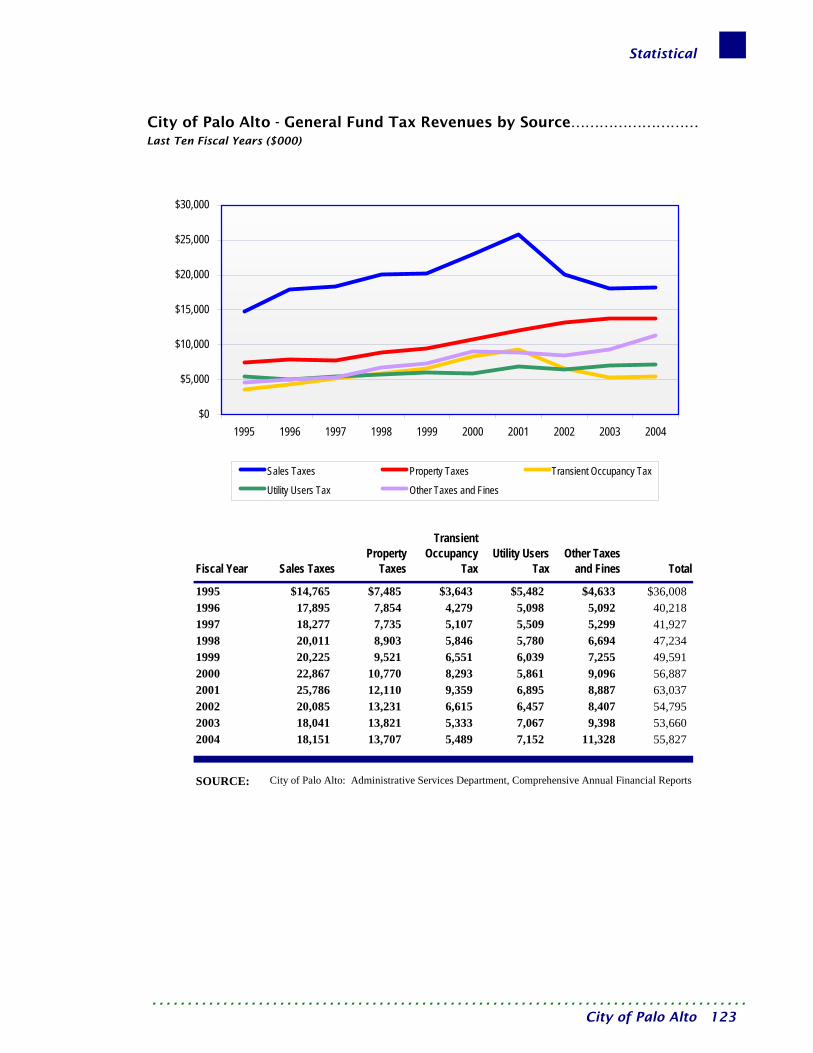
Statistical
Fiscal Year Sales Taxes Property
Taxes
TransientOccupancy
Tax Utility Users
Tax Other Taxes
and Fines Total
1995 $14,765 $7,485 $3,643 $5,482 $4,633 $36,0081996 17,895 7,854 4,279 5,098 5,092 40,2181997 18,277 7,735 5,107 5,509 5,299 41,9271998 20,011 8,903 5,846 5,780 6,694 47,2341999 20,225 9,521 6,551 6,039 7,255 49,5912000 22,867 10,770 8,293 5,861 9,096 56,8872001 25,786 12,110 9,359 6,895 8,887 63,0372002 20,085 13,231 6,615 6,457 8,407 54,7952003 18,041 13,821 5,333 7,067 9,398 53,6602004 18,151 13,707 5,489 7,152 11,328 55,827
SOURCE: City of Palo Alto: Administrative Services Department, Comprehensive Annual Financial Reports
City of Palo Alto - General Fund Tax Revenues by Source………………………Last Ten Fiscal Years ($000)
$0
$5,000
$10,000
$15,000
$20,000
$25,000
$30,000
1995 1996 1997 1998 1999 2000 2001 2002 2003 2004
Sales Taxes Property Taxes Transient Occupancy Tax
Utility Users Tax Other Taxes and Fines
………………………………………………………………………… City of Palo Alto 123
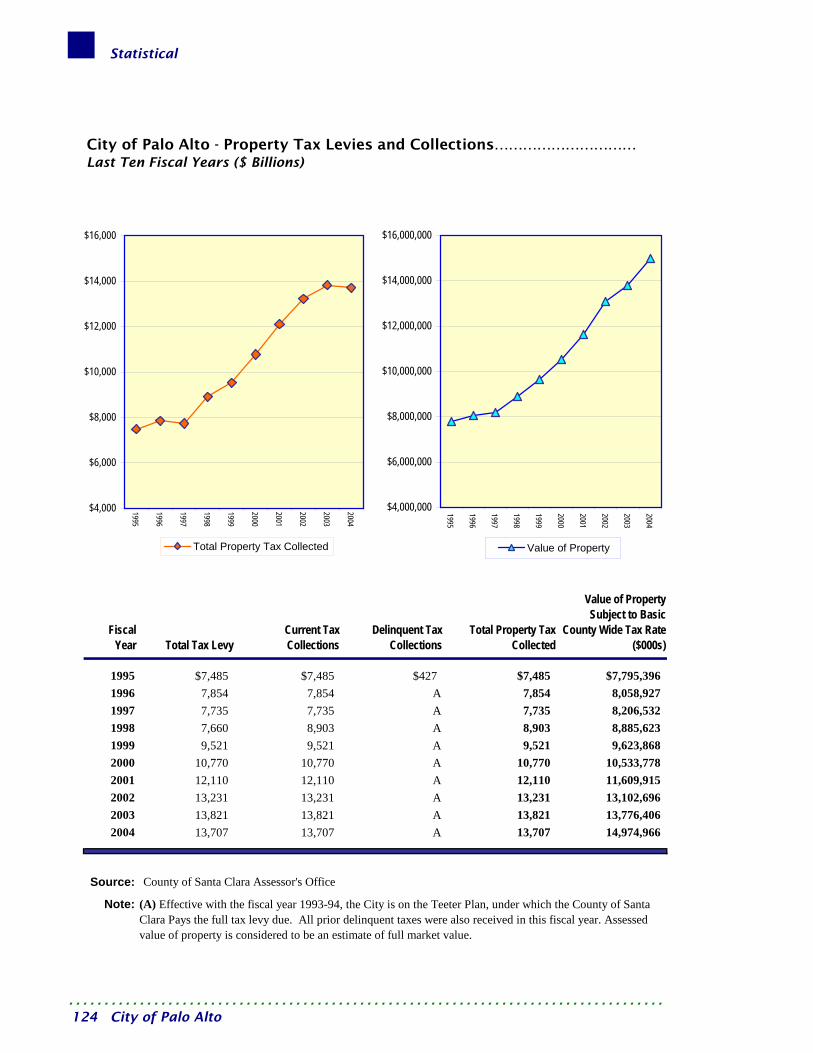
Statistical
FiscalYear Total Tax Levy
Current TaxCollections
Delinquent TaxCollections
Total Property TaxCollected
Value of PropertySubject to Basic
County Wide Tax Rate($000s)
1995 $7,485 $7,485 $427 $7,485 $7,795,3961996 7,854 7,854 A 7,854 8,058,9271997 7,735 7,735 A 7,735 8,206,5321998 7,660 8,903 A 8,903 8,885,6231999 9,521 9,521 A 9,521 9,623,8682000 10,770 10,770 A 10,770 10,533,7782001 12,110 12,110 A 12,110 11,609,9152002 13,231 13,231 A 13,231 13,102,6962003 13,821 13,821 A 13,821 13,776,4062004 13,707 13,707 A 13,707 14,974,966
Source:
Note: (A) Effective with the fiscal year 1993-94, the City is on the Teeter Plan, under which the County of Santa Clara Pays the full tax levy due. All prior delinquent taxes were also received in this fiscal year. Assessed value of property is considered to be an estimate of full market value.
County of Santa Clara Assessor's Office
City of Palo Alto - Property Tax Levies and Collections…………………………Last Ten Fiscal Years ($ Billions)
$4,000,000
$6,000,000
$8,000,000
$10,000,000
$12,000,000
$14,000,000
$16,000,000
1995
1996
1997
1998
1999
2000
2001
2002
2003
2004
Value of Property
$4,000
$6,000
$8,000
$10,000
$12,000
$14,000
$16,000
1995
1996
1997
1998
1999
2000
2001
2002
2003
2004
Total Property Tax Collected
………………………………………………………………………… 124 City of Palo Alto
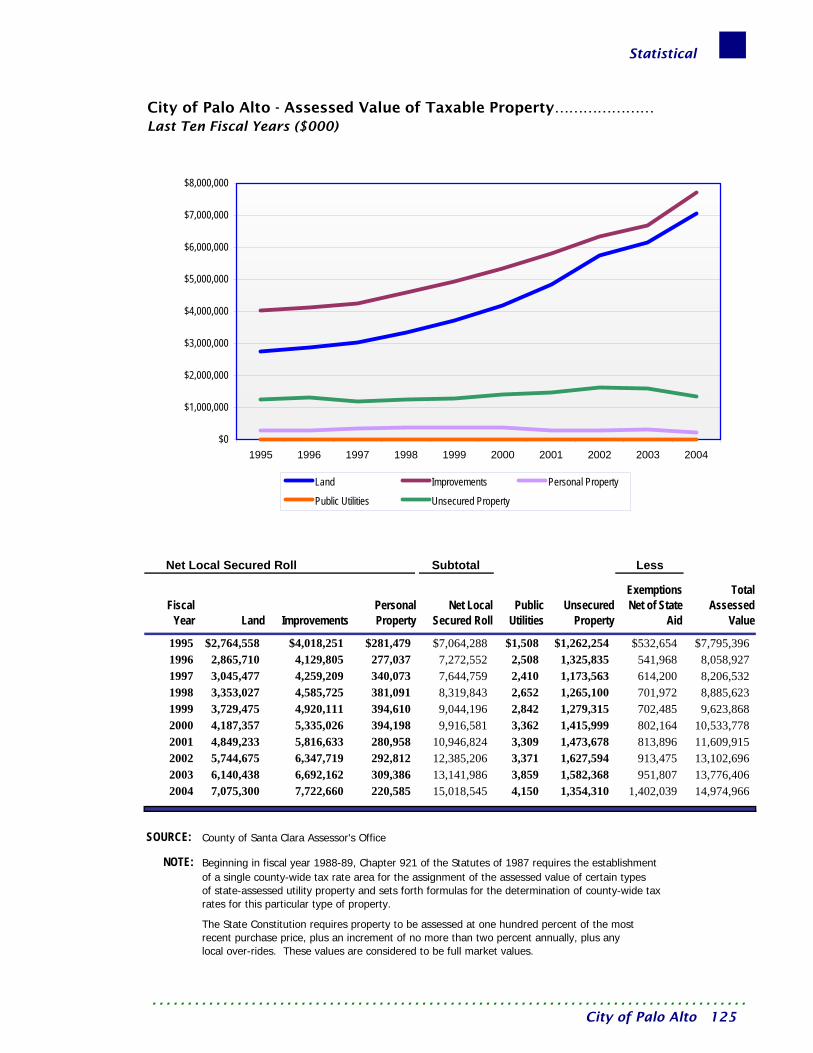
Statistical
City of Palo Alto - Assessed Value of Taxable Property…………………Last Ten Fiscal Years ($000)
Net Local Secured Roll Subtotal Less
FiscalYear Land Improvements
PersonalProperty
Net LocalSecured Roll
PublicUtilities
UnsecuredProperty
ExemptionsNet of State
Aid
TotalAssessed
Value
1995 $2,764,558 $4,018,251 $281,479 $7,064,288 $1,508 $1,262,254 $532,654 $7,795,3961996 2,865,710 4,129,805 277,037 7,272,552 2,508 1,325,835 541,968 8,058,9271997 3,045,477 4,259,209 340,073 7,644,759 2,410 1,173,563 614,200 8,206,5321998 3,353,027 4,585,725 381,091 8,319,843 2,652 1,265,100 701,972 8,885,6231999 3,729,475 4,920,111 394,610 9,044,196 2,842 1,279,315 702,485 9,623,8682000 4,187,357 5,335,026 394,198 9,916,581 3,362 1,415,999 802,164 10,533,7782001 4,849,233 5,816,633 280,958 10,946,824 3,309 1,473,678 813,896 11,609,9152002 5,744,675 6,347,719 292,812 12,385,206 3,371 1,627,594 913,475 13,102,6962003 6,140,438 6,692,162 309,386 13,141,986 3,859 1,582,368 951,807 13,776,4062004 7,075,300 7,722,660 220,585 15,018,545 4,150 1,354,310 1,402,039 14,974,966
SOURCE: County of Santa Clara Assessor's Office
NOTE: Beginning in fiscal year 1988-89, Chapter 921 of the Statutes of 1987 requires the establishment of a single county-wide tax rate area for the assignment of the assessed value of certain typesof state-assessed utility property and sets forth formulas for the determination of county-wide taxrates for this particular type of property.
The State Constitution requires property to be assessed at one hundred percent of the mostrecent purchase price, plus an increment of no more than two percent annually, plus anylocal over-rides. These values are considered to be full market values.
$0
$1,000,000
$2,000,000
$3,000,000
$4,000,000
$5,000,000
$6,000,000
$7,000,000
$8,000,000
1995 1996 1997 1998 1999 2000 2001 2002 2003 2004
Land Improvements Personal Property
Public Utilities Unsecured Property
………………………………………………………………………… City of Palo Alto 125

Statistical
Fiscal Year County of Santa Clara School Districts Total
1995 1.0330 0.0000 1.03301996 1.0340 0.0030 1.03701997 1.0340 0.1210 1.15501998 1.0388 0.0764 1.11521999 1.0388 0.0757 1.11452000 1.0319 0.0740 1.10592001 1.0356 0.0771 1.11272002 1.0364 0.0727 1.10912003 1.0388 0.0694 1.10822004 1.0388 0.0776 1.1164
City of Palo Alto - Property Tax Rates………………
Source: County of Santa Clara, Tax Rates and Information
All Overlapping Governments
Per $100 of Assessed Value - Last Ten Years
0.0000
0.2000
0.4000
0.6000
0.8000
1.0000
1.2000
1995 1996 1997 1998 1999 2000 2001 2002 2003 2004
County of Santa Clara School Districts
………………………………………………………………………… 126 City of Palo Alto

Statistical
…………………………………………………………………………
Fiscal Year Department
Stores
Eating/Drinking
Places AutoSales
Furniture/Appliance
ApparelStores
FoodMarkets
SericeStations
DrugStores
OtherRetail
RetailStores
Total All Other
Outlets Total
1995 $2,090 $1,532 $1,024 $975 $1,019 $266 $281 $113 $3,678 $10,978 $3,967 $14,9451996 2,436 1,727 1,374 1,145 921 285 292 108 3,155 11,443 4,711 16,1541997 2,656 1,839 1,595 1,238 1,031 297 327 119 3,740 12,842 4,518 17,3601998 2,925 2,032 2,112 1,388 1,033 325 318 131 4,177 14,441 5,026 19,4671999 2,740 2,077 2,265 1,485 1,116 344 269 143 4,079 14,518 5,128 19,6462000 3,011 2,379 2,724 1,845 1,226 347 323 173 4,169 16,197 6,386 22,5832001 3,112 2,551 3,118 1,824 1,343 351 417 186 4,706 17,608 7,270 24,8782002 2,646 2,321 2,533 1,593 1,171 371 379 180 3,674 14,868 5,009 19,8772003 2,316 2,172 2,094 1,455 1,114 375 388 171 2,811 12,896 4,834 17,7302004 2,425 2,168 1,958 1,479 1,186 351 437 168 3,698 13,870 3,997 17,867
Source:
NOTE:
State Funds 6.00%County Transportation Fund (Transportation Development Act) 0.25%County Transportation Fund 1.00%City 1.00%
8.25%Source: California State Board of Equalization
California State Board of Equalization complied by The HDL Companies
RETAIL STORES
SALES TAX RATES FOR THEFISCAL YEAR ENDED JUNE 30, 2004
All amounts have been restated in Fiscal Year totals. Prior CAFR amounts were reported as Calendar Year totals.
City of Palo Alto- Taxable Transactions by Type of Business……………………………………Taxable Transactions by Type of BusinessLast Ten Fiscal Years ($millions)
Fiscal Year 2004
Eating/ Drinking Places12.1%All Other Outlets
22.3%
Other Retail20.7%
Drug Stores1.0% Service
Stations2.4%
Food Markets2.0%
Department Stores13.6%
Apparel Stores6.6%
Furniture/ Appliance8.3%
Auto Sales11.0%
City of Palo Alto 127
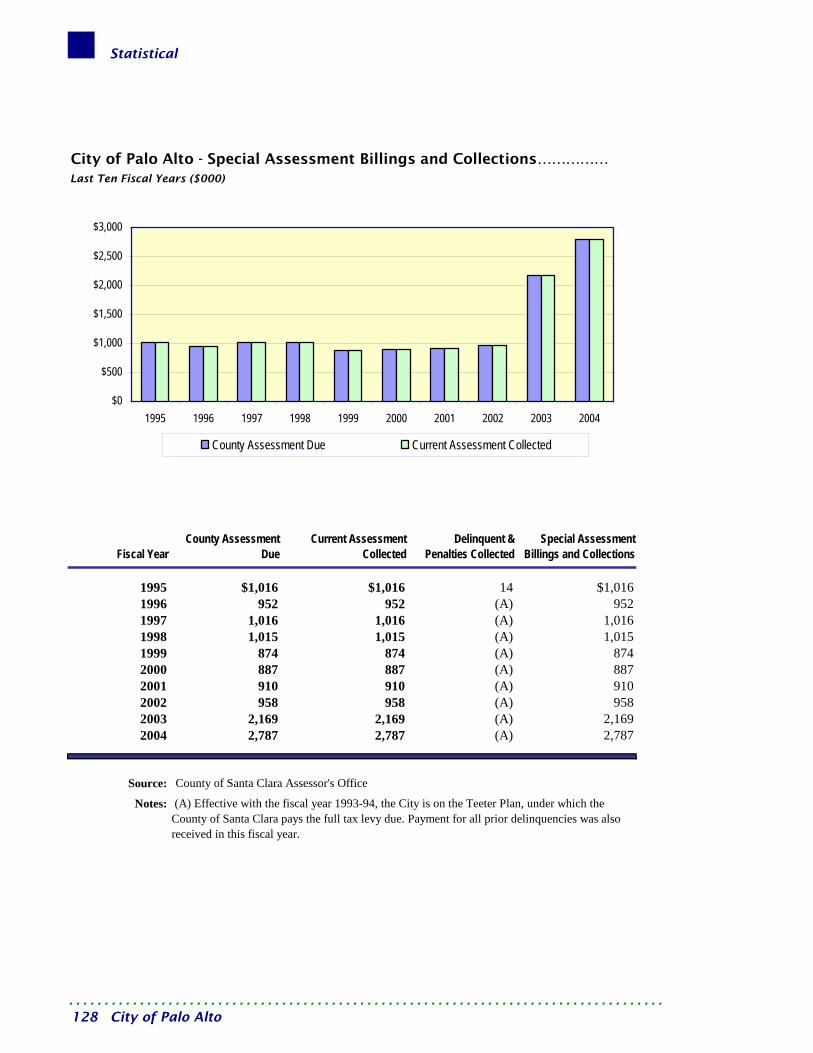
Statistical
Fiscal Year County Assessment
Due Current Assessment
Collected Delinquent &
Penalties Collected Special Assessment
Billings and Collections
1995 $1,016 $1,016 14 $1,0161996 952 952 (A) 9521997 1,016 1,016 (A) 1,0161998 1,015 1,015 (A) 1,0151999 874 874 (A) 8742000 887 887 (A) 8872001 910 910 (A) 9102002 958 958 (A) 9582003 2,169 2,169 (A) 2,1692004 2,787 2,787 (A) 2,787
Source:
Notes:
City of Palo Alto - Special Assessment Billings and Collections……………
(A) Effective with the fiscal year 1993-94, the City is on the Teeter Plan, under which the County of Santa Clara pays the full tax levy due. Payment for all prior delinquencies was also received in this fiscal year.
County of Santa Clara Assessor's Office
Last Ten Fiscal Years ($000)
$0
$500
$1,000
$1,500
$2,000
$2,500
$3,000
1995 1996 1997 1998 1999 2000 2001 2002 2003 2004
County Assessment Due Current Assessment Collected
………………………………………………………………………… 128 City of Palo Alto
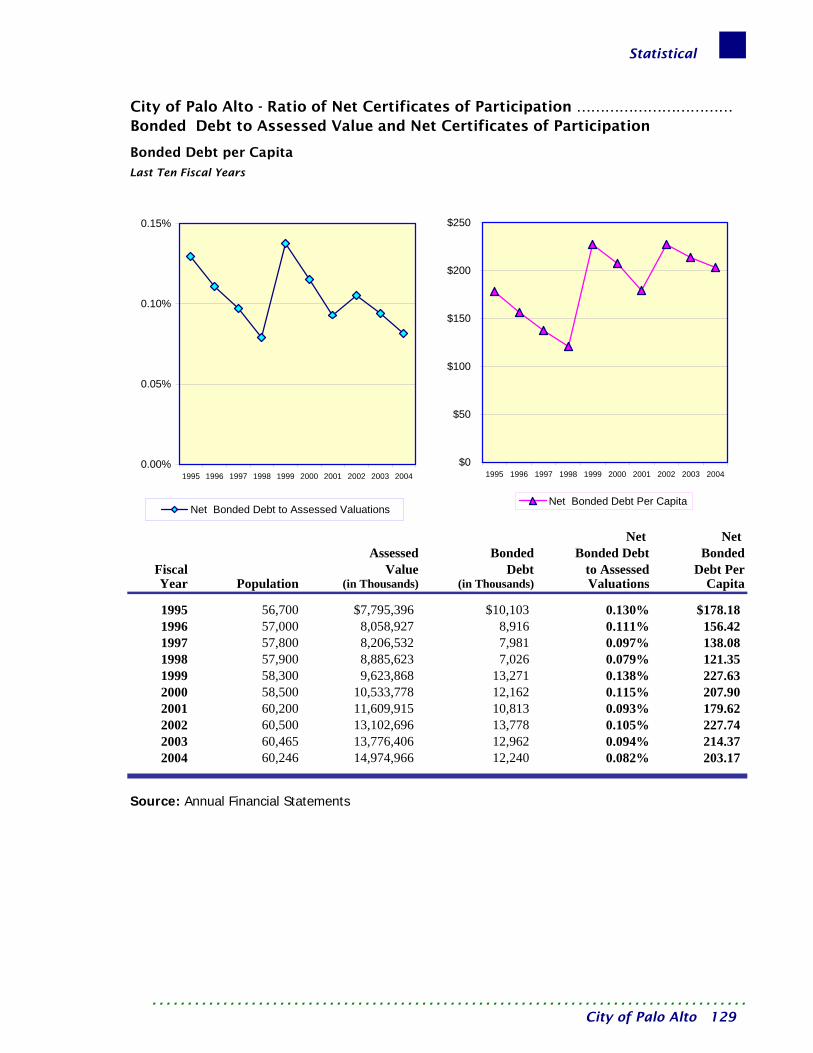
Statistical
Net Net Assessed Bonded Bonded Debt Bonded
Fiscal Value Debt to Assessed Debt PerYear Population (in Thousands) (in Thousands) Valuations Capita
1995 56,700 $7,795,396 $10,103 0.130% $178.181996 57,000 8,058,927 8,916 0.111% 156.42 1997 57,800 8,206,532 7,981 0.097% 138.08 1998 57,900 8,885,623 7,026 0.079% 121.35 1999 58,300 9,623,868 13,271 0.138% 227.63 2000 58,500 10,533,778 12,162 0.115% 207.90 2001 60,200 11,609,915 10,813 0.093% 179.62 2002 60,500 13,102,696 13,778 0.105% 227.74 2003 60,465 13,776,406 12,962 0.094% 214.37 2004 60,246 14,974,966 12,240 0.082% 203.17
Source: Annual Financial Statements
Last Ten Fiscal Years
City of Palo Alto - Ratio of Net Certificates of Participation ……………………………Bonded Debt to Assessed Value and Net Certificates of Participation
Bonded Debt per Capita
0.00%
0.05%
0.10%
0.15%
1995 1996 1997 1998 1999 2000 2001 2002 2003 2004
Net Bonded Debt to Assessed Valuations
$0
$50
$100
$150
$200
$250
1995 1996 1997 1998 1999 2000 2001 2002 2003 2004
Net Bonded Debt Per Capita
………………………………………………………………………… City of Palo Alto 129

Statistical
2003-2004 Assessed Valuation $14,974,966
2,246,245
Amount of debt applicable to debt limit:Certificates of participation 12,215Capital lease obligations 25Special assessment debt with governmental commitment 420
Total 12,660
Less amount of debt not applicable to debt limit 0
Total amount of debt applicable to debt limit 12,660 Legal debt margin $2,233,585
Source: Annual Financial StatementsNote (1)
(2)
June 30, 2004(in thousands of dollars )
City of Palo Alto - Computation of Legal Debt Margin ………………………
Debt limit - 15% of assessed value
not subject to legal debt margin
Special assessments debt excludes Cambridge Ave. parking ( aka: 1993 California Avenue Parking)debt because there is no government commitment ($1,465)
The above does not include debt recorded in the Enterprise Funds because such debt is
………………………………………………………………………… 130 City of Palo Alto
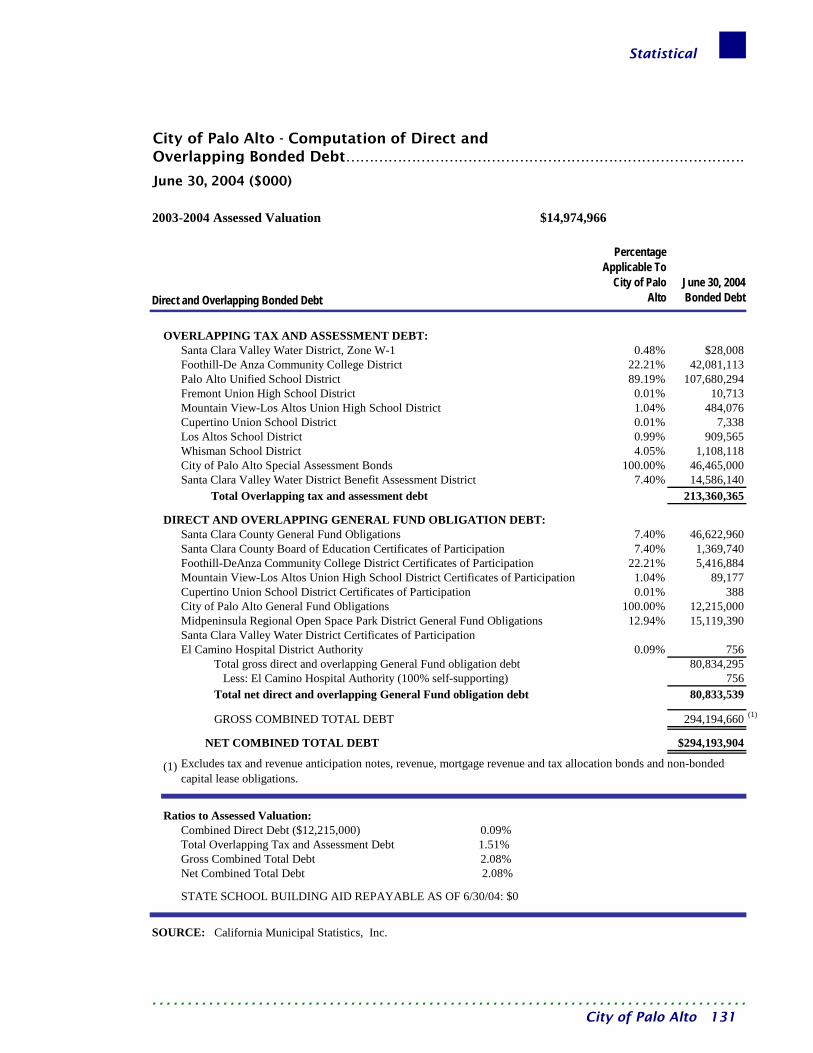
Statistical
2003-2004 Assessed Valuation $14,974,966
PercentageApplicable To
City of PaloAlto
June 30, 2004Bonded Debt
Santa Clara Valley Water District, Zone W-1 0.48% $28,008Foothill-De Anza Community College District 22.21% 42,081,113Palo Alto Unified School District 89.19% 107,680,294Fremont Union High School District 0.01% 10,713Mountain View-Los Altos Union High School District 1.04% 484,076Cupertino Union School District 0.01% 7,338Los Altos School District 0.99% 909,565Whisman School District 4.05% 1,108,118City of Palo Alto Special Assessment Bonds 100.00% 46,465,000Santa Clara Valley Water District Benefit Assessment District 7.40% 14,586,140 Total Overlapping tax and assessment debt 213,360,365
Santa Clara County General Fund Obligations 7.40% 46,622,960 Santa Clara County Board of Education Certificates of Participation 7.40% 1,369,740
Foothill-DeAnza Community College District Certificates of Participation 22.21% 5,416,8841.04% 89,177
Cupertino Union School District Certificates of Participation 0.01% 388City of Palo Alto General Fund Obligations 100.00% 12,215,000Midpeninsula Regional Open Space Park District General Fund Obligations 12.94% 15,119,390Santa Clara Valley Water District Certificates of ParticipationEl Camino Hospital District Authority 0.09% 756 Total gross direct and overlapping General Fund obligation debt 80,834,295 Less: El Camino Hospital Authority (100% self-supporting) 756 Total net direct and overlapping General Fund obligation debt 80,833,539
GROSS COMBINED TOTAL DEBT 294,194,660 (1)
NET COMBINED TOTAL DEBT $294,193,904
(1)
Combined Direct Debt ($12,215,000) 0.09%Total Overlapping Tax and Assessment Debt 1.51%Gross Combined Total Debt 2.08%Net Combined Total Debt 2.08%
STATE SCHOOL BUILDING AID REPAYABLE AS OF 6/30/04: $0
DIRECT AND OVERLAPPING GENERAL FUND OBLIGATION DEBT:
Excludes tax and revenue anticipation notes, revenue, mortgage revenue and tax allocation bonds and non-bonded capital lease obligations.
Mountain View-Los Altos Union High School District Certificates of Participation
City of Palo Alto - Computation of Direct and Overlapping Bonded Debt……………………………………………………………………………
SOURCE: California Municipal Statistics, Inc.
Ratios to Assessed Valuation:
Direct and Overlapping Bonded Debt
OVERLAPPING TAX AND ASSESSMENT DEBT:
June 30, 2004 ($000)
………………………………………………………………………… City of Palo Alto 131

Statistical
Total Fiscal General Coverage
Year Expenditures (1) Principal Interest Total Ratio
1995 $75,650 $1,245 $1,170 $2,415 3.19%1996 75,250 1,365 1,125 2,490 3.31%1997 80,402 1,355 964 2,319 2.88%1998 85,574 1,405 888 2,293 2.68%1999 103,050 1,553 956 2,509 2.43%2000 104,153 1,775 1,026 2,801 2.69%2001 115,872 1,895 922 2,817 2.43%2002 116,800 465 686 1,151 0.99%2003 134,050 875 696 1,571 1.17%2004 118,779 780 639 1,419 1.19%
Note: (1)
Source: Governmental Funds: Statement of Revenues, Expenditures, and Changes in Fund Balance
Includes general, special revenue, debt services and capital project funds
Debt Service
City of Palo Alto - Ratio of Annual Debt Service Expendituresfor General Bonded Debt to Total General Expenditures……Last Ten Fiscal Years ($000)
0%
1%
2%
3%
4%
1995 1996 1997 1998 1999 2000 2001 2002 2003 2004
Coverage Ratio
………………………………………………………………………… 132 City of Palo Alto

Statistical
Direct Net RevenueFiscal Gross Operating Available for Year Revenue Expenditures Debt Services (1) Principal Interest Total Coverage
1995 $124,537 $76,693 $47,844 $555 $997 $1,552 $30.831996 120,828 68,096 52,732 755 1,308 2,063 25.561997 133,081 77,107 55,974 801 1,263 2,064 27.121998 144,195 84,415 59,780 840 1,214 2,054 29.101999 141,696 80,748 60,948 895 1,163 2,058 29.622000 130,550 78,880 51,670 545 1,363 1,908 27.082001 197,022 133,012 64,010 555 1,342 1,897 33.742002 177,327 148,694 28,633 1,955 1,660 3,615 7.922003 166,019 116,869 49,150 1,255 2,354 3,609 13.622004 169,551 122,716 46,835 1,310 2,307 3,617 12.95
Source: Annual Financial StatementsNotes: (1) Excludes depreciation and amortization expense.
City of Palo Alto -Revenue Bond Coverage……………………………………
Debt Service
Water, Electric, Gas, Wastewater CollectionWastewater Treatment, Storm Drainage Funds and External Service Funds
Last Ten Fiscal Years ($000)
$0
$10,000
$20,000
$30,000
$40,000
$50,000
$60,000
$70,000
1995 1996 1997 1998 1999 2000 2001 2002 2003 2004
Net Revenue Available Total Debt Service
………………………………………………………………………… City of Palo Alto 133
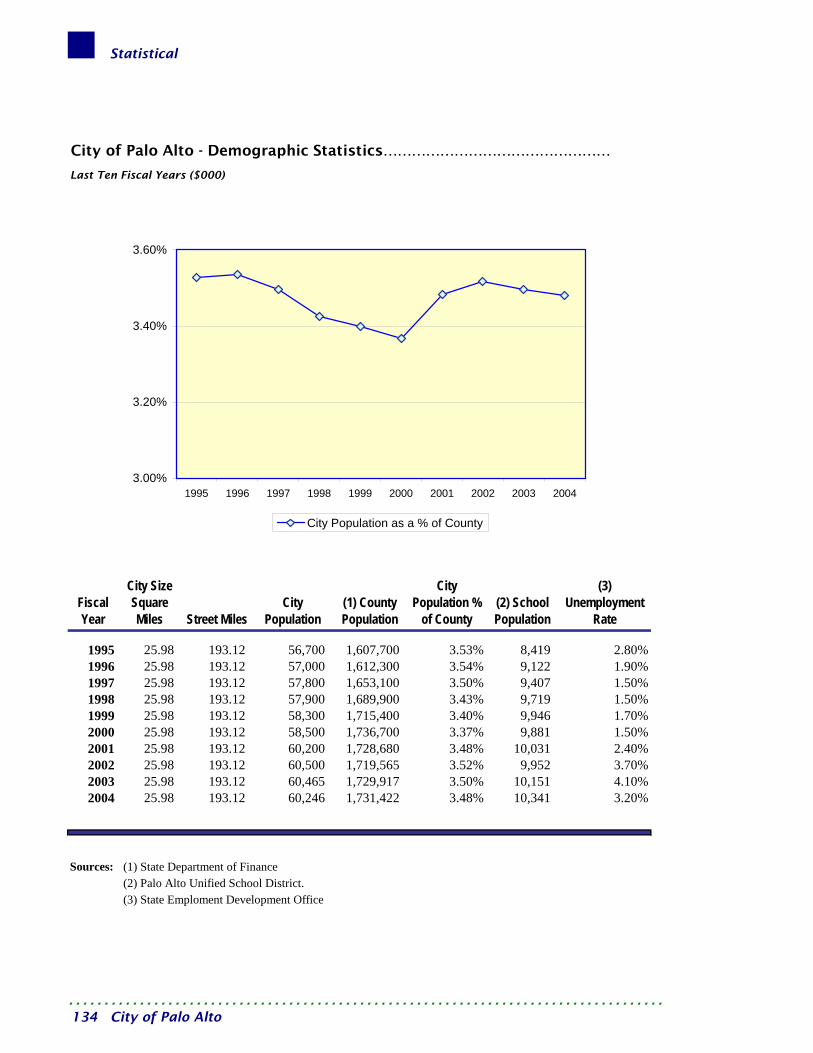
Statistical
Fiscal Year
City Size Square Miles Street Miles
City Population
(1) County Population
City Population %
of County(2) School Population
(3) Unemployment
Rate
1995 25.98 193.12 56,700 1,607,700 3.53% 8,419 2.80%1996 25.98 193.12 57,000 1,612,300 3.54% 9,122 1.90%1997 25.98 193.12 57,800 1,653,100 3.50% 9,407 1.50%1998 25.98 193.12 57,900 1,689,900 3.43% 9,719 1.50%1999 25.98 193.12 58,300 1,715,400 3.40% 9,946 1.70%2000 25.98 193.12 58,500 1,736,700 3.37% 9,881 1.50%2001 25.98 193.12 60,200 1,728,680 3.48% 10,031 2.40%2002 25.98 193.12 60,500 1,719,565 3.52% 9,952 3.70%2003 25.98 193.12 60,465 1,729,917 3.50% 10,151 4.10%2004 25.98 193.12 60,246 1,731,422 3.48% 10,341 3.20%
Sources:(2) Palo Alto Unified School District.(3) State Emploment Development Office
City of Palo Alto - Demographic Statistics…………………………………………
Last Ten Fiscal Years ($000)
(1) State Department of Finance
3.00%
3.20%
3.40%
3.60%
1995 1996 1997 1998 1999 2000 2001 2002 2003 2004
City Population as a % of County
………………………………………………………………………… 134 City of Palo Alto
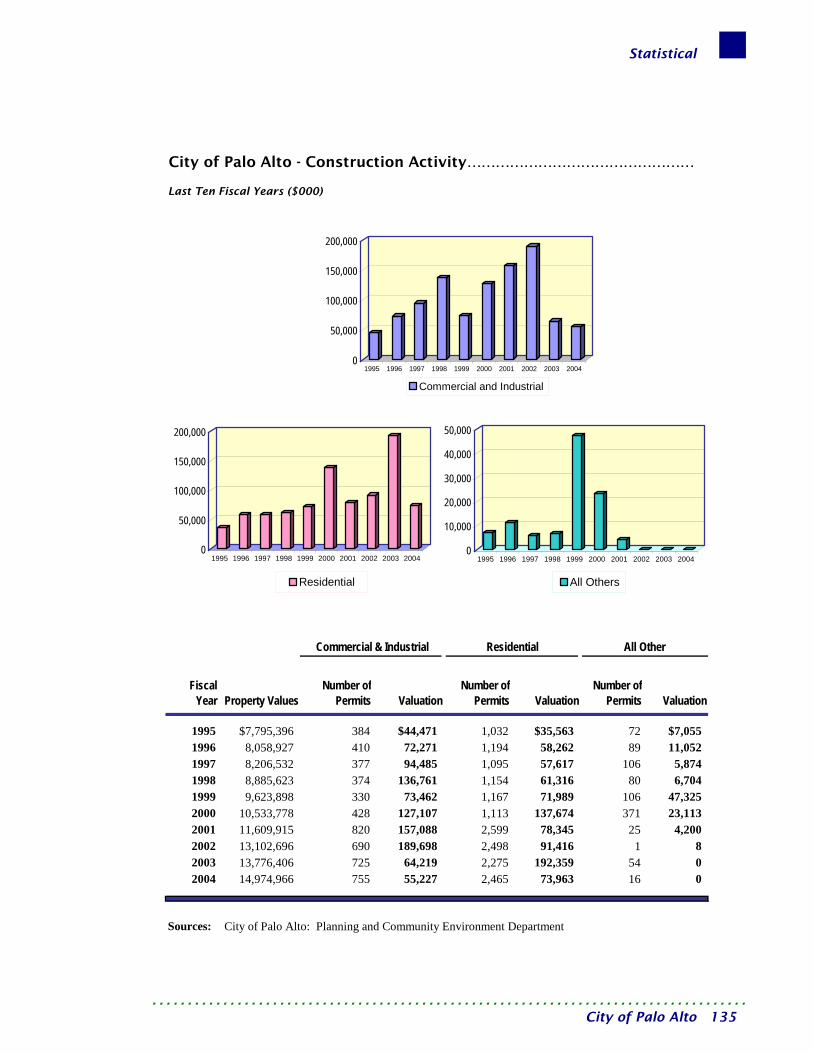
Statistical
FiscalYear Property Values
Number ofPermits Valuation
Number ofPermits Valuation
Number ofPermits Valuation
1995 $7,795,396 384 $44,471 1,032 $35,563 72 $7,0551996 8,058,927 410 72,271 1,194 58,262 89 11,0521997 8,206,532 377 94,485 1,095 57,617 106 5,8741998 8,885,623 374 136,761 1,154 61,316 80 6,7041999 9,623,898 330 73,462 1,167 71,989 106 47,3252000 10,533,778 428 127,107 1,113 137,674 371 23,1132001 11,609,915 820 157,088 2,599 78,345 25 4,2002002 13,102,696 690 189,698 2,498 91,416 1 82003 13,776,406 725 64,219 2,275 192,359 54 02004 14,974,966 755 55,227 2,465 73,963 16 0
Sources:
City of Palo Alto - Construction Activity…………………………………………
Last Ten Fiscal Years ($000)
City of Palo Alto: Planning and Community Environment Department
Commercial & Industrial Residential All Other
0
50,000
100,000
150,000
200,000
1995 1996 1997 1998 1999 2000 2001 2002 2003 2004
Commercial and Industrial
0
50,000
100,000
150,000
200,000
1995 1996 1997 1998 1999 2000 2001 2002 2003 2004
Residential
0
10,000
20,000
30,000
40,000
50,000
1995 1996 1997 1998 1999 2000 2001 2002 2003 2004
All Others
………………………………………………………………………… City of Palo Alto 135
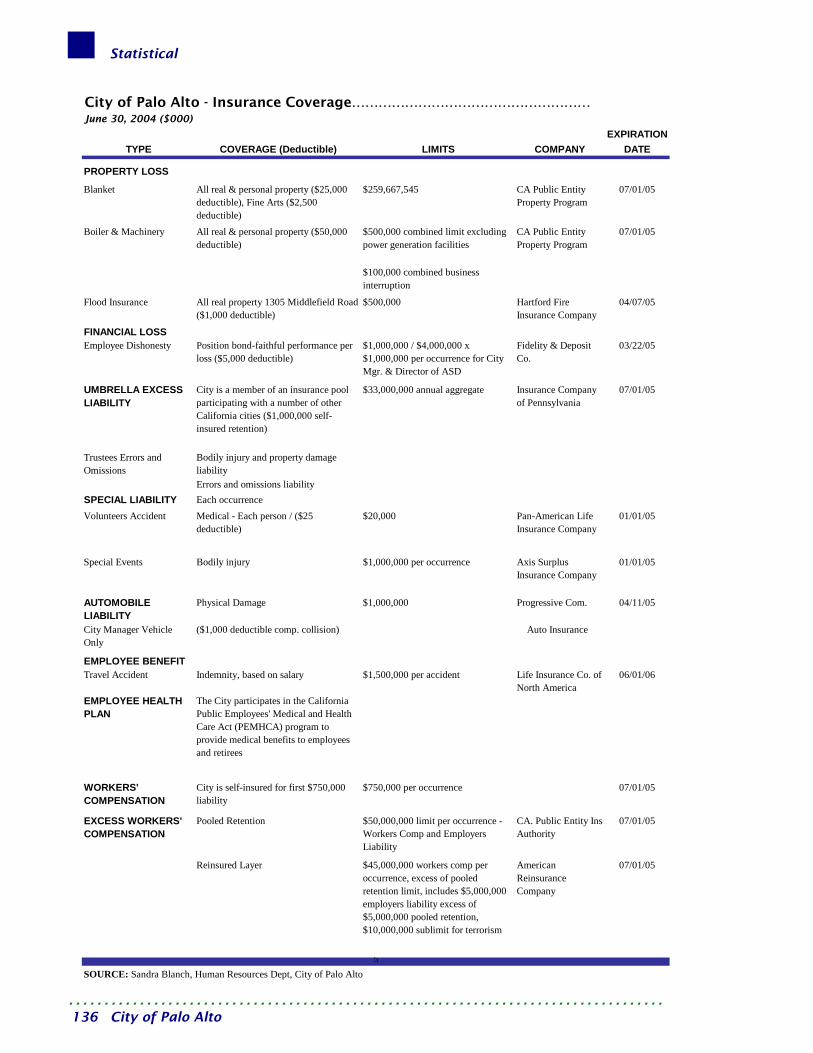
Statistical
………………………………………………………………………… 136 City of Palo Alto
EXPIRATIONTYPE COVERAGE (Deductible) LIMITS COMPANY DATE
PROPERTY LOSS
Blanket All real & personal property ($25,000 deductible), Fine Arts ($2,500 deductible)
$259,667,545 CA Public Entity Property Program
07/01/05
Boiler & Machinery All real & personal property ($50,000 deductible)
$500,000 combined limit excluding power generation facilities
CA Public Entity Property Program
07/01/05
$100,000 combined business interruption
Flood Insurance All real property 1305 Middlefield Road ($1,000 deductible)
$500,000 Hartford Fire Insurance Company
04/07/05
FINANCIAL LOSSEmployee Dishonesty Position bond-faithful performance per
loss ($5,000 deductible)$1,000,000 / $4,000,000 x $1,000,000 per occurrence for City Mgr. & Director of ASD
Fidelity & Deposit Co.
03/22/05
UMBRELLA EXCESS LIABILITY
City is a member of an insurance pool participating with a number of other California cities ($1,000,000 self-insured retention)
$33,000,000 annual aggregate Insurance Company of Pennsylvania
07/01/05
Trustees Errors and Omissions
Bodily injury and property damage liabilityErrors and omissions liability
SPECIAL LIABILITY Each occurrenceVolunteers Accident Medical - Each person / ($25
deductible)$20,000 Pan-American Life
Insurance Company01/01/05
Special Events Bodily injury $1,000,000 per occurrence Axis Surplus Insurance Company
01/01/05
AUTOMOBILE LIABILITY
Physical Damage $1,000,000 Progressive Com. 04/11/05
City Manager Vehicle Only
($1,000 deductible comp. collision) Auto Insurance
EMPLOYEE BENEFITTravel Accident Indemnity, based on salary $1,500,000 per accident Life Insurance Co. of
North America06/01/06
EMPLOYEE HEALTH PLAN
The City participates in the California Public Employees' Medical and Health Care Act (PEMHCA) program to provide medical benefits to employees and retirees
WORKERS' COMPENSATION
City is self-insured for first $750,000 liability
$750,000 per occurrence 07/01/05
EXCESS WORKERS' COMPENSATION
Pooled Retention $50,000,000 limit per occurrence -Workers Comp and Employers Liability
CA. Public Entity Ins Authority
07/01/05
Reinsured Layer $45,000,000 workers comp per occurrence, excess of pooled retention limit, includes $5,000,000 employers liability excess of $5,000,000 pooled retention, $10,000,000 sublimit for terrorism
American Reinsurance Company
07/01/05
5
City of Palo Alto - Insurance Coverage………………………………………………June 30, 2004 ($000)
SOURCE: Sandra Blanch, Human Resources Dept, City of Palo Alto
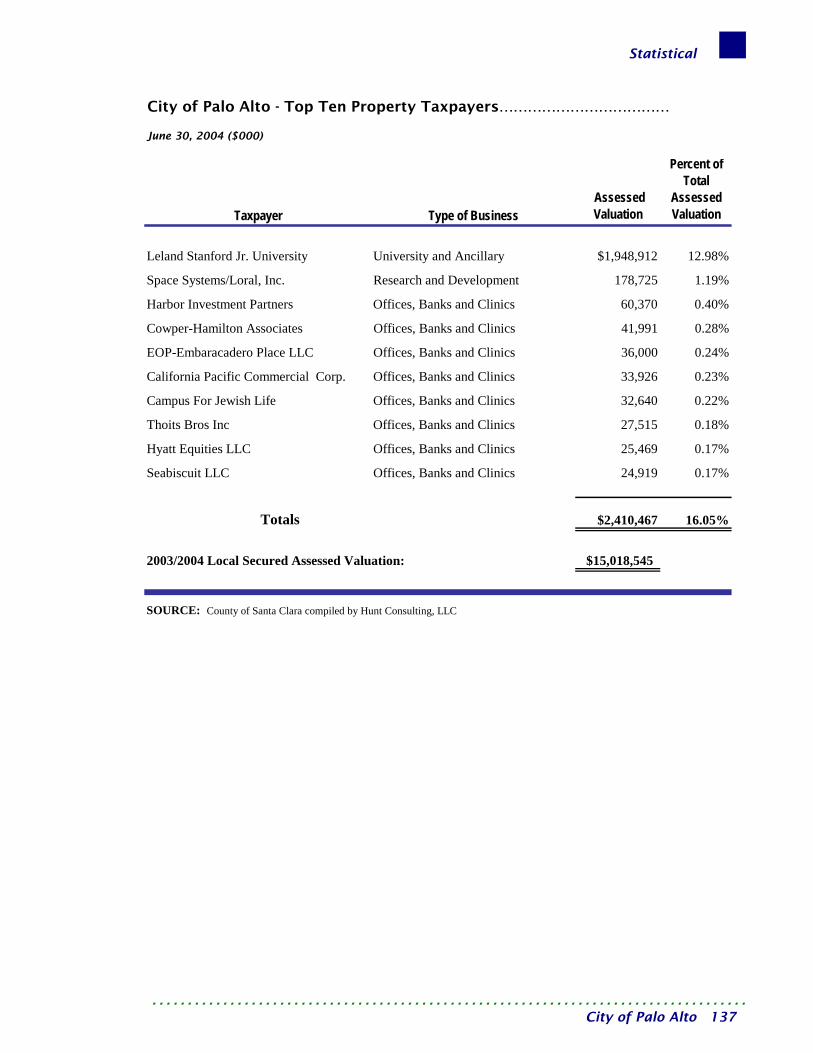
Statistical
Taxpayer Type of Business Assessed Valuation
Percent of Total
Assessed Valuation
Leland Stanford Jr. University University and Ancillary $1,948,912 12.98%
Space Systems/Loral, Inc. Research and Development 178,725 1.19%
Harbor Investment Partners Offices, Banks and Clinics 60,370 0.40%
Cowper-Hamilton Associates Offices, Banks and Clinics 41,991 0.28%
EOP-Embaracadero Place LLC Offices, Banks and Clinics 36,000 0.24%
California Pacific Commercial Corp. Offices, Banks and Clinics 33,926 0.23%
Campus For Jewish Life Offices, Banks and Clinics 32,640 0.22%
Thoits Bros Inc Offices, Banks and Clinics 27,515 0.18%
Hyatt Equities LLC Offices, Banks and Clinics 25,469 0.17%
Seabiscuit LLC Offices, Banks and Clinics 24,919 0.17%
Totals $2,410,467 16.05%
2003/2004 Local Secured Assessed Valuation: $15,018,545
SOURCE: County of Santa Clara compiled by Hunt Consulting, LLC
City of Palo Alto - Top Ten Property Taxpayers………………………………
June 30, 2004 ($000)
………………………………………………………………………… City of Palo Alto 137
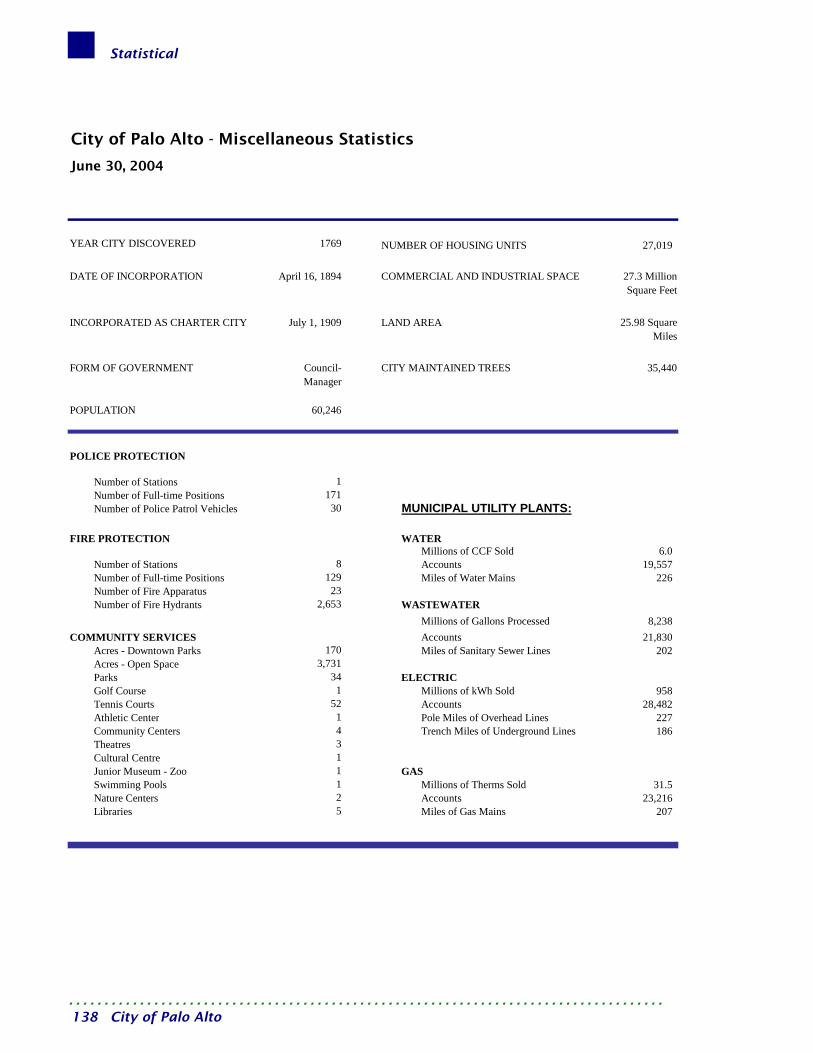
Statistical
1769 NUMBER OF HOUSING UNITS 27,019
April 16, 1894 27.3 Million Square Feet
July 1, 1909 25.98 Square Miles
Council-Manager
35,440
60,246
Number of Stations 1 Number of Full-time Positions 171 Number of Police Patrol Vehicles 30
Millions of CCF Sold 6.0 Number of Stations 8 Accounts 19,557 Number of Full-time Positions 129 Miles of Water Mains 226 Number of Fire Apparatus 23 Number of Fire Hydrants 2,653
Millions of Gallons Processed 8,238 Accounts 21,830
Acres - Downtown Parks 170 Miles of Sanitary Sewer Lines 202 Acres - Open Space 3,731 Parks 34 Golf Course 1 Millions of kWh Sold 958 Tennis Courts 52 Accounts 28,482 Athletic Center 1 Pole Miles of Overhead Lines 227 Community Centers 4 Trench Miles of Underground Lines 186 Theatres 3 Cultural Centre 1 Junior Museum - Zoo 1 Swimming Pools 1 Millions of Therms Sold 31.5 Nature Centers 2 Accounts 23,216 Libraries 5 Miles of Gas Mains 207
City of Palo Alto - Miscellaneous Statistics
June 30, 2004
COMMERCIAL AND INDUSTRIAL SPACE
POLICE PROTECTION
FIRE PROTECTION
COMMUNITY SERVICES
DATE OF INCORPORATION
YEAR CITY DISCOVERED
CITY MAINTAINED TREES
LAND AREAINCORPORATED AS CHARTER CITY
FORM OF GOVERNMENT
MUNICIPAL UTILITY PLANTS:
POPULATION
GAS
ELECTRIC
WASTEWATER
WATER
………………………………………………………………………… 138 City of Palo Alto

Single Audit

This page is intentionally left blank.
Single Audit-Index
Single Audit Index……………………………… Summary of Findings and Questioned Costs .................................................................... 143 Schedule of Expenditures of Federal Awards .................................................................... 145 Notes to Schedule of Expenditures of Federal Awards...................................................... 147 Report on Compliance and on Internal Control Over Financial Reporting Based on an Audit of Financial Statements Performed in Accordance With Government Auditing Standards ............................................................................. 149 Report on Compliance and Internal Control Over Compliance Applicable to Each Major Federal Award Program...................................................................................................... 150
……….……………………………………………………………………………………………. City of Palo Alto 139

Single Audit-Index
………………………………………………………………………………………………… 140 City of Palo Alto
This page is intentionally left blank.

Single Audit
Single Audit Section……………….………….
This section provides an overview of grant awards received from the Federal government. The Single Audit Act Amendments of 1996 require local governments to report and audit Federal funds separately from their Basic Financial Statements.
……………………………………………………………………………………………………………………………………………………. City of Palo Alto 141

Single Audit
……………………………………………………………………………..…………………………… 142 City of Palo Alto
This page is intentionally left blank.
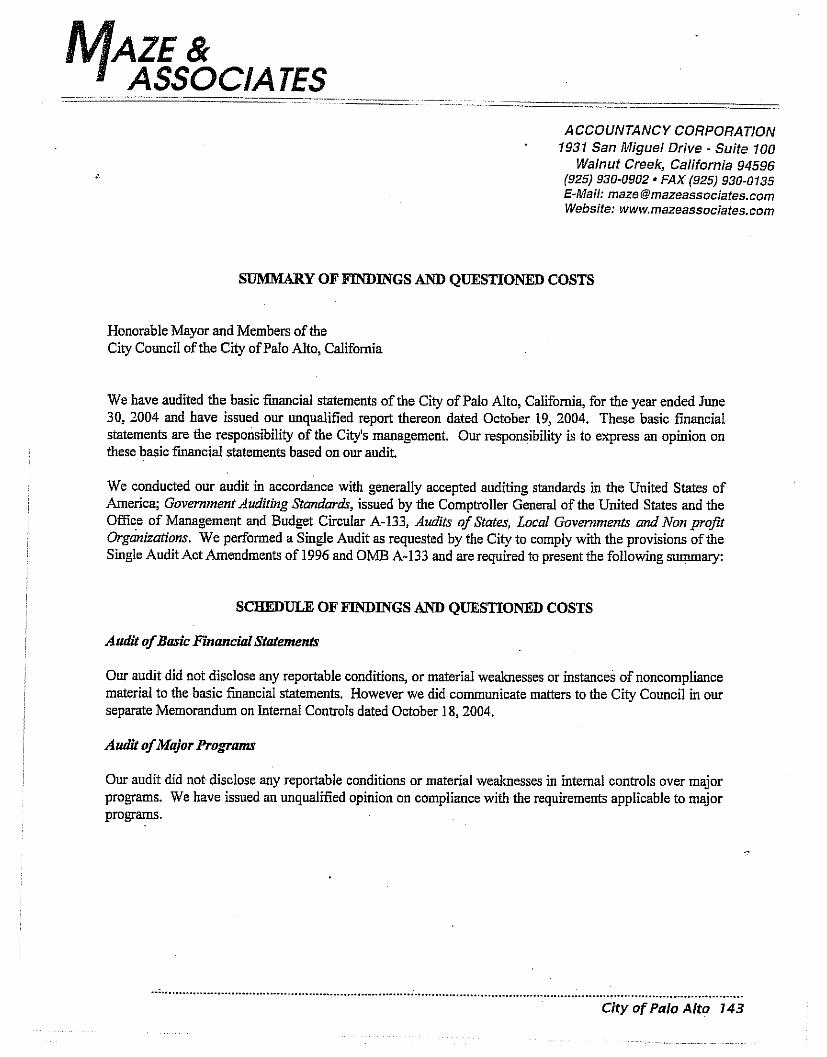

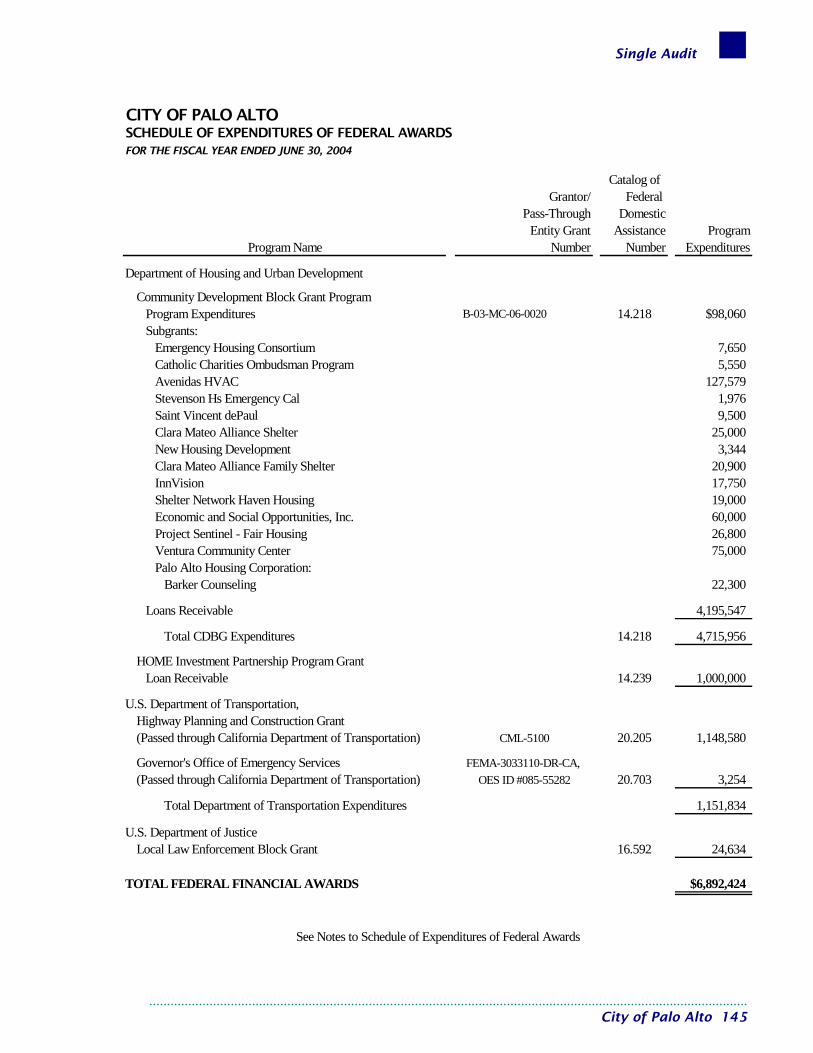
Single Audit
……………………………………………………………………………………………………………………………………………………. City of Palo Alto 145
CITY OF PALO ALTOSCHEDULE OF EXPENDITURES OF FEDERAL AWARDSFOR THE FISCAL YEAR ENDED JUNE 30, 2004
Catalog ofGrantor/ Federal
Pass-Through DomesticEntity Grant Assistance Program
Program Name Number Number Expenditures
Department of Housing and Urban Development
Community Development Block Grant ProgramProgram Expenditures B-03-MC-06-0020 14.218 $98,060Subgrants:
Emergency Housing Consortium 7,650Catholic Charities Ombudsman Program 5,550Avenidas HVAC 127,579Stevenson Hs Emergency Cal 1,976Saint Vincent dePaul 9,500Clara Mateo Alliance Shelter 25,000New Housing Development 3,344Clara Mateo Alliance Family Shelter 20,900InnVision 17,750
Shelter Network Haven Housing 19,000Economic and Social Opportunities, Inc. 60,000Project Sentinel - Fair Housing 26,800Ventura Community Center 75,000Palo Alto Housing Corporation:
Barker Counseling 22,300
Loans Receivable 4,195,547
Total CDBG Expenditures 14.218 4,715,956
HOME Investment Partnership Program GrantLoan Receivable 14.239 1,000,000
U.S. Department of Transportation,Highway Planning and Construction Grant(Passed through California Department of Transportation) CML-5100 20.205 1,148,580
Governor's Office of Emergency Services FEMA-3033110-DR-CA, (Passed through California Department of Transportation) OES ID #085-55282 20.703 3,254
Total Department of Transportation Expenditures 1,151,834
U.S. Department of JusticeLocal Law Enforcement Block Grant 16.592 24,634
TOTAL FEDERAL FINANCIAL AWARDS $6,892,424
See Notes to Schedule of Expenditures of Federal Awards

Single Audit
This page is intentionally left blank.
……………………………………………………………………………..…………………………… 146 City of Palo Alto
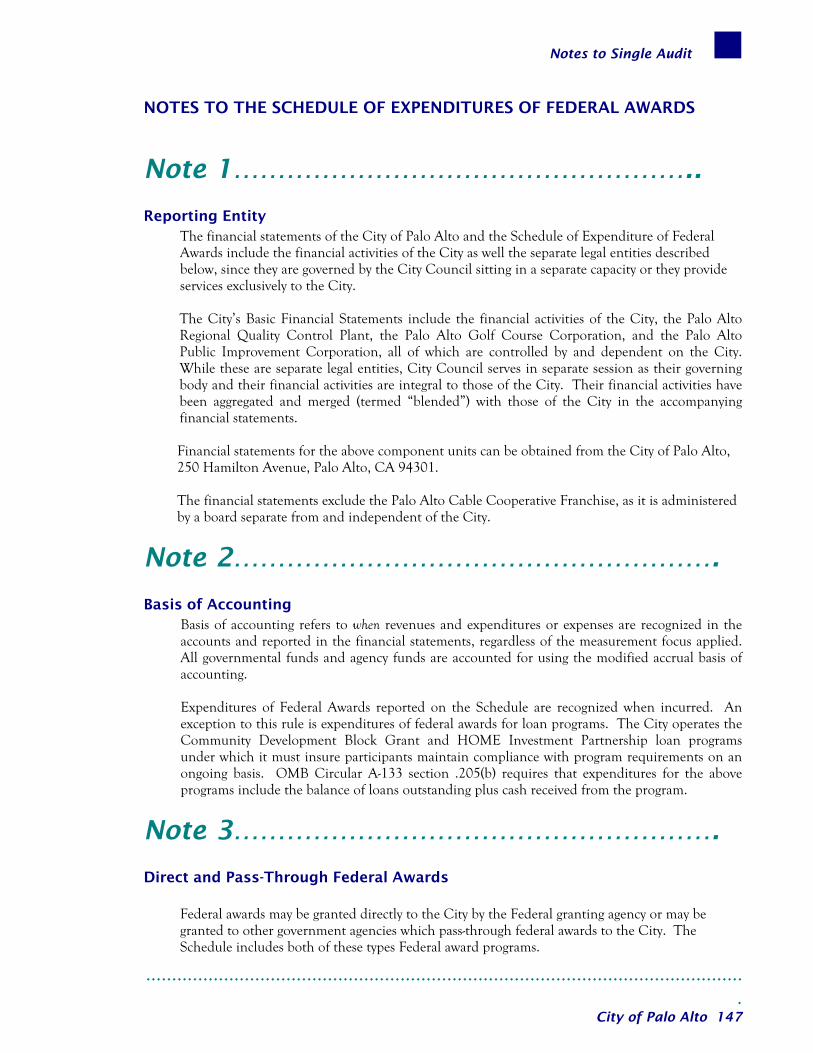
Notes to Single Audit
……….…………………………………………………………………………………………….
NOTES TO THE SCHEDULE OF EXPENDITURES OF FEDERAL AWARDS
Note 1……………………………………………..
Reporting EntityThe financial statements of the City of Palo Alto and the Schedule of Expenditure of Federal Awards include the financial activities of the City as well the separate legal entities described below, since they are governed by the City Council sitting in a separate capacity or they provide services exclusively to the City.
The City’s Basic Financial Statements include the financial activities of the City, the Palo Alto Regional Quality Control Plant, the Palo Alto Golf Course Corporation, and the Palo Alto Public Improvement Corporation, all of which are controlled by and dependent on the City. While these are separate legal entities, City Council serves in separate session as their governing body and their financial activities are integral to those of the City. Their financial activities have been aggregated and merged (termed “blended”) with those of the City in the accompanying financial statements.
Financial statements for the above component units can be obtained from the City of Palo Alto, 250 Hamilton Avenue, Palo Alto, CA 94301.
The financial statements exclude the Palo Alto Cable Cooperative Franchise, as it is administered by a board separate from and independent of the City.
Note 2……………………………………………….
Basis of Accounting Basis of accounting refers to when revenues and expenditures or expenses are recognized in the
accounts and reported in the financial statements, regardless of the measurement focus applied. All governmental funds and agency funds are accounted for using the modified accrual basis of accounting.
Expenditures of Federal Awards reported on the Schedule are recognized when incurred. An
exception to this rule is expenditures of federal awards for loan programs. The City operates the Community Development Block Grant and HOME Investment Partnership loan programs under which it must insure participants maintain compliance with program requirements on an ongoing basis. OMB Circular A-133 section .205(b) requires that expenditures for the above programs include the balance of loans outstanding plus cash received from the program.
Note 3……………………………………………….
Direct and Pass-Through Federal Awards
Federal awards may be granted directly to the City by the Federal granting agency or may be granted to other government agencies which pass-through federal awards to the City. The Schedule includes both of these types Federal award programs.
City of Palo Alto 147
Single Audit
This page is intentionally left blank.
……………………………………………………….………………………………………………… 148 City of Palo Alto
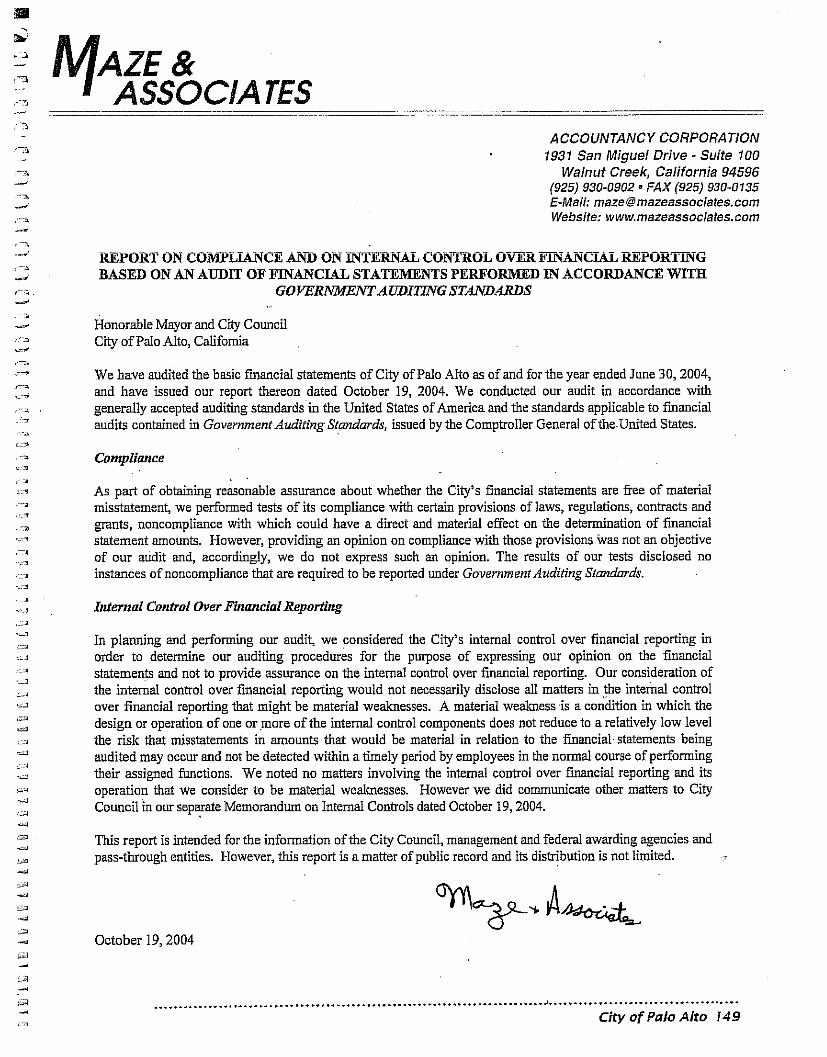
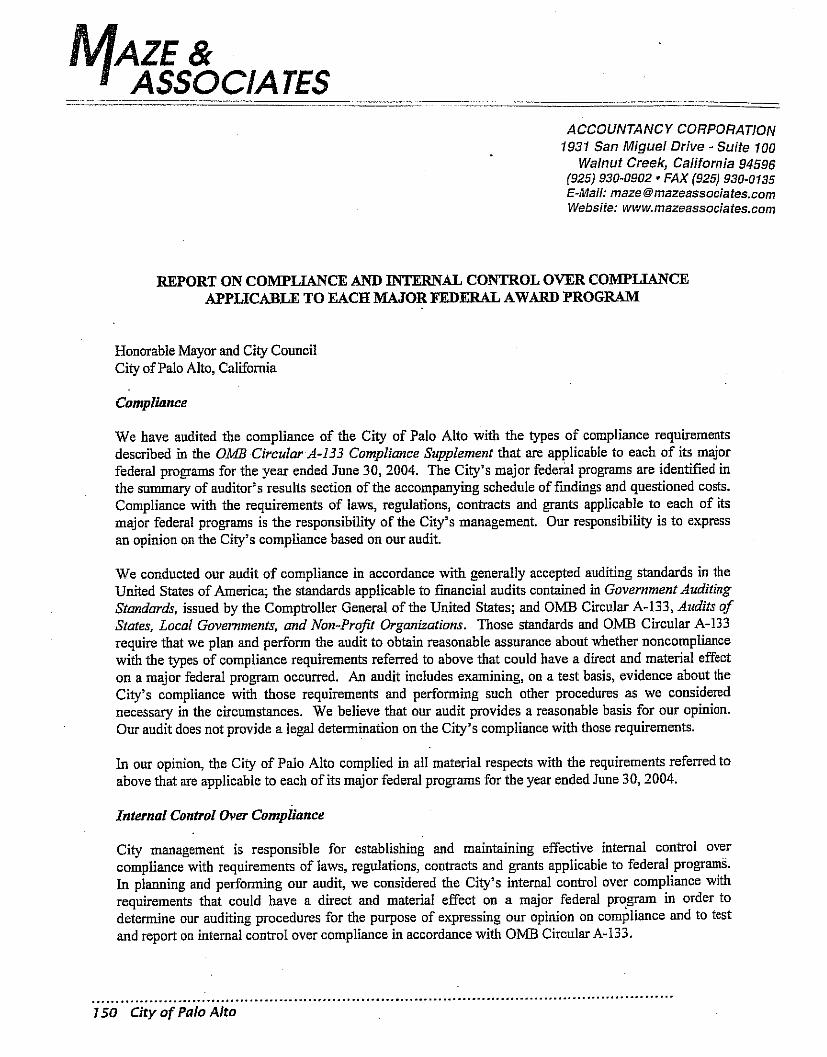


Single Audit
This page is intentionally left blank.
……………………………………………………….………………………………………………… 152 City of Palo Alto
…………………………………………………………………………………
The City of Palo Alto is located in northern Santa Clara County, approximately
35 miles south of the City of San Francisco and 12 miles north of the
City of San Jose. Spanish explorers named the area for the tall, twin-trunked
redwood tree they camped beneath in 1769. Palo Alto incorporated in 1894
and the State of California granted its first charter in 1909.
…………………………………………………………………………………
AMERICANS WITH DISABILITIES ACT STATEMENT In compliance with Americans with Disabilities Act (ADA) of 1990,
this document may be provided in other accessible formats.
For information contact: Fred Herman
City of Palo Alto 250 Hamilton Avenue
(650) 329-2550 (650) 328-1199 (TDD)
……….…………………………………………………………………………………………….
City of Palo Alto 153

This page is intentionally left blank.
……………………………………………………….………………………………………………… 154 City of Palo Alto