2003 survey of planned giving vehicles - blogspot.com · 2003 survey of planned giving vehicles...
TRANSCRIPT
2003 Survey of Planned Giving Vehicles
Released: June, 2003
Researched by:
John J. Havens, Paul G. Schervish, and Mary A. O’Herlihy
Social Welfare Research Institute
Boston College
The authors thank Paul Clolery, Editor-in-Chief of the Non-Profit Times forinitiating and coordinating the various phases of this project. They also express theirgratitude to John C. MacRae, Martha Leonard Delay, and Joan Reilly of the BostonCollege Development Office for their assistance with definitions and practicesregarding vehicles of planned giving; and to David Nnyanzi of the Social WelfareResearch Institute for his support with data management. George RuotoloAssociates, Cresskill, N.J., Semple-Bixel Associates, Nutley, N.J., and softwareprovider Metafile, Rochester, MN provided additional financial support for fieldwork in this project.
The Social Welfare Research Institute is generously supported by the T.B. MurphyFoundation Charitable Trust and the Lilly Endowment, Inc.

2003 Survey of Planned Giving Vehicles
Release Date: June, 2003
Prepared for:NonProfit Times
http://www.nptimes.com
Prepared by:Social Welfare Research Institute
Boston College, McGuinn Hall, 140 Commonwealth Ave.Chestnut Hill, MA 02467
http://www.bc.edu/swritelephone: 617-552-4070

TABLE OF CONTENTS
BACKGROUND AND PURPOSE........................................................................4INTRODUCTION....................................................................................................51 SUMMARY OF FINDINGS ...............................................................................7
1.1 Financial Resources and Planned Giving………………………….…………..71.2 Demographic Characteristics…………………………………………………..91.3 Charitable Giving……..………………………………………………………..91.4 Current Giving, Planned Giving, and Wealth…………………………..…….111.5 Professional Advisors………………………………………………………...12
2 METHODOLOGY ............................................................................................133 DETAILED FINDINGS ....................................................................................16
3.1 Prevalence of the Usage of Individual Planned Giving Vehicles….…………16Table 1: Prevalence of Use for Nine Vehicles of Planned Giving….……………193.2 Prevalence for Multiple Vehicles…….………………………………………20Table 2: Percent of Households Using Planned Giving Vehicles………………..22Table 3: Percent of Households Using or Considering Vehicles of PlannedGiving……………………………………………………………………………..263.3 Prevalence and Financial Resources……………………………………….…28Table 4: General Prevalence of the Use of Planned Giving Vehicles byHousehold Income and Household Net Worth………………………………..…..293.4 Prevalence and Demographic Characteristics………………………………..30Table 5: General Prevalence of the Use of Planned Giving Vehicles……………313.5 Charitable Giving and Planned Giving…………………………………….…33Table 6: General Prevalence of the Use of Planned Giving Vehiclesby Inter-Vivos Giving and Financial Security………………………………….…343.6 Planned Giving and Professional Advice……………………….……………35
4 DISCUSSION OF FINDINGS .........................................................................364.1 Implications…………………………………………………….…………….37

Background and Purpose 4
Background and Purpose
This report is based on data obtained in a national telephone survey of 1,010
respondents age 18 and older conducted by the Caravan Division of Opinion
Research Corporation International (ORCI) of Princeton, New Jersey from March 13
through March 16, 2003. The survey was conducted for the NonProfit Times
Publishing Group using a module of questions developed at the Social Welfare
Research Institute at Boston College. The analysis in this report was restricted to the
873 respondents who were (1) heads of household and (2) either aged 30 or older or
were high school graduates.
The main questions in the module asked if the respondents or their spouses had used
each of ten vehicles of planned giving, and if they had not, whether they were
considering a particular vehicle, or if asked, whether they would consider using each
of the vehicles. Other questions were asked about their charitable giving in the
calendar year 2002, their current net worth, how financially secure they perceived
themselves to be, and whether or not they had consulted with professional advisors
about their long-term plans for charitable giving. In addition to the questions in the
planned giving module, the survey obtained selected demographic information about
the respondent and the respondent’s household.

Introduction 5
Introduction
In recent years several trends have heightened interest in a variety of vehicles of
planned giving. These trends include growth in personal inter-vivos giving, growth
in the amount of charitable bequests, growth in high income and high net-worth
households, increased interest among the population in financial and estate planning,
and the increased range of options for giving, as well as more frequent appeals to
participate in planned giving by financial and development professionals. The
appeal of planned giving generally has grown as a result of the emergence of a
broader, more inclusive concept of planned giving as a form of giving in which
biographical and family purposes are integrated with financial purposes. In this
broad view, a planned gift is any charitable contribution around which conscientious
decision-making about the allocation of material resources is connected to similarly
conscientious decision-making about the content, timing, and personal and family
impact of the donor’s charitable aspirations. In this research report, we define
planned giving both as in its conventionally narrow meaning, as including any type
of deferred gift made in light of the donor’s death, as well as the giving of real and
appreciated assets directly to a charity or to a vehicle of charitable giving while the
donor is alive, such as a foundation or donor advised fund, since such contributions
also require the self-reflective translation of fixed assets (other than cash) into
charitable gifts.
Although there is a great deal of interest in various vehicles of planned giving, there
has been to date no baseline information available concerning the prevalence of
usage in the population at large of planned giving vehicles, narrowly or broadly
defined. To remedy this gap, the NonProfit Times engaged the Boston College

Introduction 6
Social Welfare Research Institute to design and analyze a national survey of
households. Paid for by the NonProfit Times, and conducted in mid-March 2003 by
the Opinion Research Corporation, this national telephone survey interviewed 1,010
participants concerning their use of each of nine planned giving vehicles.1 These
nine vehicles, which constituted our working definition of planned giving, were (1)
including a bequest to charity in a will, (2) designating a charity as a beneficiary of a
life insurance policy or retirement plan, such as an IRA, (3) establishing a charitable
gift annuity with a charitable organization that provides lifetime income to the donor
or spouse, (4) creating a charitable trust (including charitable remainder trust,
charitable lead trust, and other fiduciary trust providing a charitable contribution), (5)
establishing a private or family foundation, (6) establishing a charitable gift fund or a
charitable gift account at a financial institution, (7) creating a charitable fund at a
community foundation or nonprofit organization, such as a donor advised fund,
designated fund, unrestricted fund, or supporting organization, (8) donating assets
(such as stock, real estate, art or a business interest) or selling such assets in a
bargain sale to a charitable organization,2 and (9) establishing a retained-life-estate
agreement with a charitable organization.
Participants in the survey were asked whether they or their spouse had ever used one
of these vehicles for giving to charity. Those who said they had not used a particular
vehicle were then asked if they or their spouse were considering using it.
1 The survey asked about the use of ten vehicles of planned giving. Preliminary analysis of the resultsindicated that respondents appear to have confused pooled income funds connected to a charitableorganization with commercial mutual funds. The pooled income fund category was thus droppedfrom the analysis, and estimates of prevalence of planned giving are therefore somewhat conservative(i.e., too low).2 The question about donated assets was designed to capture donations of assets such as stocks, bonds,art, real estate, and vehicles. However, findings, especially among lower income and lower wealthhouseholds, may also include giving of in-kind assets such as clothing or food.

1 Summary of Findings 7
1 Summary of Findings
The survey results portray the widespread knowledge and prevalence of planned
giving vehicles among the general population. Over half the adult population (57%)
reports either using at least one of the nine vehicles (31%) or, if not utilizing any of
them at the time of the survey, reports considering at least one of them for future use
(26%). Moreover, households that use or are thinking about employing one planned
giving vehicle are more likely than not also using or considering the use of other
planned giving vehicles. Another significant finding of the survey is the fact that
95% of the population reports being familiar with at least one of the specific
vehicles, indicating knowledge of planned giving options is quite pervasive.
1.1 Financial Resources and Planned Giving
The greater the economic wherewithal of a household, the more likely it is to
participate in planned giving--the prevalence of use of the nine planned giving
vehicles is greatest among households with very large financial resources. Thirty-six
percent of households with at least $1 million dollars in net worth or at least
$100,000 in income report using at least one of the nine vehicles for giving. But
usage remains strong at all levels of income and wealth. Twenty-seven percent of
households with less than $30,000 in net worth and less than $20,000 in income
report using at least one of the planned giving vehicles.

1 Summary of Findings 8
Figure 1:
Percent of Households Using At Least One of the Nine Planned Giving Vehicles
27%
36%
0%
5%
10%
15%
20%
25%
30%
35%
40%
Households with $1 million net worthor $100,000 income
Households with < $30,000 net worthand < $20,000 income
Perc
ent
The survey data indicate that households that are using a planned giving vehicles to
carry out charitable giving have a higher average wealth ($376,806 vs. $213,967)
and a somewhat higher average income ($59,772 vs. $53,140), compared with
households that are not currently engaged in planned giving via these vehicles.
Figure 2:
Planned Giving versus Non-Planned Giving Households by Income and Wealth
$376,806
$213,967
$53,140$59,772
$-
$50,000
$100,000
$150,000
$200,000
$250,000
$300,000
$350,000
$400,000
Households using planned giving vehiclesfor charitable giving
Households not using planned givingvehicles for charitable giving
Dol
lars Average Wealth
Average Income

1 Summary of Findings 9
1.2 Demographic Characteristics
In addition to being strongly related to the level of economic resources, the use of
planned giving vehicles is strongly related to particular demographic characteristics.
Planned giving is more prevalent among households headed by individuals who are
married or widowed, older, college educated, retired, or white-collar professionals.
Although planned giving is more common among these groups, a relatively large
fraction of all demographic groups is composed of planned givers. Regardless of
marital status, age, education, race, employment status, and occupation, the
demographic characteristic most strongly related to the use of planned giving is
simply the presence of an adult head of household.
1.3 Charitable Giving
The use of planned giving vehicles is higher among households that made a
contribution to charity in the past year. Households that engage in annual giving are
twice as likely to have availed of planned giving vehicles (32%), than are households
that did not report charitable gifts in calendar year 2002 (15%). In addition, among
those who make annual contributions, the amount contributed is greater for those
who participate in planned giving than for those who do not.

1 Summary of Findings 10
Figure 3:
Donors and Non-Donors: Percent of Households Using Planned Giving Vehicles
32%
15%
0%
5%
10%
15%
20%
25%
30%
35%
Households Giving to Charityin 2002
Households Not Giving toCharity in 2002
Perc
ent
From a different viewpoint, households that were using planned giving vehicles at
the time of the survey, reported a higher rate of participation in charitable giving in
2002 (92.6% vs. 82.7%), as well higher average contributions to charity in 2002
($3,325 vs. $2,762),3 than did those households that were not engaged in any
methods of planned giving.
3 The charitable contribution figures exclude one respondent with high 2001 income, low net worth,and no use of vehicles of planned giving but who reported donating $1,000,000 to charity last year. Ifthis person were included the charitable giving figures would be $3,325 for households using avehicle of planned giving vs. $4,641 for households not using any vehicle of planned giving.

1 Summary of Findings 11
Figure 4: Figure 5:
Planned Giving versus Non-Planned Giving Households:
Percent of Households Participating in Charitable
Giving - 2002
82.7%
92.6%
76%78%80%82%84%86%88%90%92%94%
HouseholdsUsing
PlannedGiving
Vehicles
HouseholdsNot UsingPlannedGiving
Vehicles
Perc
ent
Planned Giving versus Non-Planned Giving Households:
Average Annual Contributions to Charity
$2,762
$3,325
$-
$500
$1,000
$1,500
$2,000
$2,500
$3,000
$3,500
HouseholdsUsing Planned
GivingVehicles
HouseholdsNot Using
Planned GivingVehicles
Dol
lars
1.4 Current Giving, Planned Giving, and Wealth
Those who participate in planned giving contribute a larger proportion of their
income to charity on an annual basis, than do those who do not. However, planned
givers contribute a smaller portion of their wealth to charity on an annual basis, than
do those not utilizing planned giving vehicles. Although the current survey did not
obtain information about the amount of charitable donations made through the
various vehicles of planned giving, this finding on the relationship between wealth,
annual giving, and planned giving is consistent with the proposition that planned
giving tends to come from wealth, while annual giving tends to come from income,

1 Summary of Findings 12
especially for the bottom 93% of the economic spectrum (those worth less than $1
million in wealth).
1.5 Professional Advisors
The impact of professional advisors on either annual or planned charitable giving has
not been systematically studied here, but the survey findings do offer a suggestive
insight on the matter. Overall, only one in ten households has sought professional
advice concerning their charitable giving (10%); and even though those who
participate in planned giving are more likely to have used professional advice,
nonetheless, a mere one in five planned givers has consulted a professional about
their long-term giving plan (20%).
Figure 6: Figure 7:
Charitable Households Seeking Professional
Advice
90%
10% HouseholdsSeekingProfessionalAdviceHouseholdsNot SeekingProfessionalAdvice
Planned Giving Households Seeking Professional Advice
20%
80%
HouseholdsSeekingProfessionalAdviceHouseholds NotSeekingProfessionalAdvice

2 Methodology 13
2 Methodology
This report is based on data obtained in a national telephone survey of 1,010 respondents
age 18 and older conducted by the Caravan Division of Opinion Research Corporation
International (ORCI) of Princeton, New Jersey from March 13 through March 16, 2003.
The survey was conducted for the NonProfit Times Publishing Group using a module of
questions developed at the Social Welfare Research Institute at Boston College.
The main questions in the module asked if the respondents or their spouses had used each
of ten vehicles of planned giving, and if they had not, whether they were considering a
particular vehicle, or if asked, whether they would consider using each of the vehicles.
Other questions were asked about their charitable giving in the calendar year 2002, their
current net worth, how financially secure they perceived themselves to be, and whether or
not they had consulted with professional advisors about their long-term plans for
charitable giving. In addition to the questions in the planned giving module, the survey
obtained selected demographic information about the respondent and the respondent’s
household.
ORCI cleaned the survey data and formatted them for transmittal and analysis at the
Social Welfare Research Institute. In addition, ORCI calculated a response weight4 based
on the national population distribution by age, gender, race, and region. The findings in
this report are based on survey data weighted by the ORCI response weight. It should be
noted that the weight does not adjust for variations between the sample and the
population due to income or wealth. The weighted sample distributions differ from
population distributions5 by both income and wealth. With respect to income, the
4 When the data are weighted by the response weight the resulting proportions match those in the nationalpopulation on the characteristics used to calculate the response weight (i.e., age, gender, race, and region).5 The population distributions were taken from the 2001 Survey of Consumer Finances sponsored by theBoard of Governors of the Federal Reserve. The data were not adjusted for inflation or growth in personalwealth from 2001 to 2003.

2 Methodology 14
weighted survey distribution has too small a proportion of households with incomes
below $25,000 (20% for the weighted survey but 32% for the population), and too high a
proportion of households with incomes of $75,000 or more (29% for the weighted survey
but 23% for the population). With respect to wealth, the differences are reversed: the
weighted distribution has too large a proportion of households with wealth below
$60,000 (49% for the weighted survey but 43% for the population), and too low a
proportion of households with wealth above $300,000 (17% for the weighted survey but
24% the population) distribution. Since prevalence of use and consideration of vehicles
of planned giving are positively related to both income and wealth, the effects of the
downward bias on wealth are likely to be offset by the upward bias on income, with the
net effect on prevalence likely to be small.
The analysis in this report was restricted to the 873 respondents who were (1) heads of
household and (2) either aged 30 or older or were high school graduates. These
restrictions were placed on the analysis in order to eliminate uninformed or misleading
responses. Non-heads of household tend to be adult children or older relatives of heads
of household, and they are often ignorant of the financial planning and charitable
donations of the household as a whole. Preliminary analysis of respondents who were
under thirty and who had not completed high school found very high use of vehicles of
planned giving by the group, findings which did not seem credible.
The analysis was further restricted to only nine of the ten vehicles of planned giving
included in the survey. The pooled income fund vehicle was dropped from the analysis
because it appears that respondents confused it with commercial mutual funds.
It is possible that some other respondents in the survey may have given inaccurate
responses to some of the questions. In a survey like this, which is limited to a relatively
small number of questions, the results are necessarily less precise than would be the case
with say a large national survey that asks many detailed questions. As one validation of

2 Methodology 15
the responses, however, we may compare the prevalence of charitable bequests from the
current survey (6.8% of households) with that obtained from the 2000 Survey of Donors
conducted by the National Committee on Planned Giving (5.6%6 of households). These
percentages are fairly close, but show an increase in the rates of charitable bequests. This
increase concurs with what one would expect over that three-year period, that with an
aging population and growing interest in planned giving in recent years, the rate of
bequest giving would be higher. Even allowing for some margin of error, however, the
findings of this survey, as will be seen throughout the report, are in general terms so large
as to allow us to be confident that they reflect the broad and growing popularity and
interest of the entire population--and not just the wealth holders--in vehicles of planned
giving.
6 The National Committee on Planned Giving reports a figure of 8%, but this figure combines arepresentative sample with an oversample of wealthy households and does not calculate its measure basedon microdata estimation.

3 Detailed Findings 16
3 Detailed Findings
3.1 Prevalence of the Usage of Individual Planned Giving Vehicles
Planned giving vehicles are enjoying widespread usage among the general population.
More than half of U.S. households (57% or approximately 60 million households) are
either participating in or are considering planned giving. Among this group the most
popular vehicles are the traditional methods of charitable bequests and donating assets.
The least popular are retained life estates and charitable gift funds at financial
institutions. Looking only at the 31% of households currently participating in planned
giving, we find that while donating assets is popular (10.5%), charitable funds at
community foundations and nonprofit organizations are nearly as prevalent (9.3%)
among planned givers, with charitable bequests third in prevalence (6.8%).
Figure 8:
Percent of Households Using Each of Nine Vehicles of Planned Giving
10.5%
9.3%
6.8%6.2%
5.4%4.7%
3.6%3.0%
2.5%
0%
2%
4%
6%
8%
10%
12%
DonatedAssets
CharitableFund at
CommunityFoundation
or NonprofitOrganization
CharitableBequest
CharitableFoundation
CharitableTrust
Charity AsBeneficiary
CharitableGift Annuity
Retained LifeEstate
CharitableGift Fund at
FinancialInstitution
Perc
ent

3 Detailed Findings 17
Table 1 summarizes the results for each of the vehicles included in the survey. The first
column of this table lists the vehicle of planned giving. The second column lists the
percentage of households using the vehicle. The third column lists the percentage of
households that are not currently using the vehicle, but that are considering doing so.
Figure 9:
Usage or Consideration of Planned Giving Vehicles
31%
26%
43%Households that have used at least 1 PGV
Households considering using PGVs
Households neither using nor considering using PGVs
As the table shows, 31% of households have used at least one vehicle of planned giving
and another 26% have not used any of the nine vehicles but are considering doing so.
The most popular vehicles are charitable bequests (26% leaving or considering leaving a
charitable bequest) and donating assets (24% contributing or considering contributing
assets to a charity). The least popular vehicles are retained life estates (9% established or
considering establishing such an arrangement) and charitable gift funds (10% established
or considering establishing a fund).

3 Detailed Findings 18
Figure 10:
Percent of Households Considering Each of Nine Vehicles of Planned Giving
19.3%
13.9% 13.2% 12.9%
10.8%9.3% 8.6%
7.9%6.3%
0%
5%
10%
15%
20%
25%
CharitableBequest
CharitableFoundation
DonatedAssets
CharitableGift Annuity
CharitableTrust
CharitableFund at
CommunityFoundation
or NonprofitOrganization
Charity AsBeneficiary
CharitableGift Fund at
FinancialInstitution
Retained LifeEstate
Perc
ent
Figure 11:
Percent of Households Using or Considering Each of Nine Vehicles of Planned Giving
26.1%
23.7%
20.1%18.6%
16.5% 16.2%
13.3%
10.4%9.3%
0%
5%
10%
15%
20%
25%
30%
CharitableBequest
DonatedAssets
CharitableFoundation
CharitableFund at
CommunityFoundationor NonprofitOrganization
CharitableGift Annuity
CharitableTrust
Charity AsBeneficiary
CharitableGift Fund at
FinancialInstitution
Retained LifeEstate
Perc
ent
3 Detailed Findings 19
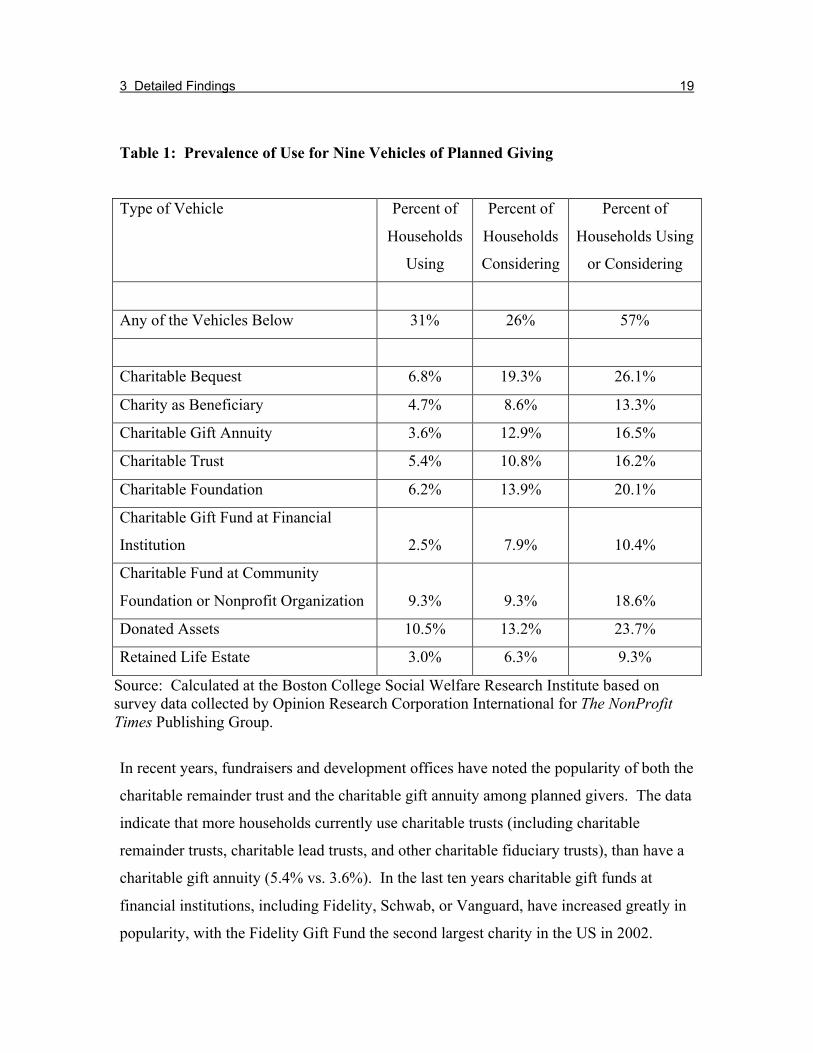
Table 1: Prevalence of Use for Nine Vehicles of Planned Giving
Type of Vehicle Percent of
Households
Using
Percent of
Households
Considering
Percent of
Households Using
or Considering
Any of the Vehicles Below 31% 26% 57%
Charitable Bequest 6.8% 19.3% 26.1%
Charity as Beneficiary 4.7% 8.6% 13.3%
Charitable Gift Annuity 3.6% 12.9% 16.5%
Charitable Trust 5.4% 10.8% 16.2%
Charitable Foundation 6.2% 13.9% 20.1%
Charitable Gift Fund at Financial
Institution 2.5% 7.9% 10.4%
Charitable Fund at Community
Foundation or Nonprofit Organization 9.3% 9.3% 18.6%
Donated Assets 10.5% 13.2% 23.7%
Retained Life Estate 3.0% 6.3% 9.3%
Source: Calculated at the Boston College Social Welfare Research Institute based onsurvey data collected by Opinion Research Corporation International for The NonProfitTimes Publishing Group.
In recent years, fundraisers and development offices have noted the popularity of both the
charitable remainder trust and the charitable gift annuity among planned givers. The data
indicate that more households currently use charitable trusts (including charitable
remainder trusts, charitable lead trusts, and other charitable fiduciary trusts), than have a
charitable gift annuity (5.4% vs. 3.6%). In the last ten years charitable gift funds at
financial institutions, including Fidelity, Schwab, or Vanguard, have increased greatly in
popularity, with the Fidelity Gift Fund the second largest charity in the US in 2002.
3 Detailed Findings 20
However, the survey finds that only 2.5% of households have established this type of
account and that it is the least prevalent of any of the nine vehicles in the survey. Even
retained life estates (3.0%) are slightly more popular.
Considering each of the nine categories individually, we find that for the most part there
are considerably fewer households currently using any specific vehicle of planned giving,
as there are households considering the use of a planned giving vehicle. It is not that
current use is low (indeed 31% of households are using at least one of the planned giving
vehicles), rather that high rates of consideration reflect the similarly high degree of
interest in planned giving among the general population, implying a fertile market and
near-term growth potential for planned gifts. As far as specific vehicles are concerned,
household interest in all the categories is relatively high. However, it appears that
charitable bequests, family and private foundations, and donating assets are the methods
that most appeal to potential planned givers. After these three options, households are
next considering charitable gift annuities (12.9%) and charitable trusts (10.8%). As noted
previously, there are more households currently using charitable trusts than charitable gift
annuities, but there is more interest in charitable gift annuities than in charitable trusts. If
new growth follows interest, charitable gift annuities will grow faster than charitable
trusts in the near-term, but there will be growth in the use of all vehicles of planned
giving.
3.2 Prevalence for Multiple Vehicles
Table 1 indicates that 31% of households use at least one of the nine vehicles of planned
giving, but many households use more than one vehicle. About 18% of all households
use only one vehicle of planned giving, another 7% use two vehicles, and 6% use three or
more vehicles. For households that use at least one of the nine vehicles, the
corresponding percentages are 58% using only one vehicle, 23% choosing two vehicles,
and 19% availing of three or more vehicles.
3 Detailed Findings 21
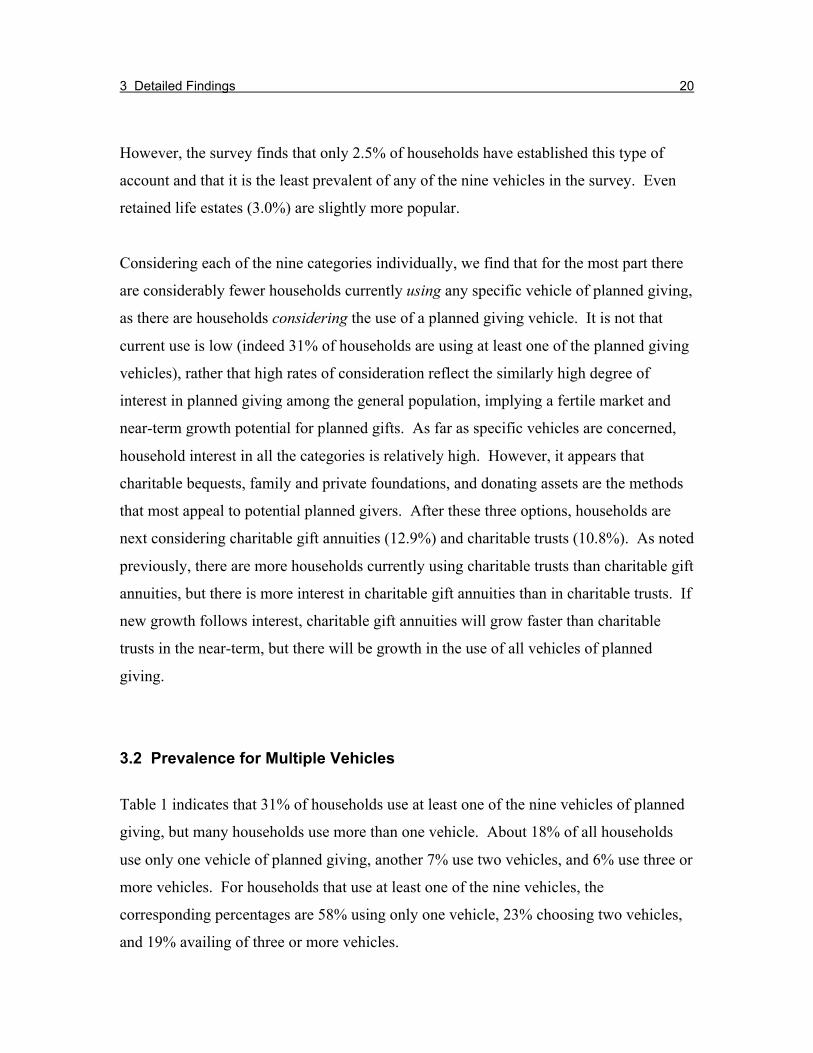
Figure 12:
Percent of All Households Using Zero, One, Two, or Three or More Vehicles of Planned Giving
18%
7%
6%69%
% Using 1 Vehicle
% Using 2 Vehicles
% Using 3+ Vehicles
% Using No Vehicles
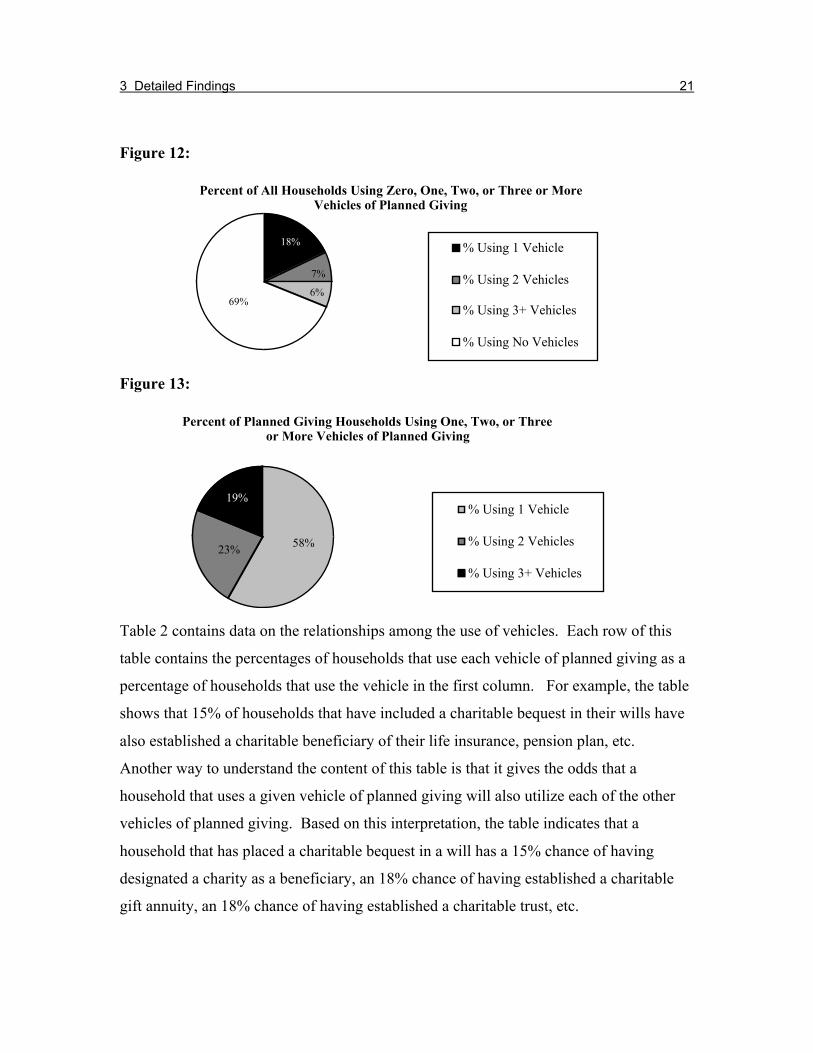
Figure 13:
Percent of Planned Giving Households Using One, Two, or Three or More Vehicles of Planned Giving
19%
58%23%
% Using 1 Vehicle
% Using 2 Vehicles
% Using 3+ Vehicles
Table 2 contains data on the relationships among the use of vehicles. Each row of this
table contains the percentages of households that use each vehicle of planned giving as a
percentage of households that use the vehicle in the first column. For example, the table
shows that 15% of households that have included a charitable bequest in their wills have
also established a charitable beneficiary of their life insurance, pension plan, etc.
Another way to understand the content of this table is that it gives the odds that a
household that uses a given vehicle of planned giving will also utilize each of the other
vehicles of planned giving. Based on this interpretation, the table indicates that a
household that has placed a charitable bequest in a will has a 15% chance of having
designated a charity as a beneficiary, an 18% chance of having established a charitable
gift annuity, an 18% chance of having established a charitable trust, etc.

3 Detailed Findings 22
Table 2: Percent of Households Using Planned Giving Vehicles
Type of Vehicle CharitableBequest
Charityas
Beneficiary
CharitableGift
Annuity
CharitableTrust
CharitableFoundation
CharitableGift Fund
atFinancialInstitution
CharitableFund at
CommunityFoundation
orNonprofit
DonatedAssets
RetainedLife Estate
Charitable Bequest 100% 15% 18% 18% 17% 41% 22% 21% 18%Charity asBeneficiary
10% 100% 12% 11% 11% 23% 9% 6% 31%
Charitable GiftAnnuity
9% 8% 100% 13% 15% 9% 16% 10% 27%
Charitable Trust 14% 12% 20% 100% 16% 28% 12% 11% 17%CharitableFoundation
16% 15% 27% 19% 100% 35% 17% 12% 22%
Charitable GiftFund atFinancial Institution
15% 13% 7% 13% 14% 100% 11% 6% 20%
Charitable Fund atCommunityFoundation orNonprofit Org.
31% 19% 43% 22% 26% 42% 100% 25% 47%
Donated Assets 31% 13% 28% 20% 20% 23% 28% 100% 38%Retained Life Estate 8% 20% 25% 10% 11% 23% 15% 11% 100%
Source: Calculated at the Boston College Social Welfare Research Institute based on survey data collected by Opinion Research CorporationInternational for The NonProfit Times Publishing Group.

3 Detailed Findings 23
The table gives a different perspective on the planned giving vehicles. In general terms
it indicates that households that use any given vehicle of planned giving are a good deal
more likely (3 to 4 times more likely) to use one of the other vehicles as compared with
the simple frequency of use presented in Table 1 (ranging from 2.5% to 10.5% of the
population of households).
Table 2 also offers a different view than Table 1 on the role of specific vehicles in the
planned giving process. For example, Table 1 indicates that 3.0% of households have a
retained life estate. Table 2 indicates that between 17% and 47% of households that
employ any of the other forms of planned giving have a retained life estate. Although not
very popular among the population at large, retained life estates are relatively popular
among households that are already using other vehicles of planned giving. Once a
household chooses one or other vehicles of planned giving, retained life estates are much
more likely to be part of its portfolio of planned gifts.
The pattern is similar for a charitable gift fund at a financial institution. The survey
indicates that this is the least popular vehicle of planned giving (2.5%). Yet among
households that are using other vehicles of planned giving, the prevalence of charitable
gift funds increases to values of 9% to 43%, depending on the specific other vehicle it is
combined with.
Charitable funds and accounts at charitable foundations and nonprofit organizations
evince a different pattern. Households which have committed to these funds have a
relatively high frequency of usage of the other vehicles. This implies that households
tend to choose charitable funds at a community organization in combination with one or
more other vehicles of planned giving, regardless of which other specific vehicles are
chosen.

3 Detailed Findings 24
Expanding the basis of our analysis from those households that use vehicles of planned
giving to those that both use or are considering using a vehicle of planned giving, we are
dealing with more than half (57%) of all households. This 57% is distributed as follows:
23% of households use or are considering one vehicle of planned giving, 11% use or are
considering two vehicles, and 23% are using or considering three or more vehicles. If we
look only at households that use or are considering any of the vehicles, we find that 40%
of such households use or are considering one vehicle, 20% use or are considering two
vehicles, and 40% use or are considering three or more vehicles. This implies that 60%
of households that are using or considering any given vehicle are also using or
considering at least one additional vehicle.
Figure 14:
The Use of Vehicles of Planned Giving Among All Households
11%
23%
43%
23%
Households Not UsingVehicles
Households Using 1VehicleHouseholds Using 2Vehicles
Households Using 3+Vehicles

3 Detailed Findings 25
Figure 15:
The Use of Vehicles of Planned Giving Among Planned Giving Households
20%
40% 40% Households Using 1 Vehicle
Households Using 2 Vehicles
Households Using 3+ Vehicles

3 Detailed Findings 26
Table 3: Percent of Households Using or Considering Vehicles of Planned Giving
Type of Vehicle CharitableBequest
Charityas
Beneficiary
CharitableGift
Annuity
CharitableTrust
CharitableFoundation
CharitableGift Fund
atFinancialInstitution
CharitableFund at
CommunityFoundation or
Nonprofit
DonatedAssets
RetainedLife
Estate
Charitable Bequest 100% 67% 59% 58% 49% 71% 56% 61% 59%Charity asBeneficiary
34% 100% 38% 37% 30% 45% 35% 33% 47%
Charitable GiftAnnuity
37% 47% 100% 57% 45% 63% 49% 39% 64%
Charitable Trust 36% 45% 57% 100% 48% 64% 46% 39% 60%CharitableFoundation
37% 45% 56% 60% 100% 56% 50% 38% 63%
Charitable GiftFund atFinancial Institution
29% 36% 41% 41% 29% 100% 32% 29% 45%
Charitable Fund atCommunityFoundation or Non-Profit Org.
40% 49% 58% 53% 46% 56% 100% 48% 63%
Donated Assets 56% 59% 57% 57% 46% 67% 61% 100% 60%Retained Life Estate 22% 36% 38% 37% 31% 42% 32% 25% 100%
Source: Calculated at the Boston College Social Welfare Research Institute based on survey data collected by Opinion Research CorporationInternational for The NonProfit Times Publishing Group.

3 Detailed Findings 27
Table 3 contains data on the relationship between the use and consideration of vehicles of
planned giving. Analogous to Table 2, each row of Table 3 contains the percentages of
households that use or are considering each vehicle of planned giving as a percentage of
households that use or are considering the vehicle in the first column. For example, the
table indicates that 49% of households that have included or are considering a charitable
bequest in their wills have also established or are considering establishing a family or
private foundation.
Table 3 reflects both the complexity and breadth of interest in vehicles of planned giving
among households. From Table 1 we learn that more than half (57%) of households are
using or considering using at least one vehicle of planned giving. Table 3 indicates that
when a household has used or is interested in using any vehicles of planned giving, there
is a high chance that it will also be using or at least interested in other vehicles as well.
Charitable gift funds at financial institutions and retained life estates are on the receiving
end of much of this interest: 42% of households that have set up or are considering a
retained life estate also have created or are considering a charitable gift fund at a financial
institution. Seventy-one percent of households that have made or are considering a
charitable bequest in a will are considering a gift fund at a commercial provider. When it
comes to retained life estates, 45% of households that already own or are considering a
commercial charitable gift fund are interested in setting up a retained life estate. That
figure is higher for households which have created or are considering a charitable fund or
account at a community foundation or non-profit organization; among these households,
a majority of 63% are interested in using a retained life estate as part of their planned
giving.

3 Detailed Findings 28
3.3 Prevalence and Financial Resources
The financial resources of the household are composed of wealth and income. Household
income can come from several sources: wage and salary, self-employment, unearned
(interest, dividend, rent, and capital gain), transfers from government (welfare, SSI, food
allowances, etc.), transfers from individuals (alimony, child support, and gifts), and
retirement (Social Security, other government pension plans, and private pension plans).
Wealth is measured by household net worth: the value of all assets owned by members
of the household minus total debts owed by members of the household. For most
households, assets include a vehicle, perhaps a home, checking and savings account
balances, possibly an IRA or defined contribution pension plan, and perhaps some
investment in mutual funds. Most households also have debt in the form of mortgages,
credit card balances, and installment loans.
There is a perception among the general public that vehicles of planned giving are
confined to high income and wealthy households. In a strict sense this is not true,
although it is true that wealthy households with high incomes more frequently use
planned giving vehicles. Approximately 25% of households with incomes less than
$50,000 and wealth (net worth) less than $300,000 are using at least one vehicle of
planned giving and another 31% of such households are considering employing a planned
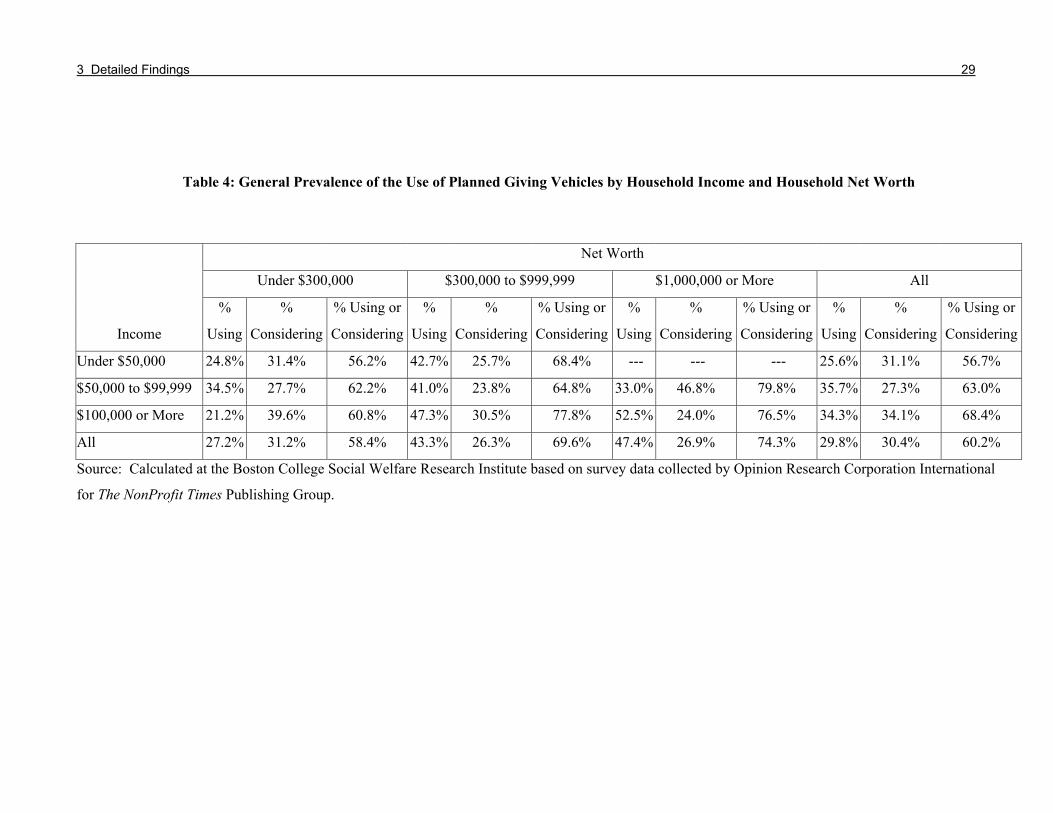
giving method (Table 4). The proportion of households using planned giving generally
trends upward as income and wealth increase. Among households earning at least
$100,000 per year and owning wealth of at least $1,000,000, 53% of households are
using at least one vehicle of planned giving and another 24% are considering a planned
giving vehicle, which makes a total of 77% of households that are using or considering
one or more vehicles of planned giving.
3 Detailed Findings 29
Table 4: General Prevalence of the Use of Planned Giving Vehicles by Household Income and Household Net Worth
Net Worth
Under $300,000 $300,000 to $999,999 $1,000,000 or More All
% % % Using or % % % Using or % % % Using or % % % Using or
Income Using Considering Considering Using Considering Considering Using Considering Considering Using Considering Considering
Under $50,000 24.8% 31.4% 56.2% 42.7% 25.7% 68.4% --- --- --- 25.6% 31.1% 56.7%
$50,000 to $99,999 34.5% 27.7% 62.2% 41.0% 23.8% 64.8% 33.0% 46.8% 79.8% 35.7% 27.3% 63.0%
$100,000 or More 21.2% 39.6% 60.8% 47.3% 30.5% 77.8% 52.5% 24.0% 76.5% 34.3% 34.1% 68.4%
All 27.2% 31.2% 58.4% 43.3% 26.3% 69.6% 47.4% 26.9% 74.3% 29.8% 30.4% 60.2%
Source: Calculated at the Boston College Social Welfare Research Institute based on survey data collected by Opinion Research Corporation International
for The NonProfit Times Publishing Group.
3 Detailed Findings 30
That such a large proportion, 77%, of high income, high wealth households are using or
considering vehicles of planned giving is interesting in its own right, but even more
significant is the fact that more than half of households (56%) with incomes under
$50,000 and wealth of less than $300,000 are also using or considering vehicles of
planned giving. These statistics underscore the degree to which planned giving has been
accepted and utilized as a means of charitable giving by the general population.
3.4 Prevalence and Demographic Characteristics
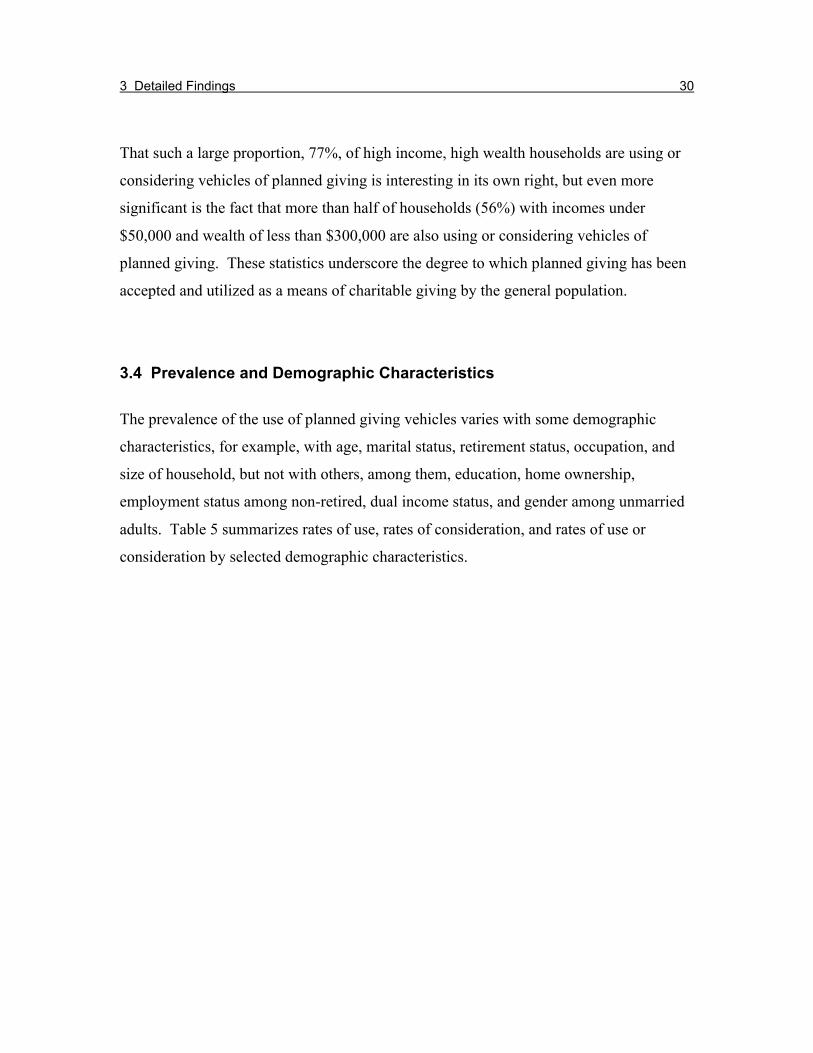
The prevalence of the use of planned giving vehicles varies with some demographic
characteristics, for example, with age, marital status, retirement status, occupation, and
size of household, but not with others, among them, education, home ownership,
employment status among non-retired, dual income status, and gender among unmarried
adults. Table 5 summarizes rates of use, rates of consideration, and rates of use or
consideration by selected demographic characteristics.
3 Detailed Findings 31
Table 5: General Prevalence of the Use of Planned Giving Vehiclesby Demographic Characteristics
Using Considering Using or ConsideringAge
Under 40 Years 28.9% 35.6% 64.5%40 to 59 Years 28.4% 26.4% 54.8%60 to 64 Years 28.1% 18.7% 46.8%
65 or Older 43.8% 8.1% 51.9%Marital Status
Married 32.5% 24.8% 57.3%Single, Separated or
Divorced 27.1% 35.3% 62.4%Widowed 35.7% 7.3% 43.0%
Home Ownership Homeowner 31.9% 22.7% 54.6%
Not a Homeowner 31.0% 35.2% 66.2%Education
Less than High School 33.2% 14.7% 47.9%High School, Not College
Graduate 29.4% 26.2% 55.6%College Graduate 33.6% 27.9% 61.5%Advanced Degree 30.2% 33.2% 63.4%
Employment Status Employed 28.1% 31.4% 59.5%
Retired 43.9% 11.5% 55.4%Not Employed 27.8% 28.4% 56.2%
Dual Income Households Dual Income 31.7% 24.7% 56.4%
Not a Dual Income 33.7% 25.0% 58.7%Occupation*
White Collar: Professional,Managerial, Owner 31.3% 29.4% 60.7%
White Collar: Sales, Clerical 22.9% 31.0% 53.9%Blue Collar 22.6% 35.5% 58.1%
Service Worker 34.9% 34.0% 68.9%Unmarried by Gender
Unmarried Female 28.0% 30.5% 58.5%Unmarried Male 29.7% 29.4% 59.1%
Number in Household One 30.2% 23.6% 53.8%Two 34.3% 23.9% 58.2%
Three 28.8% 28.4% 57.2%Four 30.8% 30.8% 61.6%
Five or More 28.9% 35.9% 64.8%Children in Household
No Children 33.2% 24.6% 57.8%Children 27.6% 30.9% 58.5%
Minority Status White 30.1% 25.4% 55.5%
Not White 33.4% 34.5% 67.9%Hispanic Status
Not Hispanic 30.6% 27.1% 57.7%Hispanic 36.7% 26.3% 63.0%
Source: Calculated at the Boston College Social Welfare Research Institute basedon survey data collected by Opinion Research Corporation Internationalfor The NonProfit Times Publishing Group.

3 Detailed Findings 32
Some of the specific demographic characteristics for which the prevalence of use of
planned giving vehicles varies reflect lifecycle differences. Adults who are nearer the
end of the lifecycle (i.e., who are aged 65 or older, widowed, or retired) are more likely to
be using one or more vehicles of planned giving as compared with adults at the beginning
or middle of the lifecycle (i.e., under age 65, not widowed, and not retired). In addition,
households with two members, households with no children, households headed by
white-collar professionals or by service workers, and households headed by minorities
are also more likely to be using one or more vehicles of planned giving as compared with
households with more than two members or a single member, households with children,
households headed by adults with blue collar or white collar sales/clerical occupations, or
households headed by whites.
Prevalence of use and prevalence of consideration tend to be inversely related: when use
goes up, consideration goes down. This most likely reflects a decision-making process
concerning the use of planned giving vehicles for charitable giving. For example, with
respect to lifecycle, adults at the beginning of the lifecycle tend to be interested in
planned giving vehicles and to be considering them actively, but have not yet committed
to their use and may not yet have the financial resources to do so. At a more advanced
stage of the lifecycle, adults tend to have made decisions concerning charitable giving via
planned giving vehicles and further consideration is no longer necessary. In addition to
lifecycle characteristics, the inverse relation between prevalence of use and prevalence of
consideration also holds for household size and occupation. This may also reflect the
classic consumer decision-making process of examining the options before choosing to
commit to one or more of them.
While education and home ownership bear little relationship to prevalence of use, further
examination of these demographics reveals relationships to the levels of interest in
vehicles of planned giving. Adults without a high school degree and college graduates
without an advanced degree have about the same rate of participation in one or more
3 Detailed Findings 33
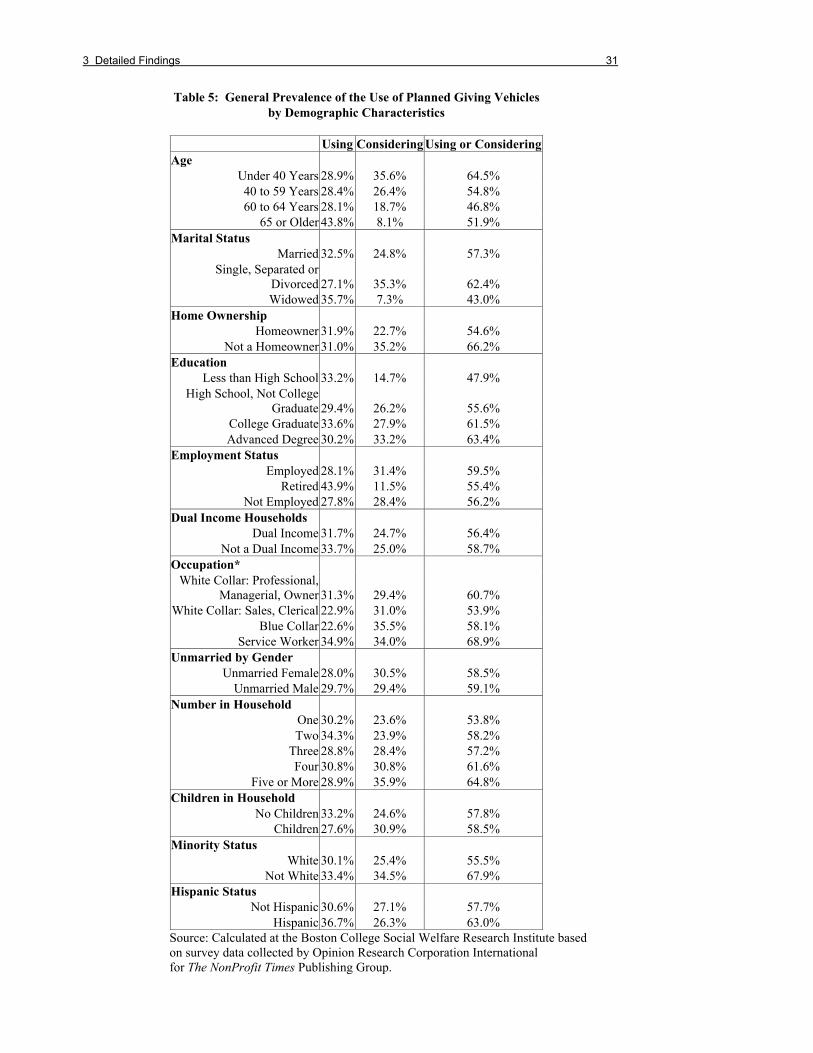
planned giving vehicles. However, interest in vehicles of planned giving rises
substantially as education increases. Only 15 percent of adults with less than a high
school education are considering planned giving vehicles as contrasted with 28 percent of
adults with a college degree and 33 percent of adults with an advanced degree. Home
ownership exhibits a pattern similar to education. Rates of use of vehicles of planned
giving are similar between homeowners and renters. However, renters exhibit more
interest in planned giving vehicles (35%) as compared with homeowners (23%). This
relationship may, however, reflect differences among households beyond home
ownership, for example, differences in financial resources and lifecycle characteristics.
Figure 16:
Percent of Adults Considering Vehicles of Planned Giving by Educational Status
33%
28%
15%
0%
5%
10%
15%
20%
25%
30%
35%
Less Than A HighSchool Education
College Degree Advanced Degree
Perc
ent
3.5 Charitable Giving and Planned Giving
More households that donated to charity in 2002 also used one or more vehicles of
planned giving, as compared with households that did not donate to charity in 2002:
approximately 32% of households that gave to charity in 2002 used one or more vehicles

3 Detailed Findings 34
of planned giving as compared with 15% of households participating in planned giving
among those households that did not give to charity in 2002. Table 6 summarizes the
relationships between inter-vivos giving in 2002 and prevalence of use and consideration
of planned giving vehicles.
Shifting from rates of participation to look at amounts contributed, we find that there is a
strong relationship between the amount contributed to charity in 2002 and use of planned
giving vehicles. Nearly half the households that contributed to charity in 2002 use at
least one vehicle of planned giving as compared with only 16% that did not contribute to
charity in 2002. The prevalence of use of planned giving vehicles also increases
dramatically as the size of household donations increases, from 24% for households that
donated less than $1,000 to 49% for households that donated at least $5,000 in 2002.
Source: Calculated at the Boston College Social Welfare Research Institute basedon survey data collected by Opinion Research Corporation International for TheNonProfit Times Publishing Group.
Table 6: General Prevalence of the Use of Planned Giving Vehicles by Inter-VivosGiving and Financial Security
Using Considering Using or Considering
Participation in Charity
Did Not Give to Charity in 2002 16.1% 22.9% 39.0%
Gave to Charity in 2002 31.8% 27.9% 59.7%
Contribution Amount
Nothing 16.1% 22.9% 39.0%
Under $1000 24.3% 27.9% 52.2%
$1000 to $2499 31.7% 26.1% 57.8%
$2500 to $4999 34.6% 36.2% 70.8%
$5000 or More 49.1% 23.4% 72.5%

3 Detailed Findings 35
3.6 Planned Giving and Professional Advice
The impact of the financial planner on charitable giving has not been studied
systematically here, and the survey does not support detailed analysis. We can, however,
begin to elucidate the relationship between professional advice concerning long-term
household plans for charitable giving and the use of vehicles of planned giving.
First, only 10% of households sought and obtained professional advice about charitable
giving; and they are concentrated among relatively wealthy households, with $300,000 or
more net worth, and to a lesser extent among relatively high income households, with
$50,000 or more annual income. The other 90% of households have not sought advice.
Seeking professional advice about long-term giving plans does lead to planned giving:
most households that consulted a professional are now using one or more vehicles of
planned giving (58%). However, even among households using vehicles of planned
giving, 80% are doing so without having received professional advice.

4 Discussion of Findings 36
4 Discussion of Findings
Anecdotal evidence, reports from financial planners and development officers, as well as
statistical evidence on foundations and charitable remainder trusts indicate increased
interest and growth in the use of vehicles of planned giving to charitable organizations.
What this evidence omits is both the depth and extent of interest and usage of planned
giving vehicles not only among affluent households, but also among the entire
population. In addition to households in the later stages of the lifecycle and households
with large amounts of income and wealth, a substantial proportion of households in all
demographic categories, all stages of their lifecycle, and all amounts of income and
wealth, currently use or are considering using vehicles of planned giving. We have
identified no surprising or dramatic indicators that identify households engaged in or
interested in planned giving. What we can say is that such households tend to be
concentrated at higher levels of income and wealth, are more advanced in the lifecycle,
and are more committed to inter-vivos charitable giving than are average households.
Charitable bequests, family and other private foundations, and donated assets are the
most popular of the nine vehicles for planned gifts. Retained life estates and charitable
gift funds at financial institutions are the least popular. A planned-giving strategy that
involves multiple vehicles of giving is common among households that have already
committed to at least one planned gift. It is curious, however, that most households that
have created a planned gift have done so without professional advice.
The considerable interest shown in planned gifts among all households, but especially
among young adults and households early in the lifecycle, bodes well for fundraisers,
development offices, and charitable organizations. Interest, however, tends to be
inversely related to use, reflecting we suggest, a decision-making process in which the
donor or potential donor first gathers information and then decides on a course of action.
4 Discussion of Findings 37
The pervasive interest in these vehicles should, however, enhance fundraising efforts and
lead to greater amounts of planned giving in the future.
4.1 Implications
The major implication of the 2003 Survey on Planned Giving Vehicles is that there is a
substantial number of people for whom charitable giving is a strategic activity and the
indications are that there is an even greater number for whom it will become so in the
future. The stakes for philanthropy are high and are increasing—not just in the aggregate
as a quantitative and cultural force nationally, but also at the individual household level,
where charitable giving is a qualitative and biographical force of individual and family
identity formation. Growth in the prevalence and potential for planned giving, which we
understand as the self-reflective allocation of assets over time to achieve a conscientious
array of charitable aspirations, is perhaps the leading emergent trend in philanthropy
today. The findings from the planned giving survey are congruent with the following
trends and implications:
1. Over the past two decades our research has shown that it is important to
consider planned giving in its broader sense, as including any gift that which
combines a strategy of financial allocation with a strategy of charitable
effectiveness. The survey findings on the interaction of the broader range of
planned gifts—not just those that depend on the donor’s death for their
realization, but also vehicles of substantial inter-vivos giving—with each other
and with annual charitable giving, support our notion that planned givers
consciously create a philanthropic strategy during their lifetimes, where financial
resources are translated into effective philanthropy.
2. The fact that those who participate in one form of planned giving tend to
participate in other forms supports our view that there is a shift of identity when
donors begin to think about their material capacity and philanthropic purpose in a

4 Discussion of Findings 38
more systematic way and begin to map the asset composition, timing, and
purposes of their gifts. As such, the training of fundraisers and development
goals should revolve more around helping donors through this identity shift from
giver to planned giver, that is, someone whose more elaborate approach to
connecting the assets, timing, and purposes of gifts is mutually formative for
themselves and their beneficiaries.
3. There is much room for advancing planned giving in its many forms: only one
third of households is currently employing one or more vehicles to carry out their
charitable giving but an additional quarter of all households is interested in
making their giving more systematic. In introducing donors to planned giving,
the relatively high prevalence of charitable bequests suggests that this vehicle
may be an entrance point for developing planned giving identities among donors.
4. As income and wealth continue to grow, more households will achieve a sense
of financial security and more individuals will see themselves capable at the
present or in the future of doing something more systematic and formative for the
people and causes they care about. At the same time the portfolios of all
households, but especially wealthy households, will increase in financial
complexity with respect to assets and the set of options concerning their tax
treatment. In this complex financial environment individuals making substantial
donations are and will be even more inclined to use forms of charitable giving that
provide the most financially congenial contribution strategy, such as the nine
vehicles at the heart of this survey.
5. A mere 10% of households has discussed future charitable plans with a
professional advisor, such as a fundraiser or financial planner. If it is carried out
in an engaging and donor-oriented fashion, gift planning linked to financial
planning should be a growth industry. As wealth, financial security, and financial
complexity grow, individuals are and will be even more inclined to seek out
assistance. As such, financial advisors and development officers have an
unprecedented opportunity to help donors combine the complexity and quantity of
4 Discussion of Findings 39
their financial capacity with the complexity and quality of their charitable
aspirations.
6. Financial planners and fundraisers need to be sensitive to the fact that, as with
all giving, but with planned giving in particular, donors’ biographical history and
prospects are constituted in tandem. Just as the assets of a planned gift were
accumulated in connection to the biographical activities and purposes of a donor,
so too will they be distributed. Planned giving is not only biographical formation,
it is also family formation. A planned gift invites and often entails the
involvement of family members, especially, though not exclusively, through
foundations and donor advised funds, which often are intergenerational.
7. In terms of the potential of planned giving as it is fostered through favorable
tax legislation, the future looks hopeful. New provisions in the pending CARE
act concerning the tax-consequences and timing of charitable gifts made from
IRAs and other defined-contribution pension plans create new opportunities for
planned giving. How substantial the effect of this legislation on planned giving
is to be seen, since apart from penalty-free early distributions of pension assets
and the avoidance of penalties for lack of disbursement, there are fewer tax
advantages for giving pension assets than non-pension assets, especially
appreciated assets. In addition, the tax bill, recently passed by the House and
Senate and awaiting the President’s signature, accelerates the lowering of the top
income tax bracket to 35% and reduces the tax on capital gains and dividends to
15%. Both of these changes will affect charitable gifts, especially gifts of
appreciated assets. Income and wealth effects will both tend to increase after-tax
financial resources and increase charitable giving, but will be offset by a price
effect tending to reduce charitable giving. However, what the net effect on total
charitable giving or on the prevalence and amounts of planned giving is at
present impossible to say.