2003 tech manual - assess · into the assess system for interpretation. assess “makes sense” of...
TRANSCRIPT

TECHNICAL MANUAL
December 2003
Copyright © 2003 Bigby, Havis & Associates, Inc., and David G. Bigby, Ph.D. All rights reserved.

ii
Contents
1: Background
Introduction ...............................................................................................................................................................1 About the ASSESS Expert System Version ..............................................................................................................1 ASSESS Rule Complexity.........................................................................................................................................3 History .......................................................................................................................................................................5 The 1970 ASSESS Expert System ............................................................................................................................5 The 1986 ASSESS Expert System (DOS-based).......................................................................................................5 The 1996 ASSESS Expert System (Windows-based) ...............................................................................................5 The 1999 ASSESS Expert System (Internet).............................................................................................................6 2001 Update...............................................................................................................................................................7 The 2003 ASSESS Expert System v2........................................................................................................................8 2: The ASSESS Personality Survey The Guilford-Zimmerman Temperament Survey......................................................................................................9 The Dynamic Factors Opinion Survey ......................................................................................................................14 Development of the ASSESS Personality Battery.....................................................................................................15 Positive Response Factors 1 and 2.............................................................................................................................19 2003 ASSESS Additional Scales...............................................................................................................................21 ASSESS Personality Attributes (ASSESS v2) ..........................................................................................................23 3: ASSESS Personality-Competency Linkages Background................................................................................................................................................................25 Competency-based Selection and Development Processes .......................................................................................25 The ASSESS v2 Strategic Success Modeling Library...............................................................................................27 Personality Competency Mapping in ASSESS v2.....................................................................................................28 4: Intellectual Ability Tests Watson-Glaser Critical Thinking Appraisal (WG) Version Form S..........................................................................31 Raven’s Standard Progressive Matrices (RPM) ........................................................................................................31 Thurstone Test of Mental Alertness (THUR) ............................................................................................................34 Arithmetic Reasoning Test (AR) ...............................................................................................................................36 Employee Aptitude Surveys (EAS 1, 2, & 7) ............................................................................................................37 5: Criterion-Related Validation Research Tailoring the ASSESS Expert System Example 1 .....................................................................................................43 Tailoring the ASSESS Expert System Example 2 .....................................................................................................45 Tailoring the ASSESS Expert System Example 3 .....................................................................................................48 Tailoring the ASSESS Expert System Example 4 .....................................................................................................51 Tailoring the ASSESS Expert System Example 5 and 6 ...........................................................................................53 Tailoring the ASSESS Expert System Example 7 .....................................................................................................56
iii
Tailoring the ASSESS Expert System Example 8 .....................................................................................................59 Tailoring the ASSESS Expert System Example 9 .....................................................................................................62 Tailoring the ASSESS Expert System Example 10...................................................................................................65 Tailoring the ASSESS Expert System Example 11...................................................................................................68 Tailoring the ASSESS Expert System Example 12...................................................................................................71 Tailoring the ASSESS Expert System Example 13...................................................................................................74 Tailoring the ASSESS Expert System Example 14...................................................................................................76 Tailoring the ASSESS Expert System Example 15...................................................................................................79 6: ASSESS Normative Data Tables Professional Normative Tables..................................................................................................................................83 ASSESS Templates - Normative Information ...........................................................................................................93
7: Bibliography ...................................................................................................................................... 106
iv
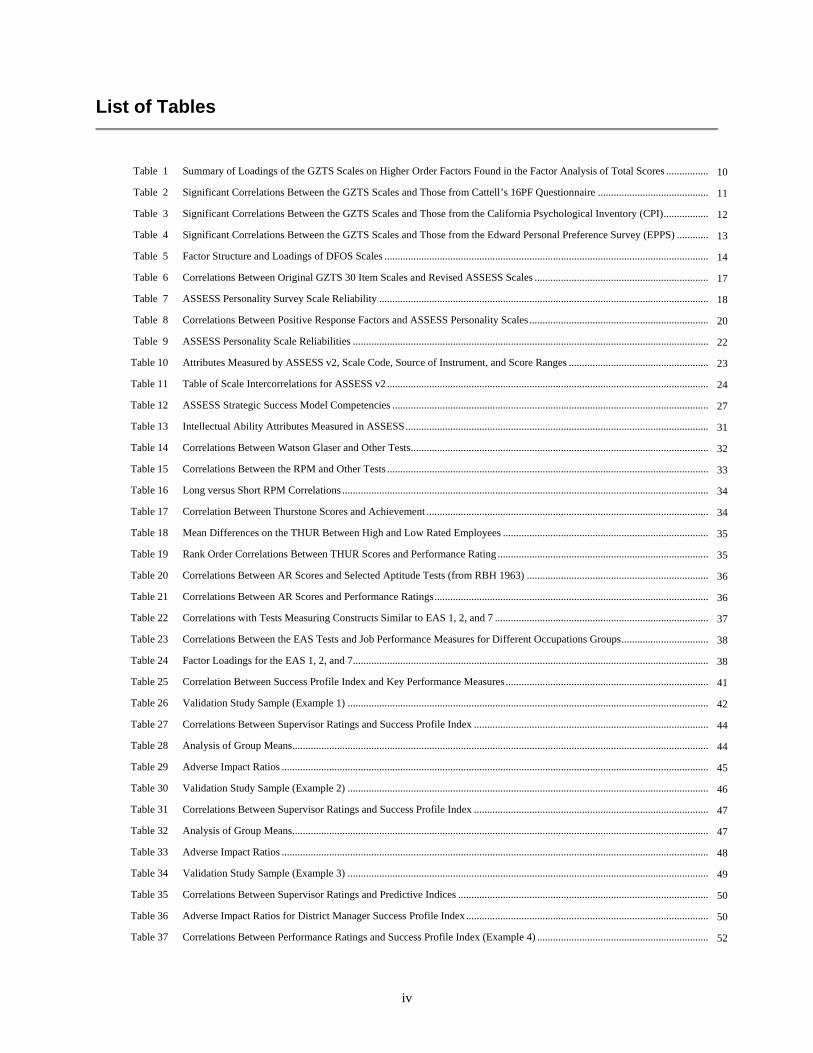
List of Tables
Table 1 Summary of Loadings of the GZTS Scales on Higher Order Factors Found in the Factor Analysis of Total Scores ................. 10
Table 2 Significant Correlations Between the GZTS Scales and Those from Cattell’s 16PF Questionnaire ........................................... 11
Table 3 Significant Correlations Between the GZTS Scales and Those from the California Psychological Inventory (CPI).................. 12
Table 4 Significant Correlations Between the GZTS Scales and Those from the Edward Personal Preference Survey (EPPS) ............. 13
Table 5 Factor Structure and Loadings of DFOS Scales ............................................................................................................................ 14
Table 6 Correlations Between Original GZTS 30 Item Scales and Revised ASSESS Scales ................................................................... 17
Table 7 ASSESS Personality Survey Scale Reliability .............................................................................................................................. 18
Table 8 Correlations Between Positive Response Factors and ASSESS Personality Scales ..................................................................... 20
Table 9 ASSESS Personality Scale Reliabilities ........................................................................................................................................ 22
Table 10 Attributes Measured by ASSESS v2, Scale Code, Source of Instrument, and Score Ranges ...................................................... 23
Table 11 Table of Scale Intercorrelations for ASSESS v2 ........................................................................................................................... 24
Table 12 ASSESS Strategic Success Model Competencies ......................................................................................................................... 27
Table 13 Intellectual Ability Attributes Measured in ASSESS.................................................................................................................... 31
Table 14 Correlations Between Watson Glaser and Other Tests.................................................................................................................. 32
Table 15 Correlations Between the RPM and Other Tests ........................................................................................................................... 33
Table 16 Long versus Short RPM Correlations ............................................................................................................................................ 34
Table 17 Correlation Between Thurstone Scores and Achievement ............................................................................................................ 34
Table 18 Mean Differences on the THUR Between High and Low Rated Employees ............................................................................... 35
Table 19 Rank Order Correlations Between THUR Scores and Performance Rating ................................................................................. 35
Table 20 Correlations Between AR Scores and Selected Aptitude Tests (from RBH 1963) ...................................................................... 36
Table 21 Correlations Between AR Scores and Performance Ratings......................................................................................................... 36
Table 22 Correlations with Tests Measuring Constructs Similar to EAS 1, 2, and 7 .................................................................................. 37
Table 23 Correlations Between the EAS Tests and Job Performance Measures for Different Occupations Groups.................................. 38
Table 24 Factor Loadings for the EAS 1, 2, and 7........................................................................................................................................ 38
Table 25 Correlation Between Success Profile Index and Key Performance Measures.............................................................................. 41
Table 26 Validation Study Sample (Example 1) .......................................................................................................................................... 42
Table 27 Correlations Between Supervisor Ratings and Success Profile Index .......................................................................................... 44
Table 28 Analysis of Group Means............................................................................................................................................................... 44
Table 29 Adverse Impact Ratios ................................................................................................................................................................... 45
Table 30 Validation Study Sample (Example 2) .......................................................................................................................................... 46
Table 31 Correlations Between Supervisor Ratings and Success Profile Index .......................................................................................... 47
Table 32 Analysis of Group Means............................................................................................................................................................... 47
Table 33 Adverse Impact Ratios ................................................................................................................................................................... 48
Table 34 Validation Study Sample (Example 3) .......................................................................................................................................... 49
Table 35 Correlations Between Supervisor Ratings and Predictive Indices ................................................................................................ 50
Table 36 Adverse Impact Ratios for District Manager Success Profile Index............................................................................................. 50
Table 37 Correlations Between Performance Ratings and Success Profile Index (Example 4) .................................................................. 52
v
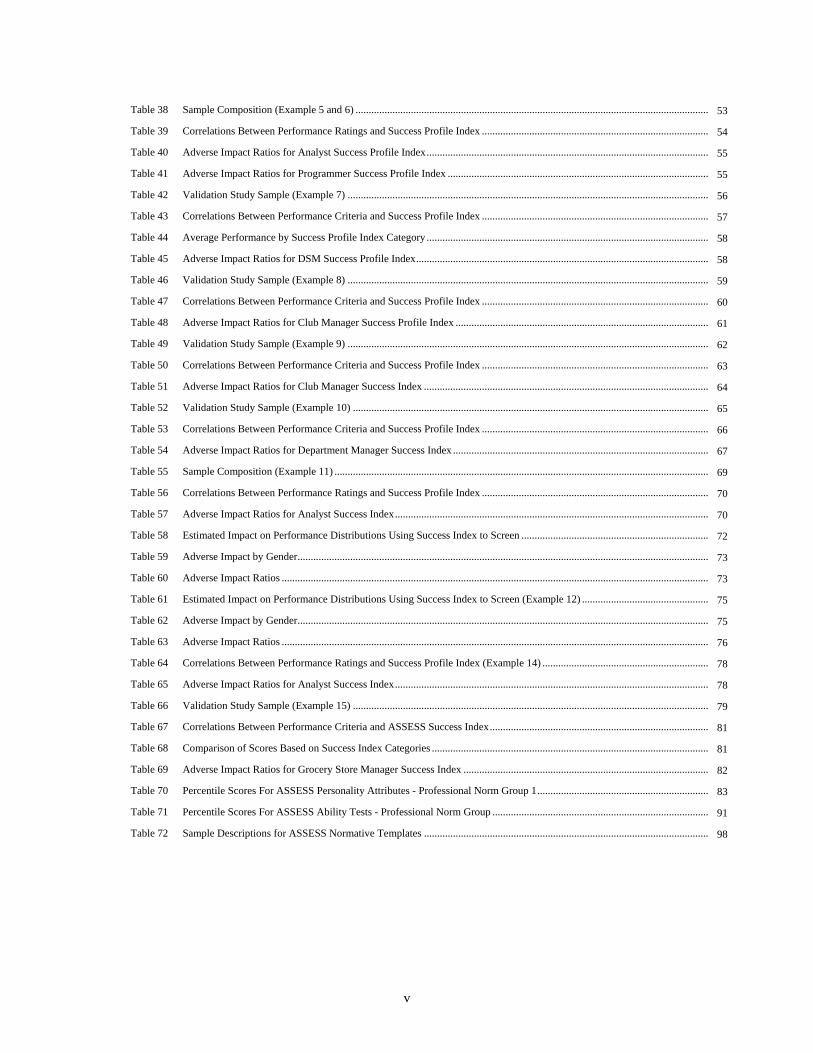
Table 38 Sample Composition (Example 5 and 6) ....................................................................................................................................... 53
Table 39 Correlations Between Performance Ratings and Success Profile Index ....................................................................................... 54
Table 40 Adverse Impact Ratios for Analyst Success Profile Index............................................................................................................ 55
Table 41 Adverse Impact Ratios for Programmer Success Profile Index .................................................................................................... 55
Table 42 Validation Study Sample (Example 7) .......................................................................................................................................... 56
Table 43 Correlations Between Performance Criteria and Success Profile Index ....................................................................................... 57
Table 44 Average Performance by Success Profile Index Category ............................................................................................................ 58
Table 45 Adverse Impact Ratios for DSM Success Profile Index................................................................................................................ 58
Table 46 Validation Study Sample (Example 8) .......................................................................................................................................... 59
Table 47 Correlations Between Performance Criteria and Success Profile Index ....................................................................................... 60
Table 48 Adverse Impact Ratios for Club Manager Success Profile Index ................................................................................................. 61
Table 49 Validation Study Sample (Example 9) .......................................................................................................................................... 62
Table 50 Correlations Between Performance Criteria and Success Profile Index ....................................................................................... 63
Table 51 Adverse Impact Ratios for Club Manager Success Index ............................................................................................................. 64
Table 52 Validation Study Sample (Example 10) ........................................................................................................................................ 65
Table 53 Correlations Between Performance Criteria and Success Profile Index ....................................................................................... 66
Table 54 Adverse Impact Ratios for Department Manager Success Index .................................................................................................. 67
Table 55 Sample Composition (Example 11) ............................................................................................................................................... 69
Table 56 Correlations Between Performance Ratings and Success Profile Index ....................................................................................... 70
Table 57 Adverse Impact Ratios for Analyst Success Index........................................................................................................................ 70
Table 58 Estimated Impact on Performance Distributions Using Success Index to Screen ........................................................................ 72
Table 59 Adverse Impact by Gender............................................................................................................................................................. 73
Table 60 Adverse Impact Ratios ................................................................................................................................................................... 73
Table 61 Estimated Impact on Performance Distributions Using Success Index to Screen (Example 12) ................................................. 75
Table 62 Adverse Impact by Gender............................................................................................................................................................. 75
Table 63 Adverse Impact Ratios ................................................................................................................................................................... 76
Table 64 Correlations Between Performance Ratings and Success Profile Index (Example 14) ................................................................ 78
Table 65 Adverse Impact Ratios for Analyst Success Index........................................................................................................................ 78
Table 66 Validation Study Sample (Example 15) ........................................................................................................................................ 79
Table 67 Correlations Between Performance Criteria and ASSESS Success Index.................................................................................... 81
Table 68 Comparison of Scores Based on Success Index Categories .......................................................................................................... 81
Table 69 Adverse Impact Ratios for Grocery Store Manager Success Index .............................................................................................. 82
Table 70 Percentile Scores For ASSESS Personality Attributes - Professional Norm Group 1.................................................................. 83
Table 71 Percentile Scores For ASSESS Ability Tests - Professional Norm Group ................................................................................... 91
Table 72 Sample Descriptions for ASSESS Normative Templates ............................................................................................................. 98

1
1 : Background Introduction
In a typical assessment situation in organizations, the candidate is given a battery of standard ability tests and personality inventories (work-oriented instruments designed to measure characteristics related to good decision making and effective job performance in professional and managerial jobs, not clinical instruments such as the MMPI). These tests are scored and evaluated, and a psychologist carefully interprets the results to write a detailed assessment report for the client. ASSESS is an expert system designed to model the judgments of psychologists in the interpretation of an assessment test battery and in the writing of reports based on these judgments. These judgments have been developed through Bigby, Havis & Associates’ (BHA) experience in assessing over 35,000 managerial and professional candidates, from working closely with professionals and managers in developmental contexts, and from our general consulting work in client companies. The ASSESS system is a knowledge-based expert system - a set of computer programs, a normative data base, and a set of complex, profile-level logic rules designed to model assessment result interpretation. Surveys and tests are administered, scored, normed and evaluated. Judgments are made, via the “rules,” and reports are produced in a few minutes, via the Internet, at a fraction of the expense of a traditional assessment. BHA psychologists have spent over 25 years refining the logic of the ASSESS system so that it can be used in this manner to make predictions that are: 1) based on good professional judgment and substantial research, 2) fair to the individual assessed regardless of his/her race, age, or gender, and 3) job relevant. The ASSESS Expert System uses well-researched personality surveys and may incorporate standard abilities tests as the basis for its profiles and reports. Since hiring, promotion, placement, and developmental decisions are made using ASSESS reports, it is important that these instruments are reliable, valid, and fair. In addition to exploring the philosophy behind ASSESS, this technical manual summarizes validation and research data for the personality and ability tests used by ASSESS as well as the validation of “success profiles” that have been developed for specific job positions. About the ASSESS Expert System
An expert system is a computer program that makes complex decisions from multiple sources of information in a way that is similar to the judgment of experts. In the case of ASSESS, the judgment of BHA psychologists has been “captured” by the logic rules of the system. This captured logic is used to evaluate and interpret scores from standardized personality, and optional ability tests, and make complex, profile-level judgments. ASSESS then uses these judgments to write selection, and development reports in a manner similar to those written directly by a BHA psychologist.

2
Technically speaking, ASSESS is a knowledge-based expert system, not artificial intelligence. That is, we have explicitly developed the logic rules to match the judgment of our experts. ASSESS does not “learn” on its own as would an artificially intelligent system. The diagram below outlines the main components of the ASSESS Expert System. Demographic information, personality survey responses (and optional ability test scores) serve as input into the rules processing “engine.” The heart of the ASSESS system consists of a rules file, a normative database (over 35,000 cases), a competency library, job specific templates and success profiles, and the engine which processes normed scores against the logic rules to write assessment reports. The “output” from ASSESS is a variety of report types. (ASSESS also maintains a database of results for future use.)
The Rules
The industrial/organizational psychologists of BHA are trained to interpret personality and ability test responses and make judgments from this information. ASSESS captures the judgments of BHA psychologists in a series of "rules" statements. These rules contain descriptive sentences which directly relate to scores from the ASSESS personality
Demographic Information Intellectual Ability Scores (optional)
ASSESS Personality Responses
“Engine”
Logic rules for Standard or Competency-based Reports
Professional Norms
Report Written Job Specific Templates and
Success Profiles Competency
Library
Database
Selection Reports Development Reports

3
and abilities tests. A certain configuration of scores on a set of personality scales, for example, generates specific statements that are descriptive of people who respond in the way they did to the personality items.
ASSESS Professional Norms
How does ASSESS interpret raw responses? Personality items are grouped into scales (Assertiveness, for example) and are scored in a manner that indicates “amount” of the personality characteristic (low vs. high assertiveness, for example). Ability test responses are scored according to the publisher’s instructions and total scores are then input into the ASSESS system for interpretation. ASSESS “makes sense” of the ability test scores and the personality scale scores by comparing them to a set of professional norms to “look up” percentile scores. For example, 75th percentile on the Assertiveness scale indicates a score higher than 75 percent of the professionals in the ASSESS norm database. These percentile scores are then used by the ASSESS rules engine to make judgments and write reports. The ASSESS professional norms are based on the responses of professional level job candidates (i.e., people who are applying for jobs which generally require education or training beyond the high school level, which are generally salaried rather than hourly, and which generally involve personal responsibility for important job outcomes). The ASSESS normative database includes data for over 40,000 professionals and managers across a wide variety of industries
ASSESS Rule Complexity
Most of the judgments made by ASSESS and the corresponding statements written in the ASSESS reports are based on profile-level interpretation of results. That is, instead of evaluating a single ability or personality scale score, ASSESS considers results on several different measures (typically 2-5). These “interactions” or “profile segments” drive most of the statements written by ASSESS. The diagram on the next page is an example of how the ASSESS rules logic works. It is a partial representation of the logic tree used for a paragraph written in the Relating section of the Selection Report. The paragraph addresses the interplay between the characteristic of Friendliness (Need to be Liked) and Assertiveness with potential moderation by Objectivity (Fact-based Thinking) and Personal Relations (Positive about People). Six paragraphs are displayed in the example. The full ASSESS rules file selects from among 16 possible paragraphs for this position in the Selection Report.

4
Example Portion of the ASSESS Rules Files This example illustrates only one of the rule sets associated with a specific section within the Selection Report. Most of the Selection Report and the other report types are “written” in a similar profile-level manner.
Friendliness (Need to be Liked)
(75-100%)
(60-74%)
(40-59%)
(25-39%)
(10-24%)
(0-9%)
Assertiveness
Assertiveness
(65-100%)
(25-64%)
(0-24%)
(90-100%)
(65-89%)
(0-64%)
He describes himself as being very friendly and agreeable, but also assertive. While he wants to be liked and to avoid unnecessary disagreements, he can be forceful when he needs to be.
Personal Relations (Positive About
People)
Objectivity (Criticism
Tolerance)
He describes himself as being less friendly and agreeable than most professionals and is likely to be unconcerned about whether he pleases people. Without proper self-control, he is apt to be overly unpleasant and disagreeable.
(25-100%)
(0-24%)
(31-100%)
(0-30%)
He describes himself as being very friendly and agreeable. He probably likes to please people and is apt to go out of his way to avoid conflict. His desire to please others should result in people responding favorably to him; however, this attribute may also decrease his willingness to make negative or tough decisions regarding people.
He describes himself as having a strong need to be liked and will probably try to avoid conflict. While he may be skeptical and hesitant to trust people, he will try to get along and will want others to view him favorably.
He describes himself as being less friendly and agreeable than most professionals and is likely to be unconcerned about whether he pleases people. Without proper self-control, he is apt to be overly unpleasant and disagreeable. He also appears to be a very competitive person who enjoys winning. If not moderated or controlled, this competitiveness may carry over into aggressive, insensitive behavior.
He describes himself as being less friendly and agreeable than most professionals and is likely to be unconcerned about whether he pleases people. Without proper self-control, he is apt to be overly unpleasant and disagreeable. He also appears to be a very competitive person who enjoys winning. If not moderated or controlled, this competitiveness is likely to have strongly aggressive and me-first overtones, perhaps to the point of ruthless attacks on competitors or others who cross him.
5
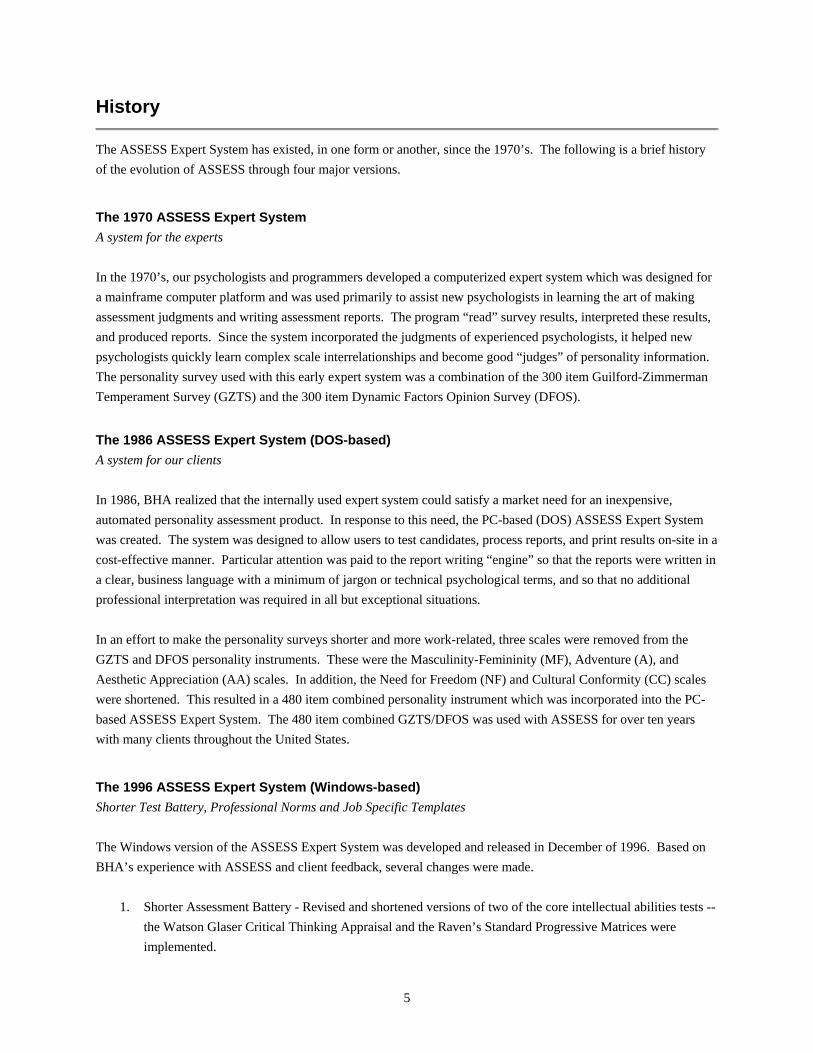
History
The ASSESS Expert System has existed, in one form or another, since the 1970’s. The following is a brief history of the evolution of ASSESS through four major versions.
The 1970 ASSESS Expert System A system for the experts In the 1970’s, our psychologists and programmers developed a computerized expert system which was designed for a mainframe computer platform and was used primarily to assist new psychologists in learning the art of making assessment judgments and writing assessment reports. The program “read” survey results, interpreted these results, and produced reports. Since the system incorporated the judgments of experienced psychologists, it helped new psychologists quickly learn complex scale interrelationships and become good “judges” of personality information. The personality survey used with this early expert system was a combination of the 300 item Guilford-Zimmerman Temperament Survey (GZTS) and the 300 item Dynamic Factors Opinion Survey (DFOS).
The 1986 ASSESS Expert System (DOS-based) A system for our clients In 1986, BHA realized that the internally used expert system could satisfy a market need for an inexpensive, automated personality assessment product. In response to this need, the PC-based (DOS) ASSESS Expert System was created. The system was designed to allow users to test candidates, process reports, and print results on-site in a cost-effective manner. Particular attention was paid to the report writing “engine” so that the reports were written in a clear, business language with a minimum of jargon or technical psychological terms, and so that no additional professional interpretation was required in all but exceptional situations. In an effort to make the personality surveys shorter and more work-related, three scales were removed from the GZTS and DFOS personality instruments. These were the Masculinity-Femininity (MF), Adventure (A), and Aesthetic Appreciation (AA) scales. In addition, the Need for Freedom (NF) and Cultural Conformity (CC) scales were shortened. This resulted in a 480 item combined personality instrument which was incorporated into the PC-based ASSESS Expert System. The 480 item combined GZTS/DFOS was used with ASSESS for over ten years with many clients throughout the United States.
The 1996 ASSESS Expert System (Windows-based) Shorter Test Battery, Professional Norms and Job Specific Templates The Windows version of the ASSESS Expert System was developed and released in December of 1996. Based on BHA’s experience with ASSESS and client feedback, several changes were made.
1. Shorter Assessment Battery - Revised and shortened versions of two of the core intellectual abilities tests -- the Watson Glaser Critical Thinking Appraisal and the Raven’s Standard Progressive Matrices were implemented.
6
The personality survey was refined and abridged using professional judgment (e.g., ADA and EEOC compliance) and statistical analysis. The development of the ASSESS Personality Survey is detailed in Chapter 2.
2. Comparison to Professional Norms - While prior releases of ASSESS allowed for comparison of survey
results to general population and administrative norms as well as professional, managerial and sales norms, the current release utilizes a simple, broad professional norm group (including professionals, supervisors and managers). Candidates’ responses are evaluated compared with this general professional norm group.
3. Templates - To permit comparison of candidates’ results within specific professional/managerial positions,
the ASSESS template feature was added.
ASSESS reports, beginning with this revision, reflected the understanding that abilities and personality characteristics do not change when one’s job does. Instead, the impact of certain personality traits may change with the job. For example, an assertive professional is still assertive regardless of her job. This high level of assertiveness may be beneficial in sales, but possibly detrimental in accounting. Although the individual’s level of assertiveness does not change, its impact may. For this reason, the new ASSESS reports also provided templates to help the user examine the potential impact of a candidate’s characteristics on a particular job type. (A more detailed discussion of ASSESS templates follows in a later section).
The 1999 ASSESS Expert System (Internet) Assessment via the Web In January 1999 we launched the Internet version of ASSESS. Based on the opportunities afforded by the web the following revisions were made:
1. Candidates could now complete the ASSESS Personality Survey anytime, anywhere with an Internet connection using client provided access codes.
2. Clients could now process results, anytime, anywhere with an Internet connection and User access codes.
3. Centralized database for the client.
4. Refined report format using html.
5. The ASSESS Survey site and User site were now offered in multiple languages (Spanish and French Canadian).

7
2001 Update: Re-labeling of Report Sections and Scale Names
While ASSESS is a work-personality survey, with no clinical measurement possible some concerns were raised by psychologists and client organizations, particularly those in California, that the Emotional Style section of ASSESS might be misinterpreted under ADA as a clinical measure of "mental health." In order to avoid any misunderstanding of the results, in February 2001 we reorganized the report under the general headings of Thinking, Working and Relating and made some minor adjustments to scale names. These changes included:
• Those measures previously reported under Emotional Style (emotional evenness, frustration tolerance, criticism tolerance and self-control) will be reported, more appropriately, as part of the Working or Relating sections.
• The Emotional Evenness scale label has been changed to a more appropriate label of Optimism. Report content has been modified as well.
• The Special Interpretation Note in the Selection Report has been removed. We did this to avoid any misinterpretation of the meaning of the note that might imply emotional/clinical issues. Further, in almost all selection cases, clients were prohibited by law from exploring the cause of the results.
Review of ASSESS Professional Norms and Updating of Ability Test Norms; Additional Templates
With the centralizing of the ASSESS database in 1999, the ASSESS normative database grew quickly to a sample size of over 30,000 respondents. We reviewed the responses of the underlying professional norm group (the group used as the general comparison point for ASSESS) to ensure it is representative of today's workforce.
• We found the distributions (percentiles for the comparative group) for the personality characteristics on the ASSESS Personality Survey to be unchanged.
• We found slight differences in the distributions of all the intellectual abilities tests from our prior norm base. We revised the ASSESS ability norm base to best represent these changes in the current workforce. Under the new norms, percentile scores will be slightly higher and there will be less adverse impact.
We also reviewed the normative database and found sufficient sample sizes to expand the ASSESS Template offerings to include 73 different job and industry specific templates. The addition of these templates made it easier to evaluate the person's fit with the job role. A detailed description of ASSESS templates is presented in Chapter 6. These templates are categorized in the following occupational families/industries:
• Accounting • Administrative • Architecture • Consulting • Engineering • Executives • Finance • Grocery

8
• Health Care • Hospitality • Human Resources • Insurance • Information Systems • Legal • Management • Manufacturing & Production • Marketing, Advertising, Public Relations • Real Estate & Property • Retail • Sales
The 2003 ASSESS Expert System v2 Competency-based Selection and Development Report in addition to a Standard Selection and Development Report, Inclusion of Experimental Scales into the reports ASSESS v2 was released in May of 2003 in response to an increasing need in the marketplace to link assessment results to competency models. It was our experience that a growing number of organizations who utilize competency models (i.e., job specific models, leadership models, enterprise wide models, etc.) as the strategic basis of their HR processes wanted to be able to link assessment results to these models to maintain and leverage a common language throughout HR practices. In fact, in the prior 2-3 years we had, on a custom basis, adapted ASSESS for select clients so that assessment reports spoke to how personality characteristics or abilities would help or hinder the display or development of key competencies. ASSESS v2 provides a new, flexible interface that quickly allows the tailoring of the ASSESS system to produce custom reports that speak directly to an organization’s competency model(s), or the processing of standard ASSESS reports modeled after traditional assessment. The competency library which underlies the ASSESS competency reports and the process to link ASSESS characteristics to these competencies are described in Chapter 3.

9
2 : T h e A S S E S S P e r s o n a l i t y S u r v e y
The main component of ASSESS is the personality survey. The ASSESS Personality Survey is adapted from two widely used, work-related personality assessments tools: The Guilford-Zimmerman Temperament Survey (GZTS), the Dynamic Factors Opinion Survey (DFOS), and also includes BHA developed scales. Since the GZTS and DFOS are the foundation of the ASSESS expert system, how these instruments were developed and their validity are important to the confident use of ASSESS. In the first section of this chapter we will provide construct validity information regarding the GZTS and the DFOS. In the latter section we will describe how BHA abridged these instruments to create the ASSESS Personality Survey, and the additional scales we have developed. The Guilford-Zimmerman Temperament Survey
The GZTS is one of the most widely used inventories available. A major handbook has been written discussing its use, reliability, and validity (Guilford, Zimmerman, and Guilford, 1976). Guilford, et al. (op. cit.) devoted 38 pages to a review and discussion of intercorrelations among GZTS scales, scales from other psychological tests, and behavior ratings. While direct comparisons of scales among tests, and correlations of scales with ratings is a complex research problem, the authors draw two important conclusions. First, relationships between the GZTS scales and scales from other personality inventories are in reasonable agreement with expected results. That is, correlations for very similar scales are generally high (e.g., .70 between the GZTS S scale and the CPI Sociability scale). Second, correlations between GZTS scale scores and peer and self ratings of corresponding attributes range from about .30 to .65. These findings support the conclusion that the test scales do, in fact, measure what they purport to measure. For a more detailed discussion of the development and validation of the GZTS, the reader is referred to this handbook. A number of researchers have examined the factor structure of GZTS total scale scores. The table below shows how these scales are most consistently grouped; the nine scales shown below are most often involved. The summary factor including Sociability (S) and Ascendance (A) occurs most consistently and General Activity (G) often accompanies this group with a somewhat smaller loading. The Introversion - Extroversion label is applied to the cluster containing Restraint (R) and Thoughtfulness (T), but is not directly in line with Eysenck’s conception of Introversion - Extroversion which has a stronger social component. The grouping with R and T is consistent with these dimensions and pertains to inwardly directed thought versus outwardly directed behavior. The Emotional Maturity factor contains Emotional Stability (E), Objectivity (O), Friendliness (F), and Personal Relations (P). E and O show much stronger correlations and some researchers report two second-order factors separating E and O from F and P (Guilford, Zimmerman, & Guilford, 1976).

10
Table 1: Summary of Loadings of the GZTS Scales on Higher Order Factors Found in the Factor Analysis of Total Scores
Investigators Introversion Extroversion
Social Activity
Emotional Maturity
R T A S G E O F P
Baker & Schutz (1961) n=125 ns ns .88 .83 .72 .78 .87 .78 .74
Barratt (1965) n=223 .86 x .70 x .33 .84 .77 x x
Barrett (1958) n=100 .72 .53 .79 .77 .39 .65 .84 .53 .56
Bendig (1960) n=100 .68 .69 .77 .85 .54 .77 .90 .57 .62
Bendig (1962a) n=100 .48 .66 .46 .69 ns .65 .59 .73 .64
Bendig (1962b) n=100 .63 .56 .77 .73 ns .51 .36 .45 .52
Bendig & Meyers (1963) n=100 .62 .50 .73 .62 .38 .73 .69 .74 .60
Borgotta (1962) n=114 x .46 .82 .89 .62 .77 .65 x x
Kelly (1960) n=100 .67 .72 .83 .77 .62 .80 .88 .60 .65
Krug & Moyer (1961) n=684 .71 .76 .82 .80 .49 .69 .82 .53 .47
Marks, Michael & Kaiser (1961) n=204
.79 .73 .79 .77 .74 .66 .73 .77 .58
Singer & Antrobus (1963) n=100 ns ns .67 .79 .56 .53 .45 ns ns
Sparks (1974) n=2478 .55 .74 .85 .82 .55 .46 .58 .65 .73
Stagner (1962) n=356 ns ns .82 .80 .66 .35 .72 .87 .58
ns - loading for scale was non-significant x - scale was not analyzed in study
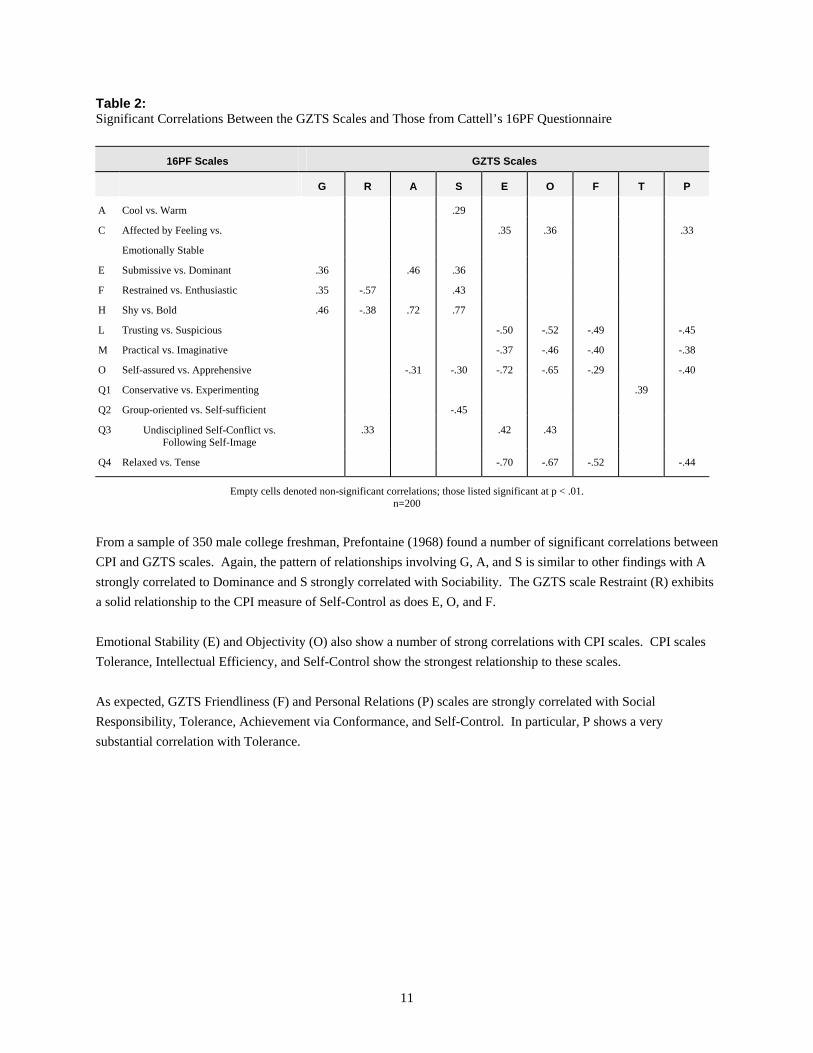
A number of studies have been conducted correlating GZTS scales with scales of other well-respected personality assessment tools. As mentioned previously, evidence of construct validity is accumulated from many sources. Kelly (1960) correlated GZTS and Cattell 16PF trait scores with a sample of 100 men and 100 women. All the GZTS scales are involved in at least one significant relationship and their clustering is not unlike the two higher order factors shown in the previously discussed factor analysis. A and S, and to a lesser extent G, tend to be more correlated with similar Cattell constructs (i.e., dominance, boldness, and confidence). E, O, F, and P show strong relationship to factors having to do with tension, insecurity, and negative affect.
11
Table 2: Significant Correlations Between the GZTS Scales and Those from Cattell’s 16PF Questionnaire
16PF Scales GZTS Scales
G R A S E O F T P
A Cool vs. Warm .29
C Affected by Feeling vs.
Emotionally Stable
.35 .36 .33
E Submissive vs. Dominant .36 .46 .36
F Restrained vs. Enthusiastic .35 -.57 .43
H Shy vs. Bold .46 -.38 .72 .77
L Trusting vs. Suspicious -.50 -.52 -.49 -.45
M Practical vs. Imaginative -.37 -.46 -.40 -.38
O Self-assured vs. Apprehensive -.31 -.30 -.72 -.65 -.29 -.40
Q1 Conservative vs. Experimenting .39
Q2 Group-oriented vs. Self-sufficient -.45
Q3 Undisciplined Self-Conflict vs. Following Self-Image
.33 .42 .43
Q4 Relaxed vs. Tense -.70 -.67 -.52 -.44
Empty cells denoted non-significant correlations; those listed significant at p < .01. n=200
From a sample of 350 male college freshman, Prefontaine (1968) found a number of significant correlations between CPI and GZTS scales. Again, the pattern of relationships involving G, A, and S is similar to other findings with A strongly correlated to Dominance and S strongly correlated with Sociability. The GZTS scale Restraint (R) exhibits a solid relationship to the CPI measure of Self-Control as does E, O, and F. Emotional Stability (E) and Objectivity (O) also show a number of strong correlations with CPI scales. CPI scales Tolerance, Intellectual Efficiency, and Self-Control show the strongest relationship to these scales. As expected, GZTS Friendliness (F) and Personal Relations (P) scales are strongly correlated with Social Responsibility, Tolerance, Achievement via Conformance, and Self-Control. In particular, P shows a very substantial correlation with Tolerance.

12
Table 3: Significant Correlations Between the GZTS Scales and those from the California Psychological Inventory (CPI)
CPI Scales GZTS Scales
G R A S E O F T P
Social Responsibility .37 .15 .35 .36 .39 .18 .42
Tolerance .19 .35 .29 .57 .65 .38 .62
Flexibility -.18 .22 .19 -.27 .15
Capacity for Status .28 .55 .53 .47 .47 .26 .37
Dominance .45 .71 .63 .45 .32 .22
Sociability .43 -.15 .66 .70 .49 .35 .21
Socialization .30 .16 .31 .24 .19 .36
Intellectual Efficiency .15 .41 .35 .53 .60 .26 .49
Achievement via Independence .36 .35 .25 .53 .50 .36 .20 .51 .24
Achievement via Conformance .30 .16 .40 .51 .40 .48
Psychological-Minded .25 .16 .40 .19 .46 .48 .23 .33
Social Presence .33 -.38 .52 .55 .41 .33 -.17 .20
Self-Control .47 .52 .56 .57 .15 .51
Self-Acceptance .31 -.19 .55 .59 .34 .22 -.19 -.21
Empty cells denoted non-significant correlations; those listed significant at p < .01 n=350 Although the Edward Personal Preference Survey was designed to measure somewhat different constructs from those of the GZTS, similar patterns of relationship are seen. GZTS Ascendence and EPPS Dominance are strongly correlated, and GZTS Friendliness and EPPS Aggression shows a very significant inverse relationship. While the GZTS scale Thoughtfulness does not often show relationship with similar measures, it is significantly correlated with the EPPS measure of Intraception, which is defined as the ability to analyze the motives and feelings of others.

13
Table 4: Significant Correlations Between the GZTS Scales and those from the Edward Personal Preference Survey (EPPS)
EPPS Scales GZTS Scales
G R A S E O F T P
Def Deference -.26 -.27 .26
Ord Order -.27 -.22
Aut Autonomy -.24
Aff Affiliation .29
Int Intraception .33
Suc Succorance -.25
Dom Dominance .52 .23 .28 .24 .24
Aba Abasement -.35 -.25
Nur Nurturance .23
End Endurance .34 .22
Agg Aggression -.27 -.27 -.50 -.29
Empty cells denoted non-significant correlations; those listed significant at p < .01. n=145

14
The Dynamic Factors Opinion Survey
The DFOS was also developed by Guilford (Guilford & Martin, 1944) and its focus is on the assessment of motivational dispositions and human needs (e.g., Need for Attention). As with the GZTS, the DFOS has a manual which offers administration instructions, normative information, and interpretation assistance (Guilford, Christensen, and Bond, 1956). Many of the constructs measured by the DFOS were derived from the theory and research of Murray (1938). Using factor analysis, Guilford and Martin derived ten factors, but in the most recently published ASSESS instrument, only seven personality scales are used (Aesthetic Appreciation, Adventure vs. Security, and Need for Diversion were dropped due to their inappropriateness to work settings). The factors measured in the DFOS were derived from 1000 items used in a large factor analytic study conducted by Guilford and his colleagues (Guilford, Christensen & Bond, 1956). Their original sample consisted of 720 US Air Force cadets, AFROTC graduates, and OCS candidates. The table below shows the DFOS scales, their respective subfactors, and accompanying factor loadings. Table 5: Factor Structure and Loadings of DFOS Scales
DFOS Scales Subfactors Factor Loading
CC Cultural Conformity Conformity Maintenance of Discipline Conscience Satisfaction No-Nonsense Competition
.62
.55
.54
.45
.37
LT Liking for Thinking Mathematical Concepts Logical Processes Organizing Problem-Solving
.52
.50
.46
.42
NA Need for Attention Recognition Status Exhibition
.54
.49
.36
NF Need for Freedom Non-conformity Aversion to Organizing Independence Disorderliness
.56
.46
.34
.30
NP Need for Precision Exactness Laboratory Procedures Detail
.65
.52
.38
RT Realistic Thinking Humor Appreciation Autistic Thinking Displaced Aggression Amusement
-.74 -.56 -.55 -.35
SR Self-Reliance Dependability Subservience Dependence Succorance Self-Reliance
.55 -.50 -.41 -.33 .31
(n = 720)

15
Development of the ASSESS Personality Battery
The ASSESS Personality Battery contains 350 items measuring 16 personality characteristics. These items were selected from the GZTS and DFOS surveys to create a shortened and improved personality survey. The following section details the steps undertaken to develop the personality survey.
1996 Shortened and Improved Personality Survey (480 to 350 items)
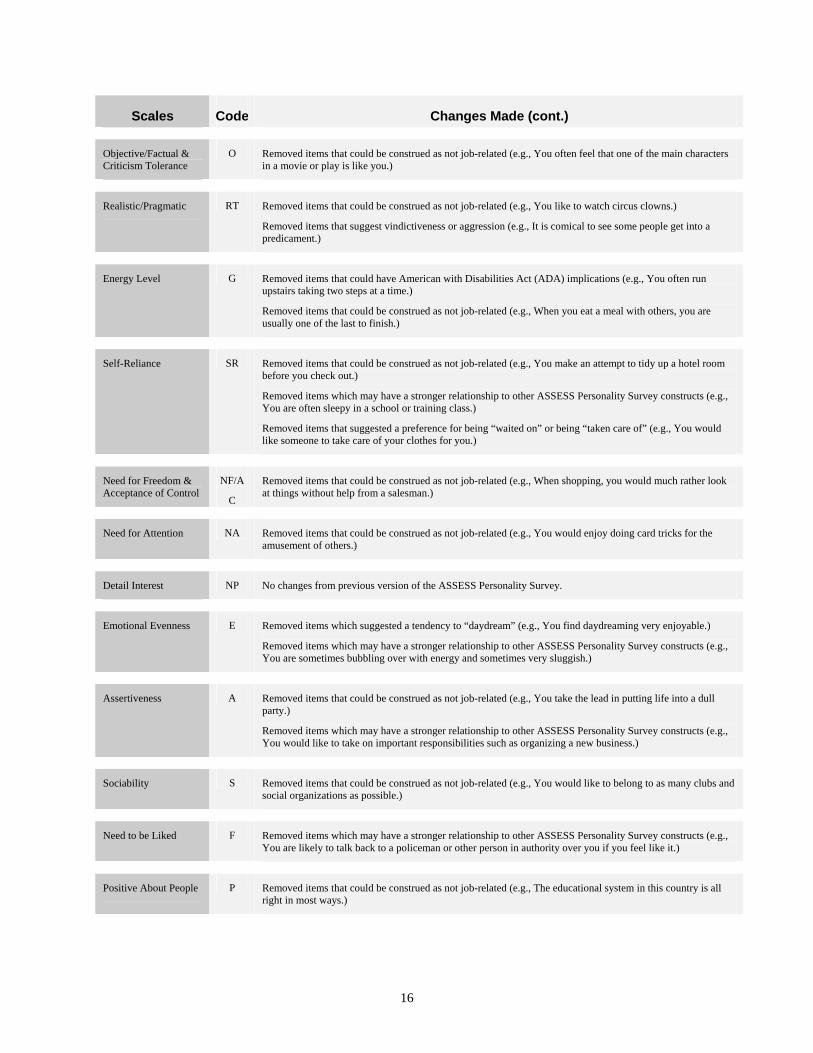
BHA’s experience with ASSESS and clients’ requests for shorter test administration time led to an effort to refine and abridge the personality survey using professional judgment and statistical procedures. First, all items were examined for their compliance with rules and precedents related to the Equal Employment Opportunity Commission (EEOC), Americans with Disabilities Act (ADA), invasion of privacy, and other legal and ethical standards. Items which were thought to be questionable, when measured against compliance criteria, were eliminated from the new ASSESS survey. As an example, an item previously included in the General Activity (Energy) scale was worded, “You often run upstairs taking two steps at a time.” This item was thought, obviously, to have ADA implications since physically-challenged people who rely on wheelchairs for mobility do not use stairs. Items like this were removed from the personality survey. Next, BHA psychologists reviewed how well each item supported the construct that it was purported to measure. Those which appeared convoluted, that is, related to more than one construct, were removed. The original items used in the GZTS and DFOS were created in the 1950’s, and some items appear dated; these items were changed to reflect more modern language usage. Further, in an effort to improve the face validity of individual items, BHA sought to delete those that sounded non-work related. The list on the following pages describes some of the changes made to scales and their items as a result of this review.
Scales Code Changes Made
Reflective/Probing & Insight
T Removed items that could be construed as not job-related (e.g., You would rather spend an evening reading at home than attend a large party.)
Removed items which may have a stronger relationship to other ASSESS Personality Survey constructs (e.g., You like a job that requires attention to many details.)
Organized/Structured LT Removed items that could be construed as not job-related (e.g., You like to figure out the secret of magic tricks.)
Removed items which may have a stronger relationship to other ASSESS Personality Survey constructs (e.g., You like to figure out the reasons people behave the way they do.)
Removed items that suggested jobs or task that are potentially unrelated to most common jobs (e.g., You would like to calculate the paths of projectiles.)
Serious/Restrained & Emotional Control
R Removed items that could be construed as not job-related (e.g., You like parties you attend to be lively.)
Removed items which may have a stronger relationship to other ASSESS Personality Survey constructs (e.g., You like work that requires considerable attention to details.)
Removed items that used slang or colloquialisms (e.g., You sometimes find yourself “leaping before you look.”)
16
Scales Code Changes Made (cont.)
Objective/Factual & Criticism Tolerance
O Removed items that could be construed as not job-related (e.g., You often feel that one of the main characters in a movie or play is like you.)
Realistic/Pragmatic RT Removed items that could be construed as not job-related (e.g., You like to watch circus clowns.)
Removed items that suggest vindictiveness or aggression (e.g., It is comical to see some people get into a predicament.)
Energy Level G Removed items that could have American with Disabilities Act (ADA) implications (e.g., You often run upstairs taking two steps at a time.)
Removed items that could be construed as not job-related (e.g., When you eat a meal with others, you are usually one of the last to finish.)
Self-Reliance SR Removed items that could be construed as not job-related (e.g., You make an attempt to tidy up a hotel room before you check out.)
Removed items which may have a stronger relationship to other ASSESS Personality Survey constructs (e.g., You are often sleepy in a school or training class.)
Removed items that suggested a preference for being “waited on” or being “taken care of” (e.g., You would like someone to take care of your clothes for you.)
Need for Freedom & Acceptance of Control
NF/A
C
Removed items that could be construed as not job-related (e.g., When shopping, you would much rather look at things without help from a salesman.)
Need for Attention NA Removed items that could be construed as not job-related (e.g., You would enjoy doing card tricks for the amusement of others.)
Detail Interest NP No changes from previous version of the ASSESS Personality Survey.
Emotional Evenness E Removed items which suggested a tendency to “daydream” (e.g., You find daydreaming very enjoyable.)
Removed items which may have a stronger relationship to other ASSESS Personality Survey constructs (e.g., You are sometimes bubbling over with energy and sometimes very sluggish.)
Assertiveness A Removed items that could be construed as not job-related (e.g., You take the lead in putting life into a dull party.)
Removed items which may have a stronger relationship to other ASSESS Personality Survey constructs (e.g., You would like to take on important responsibilities such as organizing a new business.)
Sociability S Removed items that could be construed as not job-related (e.g., You would like to belong to as many clubs and social organizations as possible.)
Need to be Liked F Removed items which may have a stronger relationship to other ASSESS Personality Survey constructs (e.g., You are likely to talk back to a policeman or other person in authority over you if you feel like it.)
Positive About People P Removed items that could be construed as not job-related (e.g., The educational system in this country is all right in most ways.)
17
Scales Code Changes Made (cont.)
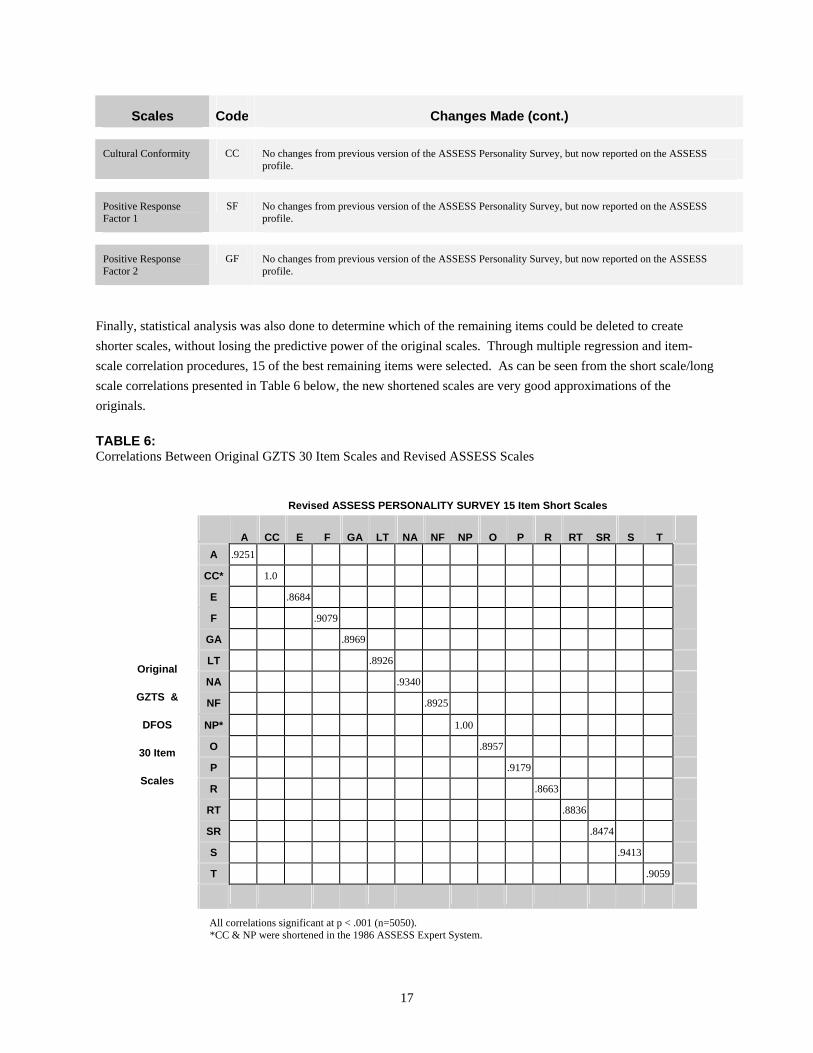
Cultural Conformity CC No changes from previous version of the ASSESS Personality Survey, but now reported on the ASSESS
profile.
Positive Response Factor 1
SF No changes from previous version of the ASSESS Personality Survey, but now reported on the ASSESS profile.
Positive Response Factor 2
GF No changes from previous version of the ASSESS Personality Survey, but now reported on the ASSESS profile.
Finally, statistical analysis was also done to determine which of the remaining items could be deleted to create shorter scales, without losing the predictive power of the original scales. Through multiple regression and item-scale correlation procedures, 15 of the best remaining items were selected. As can be seen from the short scale/long scale correlations presented in Table 6 below, the new shortened scales are very good approximations of the originals. TABLE 6: Correlations Between Original GZTS 30 Item Scales and Revised ASSESS Scales
Revised ASSESS PERSONALITY SURVEY 15 Item Short Scales
A CC E F GA LT NA NF NP O P R RT SR S T
A .9251
CC* 1.0
E .8684
F .9079
GA .8969
LT .8926
NA .9340
NF .8925
NP* 1.00
O .8957
P .9179
R .8663
RT .8836
SR .8474
S .9413
T .9059
Original
GZTS &
DFOS
30 Item
Scales
All correlations significant at p < .001 (n=5050). *CC & NP were shortened in the 1986 ASSESS Expert System.
18
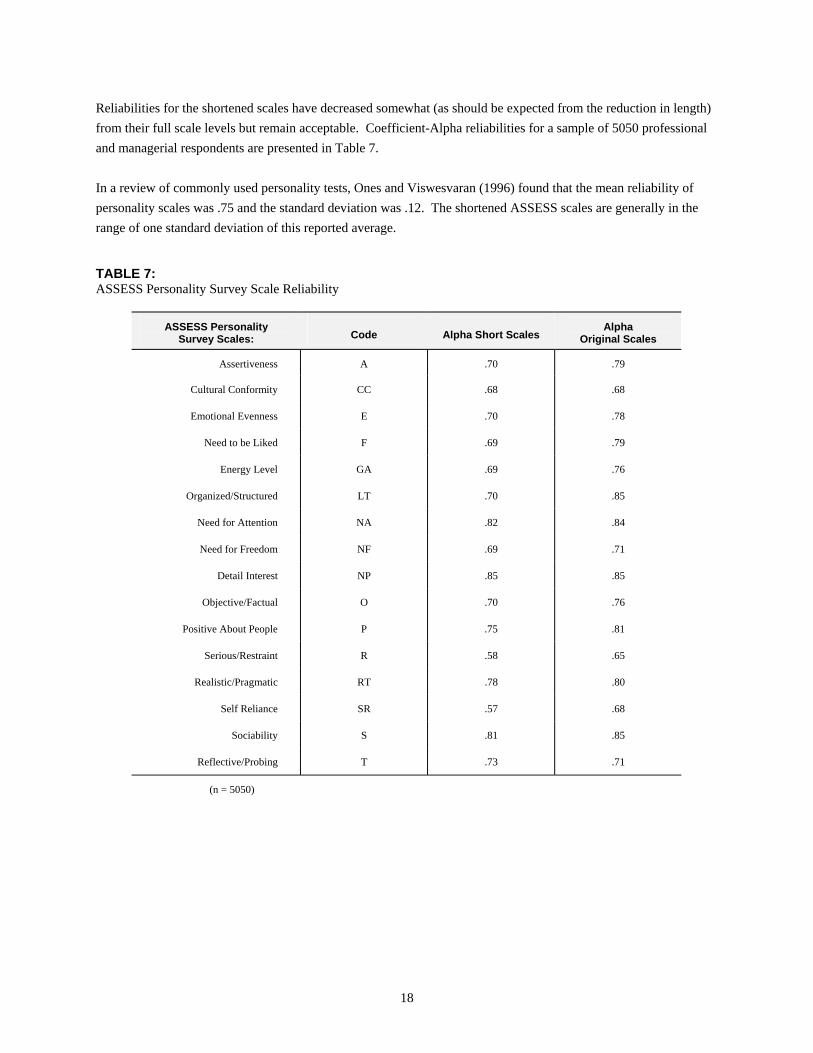
Reliabilities for the shortened scales have decreased somewhat (as should be expected from the reduction in length) from their full scale levels but remain acceptable. Coefficient-Alpha reliabilities for a sample of 5050 professional and managerial respondents are presented in Table 7. In a review of commonly used personality tests, Ones and Viswesvaran (1996) found that the mean reliability of personality scales was .75 and the standard deviation was .12. The shortened ASSESS scales are generally in the range of one standard deviation of this reported average. TABLE 7: ASSESS Personality Survey Scale Reliability
ASSESS Personality Survey Scales: Code Alpha Short Scales
Alpha Original Scales
Assertiveness A .70 .79
Cultural Conformity CC .68 .68
Emotional Evenness E .70 .78
Need to be Liked F .69 .79
Energy Level GA .69 .76
Organized/Structured LT .70 .85
Need for Attention NA .82 .84
Need for Freedom NF .69 .71
Detail Interest NP .85 .85
Objective/Factual O .70 .76
Positive About People P .75 .81
Serious/Restraint R .58 .65
Realistic/Pragmatic RT .78 .80
Self Reliance SR .57 .68
Sociability S .81 .85
Reflective/Probing T .73 .71
(n = 5050)
19
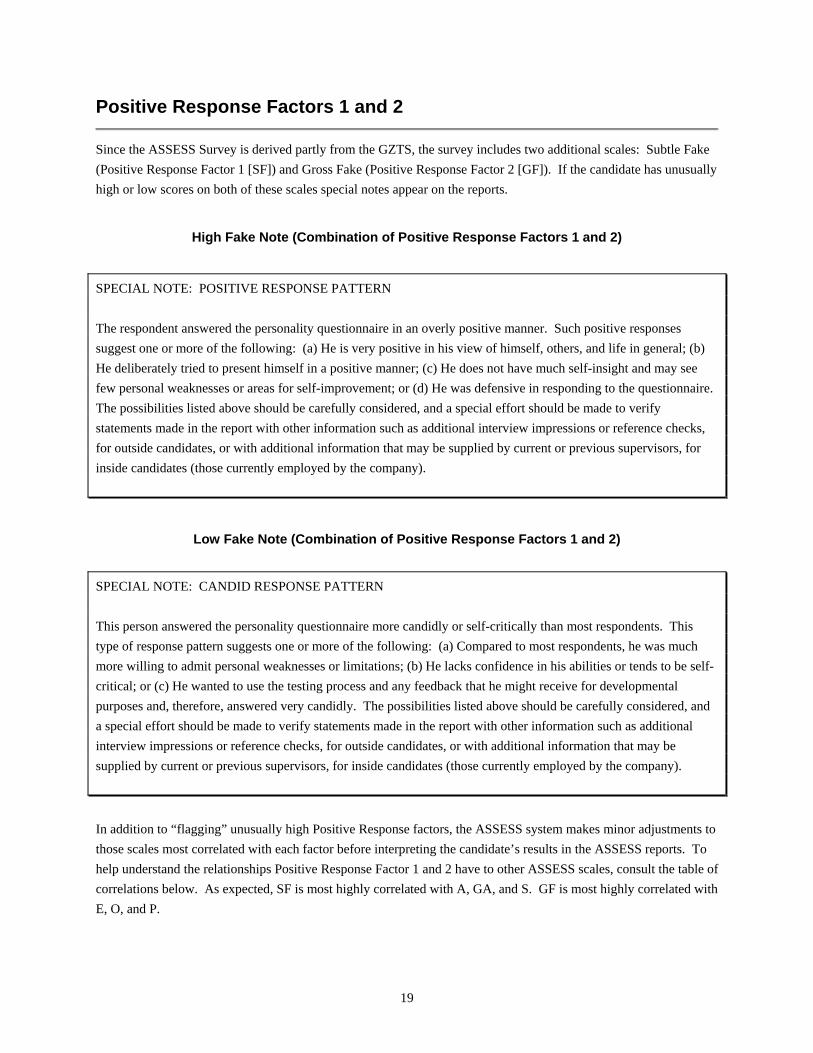
Positive Response Factors 1 and 2
Since the ASSESS Survey is derived partly from the GZTS, the survey includes two additional scales: Subtle Fake (Positive Response Factor 1 [SF]) and Gross Fake (Positive Response Factor 2 [GF]). If the candidate has unusually high or low scores on both of these scales special notes appear on the reports.
High Fake Note (Combination of Positive Response Factors 1 and 2)
SPECIAL NOTE: POSITIVE RESPONSE PATTERN The respondent answered the personality questionnaire in an overly positive manner. Such positive responses suggest one or more of the following: (a) He is very positive in his view of himself, others, and life in general; (b) He deliberately tried to present himself in a positive manner; (c) He does not have much self-insight and may see few personal weaknesses or areas for self-improvement; or (d) He was defensive in responding to the questionnaire. The possibilities listed above should be carefully considered, and a special effort should be made to verify statements made in the report with other information such as additional interview impressions or reference checks, for outside candidates, or with additional information that may be supplied by current or previous supervisors, for inside candidates (those currently employed by the company).
Low Fake Note (Combination of Positive Response Factors 1 and 2)
SPECIAL NOTE: CANDID RESPONSE PATTERN This person answered the personality questionnaire more candidly or self-critically than most respondents. This type of response pattern suggests one or more of the following: (a) Compared to most respondents, he was much more willing to admit personal weaknesses or limitations; (b) He lacks confidence in his abilities or tends to be self-critical; or (c) He wanted to use the testing process and any feedback that he might receive for developmental purposes and, therefore, answered very candidly. The possibilities listed above should be carefully considered, and a special effort should be made to verify statements made in the report with other information such as additional interview impressions or reference checks, for outside candidates, or with additional information that may be supplied by current or previous supervisors, for inside candidates (those currently employed by the company).
In addition to “flagging” unusually high Positive Response factors, the ASSESS system makes minor adjustments to those scales most correlated with each factor before interpreting the candidate’s results in the ASSESS reports. To help understand the relationships Positive Response Factor 1 and 2 have to other ASSESS scales, consult the table of correlations below. As expected, SF is most highly correlated with A, GA, and S. GF is most highly correlated with E, O, and P.

20
Table 8: Correlations Between Positive Response Factors and ASSESS Personality Scales
Scale (Code) Positive Response Factor 1 (SF) Positive Response Factor 2 (GF)
REFLECTIVE/PROBING (T) .004* -.206
ORGANIZED/STRUCTURED (LT) .167 .128
SERIOUS/RESTRAINED (R) .091 .218
OBJECTIVE/FACTUAL (O) .415 .628
REALISTIC/PRAGMATIC (RT) .156 .433
ENERGY LEVEL (GA) .602 .216
SELF RELIANCE (SR) .259 .441
ACCEPTANCE OF CONTROL (AC) .294 .353
PERSONAL FREEDOM (NF) -.294 -.353
ATTENTION/RECOGNITION (NA) .085* -.065*
DETAIL INTEREST (NP) .102 .057
EMOTIONAL EVENNESS (E) .335 .494
CRITICISM TOLERANCE (O) .415 .628
EMOTIONAL CONTROL (R) .091* .218
ASSERTIVENESS (A) .555 .403
SOCIABILITY (S) .588 .340
NEED TO BE LIKED (F) .217 .387
HOW VIEW OTHERS (P) .396 .522
INSIGHT (T) .004* -.206
CULTURAL CONFORMITY (CC) .029* -.171
All correlations significant at p < .05, except *
21
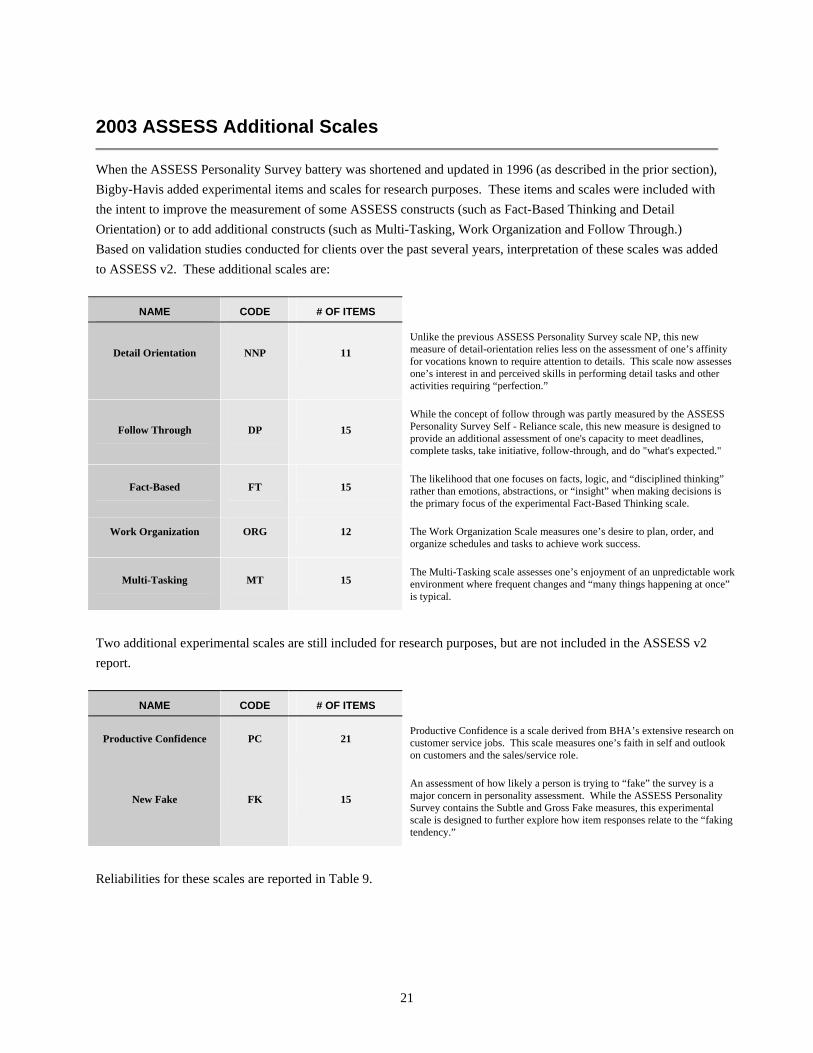
2003 ASSESS Additional Scales
When the ASSESS Personality Survey battery was shortened and updated in 1996 (as described in the prior section), Bigby-Havis added experimental items and scales for research purposes. These items and scales were included with the intent to improve the measurement of some ASSESS constructs (such as Fact-Based Thinking and Detail Orientation) or to add additional constructs (such as Multi-Tasking, Work Organization and Follow Through.) Based on validation studies conducted for clients over the past several years, interpretation of these scales was added to ASSESS v2. These additional scales are:
NAME CODE # OF ITEMS
Detail Orientation NNP 11 Unlike the previous ASSESS Personality Survey scale NP, this new measure of detail-orientation relies less on the assessment of one’s affinity for vocations known to require attention to details. This scale now assesses one’s interest in and perceived skills in performing detail tasks and other activities requiring “perfection.”
Follow Through DP 15 While the concept of follow through was partly measured by the ASSESS Personality Survey Self - Reliance scale, this new measure is designed to provide an additional assessment of one's capacity to meet deadlines, complete tasks, take initiative, follow-through, and do "what's expected."
Fact-Based FT 15 The likelihood that one focuses on facts, logic, and “disciplined thinking” rather than emotions, abstractions, or “insight” when making decisions is the primary focus of the experimental Fact-Based Thinking scale.
Work Organization ORG 12 The Work Organization Scale measures one’s desire to plan, order, and organize schedules and tasks to achieve work success.
Multi-Tasking MT 15 The Multi-Tasking scale assesses one’s enjoyment of an unpredictable work environment where frequent changes and “many things happening at once” is typical.
Two additional experimental scales are still included for research purposes, but are not included in the ASSESS v2 report.
NAME CODE # OF ITEMS
Productive Confidence PC 21 Productive Confidence is a scale derived from BHA’s extensive research on customer service jobs. This scale measures one’s faith in self and outlook on customers and the sales/service role.
New Fake FK 15 An assessment of how likely a person is trying to “fake” the survey is a major concern in personality assessment. While the ASSESS Personality Survey contains the Subtle and Gross Fake measures, this experimental scale is designed to further explore how item responses relate to the “faking tendency.”
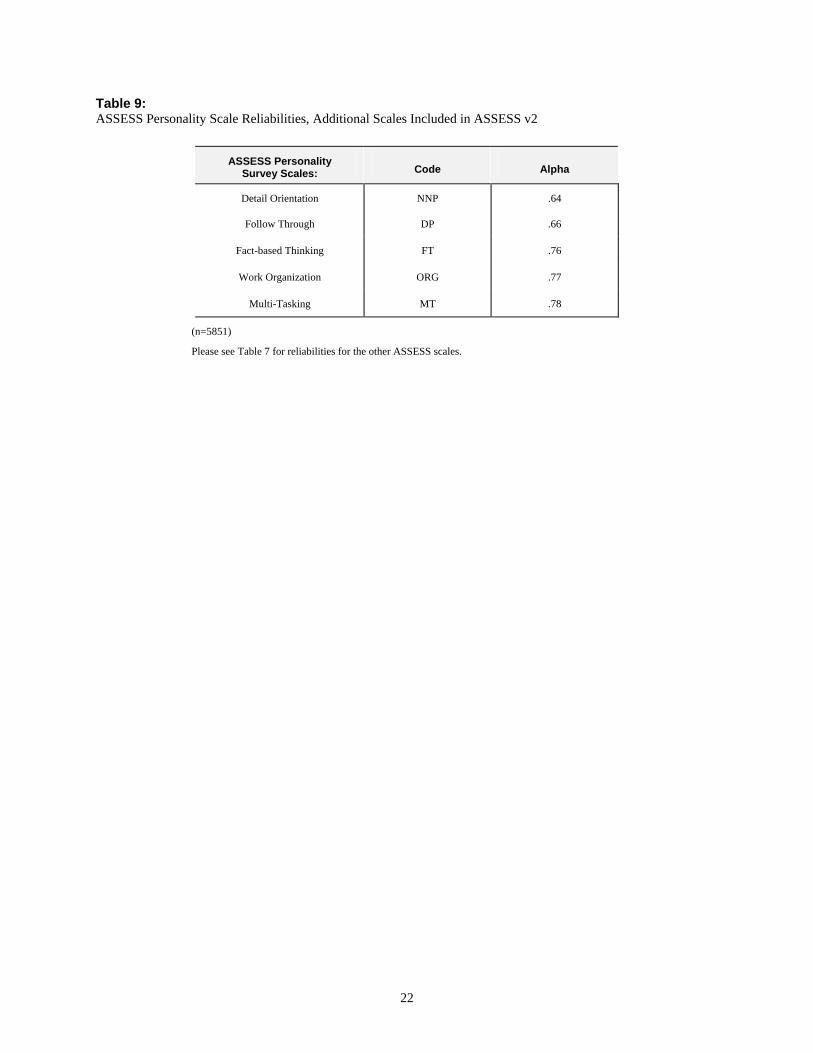
Reliabilities for these scales are reported in Table 9.
22
Table 9: ASSESS Personality Scale Reliabilities, Additional Scales Included in ASSESS v2
ASSESS Personality Survey Scales: Code Alpha
Detail Orientation NNP .64
Follow Through DP .66
Fact-based Thinking FT .76
Work Organization ORG .77
Multi-Tasking MT .78
(n=5851)
Please see Table 7 for reliabilities for the other ASSESS scales.

23
ASSESS Personality Attributes (ASSESS v2) The ASSESS v2 Personality Survey consists of 350 items scored into scales. Score ranges of all ASSESS personality scales are listed in the table below. TABLE 10: Attributes Measured by ASSESS v2, Scale Code, Source of Instrument, and Score Ranges
ATTRIBUTE SCALE CODE SOURCE INSTRUMENT SCORE RANGE
Thinking: Reflective T Thoughtfulness Scale1 0 - 15
Structured LT Liking For Thinking Scale2 0 - 15
Serious- Minded, Restrained R Restraint Scale1 0 - 15
Fact-Based FT Fact-based Thinking Scale3 0 - 15
Realistic RT Realistic Thinking Scale2 0 - 15
Working:
Work Pace GA Energy Scale1 0 - 15
Self Reliance SR Self Reliance Scale2 0 - 13
Work Organization ORG Work Organization Scale3 0 - 12
Multi-Tasking MT Multi-Tasking Scale3 0 - 15
Follow-Through DP Follow-Through Scale3 0 - 15
Acceptance Of Control AC Need For Freedom Scale (Scores Reversed) 2 0 - 15
Frustration Tolerance Computed Scale 0 - 15
Need for Freedom NF Need For Freedom Scale2 0 - 15
Need for Recognition NA Need For Attention Scale2 0 - 15
Detail Orientation NNP Detail Orientation Scale3 0 - 11
Relating: Assertiveness A Ascendancy Scale1 0 - 15
Sociability S Sociability Scale1 0 - 15
Need To Be Liked F Friendliness Scale1 0 - 15
Positive About People P Personal Relations Scale1 0 - 15
Insight T Thoughtfulness Scale1 0 - 15
Optimism E Emotional Evenness Scale1 0 - 15
Criticism Tolerance O Objectivity Scale1 0 - 15
Self-Control Control R Restraint Scale1 0 - 15
Cultural Conformity CC Cultural Conformity Scale 0 - 16
Other Scales: Positive Response Factor 1 SF Subtle Fake Scale1 0 - 38
Positive Response Factor 2 GF Gross Fake Scale1 0 - 30
1 Guilford-Zimmerman Temperament Survey, Copyright © 1976, Sheridan Psychological Services, Copyright © 1995, Consulting Psychologists Press. 2 Dynamic Factors Opinion Survey, Copyright © 1954, Sheridan Supply Company. 3 BHA developed items.

24
For informational purposes, Table 11 below shows the intercorrelations between scales of the ASSESS Personality Survey v2. TABLE 11: Table of Scale Intercorrelations for ASSESS v2.
N =37,242 All correlations signficiant at p < .05 except *. ** Positive Response Factors 1 & 2.
A CC DP E F FT GA LT MT NA NF NNP O ORG P R RT S SR T GF SF
A 1.00
CC -.046 1.00
DP .271 .026 1.00
E .326 -.098 ..375 1.00
F -.066 -.223 .281 .286 1.00
FT -.001* .310 .226 .113 .009* 1.00
GA .351 .083 .275 .217 -.115 .025 1.00
LT .157 .287 .135 .062 -.108 .409 .116 1.00
MT .296 -.200 .207 .221 .149 -.230 .354 .-.106 1.00
NA .223 .170 -.135 -.087 -.436 -.046 .164 .241 -.036 1.00
NF -.080 -.147 -..387 -.235 -,406 -.316 -.031 -.191 .040 .166 1.00
NNP .093 .303 .393 .121 .085 .380 .061 .358 -.105 -.001* -.386 1.00
O .323 -.119 ..442 .580 .393 .138 .201 .061 .264 -.176 -.294 .150 1.00
ORG .075 .309 .298 .093 .065 .420 .030 .391 -.269 .025 -.393 .505 .090 1.00
P .176 -.250 .336 .375 .435 004* .088 -.007 .215 -.184 -.253 .034 .513 .031 1.00
R .002* .070 .277 .033 .123 .246 -.058 .196 -.065 -.111 -.236 .223 .077 .267 .113 1.00
RT .066 -.245 .269 .314 .394 .112 .008* -.123 .121 -.512 -.228 .005* .367 -.012* .340 .219 1.00
S .528 .007* .269 .329 .112 -.041 .332 .082 .254 .178 -.195 .148 .311 .110 .208 -.149 -.001* 1.00
SR .239 -.181 .421 .353 .241 .106 .173 .035 .243 -.227 -.214 .144 .398 .055 .288 .206 .408 .117 1.00
T .054 .213 -.114 -.217 -.210 -.068 .010* .302 -.044 .247 .103 .080 -.216 .098 -.182 .116 -.386 .012 -.205 1.00
GF** .422 -.096 .515 .545 .439 .205 .290 .163 .264 -.085 -.425 .221 .682 .179 ..511 .230 .367 .404 .400 .199 1.00
SF** .523 .072 .435 .387 .290 .121 .591 .204 .310 .058 -.358 .245 .462 .216 .392 .145 .112 .583 .215 -.007* .541 1.00

25
3: ASSESS Personality-Competency Linkages Background
Human Resource processes and systems, like other key components of the organization should directly support the strategic goals and objectives of the organization. The strategic plan should be translated into behavioral objectives that will guide the activities of the people in the organization. This shifts the focus of Human Resource processes from rules to results and “raises the bar” on employee performance by integrating selection, performance management, training, compensation, and promotion. In recent years, many companies have used the concepts of competencies and competency models to define the broad behavioral capabilities necessary to achieve these behavioral objectives. Others have used concepts such as success factors or human capital strategies to describe critical abilities and attributes desired in employees to give the organization a workforce that will be able to achieve strategic goals. A competency can be defined as the underlying sets of skills, knowledge, personal characteristics and abilities needed to effectively perform a role in the organization and help the business to meet its strategic objectives. The combination of these factors lead to defining superior performance and excellence. By using competencies as a basis for performance management, an organization can more effectively align people’s attitudes and behaviors with what is needed to be competitive and successful as an organization. Competency-based Selection and Development Processes
Competency models have multiple advantages. They clarify work expectations for individuals and create a shared understanding of expectations among individuals by using a common language across jobs and the organization. In this way, they clearly communicate consistent standards. In turn, Human Resource systems can be linked to this language to facilitate selection and guide development. Selection processes increase effectiveness and efficiency when each facet of the selection process is designed to evaluate one or more of the competencies needed for the job. For example, defined competencies help recruiters to target and evaluate potential candidates and help the organization to identify, develop, and utilize assessments and interviews that are job appropriate. All these components help to ensure informed hiring decisions with a higher probability of selecting the best person for the role. For individuals hired or currently employed, gaps between current and future competence can also be identified and developmental resources can be appropriately allocated for the highest gains. In short, competencies ultimately impact business results (Spencer & Spencer, 1993). Within both selection and development contexts, competence in an area is the result of many factors working together, which include innate characteristics (natural ability, personality) and learned characteristics (knowledge, experience and skills) as is presented in the following chart. People who have the right competencies or who have a good potential for developing these competencies will be able to do the right things (behaviors) to produce the desired results (effective outcomes).

26
Success in a competency area is achieved through developing and building learned skills and knowledge, as well as possessing, applying, and moderating innate factors, such as personality and intelligence, that may impact the competency area. It is important when evaluating a person’s demonstrated effectiveness, or potential to display a particular competency, that all of these factors – both innate and learned – be evaluated and considered. The learned factors, such as knowledge, experience, skills, and learned abilities can be measured through several methods. An evaluation of past critical experiences, specific and targeted skill assessments, a targeted, structured interview, and 360 degree feedback in a development context are just a few ways of measuring learned factors. The innate factors can be examined through measures of intellectual ability or potential, motivators, values, interests and personality. Through our experience and research, we have found that the ASSESS Expert System, which evaluates intellectual abilities and work-oriented personality, is an effective measure of many of the innate factors that influence the display of competencies. Thus in designing ASSESS v2 we felt it important to build a linkage between ASSESS attributes and specific competencies.
27
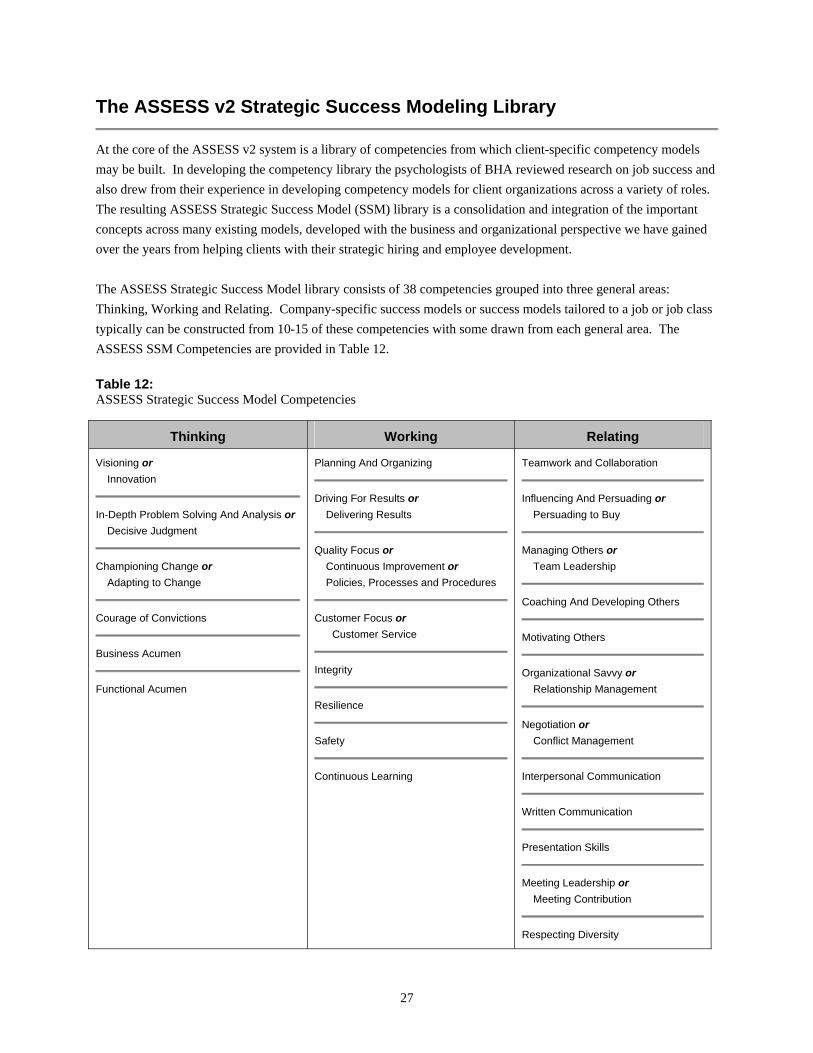
The ASSESS v2 Strategic Success Modeling Library
At the core of the ASSESS v2 system is a library of competencies from which client-specific competency models may be built. In developing the competency library the psychologists of BHA reviewed research on job success and also drew from their experience in developing competency models for client organizations across a variety of roles. The resulting ASSESS Strategic Success Model (SSM) library is a consolidation and integration of the important concepts across many existing models, developed with the business and organizational perspective we have gained over the years from helping clients with their strategic hiring and employee development. The ASSESS Strategic Success Model library consists of 38 competencies grouped into three general areas: Thinking, Working and Relating. Company-specific success models or success models tailored to a job or job class typically can be constructed from 10-15 of these competencies with some drawn from each general area. The ASSESS SSM Competencies are provided in Table 12. Table 12: ASSESS Strategic Success Model Competencies
Thinking Working Relating
Visioning or Innovation
In-Depth Problem Solving And Analysis or Decisive Judgment
Championing Change or Adapting to Change
Courage of Convictions
Business Acumen
Functional Acumen
Planning And Organizing
Driving For Results or Delivering Results
Quality Focus or Continuous Improvement or Policies, Processes and Procedures
Customer Focus or Customer Service
Integrity
Resilience
Safety
Continuous Learning
Teamwork and Collaboration
Influencing And Persuading or Persuading to Buy
Managing Others or Team Leadership
Coaching And Developing Others
Motivating Others
Organizational Savvy or Relationship Management
Negotiation or Conflict Management
Interpersonal Communication
Written Communication
Presentation Skills
Meeting Leadership or Meeting Contribution
Respecting Diversity
28
The ASSESS SSM library was intentionally designed to account for and accommodate the differing levels of competence that might be expected for different levels of job responsibilities within an organization. For example, there are a number of competencies that maintain the same core components as the paired competency, but also include components appropriate and expected at a higher level in the organization. For example, the competency “Visioning” is a higher order competency than “Innovation.” At a professional level position, it may be important for a person to be innovative in order to perform their job more effectively. At a higher level in the organization it will be important that the individual can effectively transform this innovation into a clear vision for the organization and champion or communicate this vision to others. Other examples of this include “Adapting to Change or Championing Change,” “Delivering Results or Driving for Results,” “Customer Service or Customer Focus,” “Relationship Management or Organizational Savvy,” and “Meeting Leadership or Meeting Contribution.” In addition, there are other competencies that were paired together because of their relationship to each other. In these instances, the general concept between the competencies is similar, but how this concept is operationalized on the job might be different. Examples of these include: “Managing Others or Team Leadership,” “Influencing and Persuading or Persuading to Buy,” “Quality Focus or Continuous Improvement or Policies, Processes and Procedures,” and “Negotiation or Conflict Management.” As described in the following section (Personality-Competency Mapping in ASSESS v2) BHA psychologists have developed the linkage between the ASSESS personality characteristics and many of the Strategic Success Modeling competencies. In most situations, the standard SSM library can be used or quickly adapted to fit all or most of the competencies in the organization’s model. For those circumstances where unique competencies are required to define job success, new mappings can be developed quickly and uploaded into the system. Afterwards, the ASSESS system will produce selection and development reports based on personality assessment results, and these reports will speak directly to the organization-specific or role-specific competency model. Personality-Competency Mapping in ASSESS v2
The foundation of the ASSESS v2 competency based reports is the relationship between specific personality characteristics and a particular competency. As a starting point, BHA reviewed the SSM Library and narrowed the broad list to 28 competencies which they felt could be impacted by personality characteristics. For example, the competency of Written Communication was not selected because it was felt that the display of this competency was most influenced by learned factors such as vocabulary, grammar, etc. While the competency of Teamwork was selected because it was felt that several of the personality characteristics would impact an individual’s ability to work collaboratively with others. In developing these linkages, the psychologists of Bigby, Havis & Associates maintained a number of guiding concepts based on their prior research:
There is not a unique relationship between a personality characteristic and only one competency. An individual characteristic, or combination of characteristics can impact multiple competency areas. (For

29
example, Assertiveness can impact how someone manages others, as well as how they might work together in a team.)
A personality characteristic can be an asset in relation to one competency and a liability in relation to a different competency. (For example, a high level of Assertiveness can be an asset when trying to influence others, but may become a liability in a team membership environment).
More is not always better – for a number of personality characteristics there may be a curvilinear relationship between that characteristic and what is desirable for a particular competency. (For example, both an excessively high level of realistic thinking and a low level of realistic thinking are undesirable to the Visioning competency).
Not all competencies are impacted by measurable personality or ability traits. (For example, a person’s competence on Business Acumen or Continuous Improvement is not highly impacted by measurable personality traits and is better measured through other methods such as structured interviews or 360-degree feedback).
Using these guidelines, linkages and ranges were developed based on expert judgment and prior research linking personality characteristics to job and competency success. In developing the final content of ASSESS v2 Competency Reports, BHA psychologists:
Identified the core contributing characteristics for each competency impacted by the ASSESS personality measures. While there may be many characteristics that potentially have an impact on the display of competencies, only critical characteristics with the most impact were linked to each competency.
Identified “desirable” and “undesirable” ranges for each characteristic in relation to that competency (displayed graphically by green, yellow and red in selection reports, and green and white for developmental reports).
Developed selection and development report content for each combination of characteristics that describe the impact (positive or negative) of the profile in relation to the specific competencies.
For example, the competency of Visioning is defined as follows: Identifying long-term goals and championing the implementation of different or alternative ideas. People who are competent at visioning generate creative and strategic solutions that can be successfully implemented. They think in innovative ways and support similar thinking in others. They challenge and push the organization to constantly improve and grow.
Thinks in innovative and creative ways Views tactical problems or initiatives from a broad perspective and emphasizes solutions that support
strategic objectives Generates new ideas/solutions that can be successfully implemented Challenges and pushes the organization to constantly improve and grow Identifies long-term, future goals for the organization and/or the department Champions his/her ideas to successful implementation Supports and champions the strategic initiatives of others

30
The ASSESS Personality attributes which were mapped to this competency were: Reflective -- The tendency to be perceptive, introspective, and philosophical, as opposed to a tendency to be less contemplative Realistic Thinking --The tendency to be an imaginative, perhaps wishful thinker, as opposed to a more practical and here-and-now thinker Serious Minded -- The tendency to be serious-minded and deliberate in dealing with information/situations Assertiveness -- The tendency to take the initiative with people and make one's presence felt, as opposed to a preference for remaining in the background Self-Reliance -- Preference for relying on oneself and accepting responsibility as opposed to relying on or seeking/accepting support from others Work Pace -- The pace at which one prefers to do things
Desirable and undesirable ranges for each characteristic were set and the corresponding mapping and a sample of interpretative statements for ASSESS v2 are shown below. Note that for some characteristics the relationship is linear, while for others such as Serious-Minded the linkage represents a curvilinear relationship.
Validation studies to refine these linkages are currently underway in U.S. based clients as well as in our work to introduce ASSESS to the international market (e.g., the United Kingdom and Europe, Latin and South America, Korea, Indonesia). The findings from these studies will be presented in the next update to this manual.

31
4 : In te l l ec tua l Ab i l i t y Tes ts ASSESS is designed to accommodate scores for up to seven published intellectual ability tests. Using the ASSESS professional norms these scores are then interpreted by the system and feedback is provided in a separate section of the ASSESS report. Depending upon the requirements of the position and the time available for testing, a candidate may be given any combination of these tests. The following information briefly describes the ability tests, presents validity information and provides recommendations for their use. The manuals for each intellectual ability test are referenced in the Bibliography.
TABLE 13: Intellectual Ability Attributes Measured in ASSESS
ATTRIBUTE SOURCE INSTRUMENT SCORE RANGE
Intellectual Abilities:
Critical Thinking Watson-Glaser Critical Thinking Appraisal Form S 0 to 40
Abstract Reasoning* Raven's Standard Progressive Matrices 0 to 35
Mental Alertness Thurstone Test of Mental Alertness 0 to 126
Verbal Reasoning Employee Aptitude Survey 7 (EAS-7) -15 to 30
Arithmetic Reasoning RBH Arithmetic Reasoning Test 0 to 25
Numerical Ability Employee Aptitude Survey 2 (EAS-2) -18.5 to 75
Verbal Comprehension Employee Aptitude Survey 1 (EAS-1) -10 to 30
* With permission of JC Raven’s we use a shortened version of the Raven’s Standard Progressive Matrices.
Watson-Glaser Critical Thinking Appraisal (WG) Form S
Copyright 1994 Harcourt Brace Jovanovich, Inc. (No time limit; estimate 30 minutes to complete.) The Watson-Glaser is a high level, formal measure of critical thinking ability and verbal skills. It measures the ability to evaluate written information to determine whether there is sufficient information available to make a decision, whether appropriate assumptions have been made, or if conclusions logically follow from stated facts. We strongly recommend it for use with executive and middle management candidates. You may wish to consider it for supervisors and line managers as well, especially if successful performance depends heavily on complex decision making. This is probably the best intellectual ability test available for high level management positions. The WG was developed in 1964, revised in 1980, and a shorter version (Form S) was created in 1994. The construct validity of the WG was tested on college students who were enrolled in a physics course that had been specifically designed to stress critical thinking. Scores on the WG were found to be highly correlated with performance in that course (r = .44, p < .001). In an earlier investigation of achievement and aptitude tests, correlations of .37 (p < .01) were found between test scores in a graduate statistics course and WG scores (Watson & Glaser, 1981). The WG Form S was designed for use in adult assessment, specifically in the employment selection context. The WG Form S is a shorter version of the original Watson-Glaser Critical Thinking Appraisal; it is intended to reduce

32
the administration time without changing the essential nature of the constructs being measured. Using factor analysis, 40 of the original 80 questions were selected for retention in the shorter version. To support the equivalence of Form S and Form A, the content of the items were left unchanged and the new form was assembled out of test items from Form A. Bigby Havis & Associates created norms from the ASSESS database which are more representative of the types of jobs for which BHA typically assesses. It is BHA norms which are included in the norm tables in this ASSESS manual. The WG has been shown to be highly correlated with tests measuring general intelligence, even though it reflects a narrower dimension of intellectual functioning. Table 14: Correlations Between Watson Glaser and Other Tests
Job Level:
Wesman Personnel Test Form A/Form S
EAS #1
Form A/Form S
EAS #7
Form A/Form S
Lower-Level Management (n=217) .54/.51 .54/.54 .51/.48
Mid-Level Management (n=208) .70/.66 .55/.50 .50/.51
Executive Management (n= 436) .57/.54 .45/.42 .51/.47
Raven’s Standard Progressive Matrices (RPM)
Copyright 1958 John C. Raven Note: The ASSESS normative database uses an abridged version of the RPM as described in this section. (No time limit; estimate 30 minutes to complete.) The Standard Progressive Matrices is a word-free, number-free, culture-fair measure of abstract reasoning ability. More specifically, it provides a measure of one's ability to perceive and understand concepts by asking examinees to determine the relationship between a series of figures and identify the figure which will complete the system of relations. This test provides an indication of an individual's capacity for observation, operational problem solving, and learning. It is a good general purpose test of "thinking power" and is best used in conjunction with another test such as the Watson-Glaser or the Thurstone. The RPM was published in 1938 and has undergone several revisions since. The nonverbal nature of the test reduces, but does not completely cancel, cultural bias and the RPM has been used extensively in Europe as a "culture-fair" test of intellectual ability. Performance on the RPM has been found to be highly correlated with other tests of intellectual functioning. Correlation coefficients tend to fall in the range between .50 and .75 (Jensen 1980). Burke and Bingham (1969) found high correlations between RPM scores and performance on the Wechsler Adult Intelligence Scale and Army General Classification Test in VA Hospital patients. A high correlation with the WAIS was confirmed by Burke in subsequent research (Burke 1985). Dolke (1976) reported a correlation of .55 between

33
RPM and GATB scores in a sample of textile workers. The "culture-fair" nature of the RPM is supported in a study of Hispanic and non-Hispanic students. Powers and Barkin (1986) found no significant difference in RPM scores between the two groups even though the Hispanic students scored lower on verbal ability tests than the non-Hispanic. The table below summarizes data from these two studies. Table 15: Correlations Between the RPM and Other Tests
Population CATLa CATMb WAISc AGCTd GATBe
Hispanic Students1 .45*** .49***
Non-Hispanic Students1 .51*** .55***
VA Hospital Patients2 .75**
VA Hospital Patients3 .67**
Textile Workers4 .55**
***p<.001, **p<.01 1 Powers and Barkin (1986) a California Achievement Test - Language
2 Burke and Bingham (1969) b California Achievement Test - Mathematics
3 Burke (1985) c Wechsler Adult Intelligence Scale
4 Dolke (1976) d Army General Classification Test
e General Aptitude Test Battery
In an effort to make the total assessment battery more efficient and less time consuming, analysis was conducted to shorten the RPM while maintaining the structure and predictive power of the test. The original RPM was designed so that items became progressively more difficult as: (1) one answered items down each set, and (2) one moved from set A to set E. This design was maintained in the short version by using the even items from each set. However, to allow for a wider differentiation of top performers on this shorter RPM, additional high-difficulty items were added to create the final 35 item version. Across all job categories (n=703), the short-long correlation is .97. Thus, the shorter RPM is an excellent substitute for the longer version.

34
Table 16: Long versus Short RPM Correlations
Job Category Sample Long-Short Correlations
Claims Representative 26 .98
General Management 426 .96
General Professional 83 .97
Manufacturing Supervisor 59 .98
Professional Supervisor 19 .99
Sales Manager 25 .97
All correlations significant at p < .01.
Thurstone Test of Mental Alertness (THUR)
Copyright 1952 Thelma Gwinn Thurstone and L. L. Thurstone (Timed; 20 minutes.) The Thurstone provides a measure of one's flexibility in thinking and intellectual quickness. The candidate must think quickly to solve verbal and quantitative problems and must be able to quickly "switch gears" back and forth between problem types. It reflects the strength of an individual's verbal and quantitative reasoning skills and their ability to learn quickly, adapt to new problem situations and comprehend complex relationships. A good measure of the type of "on your feet" abilities required in professional sales jobs. We recommend it for professional, entry level and lower management, sales, and administrative positions. The THUR demonstrates strong correlations with academic performance and achievement tests. Table 17: Correlation Between Thurstone Scores and Achievement (from Thurstone & Thurstone 1968)
GROUP GPA ITEDa
High School Seniors
School A
School B
School C
School D
.61
.77
.40
.64
High School Seniors .85
a Iowa Tests of Educational Development All correlation coefficients are significant at the .01 level.
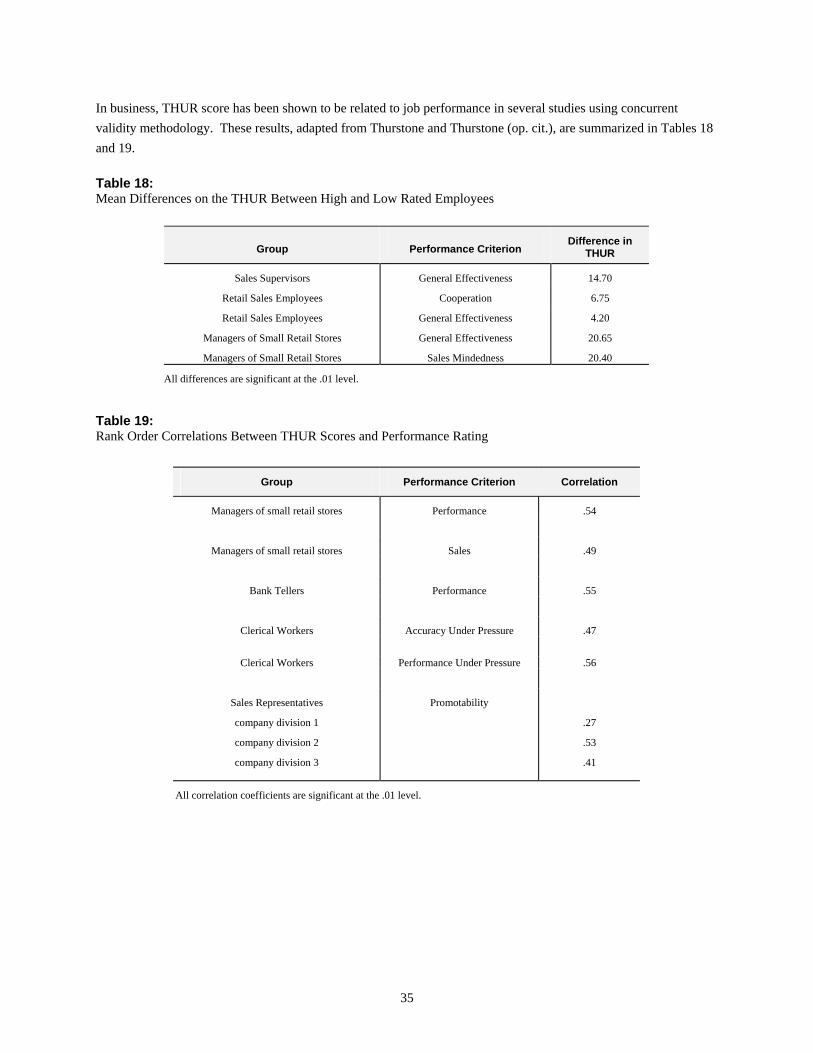
35
In business, THUR score has been shown to be related to job performance in several studies using concurrent validity methodology. These results, adapted from Thurstone and Thurstone (op. cit.), are summarized in Tables 18 and 19. Table 18: Mean Differences on the THUR Between High and Low Rated Employees
Group Performance Criterion Difference in
THUR
Sales Supervisors General Effectiveness 14.70
Retail Sales Employees Cooperation 6.75
Retail Sales Employees General Effectiveness 4.20
Managers of Small Retail Stores General Effectiveness 20.65
Managers of Small Retail Stores Sales Mindedness 20.40
All differences are significant at the .01 level.
Table 19: Rank Order Correlations Between THUR Scores and Performance Rating
Group Performance Criterion Correlation
Managers of small retail stores Performance .54
Managers of small retail stores Sales .49
Bank Tellers Performance .55
Clerical Workers Accuracy Under Pressure .47
Clerical Workers Performance Under Pressure .56
Sales Representatives
company division 1
company division 2
company division 3
Promotability
.27
.53
.41
All correlation coefficients are significant at the .01 level.
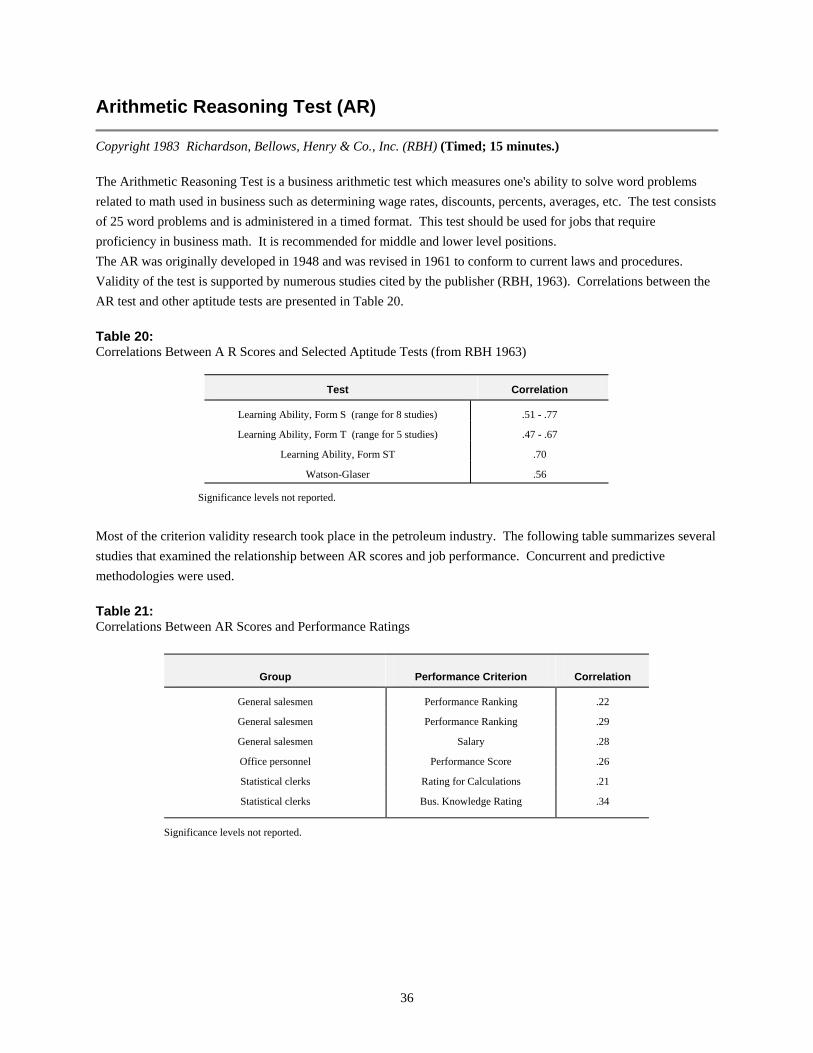
36
Arithmetic Reasoning Test (AR)
Copyright 1983 Richardson, Bellows, Henry & Co., Inc. (RBH) (Timed; 15 minutes.) The Arithmetic Reasoning Test is a business arithmetic test which measures one's ability to solve word problems related to math used in business such as determining wage rates, discounts, percents, averages, etc. The test consists of 25 word problems and is administered in a timed format. This test should be used for jobs that require proficiency in business math. It is recommended for middle and lower level positions. The AR was originally developed in 1948 and was revised in 1961 to conform to current laws and procedures. Validity of the test is supported by numerous studies cited by the publisher (RBH, 1963). Correlations between the AR test and other aptitude tests are presented in Table 20. Table 20: Correlations Between A R Scores and Selected Aptitude Tests (from RBH 1963)
Test Correlation
Learning Ability, Form S (range for 8 studies) .51 - .77
Learning Ability, Form T (range for 5 studies) .47 - .67
Learning Ability, Form ST .70
Watson-Glaser .56
Significance levels not reported.
Most of the criterion validity research took place in the petroleum industry. The following table summarizes several studies that examined the relationship between AR scores and job performance. Concurrent and predictive methodologies were used. Table 21: Correlations Between AR Scores and Performance Ratings
Group Performance Criterion Correlation
General salesmen Performance Ranking .22
General salesmen Performance Ranking .29
General salesmen Salary .28
Office personnel Performance Score .26
Statistical clerks Rating for Calculations .21
Statistical clerks Bus. Knowledge Rating .34
Significance levels not reported.

37
Employee Aptitude Surveys (EAS 1, 2 & 7)
Copyright 1984, 1956 Psychological Services, Inc. Verbal Comprehension (EAS 1) (Timed; 5 minutes.) The EAS 1 is designed to measure the ability to use words in oral and written communication. The test consists of 30 multiple choice items in which a word is presented and the respondent is asked to select another word (from a choice of four) which is most similar in meaning. The test is administered in a timed format. We recommend this test for middle and lower level positions requiring a good general vocabulary, (e.g., professionals, supervisors, sales professionals, managers, and administrative assistants). Numerical Ability (EAS 2) (Timed; 10 minutes.) The EAS 2 is a quick arithmetic comprehension test which measures one's ability to manipulate basic numbers (including percents and fractions) and to use simple arithmetic. The test consists of three parts: whole numbers, decimal fractions, and common fractions. The test is administered in a timed format. It is most appropriate for jobs with a high basic arithmetic content. Verbal Reasoning (EAS 7)
(Timed; 5 minutes.) The EAS 7 is a quick test of verbal reasoning ability which measures one's ability to analyze written information and to deduce logical conclusions from that information. The respondent is also asked to recognize those instances where there is insufficient information to reach a conclusion. The 30 item multiple choice test is administered in a timed format. It is shorter and less demanding than the Watson-Glaser, so it is better suited to lower level positions. It could be substituted for the Watson-Glaser if time is a critical factor in the testing process. The Employee Aptitude Surveys (EAS 1, 2, and 7) were published in 1963 and have been widely used for both personnel selection and career counseling. The different EAS 1, 2, and 7 tests have been shown to have high correlations with tests measuring the same basic constructs and with measures of performance (EAS Technical Manual, 1994). Table 22: Correlations with Tests Measuring Constructs Similar to EAS 1, 2 & 7
Tests PMAa Verbal PMA Reasoning PMA Number SCAT-Vb SCAT-Q
EAS1 .85 .53 .28 .75 .44
EAS2 .62 .59 .51 .10 .31
EAS7 .64 .74 .35 .51 .53 a Primary Mental Abilities Tests b Cooperative School and College Ability Test (v=verbal, q=quantitative) All correlation coefficients are significant at the .05 level.

38
Table 23: Correlations Between the EAS Tests and Job Performance Measures for Different Occupations Groups
Groups EAS1 EAS2 EAS7
Prof., Mgr, & Supervis. .26 .27 .34
Clerical .18 .22 .22
Production/Mechanical .17 .18
All correlation coefficients are significant at the .05 level.
Pounders (1970) factor analyzed the test scores of 102 students. A four-factor solution emerged and below are the factor loadings for the three EAS tests. TABLE 24: Factor Loadings for the EAS 1, 2 & 7
Tests Numerical Facility Verbal
Comprehension Abstract
Reasoning Perceptual Ability
EAS1 .00 .85 .00 -.03
EAS2 .82 .14 .26 .15
EAS7 .02 .53 .21 .46

39
5 : Cr i t e r ion -Re la ted Va l ida t ion Research Validity of a testing instrument is demonstrated in several ways. Chapter 2 presents construct-related validity of the personality components of the ASSESS system. Construct validity addresses the concern of whether survey scales measure the construct they purport to measure. Criterion-related validity addresses the concern of whether performance on the test accurately predicts job performance. In this document, we present criterion related validity of the overall ASSESS personality profile for a variety of job positions. There are two main approaches to criterion-related validation studies: Concurrent and Predictive designs.
Concurrent - In a concurrent strategy, the relationship between predictor instruments and criterion job performance is verified by testing a sample of current employees. The test performance of these employees is correlated with measures (existing performance evaluations or special purpose ratings) collected “concurrently” or in the same general time period as test performance. Predictive - In a predictive strategy, candidates are tested before they are hired and performance measures are collected later, after the candidates have been hired and on the job long enough to accurately assess their job performance.
In each of the following studies, a concurrent validation approach was adopted because of its relative efficiency. The flowchart below shows the main worksteps conducted by BHA in each of these studies. Job Analysis
Desired Attributes
Select Sample
Administer ASSESS Battery Collect Job Performance Measures
STATISTICAL ANALYSIS Validity/Adverse Impact/Utility
FINAL “Success Profile”

40
The outcome of each study was an ASSESS Success Profile which includes a predictive index of potential job success. Success Profiles are constructed through a formal validation process and designed to predict a candidate’s chance for success in a particular position. Accordingly, the Success Profile is capable of making an actual hiring recommendation rather than just providing qualitative information.
In each of the following studies, a Success Profile was custom developed for each organization, so they are tailored to the unique characteristics of the industry, company, and the target job. A generic example of a Success Profile is pictured here for your reference. The Success Profile (shaded bars) highlights which ASSESS dimensions are important for success and defines the desirable ranges on each scale. Below the profile, the Success Profile Index indicates the candidate’s “goodness of fit” to the overall Success Profile and makes a hiring recommendation – such as “Avoid” or “Pursue”.

41
Table 25 summarizes the results of each study and presents the correlation between the Success Profile Index and key performance measures. Adverse impact ratios for the Success Profile Index (using an Avoid the Avoids strategy) are also reported. Further detail of each study is presented in the remainder of this chapter. Table 25: ASSESS Validation Studies
Position n Criteria r Adverse Impact Rations for gender and race.
Ability test included
Field Sellers at a Chemical Company
78 Supervisor Ratings
Overall Rating
.22 to .57
.54
Race: 1.08
Gender: 1.04
no
Market Analysts at a Chemical Company
74 Supervisor Ratings Overall Rating
.15 to .42.44
Race: n/a Gender: .95
no
District Managers for a Convenience Store Chain
221 Supervisor Ratings
30 to .37 Race: 1.02
Gender: .92
no
District Marketing Managers at an Insurance Company
49 Supervisor Ratings
Overall Rating
.22 to .62
.56
Sample size too small no
Programmers at a Medical Software Company
97 Supervisor Ratings
Overall Rating
.22 to .51
.51
Race: .92
Gender: 1.16
no
Analysts at a Medical Software Company
114 Supervisor Ratings
Overall Rating
.23 to .41
.41
Race:.85
Gender: 1.09
yes
Retail District Manager for an Electronics Chain
149 Supervisor Ratings
Overall Rating
Percent Gain in Sales
.26
.39
.47
Race: .98
Gender: 1.07
no
Club Manager for a Private Club and Resort Company
128 Supervisor Ratings
% of Financial Goal Met
.19 to .39
.42
Race: sample too small
Gender: .1.07
no
Membership Director for a Private Club and Resort Company
94 Supervisor Ratings .34 to .54 Race: .88
Gender: 1.07
no
Department Manager for a Private Club and Resort Company
140 Supervisor Ratings
Talent Assessment Overall Rating
.31 to .40
.45
Race: .89
Gender: .95
no

42
Position n Criteria r Adverse Impact Rations for gender and race.
Ability test included
Independent Gas Station Operators for an Oil and Gas Company
71 Supervisor Ratings
Overall Rating
.29 to .47
.58
Race: .92
Gender: 1.07
yes
Outside Sales for a Electronics Distributor
104 Ranking .28 Race: sample too small Gender: .93
no
Inside Sales for an Electronics Distributor
112 Ranking .25 Race: sample too small Gender .82
no
Business Manager for a Property Management Company
54 Supervisor Ratings .30 to .38 Race: .97
Gender: .98
Managers at a Regional Grocery Chain
57 Supervisor Ratings Store Performance
.24 to .27.50
Sample size too small to conduct analysis
yes

43
Tailoring the ASSESS Expert System Example 1: Field Sellers at a Chemical Manufacturing Company
Background
In 1992, a concurrent validation study was conducted at a large chemical manufacturing company to determine the usefulness of the ASSESS Expert System in evaluating candidates for Field Seller positions. Field Sellers represent chemicals and chemically-derived product lines to large-scale buyers.
Sample Field Sellers were tested (under assurances of confidentiality) with the ASSESS battery. In addition, groups of applicants, trainees and Sales Managers were tested as well. The total sample was composed as follows: TABLE 26: Validation Study Sample
LEVEL n Female Male Ma jor i ty Minor i ty
Field Sellers 99 17 82 83 16 Applicants 34 16 18 23 11 Trainees 32 15 17 19 13
Sales Management 9 0 9 8 1 While the applicant and trainee groups were well balanced for gender, the field seller sample was predominantly male; the small management sample was all male. While a broad age range was apparent in the applicant and trainee groups, most participants in these groups were under the age of 25. The field seller group was much more likely to be in the 25 - 54 age range. The absolute number of minorities was smaller than the majority group for all levels; however, the proportionate representation was within general population percentage expectations for applicants, trainees and field sellers.
Validity Analysis
Performance ratings were available for 78 of the 99 Field Sellers in the original sample. ASSESS scale scores were correlated with several key dimensions of job performance, as rated by each Field Seller’s supervisor. Based on this and other analysis, the most predictive ASSESS scales and scale ranges were selected to create a Field Seller Success Profile. Predictive scale ranges were classified as desirable or undesirable, assigned scores of 1 or 0 respectively, and summed to compute an index of success potential or a broad-band “Success Profile Index.” The Success Profile Index was then correlated with the performance rating dimensions. The results of this analysis are summarized in Table 27 on the following page. Eighty-two percent (or 9 out of 11) of the dimensions were predicted at a p < .05 level of significance or better. The mean correlation coefficient for the significantly (p <.05) correlated dimensions was .42, slightly exceeding the expected correlation of .2 - .4 for this type of study. In all, the Success Profile Index is strongly related to performance on a variety of dimensions in the Field Seller job.
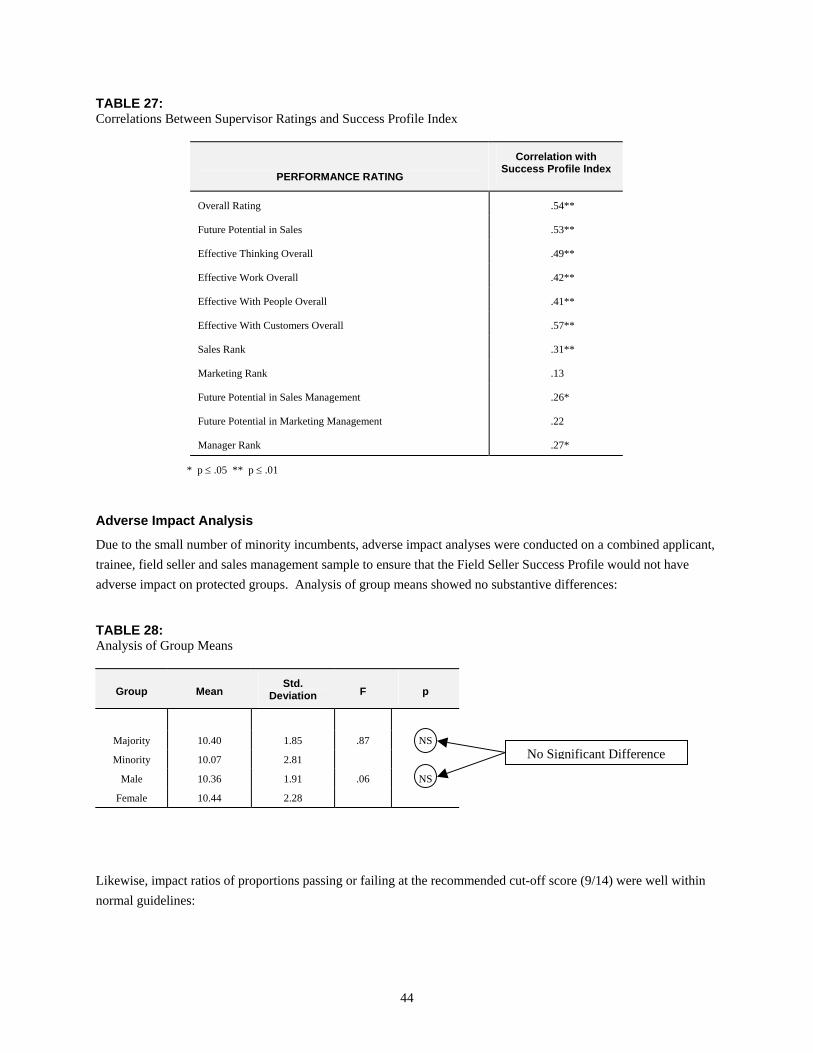
44
TABLE 27: Correlations Between Supervisor Ratings and Success Profile Index
PERFORMANCE RATING
Correlation with Success Profile Index
Overall Rating .54**
Future Potential in Sales .53**
Effective Thinking Overall .49**
Effective Work Overall .42**
Effective With People Overall .41**
Effective With Customers Overall .57**
Sales Rank .31**
Marketing Rank .13
Future Potential in Sales Management .26*
Future Potential in Marketing Management .22
Manager Rank .27*
* p ≤ .05 ** p ≤ .01
Adverse Impact Analysis
Due to the small number of minority incumbents, adverse impact analyses were conducted on a combined applicant, trainee, field seller and sales management sample to ensure that the Field Seller Success Profile would not have adverse impact on protected groups. Analysis of group means showed no substantive differences: TABLE 28: Analysis of Group Means
Group Mean Std.
Deviation F p
Majority 10.40 1.85 .87 NS
Minority 10.07 2.81
Male 10.36 1.91 .06 NS
Female 10.44 2.28
Likewise, impact ratios of proportions passing or failing at the recommended cut-off score (9/14) were well within normal guidelines:
No Significant Difference

45
TABLE 29: Adverse Impact Ratios
PERCENTAGES PASSING AT EACH LEVEL
PERCENTAGES PASSING AT EACH LEVEL
Index Score Status Total %
Majority (133) Minority (29) Impact Ratio
Male (111) Female (51) Impact Ratio
0 - 8 Caution 26.0
9 - 14 Pursue 74.0 72.9 75.9 1.04 72.4 78.0 1.08
Conclusions
The following summary conclusions can be drawn from the preceding validity, adverse impact, and fairness analysis:
1. ASSESS scales are useful predictors of important job behaviors in the Field Seller job. 2. Desirable ranges of ASSESS scale scores can be used to predict job success. 3. Desirable scale ranges can be combined into a predictive index (Success Profile). 4. The Index is highly predictive of important job behaviors. 5. The Success Profile Index as implemented is fair to minorities and females and has no observed adverse
impact.
Tailoring the ASSESS Expert System Example 2: Market Managers at a Chemical Manufacturing Company
Background
In 1992, a concurrent validation study was conducted at a large chemical manufacturing company to determine the usefulness of the ASSESS Expert System in evaluating candidates for their marketing program. Candidates from this program would most likely be placed into the marketing career ladder for the market manager position.
Within the normally accepted range of .8 - 1.2

46
Sample
Current employees in the marketing career ladder positions were tested (under assurances of confidentiality) with the ASSESS battery. This included Market Managers (the target position) as well as feeder positions such as Analysts and Product Managers. The total sample was composed as follows: TABLE 30: Validation Study Sample
LEVEL n
Market Managers 37 Product Managers 8
Analysts 37 While there was substantive representation of females in the research sample (market manager, product managers and analysts), males predominated. The sample included almost no minorities. Almost all of the study participants were in the 25-34 or 35-54 age groups.
Validity Analysis
Performance ratings were available for 74 of the 82 participants in the original sample. Additional importance ratings were obtained for each of the performance dimensions. ASSESS scale scores were correlated with several key dimensions of job performance, as rated by each participant’s direct supervisor. Based on this and other analysis, the most predictive ASSESS scales and scale ranges were selected to create a Market Manager Success Profile. Predictive scale ranges were classified as desirable or undesirable, assigned scores of 1 or 0 respectively, and summed to compute an index of success potential or a broad-band “Success Profile Index.” The Success Profile Index was then correlated with the performance rating dimensions. These ratings included specific behaviors in the areas of Intellectual Usage, Work Style, Emotional Style, Interpersonal Style and Marketing Style as well as overall performance ratings. For those specific items rated as having high importance for the job (n=15), the mean correlation coefficient was .18. Correlations with overall measures of performance (as presented in Table 31) were significant in most cases. The strongest relationships were found for current performance and future potential as a Market Manager where correlations were .44 and .42 respectively, slightly exceeding the expected correlation of .2 - .4 for this type of study. In all, the Success Profile Index is strongly related to performance on a variety of dimensions in the Market Manager job.

47
TABLE 31: Correlations Between Supervisor Ratings and Success Profile Index
PERFORMANCE RATING Correlation with Success Profile
Index
Overall Current Rating .44**
Future Potential as a Market Manager .42**
Effective Thinking Overall .37**
Effective Work Overall .34**
Effective With People Overall .15
Future Potential as a Senior Analyst -.03
Future Potential as a Product Manager .24*
Future Potential as a General Manager .25*
Product Manager Rank .11
Market Manager Rank .19
General Manager Rank .07
* p ≤ .05 ** p ≤ .01
Adverse Impact Analysis
Adverse impact analyses were conducted on a combined sample of analysts (n=37), product managers (n=8), market managers (n=37) and additionally market management (n=19) to test for adverse impact on females. Unfortunately, representation of minorities (n=4) was too small to permit analysis. Analysis of group means showed no substantive differences: TABLE 32: Analysis of Group Means
Group Mean Std.
Deviation F p
Male 6.746 1.82 .61 NS
Female 6.38 1.99
Likewise, impact ratios of proportions passing or failing at the recommended cut-off score (8/11) were well within normal guidelines:
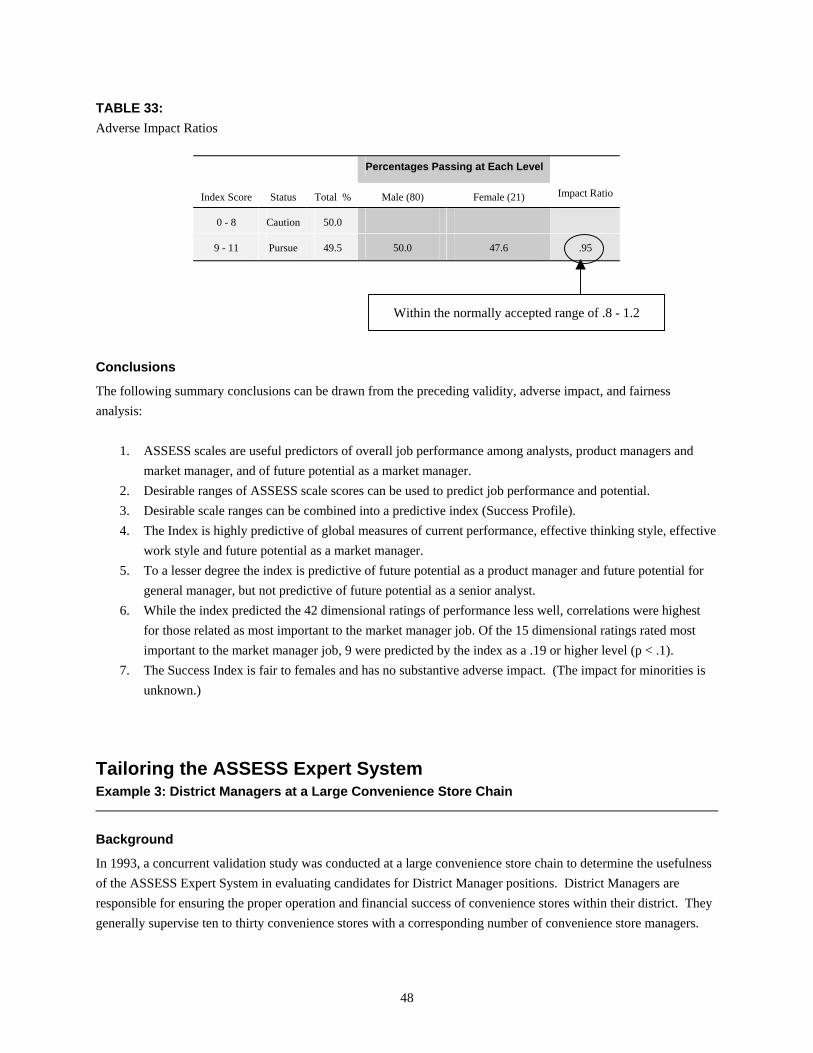
48
TABLE 33: Adverse Impact Ratios
Percentages Passing at Each Level
Index Score Status Total % Male (80) Female (21) Impact Ratio
0 - 8 Caution 50.0
9 - 11 Pursue 49.5 50.0 47.6 .95
Conclusions
The following summary conclusions can be drawn from the preceding validity, adverse impact, and fairness analysis:
1. ASSESS scales are useful predictors of overall job performance among analysts, product managers and market manager, and of future potential as a market manager.
2. Desirable ranges of ASSESS scale scores can be used to predict job performance and potential. 3. Desirable scale ranges can be combined into a predictive index (Success Profile). 4. The Index is highly predictive of global measures of current performance, effective thinking style, effective
work style and future potential as a market manager. 5. To a lesser degree the index is predictive of future potential as a product manager and future potential for
general manager, but not predictive of future potential as a senior analyst. 6. While the index predicted the 42 dimensional ratings of performance less well, correlations were highest
for those related as most important to the market manager job. Of the 15 dimensional ratings rated most important to the market manager job, 9 were predicted by the index as a .19 or higher level (p < .1).
7. The Success Index is fair to females and has no substantive adverse impact. (The impact for minorities is unknown.)
Tailoring the ASSESS Expert System Example 3: District Managers at a Large Convenience Store Chain
Background
In 1993, a concurrent validation study was conducted at a large convenience store chain to determine the usefulness of the ASSESS Expert System in evaluating candidates for District Manager positions. District Managers are responsible for ensuring the proper operation and financial success of convenience stores within their district. They generally supervise ten to thirty convenience stores with a corresponding number of convenience store managers.
Within the normally accepted range of .8 - 1.2
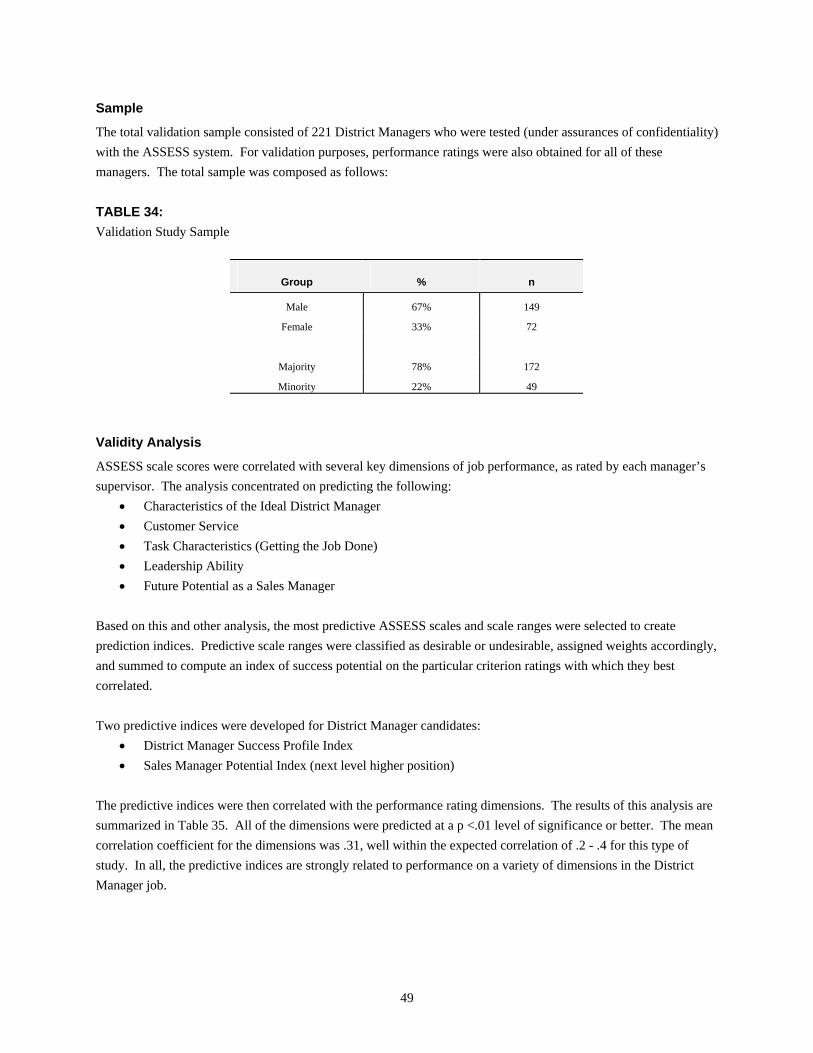
49
Sample
The total validation sample consisted of 221 District Managers who were tested (under assurances of confidentiality) with the ASSESS system. For validation purposes, performance ratings were also obtained for all of these managers. The total sample was composed as follows: TABLE 34: Validation Study Sample
Group % n
Male 67% 149
Female 33% 72
Majority 78% 172
Minority 22% 49
Validity Analysis
ASSESS scale scores were correlated with several key dimensions of job performance, as rated by each manager’s supervisor. The analysis concentrated on predicting the following:
• Characteristics of the Ideal District Manager • Customer Service • Task Characteristics (Getting the Job Done) • Leadership Ability • Future Potential as a Sales Manager
Based on this and other analysis, the most predictive ASSESS scales and scale ranges were selected to create prediction indices. Predictive scale ranges were classified as desirable or undesirable, assigned weights accordingly, and summed to compute an index of success potential on the particular criterion ratings with which they best correlated. Two predictive indices were developed for District Manager candidates:
• District Manager Success Profile Index • Sales Manager Potential Index (next level higher position)
The predictive indices were then correlated with the performance rating dimensions. The results of this analysis are summarized in Table 35. All of the dimensions were predicted at a p <.01 level of significance or better. The mean correlation coefficient for the dimensions was .31, well within the expected correlation of .2 - .4 for this type of study. In all, the predictive indices are strongly related to performance on a variety of dimensions in the District Manager job.

50
TABLE 35: Correlations Between Supervisor Ratings and Predictive Indices
Job Performance Correlations
Supervisor Ratings:
District Mgr. Success Profile
Sales Mgr. Success Profile
Ideal Zone Manager .37* .21*
Leadership .35* .21*
Task Performance .37* .23*
Customer Service .37* .20*
Sales Manager Potential .30* .38*
* p < .01
Adverse Impact Analysis
Adverse impact analyses were conducted on the total sample (n=221) to ensure that the predictive indices would not have adverse impact on protected groups. Analysis of group means generally showed no significant differences. For those indices where a significant difference in means was found, the differences did not lead to adverse impact at the recommended cut score. In many cases, minorities actually scored, on the average, better than the non-minorities. As the next page indicates, these mean differences did not result in adverse impact, or what is called reverse discrimination, against the majority group. Impact ratios of proportions passing or failing at the recommended cut-off score (2) for each index were well within normal guidelines.1
TABLE 36: Adverse Impact Ratios for District Manager Success Profile Index
Percentages Passing at Each Level Percentages Passing at Each Level
Index Score
Status Total % Majority (172)
Minority (49)
ImpactRatio
Male (149)
Female (72)
ImpactRatio
0-1 Fail 33.9
2-7 Pass 66.1 65.7 67.3 1.02 67.8 62.5 .92
1 The generally accepted “Four Fifths” Rule prescribes impact ratios of .80 to 1.20.
Note: Shown above is one of the five indices; similar adverse impact results are seen with the other four indices.
Within the normally accepted range of .8 - 1.2

51
Conclusions
The following summary conclusions can be drawn from the preceding validity, adverse impact, and fairness analysis:
1. ASSESS scales are useful predictors of important job behaviors in the District Manager job. 2. Desirable ranges of ASSESS scale scores can be used to predict job success. 3. Desirable scale ranges can be combined into predictive indices. 4. The indices are predictive of important job behaviors. 5. The Success Indices as implemented are fair to minorities and females and have no observed adverse
impact.
Tailoring the ASSESS Expert System Example 4: District Marketing Managers at a Midwestern Insurance Company
Background
In the summer of 1993, a midwestern insurance company asked a licensed vendor of BHA to assist in the evaluation of future candidates for the position of District Marketing Manager (DMM). DMM’s are responsible for the marketing and resulting sales of company insurance products within their district. The company had experienced what they considered a high rate of performance failure in the DMM position and wanted to do a better job of selecting and promoting candidates who would have the potential to become top performers. In the course of their discussions with the vendor, it was determined to use the ASSESS Expert System version of a full psychological assessment, and to conduct a tailoring and validation study to develop and validate an ASSESS-based success profile for this position.
Sample
The validation sample in this study was unusually small, consisting of 59 District Marketing Managers; however, this sample represented the total group. The sample was homogenous, almost all male, and there was no minority representation in the study sample. Therefore, adverse impact analysis could not be conducted.
Validity Analysis
Performance ratings were available for 49 of the 59 DMMs in the original sample. Ten of the 59 had been a DMM for one year or less and, therefore, could not be adequately evaluated on the job performance criterion measures. ASSESS scale scores were correlated with several key dimensions of job performance, as rated by Regional Marketing Managers. Based on this and other analysis, the most predictive ASSESS scales and scale ranges were selected to create a DMM Success Profile. Predictive scale ranges were classified as desirable or undesirable, assigned weights accordingly, and summed to compute an index of success potential or “Success Profile Index.”
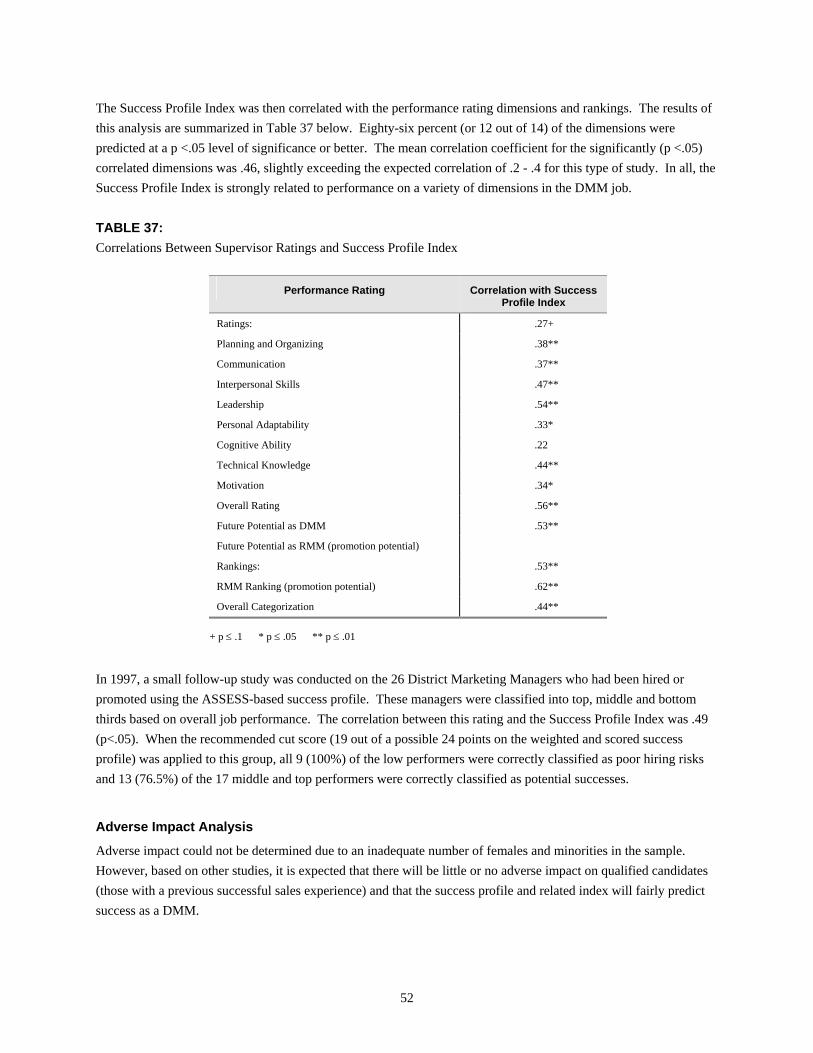
52
The Success Profile Index was then correlated with the performance rating dimensions and rankings. The results of this analysis are summarized in Table 37 below. Eighty-six percent (or 12 out of 14) of the dimensions were predicted at a p <.05 level of significance or better. The mean correlation coefficient for the significantly (p <.05) correlated dimensions was .46, slightly exceeding the expected correlation of .2 - .4 for this type of study. In all, the Success Profile Index is strongly related to performance on a variety of dimensions in the DMM job. TABLE 37: Correlations Between Supervisor Ratings and Success Profile Index
Performance Rating Correlation with Success Profile Index
Ratings: .27+
Planning and Organizing .38**
Communication .37**
Interpersonal Skills .47**
Leadership .54**
Personal Adaptability .33*
Cognitive Ability .22
Technical Knowledge .44**
Motivation .34*
Overall Rating .56**
Future Potential as DMM .53**
Future Potential as RMM (promotion potential)
Rankings: .53**
RMM Ranking (promotion potential) .62**
Overall Categorization .44**
+ p ≤ .1 * p ≤ .05 ** p ≤ .01
In 1997, a small follow-up study was conducted on the 26 District Marketing Managers who had been hired or promoted using the ASSESS-based success profile. These managers were classified into top, middle and bottom thirds based on overall job performance. The correlation between this rating and the Success Profile Index was .49 (p<.05). When the recommended cut score (19 out of a possible 24 points on the weighted and scored success profile) was applied to this group, all 9 (100%) of the low performers were correctly classified as poor hiring risks and 13 (76.5%) of the 17 middle and top performers were correctly classified as potential successes.
Adverse Impact Analysis
Adverse impact could not be determined due to an inadequate number of females and minorities in the sample. However, based on other studies, it is expected that there will be little or no adverse impact on qualified candidates (those with a previous successful sales experience) and that the success profile and related index will fairly predict success as a DMM.

53
Conclusions
The following summary conclusions can be drawn from the preceding validity, adverse impact and fairness analysis:
1. ASSESS scales are useful predictors of important job behaviors in the DMM job. 2. Desirable ranges of ASSESS scale scores can be used to predict job success. 3. Desirable scale ranges can be combined into a “Success Profile” and a predictive index. 4. The Index is highly predictive of important job behaviors.
Tailoring the ASSESS Expert System Examples 5 and 6: Programmers and Analysts at a Medical Software Company
Background
In 1998, Bigby, Havis & Associates was asked to assist in the development of a selection process for Programmers and Analysts at a large developer of medical software applications. The ASSESS Expert System was selected as an appropriate measure of many of the competencies identified as important to these Programmer and Analyst jobs. A concurrent validation study was conducted the fourth quarter of 1998 and the first quarter of 1999 to empirically demonstrate the predictive validity of ASSESS.
Sample
In the course of the validation study, an ASSESS testing battery was administered during proctored sessions to a representative sample of Programmers and Analysts at the company. The testing battery included:
• ASSESS Personality Survey • Raven's Standard Progressive Matrices (shortened) • Employee Aptitude Survey 7 - Verbal Reasoning
The study sample was composed as follows: TABLE 38: Sample Composition
Group % n
Programmers 46% 97
Analysts 54% 114
Male 63% 128
Female 36% 73
Majority 87% 174
Minority 13% 27

54
Concurrently, performance data was collected for each of the sample participants. The direct supervisor of each sample participant was asked to rate the participant's performance on each competency identified in the Competency Analysis, as well as an overall performance dimension. Raters were coached regarding proper rating techniques to avoid bias, and they had no knowledge of participants' testing results.
Validity Analysis
ASSESS scale scores were correlated with supervisor ratings of job performance. The analysis concentrated on predicting Overall Performance, but examined all the performance dimensions. Based on this and other analyses, the most predictive ASSESS scales were selected to create a Success Profile Index. Predictive scale ranges were classified as desirable or undesirable, assigned weights accordingly, and summed to compute a Success Profile Index. This process was conducted separately for Programmers and Analysts. Thus, two Success Indices were produced:
• Programmer Success Profile Index • Analyst Success Profile Index
Each Success Profile Index was then correlated with each performance rating dimension. The results of this analysis are summarized in Table 39 below. Most (82%) of the dimensions were significantly predicted by the Success Indices. For both indices, the correlation with Overall Performance is notably high (0.41 and 0.51 respectively), exceeding the expected correlations of 0.2 - 0.4 for this type of study. In all, both Success Indices are strongly related to performance on a variety of dimensions in the Programmer and Analyst jobs. TABLE 39: Correlations Between Performance Ratings and Success Profile Index
Rating Dimension Correlations with the Analyst Success Profile Index
Correlations with the Programmer Success Profile Index
Analytical Thinking .17+ .45**
Conceptual Thinking .32** .43**
Communication Skills .24* .28**
Continual Development .32** .39**
Customer Management .23* .35**
Emotional Resilience .35**
Interpersonal Finesse .23*
Interpersonal Impact .32** .30**
Product Knowledge
Project and Task Management Skills .24* .22*
Self-Motivated .27** .28**
Teamwork & Cooperation .32**
Technical Knowledge of Subject Area .31** .26*
Overall Performance .41** .51**
** p<.01 *p<.05 +p<.10

55
Adverse Impact Analysis
Adverse impact analyses were conducted on the total sample (n=201) to ensure that the Success Indices would not have adverse impact on protected groups. Impact ratios of proportions passing or failing at the recommended cut-off score for each index were well within normal guidelines:1 TABLE 40: Adverse Impact Ratios for Analyst Success Profile Index
PERCENTAGES PASSING AT EACH LEVEL
PERCENTAGES PASSING AT EACH LEVEL
Index Score
Status Total % Majority (174)
Minority (49)
ImpactRatio
Male (149)
Female (72)
ImpactRatio
0-42 Fail 22
43-70 Pass 78 79 67 .85 75 82 1.09 1 The generally accepted 'Four Fifths' Rule prescribes impact ratios of .80 to 1.20.
TABLE 41: Adverse Impact Ratios for Programmer Success Profile Index
PERCENTAGES PASSING AT EACH LEVEL
PERCENTAGES PASSING AT EACH LEVEL
Index Score
Status Total % Majority (174)
Minority (49)
ImpactRatio
Male (149)
Female (72)
ImpactRatio
0-41 Fail 16
42-68 Pass 84 84 78 .92 79 92 1.16 1The generally accepted 'Four Fifths' Rule prescribes impact ratios of .80 to 1.20.
Conclusions
The following summary conclusions can be drawn from the preceding analyses:
1. ASSESS scales are useful predictors of job behaviors in both the Programmer and Analyst jobs. 2. Desirable ranges of ASSESS scale scores can be used to predict job success. 3. Desirable scale ranges can be combined into predictive Success Indices. 4. The Success Indices are predictive of important job behaviors, as identified by a Competency Analysis. 5. The Success Indices, as implemented, are fair to minorities and females, and have no observed adverse
impact.
Within the normally accepted range of .8 - 1.2
Within the normally accepted range of .8 - 1.2

56
T a i l o r i n g t h e A S S E S S E x p e r t S ys t e m Example 7: District Sales Managers at a Nationwide Electronics Retailer
Background
In 2000, a nationwide electronics retailer with over 7,000 stores located in 200 districts asked Bigby, Havis & Associates to assist in the evaluation of future candidates for the position of District Sales Manager (DSM). DSMs are responsible for the operation and resulting sales of the retail stores within their district and are actively involved in recruitment, staffing, coaching and development of all store personnel. They serve as the store managers’ resource for corporate programs and communication. The company had experienced what they considered a high rate of performance failure in the DSM position and wanted to do a better job of selecting and promoting candidates who would have the potential to become top performers. As part of a larger project to develop a core competency model for this position and integrate the model into the selection and development processes, it was determined to use the ASSESS Expert System version of a full psychological assessment, as a component of the program. Thus, the project included a concurrent validation study to develop an ASSESS-based success profile for this position.
Sample
All DSMs were asked to complete the ASSESS Survey under conditions of confidentiality. Of the 162 DSMs who completed the ASSESS Survey, 149 were used in the validation sample. The 13 DSMs who were removed from the study either did not have performance information available for the analysis, had extremely high “fake” scores on the ASSESS Survey which brought into question the accuracy of their responses, or had performance scores that were extreme outliers in the distribution of scores. TABLE 42: Validation Study Sample
Group % n
Male 91% 136
Female 7% 10
Prefer Not to Say 2% 3
Majority 83% 124
Minority 15% 22
Prefer Not to Say 2% 3
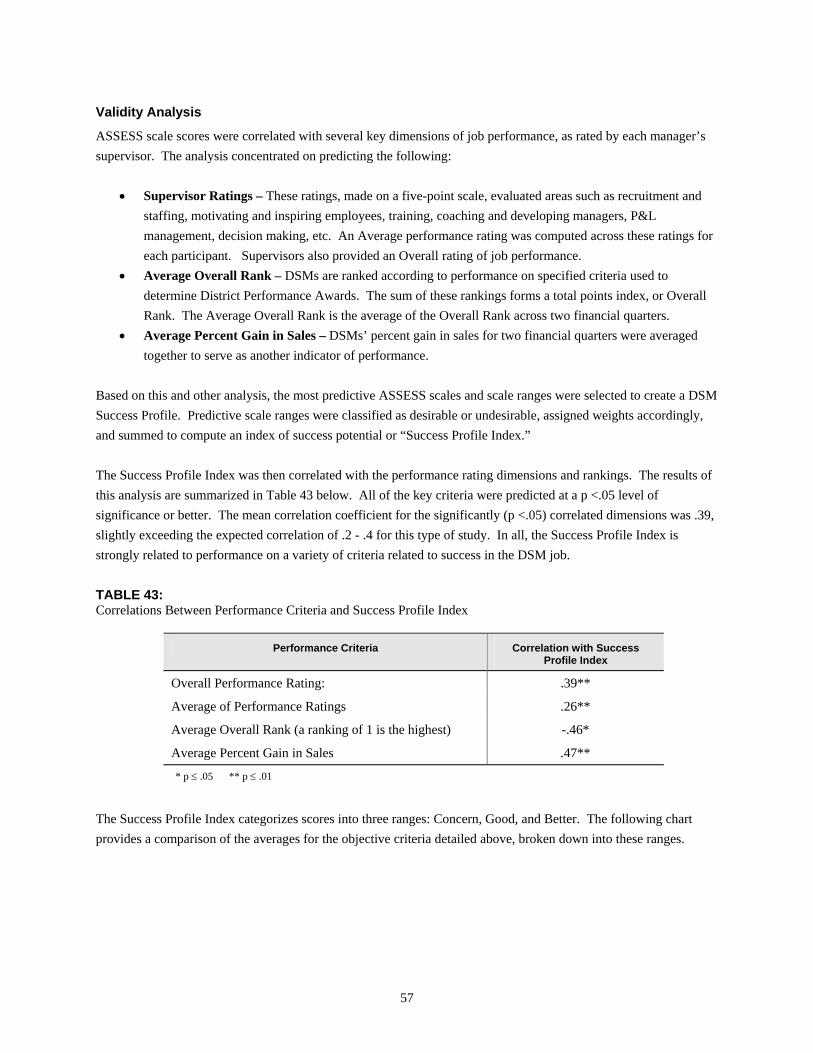
57
Validity Analysis
ASSESS scale scores were correlated with several key dimensions of job performance, as rated by each manager’s supervisor. The analysis concentrated on predicting the following:
• Supervisor Ratings – These ratings, made on a five-point scale, evaluated areas such as recruitment and staffing, motivating and inspiring employees, training, coaching and developing managers, P&L management, decision making, etc. An Average performance rating was computed across these ratings for each participant. Supervisors also provided an Overall rating of job performance.
• Average Overall Rank – DSMs are ranked according to performance on specified criteria used to determine District Performance Awards. The sum of these rankings forms a total points index, or Overall Rank. The Average Overall Rank is the average of the Overall Rank across two financial quarters.
• Average Percent Gain in Sales – DSMs’ percent gain in sales for two financial quarters were averaged together to serve as another indicator of performance.
Based on this and other analysis, the most predictive ASSESS scales and scale ranges were selected to create a DSM Success Profile. Predictive scale ranges were classified as desirable or undesirable, assigned weights accordingly, and summed to compute an index of success potential or “Success Profile Index.” The Success Profile Index was then correlated with the performance rating dimensions and rankings. The results of this analysis are summarized in Table 43 below. All of the key criteria were predicted at a p <.05 level of significance or better. The mean correlation coefficient for the significantly (p <.05) correlated dimensions was .39, slightly exceeding the expected correlation of .2 - .4 for this type of study. In all, the Success Profile Index is strongly related to performance on a variety of criteria related to success in the DSM job. TABLE 43: Correlations Between Performance Criteria and Success Profile Index
Performance Criteria Correlation with Success Profile Index
Overall Performance Rating: .39**
Average of Performance Ratings .26**
Average Overall Rank (a ranking of 1 is the highest) -.46*
Average Percent Gain in Sales .47**
* p ≤ .05 ** p ≤ .01
The Success Profile Index categorizes scores into three ranges: Concern, Good, and Better. The following chart provides a comparison of the averages for the objective criteria detailed above, broken down into these ranges.
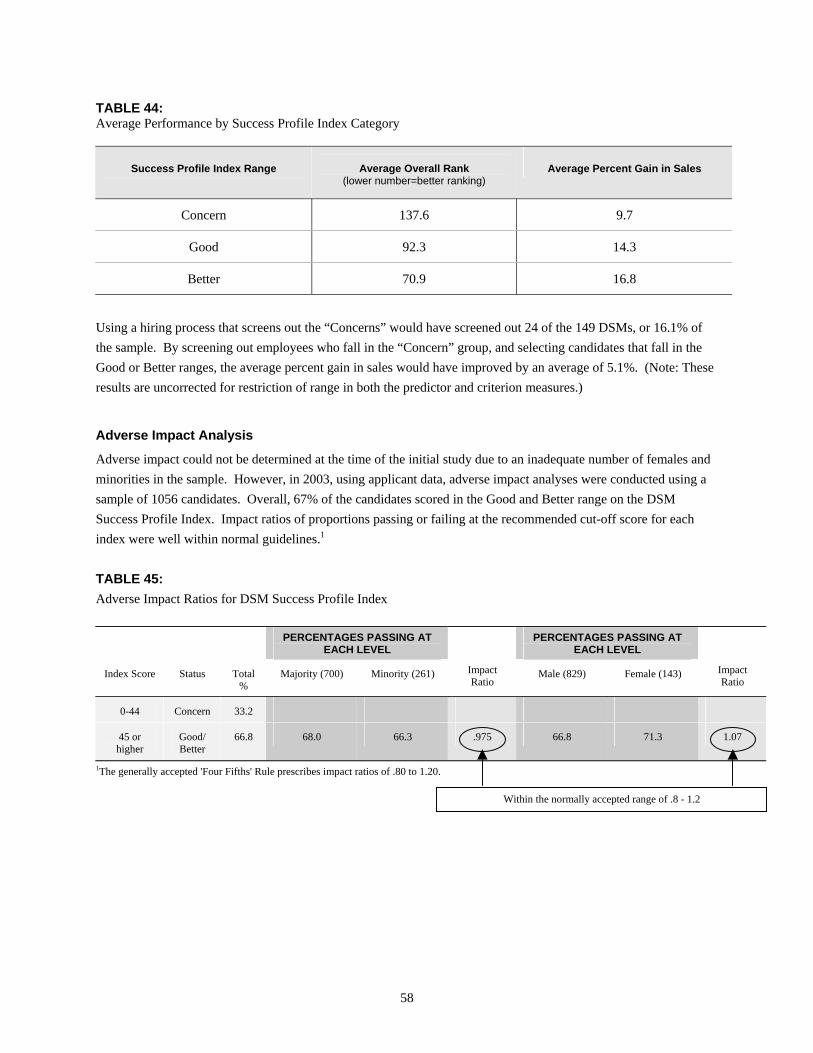
58
TABLE 44: Average Performance by Success Profile Index Category
Success Profile Index Range
Average Overall Rank (lower number=better ranking)
Average Percent Gain in Sales
Concern 137.6 9.7
Good 92.3 14.3
Better 70.9 16.8
Using a hiring process that screens out the “Concerns” would have screened out 24 of the 149 DSMs, or 16.1% of the sample. By screening out employees who fall in the “Concern” group, and selecting candidates that fall in the Good or Better ranges, the average percent gain in sales would have improved by an average of 5.1%. (Note: These results are uncorrected for restriction of range in both the predictor and criterion measures.)
Adverse Impact Analysis
Adverse impact could not be determined at the time of the initial study due to an inadequate number of females and minorities in the sample. However, in 2003, using applicant data, adverse impact analyses were conducted using a sample of 1056 candidates. Overall, 67% of the candidates scored in the Good and Better range on the DSM Success Profile Index. Impact ratios of proportions passing or failing at the recommended cut-off score for each index were well within normal guidelines.1 TABLE 45: Adverse Impact Ratios for DSM Success Profile Index
PERCENTAGES PASSING AT EACH LEVEL
PERCENTAGES PASSING AT EACH LEVEL
Index Score Status Total %
Majority (700) Minority (261) Impact Ratio
Male (829) Female (143) Impact Ratio
0-44 Concern 33.2
45 or higher
Good/ Better
66.8 68.0 66.3 .975 66.8 71.3 1.07
1The generally accepted 'Four Fifths' Rule prescribes impact ratios of .80 to 1.20.
Within the normally accepted range of .8 - 1.2

59
Conclusions
The following summary conclusions can be drawn from the preceding validity, adverse impact and fairness analysis:
1. ASSESS scales are useful predictors of important job behaviors in the DSM job. 2. Desirable ranges of ASSESS scale scores can be used to predict job success. 3. Desirable scale ranges can be combined into a “Success Profile” and a predictive index. 4. The Index is highly predictive of important job behaviors. 5. The Success Profile Index as implemented is fair to minorities and females and has no observed adverse
impact. Tailoring the ASSESS Expert System Example 8: Club Managers for an International Private Club and Resort Leader
Background
Bigby, Havis & Associates was asked to assist in the development of a selection process for Club Managers at an international private club and resort leader. The ASSESS Expert System was selected as an appropriate measure of many of the competencies identified as important to these Club Manager jobs. A concurrent validation study was conducted to empirically demonstrate the predictive validity of ASSESS.
Sample
Current Club Managers from across the country were ask to complete the ASSESS Survey under conditions of confidentiality. At about the same time, supervisor ratings and club performance data were collected for each location. One hundred ninety-nine (199) Club Managers completed the ASSESS Survey, while performance information was obtained on 128 participants. The total sample was composed as follows: TABLE 46: Validation Study Sample
Group % n
Male 65 130 Female 8 15
Prefer Not to Say 27 10
Majority 90 139 Minority 4 6
Prefer Not to Say 6 10
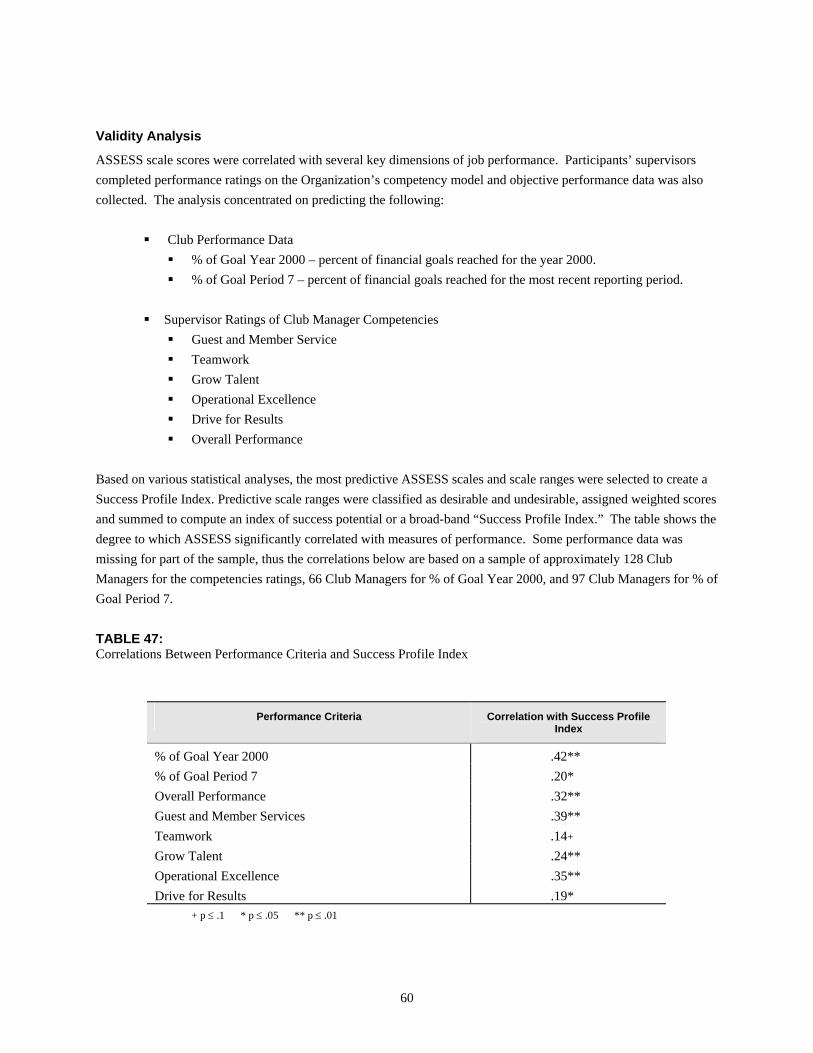
60
Validity Analysis
ASSESS scale scores were correlated with several key dimensions of job performance. Participants’ supervisors completed performance ratings on the Organization’s competency model and objective performance data was also collected. The analysis concentrated on predicting the following:
Club Performance Data % of Goal Year 2000 – percent of financial goals reached for the year 2000. % of Goal Period 7 – percent of financial goals reached for the most recent reporting period.
Supervisor Ratings of Club Manager Competencies Guest and Member Service Teamwork Grow Talent Operational Excellence Drive for Results Overall Performance
Based on various statistical analyses, the most predictive ASSESS scales and scale ranges were selected to create a Success Profile Index. Predictive scale ranges were classified as desirable and undesirable, assigned weighted scores and summed to compute an index of success potential or a broad-band “Success Profile Index.” The table shows the degree to which ASSESS significantly correlated with measures of performance. Some performance data was missing for part of the sample, thus the correlations below are based on a sample of approximately 128 Club Managers for the competencies ratings, 66 Club Managers for % of Goal Year 2000, and 97 Club Managers for % of Goal Period 7. TABLE 47: Correlations Between Performance Criteria and Success Profile Index
Performance Criteria Correlation with Success Profile Index
% of Goal Year 2000 .42** % of Goal Period 7 .20* Overall Performance .32** Guest and Member Services .39** Teamwork .14+ Grow Talent .24** Operational Excellence .35** Drive for Results .19*
+ p ≤ .1 * p ≤ .05 ** p ≤ .01

61
The Success Profile Index was categorized into recommended scoring ranges, Avoid, Consider and Pursue. Differences in mean performance (percentage of goal met) were found at each range for both year 2000 data and Period 7 data. The graphs below display the results. Those scoring in the Avoid range were on average at less than 90% of Goal, while those scoring in the Pursue range were on average above 100% of Goal.
80
85
90
95
100
105
YEAR 2000 PER. 7
AVOIDCONSIDERPURSUE
Adverse Impact Analysis
Adverse impact could not be determined at the time of the initial study due to an inadequate number of females and minorities in the sample. However, in 2003, using applicant data, adverse impact analyses were conducted using a sample of 216 applicants. The sample size for females was sufficient to conduct the analysis, while the sample size for minority applicants is to small. The latter is reported here only for informational purposes. Overall, 85% of all candidates scored in the Consider and Pursue ranges on the Success Profile Index. For the gender split, impact ratios of proportions passing or failing at the recommended cut-off score for the index were well within normal guidelines.1 TABLE 48: Adverse Impact Ratios for Club Manager Success Profile Index
PERCENTAGES PASSING AT EACH LEVEL
PERCENTAGES PASSING AT EACH LEVEL
Index Score Status Total % (216)
Majority (197)
Minority (15)
Impact Ratio
Male (165)
Female (49)
Impact Ratio
Avoid 0-75 15.1
Consider or Pursue
76 or higher 84.9 85.8 73.3 .85 83.6 89.8 .95
1The generally accepted 'Four Fifths' Rule prescribes impact ratios of .80 to 1.20.
Within the normally accepted range of .8 - 1.2

62
Conclusions
The following summary conclusions can be drawn from the preceding validity, adverse impact and fairness analysis:
1. ASSESS scales are useful predictors of important job behaviors in the Club Manager job. 2. Desirable ranges of ASSESS scale scores can be used to predict job success. 3. Desirable scale ranges can be combined into a “Success Profile” and a predictive index. 4. The Index is highly predictive of important job behaviors. 5. The Success Profile Index as implemented is fair to females and has no observed adverse impact. More
data will need to be collected to evaluate adverse impact on minorities. Tailoring the ASSESS Expert System Example 9: Sales Directors for an International Private Club and Resort
Background
Bigby, Havis & Associates was asked to assist in the development of a selection process for Sales Directors at an international private club and resort leader. The ASSESS Expert System was selected as an appropriate measure of many of the competencies identified as important to these Sales Director jobs. A concurrent validation study was conducted to empirically demonstrate the predictive validity of ASSESS.
Sample
Over 131 Sales Directors from across the country completed the ASSESS Survey under conditions of confidentiality. At the same performance ratings were collected based on the organization’s competency model. These ratings were made by the participant’s direct supervisor. A total of 94 sales directors were rated. The total sample was composed as follows: TABLE 49: Validation Study Sample
Group % n
Male 8 11 Female 57 75
Prefer Not to Say 34 45
Majority 82 82 Minority 2 3
Prefer Not to Say 35 46

63
Validity Analysis
ASSESS scale scores were correlated with several key dimensions of job performance. Participants’ supervisors completed performance ratings on the Organization’s competency model. The analysis concentrated on predicting the following:
Supervisor Ratings of Sales Director Competencies Guest and Member Service Teamwork Grow Talent Operational Excellence Drive for Results Overall Performance
Based on various statistical analyses, the most predictive ASSESS scales and scale ranges were selected to create a Success index. Predictive scale ranges were classified as desirable and undesirable, assigned weighted scores and summed to compute an index of success potential or a broad-band “Success Profile Index.” The table shows the degree to which ASSESS significantly correlated with measures of performance. Some performance data was missing for part of the sample, thus the correlations below are based on a sample of approximately 94 Sales Directors. TABLE 50: Correlations Between Performance Criteria and Success Profile Index
Performance Criteria Correlation with Success Profile Index
Overall Performance Rating .54** Guest and Member Services .38** Teamwork .38** Grow Talent .38** Operational Excellence .34** Drive for Results .34**
+ p ≤ .1 * p ≤ .05 ** p ≤ .01
The Success Index was categorized into recommended scoring ranges, Avoid, Consider and Pursue. Differences in mean Overall Performance ratings are displayed in the graphs below. Note: a rating of 1 indicates individuals who need improvement whereas a rating of 5 indicates individuals who are a ‘superstar’ and a model of performance.

64
0
1
2
3
4
5
Overall Perf.
AVOIDCONSIDERPURSUE
In the Sales Director validation study, if we had screened out those scoring in the Avoid range on the Success Index we would have avoided hiring approximately 84.4% of those who were rated as bottom performers by their supervisors, while still considering almost 87% of those rated as top performers.
Adverse Impact Analysis
Adverse impact could not be determined at the time of the initial study due to an inadequate number of minorities in the sample. However, in 2003, using applicant data, adverse impact analyses were conducted using a sample of 340 applicants. Overall, 77% of all candidates scored in the Consider and Pursue ranges on the Success Index. Impact ratios of proportions passing or failing at the recommended cut-off score for each index were well within normal guidelines.1 TABLE 51: Adverse Impact Ratios for Sales Director Success Index
PERCENTAGES PASSING AT EACH LEVEL
PERCENTAGES PASSING AT EACH LEVEL
Index Score Status Total % (340)
Majority (289)
Minority (37)
Impact Ratio
Male (64)
Female (263) Impact Ratio
Avoid 0-76 23.4
Consider or Pursue
77 or higher
76.6 77.2 67.6 .88 71.9 77.2 1.07
1The generally accepted 'Four Fifths' Rule prescribes impact ratios of .80 to 1.20.
Within the normally accepted range of .8 - 1.2

65
Conclusions
The following summary conclusions can be drawn from the preceding validity, adverse impact and fairness analysis:
1. ASSESS scales are useful predictors of important job behaviors in the Sales Director job. 2. Desirable ranges of ASSESS scale scores can be used to predict job success. 3. Desirable scale ranges can be combined into a “Success Profile” and a predictive index. 4. The Index is highly predictive of important job behaviors. 5. The Success Index as implemented is fair to minorities and females and has no observed adverse impact.
Tailoring the ASSESS Expert System Example 10: Department Managers for an International Private Club and Resort Leader
Background
Bigby, Havis & Associates was asked to assist in the development of a selection process for Department Managers at an international private club and resort leader. The ASSESS Expert System was selected as an appropriate measure of many of the competencies identified as important to these Department Manager jobs. A concurrent validation study was conducted to empirically demonstrate the predictive validity of ASSESS.
Sample
Approximately 180 Department Managers from across the country completed the ASSESS Survey under conditions of confidentiality. At the same performance ratings were collected based on the organization’s competency model. A total of 140 department managers were rated by their direct supervisor. The total sample was composed as follows: TABLE 52: Validation Study Sample
Group % n
Male 58 104 Female 37 66
Prefer Not to Say 6 10
Majority 85 153 Minority 9 15
Prefer Not to Say 6 11

66
Validity Analysis
ASSESS scale scores were correlated with several key dimensions of job performance. Participants’ supervisors completed performance ratings on the organization’s competency model and existing performance appraisal data was also used. The analysis concentrated on predicting the following:
Supervisor Ratings of Department Manager Competencies Guest and Member Service Teamwork Grow Talent Operational Excellence Drive for Results Overall Performance Existing Performance Ratings (Talent Assessment)
Based on various statistical analyses, the most predictive ASSESS scales and scale ranges were selected to create a Success index. Predictive scale ranges were classified as desirable and undesirable, assigned weighted scores and summed to compute an index of success potential or a broad-band “Success Profile Index.” The table shows the degree to which ASSESS significantly correlated with measures of performance. Some performance data was missing for part of the sample, thus the correlations below are based on a sample of approximately 140 Department Managers. TABLE 53: Correlations Between Performance Criteria and Success Profile Index
Performance Criteria Correlation with Success Profile Index
Talent Assessment Ratings .40** Overall Performance Rating .45** Guest and Member .31** Teamwork .34** Grow Talent .38** Operational Excellence .33** Drive for Results .37**
+ p ≤ .1 * p ≤ .05 ** p ≤ .01
The Success Index was categorized into recommended scoring ranges, Avoid, Consider and Pursue. Differences in mean Overall Performance ratings and mean Talent Assessment ratings are displayed in the graphs below. Note: a rating of 1 indicates individuals who need improvement whereas a rating of 5 indicates individuals who are a ‘superstar’ and a model of performance.

67
0
1
2
3
4
5
Overall Perf. Talent Assmt.
AVOIDCONSIDERPURSUE
In the Department Manager validation study, if we had screened out those scoring in the Avoid range on the Success Index we would have avoided hiring approximately 71.9% of those who were rated as bottom performers by their supervisors, while still considering almost 89% of those rated as top performers.
Adverse Impact Analysis
Adverse impact could not be determined at the time of the initial study due to an inadequate number of females and minorities in the sample. However, in 2003, using applicant data, adverse impact analyses were conducted using a sample of 663 applicants. Overall, 75% of all candidates scored in the Consider and Pursue ranges on the Success Index. Impact ratios of proportions passing or failing at the recommended cut-off score for each index were well within normal guidelines.1 TABLE 54: Adverse Impact Ratios for Department Manager Success Index
PERCENTAGES PASSING AT EACH LEVEL
PERCENTAGES PASSING AT EACH LEVEL
Index Score
Status Total (663)
Majority (583)
Minority (80)
Impact Ratio
Male (394)
Female (269)
Impact Ratio
Avoid 0-70 25.5
Consider or Pursue
71 or higher 74.5 75.5 67.5 .89 76.1 72.5 .95
1The generally accepted 'Four Fifths' Rule prescribes impact ratios of .80 to 1.20.
Within the normally accepted range of .8 - 1.2

68
Conclusions
The following summary conclusions can be drawn from the preceding validity, adverse impact and fairness analysis:
1. ASSESS scales are useful predictors of important job behaviors in the Department Manager job. 2. Desirable ranges of ASSESS scale scores can be used to predict job success. 3. Desirable scale ranges can be combined into a “Success Profile” and a predictive index. 4. The Index is highly predictive of important job behaviors. 5. The Success Index as implemented is fair to minorities and females and has no observed adverse impact.
Tailoring the ASSESS Expert System Example 11: Independent Gas Station Operators (Dealers) for an Oil and Gas Company
Background
In 1998, Bigby, Havis & Associates was asked to assist in the development of a selection process for Independent Gas Station Operators (Dealers) for a large oil and gas company who operated a number of company-operated and independently-operated convenience stores and gas stations. An initial study was conducted to determine the critical competencies for the Dealer role, after which a process was implemented that included The ASSESS Expert System, in addition to 3 ability measures and a behavior-based structured interview. A predictive validation study was completed in January of 2001 to empirically demonstrate the predictive validity of the ASSESS personality survey.
Sample
In the course of the validation study, an ASSESS testing battery was administered in a controlled setting to prospective Dealers over a period of 2 years. The testing battery included:
• ASSESS Personality Survey • Raven's Standard Progressive Matrices (shortened) • Financial Concepts Survey (custom test) • Language Comprehension Survey (custom test)
While there were a total of 222 Dealers who completed the battery, only 71 of these were both selected for the Dealer role and had been in the role for enough time to gather reliable performance data. The total sample that completed the personality battery was composed as follows:

69
TABLE 55: Sample Composition
Group % n
Male 89.6% 199
Female 10.4% 23
Majority 34.7% 77
Minority 65.3% 145
Performance data was collected for each of the sample participants who had been selected into the Dealer role and who had been in that role for at least 6 months. The sponsoring organization’s Business Development Manager (the key liaison between the dealer and the organization) for each participant was asked to rate the dealer’s performance on a number of critical criteria identified in the original study, and confirmed in a follow-up job analysis. Raters were coached regarding proper rating techniques to avoid bias, and they had no knowledge of participants' testing results.
Validity Analysis
ASSESS scale scores were correlated with the Business Development Managers’ ratings of job performance. The analysis concentrated on predicting the following measures:
• Overall Performance • Ability as a Multi-Site Operator
Based on this and other analyses, the most predictive ASSESS scales were selected to create a Dealer Success Index. Predictive scale ranges were classified as desirable or undesirable, assigned weights accordingly, and summed to compute a Success Index.
The Success Index was then correlated with the performance rating dimensions. The results of this analysis are summarized in Table 56 below. One hundred percent of the dimensions were predicted at a p < .05 level of significance or better. The correlation with Overall Performance is notably high (.519), exceeding the expected correlations of 0.2 - 0.4 for this type of study. In all, the Dealer Success Profile Index is strongly related to performance on a number of critical in the Dealer role.

70
TABLE 56: Correlations Between Performance Ratings and Success Profile Index
Rating Dimension Correlation with Success Profile Index
Self Reliance/Proactive Nature .47** Communication Skills .29* Organizational Skills .34** Customer Service .35** Competitiveness/Drive .45** Problem Solving/Decision Making .38** Positive Attitude .37** Good Business Knowledge/Sense .47** Works Within Guidelines .28* Managerial Skills .41** Ability as a Multi-Site Operator .39* Overall Performance .58**
** p<.01 *p<.05
Adverse Impact Analysis
Adverse impact analyses were conducted on a sample of 350 candidates to ensure that the Success Indices would not have adverse impact on protected groups. Of the 350 candidates, 95 chose “Prefer Not to Say” when asked for their gender and 111 chose this option when asked for their ethnicity. Impact ratios of proportions passing or failing at the recommended cut-off score for each index were well within normal guidelines1 for the majority/minority population and for the male/female population. TABLE 57: Adverse Impact Ratios for Dealer Success Index
PERCENTAGES PASSING AT EACH LEVEL
PERCENTAGES PASSING AT EACH LEVEL
Index
Score
Status Total %
(350)
Majority
(73)
Minority
(161)
Impact
Ratio
Male
(213)
Female
(37)
Impact
Ratio
0-30 Fail 31.6
31-46 Pass 68.4 74.0 68.3 .92 68.1 73.0 1.07
1 The generally accepted 'Four Fifths' Rule prescribes impact ratios of .80 to 1.20.
Within the normally accepted range of .8 - 1.2
71
Conclusions
The following summary conclusions can be drawn from the preceding analyses:
1. ASSESS scales are useful predictors of job behaviors for the Independent Operator (Dealer) role. 2. Desirable ranges of ASSESS scale scores can be used to predict job success. 3. Desirable scale ranges can be combined into a predictive index (Success Profile). 4. The Index is highly predictive of important job behaviors. 5. The Success Index as implemented is fair to groups regardless of gender or ethnicity.
Tailoring the ASSESS Expert System Example 12: Field Sales Representative for an Electronic Distributor
Background
In late 1998, one of the world’s largest distributors of electronic components asked BHA to assist in the evaluation of future candidates for the position Field Sales Representative. Field Sales Representatives are responsible for direct sales of branch products and devices in a defined territory through building effective customer relationships for current and future business. They are responsible for meeting established sales, gross profit and quality measures. The company wanted to do a better job of selecting and promoting candidates who would have the potential to become top performers. The job analysis began with a review of the current job description and success profile. This was followed by a series of focus groups with Branch Managers and best-in-class performers to identify those characteristics which distinguished successful and unsuccessful performers. Based on this job analysis, it was determined to use the ASSESS Expert System version of a full psychological assessment, and to conduct a tailoring and validation study to develop and validate an ASSESS-based success profile for this position.
Sample
The validation sample in this study consisted of all current Field Sales Representatives. The sample was predominantly male (two-thirds of the sample) and there was little minority representation in the study sample. Therefore, adverse impact analysis could only be conducted for gender but not ethnicity.
Validity Analysis
In the fall of 1998, Branch Managers were asked to categorize the performance of each of their field sales representatives into one of four categories: model of what we want, good performer, satisfactory performer and poor performer. This categorization was based on performance in the areas of sales, gross profit, quality and customer service. Once rated at the branch level, Regional Managers reviewed the rankings and refined appropriately when comparing sales performance across markets. As a final check, Sales Executives at headquarters also reviewed the rankings for accuracy. One hundred twenty-nine (129) Field Sales Representatives were ranked using this methodology; one was cited as too new to rate. (Note: at the advice of Human Resources, objective sales

72
data was not used as a criterion in this study because it was felt that the internal system numbers were not a reliable representation of sales performance.) At the same time, all Field Sales Representatives were asked to complete the ASSESS Personality Survey under conditions of confidentiality. Performance data and survey data were matched for a final sample of 104 Field Sales Representatives. Based on various statistical analyses, the most predictive ASSESS scales and scale ranges were selected to create a Success Profile Index. Predictive scale ranges were classified as desirable and undesirable, assigned weighted scores and summed to compute an index of success potential or a broad-band “Success Profile Index.” The Success Profile Index was then correlated with the performance rankings and a correlation coefficient of .28 (p < .05) was obtained. This was within the expected correlation of .2 - .4 for this type of study. The Success Index was then categorized into three groups: Caution, Good and Better. Using a recommended cut-off score of 10 or higher (avoiding the Caution ranges) approximately 27% of the current Field Sales Representatives would be screened out by the index. Using the recommended cut-off score of 10/15 (“avoid the cautions”) the impact of using the Field Seller Success Index on each performance group is depicted in Table 58. TABLE 58: Estimated Impact on Performance Distributions Using Success Index to Screen
Performance Rating Percentage of Current Sample
Percentage of Sample if Success Index Used
Percentage Improvement
Top Performer (model of what we want) 22.1 31.4 42% improvement in
selecting top performers
Mid-level Performer (ranked 2 or 3 out of 4) 65.4 62.9
Poor Performer (what we need to avoid) 12.5 5.7 54% improvement in
avoiding bottom performers
+ p ≤ .1 * p ≤ .05 ** p ≤ .01
Another way of evaluating the impact of the Index is that if an “avoid the caution” strategy were used, only 9% of the current top performers would have been screened out, only 25% of the mid-performers would have been screened-out and 69% of the poor performers would have been avoided.
Adverse Impact Analysis
In the concurrent study, adverse impact on ethnic groups could not be determined due to an inadequate number of minorities in the sample. Table 59 displays adverse impact information by gender. No substantial adverse impact was present for females using the 10 or higher cutoff.

73
TABLE 59: Adverse Impact by Gender
PERCENTAGES PASSING AT EACH LEVEL
Index Score Status Total %(112)
Male (66)
Female (39)
Impact Ratio1
Caution 0-9 26.8
Good / Better 10 or higher 73.2 74.2 69.2 .93
1The generally accepted 'Four Fifths' Rule prescribes impact ratios of .80 to 1.20.
Subsequent to the initial study, data for 613 applicants were analyzed for adverse impact. The Success Index as found to be within EEOC guidelines at the 10 and higher cutoff. TABLE 60: Adverse Impact Ratios
PERCENTAGES PASSING AT EACH LEVEL
PERCENTAGES PASSING AT EACH LEVEL
Index Score
Status Total (613)
Majority (506)
Minority (74)
Impact Ratio
Male (350)
Female (239) Impact Ratio1
0 - 9 Caution 24.5
10 or higher
Good or Better 75.5 74.9 74.3 .99 75.7 74.5
.98 1The generally accepted 'Four Fifths' Rule prescribes impact ratios of .80 to 1.20.
Conclusions
The following summary conclusions can be drawn from the preceding validity, adverse impact and fairness analysis:
1. ASSESS scales are useful predictors of important job behaviors in the Field Sales Representative. 2. Desirable ranges of ASSESS scale scores can be used to predict job success. 3. Desirable scale ranges can be combined into a “Success Profile” and a predictive index. 4. The Index helps to screen-in potential top performers while helping to avoid those that are unsuccessful.
Within the normally accepted range of .8 - 1.2
Within the normally accepted range of .8 - 1.2
74
Tailoring the ASSESS Expert System Example 13: Inside Sales Representative for an Electronic Distributor
Background
In late 1998, one of the world’s largest distributors of electronic components asked BHA to assist in the evaluation of future candidates for the position Inside Sales Representative. Inside Sellers are responsible for selling company products and services via telephone. They work in conjunction with Field Sales Representatives and others to increase customer account penetration. The must meet specified sales objectives. The company wanted to do a better job of selecting and promoting candidates who would have the potential to become top performers. The job analysis began with a review of the current job description and success profile. This was followed by a series of focus groups with Branch Managers, Product Managers and best-in-class performers to identify those characteristics which distinguished successful and unsuccessful performers. Based on this job analysis, it was determined to use the ASSESS Expert System version of a full psychological assessment, and to conduct a tailoring and validation study to develop and validate an ASSESS-based success profile for this position.
Sample
The validation sample in this study consisted of all current inside sales representatives. The sample was predominantly female (approximately 60%) and there was little minority representation in the study sample. Therefore, adverse impact analysis could only be conducted for gender but not ethnicity.
Validity Analysis
In the fall of 1998, branch management (General Managers and Product Managers) were asked to categorize the performance of each of their Inside Sales Representatives into one of four categories: model of what we want, good performer, satisfactory performer and poor performer. This categorization was based on performance in the areas of sales, customer penetration, quality and customer service. Once rated at the branch level, Regional Managers reviewed the rankings and refined appropriately when comparing sales performance across markets. As a final check, Sales Executives at headquarters also reviewed the rankings for accuracy. One hundred thirty-nine (139) Insides Sales Representatives were ranked using this methodology; four were cited as too new to rate. (Note: at the advice of Human Resources, objective sales data was not used as a criterion in this study because it was felt that the internal system numbers were not a reliable representation of sales performance.) At the same time, all Inside Sales Representatives were asked to complete the ASSESS Personality Survey under conditions of confidentiality. Performance data and survey data were matched for a final sample of 112 inside sales representatives. Based on various statistical analyses, the most predictive ASSESS scales and scale ranges were selected to create a Success Profile Index. Predictive scale ranges were classified as desirable and undesirable, assigned weighted scores and summed to compute an index of success potential or a broad-band “Success Profile Index.”

75
The Success Profile Index was then correlated with the performance rankings and a correlation coefficient of .25 (p < .05) was obtained. This was within the expected correlation of .2 - .4 for this type of study. The Success Index was then categorized into three groups: Caution, Good and Better. Using a recommended cut-off score of 21 or higher (avoiding the Caution range ) approximately 37% of the current Inside Sales Representatives would be screened out by the Success Index. Using the recommended cut-off score of 21/ (“avoid the cautions”) the impact of using the Inside Sales Representative Success Index on each performance group is depicted in Table 61. TABLE 61: Estimated Impact on Performance Distributions Using Success Index to Screen
Performance Rating Percentage of Current Sample
Percentage of Sample if Success Index Used
Percentage Improvement
Top Performer (Model of what we want) 15.2 21.0 38% improvement in selecting top performers
Satisfactory Performer (rated 2 or 3 out of 4)
70.5 72.0
Poor Performer 14.3 7.0 51% improvement in avoiding bottom performers
+ p ≤ .1 * p ≤ .05 ** p ≤ .01
Another way of evaluating the impact of the Index is that if an “avoid the Caution” strategy were used, only 12% of the current top performers would have been screened out, only 36% of the mid-performers would have been screened-out and 69% of the poor performers would have been avoided.
Adverse Impact Analysis
In the concurrent study, adverse impact on ethnic groups could not be determined due to an inadequate number of minorities in the sample. Table 62 displays adverse impact information by gender. No substantial adverse impact was present for females at the conservative 21 or higher cutoff or the more stringent 25 and higher cutoff. TABLE 62: Adverse Impact by Gender
PERCENTAGES PASSING AT EACH LEVEL
Index Score Status Total % (133)
Male (51)
Female (78)
Impact Ratio1
Caution 0-20 39.1 31.4 43.6
Good 21-24 38.3 43.1 35.9 .82
Better 25 or higher
22.6 25.5 20.5 .80
1The generally accepted 'Four Fifths' Rule prescribes impact ratios of .80 to 1.20.
Within the normally accepted range of .8 - 1.2

76
Subsequent to the initial study, data for 613 applicants were analyzed for adverse impact. The Success Index as found to be within EEOC guidelines at the conservative 21 and higher cutoff for both ethnicity and gender. While within EEOC guidelines for gender at the more stringent 25 and higher cutoff, the index introduced adverse impact for minorities. TABLE 63: Adverse Impact Ratios
Percentages Passing at Each Level Percentages Passing at Each Level
Index Score Status Total (613)
Majority (506)
Minority (74)
Impact Ratio1
Male (350)
Female (239)
Impact Ratio1
0 - 20 Caution
21 or higher Good 88.3 89.1 82.4 .92 89.4 87 .97
25 or higher 29
Better 40.3 41.1 32.4 .79 42.6 36.0 .85
1The generally accepted 'Four Fifths' Rule prescribes impact ratios of .80 to 1.20.
Conclusions
The following summary conclusions can be drawn from the preceding validity, adverse impact and fairness analysis:
1. ASSESS scales are useful predictors of important job behaviors in the Inside Sales Representative. 2. Desirable ranges of ASSESS scale scores can be used to predict job success. 3. Desirable scale ranges can be combined into a “Success Profile” and a predictive index. 4. The Index helps to screen-in potential top performers while helping to avoid those that are unsuccessful.
Tailoring the ASSESS Expert System Example 14: Business Manager for a Property Management Company
Background
As early as 1991 a nationwide property management company was using the ASSESS Expert System to aid in the selection of field managers in their Business Manager position. Business Managers are responsible for the operations of a single apartment community and are actively involved in both the sales and property management
Within the normally accepted range of .8 - 1.2

77
aspects of the community. This organization had used the assessment services of BHA (and its predecessor firm) for over 25 years for the selection and development of mid and senior-level managers and saw ASSESS as a turnkey assessment solution for field management positions. In 1999 they asked BHA to help them refine their hiring process for this position. Previously they had used a normative template developed for the company, but based on discussions, it was determined to develop an ASSESS Success Profile and corresponding Success Index to improve the probability of selecting candidates with high potential. A predictive validation study was completed to empirically demonstrate the predictive validity of the ASSESS personality survey.
Sample
While the ASSESS database for this client had grown to over 1,025 cases over the preceding decade, only a small subset of this group were still currently employed as Business Managers. Criterion rating forms were developed using input from focus groups with current Business Managers and separately their direct supervisors, the Regional Property Managers. Ratings were obtained on a sample of 100 Business Managers who were currently employed or had been employed over the past year. Matched data --ASSESS data and supervisor ratings --were obtained on a sample of 54.
Validity Analysis
ASSESS scale scores and intellectual ability results were correlated with the Business Managers’ ratings of job performance. The analysis concentrated on predicting the following measures:
• Overall Performance • Management Ability • Ability to Learn • Math Skills • Relations with Customers
Based on this and other analyses, the most predictive ASSESS scales and most predictive ability tests were selected to create a Success Index. Predictive scale ranges were classified as desirable or undesirable, assigned weights accordingly, and summed to compute a Success Index.
The Success Index was then correlated with the performance rating dimensions. The results of this analysis are summarized in Table 64 below. All of the critical dimensions were predicted at a p < .05 level of significance or better. The correlation ranged from .30 to .38 well within the expected correlations of .2 - .4 for this type of study. In all, the Business Manager Success Profile Index is strongly related to performance on a number of critical in the role.

78
TABLE 64: Correlations Between Performance Ratings and Success Profile Index
Rating Dimension Correlation with Success Profile Index
Overall Performance .38** Management Ability .32* Ability to Learn .36** Math Skills .30** Relations with Customers .36** ** p<.01 *p<.05
Adverse Impact Analysis
Adverse Impact Analyses were conducted on the total sample (n=593) to ensure that the Success Indices would not have adverse impact on protected groups. Impact ratios of proportions passing or failing at the recommended cut-off score for each index were well within normal guidelines1 for the majority/minority population and female/male populations. TABLE 65: Adverse Impact Ratios for Business Manager Success Index
Percentages Passing at Each Level Percentages Passing at Each Level
Index Score
Status Total % (563)
Majority (386
Minority (103)
Impact Ratio
Male (82)
Female (429)
ImpactRatio
0-15 Avoid
16 or higher
Consider 92.1 89.1 86.4 .97 93.7 92.1 .98
18 or higher
Pursue 58.0 60.4 55.3 .92 63.4 58.7 .93
1 The generally accepted 'Four Fifths' Rule prescribes impact ratios of .80 to 1.20.
Conclusions
The following summary conclusions can be drawn from the preceding analyses:
1. ASSESS scales are useful predictors of job behaviors for the Business Manager role. 2. Desirable ranges of ASSESS scale scores can be used to predict job success. 3. Desirable scale ranges can be combined into a predictive index (Success Profile). 4. The Index is highly predictive of important overall job performance. 5. The Success Index as implemented is fair to minorities and females.
Within the normally accepted range of .8 - 1.2

79
Tailoring the ASSESS Expert System Example 15: Store Managers at a Regional U.S. Grocer
Background
In 2000, a northeastern US grocery store company asked Bigby, Havis & Associates to improve the hiring process for Store Managers. Store Managers are responsible for grocery stores with revenue ranging from several hundred thousand to millions of dollars, and supervise several department and assistant managers, in addition to a workforce of associates, clerks, stockers, and other specialized employees. Store Managers are responsible for a variety of job duties, chief among them operating a profitable location through achieving budgeted operating profit and sales goals, and effectively managing human, capital, and other resources. When BHA was contacted, the company was using a selection process that incorporated a large number of assessments (e.g., personality, intellectual ability), but had no method of integrating data or standardizing the interpretation of these measures across locations. By collecting performance criteria data and analyzing this compared to ASSESS personality and intellectual ability data, BHA created an easy to interpret success index for hiring managers to use in selecting Store Managers.
Sample
100 current Store Managers completed the ASSESS survey. Of these, objective financial and subjective supervisor performance criteria were available for 92. Approximately 35 of these remaining managers were removed from the sample because of incomplete or problematic data. These managers were removed from the sample for a number of reasons. First, Store Managers responsible for stores that opened or closed during the time period within which data was gathered were removed to eliminate the possibility of incorrect budgeted figures. Additionally, stores involved in marketing tests (such as advertising withdrawal) were eliminated because of the likely artificial influence these activities had on store performance. A total of 57 remaining Store Managers were involved in the validation project. TABLE 66: Validation Study Sample
Group % n
Male 95% 54
Female 5% 3
Majority 95% 54
Minority 5% 3
80
Validity Analysis
Various statistical analyses were conducted to determine the best predictor set of items and scales in the Validation Sample. The resulting work characteristics and integrity indices are significantly correlated with key measures of job performance. Several different performance criteria were collected for the Store Managers in this sample. After speaking with company representatives to identify what was most important, Bigby, Havis & Associates focused on the following key dimensions.
• Percentage of Budgeted Sales Achieved – The percentage of sales achieved compared to budgeted sales. For this dimension, a manager performing exactly as well as budgeted would have a score of 100%. **Note: This criterion had virtually no variance in the sample, and as such, is only included in the Composite Performance Index. It is
not reported separately in the data below.
• Percentage of Budgeted Operating Profit Achieved – The percentage of operating profit (Sales minus
operating costs) achieved compared to budget. For this dimension, a manager performing exactly as budgeted would have a score of 100%.
• The above dimensions were combined into a Composite Performance Index, weighting Budgeted Sales
30% and Budgeted Operating Profit 70%. This weighting was adopted because these percentages are used in calculating performance-based manager bonuses within the company.
• Dollar Amount Difference Between Actual and Budgeted Operating Profit – The amount of operating
profit cleared over budgeted operating profit. This measure was included as a representation of the magnitude of profit that a manager achieves. This aids in determining the amount of bottom-line profit that managers are generating for their stores—something different from what is represented by the percentages above. For instance, two managers could each achieve 150% of their budgeted operating profit, yet one (for instance, whose store’s budgeted profit was $300,000) could generate significantly more revenue than another (for instance, whose store’s budgeted profit was $50,000).
• Supervisor Ratings on Key Dimensions – All Store Managers were evaluated by their respective District
Coaches on a number of key dimensions, several of which were used in developing the Success Index. These ratings were made on a 5-point scale, ranging from “Needs Much Improvement” to “Superior”. As presented in the correlations table below, higher success index scores were correlated with more positive supervisor ratings on several dimensions.
Based on analyses of these criteria compared to scores on the ASSESS scales & intellectual ability measures, the most predictive ASSESS scales and scale ranges were selected, weighted and added to form a Store Manager Success Profile and Success Index.

81
This Success Index was then correlated with performance rating dimensions and objective criteria. The results of this analysis are summarized in Table 67 below. TABLE 67: Correlations Between Performance Criteria and ASSESS Success Index
Performance Criteria Correlation with ASSESS Success Index
% Budgeted Operating Profit .50**
Composite Performance Index .50**
Difference Between Actual and Budgeted Operating Profit .27**
Supervisor Rating, “Demonstrates a Personal Desire to Succeed” .27*
Supervisor Rating, “Understands P & L” .23*
Supervisor Rating, “Overall Performance” .24*
Supervisor Rating, “Future Potential for District Coach” .259*
**Correlations are significant at p < .01. *Correlations are significant at p < .05 The ASSESS system breaks down scores in the success index into four ranges: Avoid, OK, Good, and Better. Table 68 provides a comparison of the averages for the objective criteria detailed above, broken down into these ranges. TABLE 68: Comparison of Scores Based on Success Index Categories
% of Budgeted Operating Profit Composite Performance Index Difference Between Actual &
Budgeted Operating Profit Success Index Range % % Improved
over Avoid % % Improved over Avoid $
Avoid 50.8 -- 66.0 -- -36,117
OK 105.3 54.5 104.1 38.1 90,763
Good 125.2 77.4 118.4 52.4 115,028
Better 138.9 88.1 128.0 62.0 200,315
By “avoiding the Avoids”, and selecting candidates that fall in the OK, Good, or Better ranges, the client would increase the percent of budgeted operating profit achieved by an average of 72.3% based on this validation study. Additionally, the composite performance index (the basis of current managers’ bonus computation) would have improved by an average of 50.8%.

82
In terms of dollar values, managers in the recommended hiring ranges (Ok, Good, & Better) averaged an actual operating profit of $135,369 over their budgeted operating profit amounts in the validation study, compared to an average loss of $36,117 for the Avoid group. Using a hiring process that “avoids the Avoids” would have screened out 17 of the 100 managers, or 17% of the total sample.
Adverse Impact Analysis
Although adverse impact analyses could not be completed on the original validation sample due to an inadequate number of females and minorities in the sample, a follow-up analysis was completed based on all candidates completing the ASSESS survey through August of 2003. Impact ratios of proportions of majority/minority and males/female groups passing or failing at the recommended cut-off score for each index were well within normal guidelines1. TABLE 69: Adverse Impact Ratios for Grocery Store Manager Success Index
Percentages Passing at Each Level
Percentages Passing at Each Level
Index Score
Status Total % (161)
Majority (126)
Minority (26)
Impact Ratio
Male (100)
Female (55)
ImpactRatio
0-15 Avoid 7.5 7.9 7.7 . 5.0 12.7
16 or higher
OK 92.5 92.1 92.3 1.00 95 87.3 .92
19 or higher
Good 79.5 80.2 76.9 .96 85 69.1 .81
22 or higher
Better 54.0 58.7 34.6 .59 57.0 49.1 .86
1 The generally accepted 'Four Fifths' Rule prescribes impact ratios of .80 to 1.20.
Conclusions
The following summary conclusions can be drawn from the preceding validity, adverse impact and fairness analysis:
1. ASSESS scales are useful predictors of important job behaviors in the Grocery Store Manager job. 2. Desirable ranges of ASSESS scale scores can be used to predict job success. 3. Desirable scale ranges can be combined into a “Success Profile” and a predictive index. 4. The Index is highly predictive of important job behaviors and work outcomes.
Within the normally accepted range of .8 - 1.2
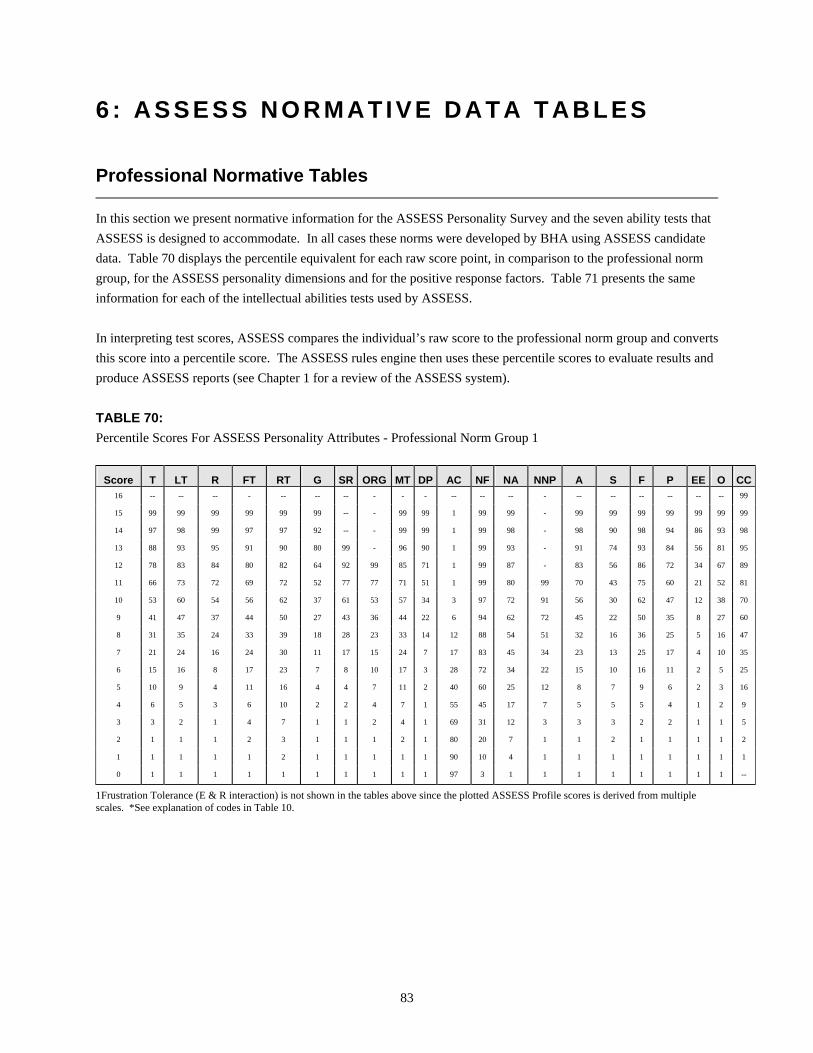
83
6 : ASSESS NORMATIVE DATA TABLES Professional Normative Tables
In this section we present normative information for the ASSESS Personality Survey and the seven ability tests that ASSESS is designed to accommodate. In all cases these norms were developed by BHA using ASSESS candidate data. Table 70 displays the percentile equivalent for each raw score point, in comparison to the professional norm group, for the ASSESS personality dimensions and for the positive response factors. Table 71 presents the same information for each of the intellectual abilities tests used by ASSESS. In interpreting test scores, ASSESS compares the individual’s raw score to the professional norm group and converts this score into a percentile score. The ASSESS rules engine then uses these percentile scores to evaluate results and produce ASSESS reports (see Chapter 1 for a review of the ASSESS system). TABLE 70: Percentile Scores For ASSESS Personality Attributes - Professional Norm Group 1
Score T LT R FT RT G SR ORG MT DP AC NF NA NNP A S F P EE O CC16 -- -- -- - -- -- -- - - - -- -- -- - -- -- -- -- -- -- 99
15 99 99 99 99 99 99 -- - 99 99 1 99 99 - 99 99 99 99 99 99 99
14 97 98 99 97 97 92 -- - 99 99 1 99 98 - 98 90 98 94 86 93 98
13 88 93 95 91 90 80 99 - 96 90 1 99 93 - 91 74 93 84 56 81 95
12 78 83 84 80 82 64 92 99 85 71 1 99 87 - 83 56 86 72 34 67 89
11 66 73 72 69 72 52 77 77 71 51 1 99 80 99 70 43 75 60 21 52 81
10 53 60 54 56 62 37 61 53 57 34 3 97 72 91 56 30 62 47 12 38 70
9 41 47 37 44 50 27 43 36 44 22 6 94 62 72 45 22 50 35 8 27 60
8 31 35 24 33 39 18 28 23 33 14 12 88 54 51 32 16 36 25 5 16 47
7 21 24 16 24 30 11 17 15 24 7 17 83 45 34 23 13 25 17 4 10 35
6 15 16 8 17 23 7 8 10 17 3 28 72 34 22 15 10 16 11 2 5 25
5 10 9 4 11 16 4 4 7 11 2 40 60 25 12 8 7 9 6 2 3 16
4 6 5 3 6 10 2 2 4 7 1 55 45 17 7 5 5 5 4 1 2 9
3 3 2 1 4 7 1 1 2 4 1 69 31 12 3 3 3 2 2 1 1 5
2 1 1 1 2 3 1 1 1 2 1 80 20 7 1 1 2 1 1 1 1 2
1 1 1 1 1 2 1 1 1 1 1 90 10 4 1 1 1 1 1 1 1 1
0 1 1 1 1 1 1 1 1 1 1 97 3 1 1 1 1 1 1 1 1 --
1Frustration Tolerance (E & R interaction) is not shown in the tables above since the plotted ASSESS Profile scores is derived from multiple scales. *See explanation of codes in Table 10.

84
Positive Response Factor 1 SCORE % SCORE %
40 -- 19 13
39 99 18 9
38 99 17 7
37 99 16 4
36 99 15 2
35 99 14 2
34 99 13 1
33 99 12 1
32 96 11 1
31 93 10 1
30 88 9 1
29 82 8 1
28 75 7 1
27 68 6 1
26 60 5 1
25 51 4 1
24 43 3 1
23 34 2 1
22 27 1 1
21 21 0 1
20 15
Positive Response Factor 2 SCORE %
21-24 99
20 97
19 94
18 89
17 83
16 74
15 66
14 57
13 48
12 38
11 31
10 22
9 15
8 10
7 7
6 4
5 2
4 1
3 1
2 1
1 1
0 1

85
TABLE 71: Percentile Scores For ASSESS Ability Tests - Professional Norm Group
WATSON-GLASER SCORE % SCORE %
40 99 19 4
39 99 18 3
38 95 17 2
37 89 16 1
36 85 15 1
35 78 14 1
34 69 13 1
33 64 12 1
32 56 11 1
31 48 10 1
30 41 9 1
29 36 8 1
28 30 7 1
27 25 6 1
26 22 5 1
25 18 4 1
24 14 3 1
23 11 2 1
22 79 1 1
21 7 0 1
20 5
(n=5599)
THURSTONE SCORE % SCORE % SCORE % SCORE %
122-126 99 91 93 60 38 29
121 99 90 92 59 35 28
120 99 89 91 58 33 27
119 99 88 90 57 32 26
118 99 87 89 56 30 25
117 99 86 88 55 28 24
116 99 85 86 54 25 23
115 99 84 85 53 23 22
114 99 83 84 52 22 21
113 99 82 82 51 20 20
112 99 81 81 50 19 19
111 99 80 79 49 17 18
110 99 79 77 48 15 17
109 99 78 76 47 14 16
108 99 77 74 46 12 15
107 99 76 72 45 11 14
106 99 75 70 44 11 13
105 99 74 68 43 9 12
104 98 73 66 42 9 11
103 98 72 64 41 8 10
102 98 71 62 40 7 9
101 98 70 60 39 6 8
100 97 69 57 38 5 7
99 97 68 56 37 5 6
98 97 67 54 36 4 5 1
97 96 66 51 35 4 4 1
96 96 65 49 34 3 3 1
95 95 64 46 33 3 2 1
94 95 63 44 32 3 1 1
93 94 62 42 31 2 0 1
92 94 61 40 30 2
(n=3823)
RAVEN'S PROG. MAT. SCORE % SCORE %
35 99 14 1
34 99 13 1
33 94 12 1
32 83 11 1
31 74 10 1
30 59 9 1
29 50 8 1
28 37 7 1
27 30 6 1
26 24 5 1
25 17 4 1
24 13 3 1
23 9 2 1
22 7 1 1
21 5 0 1
20 4
19 3
18 3
17 3
16 1
15 1
(n=9475)

86
EAS 1 EAS 2 SCORE % SCORE % SCORE % SCORE %
30 99 75 99 45 68 15 5
29 99 74 99 44 67 14 4
28 99 73 99 43 65 13 3
27 99 72 99 42 64 12 3
26 98 71 99 41 61 11 1
25 96 70 99 40 59 10 1
24 92 69 99 39 57 9 1
23 87 68 99 38 55 8 1
22 82 67 97 37 52 7 1
21 73 66 97 36 50 6 1
20 63 65 96 35 48 5 1
19 53 64 96 34 44 4 1
18 46 63 95 33 39 3 1
17 38 62 93 32 38 2 1
16 30 61 93 31 36 1 1
15 25 60 91 30 34
14 21 59 89 29 31
13 17 58 88 28 29
12 13 57 87 27 27
11 11 56 84 26 25
10 8 55 83 25 22
9 6 54 81 24 20
8 5 53 80 23 17
7 3 52 79 23 14
6 3 51 77 21 12
5 1 50 76 20 10
4 1 49 74 19 8
3 1 48 73 18 7
2 1 47 71 17 5
1 1 46 70 16 5
(n=1256)
EAS 7 SCORE % SCORE %
30 99 9 1829 99 8 15
28 99 7 12
27 99 6 10
26 99 5 8
25 98 4 6
24 97 3 4
23 96 2 3
22 94 1 1
21 91 0 1
20 88
19 83
18 76
17 68
16 60
15 54
14 46
13 40
12 34
11 28
10 23
(n=991)
ARITHMETIC REASONINGSCORE % SCORE %
25 99 4 224 99 3 1
23 99 2 1
22 96 1 1
21 93 0 1
20 90
19 89
18 79
17 73
16 66
15 61
14 52
13 43
12 36
11 29
10 24
9 18
8 13
7 10
6 7
5 5
(n=1428)
87
ASSESS Templates - Normative Information
The remainder of this chapter presents tables depicting ASSESS Templates for specific job groups. ASSESS Templates provide information regarding how people in a specific job group typically score on each characteristic. The shaded template bar represents the middle 50% (average range) for a job group compared to professional norms. ASSESS Templates allow you to quickly see how a specific job group may differ from the general professional group. This can be helpful in assessing an individual’s “fit” with specific jobs. A graphic of each of the most general templates (executive, mid-manager, supervisor, professional and sales) is presented here. All of the ASSESS templates may be viewed online at http://www.bigby.com/systems/assessv2/System/reports/graphicprofile.asp?PageFrom=envision&RType=D&SID=18&Preview=Admin. Table 72 provides information regarding each of the template samples.

88
The Five General Templates
In this section we present the ASSESS Templates for the five general groups.

89

90
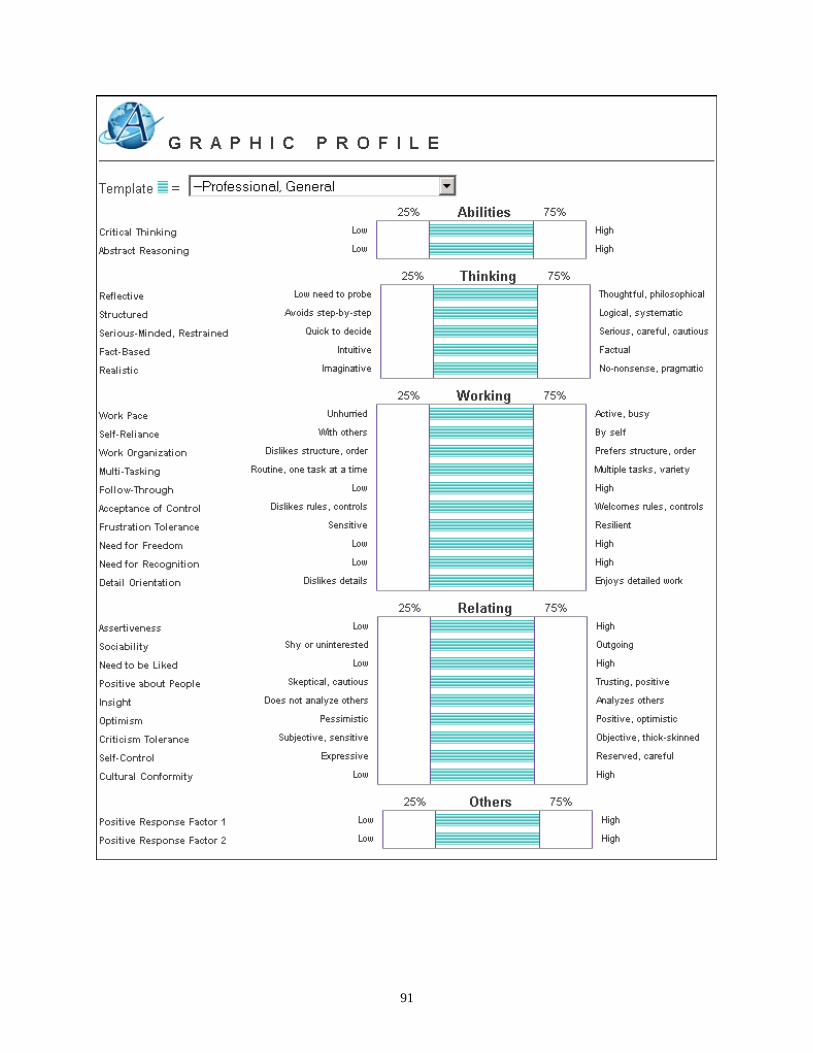
91

92

93
TABLE 72: Sample descriptions for ASSESS Normative Templates
Template Job Description Industries included in developing templates (not limited to…)
SampleSize
General
Executive, General Top level manager responsible for making key decisions
Wide variety—including banking, insurance, manufacturing, real estate, retail and utilities.
1785
Mid-Manager, General Manager of a group of professionals responsible for overseeing the operations of specific departments
Wide variety—including banking, insurance, manufacturing, transportation, retail, utilities and mining
8165
Supervisor, General First line supervisor of professionals Wide variety—including insurance, manufacturing, retail and transportation
752
Professional, General Degreed professional responsible for managing projects rather than people
Wide variety—including banking, insurance, manufacturing, retail and transportation
14979
Sales, General Combination of professionals responsible for representing and selling products
Wide variety—including construction, communication services, hospitality, electronics, insurance, manufacturing, retail and real estate
2822
Management:
Mgmt: Mid-Manager, General
Manager of a group of professionals responsible for overseeing the operations of specific departments
Wide variety—including banking, insurance, manufacturing, transportation, retail, utilities and mining
8165
Mgmt: Supervisor, General
First line supervisor of professionals Wide variety—including insurance, manufacturing, retail and transportation
752
Mgmt: Aviation Manager
Manager of corporate flight personnel Corporate flight departments 46
Mgmt: Branch Manager
Manager of an individual branch institution
Banking, distribution and transportation 157
Mgmt: C-Store Manager
Manager of individual convenience stores
Convenience stores 1200
Mgmt: C-Store District Manager
Manager of several convenience stores within a specific district or zone
Convenience stores 628
Mgmt: Construction Manager
Manager of construction and maintenance of structures, facilities and systems
Construction, manufacturing, retail and real estate
97
Mgmt: Grocery Store Manager
Manager of individual grocery stores Large grocery chains 115
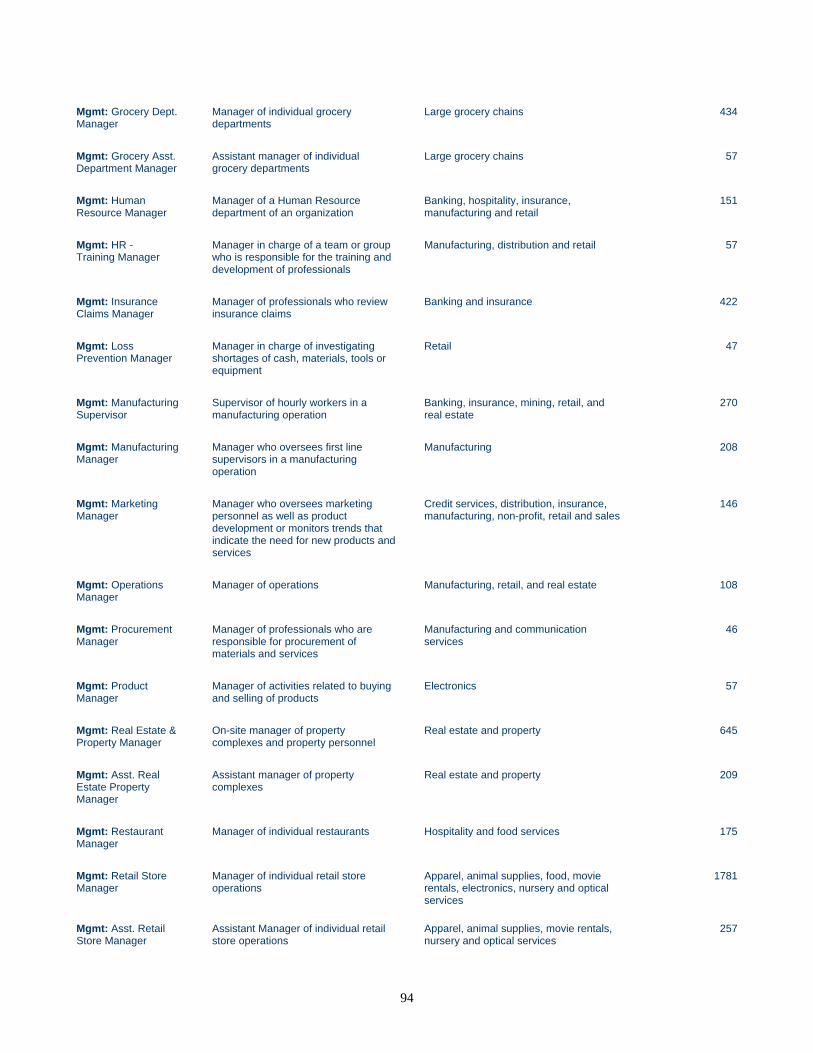
94
Mgmt: Grocery Dept. Manager
Manager of individual grocery departments
Large grocery chains 434
Mgmt: Grocery Asst. Department Manager
Assistant manager of individual grocery departments
Large grocery chains 57
Mgmt: Human Resource Manager
Manager of a Human Resource department of an organization
Banking, hospitality, insurance, manufacturing and retail
151
Mgmt: HR - Training Manager
Manager in charge of a team or group who is responsible for the training and development of professionals
Manufacturing, distribution and retail 57
Mgmt: Insurance Claims Manager
Manager of professionals who review insurance claims
Banking and insurance 422
Mgmt: Loss Prevention Manager
Manager in charge of investigating shortages of cash, materials, tools or equipment
Retail 47
Mgmt: Manufacturing Supervisor
Supervisor of hourly workers in a manufacturing operation
Banking, insurance, mining, retail, and real estate
270
Mgmt: Manufacturing Manager
Manager who oversees first line supervisors in a manufacturing operation
Manufacturing 208
Mgmt: Marketing Manager
Manager who oversees marketing personnel as well as product development or monitors trends that indicate the need for new products and services
Credit services, distribution, insurance, manufacturing, non-profit, retail and sales
146
Mgmt: Operations Manager
Manager of operations Manufacturing, retail, and real estate 108
Mgmt: Procurement Manager
Manager of professionals who are responsible for procurement of materials and services
Manufacturing and communication services
46
Mgmt: Product Manager
Manager of activities related to buying and selling of products
Electronics 57
Mgmt: Real Estate & Property Manager
On-site manager of property complexes and property personnel
Real estate and property 645
Mgmt: Asst. Real Estate Property Manager
Assistant manager of property complexes
Real estate and property 209
Mgmt: Restaurant Manager
Manager of individual restaurants Hospitality and food services 175
Mgmt: Retail Store Manager
Manager of individual retail store operations
Apparel, animal supplies, food, movie rentals, electronics, nursery and optical services
1781
Mgmt: Asst. Retail Store Manager
Assistant Manager of individual retail store operations
Apparel, animal supplies, movie rentals, nursery and optical services
257

95
Mgmt: Retail District Manager
Manager of several retail stores within a specific district or zone
Food, nursery, and personal services 843
Mgmt: Sales Manager Manager in charge of training and supervising sales professionals
Insurance, distribution, food services, manufacturing and retail
799
Executive:
Exec: Executive, General
Executive who plans, directs, and coordinates operational activities at the highest level of management with the help of subordinate managers
Wide variety-- including banking, insurance, manufacturing, real estate, retail and utilities
1785
Exec: CEO Executive who is responsible for running an organization and making key decisions
Banking, distribution, insurance, food services and retail
68
Exec: Start-Up Executive
Executive who plans, directs, and coordinates activities for a start-up company
Various industries-- including computing and e-business
47
Accounting:
Acct: Accountant Professional primarily in organizational role who analyzes, calculates, and verifies financial reports, taxes or cost information
Banking, insurance, financial and retail 379
Acct: Accounts Payable/Receivable
Associates responsible for computing, classifying, and recording numerical data to keep financial records complete
Banking, communication services, insurance, manufacturing, retail and real estate
181
Acct: Internal Auditor Professional who examines and evaluates the firms' financial and information systems, management procedures, and internal controls to protect against fraud and waste
Insurance, communication services and retail
95
Administration:
Admin: Administrative, General
Assistant who performs secretarial, receptionist, and/or other office related duties
Consulting, communication services, insurance, manufacturing, real estate and property management
407
Admin: Executive Assistant
Executive level secretary who reports to mid-level personnel
Banking, insurance, retail and real estate 47
Admin: Receptionist
Assistant who performs administrative duties and is responsible for answering the phone
Consulting, manufacturing, staffing, retail and real estate
66
Admin: Secretary Secretary who performs secretarial duties in an office environment
Consulting, manufacturing and real estate 76
Architecture:
Arch: Architecture, General
Professional who primarily plans and designs structures
Architecture 47

96
Aviation:
Aviation: Aviation Manager
Manager of corporate flight personnel Corporate flight departments 46
Aviation: Corporate Pilot
Professional responsible for safe operation of corporate aircraft
Corporate flight departments 280
Aviation: Maintenance Technician
Technician responsible for the maintenance of aircraft
Corporate flight departments 67
Communications:
Comm: Communications Professional
Professional who plans, directs, and coordinates the communication operations within an organization that provides communication services
Communication Services 64
Consulting:
Cons: Consultant, General
Professional who provides consulting services to outside groups/organizations
Various types of consulting for various industries 165
Engineering:
Eng: Engineering, General
Professionals Consulting, electronics, manufacturing and mining
557
Eng: Electrical Professional who designs, develops, tests, or supervises the manufacturing and installation of electrical equipment, components, or systems
Consulting, electronics and manufacturing 85
Eng: Mechanical Professional who performs engineering duties in planning and designing tools, engines, machines, and other mechanically functioning equipment
Consulting, electronics and manufacturing 61
Eng: Mining Professional who determines the location and plans the extraction of coal, metallic ores, nonmetallic minerals, and building materials, such as stone and gravel
Mining 68
Finance:
Finance: Finance, Analyst
Professional responsible for conducting quantitative analyses of information affecting investment programs of public or private institutions
Banking, insurance and retail 94
Finance: Controller Professional who plans, directs, and coordinates the financial activities of an organization
Banking, electronics, food services, insurance and real estate
168
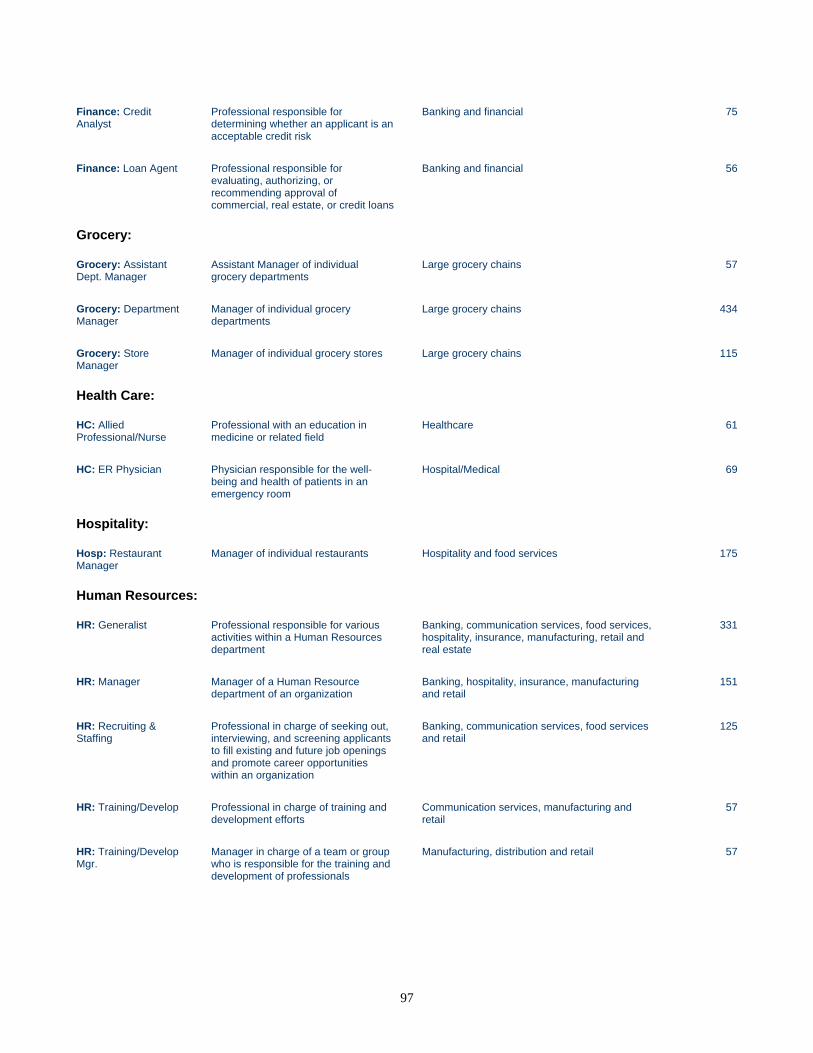
97
Finance: Credit Analyst
Professional responsible for determining whether an applicant is an acceptable credit risk
Banking and financial 75
Finance: Loan Agent Professional responsible for evaluating, authorizing, or recommending approval of commercial, real estate, or credit loans
Banking and financial 56
Grocery:
Grocery: Assistant Dept. Manager
Assistant Manager of individual grocery departments
Large grocery chains 57
Grocery: Department Manager
Manager of individual grocery departments
Large grocery chains 434
Grocery: Store Manager
Manager of individual grocery stores Large grocery chains 115
Health Care:
HC: Allied Professional/Nurse
Professional with an education in medicine or related field
Healthcare 61
HC: ER Physician Physician responsible for the well-being and health of patients in an emergency room
Hospital/Medical 69
Hospitality:
Hosp: Restaurant Manager
Manager of individual restaurants Hospitality and food services 175
Human Resources:
HR: Generalist Professional responsible for various activities within a Human Resources department
Banking, communication services, food services, hospitality, insurance, manufacturing, retail and real estate
331
HR: Manager Manager of a Human Resource department of an organization
Banking, hospitality, insurance, manufacturing and retail
151
HR: Recruiting & Staffing
Professional in charge of seeking out, interviewing, and screening applicants to fill existing and future job openings and promote career opportunities within an organization
Banking, communication services, food services and retail
125
HR: Training/Develop Professional in charge of training and development efforts
Communication services, manufacturing and retail
57
HR: Training/Develop Mgr.
Manager in charge of a team or group who is responsible for the training and development of professionals
Manufacturing, distribution and retail 57

98
Information Systems:
IS: Computer Analyst Professional responsible for analyzing user requirements, procedures, and problems to automate or improve existing systems and reviewing computer system capabilities, workflow, and scheduling limitations
Insurance, food services, manufacturing and retail
336
IS: Computer Engineer
Professional responsible for applying principles and techniques of computer science, engineering, and mathematical analysis to research, design, develop, and test computer or computer-related equipment
Electronics and computing, distribution, insurance and retail
163
IS: Computer Programmer
Professional responsible for developing and writing computer programs as well as converting project specifications and statements of problems and procedures to detailed logical flow charts for coding into computer language
Banking, communication services, healthcare, insurance, food services, manufacturing, and retail
361
IS: Network Administrator
Professional responsible for analyzing, designing, testing, and evaluating network systems, such as local area networks (LAN), wide area networks (WAN), Internet, intranet, and other data communications systems
Insurance, manufacturing, retail and real estate 96
IS: Software Design Professional responsible for developing, creating, and modifying general computer applications software or specialized utility programs
Consulting, distribution and electronics 51
Insurance:
Ins: Actuarial Professional responsible for analyzing statistical data and constructing probability tables to forecast risk and liability for payment of future benefits
Banking, insurance and manufacturing 175
Ins: Adjuster Professional responsible for investigating, analyzing, and determining the extent of insurance company's liability
Insurance 150
Ins: Claims Representative
Associate responsible for the deposition and processing of claims information
Insurance 275
Ins: Claims Manager Manager of professionals who review insurance claims
Banking and insurance 422
Ins: Underwriter Professional responsible for determining whether an applicant is an acceptable risk
Insurance 181
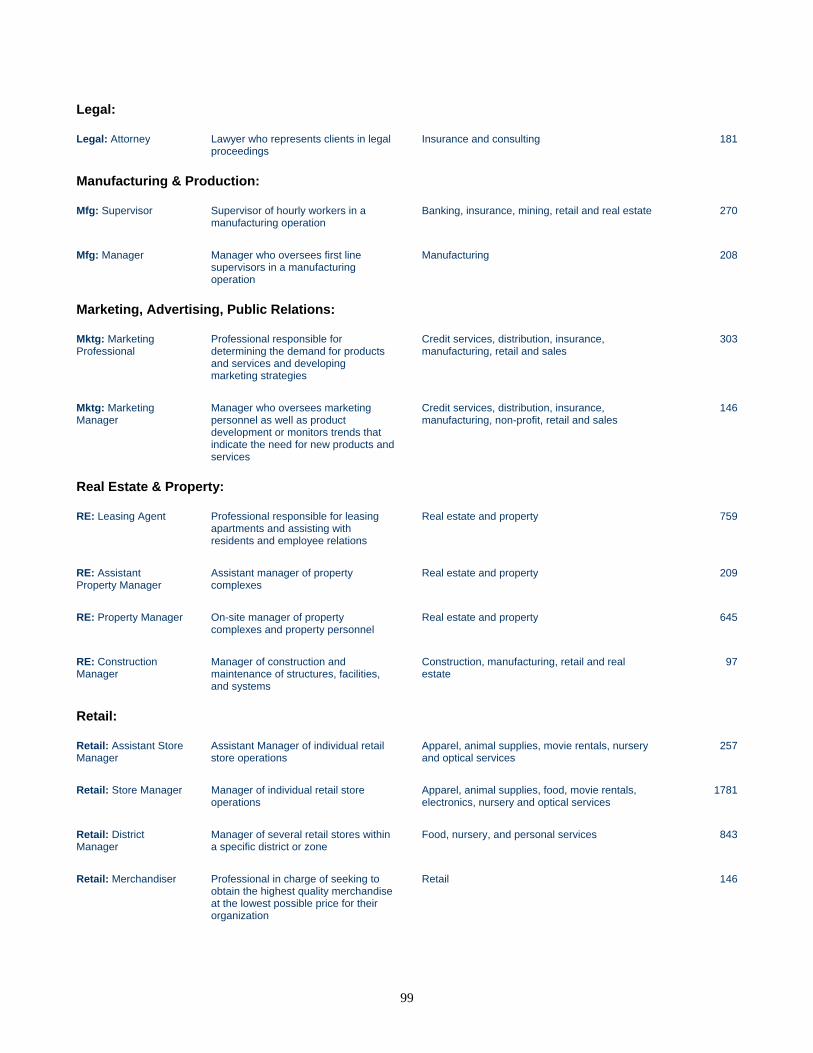
99
Legal:
Legal: Attorney Lawyer who represents clients in legal proceedings
Insurance and consulting 181
Manufacturing & Production:
Mfg: Supervisor Supervisor of hourly workers in a manufacturing operation
Banking, insurance, mining, retail and real estate 270
Mfg: Manager Manager who oversees first line supervisors in a manufacturing operation
Manufacturing 208
Marketing, Advertising, Public Relations:
Mktg: Marketing Professional
Professional responsible for determining the demand for products and services and developing marketing strategies
Credit services, distribution, insurance, manufacturing, retail and sales
303
Mktg: Marketing Manager
Manager who oversees marketing personnel as well as product development or monitors trends that indicate the need for new products and services
Credit services, distribution, insurance, manufacturing, non-profit, retail and sales
146
Real Estate & Property:
RE: Leasing Agent Professional responsible for leasing apartments and assisting with residents and employee relations
Real estate and property 759
RE: Assistant Property Manager
Assistant manager of property complexes
Real estate and property 209
RE: Property Manager On-site manager of property complexes and property personnel
Real estate and property 645
RE: Construction Manager
Manager of construction and maintenance of structures, facilities, and systems
Construction, manufacturing, retail and real estate
97
Retail:
Retail: Assistant Store Manager
Assistant Manager of individual retail store operations
Apparel, animal supplies, movie rentals, nursery and optical services
257
Retail: Store Manager Manager of individual retail store operations
Apparel, animal supplies, food, movie rentals, electronics, nursery and optical services
1781
Retail: District Manager
Manager of several retail stores within a specific district or zone
Food, nursery, and personal services 843
Retail: Merchandiser Professional in charge of seeking to obtain the highest quality merchandise at the lowest possible price for their organization
Retail 146
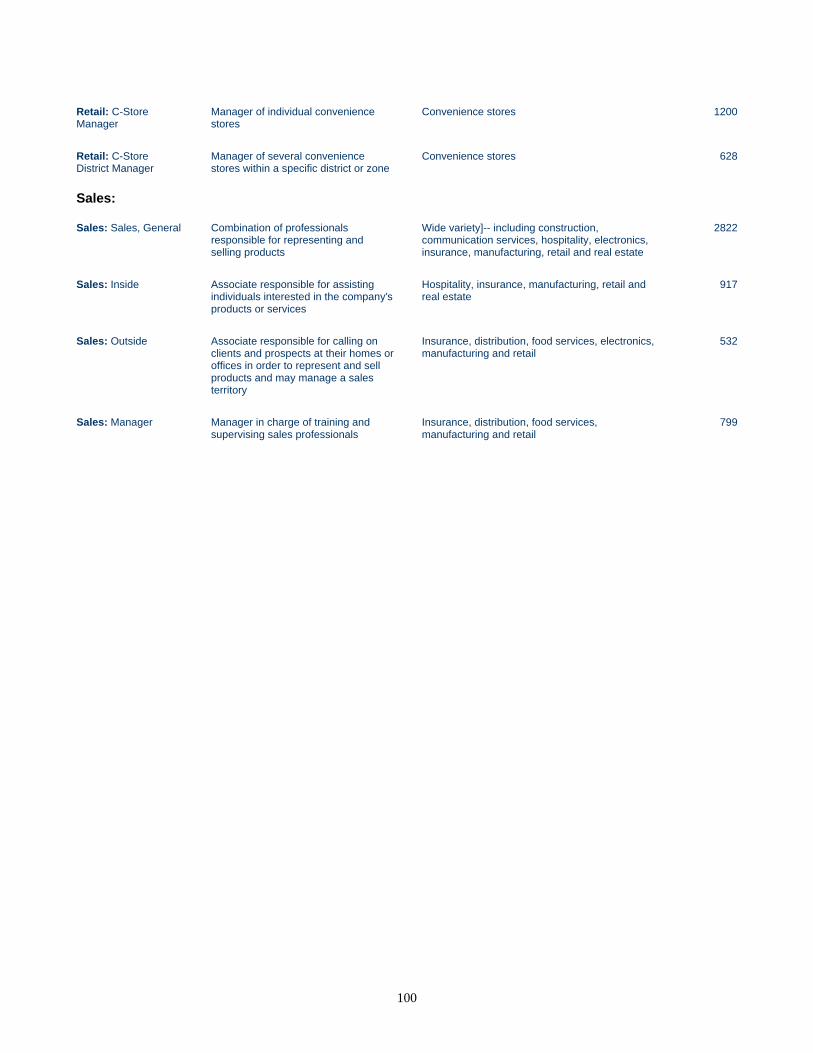
100
Retail: C-Store Manager
Manager of individual convenience stores
Convenience stores 1200
Retail: C-Store District Manager
Manager of several convenience stores within a specific district or zone
Convenience stores 628
Sales:
Sales: Sales, General Combination of professionals responsible for representing and selling products
Wide variety]-- including construction, communication services, hospitality, electronics, insurance, manufacturing, retail and real estate
2822
Sales: Inside Associate responsible for assisting individuals interested in the company's products or services
Hospitality, insurance, manufacturing, retail and real estate
917
Sales: Outside Associate responsible for calling on clients and prospects at their homes or offices in order to represent and sell products and may manage a sales territory
Insurance, distribution, food services, electronics, manufacturing and retail
532
Sales: Manager Manager in charge of training and supervising sales professionals
Insurance, distribution, food services, manufacturing and retail
799

101
7 : B IB L I OG R A P H Y Baker, R.L., & Schutz, R.E. (1961). A criterion factor analysis of the case of Mickey Murphy. Personnel and
Guidance Journal, 40, 282-285.
Barratt, E.S. (1965). Factor analysis of some psychometric measures of impulsiveness and anxiety. Psychological Reports, 16, 547-554.
Barrett, R.S. (1958). The process of predicting job performance. Personnel Psychology, 11, 39-57.
Bendig, A.W. (1960). Ability and personality characteristics of introductory psychology instructors rated competent and empathetic by their students. Journal of Educational Research, 48, 705-709.
Bendig, A.W. (1962a). Factor analyses of the Guilford-Zimmerman Temperament Survey and the Maudsley Personality Inventory. Journal of General Psychology, 67, 21-26.
Bendig, A.W. (1962b). The factorial validity of the Guilford-Zimmerman Temperament Survey. Journal of General Psychology, 67, 309-317.
Bendig, A.W., & Meyer, W.J. (1963). The factorial structure of the scales of the Primary Mental Abilities, Guilford-Zimmerman Temperament Survey, and Kuder Preference Record. Journal of General Psychology, 68, 195-201.
Borgotta, E.F. (1962). The coincidence of subtests in four personality inventories. Journal of Social Psychology, 56, 227-244.
Burke, H.R. (1985). Raven’s Progressive Matrices: More on norms, reliability, and validity. Journal of Clinical Psychology, 41, 231-245.
Burke, H.R., & Bingham, W.C. (1969). Raven’s Progressive Matrices: More on construct validity. Journal of Psychology, 72, 247-251.
Dolke, A.M. (1976). Investigation into certain properties of Raven’s Standard Progressive Matrices Test. Indian Journal of Psychology, 51, 225-236.
Grimsley, G. & Jarrett, H.F. (1975). The relation of past managerial achievement to test measures obtained in the employment situation. Methodology and results - II Personnel Psychology, 26, 31-48.
Guilford, J.P., Christensen, P.R., & Bond, N.A. (1956). The DF Opinion Survey: Manual of Instructions and Interpretations. Beverly Hills, CA: Sheridan Supply Co.
Guilford, J.P., Zimmerman, W.S., & Guilford, J.S. (1976). The Guilford-Zimmerman Temperament Survey Handbook. San Diego: Edits Publishing.
Guilford, J.P., & Martin, H. G. (1944). Age differences in some introvertive and emotional traits. Journal of General Psychology, 31, 219-229.
Harrell, T.W. (1969). Explorations in Personality. New York: Oxford University Press.
Kelly, E.L. (1960). Personal communication. As cited in Guilford, J.P., Zimmerman, W.S., & Guilford, J.S. (1976). The Guilford-Zimmerman Temperament Survey Handbook. San Diego: Edits Publishing.
Krug, R.E., & Moyer, K.E. (1961). An analysis of the F scale: II. Relationship to standardized personality inventories. Journal of Social Psychology, 53, 293-301.
Marks, A., Michael, W.B., & Kaiser, H.F. (1961). Sources of noncognitive variance in 21 measures of creativity. Psychological Reports, 9, 287-290.
Ones, D.S. & Viswesvaran, C. (1996). Test-retest and internal consistency reliabilities of the Big Five dimensions of personality. Unpublished manuscript, University of Minnesota.
Powers, S., & Barkan, J.H. (1986). Concurrent validity for the Standard Progressive Matrices for Hispanic and non-Hispanic seventh grade students. Psychology in the Schools, 23, 330-336.

102
Prefontaine, L.H. (1968). A differential study of five groups of college seminarians on selected aspects of personality development. Unpublished manuscript.
RBH Arithmetic Reasoning Test. (1993). Washington, DC: Richardson, Bellows, Henry & Co., Inc. Raven, J (1986). Manual For Raven’s Progressive Matrices. London: H.K. Lewis & Co. Ltd.
Ruch, W.W., Stang, S.W., McKillip, H.H. & Dye, D.A. (1994). Employee Aptitude Survey Technical Manual 2nd ed. New York: Psychological Services, Inc.
Singer, J.L. & Antrobus, J.S. (1963). A factor-analytic study of daydreaming and conceptually-related cognitive and personality variables. Perceptual and Motor Skill, 17, 187-209.
Sparks, C.P. (1974). Personal communication. As cited in Guilford, J.P., Zimmerman, W.S., & Guilford, J.S. (1976). The Guilford-Zimmerman Temperament Survey Handbook. San Diego: Edits Publishing.
Stagner, R. (1962). Personality variables in union-management relations. Journal of Applied Psychology, 46, 350-357.
Thurstone, L.L. & Thurstone, T.G. (1968). Thurstone Test of Mental Alertness Examiner’s Manual. New York: Science Research Associates, Inc.
Watson, G. & Glaser, E.M. (1980). Watson-Glaser Critical Thinking Appraisal Manual. New York: The Psychological Corporation.