2005-2 analysis of waste management policies in palestine · analysis of waste management policies...
TRANSCRIPT

Analysis of Waste Management Policies in Palestine
Domestic Solid Waste and Wastewater
Executing Agency Applied Research Institute – Jerusalem (ARIJ)
Funded by
U.S. AGENCY FOR INTERNATIONAL DEVELOPMENT
TAMKEEN
Civil Society and Democracy Strengthening Project
2005

II
The Applied Research Institute – Jerusalem (ARIJ) welcomes any comments or suggestions regarding the material published herein and
reserves all copyrights for this publication.
Copyright © Applied Research Institute – Jerusalem (ARIJ), 2005 P.O. Box 860, Caritas Street
Bethlehem, Palestine Tel: +972-2-2741889 - Fax: +972-2-2776966
Website: www.arij.org

III
Research Study Team
Jad Isaac
Abeer Safar
Khaldoun Rishmawi
Ghassan Darwish
Sbeih Sbeih
Anwar Qabajah
Tomas Weinroth
Alice Nassar
Enas Bannourah
IV
Acknowledgement The Applied Research Institute – Jerusalem (ARIJ) hereby expresses its deep gratitude to the Civil Society and Democracy Strengthening Project “Tamkeen” for providing a grant to carry out the research study entitled “Analysis of Waste Management Policies in Palestine”. This publication was made possible by this grant through support provided by the U.S. Agency for International Development/West Bank and Gaza, under the terms of Contract No. 294-C-00-00-00077-00. The opinions expressed herein are those of the research study team and do not necessarily reflect the views of the U.S. Agency for International Development. Special Thanks are given to Dr. Mohammed Al Mbaid, Tamkeen Chief of Party, and Mr. Ziad Faraj for their support to successfully accomplish the research study. ARIJ would like to thank all the persons who worked hard to collect and provide the research study team with the required data pertinent to the management of domestic solid waste and wastewater, namely: Faten Juneidi, Mahmoud Abu Shanab, Nizar Zyoud, Baseema Fuqaha’, Ez Al Dimes, Najeh Bani Ode, Suma Al Jawhari, May Nazzal, Samah Basalat, Atef Jaber and Talat Harb. ARIJ would like to acknowledge the Environmental Quality Authority for its cooperation with the research study team in acquiring the necessary information relevant to the formulation of the Palestinian Environmental Strategy and the National Environmental Action Plan. ARIJ would also like to acknowledge the Palestinian Water Authority and the team of the Sustainable Management of the West Bank and Gaza Aquifers Project (SUSMAQ) for their cooperation with the research study team in terms of reciprocal exchange of data relevant to water and wastewater management in the West Bank and Gaza Strip. Finally, ARIJ would like to thank the heads of local councils for facilitating the work of the surveyors in their localities.

V
Table of Contents ACKNOWLEDGEMENT IV TABLE OF CONTENTS V LIST OF FIGURES VIII LIST OF TABLES XI LIST OF PHOTOS XIV CHAPTER 11 1 INTRODUCTION 1
1.1 IMPORTANCE OF HAVING PROPER WASTE MANAGEMENT POLICIES 5 1.2 FRAMEWORK FOR WASTE MANAGEMENT POLICIES APPRAISAL 7 1.3 CHAPTER SUMMARY 8 1.4 OBJECTIVES AND STRUCTURE OF THE BOOK 8
CHAPTER 22 13 FRAMEWORK FOR WASTE MANAGEMENT POLICIES 13 APPRAISAL 13
2.1 VALUATION TECHNIQUES FOR IMPACTS 13 2.1.1 Valuation Techniques for Environmental Impacts 14
2.1.1.1 Revealed Preference Techniques 14 2.1.1.2 Stated Preference Techniques 15
2.2 IDENTIFICATION OF COSTS AND BENEFITS 16 2.3 CHAPTER SUMMARY 20
CHAPTER 33 21 OPTIONS FOR SOLID WASTE AND WASTEWATER 21 MANAGEMENT 21
3.1 CURRENT DOMESTIC WASTE MANAGEMENT SYSTEM 22 3.1.1 Domestic Solid Waste Management System 22 3.1.2 Domestic Wastewater Management System 27 3.1.3 Waste Management Practices in the Israeli Colonies 34
3.2 OPTIONS FOR SOLID WASTE MANAGEMENT 36 3.2.1 Solid Waste Collection 36 3.2.2 Solid Waste Transport 36 3.2.3 Solid Waste Processing 37
3.2.3.1 Recycling 37 3.2.3.2 Composting 38
3.2.3.2.1 Composting Stages 38 3.2.3.2.2 Composting Technologies 39

VI
3.2.3.3 Incineration “Waste to Energy” 40 3.2.3.3.1 Incineration Technologies 40
3.2.3.4 Landfilling 42 3.2.4 Strategic Options According to the Palestinian Environmental Strategy 43
3.3 OPTIONS FOR WASTEWATER MANAGEMENT 45 3.3.1 Wastewater Collection 45
3.3.1.1 Conventional Gravity Sewer Systems 45 3.3.1.2 Alternative Sewer Systems 46
3.3.1.2.1 Small Diameter Gravity Sewers 46 3.3.1.2.2 Pressure Sewers 47 3.3.1.2.3 Vacuum Sewers 47
3.3.2 Wastewater Treatment 47 3.3.2.1 Secondary Treatment 48
3.3.2.1.1 Activated Sludge 48 3.3.2.1.2 Trickling Filters 49 3.3.2.1.3 Lagoons 49
3.3.2.2 Tertiary Treatment 51 3.3.2.2.1 Tertiary Filtration 51 3.3.2.2.2 Nitrogen Removal 52 3.3.2.2.3 Phosphorus Removal 52 3.3.2.2.4 Disinfection 52
3.3.3 Centralized and Decentralized Wastewater Management Systems 54 3.3.4 Wastewater Reuse 56 3.3.5 Strategic Options According to the Palestinian Environmental Strategy 56
3.4 CHAPTER SUMMARY 57 CHAPTER 44 59 ASSESSMENT OF PUBLIC PERCEPTIONS ABOUT WASTE MANAGEMENT ISSUES 59
4.1 EXISTING DOMESTIC SOLID WASTE AND WASTEWATER MANAGEMENT SYSTEMS 61 4.2 ALTERNATIVE OPTIONS FOR SOLID WASTE AND WASTEWATER MANAGEMENT 72 4.3 PUBLIC WILLINGNESS TO PAY AND/OR PARTICIPATE IN THE WASTE MANAGEMENT PROCESS 76
4.3.1 Public Willingness to Participate in Managing Waste at Source 76 4.3.1.1 Solid Waste Management 76 4.3.1.2 Wastewater Management 82
4.3.2 Public Willingness to Contribute Financially to the Waste Management System 89 4.3.3 Public Acceptance to the Treatment of the Waste Generated by Nearby Localities in their Locality 92
4.4 CHAPTER SUMMARY 95 CHAPTER 55 97 EVALUATION OF OPTIONS 97
5.1 EVALUATION OF OPTIONS FOR SOLID WASTE MANAGEMENT 97 5.1.1 Cost Benefit Analysis of the Current Solid Waste Management System 104
5.1.1.1 Economic Valuation 104 5.1.1.2 Social Valuation 105 5.1.1.3 Environmental Valuation 106
VII
5.1.1.3.1 Landscape Degradation 107 5.1.1.3.2 Loss of Recreational and Aesthetic Values 111 5.1.1.3.3 Air Pollution 112
5.1.2 Cost Benefit Analysis of the Alternative Solid Waste Management Scenarios 116
5.1.2.1 Economic Valuation 116 5.1.2.1.1 Economic Valuation for the Drop off-Buy Back Scenario 116 5.1.2.1.2 Economic Valuation for the Bulk Waste Drop off and Landfill Scenario 122 5.1.2.1.3 Economic Valuation for the Bulk Waste Drop off and Treatment Scenario 125 5.1.2.1.4 Economic Valuation for the Separation-Curbside and Waste Treatment Scenario 128 5.1.2.1.5 Economic Valuation for the Bulk Waste-Curbside and Landfill Scenario 131 5.1.2.1.6 Economic Valuation for the Bulk Waste-Curbside and Waste Treatment Scenario 133 5.1.2.1.7 Economic Valuation for the Bulk Waste-Curbside and Incineration, Composting and Recycling Scenario 136
5.1.3 Synthesis of the Solid Waste Management System 139 5.1.3.1 Drop off-Buy Back Scenario 140 5.1.3.2 Bulk Waste Drop off and landfill Scenario 140 5.1.3.3 Bulk Waste Drop off and Treatment Scenario 140 5.1.3.4 Separation-Curbside and Waste Treatment Scenario 144 5.1.3.5 Bulk Waste-Curbside and Landfill Scenario 144 5.1.3.6 Bulk Waste-Curbside and Waste Treatment Scenario 145 5.1.3.7 Bulk Waste-Curbside and Incineration, Composting and Recycling Scenario 145
5.2 EVALUATION OF OPTIONS FOR WASTEWATER MANAGEMENT 146 5.2.1 Cost Benefit Analysis of the Current Wastewater Management System 148
5.2.1.1 Economic Valuation 148 5.2.1.2 Social Valuation 149 5.2.1.3 Environmental Valuation 150
5.2.1.3.1 Groundwater Pollution 150 5.2.1.3.2 Air Pollution 152
5.2.2 Cost Benefit Analysis of the Centralized Wastewater Management System 153 5.2.2.1 Economic Valuation 153
5.2.2.1.1 Valuation of Economic Costs 154 5.2.2.1.2 Valuation of Economic Benefits 161
5.2.2.2 Social Valuation 162 5.2.3 Cost Benefit Analysis of the Decentralized Wastewater Management System 164
5.2.3.1 Economic Valuation 164 5.2.3.1.1 Valuation of Economic Costs 164 5.2.3.1.2 Valuation of Economic Benefits 167
5.2.3.2 Social Valuation 167 5.2.4 Synthesis of the Wastewater Management System 167
5.2.4.1 Secondary Wastewater Treatment Technologies 168 5.2.4.2 Wastewater Disinfection Systems 171 5.2.4.3 Wastewater Reuse Types 172
CHAPTER 66 175 CONCLUSIONS AND RECOMMENDATIONS 175 REFERENCES 179

VIII
List of Figures Figure 1.1 Structure Of The Research Study 11 Figure 3.1 Number Of Solid Waste Dumping Sites In The West Bank Prior
To And During The Second Intifada 26 Figure 3.2 Locations Of Open Wastewater Discharge Points In The West
Bank 31 Figure 3.3 Locations Of Open Wastewater Discharge Points In The Gaza
Strip 31 Figure 3.4 Solid Waste Quantities Dumped By Israeli Colonists In Dumping
Sites Located In The West Bank 35 Figure 4.1 Interviewees Perceptions About Whether There Are Problems
Associated With The Existing Waste Management Practices In The West Bank 61
Figure 4.2 Interviewees Perceptions About Whether There Are Problems Associated With The Existing Waste Management Practices In The Gaza Strip 61
Figure 4.3 Frequency Of Problems Related To Waste Management As Perceived By Citizens Living In Localities Located Close And Far From Major Pollution Sources In The West Bank 65
Figure 4.4 Frequency Of Problems Related To Waste Management As Perceived By Citizens Living In Localities Located Close And Far From Major Pollution Sources In The Gaza Strip 66
Figure 4.5 Perceived Level Of Adverse Impacts Of The Existing Waste Management Practices On The Natural Resources In The West Bank 70
Figure 4.6 Perceived Level Of Adverse Impacts Of The Existing Waste Management Practices On The Natural Resources In The Gaza Strip 70
Figure 4.7 Observed Level Of Adverse Impacts Of The Existing Waste Management Practices On Human Health In The West Bank 71
Figure 4.8 Observed Level Of Adverse Impacts Of The Existing Waste Management Practices On Human Health In The Gaza Strip 71
Figure 4.9 Frequency Of Solid Waste Processing Methods As Preferred By The Interviewees In The West Bank 72
Figure 4.10 Frequency Of Solid Waste Processing Methods As Preferred By The Interviewees In The Gaza Strip 73
Figure 4.11 Frequency Of Solid Waste Processing Methods As Preferred By The Interviewees In The West Bank Districts 73
Figure 4.12 Frequency Of Solid Waste Processing Methods As Preferred By The Interviewees In The Gaza Strip Districts 74
Figure 4.13 Interviewees Perceptions About Wastewater Management Systems In The West Bank 75
Figure 4.14 Interviewees Perceptions About Wastewater Management Systems In The Districts Of Deir Al Balah And Khan Yunis In The Gaza Strip 75
Figure 4.15 Interviewees Willingness To Separate And Sort The Generated Solid Waste At Source, West Bank 77

IX
Figure 4.16 Interviewees Willingness To Separate And Sort The Generated Solid Waste At Source By District, West Bank 77
Figure 4.17 Interviewees Willingness To Separate And Sort The Generated Solid Waste At Source, Gaza Strip 78
Figure 4.18 Interviewees Willingness To Separate And Sort The Generated Solid Waste At Source By District, Gaza Strip 78
Figure 4.19 Interviewees Willingness To Carry Out Backyard Composting, West Bank 79
Figure 4.20 Interviewees Willingness To Carry Out Backyard Composting By District, West Bank 79
Figure 4.21 Interviewees Willingness To Utilize Compost, West Bank 80 Figure 4.22 Interviewees Willingness To Utilize Compost By District, West
Bank 80 Figure 4.23 Interviewees Willingness To Carry Out Backyard Composting,
Gaza Strip 81 Figure 4.24 Interviewees Willingness To Carry Out Backyard Composting By
District, Gaza Strip 81 Figure 4.25 Interviewees Willingness To Utilize Compost, Gaza Strip 82 Figure 4.26 Interviewees Willingness To Utilize Compost By District, Gaza
Strip 82 Figure 4.27 Interviewees Willingness To Participate In Constructing Small
Scale Wastewater Treatment Plants, West Bank 83 Figure 4.28 Interviewees Willingness To Participate In Constructing Small
Scale Wastewater Treatment Plants By District, West Bank 83 Figure 4.29 Interviewees Willingness To Participate In Constructing Small
Scale Wastewater Treatment Plants, Gaza Strip 84 Figure 4.30 Interviewees Willingness To Participate In Constructing Small
Scale Wastewater Treatment Plants By District, Gaza Strip 84 Figure 4.31 Interviewees Willingness To Use Treated Wastewater For
Agricultural Irrigation Purposes, West Bank 85 Figure 4.32 Interviewees Willingness To Use Treated Wastewater For
Domestic Purposes, West Bank 85 Figure 4.33 Interviewees Willingness To Use Treated Wastewater For
Agricultural Irrigation Purposes By District, West Bank 86 Figure 4.34 Interviewees Willingness To Use Treated Wastewater For
Domestic Purposes By District, West Bank 86 Figure 4.35 Interviewees Willingness To Use Treated Wastewater For
Agricultural Irrigation Purposes, Gaza Strip 87 Figure 4.36 Interviewees Willingness To Use Treated Wastewater For
Domestic Purposes, Gaza Strip 87 Figure 4.37 Interviewees Willingness To Use Treated Wastewater For
Agricultural Irrigation Purposes By District, Gaza Strip 88 Figure 4.38 Interviewees Willingness To Use Treated Wastewater For Domestic
Purposes By District, Gaza Strip 88 Figure 4.39 Interviewees Willingness To Contribute Financially If The Waste
Management System Was Improved, West Bank 89 Figure 4.40 Interviewees Willingness To Contribute Financially If The Waste
Management System Was Improved, Gaza Strip 90
X
Figure 4.41 Interviewees Willingness To Contribute Financially If The Waste Management System Was Improved By District, West Bank 90
Figure 4.42 Interviewees Willingness To Contribute Financially If The Waste Management System Was Improved By District, Gaza Strip 91
Figure 4.43 Interviewees Willingness To Contribute Financially If The Waste Management System Was Improved By Average Monthly Income, West Bank 91
Figure 4.44 Interviewees Willingness To Contribute Financially If The Waste Management System Was Improved By Average Monthly Income, Gaza Strip 92
Figure 4.45 Interviewees Acceptance To The Treatment Of The Waste Generated By Nearby Localities In Their Localities, West Bank 93
Figure 4.46 Interviewees Acceptance To The Treatment Of The Waste Generated By Nearby Localities In Their Localities, Gaza Strip 93
Figure 4.47 Interviewees Acceptance To The Treatment Of The Waste Generated By Nearby Localities In Their Localities By District, West Bank 93
Figure 4.48 Interviewees Acceptance To The Treatment Of The Waste Generated By Nearby Localities In Their Localities By District, Gaza Strip 94
Figure 5.10 Centralized Wastewater Management Systems For The Urban Areas Of The West Bank 147
Figure 5.11 Decentralized Cluster Wastewater Management Systems For The Rural Areas Of The West Bank 148
XI
List of Tables Table 2.1 Environmental Impacts And Valuation Techniques 16 Table 2.2 Indicators Of Impacts Associated With The Waste Management
Practices 18 Table 3.1 Advantages And Drawbacks Of Alternative Solid Waste
Processing Methods 44 Table 3.2 Advantages And Drawbacks Of Secondary Wastewater Treatment
Processes 50 Table 3.3 Advantages And Drawbacks Of Alternative Wastewater
Disinfections Systems 53 Table 3.4 Types Of Reuse, Treatment, And Water Quality Requirements 57 Table 4.1 The Size Of The Random Sample And Confidence Intervals In
Each District 60 Table 4.2 Frequency Of Problems Associated With The Existing Waste
Management Practices In Each Of The West Bank And Gaza Strip Districts 64 Table 4.3 Frequency Of The Causes Of Solid Waste Management Related
Problems In Each Of The West Bank And Gaza Strip Districts 67 Table 4.4 Frequency Of The Causes Of Wastewater Management Related
Problems In Each Of The West Bank And Gaza Strip Districts 69 Table 5.1 Direct Economic Costs Associated With The Current Solid Waste
Management System In The West Bank For Year 2005 104 Table 5.2 Cost Of Diseases Associated With The Existing Improper Solid
Waste Management System In The West Bank For The Year 2003 106 Table 5.3 Land Use/Cover Types Partially Or Completely Losing Their
Ecological Functionality Due To Pollution By The Open Discharge Of Solid Waste And Wastewater Into The Environment In The West Bank 109
Table 5.4 Land Use/Cover Types Partially Or Completely Losing Their Ecological Functionality Due To Pollution By The Open Discharge Of Solid Waste And Wastewater Into The Environment In The Gaza Strip 110
Table 5.5 Emissions Of Greenhouse And Acidifying Gases From The Transport Of The Collected Solid Waste To The Existing Dumping Sites In The West Bank Districts For The Year 2002 113
Table 5.6 Emissions Of Greenhouse And Acidifying Gases From The Open Burning Of Solid Waste And The Biological Degradation Of The Unburned Organic Waste In The Existing Dumping Sites In The West Bank Districts For The Year 2002 115
Table 5.7 Total Projected Economic Costs And Benefits Associated With The Drop Off-Buy Back Scenario For The West Bank 117
Table 5.8 Total Projected Economic Costs And Benefits Associated With The Drop Off-Buy Back Scenario For The Gaza Strip 118
Table 5.9 Total Projected Economic Costs Associated With The Bulk Waste Drop Off And Landfill Scenario For The West Bank 124
XII
Table 5.10 Total Projected Economic Costs Associated With The Bulk Waste Drop Off And Landfill Scenario For The Gaza Strip 125
Table 5.11 Total Projected Economic Costs And Benefits Associated With The Bulk Waste Drop Off And Treatment Scenario For The West Bank 127
Table 5.12 Total Projected Economic Costs And Benefits Associated With The Bulk Waste Drop Off And Treatment Scenario For The Gaza Strip 128
Table 5.13 Total Projected Economic Costs And Benefits Associated With The Separation-Curbside And Waste Treatment Scenario For The West Bank 130
Table 5.14 Total Projected Economic Costs And Benefits Associated With The Separation-Curbside And Waste Treatment Scenario For The Gaza Strip 131
Table 5.15 Total Projected Economic Costs Associated With The Bulk Waste-Curbside And Landfill Scenario For The West Bank 132
Table 5.16 Total Projected Economic Costs Associated With The Bulk Waste-Curbside And Landfill Scenario For The Gaza Strip 133
Table 5.17 Total Projected Economic Costs And Benefits Associated With The Bulk Waste-Curbside And Waste Treatment Scenario For The West Bank 135
Table 5.18 Total Projected Economic Costs And Benefits Associated With The Bulk Waste-Curbside And Waste Treatment Scenario For The Gaza Strip 136
Table 5.19 Total Projected Economic Costs And Benefits Associated With The Bulk Waste-Curbside And Incineration, Composting And Recycling Scenario For The Gaza Strip 138
Table 5.20 Assessment Of The Economic, Social, Environmental And Technical Indicators Related To The Current Solid Waste Management System And The Proposed Scenarios 141
Table 5.21 Full Economic Costs Associated With The Current Wastewater Management System, Projected For 20 Years 149
Table 5.22 Cost Of Diseases Associated With The Existing Improper Wastewater Management System In The West Bank For The Year 2003 149
Table 5.23 Leachate Analysis Results 151 Table 5.24 Wastewater Analysis Results 151 Table 5.25 Total Investment And O&M Costs For Centralized Wastewater
Management Systems Implemented In The Urban Areas Of The West Bank 155 Table 5.26 Total Investment And O&M Costs For Centralized Wastewater
Management Systems Implemented In The Gaza Strip 156 Table 5.27 Costs For A Secondary Wastewater Treatment Plant Serving 1,000
Inhabitants 157 Table 5.28 Total Projected Economic Benefits Associated With The Reuse Of
Wastewater Treated In The Urban Areas Of The West Bank And The Districts Of Gaza Strip Until Year 2023 162
Table 5.29 Total Projected Social Benefits Associated With The Reuse Of Wastewater Treated In The Urban Areas Of The West Bank And The Districts Of Gaza Strip Until Year 2023 163
Table 5.30 Total Investment And O&M Costs For Decentralized Wastewater Management Systems Implemented In The Rural Areas Of The West Bank 165
Table 5.31 Assessment Of The Economic, Social And Technical Indicators Related To The Various Secondary Wastewater Treatment Technologies For The Urban Areas Of The West Bank 169
XIII
Table 5.32 Assessment Of The Economic, Social And Technical Indicators Related To The Secondary Wastewater Treatment Technologies That Adapt To The Rural Areas Of The West Bank 169
Table 5.33 Assessment Of The Economic, Social And Technical Indicators Related To The Various Secondary Wastewater Treatment Technologies That Adapt To The Gaza Strip 170
Table 5.34 Assessment Of The Economic And Technical Indicators Related To The Various Wastewater Disinfection Systems For The Urban Areas Of The West Bank 171
Table 5.35 Assessment Of The Economic And Technical Indicators Related To The Various Wastewater Disinfection Systems For The Gaza Strip 171
Table 5.36 Assessment Of The Economic And Social Costs And Benefits Associated With The Irrigation Reuse Options Of Wastewater Treated In The Urban Areas Of The West Bank 173
Table 5.37 Assessment Of The Economic And Social Costs And Benefits Associated With The Irrigation Reuse Options Of Wastewater Treated In The Gaza Strip 173

XIV
List of Photos Photo 3.1 Open Burning Of Solid Waste In Idna Dumping Site In The
Hebron District 24 Photo 3.2 Solid Waste Management Practice In Dura Dumping Site In The
Hebron District Before Rehabilitation 24 Photo 3.3 Solid Waste Management Practice In Dura Dumping Site In The
Hebron District After Rehabilitation 25 Photo 3.4 Accumulation Of Solid Waste In The Streets Of Bethlehem City
During The Israeli Incursion Of November 2002 25 Photo 3.5 Wastewater Stream That Flows In Wadi En Nar In The Bethlehem
District 29 Photo 3.6 Wastewater Stream That Flows In Wadi Gaza 29 Photo 3.7 Wastewater Stream Flowing From Arial Colony To Palestinian
Agricultural Lands In The Salfit District 35

1
CHAPTER 11 Introduction
he environmentally sound management of waste is among the environmental issues of major concern in protecting and preserving the environment.
Unfortunately, the management of solid waste and wastewater in the Palestinian Territories has never been achieved on an environmentally sound basis. It suffered from great ignorance during the Israeli occupation era when the Israeli Civil Administration was responsible for providing the Palestinian communities with the basic infrastructure services. In that period, the policy of the Israeli Occupation Authorities aimed at serving their interests in the West Bank and Gaza Strip with no concern to the environment and the quality of infrastructure services provided to Palestinians. The infrastructure services, which are the foundation for physical development that is considered a prerequisite for the socioeconomic development of any nation, were left underdeveloped during the occupation period. This has contributed to having fragile socio-economic conditions as well as to the occurrence of several environmental problems with detrimental impacts on human health and socioeconomic well-being. On the other hand, a mutual recognition of the need to protect the environment and utilize natural resources on a sustainable basis was reached between the Palestinians and Israelis during peace negotiations. This has resulted in the transfer of powers and responsibilities to Palestinians to undertake limited environmental management activities in the West Bank and Gaza Strip. In reference to Article 12 of the Oslo II agreement, both parties agreed to cooperate and share the responsibility of preventing damage to the environment and taking measures to ensure that activities in areas controlled or managed by one party do not cause environmental damage to areas controlled or managed by the other party. It was also agreed that each party should: (Israeli Ministry of Foreign Affairs, 1995)
• Promote proper treatment of domestic and industrial wastewater, as well as solid and hazardous wastes;
• Prevent uncontrolled discharge of wastewater to water sources; • Adopt, apply and comply with internationally recognized environmental
standards concerning the levels of pollutants discharged through emissions and effluents; the acceptable levels of wastewater and solid waste
T

2
treatment; the ways and means for disposal of such wastes; and the use, handling, transportation and storage of hazardous substances and wastes.
• Ensure that a comprehensive environmental impact assessment (EIA) is conducted for all major development programs;
• Take precautions to prevent water and soil pollution as well as other environmental safety hazards;
• Take measures to prevent noise, dust and other nuisances from quarries; • Cooperate in the implementation of internationally accepted principles and
standards of global environmental concern, such as protection of the ozone layer, endangered species of fauna and flora, conservation of migratory species, and preservation of existing forest and natural resources; and
• Cooperate to promote public awareness of environmental issues, to combat desertification, to carry out environmental studies, and to control transfer of pesticides.
A Joint Environmental Experts Committee from both sides was established to ensure effective collaboration on the aforementioned issues. In spite of the apparent mutual understanding and shared responsibility to protect the environment, the Israeli experts in this committee were given a veto over the Palestinian decisions. The Palestinian experts could not interfere with the Israeli decisions as regards to their activities and practices in the Palestinian Territories that have entailed both environmental and social costs. Furthermore, the Israeli authorities didn’t comply with the aforementioned actions and measures that were recognized by both sides to protect the environment. For instance, they did not prevent the direct discharge of the untreated wastewater generated in the Israeli colonies and industrial zones that are constructed inside the Palestinian Territories on nearby Palestinian lands resulting in sever environmental damages in areas controlled by Palestinians. They did not apply the Israeli environmental law in the Israeli industrial zones that are constructed on Palestinian land and did not preserve the existing forests, but on the contrary they uprooted thousands of trees to implement their colonizing activities represented by the construction of colonies, industrial zones, bypass roads and others. Concerning the nature reserves that are part of the Palestinian environment, the Israelis have not transferred powers and responsibilities to Palestinians in order to protect and preserve such natural assets. On the Palestinian side, the Palestinian National Authority (PNA) established environmental directorates/departments within the Palestinian Ministries. In 1994, the Environmental Planning Directorate was established within the Ministry of Planning and International Cooperation to deal with the environmental affairs in the Palestinian Territories. Other environmental departments were found within the Ministry of Local Government, Ministry of Agriculture and the Ministry of Health. Later in 1997, the Palestinian Environmental Authority was established to take over environmental responsibilities. In 1998, a Ministry of Environmental
3
Affairs (MEnA) was established to take over the responsibility of environmental legislation, environmental strategies’ development and environmental planning in order to promote sustainable environmental development for the Palestinian society. MEnA, which has been currently replaced by the Environmental Quality Authority (EQA), formulated the Palestinian Environmental Law no. (7). The law was evaluated and approved by the Palestinian Legislative Council in 1999. It aims at protecting the Palestinian environment from pollution; protecting public health and social welfare; introducing environmental protection fundamentals into the social and economic development plans; promoting sustainable development; preserving the biological diversity; protecting the environmentally sensitive areas; rehabilitating the environmentally deteriorated areas; and raising the level of environmental awareness among local communities. It defines a number of principles and guidelines that form the basis for decisions and structures of the environmental legislations. The principles are illustrated through several articles as follows: (Ministry of Environmental Affairs, 1999)
• Article (3): every Palestinian individual has the right to pursue the enforcement of the right to a clean and healthy environment against any party; he/she may also obtain any official information about the environmental impacts of any planning activity.
• Article (4): the protection of the environment through collective and individual initiatives for voluntary work shall be encouraged through environmental education in schools, universities, institutions and clubs.
• Article (5): every Palestinian individual has the right to a sound and clean environment and to the best possible health care and social welfare where the protection of the country’s natural resources and the preservation of its historical heritage are maintained.
The environmental law outlines the rules and regulations related to a wide scope of environmental issues. The first and third chapters of the second section of the law deal with issues related to solid waste and wastewater through several articles: (Ministry of Environmental Affairs, 1999) Articles related to solid waste
• Article (7): the ministry has to set up a comprehensive plan for the solid waste management on the national level, leaving the responsibilities for the implementation of solid waste management operational services to the local authorities.
• Article (8): the different specialized agencies have the right to take the proper requirements to minimize solid waste generation and encourage solid waste reuse and recycling.
4
• Article (9): the ministry in cooperation with other specialized agencies has to develop standards for the solid waste disposal sites.
Articles related to wastewater
• Article (29): the ministry in cooperation with the specialized agencies has to develop standards and regulations for the collection, treatment, disposal and reuse of wastewater and storm water in a proper manner that ensures environmental and public health protection.
The formulation of the environmental law was followed by the development of the Palestinian Environmental Strategy (PES) in cooperation with the Netherlands Development Agency. The PES identifies the main environmental themes that need to be addressed, defines environmental objectives and introduces a series of prioritized measures that will lead to reaching these objectives. The PES contains eleven-strategy elements that have been prioritized through the use of certain evaluation criteria. In the PES, wastewater and solid waste management are recognized as two of the most urgent environmental priority elements that need to be addressed in order to resolve the pressing environmental problems (Ministry of Environmental Affairs, 2000 a). Based on the PES, MEnA formulated a National Environmental Action Plan (NEAP) that sets out concrete actions and projects relevant to each of the strategy elements up to the year 2003 (Ministry of Environmental Affairs, 2000 b). The NEAP identifies the projects necessary to solve or alleviate the environmental problems caused by the current management of wastewater and solid waste. However, the implementation of the proposed strategic options and actions for waste management was faced by several impediments associated with the practices of the Israeli Occupation Authorities that have been intensified after the outbreak of the second Intifada in September 2000. These impediments include:
• The geographical discontinuity which has been created at the lands under Palestinian control through the implementation of the Israeli segregation plans and the construction of the Segregation Wall that have hindered the implementation of several centralized projects related to the management of solid waste and wastewater; and
• Lack of sovereignty over land and water resources, which is an essential prerequisite for any nation to achieve sustainable development and sound environmental management. The PNA doesn’t have the jurisdiction or the right to plan for any environmental project (i.e. sanitary landfill and wastewater treatment plant) over land in Area C and even in Area B permits must be obtained from the Israeli authorities to implement such projects.
Furthermore, the inability to implement the proposed waste management strategic options and actions can be attributed to other factors, most importantly the public rejection of establishing wastewater and solid waste management facilities in their cities and villages (i.e. Not in My Backyard – NIMBY), the lack of social

5
awareness as regards to the gravity of the impacts related to the lack of proper waste management actions and, the lack of people’s willingness to pay or participate in the implementation of such projects. While the former impediments related to the Israeli practices and the deterioration of the political situation are external factors, the latter obstacles are internal and both the PES and NEAP failed to address them. Accordingly, the existing waste management system in the West Bank and Gaza Strip is still considered inefficient and improper in spite of the Palestinian efforts that were made towards improving it. 1.1 Importance of Having Proper Waste Management Policies The PES and NEAP are the outcomes of an environmental decision-making process that involved many decision makers with diverse academic backgrounds. However, an environmental strategy or action plan that may look like an excellent idea at the outset may actually cause more harm than good or entail social, financial or environmental costs, which are unacceptable. Environmental policies may affect society on many levels including the economic growth, the environmental quality, the general health situation and a range of social issues with the potential characteristics of importance being: (European Commission, 1999)
• The scale and relative magnitude of the direct policy effects, and hence potential for such effects to lead to further indirect and secondary effects;
• The degree to which equity considerations are of concern given the likely divergence between those who would gain and those who would lose;
• The relative significance of both environmental and human health effects, where this includes both the negative and positive effects of the policy;
• The level of integration of the affected industry sectors and hence the potential for impacts on related markets;
• The inter-relationship with other policies and policy areas; and • The timing and duration of policy measures.
Costs and benefits stemming from waste management strategies, regulations and action plans are the same range of impacts, which may be of concern in any environmental policy. In general, the impacts can be categorized into: (European Commission, 1999)
• Impacts on Industry and Consumers The introduction of waste management regulations may impact producers/industries and consumers both directly and indirectly. These impacts may include: (1) changes in capital and operating costs to industry arising from changes in production processes, reductions in or treatment of emissions, adoption of substitute chemicals, monitoring and any other actions required directly as a result of the regulations or initiatives; and (2) any increases in the costs of end

6
products to consumers associated with changes in the costs to industry of producing the regulated goods.
• Administrative Costs The introduction of waste management policies is likely to either change or give rise to a range of new administrative costs associated with the implementation of the associated actions and regulations. The types of cost, which may change as a result of action and regulation, include: (1) administrative costs associated with, for example, licensing an activity; (2) inspection and monitoring costs; (3) costs of scientific sampling and testing; (4) enforcement costs; and (5) income stemming from changes in taxed activities. Such costs may relate to the need for investment in new capital equipment as well as to the revenue costs (such as manpower requirements).
• Employment Waste management policies have the potential of creating jobs. This has a benefit to society but to the extent that the person employed would otherwise not have been employed. In other words, the benefits of employment are equal to the social costs of the unemployment avoided as a result of the policy. These benefits depend primarily on: (1) the period that a person is employed; (2) what state support is offered during any period of unemployment; and (3) what opportunities there are for informal activities that generate income in cash or kind. In addition, unemployment is known to create health problems, which have to be considered as part of the social cost.
• Environmental Effects In general, waste management policies aim at solving or alleviating the negative environmental effects intervened with the non-environmentally sound management practices of wastes. These environmental effects include: (1) the deterioration of water quality; (2) shoreline and marine pollution; (3) air pollution; (4) deterioration of nature and biodiversity; and (5) landscape and aesthetic distortion of the visual environment. The full implementation of the strategic measures and actions relevant to the waste management system will prevent any environmental disruption, thus warding off the environmental costs arising from the improper management of wastes.
• Morbidity Impacts The reductions in environmental degradation as a result of the implementation of waste management policies will contribute to reducing human health impacts. These health impacts stem from the contamination of food and water with wastewater and/or leachate, which is the liquid waste generated from the water content of the unburned biodegradable solid waste and from rainfall infiltration through the solid waste disposed in the existing unsanitary dumping sites. The

7
‘health endpoints’ related to the contamination of food and water with pathogens are: (1) Salmonella related diseases including salmonellosis and typhoid fever; (2) Coliforms and Fecal Coliforms related diseases such as bloody diarrhea and abdominal cramps; (3) shigellosis (bacillary dysentery) which is caused by Shigella; (4) cholera which is caused by Vibria Cholerae; (5) gastroenteritis caused by Fecal Streptococci; (6) clostridial disease caused by Clostridium Perfringens; and (7) Helminthic diseases caused by Ascaris and Trichuris spp.
Furthermore, certain health impacts may arise from air pollution to which the unsanitary waste management systems and the measures incorporated in the waste management policies may contribute. The significant ‘health endpoints’ related to air pollution are asthmatics, child bronchitis, chronic bronchitis, congestive heart failure, ischaemic heart disease, and Cerebrovascular diseases. The incidence of the previously mentioned diseases within a population entails costs that are composed of the following: (1) the value of the time lost because of the illness; (2) the value of the lost utility because of the pain and suffering; and (3) the costs of expenditures on averting and/or mitigating the effects of the illness. The last category includes both expenditures on prophylactics, as well as on the treatment of the illness once it has occurred.
• Mortality Impacts As mentioned previously, the implementation of waste management policies will contribute to improving public health by reducing the risks of morbidity and mortality. The measures relevant to waste management may bring about mortality impacts through the emission of pollutants (i.e. Hazardous chemicals, emissions from traffic and heavy metals, among others), which may cause premature death, into the environment. Therefore, thorough appraisal of waste management policies should precede their implementation in order to ensure that the benefits of introducing the policies outweigh their costs. This means that the policy should achieve the greatest net gain/welfare to society. 1.2 Framework for Waste Management Policies Appraisal The framework for waste management policies appraisal is the social Cost Benefit Analysis (CBA) that aims at determining whether the benefits of introducing a policy outweigh its costs and maximize the total social welfare. In this study, CBA has been used as an evaluation tool to identify and quantify the positive and negative economic, social and environmental impacts associated with: (1) the current domestic solid waste and wastewater management practices; and (2) the realistic options and actions established in accordance with the PES and NEAP as
8
well as with the environmentally sound waste management options applied worldwide. The identified and quantified impacts have been expressed in monetary terms through the use of specific valuation techniques. However, when monetary values could not be attached to the impacts, semi-quantitative methods that attempt to provide details about the nature and significance of impacts have been utilized. Consequently, CBA as used in the study refers to a set of procedures for measuring and comparing costs, and in this sense, is a method for organizing and analyzing data as an aid to decision making; it does not represent the decision itself. It has allowed direct comparisons in order to determine whether the benefits of introducing strategic options and actions for managing solid waste and wastewater maximize the total social welfare. 1.3 Chapter Summary This chapter defined the history of solid waste and wastewater management in the Palestinian Territories and highlighted the attempts of the PNA towards rehabilitating the neglected infrastructure and protecting the environment from further disruption. It provided an overview of the Palestinian achievements pertinent to environmental legislation and strategies development with a brief description of the political and social impediments that negatively affected the implementation of the formulated strategies and action plans. Furthermore, the chapter addressed the impacts stemming from waste management policies that are generally categorized into the impacts on industry and consumers; administrative costs; impacts on employment; environmental effects; morbidity impacts; and mortality impacts. It emphasized the importance of appraising the waste management policies within a social CBA framework before their implementation in order to ensure that the benefits of introducing the policies outweigh their costs and maximizes the social welfare. 1.4 Objectives and Structure of the Book The main objective of the book is to provide the Palestinian decision and policy makers, scientists and researchers working in the field of environmental management with a systematic analysis of the solid waste and wastewater management options in Palestine within a CBA framework. The described concepts and methods will support the decision making process by assisting the target groups in weighing the costs of the various management options against their benefits, and then in choosing the best option that maximizes the total social welfare. Accordingly, the book has been prepared with the intention of familiarizing the target groups with the existing solid waste and wastewater

9
management systems; the waste management options incorporated in the national environmental policies including the PES and NEAP; the environmentally sound waste management options adopted worldwide; the economic, social and environmental costs and benefits associated with the existing management practices and the realistic management options; and the techniques used for valuating the identified costs and benefits in monetary terms. The book also aims at providing an understanding of the local people’s perceptions about waste management and the importance of public participation in the environmental decision making process. Chapter 2 of the book provides a description of the framework for waste management policies appraisal. It discusses the various steps involved in the Cost Benefit Analysis (CBA) framework and outlines the indicators of impacts associated with the waste management practices. Chapter 3 provides a situational analysis of the solid waste and wastewater management systems in the West Bank and Gaza Strip. It also describes the various options, adopted worldwide, for managing domestic solid waste and wastewater at all stages of collection, transportation, treatment and reuse. An overview of the waste management-related measures and strategic options identified in the PES is also presented. Chapter 4 addresses the importance of public participation in the environmental decision making process as the local people are the recipients of the associated positive and negative impacts and play a key role in the success of the outputs’ implementation. It provides an assessment of people’s perceptions about waste management options and their willingness to participate in the management process. Chapter 5 provides an assessment of the solid waste and wastewater management options within a CBA framework. These options range from the existing management practices to the environmentally sound waste management options adopted worldwide. The chapter provides a description of the latter options that were established based upon practical combinations of collection, transport, treatment and/or reuse methods. For the solid waste, it reviews seven logical scenarios established for the collection, transport and processing of solid waste, which are: the drop off-buy back scenario; the bulk waste drop off and landfill scenario; the bulk waste drop off and treatment scenario; the separation-curbside and waste treatment scenario; the bulk waste-curbside and landfill scenario; the bulk waste-curbside and waste treatment scenario; and the bulk waste-curbside and incineration, composting and recycling scenario. For the wastewater, it reviews the considered centralized and decentralized management systems that entail collecting, treating and reusing wastewater for agricultural irrigation purposes. The description of options is followed by a description of the

10
techniques that were used to valuate the economic, social and environmental costs and benefits associated with the various waste management options when possible. A summary and discussion of the valuation results are also presented. The chapter concludes with decision support matrices that can assist policy makers make decisions that can maximize social welfare in the Palestinian communities. Chapter 6 provides a description of the major findings of the analysis of solid waste and wastewater management options. It also gives recommendations based on the analysis findings and public perceptions. The book serves as a promulgation tool for the research study entitled “Analysis of Waste Management Policies in Palestine” that was carried out by the Applied Research Institute – Jerusalem in the period from October 2002 to June 2004. The research study was subsidized by TAMKEEN project to support and enhance the conduct of environmental policy analysis. Figure 1.1 visualizes the structure of this study that aimed at analyzing the national environmental policies relevant to solid waste and wastewater management thoroughly and professionally. The detailed information relevant to the research study including all the generated reports are published on ARIJ website at the address of: http://www.arij.org/units/posters/waste_management/index.htm

11
Figure 1.1 Structure of the Research Study The study builds upon existing waste management policies and plans, which will be analyzed using environmental, social and economic data to derive new knowledge about the impacts of the existing waste management system on the physical, the economic and the social systems, and their inherent dynamics. The outcome (top) will be information that provides options for a more sustainable waste management in the West Bank and Gaza Strip.
Data Requirements for System Analysis
Phase 1
Phase 4
Assessment of Waste Management Impacts
Environmental, social, economic and health risks
Identification of Alternative Policies and Plans
Phase 5
Evaluation of Alternatives
and ParticipationPhase 6
Establish a systematic view of
the waste
management issue
Identifying stakeholders
Integrating Knowledge
Basis for action
Res
earc
h P
rogr
ess
Leve
l of I
nteg
ratio
n/A
ggre
gatio
n
Examine the Decision
Making process Phase 3
Relative legislation, policies, plans as well as environmental, economic and social data
DisseminationPhase 7
Data C
ollection
Phase 2

12

13
CHAPTER 22 Framework for Waste Management Policies Appraisal
he introduction of waste management policies affects society on many levels including the economic growth, the environmental quality, the general health
situation and a range of social issues. In many cases intuition and common sense guide decision makers in the right direction, but to ensure efficiency in resource allocation and maximum gain in social welfare, the decision making process needs evaluation tools to properly investigate the outputs and proposed options. The evaluation tools should be based on systematic and thorough investigation of all options under consideration (Nas, 1996). The tools are either qualitative or quantitative. Qualitative tools deal with descriptions of the impacts, while quantitative tools provide details about the nature, magnitude and significance of impacts. The social Cost Benefit Analysis (CBA) is one of the latter (Virani, 1998). CBA aims at determining whether the benefits of introducing a policy outweigh its costs and maximize the total social welfare. It should be thought of as a set of information-gathering and organizing tools that can be used to support decision making rather than as a decision making mechanism itself. It involves carrying out four steps, which are:
• Identifying and quantifying the costs and benefits; • Expressing the costs and benefits in monetary terms, when possible; • Adjusting the monetary values for time aspect; and • Making decisions based on the maximization of the total social welfare.
2.1 Valuation Techniques For Impacts
Waste management strategies, regulations and action plans have both positive and negative impacts on the economic, social and environmental systems. The negative impacts or costs can be identified and valuated using the Full Cost Accounting (FCA) approach that takes into account the following types of costs: (United States Environmental Protection Agency, 1997 b)
T

14
• Up-front costs that comprise the initial investments and expenses necessary to implement waste services;
• Operating costs, which are the expenses of managing waste on a daily basis;
• Back-end costs that include expenditures to properly wrap up operations and take proper care of waste management facilities at the end of their useful lives; and the costs of post-employment health and retirement benefits for workers;
• Remediation costs at inactive sites; • Contingent costs, which are costs that might or might not be incurred at
some point in the future; • Environmental costs, which are the costs of environmental degradation;
and • Social costs that are adverse impacts on human beings, their property, and
their welfare. Knowing the full costs of waste management can help make better decisions about solid waste and wastewater projects, improve the efficiency of services and better plan for the future. However, consideration of the full spectrum of the above-mentioned costs is beyond the scope of the research study that was conducted by ARIJ. The study only incorporated direct economic, social and environmental costs that are relatively easy to value and excluded the back-end, contingent and remediation costs. The FCA approach was also used to identify and value the positive impacts or benefits of waste management. The quantification of the economical, social and environmental impacts associated with the waste management practices was done by applying relevant valuation techniques. The following gives a brief description of the valuation techniques for the environmental impacts only as they are considered difficult to value. 2.1.1 Valuation Techniques for Environmental Impacts A range of economic valuation techniques has been developed to assist in computing and attaching monetary values to environmental goods and services. These techniques are classified under two main categories, which are the revealed preference and stated preference techniques (Pearce et al., 2000). The applicability of the different valuation techniques varies across different types of environmental impacts as can be shown in Table 2.1. 2.1.1.1 Revealed Preference Techniques The revealed preference techniques deal with the actual observed behavior of stakeholders and include five main techniques, which are: (Pearce et al., 2000)
15
• Averting Behavior The basis for the averting behavior technique is the observation that marketed goods can act as substitutes for environmental goods in certain circumstances. In other words, when a decline in environmental quality occurs, expenditures can be made to mitigate the effects and protect the household from welfare reductions. For example, purchase of water filters or sound insulation can represent the household’s willingness to pay to avoid or decrease the environmental problem in question. Sometimes the investments give rise to secondary goods, for example heat loss reduction from sound insulation.
• Hedonic Pricing (HP) This technique depends on analysis of existing markets where environmental factors have an influence on price. For example, the difference in land prices between two properties, one affected and one unaffected but otherwise equal, are considered to represent peoples willingness to pay for avoiding the environmental effect.
• Travel Cost (TC) Using a natural resource for recreational purposes requires an individual to incur costs in terms of travel, entry fees, on-site expenditures and time. These costs of consuming the services of the environmental asset are used as a proxy for the value of the recreation site and changes in its quality.
• Random Utility or Discrete Choice Models
For more specific use of an environmental good, the difference in prices between the possible alternatives of using an environmental good can represent the value of the good. For example, if the two alternatives for using drinking water are tap water and bottled water, then the difference in price between them can represent the willingness to pay for avoiding a possible source of illness (tap water).
• Replacement Costs This technique uses the cost of replacing or restoring a damaged asset to its original state as the measure of the benefit or restoration. 2.1.1.2 Stated Preference Techniques The stated preference techniques are characterized by dealing with stakeholders’ stated willingness to pay for a benefit or to accept a cost. They include two main techniques, which are: (Pearce et al., 2000)
• Contingent Valuation (CV) In this technique, people are asked directly about their willingness to pay to get a benefit or to avoid a cost. Alternatively, they are asked about their willingness to

16
accept in terms of economic compensation, to not get a benefit or to tolerate a cost. This generally requires the interviewer to create a scenario with certain premises to get a useful answer.
• Conjoint Analysis In this technique, people are asked to rank alternatives rather than to express willingness to pay or to accept. Some of the alternatives should include prices so that conversions to monetary values can be made.
Table 2.1 Environmental Impacts and Valuation Techniques
Impact
Economic Valuation Technique
Financial Payments
Averting Behavior
TC CV HP
Water Quality/Quantity � � � Recreation � � � Landscape � � Heritage � � � Habitat/Ecosystems � � � Wildlife � � Noise � � � Health � � � Fisheries � � � Aesthetics � � Forestry � � � �
2.2 Identification of Costs and Benefits A set of indicators that reflect the impacts of solid waste and wastewater management practices and actions on the economic, social and environmental systems was developed in order to identify the relevant costs and benefits (See Table 2.2). The indicators were limited to direct impacts due to the restrictions of the research study timeframe as well as the availability of data required to measure or quantify them. Accordingly, the considered costs include:
• Economic costs: the investment, operation and maintenance costs for the collection, transportation, treatment/processing, and reuse of solid waste or wastewater;
• Social costs: costs of diseases arising from the contamination of water, food and air due to waste management activities; and
• Environmental costs: costs of groundwater and air pollution, costs of the loss of recreational and aesthetic values, and costs of landscape degradation. These costs were only considered for the existing improper waste management practices.

17
As regards to the considered benefits, they differ according to the solid waste processing methods and the wastewater treatment levels. The economic benefits were limited to (1) the revenues generated from solid waste composting and recycling (i.e. the selling of compost and recyclables such as glass and metal); and (2) the revenues generated from the reuse of treated wastewater for agricultural irrigation (i.e. the selling of treated wastewater to farmers and the marketing of crops irrigated with treated wastewater). The social benefits were restricted to (1) benefits stemming from the reuse of treated wastewater for agricultural irrigation including the conversion of large parcels of land from rainfed to irrigated agricultural lands and the creation of job opportunities in the agriculture sector; and (2) the warding off the costs of prevailing diseases. The environmental benefits intervened with the proper management of waste were represented by the warding off the environmental disruption costs resulting from the existing management practices. A full description of the methodology and mathematical formulation utilized in quantifying the identified economic, social and environmental costs and benefits of the different waste management practices is provided in chapter five. It should be noted that it was impossible within the scope of the research study to convert all the considered environmental impacts to monetary values. Only the travel cost technique was utilized to calculate the recreational value of the sites that were polluted by the current waste management practices as described in chapter five. The valuation of the considered costs and benefits required a large amount of data as outlined in Table 2.2. The data was acquired from the existing databases, field studies, literature studies, and semi-structured interviews with municipal and rural councils’ engineers as well as with local people. Extrapolation of the available data was used to fill in data gaps.

18
Table 2.2 Indicators of Impacts Associated with the Waste Management Practices Indicator Impact Required Data
Economic Indicators Solid Waste The full cost of solid waste
management • Establishment costs for a transfer station, sanitary
landfill, composting facility, recycling facility and/or incineration facility.
• Costs of equipment (waste vehicles/trucks, bins, colored plastic bags, sorting equipment, and/or compaction equipment)
• Administrative cost • Cost of employment (cost of labor) • Cost of land (purchase or rent cost) • Cost of land rehabilitation and fencing • Cost of fuel • Cost of insurance • Operation and maintenance costs
The recycling and composting of solid waste generate economic benefits/revenues from the selling of recyclables (e.g. glass and metals) and compost.
• Quantity of recyclables and/or compost. • Economic value/market price of one ton of glass,
metal and/or compost.
Wastewater The full cost of wastewater management
• Costs of wastewater management using cesspits (construction costs of cesspits, costs of vacuum cleaning the full cesspits, purchase cost of vacuum tankers, depreciation cost of tankers and cost of fuel consumption).
• Installation costs for conventional and small diameter gravity sewer systems
• Investment and operation & maintenance (O&M) costs for secondary wastewater treatment plants, disinfection systems and tertiary treatment plants
• Investment costs for seasonal reservoirs, storage ponds and transmission lines
The reuse of treated wastewater for agricultural irrigation results in economic benefits represented by the economic value/price of the treated wastewater and the production value/market price of irrigated crops.
• Volume of treated and reused wastewater • Economic value of one cubic meter of treated
wastewater reused for irrigation purposes • Water requirements for each crop type • Potential area of agricultural lands to be irrigated
with the treated wastewater • Production value of irrigated crops
Social Indicators Health Indicators
Costs of diseases associated with pollution arising from the existing waste management
• Incidents of water and food born diseases (e.g. diarrhea, amoebas)
• Incidents of diseases arising from air pollution (e.g. respiratory diseases)
• Number of days spent at hospitals/clinics per disease
• Number of lost working days • Cost of treatment
Other Indicators
The treatment and reuse of wastewater for agricultural irrigation bring about social benefits including the increase in price of agricultural land and the creation of job opportunities in the agriculture sector.
• Volume of treated and reused wastewater • Water requirements for each crop type • Potential area of agricultural lands to be irrigated
with the treated wastewater • Price of one dunum of irrigated agricultural land • Income generated form cultivating one dunum of
irrigated agricultural land

19
Table 2.2 Continued Indicator Impact Required Data
Environmental Indicators Groundwater Pollution
Solid waste disposal: Leachate from the open dumping sites/sanitary landfills can contaminate groundwater.
• Monthly precipitation and evaporation data • Area of dumping sites • Volume of leachate generated • from precipitation • % of organic material in the generated solid
waste • Quantities of the generated solid waste in
each locality • Quantities of solid waste dumped in each
dumping site or landfill • Volume of leachate generated from the
water content of biodegradable solid waste • Composition of the generated leachate
(chloride concentration) Wastewater discharge: The direct discharge of untreated or partially treated wastewater into open areas endangers the groundwater quality.
• Annual volume of wastewater discharge into open areas
• Composition of the discharged wastewater (chloride concentration)
• Mean annual rainfall depth over the targeted area
• Pollutant (chloride) concentration penetrating into the aquifer
Air pollution Solid waste transport: The transport of the collected solid waste to the open dumping sites or sanitary landfills results in emissions of acidifying and greenhouse gases.
• Emission factors for methane CH4, carbon dioxide CO2, nitrous oxide N2O, sulfur dioxide SO2 and nitrogen oxides NOx from transports.
• Total distance traveled
Solid waste disposal in open dumping sites: The uncontrolled burning of solid waste and the biological degradation of the unburned solid waste in open dumping site generate emissions of greenhouse gases.
• Quantity of solid waste dumped • Efficiency of burning • Emission factors for CH4 and CO2 from
uncontrolled burning, • Emission factors for SO2 and NOx from
uncontrolled burning,
Impact: Emissions of acidifying gases can damage the surrounding biotope and the emissions of greenhouse gases add to global warming.
• Global warming potentials of gases • Acidifying potentials of acidifying gases
Loss of Recreational and Aesthetic Values
Open dumping sites, sanitary landfills, open wastewater streams and wastewater treatment plants can affect the way people perceive the landscape and their use of it for recreational purposes.
• Number of trips to recreational site • Distance traveled to recreational site • Distance traveled to alternative site
Landscape Degradation
The spatial extent of the dumping sites/sanitary landfills can cause fragmentation of natural and agricultural areas and affect biodiversity and wildlife.
• Several Landscape matrices

20
2.3 Chapter Summary The social Cost Benefit Analysis has been applied in combination with other semi-quantitative tools to appraise waste management policies by identifying, quantifying and expressing the associated impacts in monetary terms, when possible. The impacts are limited to direct economic, social and environmental costs and benefits and include: (1) investment and running costs for managing domestic waste at the stages of collection, transportation, treatment and reuse; (2) costs of diseases arising from water, food and air pollution; (3) costs of groundwater and air pollution; (4) costs of the loss of recreational and aesthetic values; (5) costs of landscape degradation; (6) economic benefits/revenues stemming from the reuse of treated wastewater, composting of organic solid waste and recycling of recyclable waste; and (7) social benefits pertinent to the reuse of treated wastewater which are the conversion of large parcels of agricultural lands from rainfed to irrigated lands and the generation of income sources.

21
CHAPTER 33 Options for Solid Waste and Wastewater Management
he protection, restoration and enhancement of the environment must be viewed as an integral part of the sustainable development process in any
country and cannot be considered in isolation from it for their effects on the well-being of peoples and the country’s economic development. This stresses the importance for countries to adopt effective measures to promote and achieve environmentally sound and sustainable development. The environmentally sound management of wastes is among the environmental issues of major concern in achieving this and maintaining the quality of the environment. The most comprehensive and environmentally responsive framework for managing wastes should integrate four programme areas, which are:
• Minimizing waste; • Maximizing environmentally sound waste reuse and recycling; • Promoting environmentally sound waste disposal and treatment; and • Extending waste service coverage.
The emphasis given to each of the four waste management-related programme areas varies according to the respective capabilities of countries, the local socio-economic and physical conditions, rates of waste generation and waste composition. However, it is crucial to recognize the various options for waste management systems applied worldwide with special focus on systems relevant to management of municipal solid waste and wastewater at all stages of collection, transportation, treatment, reuse and/or disposal. The waste management-related measures identified in the Palestinian Environmental Strategy (PES) will be also addressed. A description of the existing domestic solid waste and wastewater management system in the West Bank and Gaza Strip will precede the identification of options in order to be aware of the system’s components and their effectiveness. It is worth mentioning that the selection and planning of waste collection, treatment and disposal systems is a critical challenge for each community as such systems are linked to the protection of public health and natural resources of the
T

22
surrounding environment as well as to the comprehensive growth and development plans in the community. Therefore, it is essential that decisions made on waste management-related issues be the most environmentally sound, socially acceptable and cost effective. 3.1 Current Domestic Waste Management System 3.1.1 Domestic Solid Waste Management System The solid waste collection services in the West Bank and Gaza Strip cover almost 67% and 95% of the total population, respectively. In the West Bank, approximately 381 thousand tons of municipal solid waste are collected and dumped every year in 189 open and uncontrolled dumping sites, whereas the remaining waste, approximately 214 thousand tons are dumped and burned every year on roadsides and vacant lands. Open burning of collected solid waste is practiced in all the open dumping sites except Abu Dies site in the Jerusalem District and Nablus site in the Nablus District where the waste is land filled. Photo 3.1 shows the open burning of solid waste in Idna dumping site in the Hebron District. It is worth mentioning that only one dumping site was rehabilitated into a sanitary landfill which is Dura dumping site in the Hebron District. Photo 3.2 and Photo 3.3 shows the waste management practice in Dura site before and after the rehabilitation that took place in October 2003. Lack of sanitary landfills poses a great threat to public health due to the potential contamination of soil and groundwater as a result of leachate infiltration into the earth layers. (Isaac et al., 2003)
In the Gaza Strip, approximately 300 – 350 thousand tons of solid waste are generated every year. Around 247 thousand tons are disposed of yearly in three sanitary landfills which are Gaza, Deir Al Balah and Rafah landfills. The remaining waste is dumped and burned in uncontrolled dumping sites and vacant lands near the Green Line. Approximately 61% of the total solid waste quantity dumped in the sanitary landfills is of organic origin. According to the Environmental Quality Authority (EQA), Gaza sanitary landfill has liner and leachate collection and treatment systems, whereas the two others do not as they are located on impermeable ground outside the recharge area of the coastal aquifer. Moreover, Gaza sanitary landfill has a hazardous waste cell for disposal or storage of expired medicine and chemical laboratory waste. This cell has a life span of eight years and receives both untreated liquid and solid waste from all over the Gaza Strip. It is worth indicating that several pilot composting projects have been implemented in the Strip by non-governmental organizations. (Isaac et al., 2003)
23
The management of solid waste in the Palestinian Territories has extremely deteriorated since the outbreak of the existing Intifada. This is due to the closure and segregation of the Palestinian localities as well as the closure of the main roads leading to the existing dumping sites by the Israeli checkpoints and roadblocks. This has exacerbated the solid waste management problem and resulted in:
• Accumulation of solid waste in the streets and outside the solid waste containers as shown in Photo 3.4 that was taken in one of the streets in the Bethlehem City during the Israeli incursion of November 2002.
• Using alternative dumping sites which resulted in an increase in the number of uncontrolled open dumping sites. In the West Bank, the number of sites increased from 89 sites prior to the outbreak of the second Intifada to 189 sites after the second Intifada (see Figure3.1).
Furthermore, the construction of the Segregation Wall has significant repercussions on the Palestinian environment and natural resources. It has posed great pressure on the integrity of ecosystems and has exacerbated the problem of geographical discontinuity between the Palestinian communities which influences the management of solid waste at the two stages of transportation and disposal. The existing dumping sites that are located outside the Wall have become inaccessible to the localities that are enclosed inside the Wall causing the use of emergency disposal sites inside the localities. The Wall will also impede the implementation of centralized solid waste management projects such as sanitary landfills that aim at serving a whole district or a cluster of districts.

24
Photo 3.1 Open Burning of Solid Waste in Idna Dumping Site in the Hebron District Photo 3.2 Solid Waste Management Practice in Dura Dumping Site in the Hebron District before Rehabilitation
Photo Courtesy of ARIJ
Photo Courtesy of ARIJ
Open Dumping & Burning of Solid Waste

25
Photo 3.3 Solid Waste Management Practice in Dura Dumping Site in the Hebron District after Rehabilitation Photo 3.4 Accumulation of Solid Waste in the Streets of Bethlehem City during the Israeli Incursion of November 2002
Photo Courtesy of ARIJ
Photo Courtesy of ARIJ
Sanitary Land filling of Solid Waste

26

27
Figure 3.1 Number of Solid Waste Dumping Sites in the West Bank Prior to and During the Second Intifada 3.1.2 Domestic Wastewater Management System Wastewater collection is limited to major cities and refugee camps. The field survey conducted by the Applied Research Institute – Jerusalem (ARIJ) revealed that sewage networks serve approximately 28-32% and 66% of the West Bank and Gaza Strip populations, respectively. The remaining population uses cesspits and open channels for wastewater collection. Most of the cesspits are left without a cement basement of liner so that sewage infiltrates into the earth layers and the owners avoid using the expensive services of the vacuum tankers to empty the cesspits. Approximately 29 and 21 MCM of wastewater is generated annually in the West Bank and Gaza Strip, respectively. It should be noted that wastewater generation can be significantly higher than the figures reported herein as they were calculated based on the total volume of municipal freshwater minus the total volume of unaccounted for water and the result multiplied by 80%. Actual figures
Main City Dumping Site West Bank & District Border
Prior to the Intifada During the Intifada

28
can range anywhere between 29 MCM/yr and 40 MCM/yr in the West Bank and 21 MCM/yr and 30 MCM/yr in the Gaza Strip. (Isaac et al., 2003) In the West Bank, the wastewater collected by sewage networks is currently discharged raw at an average annual rate of 11 MCM into open areas including wadis, agricultural lands, and dumping sites. The centralized wastewater treatment plant that is operating at a high efficiency rate exists in Al Bireh in the Ramallah District and is serving Al Bireh City, two refugee camps and a small part of Ramallah City. The other plants that were constructed during the occupation period are not functioning at all, except for Tulkarm ponds that were rehabilitated in 2004. Moreover, the wastewater that is collected by vacuum tankers is discharged directly into open areas without any treatment. The major wastewater streams flow in Wadi Zeimar, Wadi El Sajour, Wadi Betunia, Wadi As Samen and Wadi En Nar. Photo 3.5 shows the wastewater stream that flows in Wadi En Nar. In the Gaza Strip, the annual wastewater collected by sewage networks reaches 15 MCM and part of it is treated in three centralized wastewater treatment plants which are Gaza, North Gaza and Rafah plants. However, the treatment plants are functioning at moderate efficiency rates ranging between 40% and 60%. Both the partially treated and untreated wastewater is discharged into open area such as Wadi Gaza or into the Sea and sand dunes (see photo 3.6). In accordance with the field survey conducted by ARIJ, the number of sites where the collected wastewater is discharged directly into the environment is around 363 sites in the West Bank (see Figure 3.2) and 20 in the Gaza Strip (see Figure 3.3). These sites represent hot pollution spots over the highly permeable recharge areas of both the West Bank and Gaza Strip Aquifers and thus threaten the groundwater quality. (Rishmawi et al., 2004)
The wastewater infrastructure that was neglected throughout the Israeli occupation period, has suffered from severe damages after the eruption of the second Intifada as a result of the practices of the Israeli Occupation Forces (IOF). The lateral and main sewage pipes were damaged during the incursion of the IOF into several Palestinian localities which resulted in great financial losses and in the overflow of wastewater into the streets. Moreover, several wastewater treatment plants such as Gaza plant sustained damage from the Israeli military actions and shelling. The maintenance services to manholes, wastewater pumping stations and treatment plants were hindered by the IOF during curfews as was the case in Al Bireh treatment plant when the city was under the Israeli control. Mainly in the rural areas that are not connected to sewage networks and depend on cesspits for wastewater disposal, the people frequently suffer from the flooding of cesspits and the overflow of wastewater into the streets. This is due to the inability of vacuum tankers from reaching their localities to empty the cesspits as a result of the severe closure and siege imposed by the IOF on the Palestinian areas. This has resulted in environmental disasters inside the residential areas.

29
Photo 3.5 Wastewater Stream that Flows in Wadi En Nar in the Bethlehem District Photo 3.6 Wastewater Stream that Flows in Wadi Gaza
Photo Courtesy of ARIJ
Photo Courtesy of ARIJ

30

31
Figure 3.2 Locations of Open Wastewater Discharge Points in the West Bank

32

33
Figure 3.3 Locations of Open Wastewater Discharge Points in the Gaza Strip
34
3.1.3 Waste Management Practices in the Israeli Colonies The pressure from solid waste and wastewater on the Palestinian environment is further intensified by the large amounts of waste disposed of by the Israeli colonists. The colonists living in the West Bank, including East Jerusalem, generate annually 172 thousand tons of solid waste (471 tons/day), whereas those living in the Gaza Strip generate annually 3 thousand tons of solid waste (8 tons/day) (Isaac et al., 2003). Around 80% of the solid waste generated by Israeli colonists living in the West Bank is disposed of in dumping sites located within the West Bank (see Figure 3.4). These dumping sites are Al Bireh dumping site in the Ramallah District, Abu Dies dumping site in the Jerusalem District, Yatta dumping site in the Hebron District and Tovlan dumping site in the Jericho District that is only used by colonists. The remaining 20% of solid waste is disposed of in dumping sites located inside Israel. Furthermore, the domestic wastewater generated annually by the Israeli colonists living in the West Bank including East Jerusalem amounts to 38 MCM, whereas that generated by colonists living in the Gaza Strip amounts to 0.6 MCM (Isaac et al., 2003). When comparing the wastewater generation by colonists with that by Palestinians living in the West Bank which is 29 MCM per year, it is found that their wastewater generation is higher than that of Palestinians. This can be attributed to the fact that they consume much more water for domestic purposes. An Israeli colonist consumes 110 CM of water per year, while a Palestinian resident consumes around 20-30 CM of water per year. Most of the generated wastewater in the Israeli colonies is discharged untreated according to one of the following disposal methods: (Isaac et al., 2000)
• Wastewater discharged into nearby wadis and Palestinian lands (see Photo 3.7).
• Wastewater disposed of in the local Palestinian sewerage System. For instance, the wastewater generated in Qiryat Arba’ Colony is disposed of in the sewage system of Hebron City.
• Wastewater pumped to Israel over the Green Line. It should be noted that the Israeli industrial activities in the Palestinian Territories add further pressure on the Palestinian environment as they do not apply the Israeli environmental law and dispose of the generated industrial waste without any treatment in nearby Palestinian lands.

35
89,037
18,253
82,676
4,53313,104
51,192
0
20,000
40,000
60,000
80,000
100,000
Abu Dies Yatta Al Bireh
Solid Waste Quantity(ton/yr)_ColonistsSolid Waste Quantity(ton/yr)_Palestinians
Figure 3.4 Solid Waste Quantities Dumped by Israeli Colonists in Dumping Sites Located in the West Bank
Photo 3.7 Wastewater Stream Flowing from Arial Colony to Palestinian Agricultural Lands in the Salfit District
Wastewater Stream
Domestic Well
Photo Courtesy of ARIJ

36
3.2 Options for Solid Waste Management 3.2.1 Solid Waste Collection Efficient collection of solid waste is at the heart of a well-run waste management system. There are several methods for solid waste collection based on the alternative pick-up points including: (United States Environmental Protection Agency, 1995) • Curbside/alley collection: In this collection method, residents place containers
to be emptied at curb or in alley on collection day. Collection crew empties containers into collection vehicle. Resident returns containers to their storage location until next scheduled collection time.
• Backyard set out - set back collection: This collection method implies carrying solid waste containers from backyard to curb by a special crew and then emptying it by the collection crew. The special crew then transports the containers back to their original storage location.
• Backyard carry collection: In this method, collection crews enter property to collect refuse. Containers may be transported to the truck, emptied and returned to their original storage location, or emptied into a tub or cart and transported to the vehicle so that only one trip is required.
• Drop off at specified collection point: Residents transport waste to a specified point. This point may be a transfer station or the disposal site.
3.2.2 Solid Waste Transport The collected solid waste is either directly transported to the disposal site/ processing facility or transferred from collection trucks or stationary containers to larger vehicles in a transfer station before transporting it to the disposal site/processing facility. A transfer station can offer several benefits including: lower collection costs because crews waste less time traveling to the site; reduced fuel and maintenance costs for collection vehicles; increased flexibility in selection of disposal facilities; the opportunity to recover recyclables or compostables at the transfer site; and the opportunity to shred or bale wastes prior to disposal. Transfer stations can be divided into three main types based on the station’s capacity: (United States Environmental Protection Agency, 1995) • Small transfer stations: They consist of a series of open-top containers that are
filled by station users and are then emptied into a larger vehicle at the station or hauled to the disposal site and emptied. They are used with the drop-off collection method.
• Small to medium transfer stations: They are direct-discharge stations that provide no intermediate waste storage area. They have two operating floors.
37
On the lower level, a compactor or open-top container is located. Station users dump wastes into hoppers connected to these containers from the top level.
• Larger transfer stations: They are designed for heavy commercial use by private and municipal collection vehicles, depending on the transfer distance and vehicle type. Most designs for larger transfer stations fall into one of the following three categories: (1) Direct-discharge noncompaction stations, in which wastes are dumped
directly from collection vehicles on the top floor, through a hopper, and into open-top trailers on the lower floor.
(2) Platform/pit noncompaction stations, in which collection vehicles dump their wastes onto a floor or area where wastes can be temporarily stored, and, if desired, picked through for recyclables or unacceptable materials. The waste is then pushed into open-top trailers, usually by front-end loaders.
(3) Compaction stations, in which wastes are fed into the compactor through a hopper in order to be compressed before they are transferred. The hydraulically powered ram of the compactor pushes waste into the transfer trailer, which is usually mechanically linked to the compactor.
3.2.3 Solid Waste Processing There are various solid waste processing methods for managing and recovering solid waste after it is produced including recycling, composting, waste-to-energy, and landfilling. The advantages and drawbacks related to these processing methods are outlined in Table 3.1. 3.2.3.1 Recycling Recycling is the process by which materials destined for disposal, are collected, processed, and remanufactured or reused. Recyclable materials can be grouped into five major categories: paper, glass, plastics, scrap metals, and waste tires. Collection of recyclables can be achieved by drop-off and buy-back collection and/or curbside collection. The drop-off and buy-back collection requires delivering the solid waste by citizens to a drop-off site where a recycling center or a buy-back center (a place where recyclables is purchased) is established. This collection method requires thorough education to promote high public participation. The curbside collection option requires placing solid waste containers to be emptied at curb where the collection crew empties such containers into collection vehicles. The solid waste may be placed at curb unsorted and waste processing is done later to remove recyclables or it can be separated at source using plastic bags or bins into recyclable and non-recyclable materials before placing it at curb. Collected recyclables are normally delivered to a processing facility, where the recyclables are either stored until large enough volumes are

38
collected to be marketable or are processed to meet the specifications of recycling markets. 3.2.3.2 Composting Composting is the controlled decomposition of organic materials, such as leaves, grass, and food scraps, by microorganisms. The result of this decomposition process is compost, a crumbly, earthy-smelling, soil-like material. Municipal solid waste contains 60 to 70% by weight organic materials, so composting can greatly reduce the amount of waste that ends up in landfills or incinerators. 3.2.3.2.1 Composting Stages There are three stages of municipal solid waste composting, which are preprocessing, processing and postprocessing. During preprocessing, feedstock material is prepared for composting by sorting it and removing materials that are difficult or impossible to compost; reducing its particle size; and treating it to optimize composting conditions. After feedstock is preprocessed, it can be introduced into the compost processing operations that occur in two major phases: the composting phase and the curing phase. During the composting stage, a significant proportion of the easily degradable organic material is decomposed and a significant amount of weight is lost. During curing the compost becomes biologically stable, with microbial activity occurring at a slower rate than during actual composting. Curing piles may either be force-aerated or use passive aeration with occasional turning. As the pile cures, less heat is generated by the microorganisms and the pile begins to cool. When the piles cool, it is a sign of reduced microbial activity, which can result from a lack of moisture, inadequate oxygen within the pile, a nutrient imbalance, or the desired result—completing the composting process. Curing may take from a few days to several months. The cured compost is then prepared for markets. (United States Environmental Protection Agency, 1994) Postprocessing is optional but normally is performed to refine the compost product to meet end-use specifications or market requirements. The following can be done during this stage: (United States Environmental Protection Agency, 1994)
• Analyzing compost to ensure that stabilization is complete; • Testing compost for chemical or pathogenic contamination and to
determine nutrient levels; • Cleansing compost of unwanted material; and • Sorting compost by size, screening, reducing its size and blending it with
other materials.
39
3.2.3.2.2 Composting Technologies Composting technologies can be classified into several categories: passive pile, turned windrow, aerated static pile, in-vessel composting, anaerobic processing and vermicomposting. They vary in the method of air supply, temperature control, mixing/turning of the material, and the time required for composting.
• Passive Pile Composting Passive pile composting method is simple and generally effective. In this method, the feedstock material is arranged in piles that are tended relatively infrequently usually only once each year. Tending the piles entails checking their moisture content and then turning them. If the moisture content is too low, water is added by manually spraying the pile with hoses or by using automatic sprinklers. (United States Environmental Protection Agency, 1994)
• Turned Windrow Composting Turned windrows are a widely used method for composting municipal solid waste. Turned windrows are elongated composting piles that are turned frequently to maintain aerobic composting conditions. The frequent turning promotes uniform decomposition of composting materials as cooler outer layers of the compost pile are moved to inner layers where they are exposed to higher temperatures and more intensive microbial activity. (United States Environmental Protection Agency, 1994)
• Aerated Static Pile Composting Aerated static pile composting is a relatively high-technology approach in which the composting mixture is placed in piles that are mechanically aerated. The piles are placed over a network of pipes connected to a blower, which supplies the air for composting. Air can be supplied under positive or negative pressure. When the composting process is nearly complete, the piles are broken up for the first time since their construction. (United States Environmental Protection Agency, 1994)
• In-Vessel Composting System In-vessel composting systems enclose the feedstock in a chamber or vessel that provides adequate mixing, aeration, and moisture. Drums, silos, digester bins, and tunnels are some of the common in-vessel type systems. These vessels can be single- or multi-compartment units. In some cases the vessel rotates, in others the vessel is stationary and a mixing/agitating mechanism moves the material around. Most in-vessel systems are continuous-feed systems, although some operate in a batch mode. (United States Environmental Protection Agency, 1994)
40
• Anaerobic Processing In anaerobic processes, facultative bacteria break down organic materials in the absence of oxygen and produce methane and carbon dioxide. Several approaches are available for anaerobic digestion of feedstock including the single-stage digestion and the two-stage digestion. When the digestion process is completed, the stabilized residue is either removed from the digester with the mechanical equipment, or pumped out as a liquid. The residue is chemically similar to compost but contains much more moisture. Conventional dewatering equipment can reduce the moisture content enough to handle the residue as a solid. The digested residue may require further curing by windrow or static pile composting. (United Nations Environment Program, 1996)
• Vermicomposting Vermicomposting, also called vermiculture or worm composting, is an aerobic composting process in which certain varieties of redworms and earthworms can be used to break down organic materials. Worms mechanically break down compostables and partially decomposed materials by eating them, and biochemical decomposition occurs via bacteria and chemicals in the worms’ digestive system. Worms are easily affected by impurities, so the organic wastes should be source-separated domestic wastes, or from markets. Vermiculture produces a superior fertilizer-type product. It requires considerable labor and careful control of composting conditions, including temperature, moisture, and the mix of ingredients. Its successes to date are limited to relatively small-scale or pilot programs. (United Nations Environment Program, 1996) 3.2.3.3 Incineration “Waste to Energy” Municipal solid waste incineration, known as waste-to-energy incineration, is the combustion of waste at high temperatures. It can generate energy while reducing the amount of waste by up to 90% in volume and 75% in weight. 3.2.3.3.1 Incineration Technologies There are several types of incineration technologies including mass-burn incineration, modular incineration, fluidized-bed incineration and refuse-derived-fuel production and incineration. The two most widely used and technically proven incineration technologies are mass-burn incineration, and modular incineration. (United Nations Environment Program, 1996)
• Mass-burn Incineration Mass-burn incineration is the predominant form of municipal solid waste incineration. Mass-burn systems generally consist of either two or three incineration units ranging in capacity from 50 to 1,000 tons per day. In order to

41
ensure environmentally responsible incineration and resource conservation, household hazardous waste (e.g., cleaners and pesticides) must be separated from the municipal solid waste stream and certain materials (e.g., iron scrap) must be recovered. The waste intake area usually includes a tipping floor, a pit, a crane, and sometimes conveyors. Trucks enter the tipping floor and tip their wastes either onto the floor itself, or directly into the pit. When wastes are tipped onto the floor, a front-end loader or a bulldozer is used to push them into the pit or onto a conveyor. From a feed chute, solid waste is continuously fed to a grate system, which moves the waste through a combustion chamber using a tumbling motion.
• Modular Incinerators Modular incinerator units are usually prefabricated units with relatively small capacities of between 5 and 120 tons of solid waste per day. Typical facilities have between one and four units for a total plant capacity of about 15 to 400 tons per day. The majority of modular units produce steam as the sole energy product. Due to their small capacity, modular incinerators are generally used in smaller communities or for commercial and industrial operations. Modular incinerators employ a somewhat different process than mass-burn incinerators, typically involving two combustion chambers. Gases generated in the primary chamber flow to an afterburner, which ensures more complete combustion and often serves as the primary means of pollution control. In addition, smaller-scale plants (i.e., less than 50 tons per day) sometimes operate using a batch process, rather than continuously, operating only 8 to 16 hours per day. The modular incineration option has become less common, however, in part due to concerns over the consistency and adequacy of air pollution controls.
• Fluidized-Bed Incinerators In a fluidized-bed incinerator, the stoker grate is replaced by a bed of limestone or sand that can withstand high temperatures, fed by an air distribution system. The heating of the bed and the increasing of the air velocities cause the bed to bubble, which gives rise to the term “fluidized”. There are two types of fluidized-bed technologies, a bubbling bed and a circulating bed. The differences are reflected in the relationship between air flow and bed material, and have implications for the type of wastes that can be burned, as well as the heat transfer to the energy recovery system.
• Refuse-Derived Fuel Refuse-derived fuel (RDF) refers to solid waste that has been mechanically processed to produce a storable, transportable, and more homogeneous fuel for combustion. RDF systems have two basic components: RDF production and RDF incineration. RDF production facilities make RDF in various forms through materials separation, size reduction, and palletizing. RDF production plants, like mass burn incinerators, typically have an indoor tipping floor. Instead of being pushed onto a pit, however, in an RDF plant the waste is typically fed onto a
42
conveyor, which is either below grade or hopper fed. In some plants, the loader doing the feeding will separate corrugated and bulky items, like carpets. Once on the conveyor, the waste travels through a number of processing stages, usually beginning with magnetic separation. The processing steps are tailored to the desired products, and typically include one or more screening stages, using trommel or vibrating screens, shredding or hammermilling of waste with additional screening steps, palletizing or baling of burnables, and, depending on the local recycling markets and the design of the facility, may include a manual separation line. 3.2.3.4 Landfilling Municipal solid waste landfilling is the technical term used to describe filling large holes in the ground with solid waste. It is the basis of a good solid waste management system as it provides for the environmentally sound disposal of waste that cannot be reduced, recycled, composted or combusted. It is also needed for disposing of residues generated from such processing methods and can be used if the alternative processing methods are not applicable. In a MSW landfill, the waste is enclosed by cover material at the top and by a liner system at the bottom. A typical landfill has two forms of cover consisting of soil and geosynthetic materials: a daily cover placed over the waste at the close of each day’s operations; and a final cover, or cap, which is the material placed over the completed landfill to control infiltration of water, gas emission to the atmosphere, and erosion. It also protects the waste from long-term contact with the environment. The liner is a system of clay layers and/or geosynthetic membranes used to collect leachate and reduce or prevent contaminant flow to groundwater. A properly designed MSW landfill includes a leachate collection system and a gas control and recovery system: (United States Environmental Protection Agency, 1995)
• Leachate Collection System
The generated leachate can be collected and carried to a storage tank by means of pipes placed at the low areas of the liner over which a drainage blanket of soil or plastic netting is placed to facilitate the flow of leachate over the liner to the pipes. The collected leachate must be periodically removed from the storage tank for treatment and/or recirculation back into the landfill. Recirculating leachate over waste in landfills has been shown to increase the quantity (by nearly a factor of 10) and quality of methane gas for recovery as well as possibly reduce the concentration of contaminants in leachate and enhance the settling of the waste.

43
• Landfill Gas Control and Recovery System The anaerobic decomposition of the organic waste generates landfill gas, which is a mixture of methane and carbon dioxide plus trace gas constituents. Landfill gas is highly flammable and poses a risk of explosion if not properly managed. It is collected for treatment or productive use as an energy source by means of vertical wells or horizontal trenches containing permeable materials and perforated piping that are placed in the landfill. 3.2.4 Strategic Options According to the Palestinian Environmental Strategy Solid waste management has been identified among the most urgent elements in the Palestinian Environmental Strategy (PES). The strategy calls for establishing an effective solid waste management system that considers the following measures: (Ministry of Environmental Affairs, 2000)
• Setting up a non-hazardous domestic and industrial waste collection and transport system, enabling 100% collection coverage;
• Construction of sanitary landfills for all non-hazardous waste streams; • Other processing methods such as composting, incineration and recycling
are not considered feasible for the short term; • Prevention of open solid waste burning at source and on dumping sites; • Development of a cost recovery system and an institutional management
system for the solid waste sector; • Closure of existing random dumping sites and sealing off those with a
high potential of leachate leakage into groundwater aquifers; • Setting up a separate collection system for hazardous waste; • Setting up a monitoring and enforcement system to support the previous
measures; and • Setting up regulations and an enforcement system fro generation,
treatment, storage, transport and disposal of hazardous waste.

44
Table 3.1 Advantages and Drawbacks of Alternative Solid Waste Processing Methods
Solid Waste Processing
Method
Advantages Drawbacks
Lan
dfill
ing
• Normally the lowest cost waste disposal method in present market conditions
• Methane can be collected and used for power generation
• Filled land can be reused for other community purposes
• Requires proper planning, design and operation
• Low cost landfill is likely to inhibit waste minimization and recycling (It wastes valuable resources)
• It produces methane, a potent greenhouse gas, which contributes to climate change
• It creates water pollution through leaching • It can lead to the contamination of land • Potential dust, odor and vermin problems
if site is not well managed • Can have detrimental effects on the
landscape and local amenities • Increasing opposition to the location of
sites
Inci
nera
tion
• Reduces volumes of waste by up to 90% and the weight of waste by 70%
• Can convert a large proportion of the calorific value of waste into usable energy
• More effective energy recovery than anaerobic digestion and landfill gas
• Reduces demand for landfill and other waste management capacity
• Can produce suitable residues for recycling
• Requires minimum land • Produces stable odor-free residue
• It destroys valuable resources • Potential for polluting gaseous and liquid
(wet scrubbing systems only) emissions (e.g. carbon dioxide and dioxins) to atmosphere
• Expensive to build and operate • High energy requirement • Requires skilled personnel and continuous
maintenance • Changes in calorific value of the waste can
cause changes in the operational costs • Requires high water usage • Potential for dust and odor problems
during storage of waste prior to incineration
• Negative public perceptions lead to planning problems
Com
post
ing
• Composting reduces waste stream volume that ends up in landfills or incinerators
• Produces useful product “Compost” that makes a valuable soil amendment and is used to provide nutrients for plants
• Reduces demand for landfill and consequently helps reducing the production of landfill gas
• Requires adequate separation of compostable materials from the non-compostable fraction in the municipal solid waste stream, which is considered difficult
• Requires controlled conditions and careful management to produce a successful end product
• Controlling the quality of the compost is considered difficult
• The marketability of the compost is directly influenced by its quality
• Can produce odor and leachate problems if not contained

45
Table 3.1 Continued Solid Waste Processing
Method
Advantages Drawbacks
Rec
yclin
g
• It reduces the demand for raw materials by extending their life and maximizing the value extracted from them
• It reduces the habitat damage, pollution and waste associated with the extraction of raw materials
• It reduces transport costs and pollution from transporting raw materials and manufacturing new products
• It saves energy in the production process when compared with the energy consumed in using raw materials
• It reduces emissions to air and water in the production process
• It reduces disposal impact (if more waste is recycled, less waste goes to landfill or incinerators
• Expands manufacturing jobs
• Expensive • The costs and practical difficulties of
collection, transportation and reprocessing • Technological push needed • Separation of useful material from waste is
considered difficult
3.3 Options for Wastewater Management 3.3.1 Wastewater Collection Wastewater collection systems or sewers are hydraulic conveyance structures that carry wastewater to a treatment plant or other discharge points. The typical conveyance method used in sewer systems is the transportation of wastewater by gravity along a downward-sloping pipe gradient. These sewers are known as conventional gravity sewers. However, in situations where conventional wastewater collection systems are not feasible, alternative wastewater collection systems are implemented. 3.3.1.1 Conventional Gravity Sewer Systems Conventional gravity sewer systems remain the most common technology used to collect and transport wastewater. They are designed to serve high density urban/suburban areas. They depend on gravity to deliver the generated wastewater from each property to the disposal site or treatment plant. Therefore, the system’s collection pipes must slope downwards at steep gradient that is uniform throughout the system to ensure that the pipes do not become clogged with solid material. The pipes must also be laid in straight alignments between manholes to
46
ensure that when a stoppage does occur it can be readily accessed. Furthermore, when there will be elevation differences within the network of collection pipes, lift stations will be required to transport the sewage to the higher elevations. These requirements make conventional sewer systems very expensive to install. (Water Quality Program Committee, 1996) 3.3.1.2 Alternative Sewer Systems Alternative sewer systems include small diameter gravity sewers, pressure sewers and vacuum sewers. The consideration of these systems is appropriate for the cases when: the wastewater treatment system will serve a small community of 10,000 people or less; many of the properties currently have on-site systems such as septic tanks or aerobic treatment units; the average lot size per property is more than one-half acre; there will be fewer than 100 homes per mile of sewer pipe; the community is located on very hilly terrain; and there are subsurface obstacles, such as bedrock or groundwater, close to the ground's surface. (Water Quality Program Committee, 1996) 3.3.1.2.1 Small Diameter Gravity Sewers Small diameter gravity sewers use gravity to transport sewage, much like conventional sewers do. However, small diameter gravity sewers are always preceded by a septic tank. The settling that first occurs in the septic tank eliminates much of the solid matter from the wastewater. This enables the collection pipes to have a smaller diameter and a more gradual incline. The pipes used are made of light weight plastic and can be buried at a relatively shallow depth, eliminating the use of manholes. Clean out ports are used to service collector pipes. (Water Quality Program Committee, 1996) Small diameter gravity sewers are well suited for communities where the houses are far apart, or where most houses are served by an existing septic tank. Areas with a high housing density or with extremely hilly terrain are not as conducive for the use of this type of system. Operation and maintenance costs for small diameter gravity sewer systems are compatible to that of conventional gravity systems. Depending on the size of the system, one to two persons can be employed on a part-time basis to handle operation and maintenance, although at least one person should be on call at all times. The only additional maintenance requirement is the periodic pump out of the septic tanks, which is usually done every three to five years by a contractor hired by the community.

47
3.3.1.2.2 Pressure Sewers Pressure sewers utilize the force supplied by pumps to deliver wastewater to the system from each property. There are two kinds of pressure sewers, based upon the type of pump used to provide the pressure. Systems that use a septic tank effluent pump combination are referred to as STEP pressure sewers. These sewers utilize septic tanks to settle out the solids, allowing the use of piping that is extremely narrow in diameter. The effluent pump delivers the wastewater to the sewer pipes and provides the necessary pressure to move it through the system. The other type uses a grinder pump (GP). Wastewater from each property goes to a tank containing a pump with grinder blades that shred the solids into tiny particles. Both solids and liquids are then pumped into the sewer system. Because the effluent contains a mixture of solids as well as liquids, the diameter of the pipes must be slightly larger. Because of the addition of the pumps, pressure sewers tend to require more operation and maintenance than small diameter gravity sewers. (Water Quality Program Committee, 1996)
3.3.1.2.3 Vacuum Sewers Wastewater from one or more homes flows by gravity to a holding tank known as the valve pit. When the wastewater level reaches a certain level, sensors within the holding tank open a vacuum valve that allows the contents of the tank to be sucked into the network of collection piping. There are no manholes with a vacuum system; instead, access can be obtained at each valve pit. The vacuum or draw within the system is created at a vacuum station. Vacuum stations are small buildings that house a large storage tank and a system of vacuum pumps. Vacuum sewer systems are limited to an extent by elevation changes of the land. Rolling terrain with small elevation changes can be accommodated, yet steep terrain would require the addition of lift stations like those used for conventional sewer systems. It is generally recommended that there be at least 75 properties per pump station, for the use of a vacuum sewer system to be cost effective. This minimum property requirement tends to make vacuum sewers most conducive for small communities with a relatively high density of properties per acre. The maintenance and operation of this system requires a full-time system operator with the necessary training. This can make the operation and maintenance costs of vacuum sewers exceed those of other systems. 3.3.2 Wastewater Treatment Wastewater treatment processes include primary, secondary and advanced (tertiary) treatment, depending on the degree of purification. Primary treatment utilizes physical processes including screening to remove large objects, such as stones or sticks that could plug lines or block tank inlets; and sedimentation to

48
allow settleable solids settle out and oils float to the top to be skimmed off. It typically reduces the Biological Oxygen Demand (BOD) and Suspended Solids (SS) by approximately 40–50 % but does not significantly reduce the levels of human pathogens. Secondary treatment typically utilizes biological treatment processes, in which microorganisms convert nonsettleable solids to settleable solids. Sedimentation typically follows, allowing the settleable solids to settle out. There are three options for secondary treatment including activated sludge, trickling filters and lagoons. After primary and secondary treatment, municipal wastewater is disinfected using chlorine, ultraviolet light or ozone to destruct harmful (pathogenic) microorganisms, i.e. disease-causing germs. An increasing number of wastewater facilities also employ tertiary treatment, often using advanced treatment methods. Tertiary treatment may include processes to remove nutrients such as nitrogen and phosphorus, and carbon adsorption to remove chemicals. These processes can be physical, biological, or chemical. 3.3.2.1 Secondary Treatment The three commonly approaches for secondary treatment take advantage of the ability of microorganisms to convert organic wastes into stabilized, low-energy compounds. In activated sludge most microorganisms are attached to suspended flocs, whereas in a trickling filter they are attached to the filter bed/media (often stones or plastic). Lagoons rely on the interaction of sunlight, algae, microorganisms and oxygen. The advantages and drawbacks related to the various secondary wastewater treatment processes in addition to the BOD5 removal efficiency are outlined in Table 3.2. 3.3.2.1.1 Activated Sludge In general, the activated sludge process is a continuous or semi continuous (fill and draw) aerobic method for biological wastewater treatment, including carbonaceous oxidation and nitrification. This process is based on the aeration of wastewater with flocculating biological growth, followed by separation of treated wastewater from this growth. Part of this growth is then wasted, and the remainder is returned to the system. Usually, the separation of the growth from the treated wastewater is performed by settling (gravity separation) but it may also be done by flotation and other methods. The conventional activated sludge process involves screening and grit removal, primary settling, aeration and final settling. A modification to the conventional process is the extended aeration process, in which wastewater is screened and aerated in a large capacity reactor, over a long period of time, before progressing to a separate final settlement tank, for completion of the process. This means that there is no production of primary

49
sludge and considerable savings of cost and time can be made by not having to remove it. (Masters, 1991) 3.3.2.1.2 Trickling Filters Trickling filters are used to remove organic matter from wastewater by utilizing microorganisms attached to a medium. This type of system is common to a number of technologies such as rotating biological contactors and packed bed reactors (biotowers). These systems are known as attached-growth processes. Trickling filters enable organic material in the wastewater to be adsorbed by a population of microorganisms attached to the medium as a biological film or slime layer (approximately 0.1 to 0.2 mm thick). As the wastewater flows over the medium, microorganisms already in the water gradually attach themselves to the rock, slag, or plastic surface and form a film. The organic material is then degraded by the aerobic microorganisms in the outer part of the slime layer. As the layer thickens through microbial growth, oxygen cannot penetrate the medium face, and anaerobic organisms develop. As the biological film continues to grow, the microorganisms near the surface lose their ability to cling to the medium, and a portion of the slime layer falls off the filter. This process is known as sloughing. The sloughed solids are picked up by the under drain system and transported to a clarifier for removal from the wastewater. (United States Environmental Protection Agency, 2000 a)
3.3.2.1.3 Lagoons Lagoons refer broadly to basins constructed in, or on the ground surface, using earthen dikes to retain the wastewater within which natural stabilization processes occur with the necessary oxygen coming from atmospheric diffusion, photosynthetic and/or mechanical sources. Natural lagoons are considered the simplest form of technology that relies on photosynthesis. The upper water segment in the basins is exposed to light, allowing the development of algae, which produce the oxygen that is required for developing and maintaining aerobic bacteria. These bacteria are responsible for the decomposition of the organic matter. Carbon dioxide produced by the bacteria, as well as mineral salts contained in the wastewater, allows the planktonic algae to multiply. At the bottom of the basin, where light does not penetrate there are anaerobic bacteria, which break down the sludge produced from the settling of organic matter. Carbon dioxide and methane are released from this level. In the case of aerated lagoons, oxygenation is supplied mechanically by a surface aerator or air blower. (European Commission, 2001)
50
Table 3.2 Advantages and Drawbacks of Secondary Wastewater Treatment Processes
Wastewater Treatment
Process
Advantages Drawbacks BOD5 Removal Efficiency
Con
vent
iona
l Act
ivat
ed
Slud
ge
• It isn’t land intensive • Can provide high removal rates
for suspended solids (SS) and biochemical oxygen demand (BOD)
• It is relatively odor free and can therefore be utilized within a populated area
• It can be designed to provide nitrogen and phosphorous removal and so has great flexibility
• Relatively high capital costs • High energy consumption • Requires skilled personnel
and regular monitoring • High production of sludge
that must be thickened • The settling property of
sludge is not always easy to control
85 - 95 %
Ext
ende
d A
erat
ion
• Land requirements are less compared to conventional activated sludge
• Construction costs are less compared to conventional activated sludge
• Easier to construct than conventional plants
• Operational costs are higher than those for conventional plants because of the additional air supply requirements
75 – 95 %
Tri
cklin
g Fi
lters
• Simple and reliable • Suitable in areas where large
tracts of land are not available for land intensive treatment systems
• Effective in treating high concentrations of organics depending on the type of medium used
• Appropriate for small to medium-sized communities
• Low power requirements • Moderate level of skill and
technical expertise needed to manage and operate the system
• Additional treatment may be needed to meet more stringent discharge standards
• Possible accumulation of excess biomass
• Requires regular operator attention
• Incidence of clogging is relatively high
• Requires low loadings depending on the medium
• Flexibility and control are limited in comparison with activated sludge
• Vector and odor problems
Low-rate filters: 80 – 90 % Intermediate-rate filters: 50 – 70 % High-rate filters: 65 – 85 % Roughing Filters: 40 – 65 %
Aer
ated
Lag
oon
• Tolerates large variations in hydraulic and/or organic loads
• Tolerates highly concentrated discharges
• Tolerates effluents that are unbalanced in nutrients (cause of bulking in activated sludge)
• Joint treatment of industrial and domestic biodegradable discharges
• Integrates well into the landscape • Stabilized sludge • Removal of sludge every two
years
• Discharge of average quality for all parameters
• Presence of electromechanical equipment requiring maintenance by a specialized agent
• Noise pollution linked with the presence of the aeration system
• High energy consumption
More than 80%
51
Table 3.2 Continued Wastewater Treatment
Process
Advantages Drawbacks BOD5 Removal Efficiency
Nat
ural
Lag
oons
• An energy supply is not necessary if the difference in level is favorable
• Operation remains simple, but if overall cleaning does not take place in time, the performance of the lagoon drops off very rapidly
• Eliminates a large portion of the nutrients, phosphorus and nitrogen (in summer)
• Very good elimination of pathogenic bacteria in the summer
• No hard permanent constructions, civil engineering remains simple
• Absence of noise pollution • Sludge from cleaning is well
stabilized except for that which is present at the head of the first basin
• Much ground space needed (10m2/p.e)
• Investment costs depend very heavily on the type of substratum. With unstable or sandy land, it is preferable not to consider this type of lagoon
• Performance is less than in intensive processes with respect to organic matter
• Quality of discharge varies according to season
More than 75%
3.3.2.2 Tertiary Treatment Tertiary treatment may be defined as any treatment process in which unit operations are added to the flow scheme following conventional secondary treatment. Additions to conventional secondary treatment could be as simple as the addition of a filter for suspended solids removal or as complex as the addition of many unit processes for organic, suspended solids, pathogens, nitrogen and phosphorous removal. This level of treatment has proved to be sufficient to provide reusable water for domestic and/or industrial purposes. (Masters, 1991) 3.3.2.2.1 Tertiary Filtration Tertiary granular-media filtration can be employed to remove suspended and colloidal solids, which are carried over from previous unit processes. The preferred filters are coal-sand dual media or mixed media containing anthracite coal, garnet and sand. Tertiary filtration ranges from plain filtration to traditional filtration with chemical coagulation, flocculation and sedimentation. In general, the best effluent quality achievable by plain filtration is 5 to 10 mg/L of suspended solids. If further reduction is desired, chemical coagulation must precede filtration to flocculate the colloidal solids and reduce the effluent suspended solids to less than 5 mg/L.
52
3.3.2.2.2 Nitrogen Removal Nitrogen removal can be achieved by ammonia stripping which is a simple desorption process used to lower the ammonia content of a wastewater stream. In ammonia stripping, lime or caustic is added to the wastewater until the pH reaches 10.8 to 11.5 standard units which converts ammonium hydroxide ions to ammonia gas according. A second approach to nitrogen control utilizes aerobic bacteria to convert ammonia (NH4
+) to nitrates (NO3-), which is nitrification, followed by an
anaerobic stage where different bacteria convert nitrates to nitrogen gas (N2), which is denitrification. (Masters, 1991) 3.3.2.2.3 Phosphorus Removal The phosphorus removal from the wastewater stream is important when eutrophication is a problem as it is the limiting nutrient. Only about 30% of the phosphorus in municipal wastewater is removed during conventional primary and biological treatment. Chemical precipitation using alum or lime coagulants is effective in phosphate removal. Alum can be added to the aeration tank when the activated sludge process is being used, while lime is often used after biological treatment, especially when ammonia stripping is part of the treatment process. (Masters, 1991) 3.3.2.2.4 Disinfection Disinfection of wastewater is considered one of the primary mechanisms for the inactivation/destruction of pathogenic organisms to prevent the spread of waterborne diseases to downstream users and the environment. It is important that wastewater be adequately treated prior to disinfection in order for any disinfectant to be effective. Disinfection can be achieved using various disinfectants including chlorine, ultraviolet light or ozone. The advantages and drawbacks associated with the alternative disinfection systems are presented in Table 3.3. Chlorine is the most widely used disinfectant for municipal wastewater because it destroys target organisms by oxidizing cellular material. Chlorine can be supplied in many forms, which include chlorine gas, hypochlorite solutions, and other chlorine compounds in solid or liquid form. (United States Environmental Protection Agency, 1999 a) Ozone disinfection is generally used at medium to large sized plants after at least secondary treatment. The components of an ozone disinfection system include feed-gas preparation, ozone generation, ozone contacting, and ozone destruction. Air or pure oxygen is used as the feed gas source and is passed to the ozone generator at a set flow rate. The electrical discharge method is the most common energy source used to produce ozone. Extremely dry air or pure oxygen is exposed to a controlled, uniform high-voltage discharge at a high or low frequency. After

53
generation, ozone is fed into a down-flow contact chamber containing the wastewater to be disinfected. The main purpose of the contactor is to transfer ozone from the gas bubble into the bulk liquid while providing sufficient contact time for disinfection. The off-gases from the contact chamber must be treated to destroy any remaining ozone before release into the atmosphere. (United States Environmental Protection Agency, 1999 b) An Ultraviolet (UV) disinfection system transfers electromagnetic energy from a mercury arc lamp to an organism’s genetic material (DNA and RNA). When UV radiation penetrates the cell wall of an organism, it destroys the cells ability to reproduce. The main components of a UV disinfection system are mercury arc lamps, a reactor, and ballasts. The source of UV radiation is either the low-pressure or medium-pressure mercury arc lamp with low or high intensities. The optimum wavelength to effectively inactivate microorganisms is in the range of 250 to 270 nm. (United States Environmental Protection Agency, 1999 c) Table 3.3 Advantages and Drawbacks of Alternative Wastewater Disinfections Systems
Disinfection System
Advantages Drawbacks
Chl
orin
e D
isin
fect
ion
• Chlorination is a well established technology
• Chlorine is more cost effective than either UV or ozone disinfection
• The chlorine residual that remains in the wastewater effluent can prolong disinfection even after initial treatment
• Chlorine disinfection is reliable and effective against a wide spectrum of pathogenic organisms
• Chlorine is effective in oxidizing certain organic and inorganic compounds
• Chlorination has flexible dosing control • Chlorine can eliminate certain noxious
odors during disinfection
• The chlorine residual is toxic to aquatic life and may require dechlorination
• All forms of chlorine are highly corrosive and toxic. Thus, storage, shipping, and handling pose a risk, requiring increased safety regulations
• Chlorine oxidizes certain types of organic matter in wastewater, creating more hazardous compounds (e.g. trihalomethanes THMs)
• The level of total dissolved solids is increased in the treated effluent
• Chlorine residual is unstable in the presence of high concentrations of chlorine demanding materials, thus requiring higher doses to effect adequate disinfection
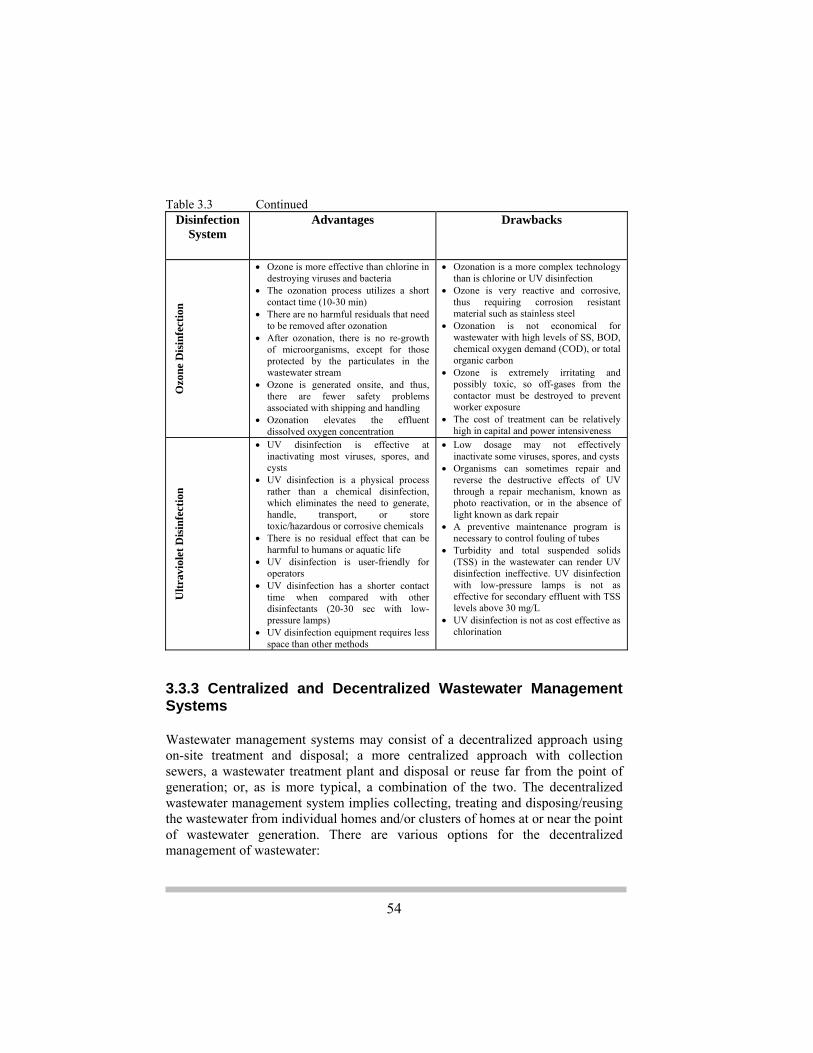
54
Table 3.3 Continued
Disinfection System
Advantages Drawbacks
Ozo
ne D
isin
fect
ion
• Ozone is more effective than chlorine in destroying viruses and bacteria
• The ozonation process utilizes a short contact time (10-30 min)
• There are no harmful residuals that need to be removed after ozonation
• After ozonation, there is no re-growth of microorganisms, except for those protected by the particulates in the wastewater stream
• Ozone is generated onsite, and thus, there are fewer safety problems associated with shipping and handling
• Ozonation elevates the effluent dissolved oxygen concentration
• Ozonation is a more complex technology than is chlorine or UV disinfection
• Ozone is very reactive and corrosive, thus requiring corrosion resistant material such as stainless steel
• Ozonation is not economical for wastewater with high levels of SS, BOD, chemical oxygen demand (COD), or total organic carbon
• Ozone is extremely irritating and possibly toxic, so off-gases from the contactor must be destroyed to prevent worker exposure
• The cost of treatment can be relatively high in capital and power intensiveness
Ultr
avio
let D
isin
fect
ion
• UV disinfection is effective at inactivating most viruses, spores, and cysts
• UV disinfection is a physical process rather than a chemical disinfection, which eliminates the need to generate, handle, transport, or store toxic/hazardous or corrosive chemicals
• There is no residual effect that can be harmful to humans or aquatic life
• UV disinfection is user-friendly for operators
• UV disinfection has a shorter contact time when compared with other disinfectants (20-30 sec with low-pressure lamps)
• UV disinfection equipment requires less space than other methods
• Low dosage may not effectively inactivate some viruses, spores, and cysts
• Organisms can sometimes repair and reverse the destructive effects of UV through a repair mechanism, known as photo reactivation, or in the absence of light known as dark repair
• A preventive maintenance program is necessary to control fouling of tubes
• Turbidity and total suspended solids (TSS) in the wastewater can render UV disinfection ineffective. UV disinfection with low-pressure lamps is not as effective for secondary effluent with TSS levels above 30 mg/L
• UV disinfection is not as cost effective as chlorination
3.3.3 Centralized and Decentralized Wastewater Management Systems Wastewater management systems may consist of a decentralized approach using on-site treatment and disposal; a more centralized approach with collection sewers, a wastewater treatment plant and disposal or reuse far from the point of generation; or, as is more typical, a combination of the two. The decentralized wastewater management system implies collecting, treating and disposing/reusing the wastewater from individual homes and/or clusters of homes at or near the point of wastewater generation. There are various options for the decentralized management of wastewater:
55
• Onsite Systems for a Single House The subsurface soil absorption system has been recognized as the most appropriate technique for onsite wastewater treatment. In this system wastewater is treated by a septic tank and/or aerobic unit and the effluent is disposed through a soil absorption system. The septic tank is an underground watertight container that collects and provides primary treatment of wastewater by holding the wastewater in the tank and allowing settleable solids to settle to the bottom while floatable solids (oil and grease) rise to the top. Up to 50% of the solids retained in the tank decompose, while the remainder accumulate as sludge at the bottom of the tank and must be removed periodically by pumping the tank. The tank should retain the wastewater for at least 24 hours. The effluent form the septic tank is either disposed of through soil absorption fields e.g. trenches or beds, provided that site characteristics are appropriate, or subjected to further treatment employing a sand filter. In soil absorption systems, the treated or partially treated effluent is discharged underneath the soil surface. The effluent should be allowed to infiltrate through a 1.0 – 1.5m of unsaturated soil where the naturally existing bacteria acts to further purify it before entering the groundwater zone. (United States Environmental Protection Agency, 2000 b)
• Onsite Systems for a Cluster of Houses In certain cases, it is more appropriate to employ a wastewater management system for a cluster of houses rather than installing individual ones for each single house. In such cases, there is a need to install a sewage collection system. Small diameter gravity and pressure sewers are appropriate for small communities as they are affordable and less-water-intensive alternatives to the conventional sewerage collection systems.
• Package Sewage Disposal Systems There are sewage disposal systems designed and installed as one package to serve a single house or a cluster of houses. In general, the wastewater treatment processes that are integrated in such systems include screening, sedimentation, biological treatment and disinfection. An example of such systems is the ECOFLUID Package Sewage Disposal System. The wastewater treatment in such system is achieved by biological processes using single heterogeneous activated sludge kept in suspension. The treatment includes nitrification and denitrification processes. Separation of the effluent from the sludge suspension takes place in the separation zone by fluid to fluid, or sludge blanket filtration. The treatment process is self-regulating and the unit automatically reacts to changes in flow throughout the day. The decentralized wastewater management system has received increased attention from wastewater researchers for solving the problem of wastewater in small communities and in areas where water supplies are intermittent and water consumption is low. This management system has the potential for delivering

56
several benefits including: increasing wastewater reuse opportunities by keeping wastewater as close as practical to the reuse site; reducing wastewater transportation and collection costs; and lowering the probability of simultaneous failure of all small systems in comparison to that of one system serving the entire community. (Bakir, 2000) 3.3.4 Wastewater Reuse Wastewater recycling and reuse is considered a very important option for generating additional water resources to replace fresh water used for agricultural and industrial purposes. Types of reuse may be grouped as restricted and unrestricted agricultural irrigation, restricted and unrestricted urban irrigation, industrial reuse, and recharge of aquifers used for groundwater supply. Such grouping is based on the applied wastewater treatment processes and the water quality requirements. Table 3.4 lists the general reuse applications, the treatment processes and the water quality requirements as adapted from the Guidelines for Water Reuse that are prepared by the U.S. Environmental Protection Agency (EPA). (Hammer, 1996)
3.3.5 Strategic Options According to the Palestinian Environmental Strategy Wastewater management has been identified as the most urgent element in the Palestinian Environmental Strategy (PES). The strategy calls for establishing an effective wastewater management system that considers the following measures: (Ministry of Environmental Affairs, 2000)
• Rehabilitation of existing wastewater treatment plants and/or construction of new plants based on maximization of capacities in order to minimize the number of plants required;
• Maximizing coverage of households’ connections to the sewer system; • Considering alternative collection and disposal measures for areas where
the construction of sewage networks is unfeasible; • Developing regulations for treatment or disposal of sludge that is
generated by wastewater treatment plants; • Enabling an acceptable quality range of influent wastewater, so that
treatment plants will be able to treat wastewater effectively, • Industries have to undertake on-site pre-treatment measures to comply
with the treatment plants specifications; • Developing guidelines and specifications for the wastewater treatment
technologies and locations; and • Establishing a cost recovery system.

57
Table 3.4 Types of Reuse, Treatment, and Water Quality Requirements Water Quality Treatment Types of Reuse
30 mg/l BOD, 30 mg/l SS, and 200/100 ml fecal coliforms
Secondary and chlorination or storage ponds with 25 days of detention time
Agricultural irrigation with restricted access of fodder, fiber, seed crops, sod farms, pasture land, and areas with restricted public access
30 mg/l BOD, 30 mg/l SS, and 23/100 ml fecal coliforms 10 mg/l BOD, 2NTU, and 2.2/100 ml fecal coliforms
Surface irrigation: secondary, disinfection Spray irrigation: secondary, coagulation, filtration, disinfection
Agricultural irrigation of food crops commercially processed and foods eaten raw and irrigation of orchards and vineyards
10 mg/l BOD, 10 mg/l SS, and 23/100 ml fecal coliforms
Secondary and disinfection Urban irrigation with restricted access such as golf courses, cemeteries, and roadway medians
10 mg/l BOD, 2NTU, and 2.2/100 ml fecal coliforms
Secondary, coagulation, filtration, disinfection
Urban reuse with unrestricted access, such as irrigation of parks, residential, and commercial areas
10 mg/l BOD, 10 mg/l SS, and 23/100 ml fecal coliforms
Secondary and disinfection Industrial reuse for cooling water, pulp and paper, textile, and similar applications
0.5 NTU, 2 TOC, 1000 TDS, zero fecal coliforms, and meeting other drinking water standards.
Secondary, lime coagulation, filtration, carbon adsorption, disinfection, and possible reverse osmosis
Groundwater recharge and potable water reuse by subsurface injection and short detention surface water
3.4 Chapter Summary Waste management options range from the existing management practices to the introduction of several comprehensive schemes comprising practical combinations of waste collection, transport, treatment/processing and/or reuse. As regards to domestic solid waste management in the West Bank, the collected waste is currently dumped in 189 uncontrolled dumping sites, where open burning of waste is practiced except in Abu Dies and Nablus sites where the waste is land filled. In the Gaza Strip, the collected waste is disposed of in Gaza, Deir Al Balah and Rafah sanitary landfills. The alternative options for the collection of solid waste include the curbside/alley collection, backyard set out - set back collection, backyard carry collection, and the drop off at specified collection point. The collected solid waste can either be directly transported to the processing facilities or to transfer stations where it can be separated and/or compacted before being transported to final destination. Solid waste processing includes recycling, composting, incineration and landfilling. The Palestinian Environmental Strategy

58
calls for establishing sanitary landfills to dispose of the generated solid waste. It considers the other processing methods unfeasible for the short term. Concerning the domestic wastewater management, the existing conventional gravity sewage networks serve approximately 28-32% and 66% of the West Bank and Gaza Strip populations, respectively. About 90% of the generated wastewater in the West Bank is currently discharged untreated into the environment. The only functioning wastewater treatment plant exists in Al Bireh City in the Ramallah District. In the Gaza Strip, the wastewater treatment plants of Gaza, North Gaza and Rafah are functioning at moderate efficiency rates, thus generating partially treated wastewater. Both the partially treated and untreated wastewater is discharged into open areas or into the Sea. The management of wastewater can be achieved by decentralized systems using on-site treatment and disposal and/or centralized systems using conventional collection sewers and centralized treatment plants located far from the point of generation. The alternative options for the collection and treatment of wastewater are summarized as follows:
• Wastewater collection is achieved by conventional gravity sewer systems that are typically used in urban areas. The alternative collection systems include small diameter gravity sewers, pressure sewers and vacuum sewers.
• Wastewater treatment processes include primary (i.e. physical removal of floatable and settleable solids), secondary (i.e. biological removal of dissolved solids) and advanced tertiary treatment, depending on the degree of purification. There are three options for the secondary treatment of wastewater including the activated sludge, trickling filters and lagoons. The biologically treated wastewater should be disinfected using chlorine, ultraviolet light or ozone to destruct harmful microorganisms.
The Palestinian Environmental Strategy calls for maximizing the coverage of households’ connections to the sewer system, rehabilitating the existing wastewater treatment plants and/or constructing new treatment plants. It also calls for considering alternative collection and disposal measures for areas where the construction of sewage networks is unfeasible.

59
CHAPTER 44 Assessment of Public Perceptions about Waste Management Issues
ecision making as regards to environmental management issues including the management of solid waste and wastewater leads to the formulation of
environmental strategies and policies. These policies may entail positive and negative impacts that are reflected on the welfare of local citizens’ who also play a key role in the success of the implementation process of the relevant actions and measures. Accordingly, public participation in the environmental decision making process is crucial in order to give the citizens the opportunity to express their needs, enter into dialogue with decision makers and share the responsibility of environmental planning. This results in having strong advocates of the environmental management initiatives and familiarizes decision makers with public perceptions about the proposed initiatives. Out of this context, public participation was considered in the conducted research study to understand and assess the perceptions of local citizens about various solid waste and wastewater management issues. It was achieved through conducting semi-structured interviews with 1,132 individuals who were selected using the stratified random sampling method in which a simple random sample was taken from each district in the West Bank and Gaza Strip. The number of individuals in the randomly selected sample in each district and the corresponding confidence interval are outlined in Table 4.1. A questionnaire was formulated to facilitate the communication between the surveyors and the interviewees. The questionnaire addressed various issues including:
• Citizens’ perceptions about the problems associated with the existing management of solid waste and wastewater; the causes of the problems; the impacts of the problems on public health, environmental health and social welfare; and the proposed solutions to alleviate the impacts of the problem.
• Citizens’ perceptions about the alternative options for managing solid waste and wastewater.
D

60
• The willingness of people to participate in separating and sorting domestic solid waste; carrying out backyard composting and utilizing compost in their gardens or agricultural lands; constructing small scale wastewater treatment plants; and reusing treated wastewater for irrigation purposes and/or for domestic purposes such as toilet flushing and floor cleaning.
• The willingness of people to pay more for improvements in the existing solid waste and wastewater management system in the West Bank and Gaza Strip.
The data compiled through the questionnaires were entered into the Statistical Package for Social Sciences (SPSS) and then analyzed. The findings of the analysis are discussed in the following sections. Table 4.1 The Size of the Random Sample and Confidence Intervals in Each District
District Total Population
(2002) Number of Individuals
Confidence Interval (%)
Hebron 500,000 122 ±8.87 Bethlehem 160,000 84 ±10.69 Jerusalem 138,341 71 ±11.63 Ramallah 256,483 82 ±10.82 Jericho 39,000 45 ±14.6 Tubas 43,237 46 ±14.44 Nablus 300,000 107 ±9.47 Salfit 57,300 56 ±13.09 Tulkarm 156,000 72 ±11.55 Jenin 236,000 78 ±11.09 Qalqiliya 86,284 63 ±12.34 West Bank 1,972,645 826 ±3.41 Deir Al Balah 182,882 51 ±13.72
Gaza 446,416 69 ±11.80
Khan Yunis 245,588 90 ±10.33
North Gaza 237,641 50 ±13.86
Rafah 150,725 45 ±14.61
Gaza Strip 1,263,252 305 ±5.61
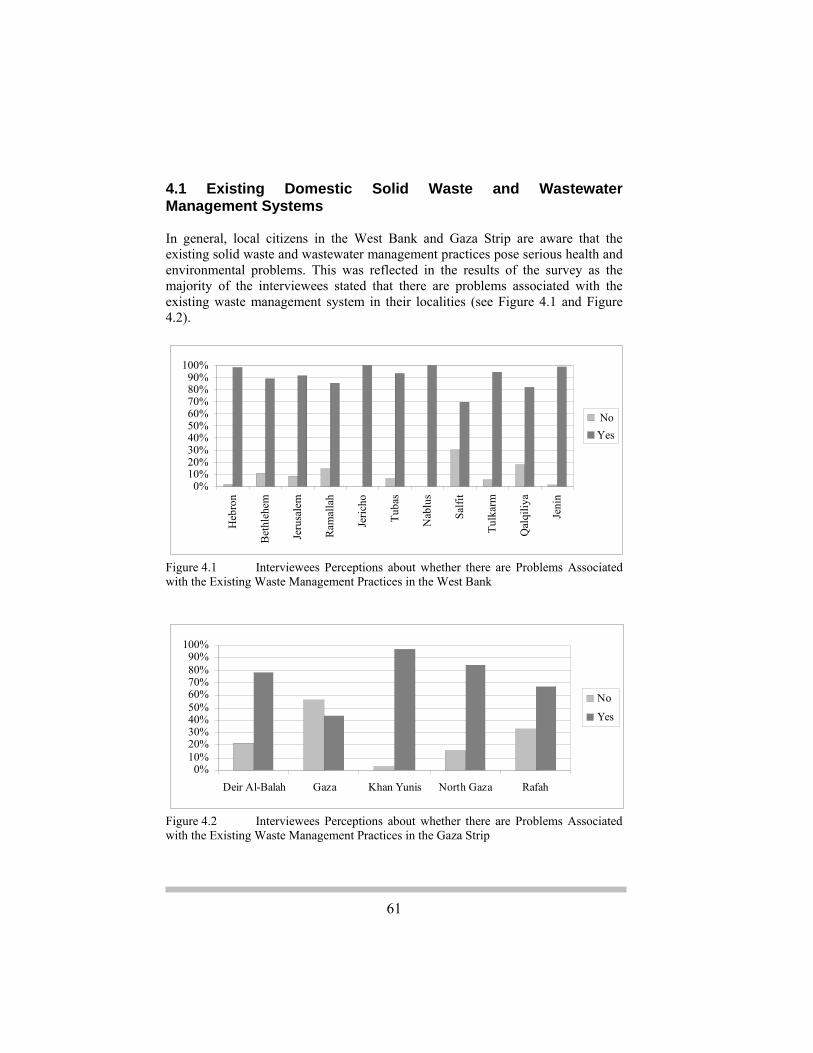
61
4.1 Existing Domestic Solid Waste and Wastewater Management Systems In general, local citizens in the West Bank and Gaza Strip are aware that the existing solid waste and wastewater management practices pose serious health and environmental problems. This was reflected in the results of the survey as the majority of the interviewees stated that there are problems associated with the existing waste management system in their localities (see Figure 4.1 and Figure 4.2).
0%10%20%30%40%50%60%70%80%90%
100%
Heb
ron
Bet
hleh
em
Jeru
sale
m
Ram
alla
h
Jeric
ho
Tuba
s
Nab
lus
Salfi
t
Tulk
arm
Qal
qiliy
a
Jeni
n
NoYes
Figure 4.1 Interviewees Perceptions about whether there are Problems Associated with the Existing Waste Management Practices in the West Bank
0%10%20%30%40%50%60%70%80%90%
100%
Deir Al-Balah Gaza Khan Yunis North Gaza Rafah
No
Yes
Figure 4.2 Interviewees Perceptions about whether there are Problems Associated with the Existing Waste Management Practices in the Gaza Strip

62
According to the interviewees’ perceptions, the following problems exist: • Flooding of wastewater collected in cesspits; • Flooding of wastewater collected in sewage networks; • Accumulation of solid waste in the streets and outside the containers; • Open burning of solid waste in dumping sites and containers; • Random dumping of scrap cars; • Noise pollution; • Spreading of dust; • Spreading of rats; • Spreading of insects; • Pollution of springs; and • Lack of commitment from citizens in paying the fees.
The frequencies for each of the aforementioned problems were recorded as observed in the semi-structured interviews. The results are available in Table 4.2 for the West Bank and Gaza Strip districts. It can be noted that the problem of solid waste accumulation in the streets and outside the containers has the highest ranking in most of the districts except in Qalqiliya, North Gaza and Rafah districts where the problem of insect spreading has the highest ranking. The stated problems were also analyzed in reference to the impact level of the existing pollution sources associated with the improper waste management on the localities in which the interviewees reside. The localities were classified into impacted and not impact areas. The former refers to localities located close to open dumping sites and/or wastewater streams (i.e. within a 2 km diameter), whereas the latter refers to localities located far from these pollution sources. The analysis revealed that the abovementioned problems are somehow more severe in areas located close to pollution sources (impacted areas) than in those located far from pollution sources as shown in Figure 4.3 for the West Bank and Figure 4.4 for the Gaza Strip. The causes that led to the prevalence of the waste management related problems specified by the interviewees were also investigated in order to understand the perceptions’ of local citizens about these causes. The interviewees linked the problems relevant to solid waste management to the following causes:
• Insufficient number of solid waste vehicles; • Unavailability of a central dumping site; • The location of industrial plants within residential areas; • Industrial plants do not apply minimum health standards; • Insufficient number of solid waste containers; • The location of dumping sites close to residential and agricultural areas; • Lack of solid waste services;

63
• Open burning of solid waste in dumping sites and containers; • Irregular collection of solid waste; • Accumulation of heavy solid waste; • The closures imposed by the Israeli Occupation Authorities; • Lack of public awareness and commitment; and • Inefficient waste management services.
The frequencies for each of the above listed causes were recorded as observed in the semi-structured interviews and are presented in Table 4.3 for the West Bank and Gaza Strip. The insufficient number of solid waste containers and vehicles, the irregular collection of solid waste, and the lack of solid waste services are considered the most significant causes according to the perceptions of the West Bank citizens. This indicates that most of the interviewees are not satisfied with the existing level of solid waste management services provided by the municipal and rural councils in the West Bank and believe that it has resulted in the prevailing solid waste management related problems. In the Gaza Strip, the majority of the interviewees except those residing in the Gaza District indicated that the insufficient number of containers has highly contributed in the occurrence of the existing problems.

64
Table 4.2 Frequency of Problems Associated with the Existing Waste Management Practices in each of the West Bank and Gaza Strip Districts
Stated Problem
West Bank (%) Gaza Strip (%)
Heb
ron
Bet
hleh
em
Jeru
sale
m
Ram
alla
h
Jeri
cho
Tub
as
Nab
lus
Salfi
t
Tul
karm
Jeni
n
Qal
qiliy
a
Dei
r A
l B
alah
Gaz
a
Kha
n Y
unis
Nor
th
Gaz
a
Raf
ah
Flooding of Wastewater Collected in Cesspits 76 51 38 4 9 33 82 22 45 69 33 23 5 51 27 19 Accumulation of Solid Waste in the Streets and Outside the Containers 92 53 64 68 45 40 95 37 63 71 33 31 20 73 41 20 Flooding of Wastewater Collected in Sewage Networks 10 2 0 19 0 0 1 2 0 3 2 0 8 17 8 8 Noise Pollution 2 0 0 0 0 0 0 0 0 0 4 21 9 21 38 26 Spreading of Dust 15 8 1 0 0 0 4 0 1 0 3 17 11 9 23 1 Spreading of Rats 26 1 3 0 3 2 14 0 15 11 3 24 17 47 42 21 Spreading of Insects 60 2 10 11 21 9 61 6 41 29 35 23 19 60 42 29 Pollution of Springs 2 2 1 0 0 7 2 0 1 1 3 8 12 4 14 16 Open Burning of Solid Waste in Dumping Sites and Containers 42 7 0 2 14 2 49 8 21 20 8 2 9 5 2 0 Lack of Commitment From Citizens in Paying the Fees 0 1 0 0 8 1 2 0 8 0 0 0 1 1 1 0 Random Dumping of Scrap Cars 0 4 0 0 0 0 0 0 0 0 0 0 0 1 1 0

65
0%
10%
20%
30%
40%
50%
60%
70%
80%
90%
Floo
ding
of W
aste
wat
erC
olle
cted
in C
essp
its
Acc
umul
atio
n of
Sol
id W
aste
in th
e St
reet
s and
Out
side
the
Con
tain
ers
Floo
ding
of W
aste
wat
erC
olle
cted
in S
ewag
eN
etw
orks
Noi
se P
ollu
tion
Spre
adin
g of
Dus
t
Spre
adin
g of
Rat
s
Spre
adin
g of
Inse
cts
Pollu
tion
of S
prin
gs
Ope
n B
urni
ng o
f Sol
id W
aste
in D
umpi
ng S
ites a
ndC
onta
iner
s
Lack
of C
omm
itmen
t fro
mC
itize
ns in
Pay
ing
the
Fees
Ran
dom
Dum
ping
of S
crap
Car
s
Not ImpactedImpacted
Figure 4.3 Frequency of Problems Related to Waste Management as Perceived by Citizens Living in localities Located Close and Far from Major Pollution Sources in the West Bank

66
0%
10%
20%
30%
40%
50%
60%
70%
80%
90%
Floo
ding
of W
aste
wat
erC
olle
cted
in C
essp
its
Acc
umul
atio
n of
Sol
id W
aste
in th
e St
reet
s and
Out
side
the
Con
tain
ers
Floo
ding
of W
aste
wat
erC
olle
cted
in S
ewag
e N
etw
orks
Noi
se P
ollu
tion
Spre
adin
g of
Dus
t
Spre
adin
g of
Rat
s
Spre
adin
g of
Inse
cts
Pollu
tion
of S
prin
gs
Ope
n B
urni
ng o
f Sol
id W
aste
in D
umpi
ng S
ites a
ndC
onta
iner
s
Lack
of C
omm
itmen
t fro
mC
itize
ns in
Pay
ing
the
Fees
Ran
dom
Dum
ping
of S
crap
Car
s
Not ImpactedImpacted
Figure 4.4 Frequency of Problems Related to Waste Management as Perceived by Citizens Living in localities Located Close and Far from Major Pollution Sources in the Gaza Strip
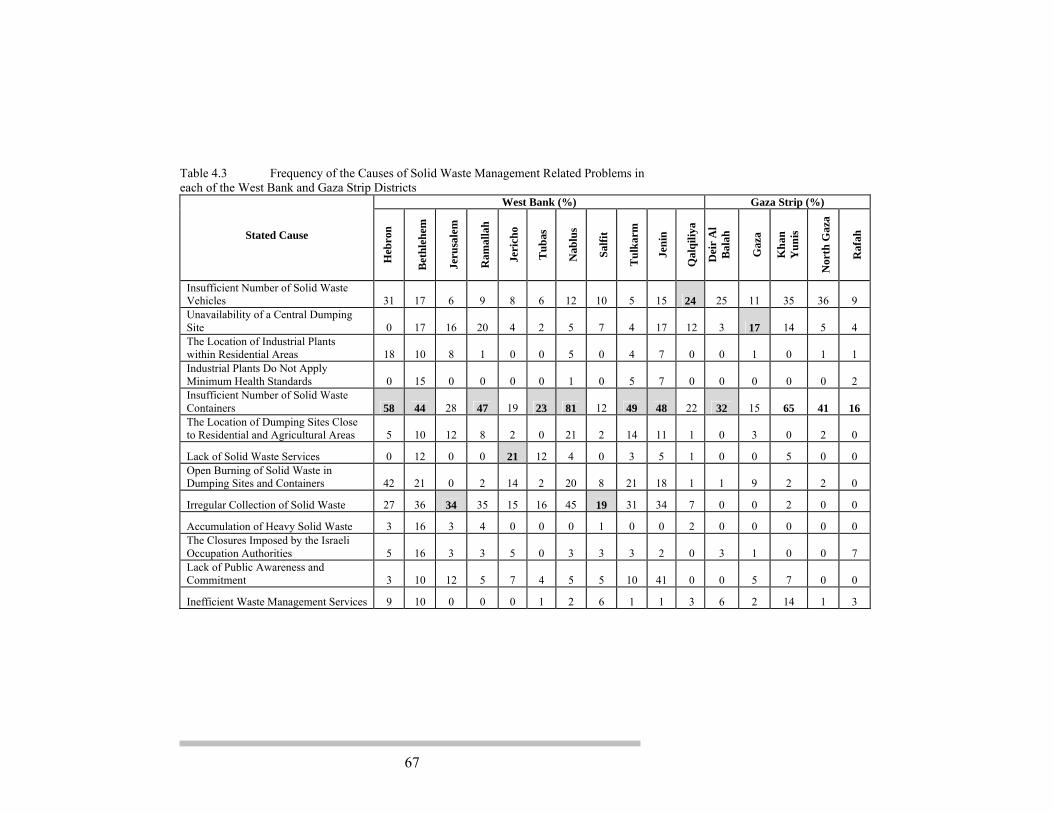
67
Table 4.3 Frequency of the Causes of Solid Waste Management Related Problems in each of the West Bank and Gaza Strip Districts
Stated Cause
West Bank (%) Gaza Strip (%)
Heb
ron
Bet
hleh
em
Jeru
sale
m
Ram
alla
h
Jeri
cho
Tub
as
Nab
lus
Salfi
t
Tul
karm
Jeni
n
Qal
qiliy
a
Dei
r A
l B
alah
Gaz
a
Kha
n Y
unis
Nor
th G
aza
Raf
ah
Insufficient Number of Solid Waste Vehicles 31 17 6 9 8 6 12 10 5 15 24 25 11 35 36 9 Unavailability of a Central Dumping Site 0 17 16 20 4 2 5 7 4 17 12 3 17 14 5 4 The Location of Industrial Plants within Residential Areas 18 10 8 1 0 0 5 0 4 7 0 0 1 0 1 1 Industrial Plants Do Not Apply Minimum Health Standards 0 15 0 0 0 0 1 0 5 7 0 0 0 0 0 2 Insufficient Number of Solid Waste Containers 58 44 28 47 19 23 81 12 49 48 22 32 15 65 41 16 The Location of Dumping Sites Close to Residential and Agricultural Areas 5 10 12 8 2 0 21 2 14 11 1 0 3 0 2 0
Lack of Solid Waste Services 0 12 0 0 21 12 4 0 3 5 1 0 0 5 0 0Open Burning of Solid Waste in Dumping Sites and Containers 42 21 0 2 14 2 20 8 21 18 1 1 9 2 2 0
Irregular Collection of Solid Waste 27 36 34 35 15 16 45 19 31 34 7 0 0 2 0 0
Accumulation of Heavy Solid Waste 3 16 3 4 0 0 0 1 0 0 2 0 0 0 0 0 The Closures Imposed by the Israeli Occupation Authorities 5 16 3 3 5 0 3 3 3 2 0 3 1 0 0 7 Lack of Public Awareness and Commitment 3 10 12 5 7 4 5 5 10 41 0 0 5 7 0 0
Inefficient Waste Management Services 9 10 0 0 0 1 2 6 1 1 3 6 2 14 1 3

68
Concerning the causes of the wastewater management related problems, the interviewees focused on the following:
• Lack of sewage networks; • Small diameter sewage pipes; • The use of cesspits; • Small capacity of cesspits; • High expenses of using vacuum tankers; • Open flow of wastewater; • Incomplete connection of houses to sewage networks; • The location of industrial plants within residential areas; • Industrial plants do not apply minimum health standards; • Lack of public awareness and commitment; and • Inefficient waste management services.
The frequencies for each of the aforementioned causes were recorded as observed in the semi-structured interviews and are outlined in Table 4.4 for the West Bank and Gaza Strip. According to public perceptions, the lack of sewage networks, small capacities of cesspits and the high expenses of using vacuum tankers are considered the most important causes that led to the existing wastewater management related problems in the West Bank. In the Gaza Strip, lack of sewage networks has the highest ranking among the other causes. It can be indicated that the citizens are highly concerned about the collection of the generated wastewater due to the inefficient collection system and the inability of citizens to afford the high expenses of vacuum tankers that are used to empty the cesspits. Moreover, it is essential to understand how local citizens perceive the impact level of the existing waste management practices on natural resources as this reflects their concerns about the surrounding environment. They were asked to indicate if the management practices entail adverse impacts on water resources, house cisterns, air, soil, agricultural lands, livestock, wild plants and animals as well as on the aesthetic value of their surroundings. The analysis results are presented in Figure 4.5 for the West Bank and Figure 4.6 for the Gaza Strip. The interviewees indicated that the existing waste management practices have negatively impacted the natural resources and distorted the visual environment. In the West Bank, the citizens were most concerned about the adverse impacts on air quality and the aesthetic value of the surrounding environment. They paid less concern to the adverse impacts on water resources and house cisterns. In the Gaza Strip, the interviewees were most concerned about the adverse impacts of the existing waste management practices on the aesthetic value of their surrounding environment. They showed some concern to the adverse impacts on air quality and water resources. It should be indicated that the awareness level among the citizens of the West Bank and Gaza Strip must be raised in this respect.

69
Table 4.4 Frequency of the Causes of Wastewater Management Related Problems in each of the West Bank and Gaza Strip Districts
Stated Cause
West Bank (%) Gaza Strip (%)
Heb
ron
Bet
hleh
em
Jeru
sale
m
Ram
alla
h
Jeri
cho
Tub
as
Nab
lus
Salfi
t
Tul
karm
Jeni
n
Qal
qiliy
a
Dei
r A
l B
alah
Gaz
a
Kha
n Y
unis
Nor
th G
aza
Raf
ah
Lack of Sewage Networks 13 43 25 20 9 33 61 12 45 61 35 21 8 65 24 17
Small Diameter Sewage Pipes 0 14 0 0 0 0 7 1 0 1 0 1 2 0 5 3
The Use of Cesspits 0 19 0 0 2 0 4 0 0 2 31 12 1 19 9 0
Small Capacity of Cesspits 75 43 8 4 0 7 55 12 16 12 14 1 0 6 10 0 High Expenses of Using Vacuum Tankers 1 47 0 0 0 2 47 0 15 23 13 0 0 10 1 0
Open Flow of Wastewater 11 14 0 0 0 6 9 0 6 3 9 5 4 0 0 7 Incomplete Connection of Houses to Sewage Networks 3 13 7 7 0 0 1 4 0 10 1 7 1 1 6 7 The Location of Industrial Plants Within Residential Areas 18 10 8 1 0 0 5 0 4 7 0 0 1 0 1 1 Industrial Plants Do Not Apply Minimum Health Standards 0 15 0 0 0 0 1 0 5 7 0 0 0 0 0 2 Lack of Public Awareness and Commitment 3 10 12 5 7 4 5 5 10 41 0 0 5 7 0 0 Inefficient Waste Management Services 9 10 0 0 0 1 2 6 1 1
3 6 2 14 1 3

70
0%
10%
20%
30%
40%
50%
60%
70%
80%
Wat
erR
esou
rces
Hou
seC
iste
rns
Air
Soil
Agr
icul
tura
lLa
nds
Wild
Pla
nts
Live
stoc
k
Wild
Ani
mal
s
Aes
thet
icV
alue
of t
heSu
rrou
ndin
g
Figure 4.5 Perceived Level of Adverse Impacts of the Existing Waste Management Practices on the Natural Resources in the West Bank
0%
10%
20%
30%
40%
50%
60%
70%
80%
Wat
erR
esou
rces
Hou
seC
iste
rns
Air
Soil
Agr
icul
tura
lLa
nds
Wild
Pla
nts
Live
stoc
k
Wild
Ani
mal
s
Aes
thet
icV
alue
of t
heSu
rrou
ndin
g
Figure 4.6 Perceived Level of Adverse Impacts of the Existing Waste Management Practices on the Natural Resources in the Gaza Strip
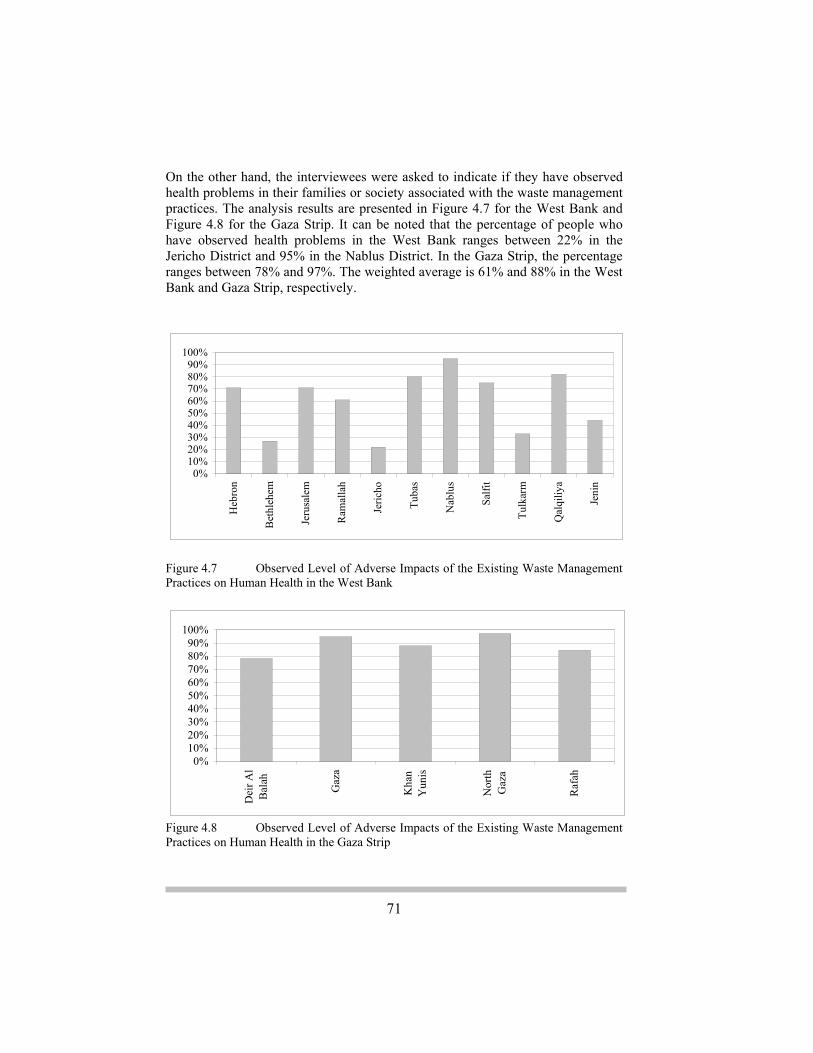
71
On the other hand, the interviewees were asked to indicate if they have observed health problems in their families or society associated with the waste management practices. The analysis results are presented in Figure 4.7 for the West Bank and Figure 4.8 for the Gaza Strip. It can be noted that the percentage of people who have observed health problems in the West Bank ranges between 22% in the Jericho District and 95% in the Nablus District. In the Gaza Strip, the percentage ranges between 78% and 97%. The weighted average is 61% and 88% in the West Bank and Gaza Strip, respectively.
0%10%20%30%40%50%60%70%80%90%
100%
Heb
ron
Bet
hleh
em
Jeru
sale
m
Ram
alla
h
Jeric
ho
Tuba
s
Nab
lus
Salfi
t
Tulk
arm
Qal
qiliy
a
Jeni
n
Figure 4.7 Observed Level of Adverse Impacts of the Existing Waste Management Practices on Human Health in the West Bank
0%10%20%30%40%50%60%70%80%90%
100%
Dei
r Al
Bal
ah
Gaz
a
Kha
nY
unis
Nor
thG
aza
Raf
ah
Figure 4.8 Observed Level of Adverse Impacts of the Existing Waste Management Practices on Human Health in the Gaza Strip

72
4.2 Alternative Options for Solid Waste and Wastewater Management As indicated previously, it is essential to consider the opinions of local citizens during the evaluation of the alternative options for solid waste processing and wastewater management. Accordingly, the interviewees were given a brief description of the alternative options with the relevant advantages and disadvantages and then were asked to specify the most favorable option from their point of view. Concerning the solid waste processing methods, the most favorable option based on the perceptions of the interviewees in the West Bank is Land filling, followed by recycling, composting and incineration (see Figure 4.9). In the Gaza Strip, the recycling option has the highest ranking followed by composting, land filling and incineration (see Figure 4.10). This is because the residents of Gaza Strip have experienced the land filling of solid waste in the existing sanitary landfills. The analysis results are also presented for each of the West Bank and Gaza Strip districts as shown in Figure 4.11 and Figure 4.12, respectively.
0%
10%
20%
30%
40%
50%
60%
Composting Recycling Incineration Landfilling
Figure 4.9 Frequency of Solid Waste Processing Methods as Preferred by the Interviewees in the West Bank

73
0%
10%
20%
30%
40%
50%
60%
Composting Recycling Incineration Landfilling
Figure 4.10 Frequency of Solid Waste Processing Methods as Preferred by the Interviewees in the Gaza Strip
0%10%20%30%40%50%60%70%80%90%
100%
Heb
ron
Bet
hleh
em
Jeru
sale
m
Ram
alla
h
Jeric
ho
Tuba
s
Nab
lus
Salfi
t
Tulk
arm
Qal
qiliy
a
Jeni
n
CompostingRecyclingIncinerationLandfilling
Figure 4.11 Frequency of Solid Waste Processing Methods as Preferred by the Interviewees in the West Bank Districts
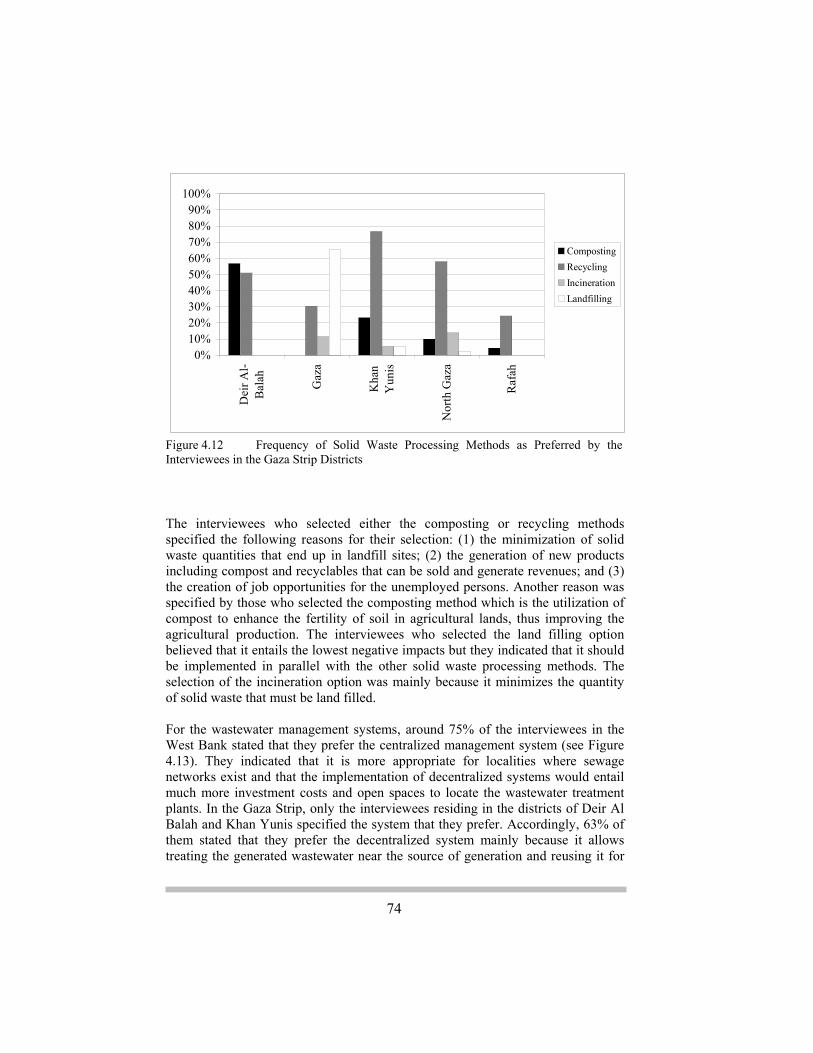
74
0%10%20%30%40%50%60%70%80%90%
100%
Dei
r Al-
Bal
ah Gaz
a
Kha
nY
unis
Nor
th G
aza
Raf
ah
CompostingRecyclingIncinerationLandfilling
Figure 4.12 Frequency of Solid Waste Processing Methods as Preferred by the Interviewees in the Gaza Strip Districts
The interviewees who selected either the composting or recycling methods specified the following reasons for their selection: (1) the minimization of solid waste quantities that end up in landfill sites; (2) the generation of new products including compost and recyclables that can be sold and generate revenues; and (3) the creation of job opportunities for the unemployed persons. Another reason was specified by those who selected the composting method which is the utilization of compost to enhance the fertility of soil in agricultural lands, thus improving the agricultural production. The interviewees who selected the land filling option believed that it entails the lowest negative impacts but they indicated that it should be implemented in parallel with the other solid waste processing methods. The selection of the incineration option was mainly because it minimizes the quantity of solid waste that must be land filled. For the wastewater management systems, around 75% of the interviewees in the West Bank stated that they prefer the centralized management system (see Figure 4.13). They indicated that it is more appropriate for localities where sewage networks exist and that the implementation of decentralized systems would entail much more investment costs and open spaces to locate the wastewater treatment plants. In the Gaza Strip, only the interviewees residing in the districts of Deir Al Balah and Khan Yunis specified the system that they prefer. Accordingly, 63% of them stated that they prefer the decentralized system mainly because it allows treating the generated wastewater near the source of generation and reusing it for

75
agricultural purposes, thus rehabilitating the degraded agricultural lands (see Figure 4.14).
Figure 4.13 Interviewees Perceptions about Wastewater Management Systems in the West Bank
0%
10%
20%
30%
40%
50%
60%
70%
Centralized Wastewater Management Decentralized WastewaterManagement
Figure 4.14 Interviewees Perceptions about Wastewater Management Systems in the Districts of Deir Al Balah and Khan Yunis in the Gaza Strip
0%10%20%30%40%50%60%70%80%
Centralized Wastewater Management Decentralized WastewaterManagement

76
4.3 Public Willingness to Pay and/or Participate in the Waste Management Process The management of solid waste and wastewater at source requires high public acceptance to participate in the relevant activities including the separation of domestic solid waste at source; the implementation of backyard composting; the utilization of compost in their gardens and agricultural lands; the construction of small scale wastewater treatment plants; and the reuse of treated wastewater for agricultural irrigation purposes and/or for domestic purposes such as toilet flushing and floor cleaning. It also involves financial contributions in the form of waste management fees from the citizens who are provided with such services in order to assist the municipal and rural councils in recovering the cost of investment as well as in running the waste management system effectively. These issues besides the public acceptance to the idea of treating the waste generated by nearby localities in their localities were identified and assessed through the conducted semi-structured interviews. 4.3.1 Public Willingness to Participate in Managing Waste at Source 4.3.1.1 Solid Waste Management The solid waste composting, recycling and/or incineration require that the relevant solid waste components be separated and sorted. This can either be carried out by the citizens at source or by the municipal staff at transfer stations. The first option was assessed by identifying the willingness level of the interviewees to separate the generated domestic solid waste before transporting it to curbside/alley containers. In the West Bank, around 84% of the interviewees showed high and moderate willingness to separate the generated solid waste at source as illustrated in Figure 4.15. The results are also presented for each of the West Bank districts as shown in Figure 4.16. In the Gaza Strip, around 92% of the interviewees expressed their high and moderate willingness to do so as illustrated in Figure 4.17. The results were also analyzed for the Gaza Strip districts as shown in Figure 4.18.
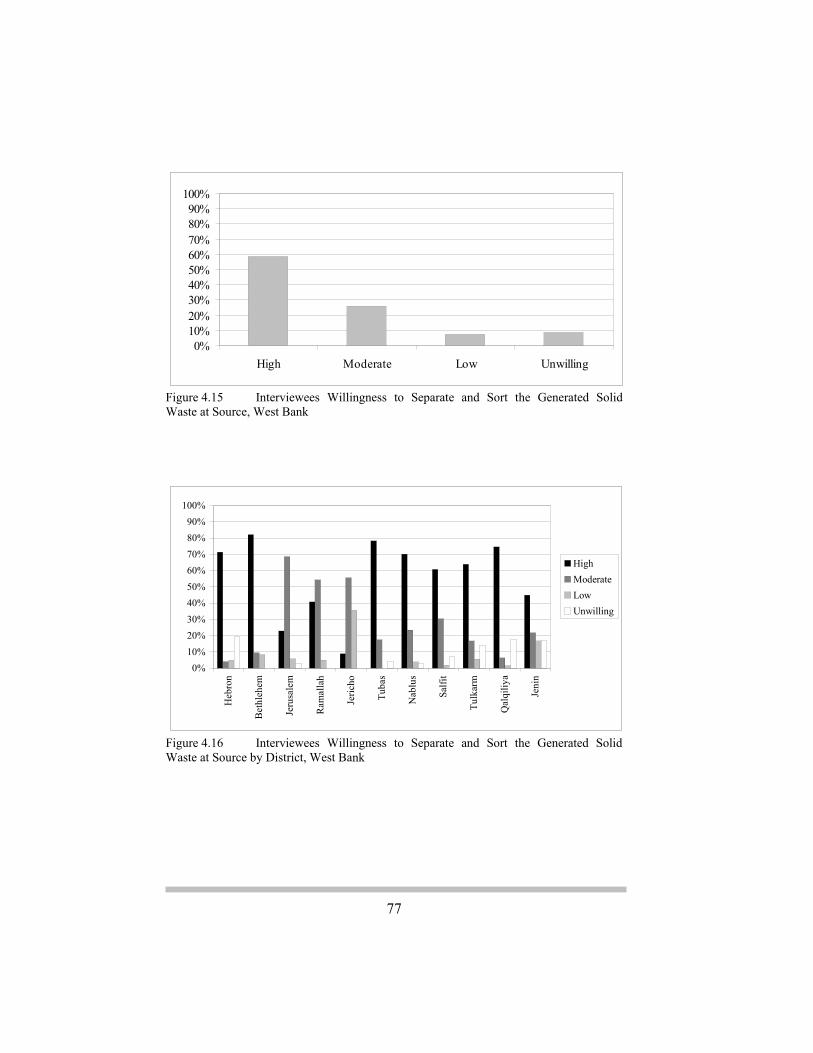
77
0%10%20%30%40%50%60%70%80%90%
100%
High Moderate Low Unwilling
Figure 4.15 Interviewees Willingness to Separate and Sort the Generated Solid Waste at Source, West Bank
0%10%20%30%40%50%60%70%80%90%
100%
Heb
ron
Bet
hleh
em
Jeru
sale
m
Ram
alla
h
Jeric
ho
Tuba
s
Nab
lus
Salfi
t
Tulk
arm
Qal
qiliy
a
Jeni
n
HighModerateLowUnwilling
Figure 4.16 Interviewees Willingness to Separate and Sort the Generated Solid Waste at Source by District, West Bank
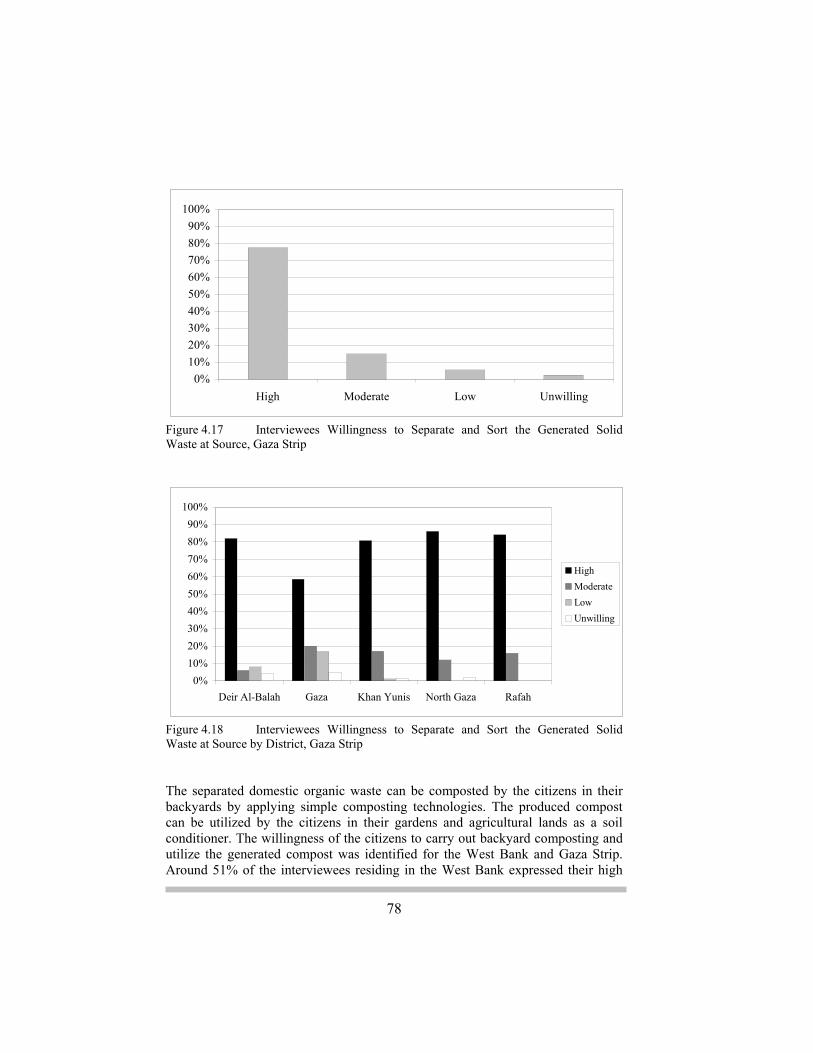
78
0%10%20%30%40%50%60%70%80%90%
100%
High Moderate Low Unwilling
Figure 4.17 Interviewees Willingness to Separate and Sort the Generated Solid Waste at Source, Gaza Strip
0%10%20%30%40%50%60%70%80%90%
100%
Deir Al-Balah Gaza Khan Yunis North Gaza Rafah
HighModerateLowUnwilling
Figure 4.18 Interviewees Willingness to Separate and Sort the Generated Solid Waste at Source by District, Gaza Strip The separated domestic organic waste can be composted by the citizens in their backyards by applying simple composting technologies. The produced compost can be utilized by the citizens in their gardens and agricultural lands as a soil conditioner. The willingness of the citizens to carry out backyard composting and utilize the generated compost was identified for the West Bank and Gaza Strip. Around 51% of the interviewees residing in the West Bank expressed their high
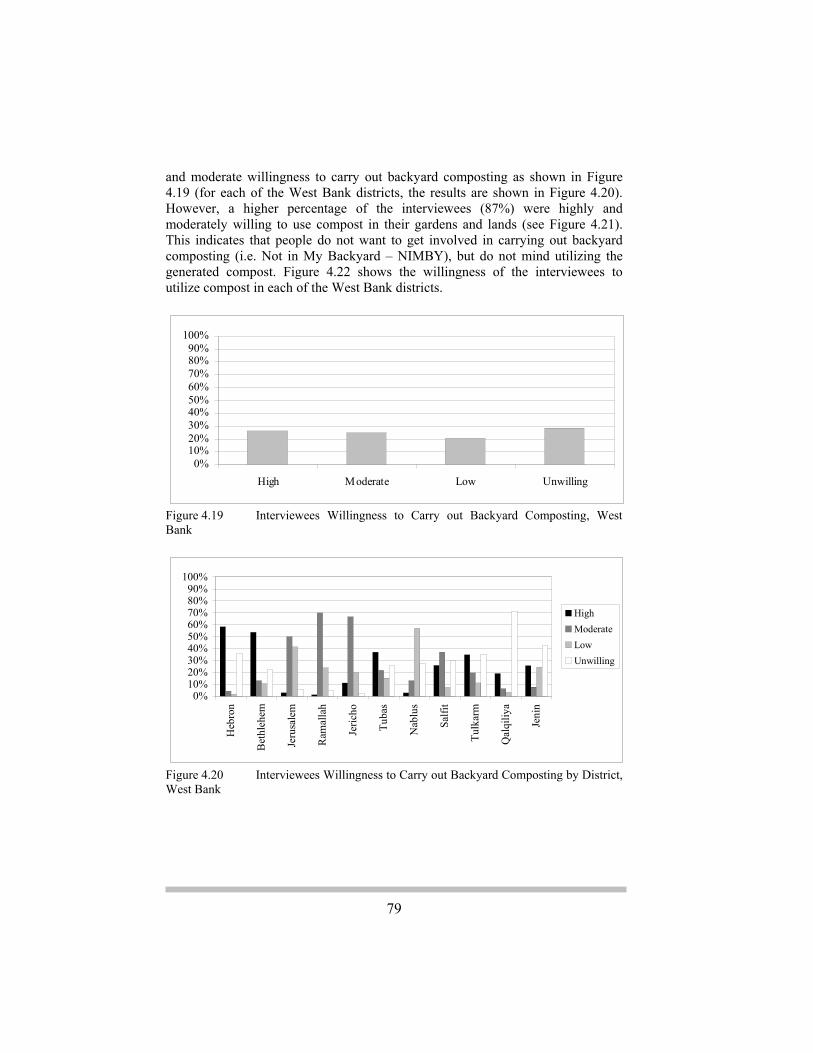
79
and moderate willingness to carry out backyard composting as shown in Figure 4.19 (for each of the West Bank districts, the results are shown in Figure 4.20). However, a higher percentage of the interviewees (87%) were highly and moderately willing to use compost in their gardens and lands (see Figure 4.21). This indicates that people do not want to get involved in carrying out backyard composting (i.e. Not in My Backyard – NIMBY), but do not mind utilizing the generated compost. Figure 4.22 shows the willingness of the interviewees to utilize compost in each of the West Bank districts.
0%10%20%30%40%50%60%70%80%90%
100%
High Moderate Low Unwilling
Figure 4.19 Interviewees Willingness to Carry out Backyard Composting, West Bank
0%10%20%30%40%50%60%70%80%90%
100%
Heb
ron
Bet
hleh
em
Jeru
sale
m
Ram
alla
h
Jeric
ho
Tuba
s
Nab
lus
Salfi
t
Tulk
arm
Qal
qiliy
a
Jeni
n
HighModerateLowUnwilling
Figure 4.20 Interviewees Willingness to Carry out Backyard Composting by District, West Bank

80
0%10%20%30%40%50%60%70%80%90%
100%
High Moderate Low Unwilling
Figure 4.21 Interviewees Willingness to Utilize Compost, West Bank
0%10%20%30%40%50%60%70%80%90%
100%
Heb
ron
Bet
hleh
em
Jeru
sale
m
Ram
alla
h
Jeric
ho
Tuba
s
Nab
lus
Salfi
t
Tulk
arm
Qal
qiliy
a
Jeni
n
HighModerateLowUnwilling
Figure 4.22 Interviewees Willingness to Utilize Compost by District, West Bank In the Gaza Strip, only 40% of the interviewees were highly and moderately willing to carry out backyard composting (see Figure 4.23). The data analyzed for each district is presented in Figure 4.24. On the other hand, 74% of the interviewees showed high and moderate willingness to utilize compost in their lands as illustrated in Figure 4.25. The willingness level to utilize compost varies from one district to another as shown in Figure 4.26.
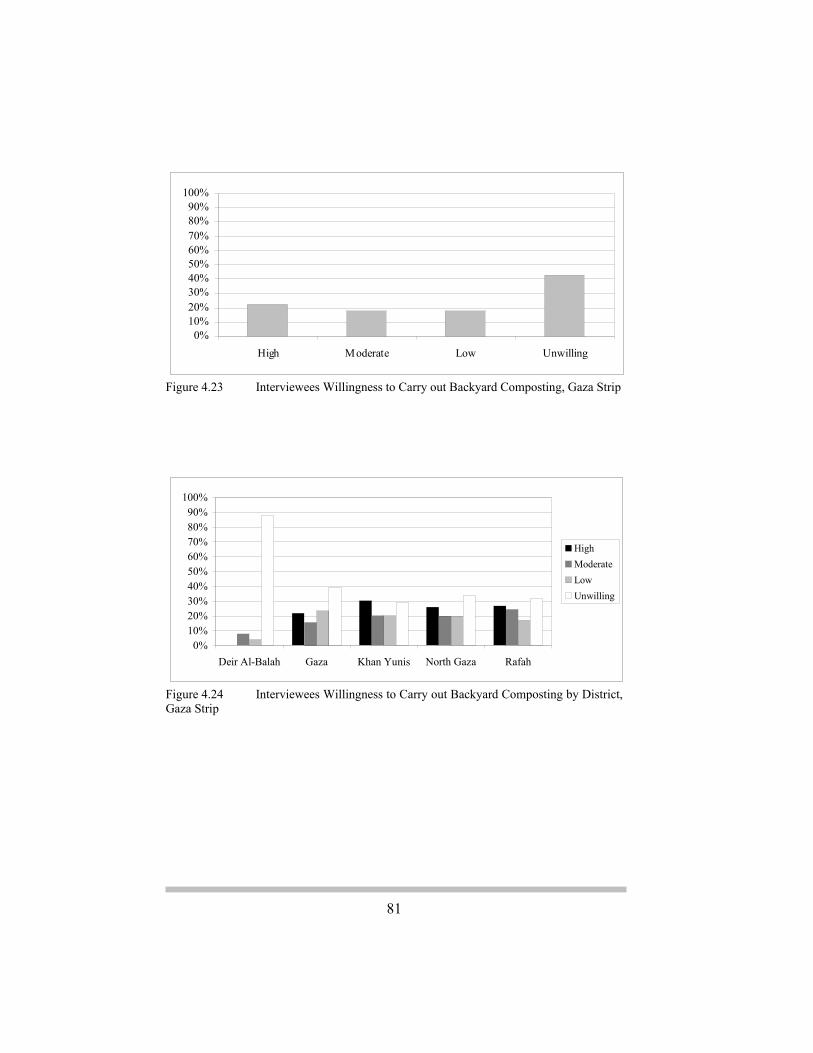
81
0%10%20%30%40%50%60%70%80%90%
100%
High Moderate Low Unwilling
Figure 4.23 Interviewees Willingness to Carry out Backyard Composting, Gaza Strip
0%10%20%30%40%50%60%70%80%90%
100%
Deir Al-Balah Gaza Khan Yunis North Gaza Rafah
HighModerateLowUnwilling
Figure 4.24 Interviewees Willingness to Carry out Backyard Composting by District, Gaza Strip

82
0%10%20%30%40%50%60%70%80%90%
100%
High Moderate Low Unwilling
Figure 4.25 Interviewees Willingness to Utilize Compost, Gaza Strip
0%
10%
20%
30%
40%
50%
60%
70%
80%
90%
100%
Deir Al-Balah Gaza Khan Yunis North Gaza Rafah
HighModerateLowUnwilling
Figure 4.26 Interviewees Willingness to Utilize Compost by District, Gaza Strip 4.3.1.2 Wastewater Management The implementation of decentralized wastewater management systems requires high participation from the local communities particularly when small scale wastewater treatment plants are installed on site at household levels. The public willingness to participate in the construction of small scale wastewater treatment plants was identified for the West Bank and Gaza Strip. In the West Bank, around 58% of the interviewees showed high and moderate willingness to participate in this process (see Figure 4.27). This percentage differs from one district to another as shown in Figure 4.28.
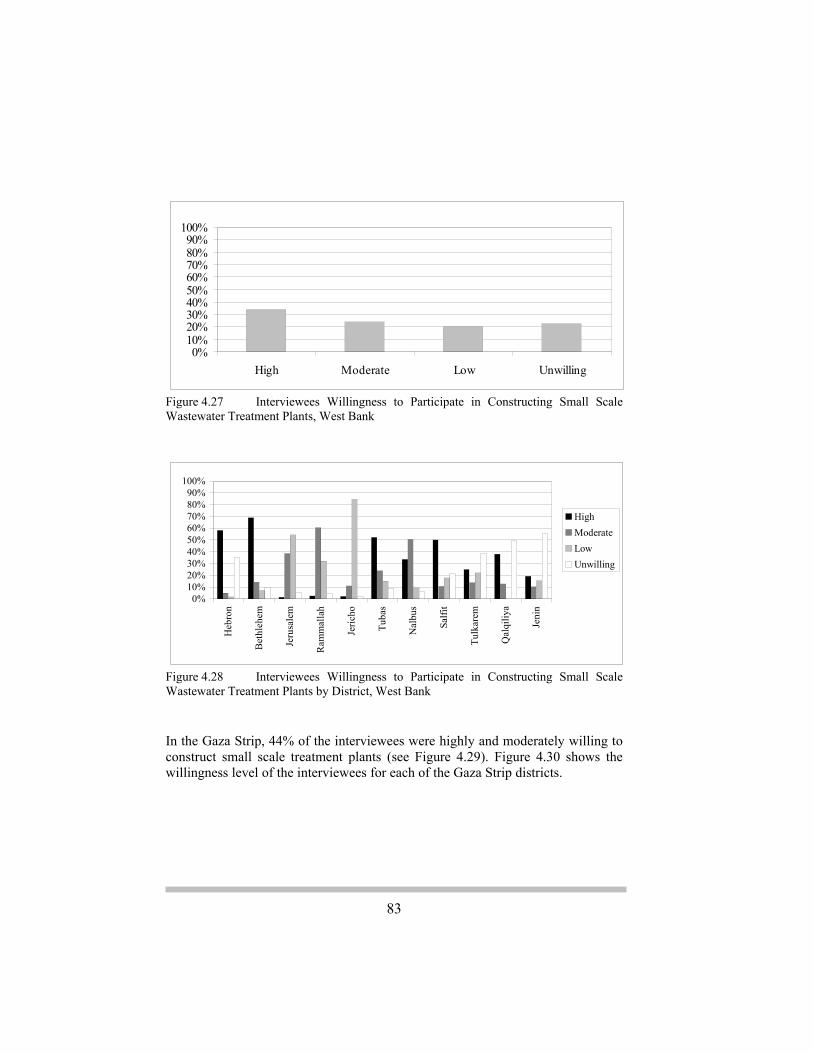
83
0%10%20%30%40%50%60%70%80%90%
100%
High Moderate Low Unwilling
Figure 4.27 Interviewees Willingness to Participate in Constructing Small Scale Wastewater Treatment Plants, West Bank
0%10%20%30%40%50%60%70%80%90%
100%
Heb
ron
Bet
hleh
em
Jeru
sale
m
Ram
mal
lah
Jeric
ho
Tuba
s
Nal
bus
Salfi
t
Tulk
arem
Qal
qiliy
a
Jeni
n
HighModerateLowUnwilling
Figure 4.28 Interviewees Willingness to Participate in Constructing Small Scale Wastewater Treatment Plants by District, West Bank In the Gaza Strip, 44% of the interviewees were highly and moderately willing to construct small scale treatment plants (see Figure 4.29). Figure 4.30 shows the willingness level of the interviewees for each of the Gaza Strip districts.
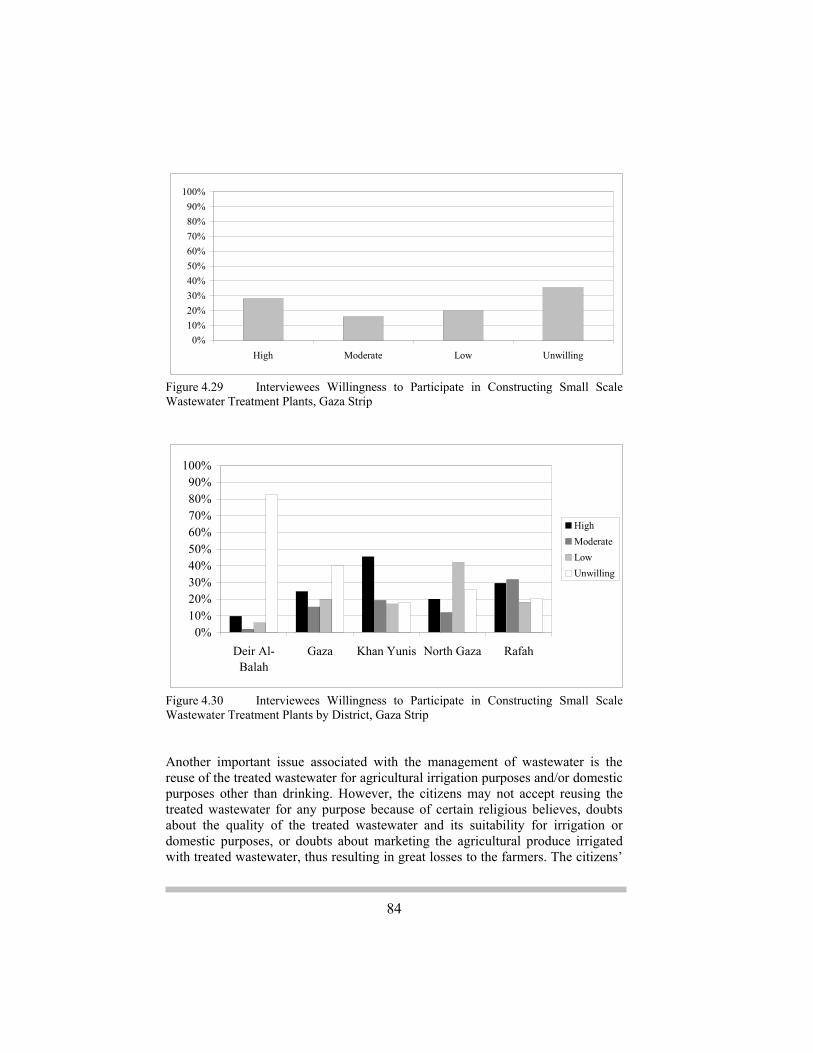
84
0%10%20%30%40%50%60%70%80%90%
100%
High Moderate Low Unwilling
Figure 4.29 Interviewees Willingness to Participate in Constructing Small Scale Wastewater Treatment Plants, Gaza Strip
0%10%20%30%40%50%60%70%80%90%
100%
Deir Al-Balah
Gaza Khan Yunis North Gaza Rafah
HighModerateLowUnwilling
Figure 4.30 Interviewees Willingness to Participate in Constructing Small Scale Wastewater Treatment Plants by District, Gaza Strip Another important issue associated with the management of wastewater is the reuse of the treated wastewater for agricultural irrigation purposes and/or domestic purposes other than drinking. However, the citizens may not accept reusing the treated wastewater for any purpose because of certain religious believes, doubts about the quality of the treated wastewater and its suitability for irrigation or domestic purposes, or doubts about marketing the agricultural produce irrigated with treated wastewater, thus resulting in great losses to the farmers. The citizens’

85
willingness to reuse treated wastewater for one of the two purposes was identified. In the West Bank, only 10% of the interviewees were unwilling to reuse treated wastewater for agricultural irrigation (see Figure 4.31). The remaining interviewees expressed their willingness to reuse treated wastewater for irrigation purposes but at different levels. Around 52%, 23% and 15% of them were highly, moderately and slightly willing to do so, respectively. On the other hand, 55% of the interviewees were unwilling to reuse treated wastewater for domestic purposes, whereas only 25% of them were highly and moderately willing to do so (see Figure 4.32). The relevant data was also analyzed for each of the West Bank districts as shown in Figure 4.33 and Figure 4.34.
0%10%20%30%40%50%60%70%80%90%
100%
High Moderate Low Unwilling
Figure 4.31 Interviewees Willingness to Use Treated Wastewater for Agricultural Irrigation Purposes, West Bank
0%10%20%30%40%50%60%70%80%90%
100%
High Moderate Low Unwilling
Figure 4.32 Interviewees Willingness to Use Treated Wastewater for Domestic Purposes, West Bank

86
0%10%20%30%40%50%60%70%80%90%
100%
Heb
ron
Bet
hleh
em
Jeru
sale
m
Ram
alla
h
Jeric
ho
Tuba
s
Nab
lus
Salfi
t
Tulk
arm
Qal
qiliy
a
Jeni
n
HighModerateLowUnwilling
Figure 4.33 Interviewees Willingness to Use Treated Wastewater for Agricultural Irrigation Purposes by District, West Bank
0%10%20%30%40%50%60%70%80%90%
100%
Heb
ron
Bet
hleh
em
Jeru
sale
m
Ram
alla
h
Jeric
ho
Tuba
s
Nab
lus
Salfi
t
Tulk
arm
Qal
qiliy
a
Jeni
n
HighModerateLowUnwilling
Figure 4.34 Interviewees Willingness to Use Treated Wastewater for Domestic Purposes by District, West Bank In the Gaza Strip, only 6% of the interviewees were unwilling to reuse treated wastewater for agricultural irrigation (see Figure 4.35). The majority of them expressed their willingness to do so but at different levels. Around 61%, 24% and 9% of them were highly, moderately and slightly willing to do so, respectively. On the other hand, 50% of the interviewees were unwilling to reuse treated wastewater for domestic purposes, whereas only 40% of them were highly and moderately willing to do so (see Figure 4.36). The relevant data was also analyzed for each of the Gaza Strip districts as shown in Figure 4.37 and Figure 4.38. It should be noted that the awareness level among the citizens who will

87
benefit from a wastewater management project must be raised before the implementation process in order to alleviate their worries pertinent to the reuse of treated wastewater.
0%10%20%30%40%50%60%70%80%90%
100%
High Moderate Low Unwilling
Figure 4.35 Interviewees Willingness to Use Treated Wastewater for Agricultural Irrigation Purposes, Gaza Strip
0%10%20%30%40%50%60%70%80%90%
100%
High Moderate Low Unwilling
Figure 4.36 Interviewees Willingness to Use Treated Wastewater for Domestic Purposes, Gaza Strip

88
0%10%20%30%40%50%60%70%80%90%
100%
Deir Al-Balah Gaza Khan Yunis North Gaza Rafah
HighModerateLowUnwilling
Figure 4.37 Interviewees Willingness to Use Treated Wastewater for Agricultural Irrigation Purposes by District, Gaza Strip
0%10%20%30%40%50%60%70%80%90%
100%
Deir Al-Balah Gaza Khan Yunis North Gaza Rafah
HighModerateLowUnwilling
Figure 4.38 Interviewees Willingness to Use Treated Wastewater for Domestic Purposes by District, Gaza Strip
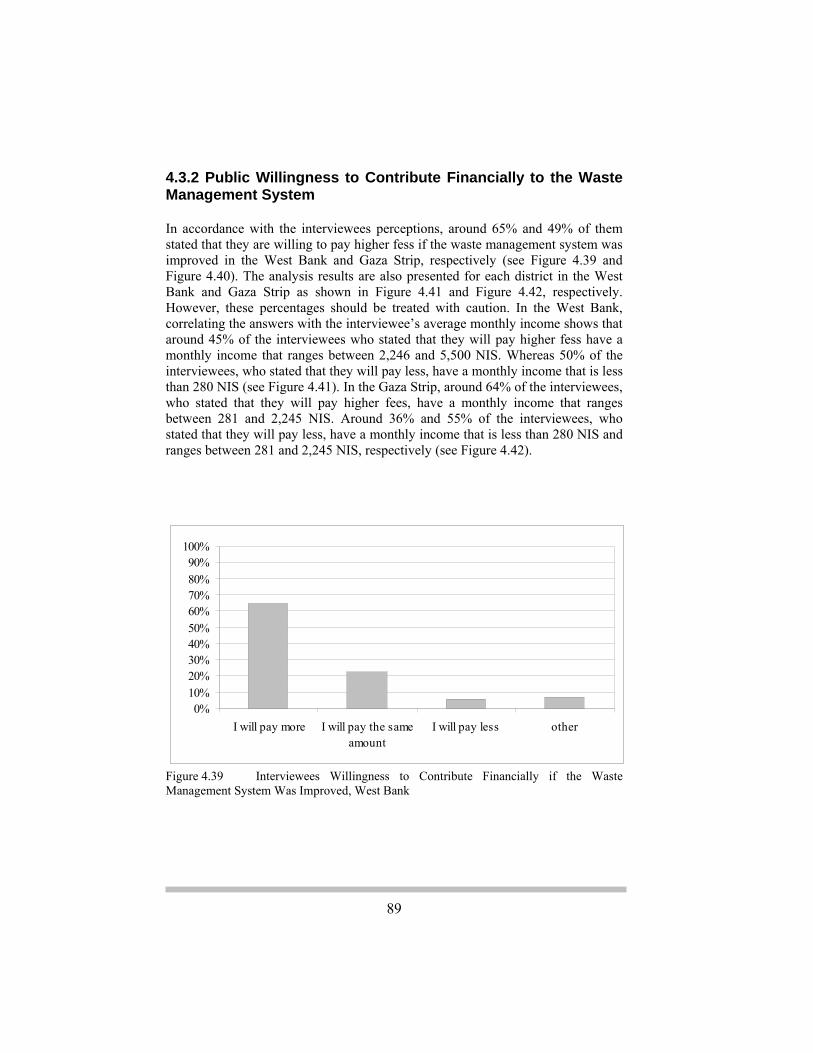
89
4.3.2 Public Willingness to Contribute Financially to the Waste Management System In accordance with the interviewees perceptions, around 65% and 49% of them stated that they are willing to pay higher fess if the waste management system was improved in the West Bank and Gaza Strip, respectively (see Figure 4.39 and Figure 4.40). The analysis results are also presented for each district in the West Bank and Gaza Strip as shown in Figure 4.41 and Figure 4.42, respectively. However, these percentages should be treated with caution. In the West Bank, correlating the answers with the interviewee’s average monthly income shows that around 45% of the interviewees who stated that they will pay higher fess have a monthly income that ranges between 2,246 and 5,500 NIS. Whereas 50% of the interviewees, who stated that they will pay less, have a monthly income that is less than 280 NIS (see Figure 4.41). In the Gaza Strip, around 64% of the interviewees, who stated that they will pay higher fees, have a monthly income that ranges between 281 and 2,245 NIS. Around 36% and 55% of the interviewees, who stated that they will pay less, have a monthly income that is less than 280 NIS and ranges between 281 and 2,245 NIS, respectively (see Figure 4.42).
0%10%20%30%40%50%60%70%80%90%
100%
I will pay more I will pay the sameamount
I will pay less other
Figure 4.39 Interviewees Willingness to Contribute Financially if the Waste Management System Was Improved, West Bank

90
0%10%20%30%40%50%60%70%80%90%
100%
I will pay more I will pay the sameamount
I will pay less other
Figure 4.40 Interviewees Willingness to Contribute Financially if the Waste Management System Was Improved, Gaza Strip
0%10%20%30%40%50%60%70%80%90%
100%
Heb
ron
Bet
hleh
em
Jeru
sale
m
Ram
alla
h
Jeric
ho
Tuba
s
Nab
lus
Salfi
t
Tulk
arm
Qal
qiliy
a
Jeni
n
I will pay moreI will pay the same amountI will pay lessother
Figure 4.41 Interviewees Willingness to Contribute Financially if the Waste Management System Was Improved by District, West Bank

91
0%10%20%30%40%50%60%70%80%90%
100%
Deir Al-Balah
Gaza KhanYunis
NorthGaza
Rafah
I will pay moreI will pay the same amountI will pay lessother
Figure 4.42 Interviewees Willingness to Contribute Financially if the Waste Management System Was Improved by District, Gaza Strip
0%10%20%30%40%50%60%70%80%90%
100%
0-280 281-2,245 2,246-5,500
5,501-9,165
9,166 andover
Average Monthly Income (NIS)
I will pay moreI will pay the same amountI will pay lessother
Figure 4.43 Interviewees Willingness to Contribute Financially if the Waste Management System Was Improved by Average Monthly Income, West Bank
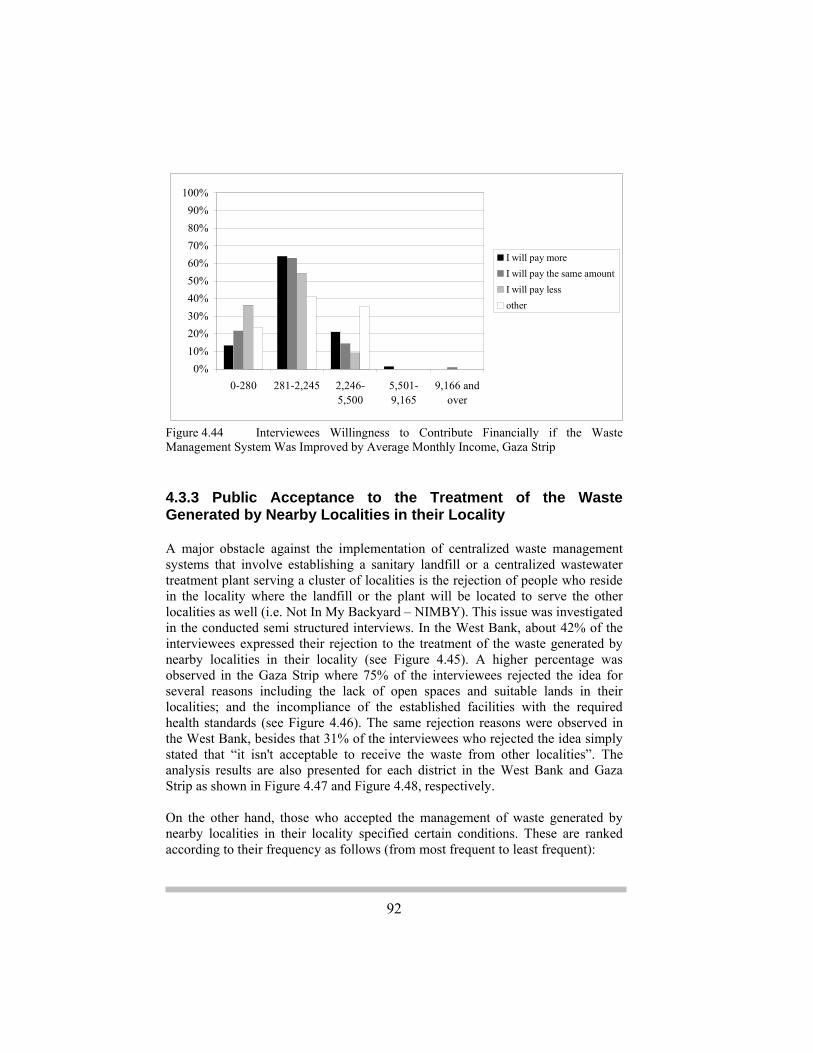
92
0%10%20%30%40%50%60%70%80%90%
100%
0-280 281-2,245 2,246-5,500
5,501-9,165
9,166 andover
I will pay moreI will pay the same amountI will pay lessother
Figure 4.44 Interviewees Willingness to Contribute Financially if the Waste Management System Was Improved by Average Monthly Income, Gaza Strip 4.3.3 Public Acceptance to the Treatment of the Waste Generated by Nearby Localities in their Locality A major obstacle against the implementation of centralized waste management systems that involve establishing a sanitary landfill or a centralized wastewater treatment plant serving a cluster of localities is the rejection of people who reside in the locality where the landfill or the plant will be located to serve the other localities as well (i.e. Not In My Backyard – NIMBY). This issue was investigated in the conducted semi structured interviews. In the West Bank, about 42% of the interviewees expressed their rejection to the treatment of the waste generated by nearby localities in their locality (see Figure 4.45). A higher percentage was observed in the Gaza Strip where 75% of the interviewees rejected the idea for several reasons including the lack of open spaces and suitable lands in their localities; and the incompliance of the established facilities with the required health standards (see Figure 4.46). The same rejection reasons were observed in the West Bank, besides that 31% of the interviewees who rejected the idea simply stated that “it isn't acceptable to receive the waste from other localities”. The analysis results are also presented for each district in the West Bank and Gaza Strip as shown in Figure 4.47 and Figure 4.48, respectively. On the other hand, those who accepted the management of waste generated by nearby localities in their locality specified certain conditions. These are ranked according to their frequency as follows (from most frequent to least frequent):
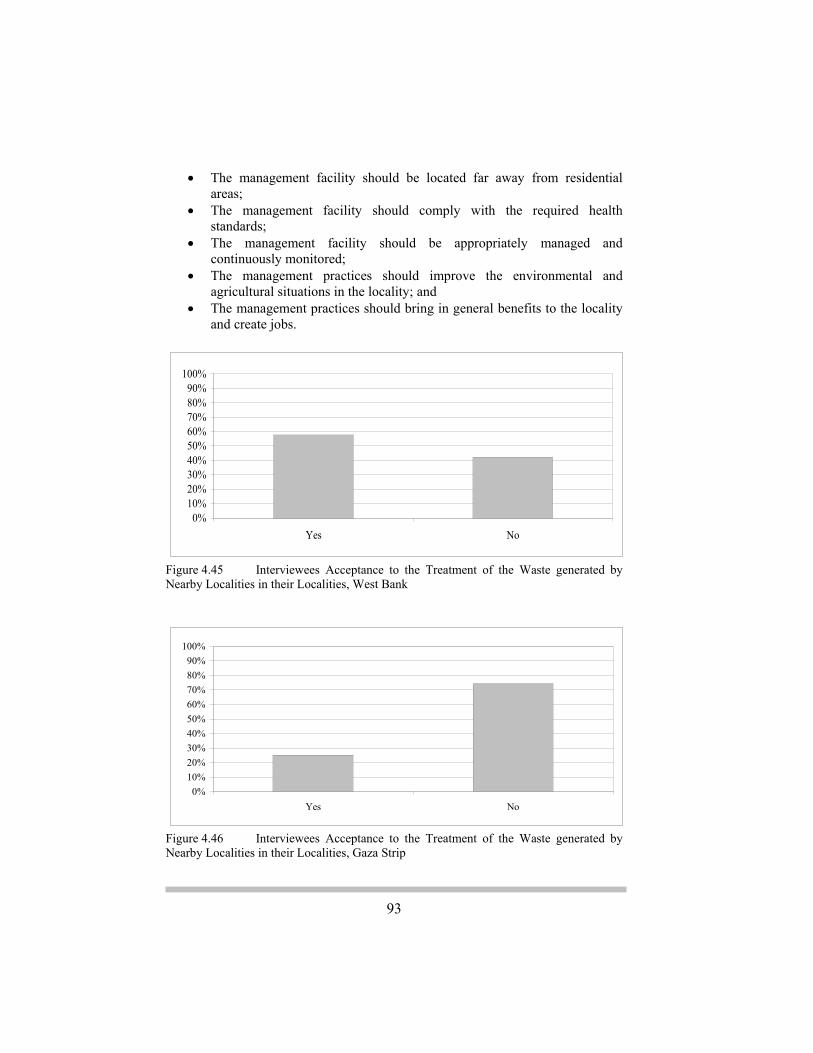
93
• The management facility should be located far away from residential areas;
• The management facility should comply with the required health standards;
• The management facility should be appropriately managed and continuously monitored;
• The management practices should improve the environmental and agricultural situations in the locality; and
• The management practices should bring in general benefits to the locality and create jobs.
0%10%20%30%40%50%60%70%80%90%
100%
Yes No
Figure 4.45 Interviewees Acceptance to the Treatment of the Waste generated by Nearby Localities in their Localities, West Bank
0%10%20%30%40%50%60%70%80%90%
100%
Yes No
Figure 4.46 Interviewees Acceptance to the Treatment of the Waste generated by Nearby Localities in their Localities, Gaza Strip

94
0%10%20%30%40%50%60%70%80%90%
100%
Heb
ron
Bet
hleh
em
Jeru
sale
m
Ram
alla
h
Jeric
ho
Tuba
s
Nab
lus
Salfi
t
Tulk
arm
Qal
qiliy
a
Jeni
n
YesNo
Figure 4.47 Interviewees Acceptance to the Treatment of the Waste generated by Nearby Localities in their Localities by District, West Bank
0%10%20%30%40%50%60%70%80%90%
100%
Deir Al-Balah Gaza Khan Yunis North Gaza Rafah
YesNo
Figure 4.48 Interviewees Acceptance to the Treatment of the Waste generated by Nearby Localities in their Localities by District, Gaza Strip

95
4.4 Chapter Summary Entering into dialogue with a random sample of local citizens has revealed their perceptions about the existing waste management system. The majority of the interviewed citizens is not satisfied with the existing level of waste management service provided by the municipal and rural councils and is aware that it poses serious health and environmental problems. They indicated that the current waste management practices have negatively impacted the natural resources and the health of their families, and distorted the visual environment as well. However, the awareness level among local citizens should be raised in this respect as the majority of the interviewees were most concerned about the loss of aesthetic value of the surrounding environment. Furthermore, the interviewed citizens expressed their concern about the alternative options for managing solid waste and wastewater. In their selection, they focused on the options that create job opportunities, generate new products and minimize the negative impacts. Concerning the citizens’ willingness to pay and/or participate in the waste management process, the following was revealed:
• A high percentage of the interviewees showed high and moderate willingness to separate the generated solid waste at source.
• Almost half of the interviewees were highly and moderately willing to carry out backyard composting but a higher percentage of them showed high and moderate willingness to utilize compost in their gardens without being generated in their backyards.
• Around 58% and 44% of the interviewees showed high and moderate willingness to participate in the construction of small scale wastewater treatment plants in the West Bank and Gaza Strip, respectively.
• In the West Bank, 10% and 55% of the interviewees were unwilling to reuse treated wastewater for agricultural irrigation and domestic purposes, respectively.
• In the Gaza Strip, 6% and 50% of the interviewees were unwilling to reuse treated wastewater for agricultural irrigation and domestic purposes, respectively.
• Around 65% and 49% of the interviewees were willing to pay higher fess if the waste management system was improved in the West Bank and Gaza Strip, respectively.
• In the West Bank, about 42% of the interviewees expressed their rejection to the treatment of the waste generated by nearby localities in their locality. A higher percentage of 75% was observed in the Gaza Strip.

96

97
CHAPTER 55 Evaluation of Options
ractical combinations of various environmentally sound systems for the collection, transport, treatment and reuse of domestic solid waste and
wastewater have been developed for the West Bank and Gaza Strip. The considered systems are adopted worldwide and part of them is recommended in the Palestinian Environmental Strategy and the National Environmental Action Plan. These systems diverge from the current waste management systems that do not provide the Palestinian citizens with the required level of sanitation services and do not protect and maintain the quality of the environment and natural resources as well. In order to verify this divergence, the developed and current waste management systems will be thoroughly analyzed and evaluated using the Cost Benefit Analysis and other qualitative evaluation tools. In the analysis, the economic, social and environmental costs and benefits will be identified, quantified and expressed in monetary terms when possible. Moreover, the analysis will support the decision making process pertinent to the developed waste management systems through the generated information on the nature, magnitude and significance of the impacts stemming from these systems. This is essential in order to ensure efficiency in resource allocation and maximum gain in social welfare. 5.1 Evaluation of Options for Solid Waste Management
Solid Waste management options range from the management practices that are currently applied by the municipal and rural councils in the West Bank and Gaza Strip, to the introduction of several comprehensive schemes comprising practical combinations of solid waste collection, transport and processing systems. On one hand, the existing practices for managing domestic solid waste are limited to the collection of the generated solid waste at a coverage rate of 67% and 95% of the total population residing in the West Bank and Gaza Strip, respectively; and the dumping of collected waste in uncontrolled dumping sites where open burning is mainly practiced as the case in the West Bank or in sanitary landfills as the case
P
98
in the Gaza Strip. The uncollected solid waste is dumped and burned on roadsides and vacant lands. On the other hand, practical combinations of various options for solid waste collection, transport and processing have been presented in seven scenarios. The considered options for solid waste collection are the curbside/alley and drop off collection methods. When the former collection method is applied, solid waste is transported to the transfer station or processing facility by collection vehicles administered by the municipalities and rural councils, whereas when the drop off collection method is applied, solid waste is transported by the citizens’ private cars. Transfer stations can be established in spite of the considered collection method with the difference in the required number of stations and their location from the served locality. When using the drop off collection method, transfer stations should be established in each locality at a distance not further than 3-5 km from the locality’s central market in order to minimize the cost incurred by citizens. In this case, the stations can be either non-compaction small or medium sized stations or compaction large stations depending on the size of the locality. For the curbside/alley collection method a transfer station should be established if the processing facility is at a distance more than 20 kilometers from the locality. As regards to solid waste processing, several methods are considered including the discharge of solid waste into sanitary landfills, composting of organic matter, incineration of waste and recycling of glass, paper and aluminum. The established solid waste management scenarios are: the drop off-buy back scenario; the bulk waste drop off and landfill scenario; the bulk waste drop off and treatment scenario; the separation-curbside and waste treatment scenario; the bulk waste-curbside and landfill scenario; the bulk waste-curbside and waste treatment scenario; and the bulk waste-curbside and incineration, composting and recycling scenario. The following provides a brief description of each scenario.
• Drop off-Buy Back Scenario
In this scenario, municipal solid waste is separated at source in separate bags with indicative colors (see Figure 5.1). The separated solid waste is transported in private cars to the transfer/drop off buy-back stations. Non recyclable materials are sent to the landfill sites, organic material is sent to the composting facilities and recyclables are sent to the recycling facility or the buy-back center. Awareness campaigns and law enforcement are two tools that should be utilized when implementing this scenario. Furthermore, the population should be provided with incentives to separate waste at source where a significantly lower municipal waste fee should be imposed.

99
Figure 5.1 Schematic Presentation of Processes in the Drop off-Buy Back Scenario
Figure 5.2 Schematic Presentation of Processes in the Bulk Waste Drop off and Landfill Scenario
• Bulk Waste Drop off and Landfill Scenario In this scenario, the generated bulk waste is transported by citizens to transfer stations from which it is then transported by municipal refuse vehicles to the landfill sites (see Figure 5.2). The landfills should be designed with a capacity sufficient to receive the total generated volume of solid waste for a period of 20 years. The implementation of this scenario should be accompanied by awareness campaigns, law enforcement and incentives to motivate local people to transport the waste to the stations.
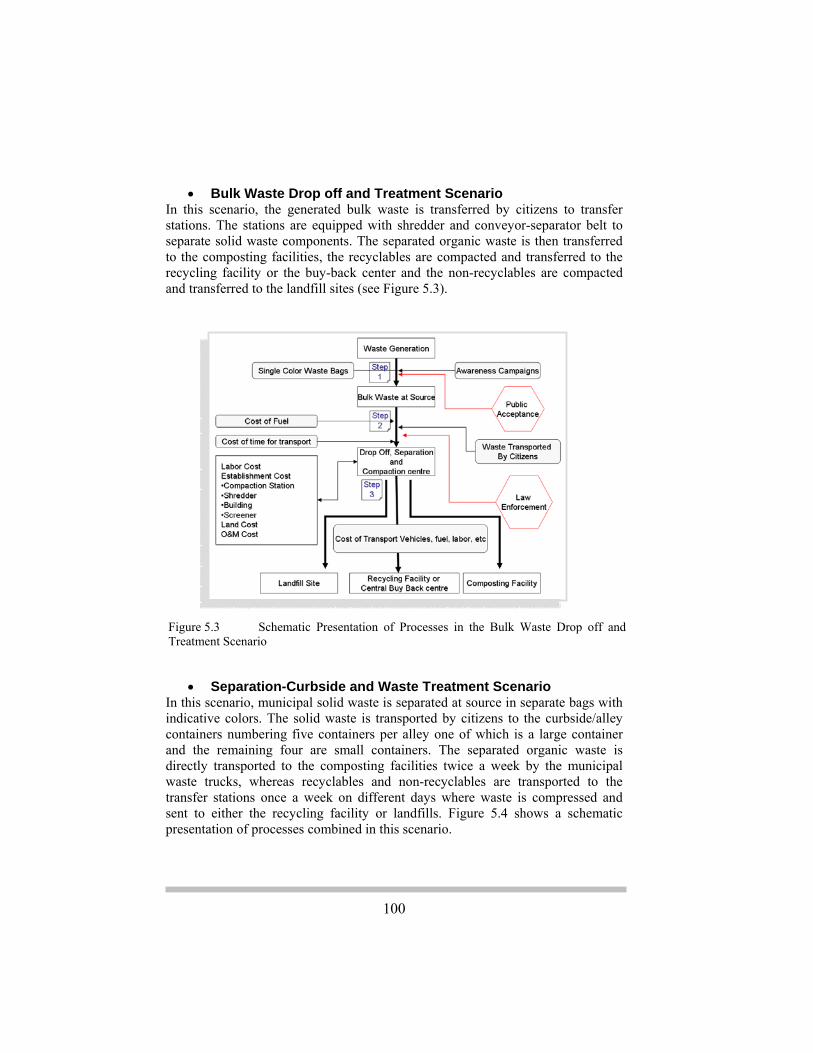
100
• Bulk Waste Drop off and Treatment Scenario
In this scenario, the generated bulk waste is transferred by citizens to transfer stations. The stations are equipped with shredder and conveyor-separator belt to separate solid waste components. The separated organic waste is then transferred to the composting facilities, the recyclables are compacted and transferred to the recycling facility or the buy-back center and the non-recyclables are compacted and transferred to the landfill sites (see Figure 5.3).
• Separation-Curbside and Waste Treatment Scenario
In this scenario, municipal solid waste is separated at source in separate bags with indicative colors. The solid waste is transported by citizens to the curbside/alley containers numbering five containers per alley one of which is a large container and the remaining four are small containers. The separated organic waste is directly transported to the composting facilities twice a week by the municipal waste trucks, whereas recyclables and non-recyclables are transported to the transfer stations once a week on different days where waste is compressed and sent to either the recycling facility or landfills. Figure 5.4 shows a schematic presentation of processes combined in this scenario.
Figure 5.3 Schematic Presentation of Processes in the Bulk Waste Drop off and Treatment Scenario
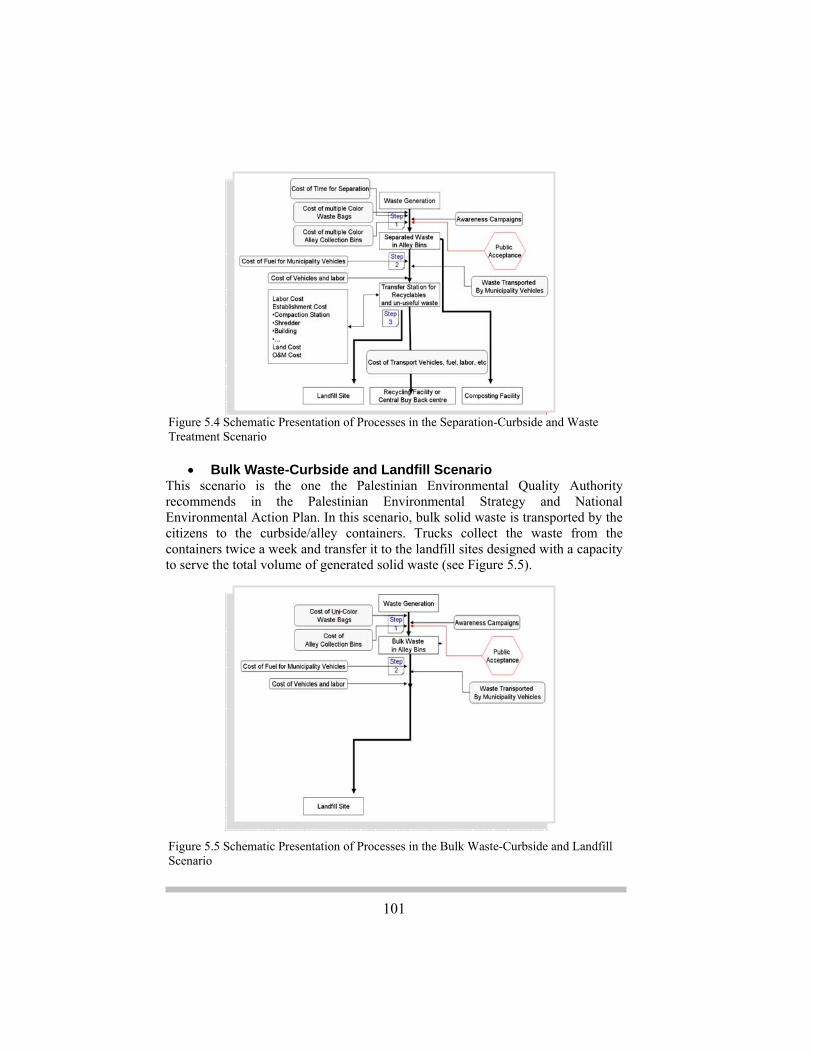
101
Figure 5.4 Schematic Presentation of Processes in the Separation-Curbside and Waste Treatment Scenario
Figure 5.5 Schematic Presentation of Processes in the Bulk Waste-Curbside and Landfill Scenario
• Bulk Waste-Curbside and Landfill Scenario
This scenario is the one the Palestinian Environmental Quality Authority recommends in the Palestinian Environmental Strategy and National Environmental Action Plan. In this scenario, bulk solid waste is transported by the citizens to the curbside/alley containers. Trucks collect the waste from the containers twice a week and transfer it to the landfill sites designed with a capacity to serve the total volume of generated solid waste (see Figure 5.5).

102
• Bulk Waste-Curbside and Waste Treatment Scenario In this scenario, bulk waste is transported by the citizens to the curbside/alley containers. The waste is transferred by the municipal trucks to the transfer stations. The transfer stations are equipped with shredder, screener and conveyor-separator belt to separate components. The separated organic waste is then transferred to the composting facilities, the recyclables are compacted and transferred to the recycling facility or the buy-back center and the non-recyclables are compacted and transferred to the landfill sites. Figure 5.6 illustrates the processes combined in this scenario.
• Bulk Waste-Curbside and Incineration, Composting and
Recycling Scenario In this scenario, bulk solid waste is transported by the citizens to the curbside/alley containers. Trucks collect the waste from the containers and transfer it to stations twice a week. These are either small/medium sized non-compaction transfer stations or large compaction stations depending on the volume of generated waste by the community. This scenario is similar to the previous scenario with the exception that incineration is added as a waste processing method along with composting, recycling and landfilling (see Figure 5.7). The reason for adding the incineration process is to reduce the volume of waste land filled by 20% - 25%. This is in particular important in the Gaza Strip where landfills are devouring significant areas of scarce open spaces. With incineration, only Refuse Derived Fuel (RDF) will be incinerated. RDF is comprised mainly of organic, wet-
Figure 5.6 Schematic Presentation of Processes in the Bulk Waste-Curbside and Waste Treatment Scenario

103
sandy/gritty- paper like material and plastics. The volume of waste incinerated would range between 50,000-120,000 tons/yr. This scenario wasn’t considered for the West Bank due to the incineration option that would entail very high cost to dry the wet organic waste, representing around 70% of the total generated waste, and convert it to RDF. Furthermore, it is more vital to treat the organic waste and convert it to compost that would be used to check further land degradation and desertification in the West Bank, particularly in the eastern slopes.
A comprehensive assessment will be presented which includes the economic, social and environmental costs and benefits associated with the current solid waste management system in the West Bank and Gaza Strip and the established scenarios.
Figure 5.7 Schematic Presentation of Processes in the Bulk Waste-Curbside and Incineration, Composting, and Recycling Scenario

104
5.1.1 Cost Benefit Analysis of the Current Solid Waste Management System 5.1.1.1 Economic Valuation
The full cost accounting method was used to valuate the direct economic costs associated with the existing municipal solid waste management system including: the administrative cost; the running cost of dumping or landfill sites (i.e. purchase or rent cost of land); the cost of employment (i.e. salaries, wages, etc); the cost of fuel; the cost of maintenance; the cost of insurance; and the cost of solid waste trucks and bins. For the West Bank, it was assumed that the current random dumping sites and the open burning practices would preserve but the collection system would evolve to increase the percentage of population served from the current 67% to 99% coverage. Base data relevant to the aforementioned costs were acquired from the municipalities and rural councils using questionnaires and through semi-structured interviews. Data was compared and assessed for validity. Data outliers were removed from further analysis and mean costs (i.e. per capita administrative costs) were derived. According to the economic valuation results, the total economic costs of the current solid waste management system in the West Bank districts were estimated at 19 million USD for year 2005. The breakdown of costs for each cost item is outlined in Table 5.1.
The projected costs for the next 20 years were estimated at a net present value of approximately 315 million USD based on the following assumptions: (1) the current practices would not fundamentally change over the course of the next 20 years; (2) the number of employees working in the solid waste management sector would increase normally at a rate equivalent to the increase in population; (3) the weighted average of the annual percentage increase in the miscellaneous administrative costs is 2%; (4) the land renting cost would increase at an annual
Table 5.1 Direct Economic Costs Associated with the Current Solid Waste Management System in the West Bank for Year 2005
Cost Items Associated with the Current Solid Waste Management
System Cost Administration $1,515,695 Use of Dumping Sites $515,790 Employment $6,327,328 Fuel Consumption $1,006,575 Maintenance $1,622,859 Insurance $465,249 Refuse Trucks $4,773,167 Refuse Bins $2,748,572 Total cost $18,975,235

105
increment of 2%; (5) the dumping sites, where open burning of solid waste is practiced, would have an infinite lifetime; (6) the annual percentage increase in the insurance value is 2%; and (7) the inflation rate is 3%. For the Gaza Strip, the valuation of the economic costs associated with the current management of solid waste followed the same procedure for the West Bank. The total projected costs for the next 20 years were estimated at 186 million USD. 5.1.1.2 Social Valuation In general, social impacts associated with the current waste management systems are represented by the spread of diseases arising from the contamination of food, water and air due to the improper waste management practices. These diseases include respiratory diseases, cancer, hepatitis, diarrhea, amoeba and skin diseases, among others.
The open burning of solid waste in the existing dumping sites may contribute to the occurrence of respiratory diseases and cancer among residents, whereas the discharge of untreated wastewater into open areas may contribute to the occurrence of the other aforementioned diseases. The cause and effect relation between the incident of such diseases and the improper collection and disposal of both solid waste and wastewater was validated as follows:
• Localities were classified into two classes, namely areas proximate to pollution sources and areas located far from pollution sources. The solid waste-related pollution sources are the open dumping sites, whereas the wastewater-related pollution sources are the non-functional wastewater treatment plants and the untreated wastewater discharge points.
• The percentage incident of the above-mentioned diseases in the two classified areas was calculated based on the data obtained from the statistical health records of the Ministry of Health as well as the statistical books of the local health centers. An increase in the incident of diseases from areas located far from pollution sources to areas proximate to pollution sources was noticed.
• A comparison between the two areas in terms of factors other than the proximity to pollution sources was conducted in order to investigate whether there is a significant difference between them with respect to selected factors including: water network connection; sewer system connection; level of income; unemployment level; and degree of urbanization. This was achieved by carrying out a t-test for the equality of means of each factor between the two areas. The tests revealed that there was no significant difference at the 95% confidence interval between the two areas in terms of the abovementioned factors, thus verifying that the classification of localities in relation to their proximity to pollution sources is the determining factor for the observed increase in the incident of diseases.

106
The cost of treatment and the cost of lost working days were the two costs accounted for when valuing the costs associated with the increase in incidents of diseases from areas located far from pollution sources to areas proximate to pollution sources. The valuation was preceded by the ANalysis Of VAriance (ANOVA) to test whether the means of the incident level per disease are significantly different between the two areas. The analysis results revealed that the incidents of respiratory diseases, skin diseases, hepatitis, diarrhea, cancer and amoeba were significantly different between the two areas. It is worth indicating that the valuation of the costs of diseases was not conducted for the Gaza Strip and the districts of Jerusalem, Qalqiliya and Jericho as insufficient health data for such areas was compiled. Accordingly, the calculated costs of diseases arising from the improper management of solid waste in the remaining districts of the West Bank were found to be equal to approximately 21 million USD for year 2003 (see Table 5.2). The projected cost for 20 years was equal to approximately 909 million USD based on the assumptions that the current rates of diseases caused by pollution will remain constant, the population growth rate is 3.5%, the increase of price of medicine is 3%, and the increase of per capita income is 3%. It should be noted that the costs of diseases will be warded off when proper and effective solid waste collection, processing and disposal systems will be implemented. Table 5.2 Cost of Diseases Associated with the Existing Improper Solid Waste Management System in the West Bank for the Year 2003
District Cost of Respiratory
Diseases Cost of Cancer Total Cost Bethlehem $1,055,054 $281,325 $1,336,381 Hebron $2,520,807 $3,127,741 $5,648,549 Jenin $3,053,892 $908,108 $3,962,000 Nablus $478,876 $4,084,551 $4,563,428 Ramallah $2,448,766 $572,861 $3,021,628 Salfit $739,497 $462,746 $1,202,245 Tubas $134,443 $109,681 $244,126 Tulkarm $1,182,757 $273,603 $1,456,361 Total $11,618,274 $9,842,022 $21,460,298
5.1.1.3 Environmental Valuation The improper management of solid waste and wastewater has highly contributed in the occurrence of a series of environmental problems including the deterioration of groundwater quality; air pollution; deterioration of nature and biodiversity; and landscape and aesthetic distortion of the visual environment. This environmental disruption was assessed by applying quantitative and semi-quantitative valuation techniques that attempted to attach monetary values and semi-quantitative values

107
(i.e. ++++ highly positive impact, ---- highly negative impact) to the impacts, respectively. Sections 5.1.1.3.1 and 5.1.1.3.2 provide a description of the valuation procedures and results for the combined impacts of solid waste and wastewater management practices on landscapes, and the recreational and aesthetic values, respectively. The impacts of the transport and open burning of solid waste on air pollution were valuated as described in section 5.1.1.3.3, whereas the impacts of non-sanitary solid waste disposal on the contamination of groundwater were valuated along with those of wastewater disposal as described in section 5.2.1.3.1. 5.1.1.3.1 Landscape Degradation
Landscapes have an ability to support wildlife that may be affected by changes in landscape. Environmental patterns can strongly influence ecological processes. The habitats, in which organisms live, are spatially structured at a number of scales and these patterns interact with organism perception and behavior to drive the higher level processes of population dynamics and community structure. Anthropogenic activities such as the establishment of open dumping sites and the pollution of water streams as well as land patches can disrupt the structural integrity of landscapes and impede ecological flows (i.e. movement of organisms) across the landscape. A disruption in landscape’s patterns may therefore compromise its function by interfering with critical ecological processes necessary for population persistence, maintenance of biodiversity and ecosystem health. The connection between what can be mapped and measured and what is ecologically relevant is however not always clear (McGarigal et al., 2002). In order to investigate these possible impacts on landscape, remote sensing and Geographic Information System (GIS) techniques were used as described in the following steps:
• The land use/land cover (LULC) types or classes in the study area were identified using very high resolution (4 * 4 meters, equivalent to a 1:25,000 scale map) satellite data from the IKONOS images. The identified classes included agricultural areas, natural areas, Palestinian and Israeli built-up areas, road network, and agricultural plastic houses.
• The percentage vegetation cover in the identified natural areas was quantified using LANDSAT TM satellite images.
• The percentage vegetation cover was associated with the dominant natural vegetation classes (i.e. pine forests, open woodlands, sparse annual grasses, etc) in the study area.
• An accurate LULC map was produced for the study area using the results of the IKONOS and LANDSAT TM images’ analysis carried out in the previous steps. The map was compared to a second LULC map on which the open solid waste dumping sites, wastewater streams and landscape

108
patches polluted with the open discharge of untreated wastewater are added, in order to give data about the status of the landscape under the two scenarios. It was assumed that pollution either by solid waste or wastewater would render the polluted areas as non-functional for most if not all of the ecological functions.
• The two generated LULC maps were further analyzed using FRAGSTATS, a program designed to evaluate landscape fragmentation (McGarigal et al., 2002). A number of class and landscape matrices was utilized to assess the impacts of the dumping sites, wastewater streams and areas polluted with open discharge of wastewater on the landscape and the different land cover classes. These matrices include:
1) The matrix Class Area (CA), which measures the landscape composition by determining the area of a particular patch type, was used in the analysis to determine the area of the land classes lost due to the improper management of solid waste and wastewater.
2) The matrix Percentage of Landscape (PLAND), which quantifies the proportional abundance of each patch type in the landscape, was utilized to determine whether the improper management of solid waste and wastewater encroaches land classes that are originally rare in the landscape (e.g. forests).
3) The matrix Landscape Shape Index (LSI), which measures class aggregation, was used in the analysis to understand the impact of the current solid waste and wastewater practices on the aggregation of patches and the potential of having viable large animal populations.
4) The matrix Patch Cohesion Index (COHESION), which measures the physical connectedness of the corresponding patch type, was utilized to find out whether the current practices of solid waste and wastewater management adversely affect cohesiveness values. It is worth noting that the more cohesive the patches in a landscape the better are their potential to support viable populations.
The analysis results are outlined in Table 5.3 for the West Bank and Table 5.4 for the Gaza Strip. It should be noted that it was difficult to convert the results to monetary values due to the fact that it is particularly difficult to understand the impacts of landscape degradation on the whole spectrum of fauna and flora, assess their functionality and attach prices to these functionalities.

109
Table 5.3 Land Use/Cover Types Partially or Completely Losing their Ecological Functionality Due to Pollution by the Open Discharge of Solid Waste and Wastewater into the Environment in the West Bank
Class and Landscape Matrix
Land Use/Cover Type
Patch Cohesion
Index
Landscape Shape Index
Percentage of
Landscape (%)
Class Area (Hectare)
-7 -39 -3 -25,146 Shrubs -12 -2 0 0 Forests -2 45 1 0 Permanent Crops -5 52 1 0 Arable Land 0 8 0 0 Open Spaces
-23 2 0 0 Inland Water -15 31 -1 -11,249 Urban Fabric 3 8 -1 -649 Bucolic Areas
-30 -89 -3 -27,473 Heterogenic Agricultural Areas
-69 -9 0 -1,838 Plastic Houses
8 30-12Industrial Commercial Sites
-46 -27 0 -2,558 Mine, Dumps, and Construction Sites
In reference to the values of Class Area and Percentage of Landscape for the various land use/cover types in the West Bank, it is found that the heterogenic agricultural areas, shrub lands, urban areas and bucolic areas are the land use/cover types largely affected by the discharge of solid waste and wastewater into the environment. The analysis results meet the results obtained from the public health analysis that reflected a high percentage of disease incidents in the urban areas of which 11,249 hectares are influenced by the open discharge of pollutants as indicated in Table 5.3. On the other hand, the pollution of large tracts of natural and semi-natural lands (i.e. 25,146 hectares of shrub lands and 27,473 hectares of heterogenic agricultural lands) has detrimental consequences on the structural complexity and functionality of the ecosystems as well as on their ability to provide ecosystem services. Moreover, the values of the Patch Cohesion Index indicate that most of the land use/cover types have been adversely affected by the discharge of pollutants into the environment and that their corresponding ability to carry ecosystem functions and services would be expected to suffer as well.

110
Table 5.4 Land Use/Cover Types Partially or Completely Losing their Ecological Functionality Due to Pollution by the Open Discharge of Solid Waste and Wastewater into the Environment in the Gaza Strip
Class and Landscape Matrix
Land Use/Cover Type
Patch Cohesion
Index
Landscape Shape Index
Percentage of
Landscape (%)
Class Area (Hectare)
-2 -19 -2 -146 Shrubs -12 -2 0 0 Forests -2 451-269Permanent Crops -5 52 1 0 Arable Land 0 8 0 0 Open Spaces
-17 200Inland Water -15 31 -3 -752 Urban Fabric 0 0 0 0 Bucolic Areas
-17 -62 -3 -626 Heterogenic Agricultural Areas
0 0 0 0 Plastic Houses
0 0 0 0 Industrial Commercial Sites
0 0 0 0 Mine, Dumps, and Construction sites
In the Gaza Strip, the impacts of the open discharge of solid waste and wastewater on the ecosystem structural complexity and functionality are less severe than they are in the West Bank (see Table 5.4). The reasons behind that are: (1) most of the wastewater is collected in sewage networks and discharged into Wadi Gaza and the wastewater treatment plants; and (2) the wastewater collected in cesspits is largely discharged into the coastal area rather than onto the landscape. Despite the fact that landscape degradation is less severe in the Gaza Strip than in the West Bank, the inefficient treatment of wastewater at the existing treatment plants and the discharge of wastewater in large quantities into Wadi Gaza and the coastal areas pose great threats to the quality of groundwater and the integrity of the marine ecosystems which are both highly polluted.
111
5.1.1.3.2 Loss of Recreational and Aesthetic Values Bucolic areas and shrub lands are areas sporadically used by the residents of the West Bank for recreational purposes. The pollution of such areas due to the improper disposal of the collected solid waste and wastewater or their location close to pollution sources results in the loss of their recreational and aesthetic values, thus the use of alternative sites by the residents. The values of the recreational sites and the changes in their quality were valuated using the travel cost technique as follows:
• The bucolic areas and shrub lands located close to pollution sources were identified using GIS. Thirty three traditionally utilized recreational sites are located in close proximity to pollution sources and are not currently used for recreational purposes. The total number of population residing in localities adjacent to these recreational sites is approximately 200,000 persons.
• The travel distances from the urban localities located close to the impacted recreational sites were calculated using the GIS. The average travel distance was approximately 5 kilometers.
• The average travel distance was compared to the distance that would be traveled by residents to reach alternative recreational sites located in close proximity to their localities. This was done in order to calculate the difference in the travel distance and the required cost incurred by the residents when traveling longer distances to reach the alternative sites. The average travel distance to alternative sites was approximately 9 kilometers.
• In order to determine the number of trips made by each person every year to the adjacent recreational sites, a representative sample of the population was interviewed. It was found that the use of adjacent natural areas for recreational purposes dropped from an approximate average of two trips per person per year to less than half a trip per person per year after the outbreak of the second Intifada. This was mainly due to the deteriorating economic and political situation.
• The travel cost was approximated at 35 cents per kilometer. Accordingly, the total cost incurred by residents to travel to the alternative recreational sites was estimated at 280 thousand USD in year 2003. This cost was projected for the next 20 years at 14 million USD. It should be noted that the calculated travel cost is an averted cost if the recreational sites were not polluted or located close to pollution sources.
The values of the recreational sites in the Gaza Strip were not calculated due to lack of alternative recreational sites. The two potential recreational sites are the shoreline and Wadi Gaza with its surrounding shrub land. However, both sites are currently polluted and lost their potential as recreational sites.

112
5.1.1.3.3 Air Pollution The transport of the collected solid waste to the dumping sites and the open burning of such waste produce emissions of acidifying and greenhouse gases (European Commission, 2000). The acidifying gases include sulfur dioxide SO2 and nitrogen oxides NOx, while the greenhouse gases include carbon dioxide CO2, methane CH4 and nitrous oxide N2O. Air emissions from both pollution sources were only quantified for the West Bank due to the large number of existing uncontrolled dumping sites where open burning of solid waste is the common practice. In the Gaza Strip most of the collected solid waste is disposed of in the existing sanitary landfills.
• Air Emissions from the Transport of Solid Waste to the Dumping Sites
The quantities of air emissions were calculated using emission factors for each of the acidifying and greenhouse gases emitted from the refuse vehicles during their travel from localities to the dumping sites. Each emission factor is expressed as kilograms of the emitted gas per 1 kilometer distance traveled by vehicle, except for the SO2 emission factor that is expressed as kilograms per 1 cubic meter of fuel consumed. Several assumptions were made to estimate the emission factors, which are: (1) the refuse vehicles are of the heavy duty diesel type; (2) the average vehicle fuel consumption is 0.28 l/km; and (3) the average carrying capacity of the vehicle is 3 tons. The emission factors for SO2 and NOx are 5.178 kg/m3 and 1.073*10-2 kg/km, respectively (United States Environmental Protection Agency, 2000 c). The emission factors for the CO2, CH4 and N2O are 7.644*10-1 kg/km, 4.200*10-5 kg/km and 2.240*10-5 kg/km, respectively (Environment Canada, 2001). The total distance traveled by vehicles to the dumping sites was calculated using the following equation: n=23 dtot = ∑(di*∑(MSWni/3) (5.1)
i n=1
Where: dtot: total distance traveled to the dumping site (km) MSWni: amount of municipal solid waste collected at year n by locality i (ton) di: roundtrip distance to the dumping site from locality i (km) It should be noted that the roundtrip distances to the dumping sites were calculated based on the average distance traveled by vehicles from the localities to the dumping sites located outside the localities' jurisdiction. If the dumping site is situated within the locality, emissions from solid waste transport were neglected. The calculated emissions of the acidifying and greenhouse gases from the
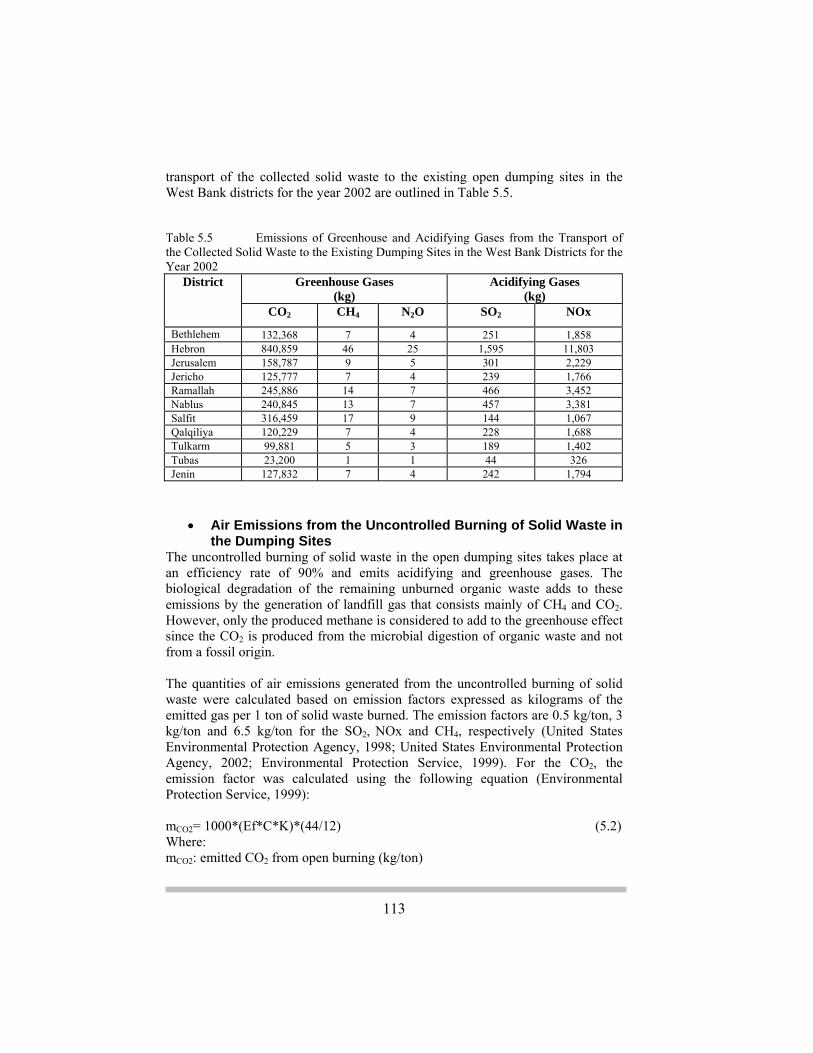
113
transport of the collected solid waste to the existing open dumping sites in the West Bank districts for the year 2002 are outlined in Table 5.5. Table 5.5 Emissions of Greenhouse and Acidifying Gases from the Transport of the Collected Solid Waste to the Existing Dumping Sites in the West Bank Districts for the Year 2002
District
Greenhouse Gases (kg)
Acidifying Gases (kg)
CO2 CH4 N2O SO2 NOx
Bethlehem 132,368 7 4 251 1,858 Hebron 840,859 46 25 1,595 11,803 Jerusalem 158,787 9 5 301 2,229 Jericho 125,777 7 4 239 1,766 Ramallah 245,886 14 7 466 3,452 Nablus 240,845 13 7 457 3,381 Salfit 316,459 17 9 144 1,067 Qalqiliya 120,229 7 4 228 1,688 Tulkarm 99,881 5 3 189 1,402 Tubas 23,200 1 1 44 326 Jenin 127,832 7 4 242 1,794
• Air Emissions from the Uncontrolled Burning of Solid Waste in the Dumping Sites
The uncontrolled burning of solid waste in the open dumping sites takes place at an efficiency rate of 90% and emits acidifying and greenhouse gases. The biological degradation of the remaining unburned organic waste adds to these emissions by the generation of landfill gas that consists mainly of CH4 and CO2. However, only the produced methane is considered to add to the greenhouse effect since the CO2 is produced from the microbial digestion of organic waste and not from a fossil origin. The quantities of air emissions generated from the uncontrolled burning of solid waste were calculated based on emission factors expressed as kilograms of the emitted gas per 1 ton of solid waste burned. The emission factors are 0.5 kg/ton, 3 kg/ton and 6.5 kg/ton for the SO2, NOx and CH4, respectively (United States Environmental Protection Agency, 1998; United States Environmental Protection Agency, 2002; Environmental Protection Service, 1999). For the CO2, the emission factor was calculated using the following equation (Environmental Protection Service, 1999): mCO2= 1000*(Ef*C*K)*(44/12) (5.2) Where: mCO2: emitted CO2 from open burning (kg/ton)

114
Ef: efficiency of burning C: fossil carbon content (ton/ton) K: percent of carbon converted into CO2 (ton/ton) (44/12) = molar mass ratio for CO2/C In order to simplify the above equation, several assumptions were made: (1) the efficiency of combustion (Ef) is 90%; (2) the percent of carbon converted into CO2 (K) is 50 % (Environmental Protection Service, 1999); (3) the only fractions of waste that contain fossil carbon are plastic, rubber and leather; and (4) the carbon content in plastic and rubber & leather is on average 78% and 85%, respectively (United States Environmental Protection Agency, 2002). As regards to methane emissions produced from the biological degradation of the unburned organic waste, they were calculated using the following equation (University of Central California, 2001): n GCH4 = ∑2kLoMie-kti (5.3) i=1 Where: GCH4: total methane emission rate (m3/year) n: total number of years of waste placement k: landfill gas emission constant (year-1). For areas receiving rainfall more than 635 mm/year, the value of k is 0.04 year-1 and it is 0.02 year-1 for areas receiving rainfall less than 635 mm/year (United States Environmental Protection Agency, 1997 b). Lo: methane generation potential (m3/year). It was estimated at 100 m3/year. Mi: mass of wet waste placed at time i (ton) ti: age of the ith section of waste (year). It was estimated at 18 years assuming that the dumping sites were established in the year 2002 and will be closed in the year 2020. It should be noted that the annual emission rate (GCH4) was converted from cubic meter to kilograms by multiplying it with the density of methane which is 1.819 kg/m3.
The calculated emissions of the acidifying and greenhouse gases from the open burning of solid waste and the biological degradation of the unburned organic waste in the existing dumping sites in the West Bank districts for the year 2002 are outlined in Table 5.6.

115
Table 5.6 Emissions of Greenhouse and Acidifying Gases from the Open Burning of Solid Waste and the Biological Degradation of the Unburned Organic Waste in the Existing Dumping Sites in the West Bank Districts for the Year 2002 District Uncontrolled Burning
(kg of emitted gases) Biological
Degradation of the Unburned Organic
Waste (kg of emitted
gases) CO2 CH4 SOx NOx CH4
Bethlehem 4,644,401 257,582 19,814 118,884 13,076 Hebron 28,868,594 939,639 72,280 433,679 40,361 Jerusalem 6,412,636 208,724 16,056 96,334 10,595 Jericho 2,083,438 67,813 5,216 31,299 3,548 Ramallah 11,434,593 372,183 28,629 171,777 11,946 Nablus 16,096,124 523,910 40,301 241,805 35,597 Salfit 11,265,304 366,672 5,232 31,391 4,621 Qalqiliya 4,587,869 149,330 11,487 68,921 7,814 Tulkarm 7,611,783 247,755 19,058 114,348 12,964 Tubas 2,097,625 68,275 5,252 31,512 4,639 Jenin 11,514,768 374,792 28,830 172,981 17,562
The calculated emissions of acidifying and greenhouse gases outlined in Table 5.5 and Table 5.6 were converted into SO2-equivalents (SO2e) and CO2-equivalents (CO2e), respectively in order to express such quantities in monetary values. The total quantities of acidifying and greenhouse gases emitted in the West Bank in the year 2002 were estimated at 1,452 tons of SO2e and 178,792 tons of CO2e, respectively. The total quantities of acidifying and greenhouse gases to be emitted within the period from year 2002 to year 2023 in the West Bank were projected at 41,323 tons of SO2e and 5,591,200 tons of CO2e. Monetary values were only attached to the equivalent values of acidifying gases emissions as acidifying gases have a direct adverse impact on human health and the environment, whereas greenhouse gases contribute to the process of global warming. This makes it complex to valuate the price of 1 ton of CO2e emitted as a result of the transport and open burning of solid waste. Accordingly, the total cost of air pollution arising from the acidifying gases emitted during the transport and open burning of solid waste was projected until year 2023 at 3 million USD in the West Bank.

116
5.1.2 Cost Benefit Analysis of the Alternative Solid Waste Management Scenarios As mentioned previously, practical combinations of various options for solid waste collection, transport and processing have been presented in seven scenarios. Each of the scenarios has economical, social and environmental negative and positive impacts. The valuation of these impacts was limited to the direct economic costs and benefits. Little attention was given to the social contexture and environmental values inherent in the established scenarios. 5.1.2.1 Economic Valuation The implementation of one of the established solid waste management scenarios entails direct economic costs and benefits that vary according to the considered options for solid waste collection, transport and processing. These costs and benefits were valuated by applying the full cost accounting method. Economic costs are divided into three types: (1) costs related to the separation of solid waste at source or at transfer stations; (2) costs associated with the transport of collected solid waste to the transfer station and/or to the processing facilities (i.e. landfill site, composting facility, recycling facility and/or incineration facility); and (3) the investment and operation and maintenance (O&M) costs associated with the transfer stations and processing facilities. Economic benefits include those resulting from the recycling and/or composting of solid waste. 5.1.2.1.1 Economic Valuation for the Drop off-Buy Back Scenario The full economic costs accounting for the separation, transport and processing of solid waste under the drop off-buy back scenario as well as the associated benefits were calculated and projected until year 2026. The results of the economic valuation are outlined in Table 5.7 for the West Bank and Table 5.8 for the Gaza Strip. The utilized cost factors and equations as well as the assumptions made are described for each component of the proposed solid waste management system as follows:

117
Table 5.7 Total Projected Economic Costs and Benefits Associated with the Drop Off-Buy Back Scenario for the West Bank
Costs Until Year 2026
(Million USD) Benefits Until Year 2026
(Million USD)
Cos
t-B
enef
it
System Component
Cost Directly Incurred
by Citizens
Cost Incurred by
Waste Management
Utilities Total Cost
Benefit From
Selling Recyclables
Benefit from
Selling Compost
Solid Waste Separation: Waste Separation Bags 112 0 112 0 0 112
Solid Waste Transport to Transfer Stations: Waste transport within Municipalities to Transfer Stations 180 0 180 0 0 180 Investment and O&M of Transfer Stations 0 72 72 0 0 72
Solid Waste Transport to Final Destination: Solid Waste Transport to Final Destination 0 75 75 0 0 75
Solid Waste Processing (Investment and O&M of Facilities)
Land Filling:
Five Landfill Sites 0 31 31 0 0 31
Recycling: One Glass Recycling Plant 0 213 213 24 0 189 One Aluminum and other Valuable Metals Recycling Plant 0 75 75 107 0 -32 One Paper Recycling Plant 0 107 107 72 0 35
Composting: Eleven Composting Facilities 0 179-188 183 0 382 -199
Total 292 756 1,048 203 382 463
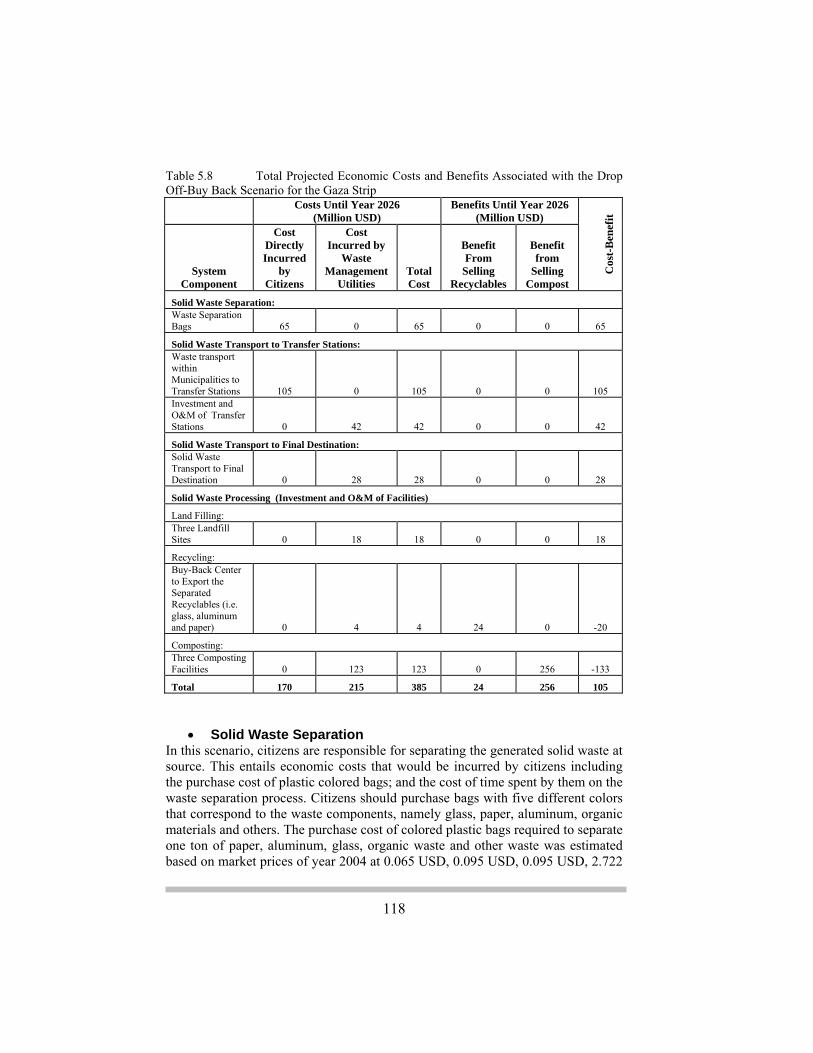
118
Table 5.8 Total Projected Economic Costs and Benefits Associated with the Drop Off-Buy Back Scenario for the Gaza Strip
Costs Until Year 2026
(Million USD) Benefits Until Year 2026
(Million USD)
Cos
t-B
enef
it
System Component
Cost Directly Incurred
by Citizens
Cost Incurred by
Waste Management
Utilities Total Cost
Benefit From
Selling Recyclables
Benefit from
Selling Compost
Solid Waste Separation: Waste Separation Bags 65 0 65 0 0 65
Solid Waste Transport to Transfer Stations: Waste transport within Municipalities to Transfer Stations 105 0 105 0 0 105 Investment and O&M of Transfer Stations 0 42 42 0 0 42
Solid Waste Transport to Final Destination: Solid Waste Transport to Final Destination 0 28 28 0 0 28
Solid Waste Processing (Investment and O&M of Facilities)
Land Filling: Three Landfill Sites 0 18 18 0 0 18
Recycling: Buy-Back Center to Export the Separated Recyclables (i.e. glass, aluminum and paper) 0 4 4 24 0 -20
Composting: Three Composting Facilities 0 123 123 0 256 -133
Total 170 215 385 24 256 105
• Solid Waste Separation In this scenario, citizens are responsible for separating the generated solid waste at source. This entails economic costs that would be incurred by citizens including the purchase cost of plastic colored bags; and the cost of time spent by them on the waste separation process. Citizens should purchase bags with five different colors that correspond to the waste components, namely glass, paper, aluminum, organic materials and others. The purchase cost of colored plastic bags required to separate one ton of paper, aluminum, glass, organic waste and other waste was estimated based on market prices of year 2004 at 0.065 USD, 0.095 USD, 0.095 USD, 2.722

119
and 1.813 USD, respectively. As regards to the time spent by citizens on waste separation, its cost is considered insignificant due to the very high unemployment rate currently observed in the Palestinian communities. Even if the socioeconomic situation improves, it is believed that the time required to separate waste would not result in an overall reduction of time invested by people to attend their customary jobs. Furthermore, separation of waste at source should be preceded by public awareness campaigns in order to raise the level of public acceptance for waste separation. The costs associated with these campaigns were assumed to be funded by donors, thus were not considered in the valuation. Accordingly, the total projected costs incurred by the citizens of the West Bank and Gaza Strip until year 2026 for separating the generated solid waste at source were estimated at 112 million USD and 65 million USD, respectively.
• Solid Waste Transport to Transfer Stations The separated solid waste is also transported by citizens in their private cars to the drop off-buy back/transfer stations. This brings about economic costs that would be incurred by citizens including the cost of fuel and the cost of time for transporting the waste to the stations. The latter cost was considered insignificant, whereas the cost of fuel consumed during the transport of one ton of solid waste from the source to the transfer station was estimated at 8.5 USD. It was assumed that individuals will travel four times a week to transport the waste to the transfer station, which translates to 12-20 km. Accordingly, the total projected costs incurred by the citizens of the West Bank and Gaza Strip until year 2026 for transporting the separated waste to the transfer stations were estimated at 180 million USD and 105 million USD, respectively. Concerning the transfer stations, the compaction and non-compaction types are considered to be established for localities with population greater than 10,000 persons and for localities with less than 10,000 persons, respectively. The ratio of compaction was assumed at 4:1 (i.e. a truck loading 6 tons would be able to load 24 tons of waste which would result in a significant reduction of transport cost to recycling facilities, composting facilities and landfill sites). The costs associated with transfer stations include investment, land, O&M and labor costs:
1) The investment costs refer to the purchase costs of relevant equipment and/or the establishment costs of stations. For a non-compaction station, the investment costs were estimated at 60,000 USD. For a compaction station, the purchase costs of compaction equipment vary according to the station’s capacity. They were estimated at 100,000 USD, 150,000 USD and 185,000 USD for a station serving population in the range of 10,000 to 27,000 persons, 27,001 to 62,000 persons, and 62,001 to 140,000 persons, respectively.
2) The renting cost of one dunum of land where the drop off-buy back station will be established was estimated at 700 USD per month. The required

120
area of land depends on the station’s capacity and was estimated at 1,000 m2 for a station serving 27,000 persons. The area of land increases proportionally with the number of persons served.
3) The O&M costs for a transfer station were estimated at 12-15% of the investment costs.
4) The average cost per worker was assumed at 600 USD/person/month. It was estimated that a minimum of 5 workers are required to manage and operate a transfer station. If the population served is more than 14,000 people, the number of workers will increase proportionally.
The aforementioned costs associated with the transfer stations were projected until year 2026 and estimated at 72 million USD for the West Bank and 42 million USD for the Gaza Strip.
• Solid Waste Transport from Transfer Stations to Processing Facilities
The full economic costs accounting for the transport of the separated solid waste from transfer stations to final destination as well as the processing of solid waste were estimated based on the following assumptions: Composting Facilities:
1) Eleven and three composting facilities are proposed to be established for the West Bank and Gaza Strip, respectively;
2) Two composting technologies can be utilized either the turned windrow technology or the aerated static pile technology using the Gore cover; and
3) The capacity of the composting facility is designed to treat 70% of the generated domestic solid waste. Every ten years the facility should be expanded to accommodate larger quantities of waste generated by a rapid growing population (population growth rate is assumed at 4.25%).
Recycling Facilities:
1) Only glass, aluminum and metal, and paper are to be recycled; 2) Three recycling plants are proposed to be established in the West Bank. A
paper recycling plant in Nablus, a glass recycling plant in Hebron and metals and aluminum recycling plant in Jericho;
3) The capacity of the recycling facility is designed to treat 15% of the generated domestic solid waste. Every ten years the facility should be expanded to accommodate larger quantities of waste generated by a rapid growing population; and
4) A buy-back center is proposed to be established in the Gaza Strip to export the recyclables.

121
Landfill Sites: 1) Five Landfills are proposed to be established in the West Bank and
another three in the Gaza Strip; and 2) The capacity of the Landfill sites is designed to receive 15% of the
generated domestic solid waste. Every ten years the facility should be expanded to accommodate larger quantities of waste generated by a rapid growing population.
The separated organic waste, recyclables and the remaining waste will be transported by means of trucks administered by the municipal and rural councils from the transfer stations to the composting facilities, recycling plants and landfill sites, respectively. This brings about economic costs that would be incurred by the waste management utilities including the purchase cost of trucks; the cost of fuel; and the cost of labor. The base costs were obtained from those calculated for the bulk waste drop off and landfill scenario that were based on the cost factors in the World Bank Study (World Bank, 1998 a & 1998 b). Accordingly, the total cost of transport was calculated using the following equation: Cost of transport = (((Cf * Corr1) + Cl + Ct) * CR * CF1 * TR1) + (5.4)
(((Cf *Corr2) + Cl + Ct) * CR * CF2 * TR2) + (((Cf *Corr3) + Cl + Ct) * CR * CF3 * TR3)
Where: Cf: cost of fuel, Cl: cost of labor and Ct: cost of trucks. They equal the costs calculated for the bulk waste drop off and landfill scenario. Corr1, Corr2 and Corr3 are correction factors arising due to the exclusion of trucks traveling within the cities and villages to collect waste from the alleys. On average, trucks travel a distance inside the city which equals the return trip to the landfill sites. Accordingly, Corr1 (landfill sites) = 0.5, Corr2 (composting facilities) = 0.35, and Corr3 (recycling facility) = 0.85 CR: ratio of the compacted waste volume to the untreated waste volume. It was estimated at 55% based on the assumption that 61% of the generated waste is compacted. CF1: percentage of non-recyclable waste. It was assumed at 15% of the generated waste. CF2: percentage of organic waste. It was assumed at 70% of the generated waste. CF3: percentage of recyclable waste. It was assumed at 15% of the generated waste.
122
TR1: ratio of the transport distances to landfill sites to the distance calculated for the bulk waste drop off and landfill scenario. It was calculated at 100%. TR2: ratio of the transport distances to composting facilities to the distance calculated for the bulk waste drop off and landfill scenario. It was calculated at 40%. TR3: ratio of the transport distances to recycling facilities to the distance calculated for the bulk waste drop off and landfill scenario. It was calculated at 450%. The calculated total costs of transporting the separated solid waste from the transfer stations to the processing facilities were projected until year 2026 and estimated at 75 million USD for the West Bank and 28 million USD for the Gaza Strip. Concerning the costs associated with the processing facilities, they include investment, land, O&M and labor costs. The base data for calculating these costs were obtained from the World Bank study (World Bank, 1998 a & 1998 b). The calculated costs were projected until year 2026. For the West Bank, they were estimated at 31 million USD for the five landfill sites, 395 million USD for the three recycling plants and 183 million USD for the composting facilities. For the Gaza Strip, the total costs were estimated at 18 million USD for the three landfill sites, 4 million USD for the buy back center and 123 million USD for the composting facilities. On the other hand, the composting of organic waste as well as the recycling of glass, aluminum and other valuable metals, and paper would generate revenues from selling the compost and recyclables to their end users. It was estimated that each ton of compost is sold at 50-65 USD, whereas each ton of recycled glass and recycled metals is sold at 48 USD and 98 USD, respectively. The total economic benefits were calculated and projected until year 2026 at 585 million USD for the West Bank and 280 million USD for the Gaza Strip. 5.1.2.1.2 Economic Valuation for the Bulk Waste Drop off and Landfill Scenario The full economic costs accounting for the transport and land filling of solid waste under the bulk waste drop off and landfill scenario were calculated and projected until year 2026. The results of the valuation of economic costs are outlined in Table 5.9 for the West Bank and Table 5.10 for the Gaza Strip. The utilized cost factors and assumptions made are described for each component of the proposed waste management system as follows:
• Solid Waste Separation In this scenario, citizens are responsible for collecting the generated bulk solid waste in plastic bags without separation. The purchase cost of bags will be incurred by citizens. It was estimated at 2.7 USD for holding in one ton of typical
123
domestic solid waste. Accordingly, the total projected purchase costs of plastic bags used by the citizens of the West Bank and Gaza Strip were estimated at 109 million USD and 63 million USD, respectively. The awareness level among residents should be raised at this stage in order to secure their commitment in collecting the generated waste in plastic bags and then transporting it to the transfer stations. The costs associated with the awareness campaign were not considered in the valuation because they were assumed to be funded by donors.
• Solid Waste Transport to Transfer Stations The bulk solid waste is also transported by citizens in their private cars to the compaction and non-compaction drop off/transfer stations. The cost factors utilized to calculate the costs of transporting the solid waste to the stations and those associated with the stations are the same as in the previous scenario (refer to section 5.1.2.1.1). Accordingly, the total projected costs incurred by the citizens of the West Bank and Gaza Strip until year 2026 for transporting the separated waste to the transfer stations were estimated at 180 million USD and 105 million USD, respectively. As regards to the investment, Land, O&M and labor costs associated with the transfer station, they were projected and estimated at 72 million USD for the West Bank and 42 million USD for the Gaza Strip.
• Solid Waste Transport from Transfer Stations to Processing Facilities
In this waste management scenario, solid waste is transported from the transfer stations to the landfill sites only. The assumptions made in the previous scenario for the landfill option apply to this scenario. The costs of transporting the bulk solid waste from the stations to the landfill sites were calculated using equation 5.4 and projected until year 2026 at 50 million USD within the West Bank and 19 million USD within the Gaza Strip. The total projected investment, land, O&M and labor costs associated with the landfill sites, were estimated at 144 million USD for the West Bank and 84 million USD for the Gaza Strip.

124
Table 5.9 Total Projected Economic Costs Associated with the Bulk Waste Drop off and Landfill Scenario for the West Bank
Costs Until Year 2026
(Million USD) Benefits Until Year 2026
(Million USD)
Cos
t-B
enef
it
System Component
Cost Directly Incurred
by Citizens
Cost Incurred by
Waste Management
Utilities Total Cost
Benefit From
Selling Recyclables
Benefit from
Selling Compost
Solid Waste Separation:
Bulk Waste Bags 109 0 109 0 0 109
Solid Waste Transport to Transfer Stations: Waste transport within Municipalities to Transfer Stations 180 0 180 0 0 180 Investment and O&M of Transfer Stations 0 72 72 0 0 72
Solid Waste Transport to Final Destination: Solid Waste Transport to Final Destination 0 50 50 0 0 50
Solid Waste Processing (Investment and O&M of Facilities)
Land Filling:
Five Landfill Sites 0 144 144 0 0 144
Total 289 266 555 0 0 555
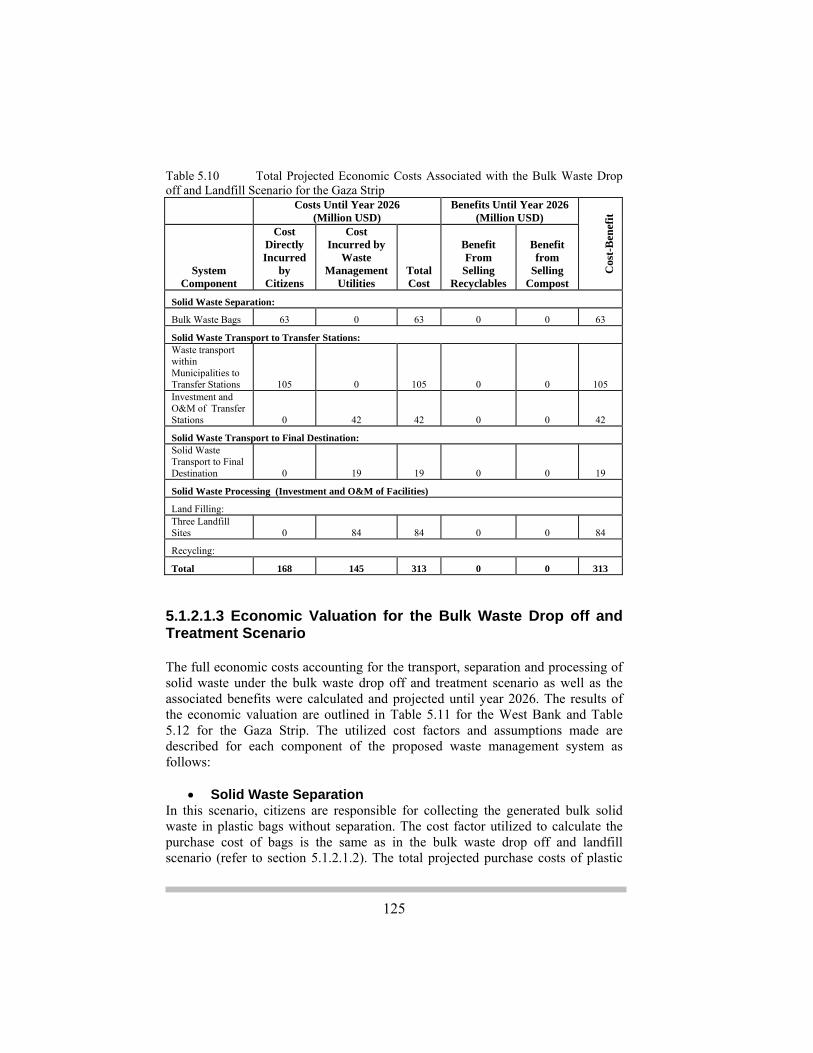
125
Table 5.10 Total Projected Economic Costs Associated with the Bulk Waste Drop off and Landfill Scenario for the Gaza Strip
Costs Until Year 2026
(Million USD) Benefits Until Year 2026
(Million USD)
Cos
t-B
enef
it
System Component
Cost Directly Incurred
by Citizens
Cost Incurred by
Waste Management
Utilities Total Cost
Benefit From
Selling Recyclables
Benefit from
Selling Compost
Solid Waste Separation:
Bulk Waste Bags 63 0 63 0 0 63
Solid Waste Transport to Transfer Stations: Waste transport within Municipalities to Transfer Stations 105 0 105 0 0 105 Investment and O&M of Transfer Stations 0 42 42 0 0 42
Solid Waste Transport to Final Destination: Solid Waste Transport to Final Destination 0 19 19 0 0 19
Solid Waste Processing (Investment and O&M of Facilities)
Land Filling: Three Landfill Sites 0 84 84 0 0 84
Recycling:
Total 168 145 313 0 0 313 5.1.2.1.3 Economic Valuation for the Bulk Waste Drop off and Treatment Scenario The full economic costs accounting for the transport, separation and processing of solid waste under the bulk waste drop off and treatment scenario as well as the associated benefits were calculated and projected until year 2026. The results of the economic valuation are outlined in Table 5.11 for the West Bank and Table 5.12 for the Gaza Strip. The utilized cost factors and assumptions made are described for each component of the proposed waste management system as follows:
• Solid Waste Separation In this scenario, citizens are responsible for collecting the generated bulk solid waste in plastic bags without separation. The cost factor utilized to calculate the purchase cost of bags is the same as in the bulk waste drop off and landfill scenario (refer to section 5.1.2.1.2). The total projected purchase costs of plastic

126
bags used by the citizens of the West Bank and Gaza Strip were estimated at 109 million USD and 63 million USD, respectively.
• Solid Waste Transport to Transfer Stations The bulk solid waste is transported by citizens in their private cars to the compaction and non-compaction drop off/transfer stations. The cost factors utilized to calculate the costs of transporting the solid waste to the stations are the same as in the first scenario (refer to section 5.1.2.1.1). Accordingly, the total projected costs incurred by the citizens of the West Bank and Gaza Strip until year 2026 for transporting the separated waste to the transfer stations were estimated at 180 million USD and 105 million USD, respectively. Under this scenario, the bulk solid waste is proposed to be separated in the compaction and non-compaction transfer stations that are equipped with sorting equipment and conveyor belts. The sorting equipment (e.g. trommel screen) is used to separate organic waste from the waste stream, whereas the recyclable waste is separated on the conveyor belts by workers. This brings about additional costs to the investment, land, O&M and labor costs associated with the transfer stations under the first scenario (refer to section 5.1.2.1.1). The additional costs include the equipment costs and the salaries of workers responsible for separating the recyclable solid waste items. The cost of sorting equipment (e.g. trommel screen) serving 60,000 persons is estimated at 110,000 USD and the cost of a conveyor belt is approximately 20,000 USD. The required number of workers depends on the number of people served. For a transfer station serving 13,000 persons the required number of workers is 5. The total projected costs associated with the separation/transfer stations were estimated at 199 million USD for the West Bank and 116 million USD for the Gaza Strip.
• Solid Waste Transport from Transfer Stations to Processing Facilities
In this waste management scenario, the separated solid waste should be transported from the transfer stations to the landfill sites, composting facilities and recycling facilities. The utilized cost factors and assumptions made for the solid waste processing methods considered in the drop off-buy back scenario apply to this scenario. For the West Bank, the transport costs and the total costs associated with the considered processing methods were projected until year 2026 at 75 million USD and 609 million USD, respectively. For the Gaza Strip, these costs were projected at 28 million USD and 145 million USD, respectively. The revenues generated from selling the compost and recyclables to end users were calculated using the same cost factors utilized in the first scenario. They were estimated at 585 million USD for the West Bank and 280 million USD for the Gaza Strip.

127
Table 5.11 Total Projected Economic Costs and Benefits Associated with the Bulk Waste Drop off and Treatment Scenario for the West Bank
Costs Until Year 2026
(Million USD) Benefits Until Year 2026
(Million USD)
Cos
t-B
enef
it
System Component
Cost Directly Incurred
by Citizens
Cost Incurred by
Waste Management
Utilities Total Cost
Benefit From
Selling Recyclables
Benefit from
Selling Compost
Solid Waste Separation:
Bulk Waste Bags 109 0 109 0 0 109
Solid Waste Transport to Separation/Transfer Stations: Waste transport within Municipalities to Separation/Transfer Stations 180 0 180 0 0 180 Investment and O&M of Separation/Transfer Stations 0 199 199 0 0 199
Solid Waste Transport to Final Destination: Solid Waste Transport to Final Destination 0 75 75 0 0 75
Solid Waste Processing (Investment and O&M of Facilities)
Land Filling:
Five Landfill Sites 0 31 31 0 0 31
Recycling: One Glass Recycling Plant 0 213 213 24 0 189 One Aluminum and other Valuable Metals Recycling Plant 0 75 75 107 0 -32 One Paper Recycling Plant 0 107 107 72 0 35
Composting: Eleven Composting Facilities 0 179-188 183 0 382 -199
Total 289 883 1,172 203 382 587

128
Table 5.12 Total Projected Economic Costs and Benefits Associated with the Bulk Waste Drop off and Treatment Scenario for the Gaza Strip
Costs Until Year 2026
(Million USD) Benefits Until Year 2026
(Million USD)
Cos
t-B
enef
it
System Component
Cost Directly Incurred
by Citizens
Cost Incurred by
Waste Management
Utilities Total Cost
Benefit From
Selling Recyclables
Benefit from
Selling Compost
Solid Waste Separation:
Bulk Waste Bags 63 0 63 0 0 63
Solid Waste Transport to Separation/Transfer Stations: Waste transport within Municipalities to Separation/Transfer Stations 105 0 105 0 0 105 Investment and O&M of Separation/Transfer Stations 0 116 116 0 0 116
Solid Waste Transport to Final Destination: Solid Waste Transport to Final Destination 0 28 28 0 0 28
Solid Waste Processing (Investment and O&M of Facilities)
Land Filling: Three Landfill Sites 0 18 18 0 0 18
Recycling: Buy-Back Center to Export the Separated Recyclables (i.e. glass, aluminum and paper) 0 4 4 24 0 -20
Composting: Three Composting Facilities 0 123 123 0 256 -133
Total 168 289 457 24 256 177
5.1.2.1.4 Economic Valuation for the Separation-Curbside and Waste Treatment Scenario The full economic costs accounting for the management of solid waste under the separation-curbside and waste treatment scenario as well as the associated benefits were calculated and projected until year 2026. The results of the economic valuation are outlined in Table 5.13 for the West Bank and Table 5.14 for the

129
Gaza Strip. The utilized cost factors and assumptions made are described for each component of the proposed waste management system as follows:
• Solid Waste Separation The separation of solid waste is achieved by citizens at source as was indicated under the drop off-buy back scenario. This entails purchasing colored waste bags by the citizens. The total projected purchase costs of colored bags used by the citizens of the West Bank and Gaza Strip were estimated at 112 million USD and 65 million USD, respectively. The citizens are also responsible for transporting the colored plastic bags to the corresponding containers in the alley/neighborhood. Five containers of different sizes should be distributed per alley. The container for collecting organic waste is designed with a capacity of 1.5 tons, whereas the other containers for collecting glass, aluminum, paper and other non-recyclable waste are designed with a capacity of 0.5 tons. The purchase cost of containers would be incurred by the waste management utilities and was estimated based on market prices. The total projected purchase costs of containers were estimated at 21 million USD for the West Bank and 12 million USD for the Gaza Strip.
• Solid Waste Transport to Transfer Stations In this scenario, the solid waste collected in the waste alley containers should be transported by the municipal and/or rural refuse trucks. The organic waste is proposed to be directly transported to the composting facilities that are located at an average distance of 25 km from any locality in the West Bank. The remaining waste is transported to the transfer stations. The total costs of transport were estimated and projected until year 2026 at 251 million USD for the West Bank and 146 million USD for the Gaza Strip. Concerning the costs associated with the transfer stations, they were estimated and projected at 72 million USD for the West Bank and 42 million USD for the Gaza Strip using the same cost factors used in the drop off-buy back scenario.
• Solid Waste Transport from Transfer Stations to Processing Facilities
The separated recyclable and non-recyclable waste is transported to the recycling plants and landfill sites, respectively. The average travel distance from the transfer station to the recycling facility and landfill site was estimated at 175 km and 50 km, respectively. The total costs of transport include the cost of fuel that was calculated based on the number of trips needed and the travel distance; the cost of trucks that was calculated based on the required number of trucks that varies according to the number of persons served; and the cost of labor that was assumed to be at around 500-600 USD/month. The total projected transport costs were estimated at 75 million USD for the West Bank and 16 million USD for the Gaza Strip. The total costs associated with the processing facilities were calculated based on the cost factors and assumptions made for the drop off-buy back scenario. The total costs were projected at 609 million USD for the West Bank and

130
129 million USD for the Gaza Strip. On the other hand, the total projected revenues generated from selling the compost and recyclables to end users were estimated at 585 million USD for the West Bank and 247 million USD for the Gaza Strip. Table 5.13 Total Projected Economic Costs and Benefits Associated with the Separation-Curbside and Waste Treatment Scenario for the West Bank
Costs Until Year 2026
(Million USD) Benefits Until Year 2026
(Million USD)
Cos
t-B
enef
it
System Component
Cost Directly Incurred
by Citizens
Cost Incurred by
Waste Management
Utilities Total Cost
Benefit From Selling Recyclables
Benefit from
Selling Compost
Solid Waste Separation: Waste Separation Bags 112 0 112 0 0 112 Waste Alley Containers 0 21 21 0 0 21
Recyclable & Non-Recyclable Wastes’ Transport to Transfer Stations: Waste transport within Municipalities to Transfer Stations 0 251 251 0 0 251 Investment and O&M of Transfer Stations 0 72 72 0 0 72
Solid Waste Transport to Final Destination: Solid Waste Transport to Final Destination 0 75 75 0 0 75
Solid Waste Processing (Investment and O&M of Facilities)
Land Filling:
Five Landfill Sites 0 31 31 0 0 31
Recycling: One Glass Recycling Plant 0 213 213 24 0 189 One Aluminum and other Valuable Metals Recycling Plant 0 75 75 107 0 -32 One Paper Recycling Plant 0 107 107 72 0 35
Composting: Eleven Composting Facilities 0 179-188 183 0 382 -199
Total 112 1,028 1,140 203 382 555

131
Table 5.14 Total Projected Economic Costs and Benefits Associated with the Separation-Curbside and Waste Treatment Scenario for the Gaza Strip
Costs Until Year 2026
(Million USD) Benefits Until Year 2026
(Million USD)
Cos
t-B
enef
it
System Component
Cost Directly Incurred
by Citizens
Cost Incurred by
Waste Management
Utilities Total Cost
Benefit From
Selling Recyclables
Benefit from
Selling Compost
Solid Waste Separation: Waste Separation Bags 65 0 65 0 0 65 Waste Alley Containers 0 12 12 0 0 12
Recyclable & Non-Recyclable Wastes’ Transport to Transfer Stations: Waste transport within Municipalities to Transfer Stations 0 146 146 0 0 146 Investment and O&M of Transfer Stations 0 42 42 0 0 42
Solid Waste Transport to Final Destination: Solid Waste Transport to Final Destination 0 16 16 0 0 16
Solid Waste Processing (Investment and O&M of Facilities)
Land Filling:
Three Landfill Sites 0 18 18 0 0 18
Recycling: Buy-Back Center to Export the Separated Recyclables (i.e. glass, aluminum and paper) 0 4 4 24 0 -20
Composting: Three Composting Facilities 0 107 107 0 223 -116
Total 65 345 410 24 223 163 5.1.2.1.5 Economic Valuation for the Bulk Waste-Curbside and Landfill Scenario The full economic costs accounting for the management of solid waste under the bulk waste-curbside and landfill scenario were calculated and projected until year 2026. The results are outlined in Table 5.15 for the West Bank and Table 5.16 for the Gaza Strip. The utilized cost factors and assumptions made are described for each component of the proposed waste management system as follows:
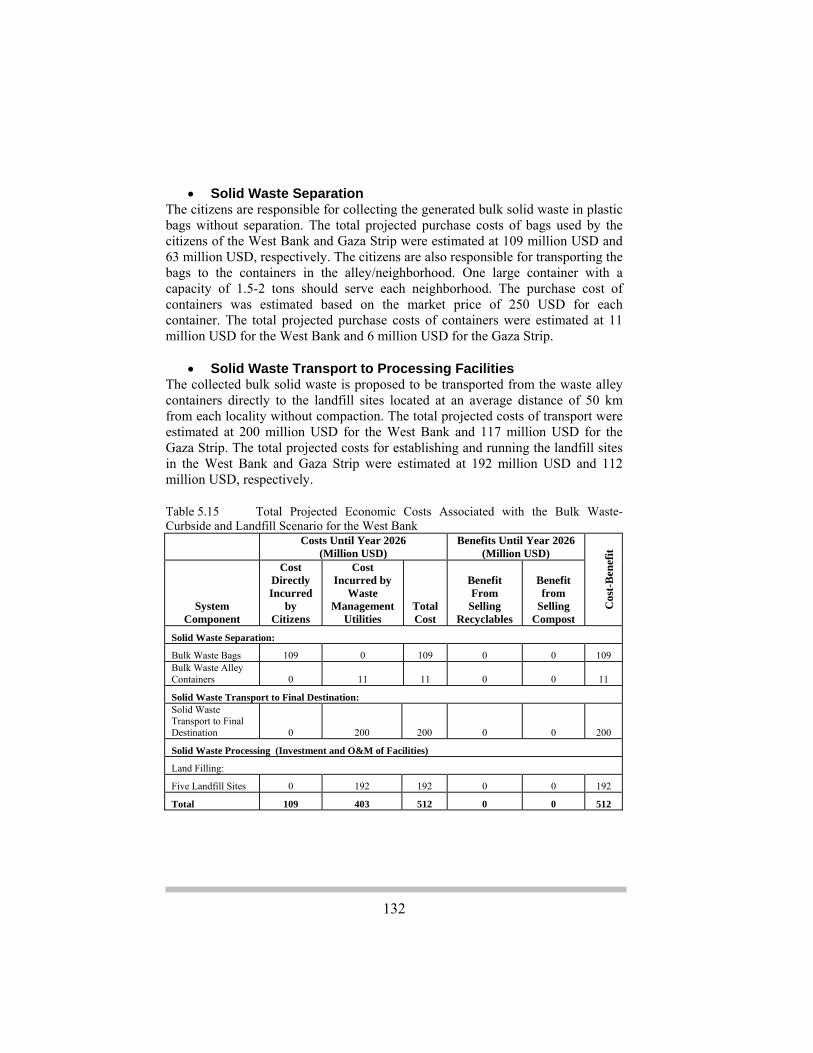
132
• Solid Waste Separation
The citizens are responsible for collecting the generated bulk solid waste in plastic bags without separation. The total projected purchase costs of bags used by the citizens of the West Bank and Gaza Strip were estimated at 109 million USD and 63 million USD, respectively. The citizens are also responsible for transporting the bags to the containers in the alley/neighborhood. One large container with a capacity of 1.5-2 tons should serve each neighborhood. The purchase cost of containers was estimated based on the market price of 250 USD for each container. The total projected purchase costs of containers were estimated at 11 million USD for the West Bank and 6 million USD for the Gaza Strip.
• Solid Waste Transport to Processing Facilities The collected bulk solid waste is proposed to be transported from the waste alley containers directly to the landfill sites located at an average distance of 50 km from each locality without compaction. The total projected costs of transport were estimated at 200 million USD for the West Bank and 117 million USD for the Gaza Strip. The total projected costs for establishing and running the landfill sites in the West Bank and Gaza Strip were estimated at 192 million USD and 112 million USD, respectively. Table 5.15 Total Projected Economic Costs Associated with the Bulk Waste-Curbside and Landfill Scenario for the West Bank
Costs Until Year 2026
(Million USD) Benefits Until Year 2026
(Million USD)
Cos
t-B
enef
it System
Component
Cost Directly Incurred
by Citizens
Cost Incurred by
Waste Management
Utilities Total Cost
Benefit From
Selling Recyclables
Benefit from
Selling Compost
Solid Waste Separation:
Bulk Waste Bags 109 0 109 0 0 109 Bulk Waste Alley Containers 0 11 11 0 0 11
Solid Waste Transport to Final Destination: Solid Waste Transport to Final Destination 0 200 200 0 0 200
Solid Waste Processing (Investment and O&M of Facilities)
Land Filling:
Five Landfill Sites 0 192 192 0 0 192
Total 109 403 512 0 0 512
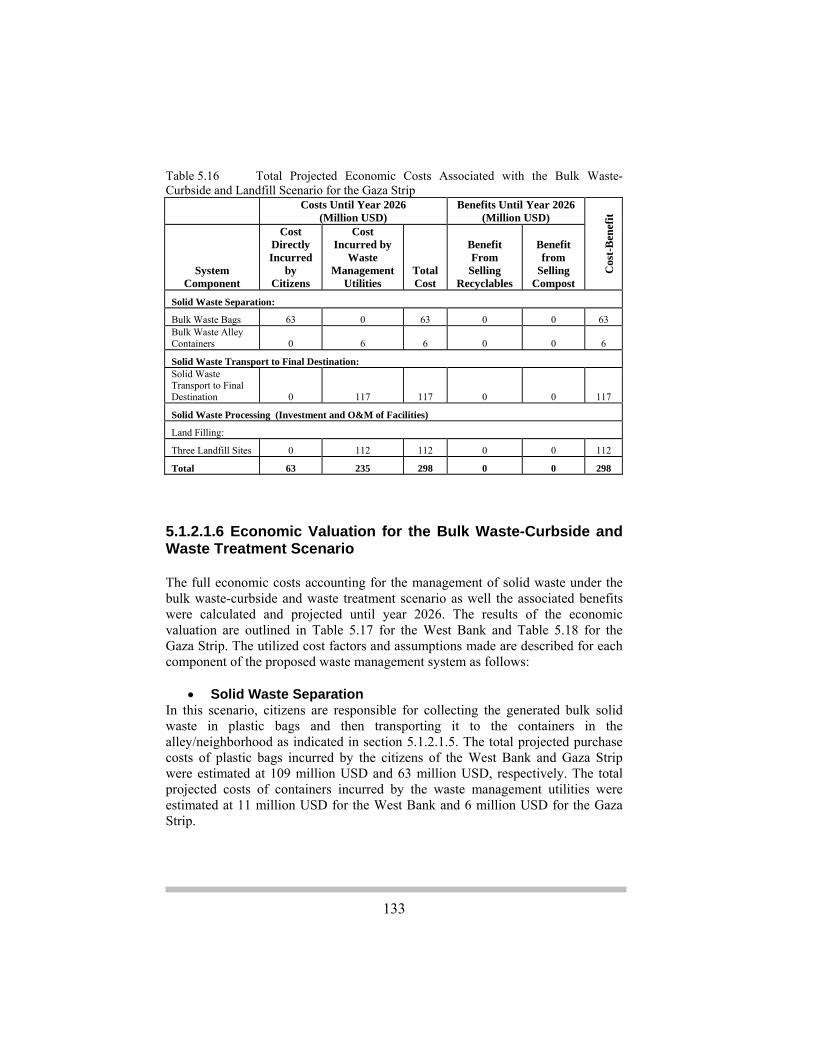
133
Table 5.16 Total Projected Economic Costs Associated with the Bulk Waste-Curbside and Landfill Scenario for the Gaza Strip
Costs Until Year 2026
(Million USD) Benefits Until Year 2026
(Million USD)
Cos
t-B
enef
it
System Component
Cost Directly Incurred
by Citizens
Cost Incurred by
Waste Management
Utilities Total Cost
Benefit From
Selling Recyclables
Benefit from
Selling Compost
Solid Waste Separation:
Bulk Waste Bags 63 0 63 0 0 63 Bulk Waste Alley Containers 0 6 6 0 0 6
Solid Waste Transport to Final Destination: Solid Waste Transport to Final Destination 0 117 117 0 0 117
Solid Waste Processing (Investment and O&M of Facilities)
Land Filling:
Three Landfill Sites 0 112 112 0 0 112
Total 63 235 298 0 0 298 5.1.2.1.6 Economic Valuation for the Bulk Waste-Curbside and Waste Treatment Scenario The full economic costs accounting for the management of solid waste under the bulk waste-curbside and waste treatment scenario as well the associated benefits were calculated and projected until year 2026. The results of the economic valuation are outlined in Table 5.17 for the West Bank and Table 5.18 for the Gaza Strip. The utilized cost factors and assumptions made are described for each component of the proposed waste management system as follows:
• Solid Waste Separation In this scenario, citizens are responsible for collecting the generated bulk solid waste in plastic bags and then transporting it to the containers in the alley/neighborhood as indicated in section 5.1.2.1.5. The total projected purchase costs of plastic bags incurred by the citizens of the West Bank and Gaza Strip were estimated at 109 million USD and 63 million USD, respectively. The total projected costs of containers incurred by the waste management utilities were estimated at 11 million USD for the West Bank and 6 million USD for the Gaza Strip.

134
• Solid Waste Transport to Transfer Stations The bulk solid waste collected in the waste alley containers is proposed to be transported by the municipal and/or rural refuse trucks to the transfer stations only twice a week. This reduces the total costs of transport by 40-45% of that associated with the transport of separated waste when the refuse vehicles travel 5-6 times to each neighborhood. The total projected costs incurred by the waste management utilities in the West Bank and Gaza Strip were estimated at 100 million USD and 59 million USD, respectively. The separation of the bulk solid waste is proposed to take place at the transfer stations as is the case in the bulk waste drop off and treatment scenario. The total projected costs associated with the separation/transfer station were estimated at 199 million USD for the West Bank and 116 million USD for the Gaza Strip.
• Solid Waste Transport from Transfer Stations to Processing
Facilities In this waste management scenario, the separated solid waste is transported from the transfer stations to the landfill sites, composting facilities and recycling facilities. The utilized cost factors and assumptions made for the solid waste processing methods considered in the drop off-buy back scenario apply to this scenario. For the West Bank, the transport costs and the total costs associated with the considered processing methods were projected until year 2026 at 75 million USD and 609 million USD, respectively. For the Gaza Strip, these costs were projected at 16 million USD and 129 million USD, respectively. The revenues generated from selling the compost and recyclables to end users were calculated using the same cost factors utilized in the first scenario. They were estimated at 585 million USD for the West Bank and 247 million USD for the Gaza Strip.

135
Table 5.17 Total Projected Economic Costs and Benefits Associated with the Bulk Waste-Curbside and Waste Treatment Scenario for the West Bank
Costs Until Year 2026
(Million USD) Benefits Until Year 2026
(Million USD)
Cos
t-B
enef
it
System Component
Cost Directly Incurred
by Citizens
Cost Incurred by
Waste Management
Utilities Total Cost
Benefit From
Selling Recyclables
Benefit from
Selling Compost
Solid Waste Separation:
Bulk Waste Bags 109 0 109 0 0 109 Bulk Waste Alley Containers 0 11 11 0 0 11
Waste Transport to Transfer Stations: Waste transport within Municipalities to Transfer Stations 0 100 100 0 0 100 Investment and O&M of Transfer Stations 0 199 199 0 0 199
Solid Waste Transport to Final Destination: Solid Waste Transport to Final Destination 0 75 75 0 0 75
Solid Waste Processing (Investment and O&M of Facilities)
Land Filling:
Five Landfill Sites 0 31 31 0 0 31
Recycling: One Glass Recycling Plant 0 213 213 24 0 189 One Aluminum and other Valuable Metals Recycling Plant 0 75 75 107 0 -32 One Paper Recycling Plant 0 107 107 72 0 35
Composting: Eleven Composting Facilities 0 179-188 183 0 382 -199
Total 109 994 1,103 203 382 518
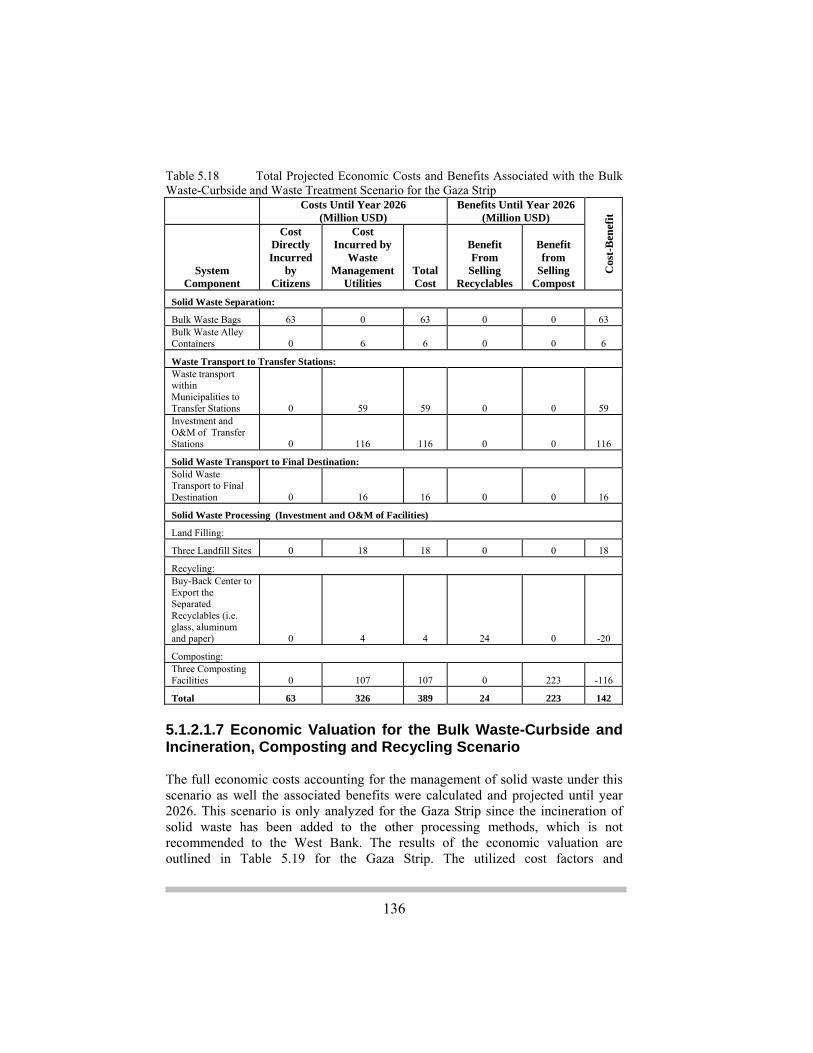
136
Table 5.18 Total Projected Economic Costs and Benefits Associated with the Bulk Waste-Curbside and Waste Treatment Scenario for the Gaza Strip
Costs Until Year 2026
(Million USD) Benefits Until Year 2026
(Million USD)
Cos
t-B
enef
it
System Component
Cost Directly Incurred
by Citizens
Cost Incurred by
Waste Management
Utilities Total Cost
Benefit From
Selling Recyclables
Benefit from
Selling Compost
Solid Waste Separation:
Bulk Waste Bags 63 0 63 0 0 63 Bulk Waste Alley Containers 0 6 6 0 0 6
Waste Transport to Transfer Stations: Waste transport within Municipalities to Transfer Stations 0 59 59 0 0 59 Investment and O&M of Transfer Stations 0 116 116 0 0 116
Solid Waste Transport to Final Destination: Solid Waste Transport to Final Destination 0 16 16 0 0 16
Solid Waste Processing (Investment and O&M of Facilities)
Land Filling:
Three Landfill Sites 0 18 18 0 0 18
Recycling: Buy-Back Center to Export the Separated Recyclables (i.e. glass, aluminum and paper) 0 4 4 24 0 -20
Composting: Three Composting Facilities 0 107 107 0 223 -116
Total 63 326 389 24 223 142 5.1.2.1.7 Economic Valuation for the Bulk Waste-Curbside and Incineration, Composting and Recycling Scenario The full economic costs accounting for the management of solid waste under this scenario as well the associated benefits were calculated and projected until year 2026. This scenario is only analyzed for the Gaza Strip since the incineration of solid waste has been added to the other processing methods, which is not recommended to the West Bank. The results of the economic valuation are outlined in Table 5.19 for the Gaza Strip. The utilized cost factors and

137
assumptions made are described for each component of the proposed waste management system as follows:
• Solid Waste Separation In this scenario, citizens are responsible for collecting the generated bulk solid waste in plastic bags and then transporting it to the containers in the alley/neighborhood as indicated in section 5.1.2.1.5. The total projected purchase costs of bags and containers were estimated at 63 million USD and 6 million USD, respectively.
• Solid Waste Transport to Transfer Stations The bulk solid waste collected in the waste alley containers is transported by refuse trucks to the transfer stations only twice a week. This reduces the total costs of transport by 40-45% of that associated with the transport of separated waste when the refuse vehicles travel 5-6 times to each neighborhood. The total projected costs incurred by the waste management utilities in the Gaza Strip were estimated at 59 million USD, respectively. The separation of the bulk solid waste is proposed to take place in the transfer stations as is the case in the bulk waste drop off and treatment scenario. The total projected costs associated with the separation/transfer station were estimated at 116 million USD.
• Solid Waste Transport from Transfer Stations to Processing Facilities
In this waste management scenario, it is recommended that an incineration facility be added to the other processing facilities for the Gaza Strip. However, for the incineration facility to be economically feasible, it should receive at least 100,000 tons of combustible solid waste per year. This represents approximately 28% of the generated domestic solid waste in the Gaza Strip. Accordingly, a significant percentage of organic waste (10-15%) will be combusted rather than composted. The total projected costs of transporting the separated solid waste to the processing facilities were estimated at 16 million USD. Concerning the investment and running costs associated with the landfill sites, composting facilities and the recyclables buy back center, the utilized cost factors and assumptions made for those considered in the drop off-buy back scenario apply to this scenario. For the incineration facility, the investment and O&M costs is estimated at 15 million USD for a facility processing a maximum of 120,000 tons of waste per year. The facility includes a large tipping floor on which the waste is dumped and from which the white goods, hazardous chemicals, mattresses, etc., are removed by hand; a pit in which the waste is shoved by a front end loader and from which the waste is then “metered out” by a “Bobcat” onto a belt conveyor to bring the RDF to a three day storage bin; and an incinerator with energy recovery unit. Accordingly, the total projected costs associated with the incineration facility, landfill sites, buy back center and the composting facilities were estimated at 98
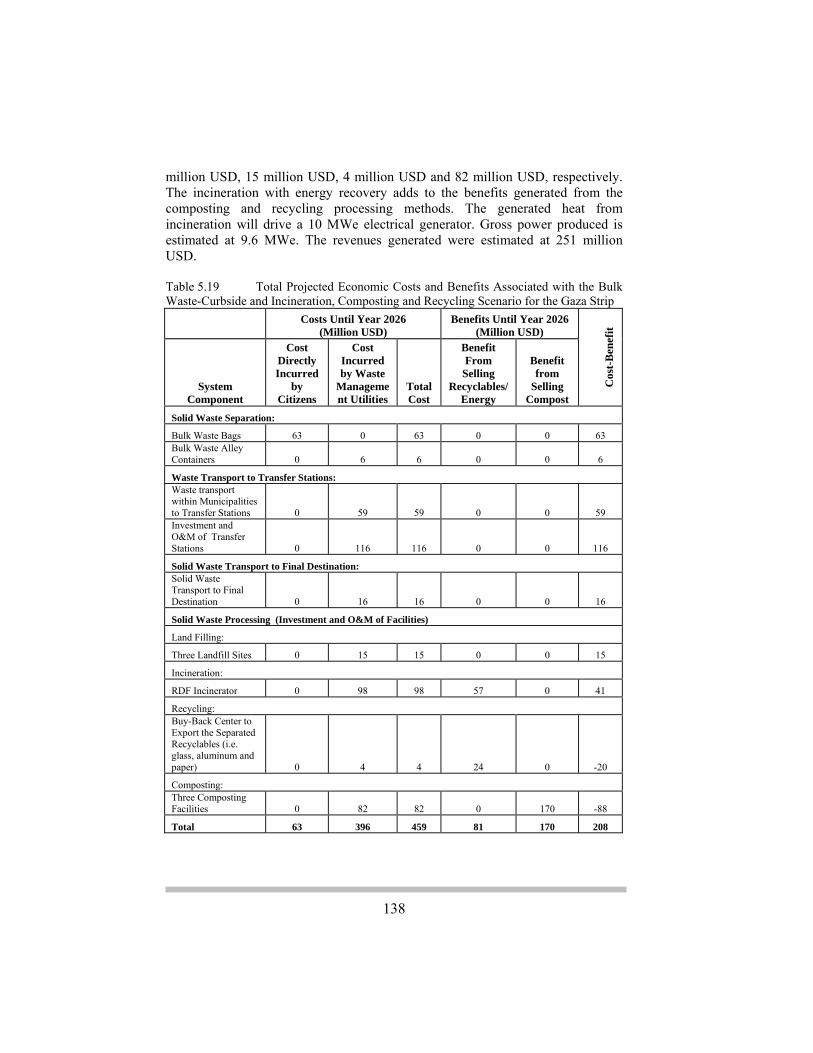
138
million USD, 15 million USD, 4 million USD and 82 million USD, respectively. The incineration with energy recovery adds to the benefits generated from the composting and recycling processing methods. The generated heat from incineration will drive a 10 MWe electrical generator. Gross power produced is estimated at 9.6 MWe. The revenues generated were estimated at 251 million USD. Table 5.19 Total Projected Economic Costs and Benefits Associated with the Bulk Waste-Curbside and Incineration, Composting and Recycling Scenario for the Gaza Strip
Costs Until Year 2026
(Million USD) Benefits Until Year 2026
(Million USD)
Cos
t-B
enef
it
System Component
Cost Directly Incurred
by Citizens
Cost Incurred by Waste
Management Utilities
Total Cost
Benefit From
Selling Recyclables/
Energy
Benefit from
Selling Compost
Solid Waste Separation:
Bulk Waste Bags 63 0 63 0 0 63 Bulk Waste Alley Containers 0 6 6 0 0 6
Waste Transport to Transfer Stations: Waste transport within Municipalities to Transfer Stations 0 59 59 0 0 59 Investment and O&M of Transfer Stations 0 116 116 0 0 116
Solid Waste Transport to Final Destination: Solid Waste Transport to Final Destination 0 16 16 0 0 16
Solid Waste Processing (Investment and O&M of Facilities)
Land Filling:
Three Landfill Sites 0 15 15 0 0 15
Incineration:
RDF Incinerator 0 98 98 57 0 41
Recycling: Buy-Back Center to Export the Separated Recyclables (i.e. glass, aluminum and paper) 0 4 4 24 0 -20
Composting: Three Composting Facilities 0 82 82 0 170 -88
Total 63 396 459 81 170 208
139
5.1.3 Synthesis of the Solid Waste Management System Altering the solid waste management practices from the current system to one of the proposed solid waste management systems presented in the established scenarios would entail much more direct economic costs. This is due to the added investment and running costs associated with the separation of solid waste at source or in the transfer stations; the transport of the bulk or separated waste to the transfer stations and/or the processing facilities; and the land filling, composting, recycling and/or incineration of relevant solid waste. However, the effective management of solid waste will abate the impacts of the current practices on the environment and public health, thus warding off the costs of the prevailing diseases, air and groundwater pollution, landscape and aesthetic distortion of the visual environment, and landscape degradation. Furthermore, the composting of organic waste, the recycling of glass, aluminum and paper as well as the incineration of combustible solid waste will bring about economic and social benefits. The conducted economic valuation provided information on the economic costs and benefits attached to the current solid waste management system and the established scenarios. However, the associated costs can not be considered as the decisive factor in the selection of the appropriate management system as other social, environmental and technical factors/indicators must be assessed to give a total score that indicates the feasibility and applicability of each system for a particular district in the West Bank or Gaza Strip. These factors/indicators include public acceptance, potential agricultural land reclamation, the health and environmental risks involved as well as the risk of failure, land area requirements, law enforcement requirement and the management level of organization. It should be noted that the assessment of the social and environmental risks associated with the implementation of the proposed management systems was not carried out due to the complexity of the issue and its dependence on the location where the management system will be implemented. Therefore, the valuated economic costs and benefits will be analyzed in this section with a social and environmental perspective. The information related to the behavior of the aforementioned social, environmental and technical factors/indicators under the current situation and the proposed scenarios is summarized in Table 5.20. This information will enable decision makers attach weights to each factor/indicator and decide upon the most practical and economically and socially feasible option. Furthermore, baseline surveys of district needs and public willingness to pay and/or participate in the solid waste management process should precede the implementation of a particular scenario in any district. On the other hand, the selection of any scenario should not be done independently from the wastewater management and reuse system. For instance, if in a particular locality or cluster of localities there exists plans for wastewater treatment and reuse, the solid waste
140
scenarios that attempt to generate significant quantities of compost should be given preference to allow for land reclamation, preparation and maintenance of agricultural land where the treated wastewater will be reused. 5.1.3.1 Drop off-Buy Back Scenario The results of the economic valuation for the alternative solid waste management scenarios indicate that the drop off-buy back scenario is the most economically feasible one. However, it would not be socially acceptable in many localities of the West Bank and Gaza Strip. The scenario assumes that citizens will be responsible for transporting solid waste from their houses to the transfer stations. Currently, the household to car ownership ratio is below one in most localities. Accordingly, citizens would find it difficult to transport waste to the transfer stations, resulting in waste accumulation in the neighborhoods. On the other hand, it will be some time until the population accepts to invest effort for the separation of waste at source and thus awareness campaigns and mechanism of law enforcement should be introduced before the implementation of this scenario. 5.1.3.2 Bulk Waste Drop off and landfill Scenario The bulk waste drop off and landfill scenario is one of the least economically attractive scenarios for solid waste management. The costs incurred by citizens and the waste management utilities are higher in this scenario than many of the other scenarios. Citizens will be responsible for transporting the generated bulk solid waste from their houses to the transfer stations located at a distance of 3-5 km from the localities’ central markets. Therefore, it would be more convenient to implement this scenario in localities with a high household to car ownership ratio. This would alleviate public rejection to the proposed solid waste transport system. On the other hand, citizens would avoid a significant increase in municipal waste tax, thus avoiding tax evasion and social rejection. 5.1.3.3 Bulk Waste Drop off and Treatment Scenario The valuation of economic costs associated with the various components of the bulk waste drop off and treatment scenario revealed that it entails much more direct costs than the two previous scenarios. This is due to the added costs for separating the bulk solid waste at transfer stations and then treating around 85% of it. However, the composting of organic waste and recycling of glass, paper and aluminum generate revenues that would cover part of the associated costs. Still the same drawbacks observed in the previous scenario preserve, namely citizens would find it difficult to transport waste to the transfer stations and waste can accumulate in the neighborhoods.
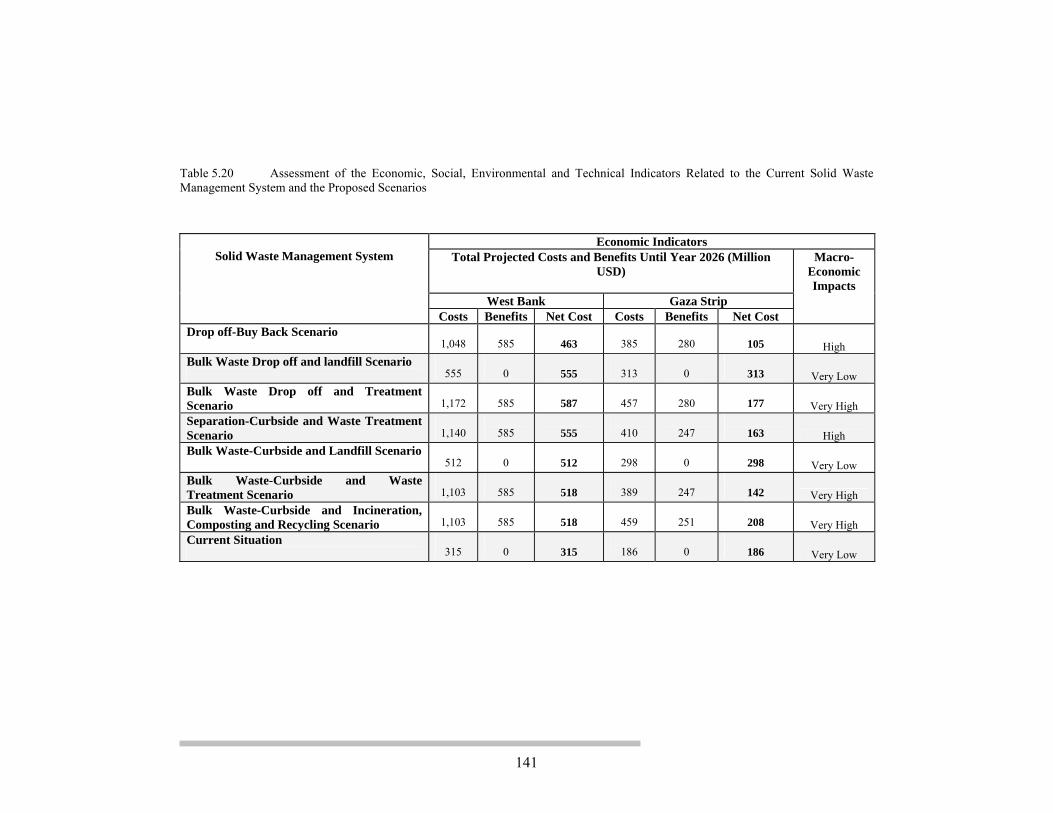
141
Table 5.20 Assessment of the Economic, Social, Environmental and Technical Indicators Related to the Current Solid Waste Management System and the Proposed Scenarios
Solid Waste Management System
Economic Indicators Total Projected Costs and Benefits Until Year 2026 (Million
USD)
Macro-Economic Impacts
West Bank Gaza Strip Costs Benefits Net Cost Costs Benefits Net Cost
Drop off-Buy Back Scenario
1,048
585
463
385
280
105 High
Bulk Waste Drop off and landfill Scenario
555
0
555
313
0
313 Very Low
Bulk Waste Drop off and Treatment Scenario
1,172
585
587
457
280
177 Very High
Separation-Curbside and Waste Treatment Scenario
1,140
585
555
410
247
163 High
Bulk Waste-Curbside and Landfill Scenario
512
0
512
298
0
298 Very Low
Bulk Waste-Curbside and Waste Treatment Scenario
1,103
585
518
389
247
142 Very High
Bulk Waste-Curbside and Incineration, Composting and Recycling Scenario
1,103
585
518
459
251
208 Very High
Current Situation
315
0
315
186
0
186 Very Low

142
Table 5.20 Continued
Solid Waste Management System
Social Indicators Environmental Indicators
Health Costs
Public Acceptance
Potential Agricultural
Land Reclamation
Air Pollution
Greenhouse Gases
Emissions Land
Degradation
Loss of Aesthetic
Value Drop off-Buy Back Scenario Minimal Very Low Very High High High Low IntermediateBulk Waste Drop off and landfill Scenario Minimal Low Low High Moderate Intermediate Low Bulk Waste Drop off and Treatment Scenario Minimal Low Very High High High Low Intermediate Separation-Curbside and Waste Treatment Scenario Minimal High Very High Intermediate High Low Intermediate Bulk Waste-Curbside and Landfill Scenario Minimal Very High Low Intermediate Moderate Intermediate LowBulk Waste-Curbside and Waste Treatment Scenario Minimal Very High Very High Intermediate High Low Intermediate Bulk Waste-Curbside and Incineration, Composting and Recycling Scenario Minimal Very High High High High Low Intermediate Current Situation 909 Very Low Very Low Very High Very High Very High High
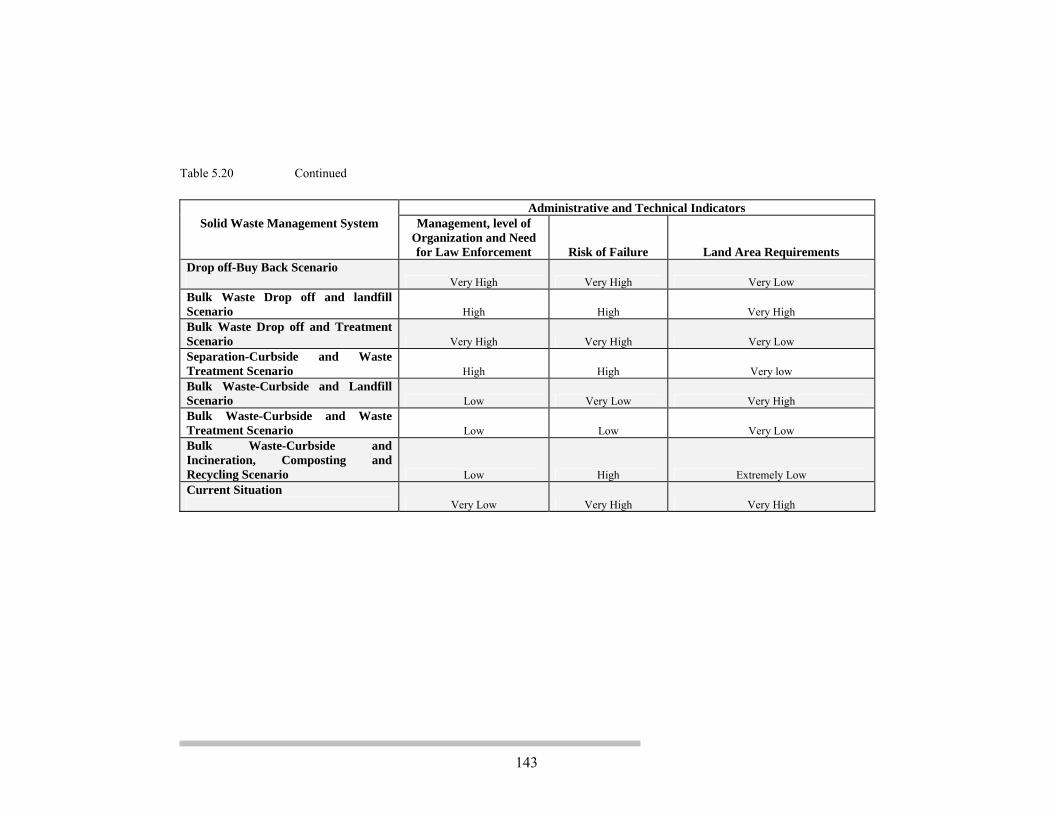
143
Table 5.20 Continued
Solid Waste Management System
Administrative and Technical Indicators Management, level of
Organization and Need for Law Enforcement Risk of Failure Land Area Requirements
Drop off-Buy Back Scenario Very High Very High Very Low Bulk Waste Drop off and landfill Scenario High High Very High Bulk Waste Drop off and Treatment Scenario Very High Very High Very Low Separation-Curbside and Waste Treatment Scenario High High Very lowBulk Waste-Curbside and Landfill Scenario Low Very Low Very High Bulk Waste-Curbside and Waste Treatment Scenario Low Low Very Low Bulk Waste-Curbside and Incineration, Composting and Recycling Scenario Low High Extremely Low Current Situation Very Low Very High Very High

144
5.1.3.4 Separation-Curbside and Waste Treatment Scenario In this scenario, the generated solid waste is separated by citizens at source and collected in the corresponding waste containers at curbside. It does not imply transporting the generated waste by citizens to transfer stations which is considered an advantage over the three previous scenarios. However, it still requires intensive awareness campaigns and law enforcement mechanism to induce, monitor, and regulate the separation of domestic solid waste at source. As regards to the associated economic costs, the proposed waste management system under this scenario entails less cost as compared to the third scenario. This is because the separation of the generated solid waste is carried out by citizens and not in the transfer stations. Nevertheless, the cost of transporting the separated solid waste by refuse vehicles to transfer stations is higher. Furthermore, there are several advantages associated with the proposed solid waste management system including:
• Less land requirements as landfill sites are only 15-20% in area as compared with landfill sites designed to receive the total volume of generated waste;
• Risks of failure are less than those anticipated for the drop-off buy-back scenario;
• Lower risk of groundwater aquifers pollution as it is much easier to manage and line smaller landfills;
• Production of cheap compost that can be used in agricultural land reclamation; and
• High macroeconomic effects as the recycling of glass, metals and paper would reduce the quantities of these items imported from other countries thus decreasing the imports/exports budget deficit.
5.1.3.5 Bulk Waste-Curbside and Landfill Scenario In this scenario, the generated bulk solid waste is collected by refuse vehicles and transported directly to the landfill sites. In comparison with the other proposed scenarios, it requires the least management efforts and has the lowest risk of failure. In addition, the economic costs for implementing this scenario are the lowest for the West Bank and Gaza Strip, but still it does not return any profit as composting and recycling are excluded from the management system. It also has the disadvantage of very high land area requirements because the implemented landfills will receive the entire volume of generated bulk waste. The bulk waste-curbside and landfill scenario is recommended in the PES and NEAP as the most appropriate solid waste management system to be implemented in the West Bank and Gaza Strip. However, it would more convenient to establish

145
compaction and non-compaction transfer stations in order to reduce the cost of solid waste transport from localities to the landfill sites, relatively reduce the volume of waste to be land filled, and to increase the lifetime of the landfills. 5.1.3.6 Bulk Waste-Curbside and Waste Treatment Scenario This scenario differs from the separation-curbside and waste treatment scenario in that the generated waste is collected by refuse vehicles in bulk at curbside and then separated at the transfer stations. This has several advantages, these are: a significant reduction in the cost of transporting the collected solid waste to transfer stations as compared to aforementioned scenario; (2) no awareness campaigns are required; and (3) law enforcement is not a critical factor. However, the separation of waste at the transfer stations is considered a disadvantage as it entails additional costs for machinery and labor among others. Overall, this scenario would be viewed as the most practical and possible scenario for waste collection, separation and recycling. It is recommended to be implemented in the districts where land reclamation and preservation is urgently needed, such as the districts of Jenin, Bethlehem and Hebron. Moreover, recycling should not be attempted until 2010, but buy back centers for trading raw recyclable materials should be established in parallel with composting facilities. 5.1.3.7 Bulk Waste-Curbside and Incineration, Composting and Recycling Scenario In this scenario, the incineration option is considered along with the other solid waste processing methods to be implemented in the Gaza Strip only. This increases the economic costs of the management system because of the incinerator, but it reduces the volume of solid waste that ends up in landfills, thus conserving significant areas of land from being used as landfill sites. It is highly recommended to consider this scenario for the Gaza Strip, where the existing landfills are devouring significant areas of scarce open spaces.

146
5.2 Evaluation of Options for Wastewater Management Wastewater management options range from the management practices that are currently applied by the municipal and rural councils in the West Bank and Gaza Strip, to the introduction of comprehensive schemes comprising centralized and decentralized wastewater management systems. On one hand, the existing practices for managing domestic wastewater are limited to the collection of the generated wastewater by sewage networks and/or cesspits; treatment of small volumes of the collected wastewater; and final discharge into the sea and open areas including wadis where water streams flow, agricultural lands, and dumping sites. Wastewater treatment is taking place in Al Bireh treatment plant, the only functioning plant in the West Bank, and in Gaza, Rafah and North Gaza plants that are located in the Gaza Strip but are not operating properly. None of the wastewater treatment plants has associated treated wastewater reuse projects. On the other hand, environmentally sound wastewater management systems that entail managing wastewater at all stages of collection, treatment and reuse are introduced. In the West Bank, the centralized and decentralized wastewater management systems are considered for the urban and rural areas, respectively. The former system implies collecting the wastewater generated in the whole urban area through conventional gravity sewers, treating it in a centralized treatment plant and reusing it for agricultural irrigation purposes. Two reuse types are considered: the restricted irrigation reuse that refers to the irrigation of fodder, fiber, seed crops, pasture land and areas with restricted public access; and the unrestricted irrigation reuse that refers to the irrigation of food crops commercially processed, foods eaten raw, orchards and vineyards. These reuse types require that the effluent standard for the Biological Oxygen Demand (BOD) and Suspended Solids (SS) meet 30 mg/l, except for the Fecal Coliforms, the effluent standard should meet 200 per 100 ml and 23 per 100 ml for the restricted and unrestricted irrigation reuses, respectively. The quality requirements can be achieved by secondary treatment and disinfection to generate wastewater suitable for restricted irrigation reuse, and by secondary treatment, tertiary filtration and disinfection to generate wastewater suitable for unrestricted irrigation reuse (see Figure 5.10). Various secondary treatment and disinfection technologies can be applied to meet the quality requirements. As regards to the secondary treatment, the activated sludge, extended aeration, trickling filters, and natural and aerated lagoons are investigated. Wastewater disinfection can be achieved by chlorine, ozone or ultraviolet disinfection systems. The other decentralized management system implies collecting, treating and reusing wastewater generated from clusters of houses in rural areas. Each cluster includes 17 houses with a population of 100 persons to be served by small

147
diameter gravity sewers collecting the generated wastewater; a secondary wastewater treatment plant; and a simple storage reservoir with 25 days of detention time for collecting and storing the treated effluent prior reuse for restricted agricultural irrigation (see Figure 5.11). Several secondary treatment processes that adapt to small communities are investigated including trickling filters, rotating biological contactors (RBC) and upflow sludge blanket filtration process. In the Gaza Strip, the centralized wastewater management system is considered to serve both the urban and rural areas, taking into account the two wastewater reuse types that were considered for the urban areas of the West Bank. However, the investigated secondary treatment technologies for the Gaza Strip are the conventional activated sludge and extended aeration in order to meet the required treatment level of 10 mg/l, 15 mg/l and 10 mg/l for the Biological Oxygen Demand (BOD), Suspended Solids (SS) and Nitrates, respectively. A comprehensive assessment will be presented which includes the economic, social and environmental costs and benefits associated with the abovementioned options for managing wastewater in the West Bank and Gaza Strip.
Figure 5.10 Centralized Wastewater Management Systems for the Urban Areas of the West Bank

148
Figure 5.11 Decentralized Cluster Wastewater Management Systems for the Rural Areas of the West Bank 5.2.1 Cost Benefit Analysis of the Current Wastewater Management System 5.2.1.1 Economic Valuation The full cost accounting method was used to valuate the direct economic costs associated with the existing wastewater management system including: the construction cost of the existing sewage networks; the investment and running costs of the existing wastewater treatment plants; the construction cost of cesspits to serve the increasing population; the cost of using vacuum tankers to empty the full cesspits; the purchase cost of new vacuum tankers; and the depreciation cost of tankers. Data relevant to these costs was collected from the municipal and rural councils using questionnaires and through semi-structured interviews. The projected full economic costs for the next 20 years were estimated at 555 million USD and 348 million USD in the West Bank and Gaza Strip, respectively (see Table 5.21).
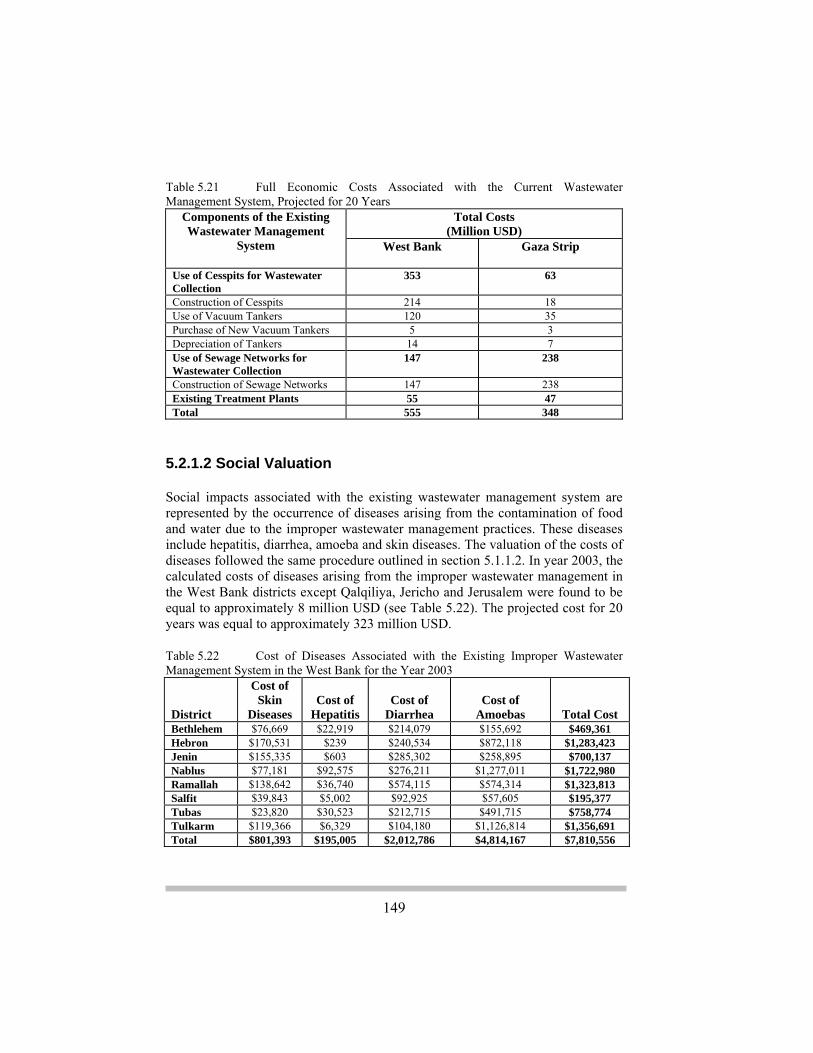
149
Table 5.21 Full Economic Costs Associated with the Current Wastewater Management System, Projected for 20 Years
Components of the Existing Wastewater Management
System
Total Costs (Million USD)
West Bank
Gaza Strip
Use of Cesspits for Wastewater Collection
353 63
Construction of Cesspits 214 18 Use of Vacuum Tankers 120 35 Purchase of New Vacuum Tankers 5 3 Depreciation of Tankers 14 7 Use of Sewage Networks for Wastewater Collection
147 238
Construction of Sewage Networks 147 238 Existing Treatment Plants 55 47 Total 555 348
5.2.1.2 Social Valuation Social impacts associated with the existing wastewater management system are represented by the occurrence of diseases arising from the contamination of food and water due to the improper wastewater management practices. These diseases include hepatitis, diarrhea, amoeba and skin diseases. The valuation of the costs of diseases followed the same procedure outlined in section 5.1.1.2. In year 2003, the calculated costs of diseases arising from the improper wastewater management in the West Bank districts except Qalqiliya, Jericho and Jerusalem were found to be equal to approximately 8 million USD (see Table 5.22). The projected cost for 20 years was equal to approximately 323 million USD. Table 5.22 Cost of Diseases Associated with the Existing Improper Wastewater Management System in the West Bank for the Year 2003
District
Cost of Skin
Diseases Cost of
Hepatitis Cost of
Diarrhea Cost of
Amoebas Total Cost Bethlehem $76,669 $22,919 $214,079 $155,692 $469,361 Hebron $170,531 $239 $240,534 $872,118 $1,283,423 Jenin $155,335 $603 $285,302 $258,895 $700,137 Nablus $77,181 $92,575 $276,211 $1,277,011 $1,722,980 Ramallah $138,642 $36,740 $574,115 $574,314 $1,323,813 Salfit $39,843 $5,002 $92,925 $57,605 $195,377 Tubas $23,820 $30,523 $212,715 $491,715 $758,774 Tulkarm $119,366 $6,329 $104,180 $1,126,814 $1,356,691 Total $801,393 $195,005 $2,012,786 $4,814,167 $7,810,556
150
5.2.1.3 Environmental Valuation The improper management of wastewater has contributed to the deterioration of groundwater quality, air pollution, landscape degradation and aesthetic distortion of the visual environment. The impacts on groundwater and air quality were valuated as described in the next sections. The landscape degradation, and the loss of recreational and aesthetic values intervened with the improper wastewater management were valuated along with those intervened with the improper solid waste management as was detailed in sections 5.1.1.3.1 and 5.1.1.3.2, respectively. 5.2.1.3.1 Groundwater Pollution The combined impacts of the open discharge of untreated wastewater into the environment and the non-sanitary disposal of solid waste in the exiting dumping sites on groundwater quality was only evaluated for the West Bank Aquifer due to lack of data required to develop hydrological models for the Gaza Strip Aquifers. The evaluation was carried out using two simulation models developed for the Western and Eastern Basins of the Aquifer. The models were built with the Processing Modflow for Windows (PMWIN), which is a simulation system for modeling groundwater flow and pollutant transport processes using the modular three-dimensional finite-difference groundwater model (MODFLOW); the particle tracking model (PMPATH); and the solute transport model (MT3D). The Aquifer was modeled as a two-layer system with the assumption that there is no hydraulic contact between the two layers (Guttman, 2000). It was represented in the two models as a multiple rectangular cell system defined by a grid of 5*5 km2 cells arranged in 30 rows by 11 columns for the Western Basin and 30 rows by 7 columns for the Eastern Basin. The two simulation models were run using MODFLOW under steady flow conditions to obtain the groundwater flow field. The open dumping sites and wastewater discharge points were considered as point sources of pollution over the groundwater basins. Accordingly, the volume of leachate or wastewater was accounted for when calculation the volume of recharge on the cells where the point sources of pollution exist. This was followed by running the MT3D in order to simulate the spread of pollutant in the saturated zone of the Aquifer. Chloride was used as the pollutant and its concentration in the generated leachate or wastewater was obtained from the results of the laboratory analysis that was conducted for leachate samples collected from Dura sanitary landfill in the Hebron District (see Table 5.23) and for wastewater samples collected from the wastewater streams (see Table 5.24). The samples were collected in October 2003 and analyzed at the Center for Environmental & Occupational Health Sciences in BirZeit University. Values of the chloride concentrations in the groundwater were

151
extracted for each year over a time period of 20 years. The extracted values were compared to the standards set by the United States Environmental Protection Agency (USEPA) for drinking water which recommends an upper limit for chloride concentrations of 250 mg/L. When the chloride concentration exceeds the set criteria in a cell, the volume of water being withdrawn from wells for domestic purposes is considered to be a lost potable water resource. The cost of the lost potable water volumes was calculated by multiplying the lost volumes by the cost of each cubic meter of potable water which is estimated at 0.4 USD. Accordingly, the total cost of losing groundwater resources used for domestic purposes within the period from year 2005 to year 2023 would amount to 176 million USD. However, this water can still be utilized for agricultural purposes with an economic value approximated at 52 million USD. Consequently, the net loss is equal to 124 million USD.
The full implementation of the alternative solid waste and wastewater management options would prevent any groundwater pollution and therefore all the costs of groundwater pollution arising from the existing waste management practices are considered averted costs.
Table 5.24 Wastewater Analysis Results
Parameter
Wastewater Collection Sites in the West Bank
Nablus District Bethlehem
District Hebron District
Ramallah District
Wadi Zimar
Wadi El Sajour Wadi En Nar
Wadi As Samen
Wadi Betunia
BOD (ppm) 570 739 400 624 265 TSS (ppm) 1,285 1,408 537 1,370 321 Chloride (ppm) 3,019 261 223 575 653 Nitrate (ppm) 0.71 0.61 1.74 2.27 2.80 Nickel (ppm) 0.000 0.026 0.027 0.041 0.000 Cadmium (ppm) 0.022 0.026 0.029 0.030 0.015 Chromium (ppm) 0.011 0.042 0.014 1.278 0.018 Lead (ppm) 0.000 0.000 0.000 0.000 0.000 Zinc (ppm) 0.425 0.595 0.515 0.339 0.410 pH 6.56 7.03 7.18 7.82 7.53
Table 5.23 Leachate Analysis Results
Parameter
Dura Landfill BOD (ppm) 315 TSS (ppm) 3,392 Chloride (ppm) 35,040 Nitrate (ppm) 132 Nickel (ppm) 0.144 Cadmium (ppm) 0.287 Chromium (ppm) 0.008 Lead (ppm) 0.049 Zinc (ppm) 0.485pH 8.145
152
5.2.1.3.2 Air Pollution The transport of wastewater collected in vacuum tankers to the open discharge points, the burning of fuel at wastewater treatment plants and the aerobic and anaerobic degradation of organic material in wastewater are considered potential air pollution sources intervened with the existing wastewater management system. However, the major pollution source is the burning of diesel fuel in vacuum tankers that produces emissions of acidifying and greenhouse gases. The acidifying gases include sulfur dioxide SO2 and nitrogen oxides NOx, while the greenhouse gases include carbon dioxide CO2, methane CH4 and nitrous oxide N2O. The other two air pollution sources were neglected as there are only few operational wastewater treatment plants in the West Bank and Gaza Strip, in which the source of energy utilized, is electrical and is generated in Israel, in addition to the fact that the gases emitted from the bio-degradation of wastewater are negligible. The quantities of air emissions were calculated using emission factors for each of the acidifying and greenhouse gases emitted from the diesel vacuum tankers during their travel from localities to open discharge areas located outside the localities. Each emission factor is expressed as kilograms of the emitted gas per 1 kilometer distance traveled by vehicle, except for the SO2 emission factor that is expressed as kilograms per 1 cubic meter of fuel consumed. The emission factors for SO2 and NOx are 5.178 kg/m3 and 1.073*10-2 kg/km, respectively (United States Environmental Protection Agency, 2000 c). The emission factors for the CO2, CH4 and N2O are 7.644*10-1 kg/km, 4.200*10-5 kg/km and 2.240*10-5 kg/km, respectively (Environment Canada, 2001). The calculated quantities of acidifying and greenhouse gases emissions were converted into SO2-equivalents (SO2e) and CO2-equivalents (CO2e), respectively in order to express such quantities in monetary values. The quantities of acidifying and greenhouse gases to be emitted by year 2023 in the West Bank were projected at 201,421 kg of SO2e and 17,438,947 kg of CO2e, respectively. In the Gaza Strip, the projected quantities of emitted acidifying and greenhouse gases were 52,487 kg of SO2e and 4,538,433 kg of CO2e, respectively. Monetary values were only attached to the equivalent values of acidifying gases emissions as acidifying gases have a direct adverse impact on human health and the environment, whereas greenhouse gases contribute to the process of global warming, making it complex to valuate the price of 1 kg of CO2e emitted as a result of diesel burning in vacuum tankers. The total quantities of acidifying gases to be emitted within the period from year 2003 to year 2023 in the West Bank and Gaza Strip were projected at 2,879 tons of SO2e and 750 tons of SO2e, respectively. The total cost of air pollution arising from the acidifying gases emitted during the transport of wastewater collected in vacuum tankers to the open

153
discharge points was projected for the next 20 years (until year 2023) at 239 thousand USD in the West Bank and 62 thousand USD in the Gaza Strip. 5.2.2 Cost Benefit Analysis of the Centralized Wastewater Management System Environmentally sound management of wastewater in the urban areas of the West Bank and in the Gaza Strip districts will be achieved by applying the centralized management approach. The urban areas of the West Bank were classified into five categories based on population in order to prioritize the implementation of the centralized wastewater collection, treatment and reuse systems in such areas. The classification categories are:
• The first category: population ≥ 100,000 • The second category: 20,000≤ population <100,000 • The third category: 16,750≤ population <20,000 • The forth category: 6,600≤ population <16,750 • The fifth category: population <6,600
Accordingly, the implementation of the centralized system for the urban localities that are classified within the first category was given the first priority and would be initiated in year 2004, whereas the other localities that are classified within the second, third, forth and fifth categories were given the second, third, forth and fifth priorities, respectively. The implementation process would be initiated in years 2005, 2006, 2007 and 2010, respectively. For the Gaza Strip, the implementation of this wastewater management system would be initiated in year 2005 for Gaza and North Gaza districts where sewage networks exist and serve a high percentage of the population. For the other districts, it was proposed to implement two centralized systems in year 2007: the first to serve the districts of Rafah and Khan Yunis and the second to serve Deir Al Balah district. 5.2.2.1 Economic Valuation The implementation of a centralized wastewater management system entails direct economic costs and benefits that were valuated by applying the full cost accounting method. Economic costs include the investment costs necessary to install the various components of the system and the annual costs to operate and maintain them. Economic benefits include the benefits resulting from the reuse of treated wastewater for restricted or unrestricted agricultural irrigation.

154
5.2.2.1.1 Valuation of Economic Costs The full economic costs accounting for the collection of wastewater by means of gravity sewer systems; the treatment of collected wastewater by utilizing secondary treatment processes, tertiary filtration and disinfection; the storage of treated wastewater; and the transport of treated wastewater to the targeted reuse sites through transmission lines were calculated and projected until year 2023. The total projected investment costs and the operation and maintenance (O&M) costs for each of the abovementioned components of the centralized wastewater management system are outlined in Table 5.25 for the West Bank and in Table 5.26 for the Gaza Strip. The results of the valuation of economic costs, the utilized cost rates and equations as well as the assumptions made are described for each component as follows:
• Conventional Gravity Sewer System Conventional gravity sewer systems should be installed to serve the unconnected population to the existing collection system in the urban areas of the West Bank and the districts of Gaza Strip in order to achieve 100% coverage. The total installation cost for a conventional gravity sewer system includes the installation costs for lateral pipes that transport wastewater from houses to the collection main sewers; the installation costs for collection sewers that carry the wastewater to the interceptor sewers; and the installation costs for interceptor sewers that carry wastewater to the treatment system. The cost of installing one meter of lateral pipe, collection sewer and interceptor pipe was estimated at $56, $101 and $101 in 2003 USD dollars, respectively. Raw data and equations for calculating the installation costs were obtained from a study prepared by the US Environmental Protection Agency (EPA) (United States Environmental Protection Agency, 1997). Therefore, correction factors were used to account for the regional differences and the costs were modified to the 2003 US dollars using an inflation rate of 3% as the raw data reflect costs from different years. The required pipes lengths were estimated at 2 m per capita for lateral pipes and 5,000 m per served urban locality or district for interceptor pipes based on data obtained from the EPA study (United States Environmental Protection Agency, 1997). For the collection sewers, the required per capita length is dependent on the population density in the served area and was calculated using an equation presented in the abovementioned study and was found to be equal to 2 m.
The total costs for installing conventional gravity sewer systems in the urban areas of the West Bank and the districts of Gaza Strip to serve the unconnected population to the existing sewage networks were estimated at 253 million USD and 196 million USD, respectively. The breakdown of costs according to the implementation year is outlined in Table 5.25 and Table 5.26.

155
Table 5.25 Total Investment and O&M Costs for Centralized Wastewater Management Systems Implemented in the Urban Areas of the West Bank
System Component
Investment Costs (Million USD)
Total O&M Costs Until Year 2023
(Million USD) Yea
r 20
04
Yea
r 20
05
Yea
r 20
06
Yea
r 20
07
Yea
r 20
10
Total Costs
Number of Systems
2
9 5 19 10 Conventional Gravity Sewer Systems 19 57 42 101 33 253 Secondary Wastewater Treatment Plants: The total costs until year 2023 range between 169 and 330 million USD Conventional Activated Sludge
60
65 41 107 28 302
28 Extended Aeration 55 59 37 97 25 274 40 Trickling Filters 47 51 32 84 22 236 17 Aerated Lagoons 34 37 23 61 16 171 16 Natural Lagoons 31 34 22 56 15 158 11 Tertiary Filtration Plants 2
2 1 4 1 10 11
Disinfection Systems: The total costs until year 2023 range between 14 and 60 million USD Chlorination 4 9 5 18 9 46 14 Ozone 3 4 2 7 3 19 4 UV 2 2 1 4 1 11 3 Storage System: The total costs until year 2023 range between 1 and 21 million USD Settling Ponds 0.32 0.24 0.15 0.36 0.08 1
Seasonal Reservoirs 6 4 3 6 1
21
Transmission Lines
12 48 15 90 58 224

156
Table 5.26 Total Investment and O&M Costs for Centralized Wastewater Management Systems Implemented in the Gaza Strip
System Component
Investment Costs (Million USD)
Total O&M Costs Until Year
2023 (Million USD)
Y
ear
2005
Yea
r 20
07
Total Costs Number of Systems 2 2 Conventional Gravity Sewer Systems 41 155 196 Secondary Wastewater Treatment PlantsConventional Activated Sludge 125 116 241 15 Extended Aeration
113
105 218 21 Tertiary Filtration Plants
4 4 8 2
Disinfection Systems Chlorination 11 10 21 9 Ozone 8 8 16 5 UV 4 4 8 2 Storage System Settling Ponds 1 1 2 Seasonal Reservoirs 19 17 36 Transmission Lines 7 5 12
• Wastewater Treatment System The number of centralized treatment systems required is 2, 9, 5, 19 and 10 plants for the urban areas of the West Bank that were classified in the first, second, third, forth and fifth categories, respectively. For the Gaza Strip, the number of treatment systems is 2 in both the first and second categories. Each treatment system consists of a secondary wastewater treatment plant, a tertiary filtration plant if required and a disinfection system. 1. Secondary Wastewater Treatment Plants Secondary wastewater treatment can be achieved by utilizing various processes including conventional activated sludge; extended aeration; trickling filters; natural lagoons; or aerated lagoons. An order-of-magnitude estimate of the investment cost and the annual O&M costs for a plant applying one of the abovementioned processes was obtained from the relevant costs of a similar plant with a different capacity by using the following equations:
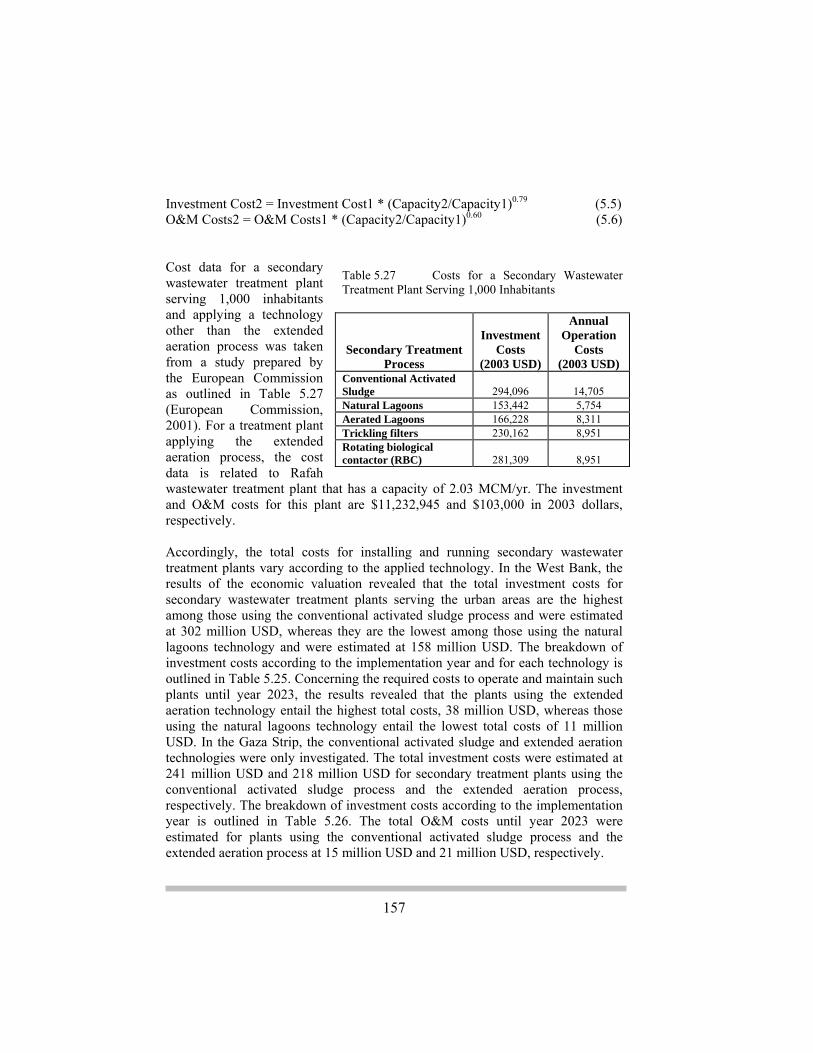
157
Investment Cost2 = Investment Cost1 * (Capacity2/Capacity1)0.79 (5.5) O&M Costs2 = O&M Costs1 * (Capacity2/Capacity1)0.60 (5.6) Cost data for a secondary wastewater treatment plant serving 1,000 inhabitants and applying a technology other than the extended aeration process was taken from a study prepared by the European Commission as outlined in Table 5.27 (European Commission, 2001). For a treatment plant applying the extended aeration process, the cost data is related to Rafah wastewater treatment plant that has a capacity of 2.03 MCM/yr. The investment and O&M costs for this plant are $11,232,945 and $103,000 in 2003 dollars, respectively. Accordingly, the total costs for installing and running secondary wastewater treatment plants vary according to the applied technology. In the West Bank, the results of the economic valuation revealed that the total investment costs for secondary wastewater treatment plants serving the urban areas are the highest among those using the conventional activated sludge process and were estimated at 302 million USD, whereas they are the lowest among those using the natural lagoons technology and were estimated at 158 million USD. The breakdown of investment costs according to the implementation year and for each technology is outlined in Table 5.25. Concerning the required costs to operate and maintain such plants until year 2023, the results revealed that the plants using the extended aeration technology entail the highest total costs, 38 million USD, whereas those using the natural lagoons technology entail the lowest total costs of 11 million USD. In the Gaza Strip, the conventional activated sludge and extended aeration technologies were only investigated. The total investment costs were estimated at 241 million USD and 218 million USD for secondary treatment plants using the conventional activated sludge process and the extended aeration process, respectively. The breakdown of investment costs according to the implementation year is outlined in Table 5.26. The total O&M costs until year 2023 were estimated for plants using the conventional activated sludge process and the extended aeration process at 15 million USD and 21 million USD, respectively.
Table 5.27 Costs for a Secondary Wastewater Treatment Plant Serving 1,000 Inhabitants
Secondary Treatment Process
Investment Costs
(2003 USD)
Annual Operation
Costs (2003 USD)
Conventional Activated Sludge 294,096 14,705 Natural Lagoons 153,442 5,754 Aerated Lagoons 166,228 8,311 Trickling filters 230,162 8,951 Rotating biological contactor (RBC) 281,309 8,951

158
2. Tertiary Filtration Plants The utilization of multimedia tertiary treatment plants in the centralized wastewater treatment system to meet the quality requirements for wastewater reuse in unrestricted agricultural irrigation, results in additional costs. The investment and O&M costs for these plants were estimated using cost curves developed by the US Environmental Protection Agency (EPA) based on vendor supplied quotes (United States Environmental Protection Agency, 1999 d). The capital and running costs curves are presented in the following equations: Ln (Y1) = 12.265 + 0.658 ln(X) + 0.036 ln(X)2 (5.7) Ln (Y2) = 10.851 + 0.168 ln(X) + 0.018 ln(X)2 (5.8) Where: Y1: investment cost (1992 US dollars) Y2: O&M costs (1992 US dollars) X: flow rate (million gallons per day) The investment and O&M costs calculated using the above equations were projected for the specified implementation and operation years using an inflation rate of 3%. The total investment and O&M costs for tertiary treatment plants serving the urban areas of the West Bank were estimated at 10 million USD and 11 million USD, respectively. In the Gaza Strip, the total investment and O&M costs were estimated at 8 million USD and 2 million USD, respectively. The breakdown of investment costs according to the implementation year is outlined in Table 5.25 and Table 5.26. 3. Disinfection Systems Wastewater disinfection can be achieved using various disinfectants including chlorine, ultraviolet light or ozone. The valuation of the investment and O&M costs for a disinfection system varies according to the system type as follows:
Chlorine Disinfection System: A chlorine disinfection system is composed of chlorination and dechlorination subsystems. The investment and O&M costs for a chlorine disinfection system were estimated using cost curves developed based on the cost estimates that were prepared by the American Water Environment Research Foundation in 1995 (United States Environmental Protection Agency, 1999 a). The cost curves were developed by applying the curve estimation procedure that is supported by the Statistical Package for Social Sciences (SPSS) and are presented in the following equations:

159
Y1 = 141966.0X - 502.4X2 + 250042.7 (5.9) Y2 = 47943.7X - 296.8X2 + 308402.9 (5.10) Y3 = 26228.6X - 123.4X2 + 40639.4 (5.11) Where: Y1: investment cost for a chlorination subsystem (1995 US dollars) Y2: investment cost for a dechlorination subsystem (1995 US dollars) Y3: O&M costs for a chlorine disinfection system (1995 US dollars) X: average dry weather flow (MCM/yr)
Ultraviolet Disinfection System: An order-of-magnitude estimate of the investment cost and the annual O&M costs for an ultraviolet (UV) disinfection system was obtained from the relevant costs of a similar system with a different capacity by using the following equations: Investment Cost2 = Investment Cost1 * (Capacity2/Capacity1)0.677 (5.12) O&M Costs2 = O&M Costs1 * (Capacity2/Capacity1)0.69 (5.13) The typical capital and O&M costs that are associated with a UV disinfection system at a flow of 1.38 MCM/yr were estimated at $244,000 and $19,190 (in 1995 dollars), respectively (United States Environmental Protection Agency, 1999 c). Ozone Disinfection System: The investment and O&M costs for an ozone disinfection system were estimated using cost curves developed based on some typical cost estimates at various design flows (United States Environmental Protection Agency, 1999 a). The cost curves were developed by applying the curve estimation procedure that is supported by the SPSS and are presented in the following equations: Y1 = 133036.7X + 142.1X2 + 144941.0 (5.14) Y2 = 13646.6X - 9.5X2 + 3757.7 (5.15) Where: Y1: investment cost (1991 dollars) Y2: O&M costs (1991 dollars) X: wastewater flow (MCM/yr) The investment and O&M costs for each disinfection system calculated using the above equations were projected for the specified implementation and operation years using an inflation rate of 3%. The results of the economic valuation for each system revealed that the ultraviolet disinfection system is more cost effective than either chlorine or ozone disinfection systems. In the West Bank, the total investment and O&M costs for UV disinfection systems were estimated at 11

160
million USD and 3 million USD, respectively. In the Gaza Strip, the total investment and O&M costs were estimated at 8 million USD and 2 million USD, respectively. Refer to Table 5.25 and Table 5.26 for the total investment and O&M costs for the other systems.
• Wastewater Storage The treated wastewater flowing out of the centralized treatment system will be stored either in a seasonal reservoir for 6 months or in a settling pond for 10 days before being transferred to reuse sites. The storage options were evaluated by calculating the associated investment costs. In accordance with the data provided by the Palestinian Water Authority (PWA), the investment cost for a seasonal reservoir is $0.47 (2003 dollars) per 1 cubic meter of wastewater entering the centralized treatment system yearly (Palestinian Water Authority, 1999 b). The investment cost for a settling pond was estimated at 5.6% of the investment cost for a seasonal reservoir. Accordingly, the projected total investment costs for seasonal reservoirs and settling ponds used to store the treated wastewater flowing out of the centralized treatment systems serving the urban areas of the West Bank were estimated at 21 million USD and 1 million USD, respectively. For the Gaza Strip, the total projected investment costs for seasonal reservoirs and settling ponds were estimated at 37 million USD and 2 million USD, respectively. The breakdown of the investment costs for each implementation year is presented in Table 5.25 and Table 5.26.
• Wastewater Transport to Reuse Sites The wastewater treated in the urban areas of Tulkarm, Qalqiliya and Salfit districts will be reused within the same districts, whereas that treated in the urban areas of Jenin, Nablus, Tubas, Ramallah and Jerusalem districts will be transferred to the Jordan Valley. Concerning the wastewater treated in the urban areas of Bethlehem and Hebron districts, it will be transferred to the Eastern Slopes. For the Gaza strip, the excess of treated wastewater in the northern and central districts will be transferred to Khan Yunis and Rafah districts in order to expand the area of irrigated agricultural lands. These transfer options resulted in additional investment costs represented by the installation costs of transmission lines. The cost of installing one meter of a transmission line from the district to the reuse site outside the district is $202 (2003 USD dollars) based on the PWA data (Palestinian Water Authority, 1999 b). If the transmission lines will be installed within the same district, the investment cost for 1 m is $101.1 (2003 US dollars). The lengths of transmission lines required to transport the treated wastewater to the final destination for reuse were calculated using the Geographic Information System (GIS) techniques. Accordingly, the projected total costs for installing transmission lines within the West Bank and Gaza Strip were estimated at 224 million USD and 12 million USD, respectively.
161
5.2.2.1.2 Valuation of Economic Benefits The economic benefits resulting from the reuse of treated wastewater for restricted and unrestricted agricultural irrigation were calculated and projected until year 2023. For the Gaza Strip, the benefits were only calculated for the Khan Yunis and Rafah districts because it was assumed that they would receive the excess wastewater generated from the other three systems in the Strip to expand the area of irrigated lands. The results of the economic valuation of benefits that are represented by the economic value/price of the treated wastewater and the production value/market price of irrigated crops are summarized in Table 5.28 for the West Bank and Gaza Strip according to the wastewater reuse type. The utilized cost rates and assumptions made when valuating these economic benefits are described as follows:
• Economic Value of Treated Wastewater The treated wastewater has an economic value/price that would generate revenues when reused for irrigation purposes. The economic value of one cubic meter of treated wastewater reused for irrigation purposes is $0.20 (2003 USD dollars) based on the PWA data (Palestinian Water Authority, 1999 b). This value was projected for each year using an inflation rate of 3%. The resulting annual benefits were calculated by multiplying the economic value per cubic meter by the total volume of treated wastewater.
• Production Value of Irrigated Crops
Wastewater reuse will improve the irrigated agriculture sector by increasing the area of irrigated agricultural lands and consequently the production of more fodder and seed crops or fruit trees depending on the reuse type. These improvements were expressed in monetary values by calculating the increase in the production value/market price of irrigated crops as it represents the profits that would be gained from selling the crops. In year 2000, the production value of each dunum of land cultivated with fodder and seed crops was $77 and 62$ in the West Bank and Gaza Strip, respectively (Palestinian Central Bureau of Statistics, 2002). For lands cultivated with fruit trees, the production value in year 2000 was $242 and 452$ in the West Bank and Gaza Strip, respectively (Palestinian Central Bureau of Statistics, 2002). These values were projected for each year using an inflation rate of 3%. The increase in the production value of the two types of irrigated crops was calculated by multiplying the production value of 1 dunum cultivated with each type by the expected total dunums of irrigated land. The expected total dunums of irrigated agricultural land were calculated by dividing the total volume of wastewater reused for irrigation purposes by the volume of water required to

162
irrigate 1 dunum of land. Each dunum of agricultural land cultivated with fodder and seed crops requires 569 CM of water per year (Palestinian Water Authority, 1999 a), whereas that cultivated with fruit trees requires 1,590 CM of water per year (Ministry of Agriculture et al, 2001). Table 5.28 Total Projected Economic Benefits Associated With the Reuse of Wastewater Treated in the Urban Areas of the West Bank and the Districts of Gaza Strip Until Year 2023
Wastewater Reuse Type
Economic Benefits of
Treated Wastewater
(Million USD)
Economic Benefits of
Irrigated Crops
(Million USD)
Total Economic Benefits
(Million USD)
West Bank
Unrestricted Irrigation Reuse
135
112
247
Restricted Irrigation Reuse
135
100
235 Gaza Strip
Unrestricted Irrigation Reuse 248 407 655 Restricted Irrigation Reuse 248 146 394
The results of the economic valuation revealed that the reuse of wastewater for unrestricted irrigation would generate more economic benefits than the restricted irrigation reuse. The benefits resulting from the unrestricted irrigation reuse were estimated at 247 million USD and 655 million USD for the West Bank and Gaza Strip, respectively. This can be compared to the benefits generated from the restricted reuse that were estimated at 235 million USD, 394 million USD for the West Bank and Gaza Strip, respectively. 5.2.2.2 Social Valuation The implementation of an effective centralized wastewater management system would result in various social benefits. These benefits include the warding off the costs of wastewater-borne diseases spreading due to the existing wastewater management (refer to section 5.2.1.2); and the benefits associated with the reuse of treated wastewater in agricultural irrigation. The latter benefits were valuated and include the conversion of large parcels of land from rainfed agricultural into irrigated agricultural lands; and the creation of new job opportunities in the agriculture sector. The results of the valuation of these social benefits are presented in Table 5.29. The methods, assumptions and cost rates utilized in the social valuation are described as follows:

163
• Increase in Price of Agricultural Land
The reuse of wastewater for irrigation purposes will improve the irrigated agriculture sector by increasing the area of irrigated agricultural lands that worth more than the rainfed agricultural lands. These improvements were expressed in monetary values by calculating the annual increase in the land price that equals the increase in dunums of irrigated agricultural land multiplied by the price of one dunum of irrigated land. In year 2003, the price of one dunum of irrigated agricultural land was estimated at $6,091. This price was projected for the other years using an inflation rate of 3% to calculate the increase in land price until year 2023.
• Increase in Employment in the Agricultural Sector The increase in the area of irrigated agricultural lands will create more job opportunities in the agricultural sector and results in an increase in the income of farmers. The total income generated in each year was calculated by multiplying the generated income per dunum by the total dunums of irrigated agricultural land in that year. It was estimated that the income generated form cultivating one dunum of irrigated agricultural land is $193 in 2003 dollars. Table 5.29 Total Projected Social Benefits Associated With the Reuse of Wastewater Treated in the Urban Areas of the West Bank and the Districts of Gaza Strip Until Year 2023
Wastewater Reuse Type
Total Increase in Land Price
(Million USD)
Total Increase of Income
(Million USD)
Total Social Benefits
(Million USD) West Bank
Unrestricted Irrigation Reuse 201 82 283 Restricted Irrigation Reuse 561 229 790
Gaza Strip Unrestricted Irrigation Reuse 390 159 549 Restricted Irrigation Reuse 1,028 420 1,448
The results of the social valuation revealed that wastewater reuse for restricted agricultural irrigation would generate more social benefits than the unrestricted irrigation reuse. This is due to the fact that fruit trees are much more water demanding than fodder and seed crops, resulting in the cultivation of smaller areas of irrigated lands. The benefits resulting from the restricted irrigation reuse were estimated at 790 million USD and 1,448 million USD for the West Bank and Gaza Strip, respectively. This can be compared to the benefits generated from the unrestricted reuse that were estimated at 283 million USD, 549 million USD for the West Bank and Gaza Strip, respectively.
164
5.2.3 Cost Benefit Analysis of the Decentralized Wastewater Management System Environmentally sound management of wastewater in the rural areas of the West Bank will be achieved by applying the decentralized cluster management approach. The rural areas of the West Bank were classified into three categories based on population in order to prioritize the implementation of the cluster wastewater management systems in such areas. The classification categories are:
• The first category: population ≥ 5,000 • The second category: 1,000≤ population <5,000 • The third category: population <1,000
The implementation of cluster systems for the rural areas that are classified within the first category was given the first priority and would be initiated in year 2004, whereas the other areas that are classified within the second and third categories were given the second and third priorities, respectively. The implementation process would be initiated in years 2006 and 2007, respectively. The total number of clusters in each category was determined by dividing the total number of persons living in localities classified within each category by the number of persons per cluster which was estimated at 100 for a cluster of 17 houses. Accordingly, the number of clusters is 3986, 5959 and 1116 clusters for the rural areas that were classified in the first, second and third categories, respectively 5.2.3.1 Economic Valuation The implementation of decentralized cluster wastewater management systems entail direct economic costs and benefits that were valuated by applying the full cost accounting method. Economic costs include the investment costs necessary to install the various components of the system and the annual costs to operate and maintain them. Economic benefits include the benefits resulting from reusing wastewater for restricted irrigation. 5.2.3.1.1 Valuation of Economic Costs The full economic costs accounting for the collection of wastewater by means of small diameter gravity collection mains; and the treatment of collected wastewater by utilizing secondary treatment processes and storing the secondary effluent in storage reservoirs for 25 days were calculated and projected until year 2023. The total projected investment costs and the operation and maintenance (O&M) costs for each of the abovementioned components of the cluster wastewater management systems are outlined in Table 5.30. The results of the valuation of
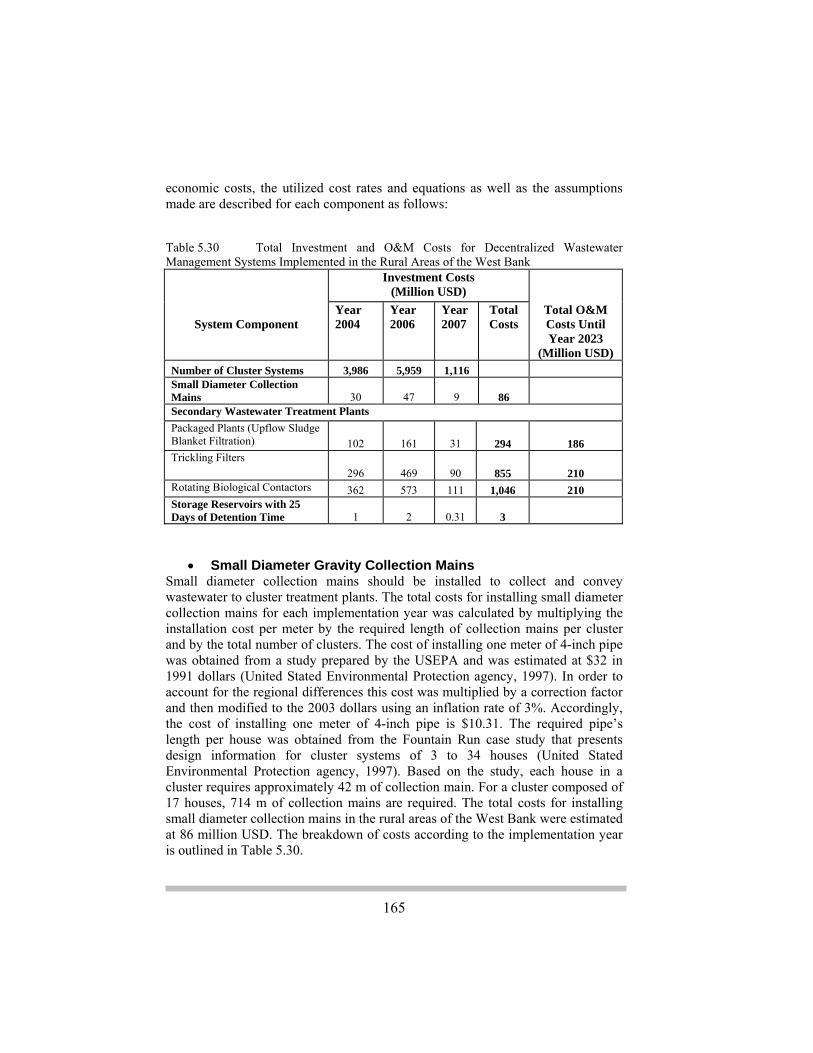
165
economic costs, the utilized cost rates and equations as well as the assumptions made are described for each component as follows: Table 5.30 Total Investment and O&M Costs for Decentralized Wastewater Management Systems Implemented in the Rural Areas of the West Bank
System Component
Investment Costs (Million USD)
Total O&M Costs Until Year 2023
(Million USD)
Year 2004
Year 2006
Year 2007
Total Costs
Number of Cluster Systems 3,986 5,959 1,116 Small Diameter Collection Mains 30 47 9 86 Secondary Wastewater Treatment Plants Packaged Plants (Upflow Sludge Blanket Filtration) 102 161 31 294 186 Trickling Filters
296 469 90 855 210 Rotating Biological Contactors 362 573 111 1,046 210 Storage Reservoirs with 25 Days of Detention Time 1 2 0.31 3
• Small Diameter Gravity Collection Mains Small diameter collection mains should be installed to collect and convey wastewater to cluster treatment plants. The total costs for installing small diameter collection mains for each implementation year was calculated by multiplying the installation cost per meter by the required length of collection mains per cluster and by the total number of clusters. The cost of installing one meter of 4-inch pipe was obtained from a study prepared by the USEPA and was estimated at $32 in 1991 dollars (United Stated Environmental Protection agency, 1997). In order to account for the regional differences this cost was multiplied by a correction factor and then modified to the 2003 dollars using an inflation rate of 3%. Accordingly, the cost of installing one meter of 4-inch pipe is $10.31. The required pipe’s length per house was obtained from the Fountain Run case study that presents design information for cluster systems of 3 to 34 houses (United Stated Environmental Protection agency, 1997). Based on the study, each house in a cluster requires approximately 42 m of collection main. For a cluster composed of 17 houses, 714 m of collection mains are required. The total costs for installing small diameter collection mains in the rural areas of the West Bank were estimated at 86 million USD. The breakdown of costs according to the implementation year is outlined in Table 5.30.

166
• Wastewater Treatment System The number of required cluster treatment systems in each implementation year equals the total number of clusters for each category as every cluster would be served by a treatment plant and a storage reservoir. 1. Secondary Wastewater Treatment Plants Secondary wastewater treatment can be achieved by utilizing various processes that adapt to small communities including trickling filters; rotating biological contactors; and upflow sludge blanket filtration process that is used in packaged treatment plants. An order-of-magnitude estimate of the investment cost and the annual O&M costs for trickling filters and rotating biological contactors was obtained from the relevant costs of a similar plant with a different capacity (refer to Table 5.27) by using equations (5.5) and (5.6). For a treatment plant applying the upflow sludge blanket filtration process, the relevant investment and O&M costs were estimated at $24,731 and $667 in 2003 dollars, respectively. The cost data is based on the data provided by ARIJ where a similar treatment plant but with a different capacity is installed. The results of the economic valuation revealed that the total investment and O&M costs for the packaged biological wastewater treatment plants are the lowest in comparison to the costs of trickling filters and rotating biological contactors. The total investment costs were estimated at 294 million USD for the packaged plants, 855 million USD for the trickling filters and 1,046 million USD for the rotating biological contactors. The breakdown of investment costs according to the implementation year and for each technology is outlined in Table 5.30. Concerning the required costs to operate and maintain the packaged plants until year 2023, they were estimated at 186 million USD, whereas those associated with the trickling filters and rotating biological contactors, they were estimated at 210 million USD. 2. Storage Reservoirs with 25 Days of Detention Time The storage of treated wastewater in simple reservoirs for 25 days is necessary to meet the quality requirements for wastewater reuse in restricted agricultural irrigation. This option was evaluated by calculating the associated investment costs based on the cost of storing one cubic meter of wastewater in a reservoir which is estimated at $0.47 (2003 dollars) (Palestinian Water Authority, 1999 b). Accordingly, the projected total investment costs for seasonal reservoirs were estimated at 3 million USD. Refer to Table 5.30 for the breakdown of costs for each implementation year.
167
5.2.3.1.2 Valuation of Economic Benefits The achieved treatment level will limit the reuse of treated wastewater for restricted agricultural irrigation. However, this will generate economic benefits represented by the economic value of the treated wastewater and the production value of irrigated fodder and seed crops. The economic valuation of such benefits applies the same procedure described in section 5.2.2.1.2 except for the fact that each dunum of agricultural land cultivated with fodder and seed crops in the rural areas of the West Bank requires 569 CM of water per year (Palestinian Water Authority, 1999 a). The projected total economic benefits of treated wastewater and irrigated crops were estimated at 142 million USD and 116 million USD, respectively. 5.2.3.2 Social Valuation The economic valuation of the social benefits generated from the restricted irrigation reuse of wastewater in the rural areas of the West Bank applies the same procedure described in section 5.2.2.2. The projected total social benefits were estimated at 852 million USD. These include the increase in land price and income that were estimated at 584 million USD and 268 million USD, respectively. 5.2.4 Synthesis of the Wastewater Management System Altering the wastewater management practices from the current system to the environmentally sound centralized and/or decentralized management systems entails much more direct economic costs. This is due to the added investment and running costs associated with the expansion of population connection to the existing sewage networks and/or the installation of small diameter gravity sewers; the full treatment of collected wastewater; and the reuse of treated wastewater for agricultural irrigation purposes. However, the effective management of wastewater will abate the impacts of the current practices on the environment and public health, thus warding off the costs of the prevailing diseases, air and groundwater pollution, landscape and aesthetic distortion of the visual environment, and landscape degradation. Furthermore, the reuse of treated wastewater for restricted and/or unrestricted irrigation will bring about economic and social benefits. The considered centralized and decentralized wastewater management systems comprise various systems to collect and treat the generated wastewater to allow its reuse for restricted or unrestricted agricultural irrigation. Wastewater treatment can be achieved by secondary treatment, disinfection and/or tertiary filtration depending on the required wastewater quality associated with each reuse type. Each treatment level can be accomplished by utilizing several technologies that

168
vary in the construction, land, operation and maintenance requirements, thus entailing different investment and O&M costs. The conducted economic valuation provided information on the economic costs attached to each treatment technology. However, the associated costs can not be considered as the decisive factor in the selection of the appropriate treatment technology as other factors must be assessed to give a total score that indicates the feasibility and applicability of each technology for a particular locality in the West Bank or Gaza Strip. These factors include land requirements, ease of construction and operation, public acceptance and the environmental risks involved. It should be noted that the assessment of the environmental risks involved in the implementation of the wastewater treatment options was not carried out in this study due to the complexity of the issue and its dependence on the location where the management system will be implemented. The information related to the behavior of the aforementioned factors/indicators under each of the investigated secondary wastewater treatment technologies, wastewater disinfection systems and the treated wastewater reuse types is summarized and discussed in the following sections. This information will enable decision makers attach weights to each factor/indicator and decide upon the most practical and economically and socially feasible option. 5.2.4.1 Secondary Wastewater Treatment Technologies For the urban and rural areas of the West Bank, the information related to the behavior of the economic, social and technical factors/indicators under each of the evaluated secondary wastewater treatment technologies is summarized in Table 5.31 and Table 5.32 respectively.

169
Table 5.31 Assessment of the Economic, Social and Technical Indicators Related to the Various Secondary Wastewater Treatment Technologies for the Urban Areas of the West Bank
Indicator Secondary Wastewater Treatment Technology
Conventional Activated
Sludge
Extended Aeration
Trickling Filters
Aerated Lagoons
Natural lagoons
Direct Costs Until Year 2023 (Million USD)
Very high
(330)
High (314)
Moderate
(253)
Low (187)
Very low
(169)
Public Acceptance
High
Very high
Moderate
Low
Very low
Land Area Requirements
Low
Low
Intermediate
Very high
High
Ease of Operation
Very difficult
Very difficult
Intermediate
Easy to operate
Very easy to
operate Ease of Construction
Difficult
Very difficult
Intermediate
Very easy
to construct
Very easy to
construct Table 5.32 Assessment of the Economic, Social and Technical Indicators Related to the Secondary Wastewater Treatment Technologies that Adapt to the Rural Areas of the West Bank
Indicator Secondary Wastewater Treatment Technology
Upflow Sludge Blanket Filtration
Trickling Filters
Rotating Biological Contactors
Direct Costs Until Year 2023 (Million USD)
Low cost (480)
Intermediate (1,065)
High cost (1,256)
Public Acceptance High Intermediate Low Land Area Requirements Low High Intermediate Ease of Operation Easy to operate Intermediate Difficult to operate Ease of Construction Easy to construct Intermediate Intermediate
In accordance with the results of economic valuation for the urban areas of the West Bank, the investment and O&M costs associated with natural and aerated lagoons are significantly lower than those associated with trickling filters, conventional activated sludge and extended aeration (see Table 5.31). In spite of the economical feasibility of these technologies, they are not the most appropriate technologies to be applied in the urban areas of the West Bank when considering their land requirements which are higher than other technologies. Land requirement is considered a limiting factor in the West Bank since the majority of the open spaces are located within Area C which is fully controlled by the Israeli

170
Authorities. Therefore, the implementation of a wastewater treatment scheme in such area requires getting permit from the Israeli Authorities which is a time consuming process that may impede the implementation process. On the other hand, the conventional activated sludge and extended aeration technologies are not land intensive and are considered relatively odor free if operated properly. Therefore, they can be utilized within residential areas without causing unpleasant conditions. Secondary wastewater treatment technologies that adapt to small communities or clusters of houses in rural areas include trickling filters, rotating biological contactors, and upflow sludge blanket filtration process. The latter technology has the lowest economic costs and is used in packaged treatment plants that result in less space, construction and operation requirements (see Table 5.32). Accordingly, this technology is recommended over the other two technologies. Moreover, the treated wastewater can be reused for irrigating fodder and/or seed crops after storage in simple reservoirs for 25 days. For the Gaza Strip, the information related to the behavior of major indicators under each secondary wastewater treatment technology is summarized in Table 5.33. The natural and aerated lagoons were not investigated for the Gaza Strip because they do not generate treated wastewater with a quality that meets the Palestinian effluent standards of 10 mg/l, 15 mg/l and 10 mg/l for the Biological Oxygen Demand (BOD), Suspended Solids (SS) and Nitrates, respectively. The economic valuation of the costs associated with the conventional activated sludge and extended aeration technologies revealed that the latter technology entails less costs. However, the selection between the two technologies should be done in consultation with the local public as the other factors do not highly vary. Table 5.33 Assessment of the Economic, Social and Technical Indicators Related to the Various Secondary Wastewater Treatment Technologies that Adapt to the Gaza Strip
Indicator Secondary Wastewater Treatment Technology
Conventional
Activated SludgeExtended Aeration
Direct Costs Until Year 2023 (Million USD)
Very high (256)
High (239)
Public Acceptance Low High Land Area Requirements Low Low Ease of Operation Difficult to operate Difficult to operate Ease of Construction Difficult to construct Intermediate

171
5.2.4.2 Wastewater Disinfection Systems In the urban areas of the West Bank and Gaza Strip, wastewater disinfection is necessary if wastewater is to be reused for either restricted or unrestricted agriculture irrigation. Still several systems exist for disinfecting wastewater, namely chlorine, ozone and ultraviolet disinfection. These systems differ in cost, land, operation and disinfectant handling requirements based on the relevant information presented in Table 5.34 and Table 5.35 for the urban areas of the West Bank and Gaza Strip, respectively. The ultraviolet disinfection is recommended as the appropriate wastewater disinfection system because it has the lowest investment and O&M costs; requires less space than other systems; does not have any residual effect that can be harmful to humans; and is user-friendly for operators. Table 5.34 Assessment of the Economic and Technical Indicators Related to the Various Wastewater Disinfection Systems for the Urban Areas of the West Bank
Indicator Wastewater Disinfection System
Chlorine Disinfection
Ozone Disinfection
Ultraviolet Disinfection
Direct Costs Until Year 2023 (Million USD)
High (60) Moderate (23) Low (14)
Land Area Requirements Intermediate Intermediate Low Ease of Disinfectant Handling and Storage
Uneasy and unsafe
Uneasy Easy
Presence of Toxic and Harmful Residuals after Disinfection
High No harmful residuals No residual effect
Ease of Operation Intermediate Difficult to operate Easy to operate
Table 5.35 Assessment of the Economic and Technical Indicators Related to the Various Wastewater Disinfection Systems for the Gaza Strip
Indicator Wastewater Disinfection System
Chlorine Disinfection
Ozone Disinfection
Ultraviolet Disinfection
Direct Costs Until Year 2023 (Million USD)
High (30) Moderate (21) Low (10)
Land Area Requirements Intermediate Intermediate Low Ease of Disinfectant Handling and Storage
Uneasy and unsafe
Uneasy Easy
Presence of Toxic and Harmful Residuals after Disinfection
High No harmful residuals No residual effect
Ease of Operation Intermediate Difficult to operate Easy to operate

172
5.2.4.3 Wastewater Reuse Types Treated wastewater is considered a vital resource that can replace fresh water used for irrigating agricultural lands. However, the quality of treated wastewater restricts the reuse options and groups them into restricted and unrestricted agricultural irrigation. The unrestricted irrigation reuse (i.e. irrigation of fruit trees) of wastewater treated in the urban areas of the West Bank requires tertiary filtration which adds an additional cost of 21 million USD as outlined in Table 5.36. The additional cost represents the investment cost for multimedia tertiary filtration plants and the cost for operating and maintaining them until year 2023. On the other hand, the unrestricted reuse of wastewater generates higher economic benefits (i.e. the economic value/price of treated wastewater and the production value/market price of irrigated crops) than the restricted reuse because the production value or market price of the irrigated fruit trees is higher than that of the irrigated fodder and/or seed crops. The respective projected total economic benefits were estimated at 247 million USD and 235 million USD. Furthermore, the reuse of wastewater in agricultural irrigation brings about social benefits represented by the increase in land price due to the conversion of land from rainfed agricultural into irrigated agricultural lands as well as the increase in employment in the agriculture sector. The social benefits of the unrestricted wastewater reuse were estimated at 283 million USD and are less than those of the restricted reuse, which were estimated at 790 million USD. This is due to the fact that fruit trees are much more water demanding than fodder and seed crops, resulting in the cultivation of smaller areas of irrigated lands. Accordingly one might assume that the restricted reuse of treated wastewater maximizes net social welfare. However, it is more logical that a combination of the two wastewater reuse types will be considered and that the percentages of reuse in restricted or unrestricted agricultural irrigation must be determined through market demand. In the Gaza Strip, wastewater reuse is essential as the quality of groundwater has deteriorated and the volume of groundwater abstracted from the aquifers has exceeded the sustainable yield. Treated wastewater is foreseen to replace the current abstracted fresh and brackish water used in irrigation that amounts to 95 MCM/yr. According to the PWA, the volume of abstracted water will drop to 27 MCM/yr which will negatively influence the irrigated agriculture sector in the Strip. However, a total of approximately 71 MCM/yr of treated wastewater will become available for agriculture by the year 2023 and thus irrigated lands can be maintained. The total economic and social benefits resulting from maintaining the area of irrigated agricultural lands in the Gaza Strip range between 1,204 and 1,842 million USD for the next 20 years as outlined in Table 5.37 It is believed that a combination of the restricted and unrestricted wastewater reuses should be applied in the Gaza Strip. The percentages of reuse for each type must be determined through market demand. The remaining fresh and brackish water will
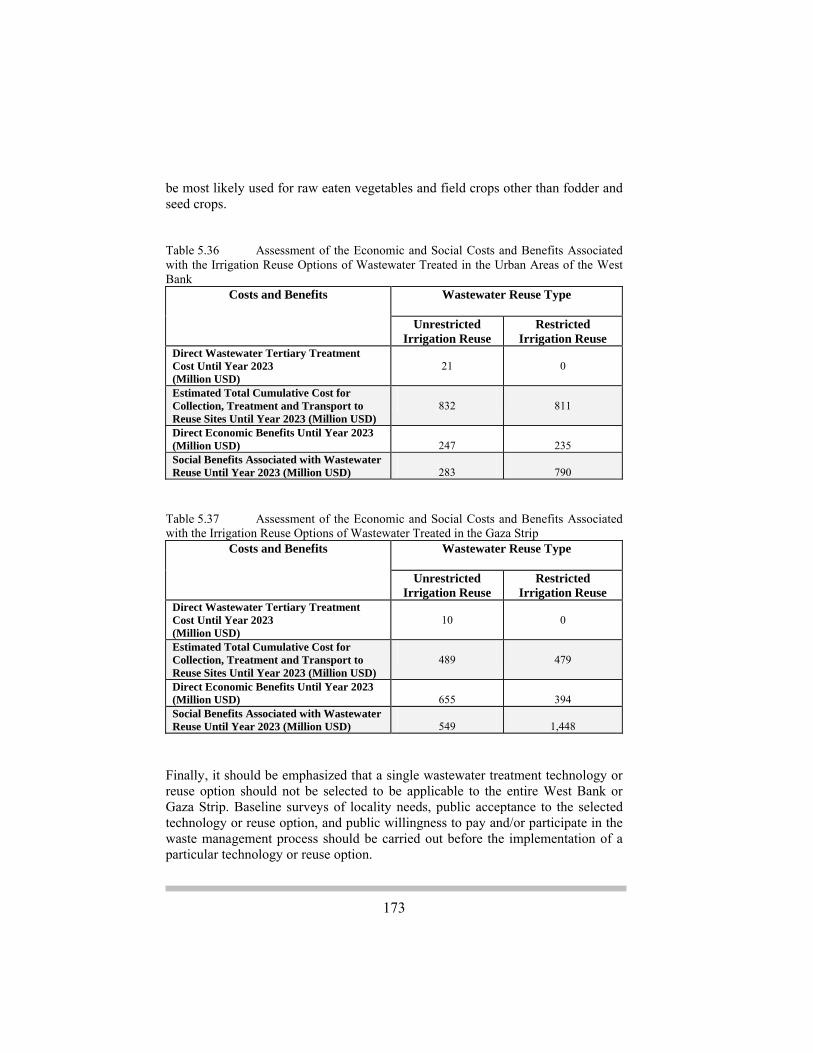
173
be most likely used for raw eaten vegetables and field crops other than fodder and seed crops. Table 5.36 Assessment of the Economic and Social Costs and Benefits Associated with the Irrigation Reuse Options of Wastewater Treated in the Urban Areas of the West Bank
Costs and Benefits Wastewater Reuse Type
Unrestricted Irrigation Reuse
Restricted Irrigation Reuse
Direct Wastewater Tertiary Treatment Cost Until Year 2023 (Million USD)
21
0
Estimated Total Cumulative Cost for Collection, Treatment and Transport to Reuse Sites Until Year 2023 (Million USD)
832
811
Direct Economic Benefits Until Year 2023 (Million USD)
247
235
Social Benefits Associated with Wastewater Reuse Until Year 2023 (Million USD)
283
790
Table 5.37 Assessment of the Economic and Social Costs and Benefits Associated with the Irrigation Reuse Options of Wastewater Treated in the Gaza Strip
Costs and Benefits Wastewater Reuse Type
Unrestricted Irrigation Reuse
Restricted Irrigation Reuse
Direct Wastewater Tertiary Treatment Cost Until Year 2023 (Million USD)
10
0
Estimated Total Cumulative Cost for Collection, Treatment and Transport to Reuse Sites Until Year 2023 (Million USD)
489
479
Direct Economic Benefits Until Year 2023 (Million USD)
655
394
Social Benefits Associated with Wastewater Reuse Until Year 2023 (Million USD)
549
1,448
Finally, it should be emphasized that a single wastewater treatment technology or reuse option should not be selected to be applicable to the entire West Bank or Gaza Strip. Baseline surveys of locality needs, public acceptance to the selected technology or reuse option, and public willingness to pay and/or participate in the waste management process should be carried out before the implementation of a particular technology or reuse option.

174
175
CHAPTER 66 Conclusions and Recommendations
he management of solid waste and wastewater in the Palestinian Territories has never been achieved on an environmentally sound basis in spite of the
Palestinian efforts towards rehabilitating the infrastructure that was neglected during the Israeli occupation era. The existing improper management of solid waste and wastewater has adversely impacted the environment and resulted in various problems including the deterioration of groundwater quality; air pollution; deterioration of nature and biodiversity; and landscape and aesthetic distortion of the visual environment. It has also posed serious public health risks represented by the spread of diseases arising from the contamination of food, water and air. The diseases include respiratory diseases, cancer, hepatitis, diarrhea, amoeba and skin diseases, among others. The study revealed that the Palestinian population is aware of the abovementioned problems and are willing to participate in the decision making process to find practical, socially acceptable, economically feasible and environmentally friendly solutions to such problems. The environmental and social costs stemming from the existing waste management practices were assessed using the CBA and other semi-quantitative valuation techniques. The assessment results are summarized as follows:
• The assessment of landscape degradation in the West Bank revealed that the heterogenic agricultural areas, shrub lands, urban areas and bucolic areas are the land use/cover types largely affected by the discharge of solid waste and wastewater into the environment. In the Gaza Strip, it was found that the impacts of open discharge of waste on the ecosystem structural complexity and functionality are less severe than they are in the West Bank.
• The assessment of the loss of recreational and aesthetic values of the polluted recreational sites showed that the residents would incur additional costs to travel to alternative recreational sites. The total costs were estimated and projected for the next 20 years at 14 million USD.
• The greenhouse and acidifying gases emitted from the transport of solid waste and wastewater to the disposal sites, the uncontrolled burning of solid waste in the existing open dumping sites and the biological degradation of the unburned organic waste in the West Bank were
T
176
quantified and converted into CO2-equivalents and SO2-equivalents, respectively. Monetary values were only attached to the equivalent values of acidifying gases emissions and were projected at 3 million USD for the next 20 years.
• The projected cost of groundwater pollution in the West Bank Aquifer arising from the open discharge of raw wastewater into the environment and the non-sanitary disposal of solid waste in the exiting dumping sites was estimated at 176 million USD.
• The projected costs of diseases arising from the improper management of solid waste and wastewater in the West Bank over the course of the next 20 years were estimated at 909 million USD and 323 million USD, respectively.
The abovementioned costs would be averted when proper and effective waste management systems as those recommended in the PES or adopted worldwide are implemented. Practical combinations of various environmentally sound systems for the collection, transport, treatment and reuse of domestic solid waste and wastewater were developed and analyzed. It was found that these systems entail more direct economic costs than the current systems as they are more comprehensive. Concerning the alternative solid waste management systems, seven scenarios were analyzed including the landfilling option and several other integrated solid waste management plans that included a combination of incineration, composting, landfilling and recycling. Analysis of the direct costs and benefits have shown that an integrated approach that includes recycling of valuable recyclables, composting and landfilling is more economically viable on the long run (i.e. for the next 20 years) than the landfilling option. However, it must be noted that the investment costs for the integrated approach is much higher than that for the landfilling option. Furthermore, there are other factors that may impede the implementation of the integrated approach, these are:
• Willingness of people to separate waste at source; • Willingness of people to use compost; • Willingness of people to pay higher fees for a better service; and • Availability of trained personnel to operate recycling, composting and
incineration facilities. Accordingly, proper awareness campaigns should start in order to catalyze public discourse on issues related to waste management and to inform the public of the relevant alternative options and their costs and benefits. In addition, it is essential to carry out some pilot demonstration projects to assess public acceptance and willingness to participate in the implementation process. For instance, it is suggested to implement the drop-off buy back scenario in the cities of Ramallah and Bethlehem, which have a high household to car ownership, in order to acquire sufficient information regarding the public willingness to separate domestic solid

177
waste at source and transport the separated waste to the transfer/drop off buy-back station. Regarding the alternative wastewater management systems, a combination of the centralized and decentralized wastewater management systems was considered for the West Bank, whereas the centralized wastewater management system was only considered for the Gaza Strip. Two wastewater reuse options including the restricted and unrestricted agricultural irrigation reuse were evaluated. These reuse options governed the selection of the various components of the management system including the collection system (i.e. conventional gravity sewers and small diameter gravity sewers), the treatment system (i.e. secondary treatment, tertiary filtration, and disinfection), the storage and reuse system (i.e. seasonal reservoirs and settling ponds) and transfer. All of the proper technologies of collection, treatment, storage and reuse were analyzed and valuated. The valuation of the direct costs and benefits for each wastewater reuse option has indicated that the restricted irrigation reuse of treated wastewater is more cost effective than the unrestricted irrigation reuse that requires additional treatment, mainly tertiary filtration. Furthermore, the valuation has indicated that the social benefits (i.e. increase in land price and increase in employment) associated with the restricted irrigation reuse are higher than those associated with the unrestricted irrigation reuse. Accordingly, one can conclude that the restricted irrigation reuse of treated wastewater maximizes net social welfare. However, a combination of restricted and unrestricted irrigation reuse of wastewater is more practical and the percentages of reuse in restricted or unrestricted agriculture must be determined through market demand. Finally, it is recommended that an integrated solid waste and wastewater management approach be considered for a specific locality or cluster of localities. For instance, the solid waste management system that involves recycling of organic waste to produce compost should be given preference for areas where wastewater treatment is taking place to allow for land reclamation, preparation and maintenance of agricultural land where wastewater will be reused. Furthermore, it should be emphasized that law enforcement is a crucial requirement to ensure an effective implementation of the proposed alternative waste management options or scenarios.

178

179
References
Bakir, H., December 2000, Guiding Principles and Options for Accelerated
Extension of Wastewater Management Services to Small Communities in EMR Countries, Jordan
Environment Canada, 2001, Canada's Greenhouse Gas Inventory 1990 – 1999:
Emission and Removal Estimation Practices and Methods
Environmental Protection Service, 1999, Greenhouse Gas Emission in 1996 for the Northwest Territories and Nunavut
European Commission (EC), 2001, Extensive Wastewater Treatment Processes,
Luxembourg European Commission (EC), 2000, a Study on the Economic Valuation of
Environmental Externalities from Landfill Disposal and Incineration of Waste
European Commission (EC), 1999, Induced and Opportunity Cost and Benefit
Patterns in the Context of Cost-Benefit Analysis in the Field of Environment, Final report, UK
Guttman, J., 2000, Study of the Sustainable Yield of the Eastern Aquifer
Basin: Conceptual and Flow Model, Mekorot Report no. 487, Israel Hammer, M., 1996, Water & Wastewater Technology, third edition, New
Jersey, USA Israeli Ministry of Foreign Affairs, 1995, Israeli-Palestinian Interim Agreement
on the West Bank and the Gaza Strip, Washington Isaac, J., Rishmawi, K., Safar, A., Darwish, G., and Sbeih, S., 2003, Analysis of
Waste Management Policies in Palestine: Data collection report. Presented to Tamkeen Project-USAID, Applied Research Institute – Jerusalem (ARIJ), http://www.arij.org/units/posters/waste_management/index.htm

180
Isaac, J., Qumsieh, V., and Safar, A., 2000, Survey and Evaluation of Pollution Sources in the Shared Israeli-Palestinian Mountain Aquifer: Final Report for the research project entitled “Environmental Protection of the Shared Israeli-Palestinian Mountain Aquifer”. Presented to Middle East Regional Cooperation (MERC) Programme of the USAID, Applied Research Institute – Jerusalem (ARIJ)
McGarigal, K., Cushman, S. A., Neel, M. C., Ene, E., 2002, FRAGSTATS:
Spatial Pattern Analysis Program for Categorical Maps, Computer software program
Masters, G., 1991, Introduction to Environmental Engineering and Science,
New Jersey, USA Ministry of Agriculture (MOA), Applied Research Institute – Jerusalem (ARIJ),
2001, Water Management Program for the Irrigated Agricultural Sector, 2001
Ministry of Environmental Affairs (MEnA), 2000 a, Palestinian Environmental
Strategy, Main Report, Second Edition, Al-Bireh, West Bank Ministry of Environmental Affairs (MEnA), 2000 b, National Environmental
Action Plan (NEAP), Final Draft, Al-Bireh, West Bank Ministry of Environmental Affairs (MEnA), 1999, Palestinian Environmental
Law no. (7), Al-Bireh, West Bank Nas, F., 1996, Cost-Benefit Analysis – Theory and Application National Small Flows Clearinghouse, 1998, Ozone Disinfection Technical
Overview, http://www.septic-info.com/doc/display/56.html Palestinian Centralized Bureau of Statistics (PCBS), 2002, Agricultural Statistics
1999/2000, Ramallah, West Bank Palestinian Water Authority (PWA), 1999 a, Water Sector Strategic Planning
Study (WSSPS), Volume III, Part B, Ramallah, West Bank Palestinian Water Authority (PWA), 1999 b, Water Sector Strategic Planning
Study (WSSPS), Volume II, Part C, Ramallah, West Bank Pearce, W., Howarth, A., 2000, Technical Report on Methodology: Cost
Benefit Analysis and Policy Responses

181
Rishmawi, K., Safar, A., Darwish, G., Weinroth, T., and Nassar, A., 2004, Analysis of Waste Management Policies in Palestine: Environmental, Social and Economic Risks Report. Presented to Tamkeen Project-USAID, Applied Research Institute – Jerusalem (ARIJ), http://www.arij.org/units/posters/waste_management/index.htm
United Nations Environmental Program (UNEP), 2003, Desk Study on the
Environment in the Occupied Palestinian Territories, Switzerland United Nations Environment Program (UNEP), July 1996, International Source
Book on Environmentally Sound Technologies for Municipal Solid Waste Management, http://www.unep.or.jp/ietc/ESTdir/Pub/MSW/index.asp
United States Environmental Protection Agency (USEPA), 2002, 2002 National
Inventory Annexes, Annex H United States Environmental Protection Agency (USEPA), 2000 a, Wastewater
Technology Fact Sheet: Trickling Filters, http://www.epa.gov/owmitnet/mtb/
United States Environmental Protection Agency (USEPA), 2000 b, Decentralized
Systems Technology Fact Sheet: Septic System Tank United States Environmental Protection Agency (USEPA), 2000 c, Compilation
of Air Pollutant Emission Factors, AP-42, Fifth Edition, Volume II: Mobile Sources
United States Environmental Protection Agency (USEPA), 1999 a, Wastewater
Technology Fact Sheet: Chlorine Disinfection, http://www.epa.gov/owmitnet/mtb/chlo.pdf
United States Environmental Protection Agency (USEPA), 1999 b, Wastewater
Technology Fact Sheet: Ozone Disinfection, http://www.epa.gov/owmitnet/mtb/ozon.pdf
United States Environmental Protection Agency (USEPA), 1999 c, Wastewater
Technology Fact Sheet: Ultraviolet Disinfection, http://www.epa.gov/owmitnet/mtb/uv.pdf
United States Environmental Protection Agency (USEPA), 1999 d, Development
Document for Final Effluent Limitations Guidelines and Standards for the Landfills Point Source Category, www.epa.gov/OST/guide/landfills/final/

182
United States Environmental Protection Agency (USEPA), 1998, Compilation of
Air Pollutant Emission Factors, AP-42, Fifth Edition, Volume I: Stationary Point and Area Sources
United States Environmental Protection Agency (USEPA), 1997 a, Response
to Congress on Use of Decentralized Wastewater Treatment Systems, EPA 832-R-97-001b
United States Environmental Protection Agency (USEPA), 1997 b, Full Cost
Accounting for Municipal Solid Waste Management: A Handbook, EPA 530-R-95-041
United States Environmental Protection Agency (USEPA), 1995, Decision
Maker’s Guide to Solid Waste Management, Volume II, (EPA 530-R-95-023)
United States Environmental Protection Agency (USEPA), May 1994,
Composting Yard Trimmings and Municipal Solid Waste, (EPA 530-R-94-003)
University of Central California, 2001, Municipal Solid Waste Learning Tool Virani, S., Graham, S. - Risk & Policy Analysts Limited, 1998, Economic
Evaluation of Environmental Policies and Legislation, Prepared for European Commission Directorate General III (Industrial Affairs)
Water Quality Program Committee, Virginia Tech, July 1996, Small Community
Wastewater Collection Systems, http://www.ext.vt.edu/pubs/waterquality/448-405/448-405.html.
World Bank, 1998 a, West Bank and Gaza Solid Waste Management Project:
Environmental Analysis of the Zaharat Finjan Landfill Site World Bank, 1998 b, West Bank and Gaza Solid Waste Management Project:
Environmental Analysis of the Hebron/Yatta Landfill Site