2005 jetro white paper on international trade and foreign direct investment by jetro
TRANSCRIPT

2005 JETRO WHITE PAPER ON
INTERNATIONAL TRADE AND FOREIGN DIRECT INVESTMENT
(Summary)
JAPAN EXTERNAL TRADE ORGANIZATION

This same information can be viewed on JETRO’s website at www.jetro.go.jp
CONTENTS
I. U.S. and China Lead World Economy in 2004.................................................................................. 1
A. Global Economy ................................................................................................................................... 1
B. U.S. Economy ....................................................................................................................................... 2
C. Chinese Economy.................................................................................................................................. 3
D. Oil Prices............................................................................................................................................... 6
II. Highest Trade Growth since 1979 ...................................................................................................... 6
A. World Trade........................................................................................................................................... 6
B. Japanese Trade .................................................................................................................................... 11
III. FDI Recovers Globally and Increases in Japan .............................................................................. 15
A. Global FDI .......................................................................................................................................... 15
B. Japanese FDI ....................................................................................................................................... 18
IV. Growth Strategies for Japanese Corporations ................................................................................ 20
A. Growth Strategy 1: Increased Localization of Product Development in East Asia ............................. 21
B. Growth Strategy 2: Protect Intellectual Property for Better Returns on R&D .................................... 24
C. Growth Strategy 3: Improving Brand Power....................................................................................... 27
D. Growth Strategy 4: Entering the BRICs and Other Emerging Markets .............................................. 29
V. Japan’s Role in Integration of East Asian Free Business Area...................................................... 33

1
2005 JETRO White Paper on Trade and Investment I. U.S. and China Lead World Economy in 2004 A. Global Economy
The global economy in 2004 grew 5.1%, the highest growth rate since 1976. Growth was led by the U.S. and China, although certain conditions in these two countries raised concerns about their economic prospects going forward. The U.S. economy grew 4.2%, driven primarily by personal consumption, but the current account deficit expanded to a record $668 billion, or 5.7% of GDP. The Chinese economy showed clear signs of overheating, reaching a high growth rate of 9.5%, with investment accounting for 40% of GDP. Conditions such as these raised concerns about the sustainability of economic growth in both countries, which poses risks for the global economy.
Yet there were some important differences between the conditions in the U.S. and China. In the U.S., even though the current account and fiscal deficits both grew, overall growth is expected to remain stable for the time being. In China, however, following capital investment rises of 22.4% in 2003 and 19.6% in 2004, economic growth may be slowed by various factors in the coming years. In particular, excessive investment in real estate, iron and steel, and automobiles could result in weaker corporate profits, increased bad loans and deflation.
The Japanese and EU economies, which had been struggling for some time, both achieved growth in the 2% range. BRICs—Brazil, Russia, India and China—grew a combined 8.2%.
With monetary policies around the world expected to grow tighter in 2005, the International Monetary Fund (IMF) forecast growth of 4.3% for the global economy. In comparison with oil crises of the past, the overall effect of today’s high oil prices is likely to be limited, although effects will differ from country to country. Nonetheless, higher oil prices pose a risk for the global economy.
Table I-1 GDP growth rates by country/region (Unit: %)
Growth rate Contribution Growth rate Contribution Growth rate Contribution Growth rate ContributionWorld 2.5 100.0 3.0 100.0 4.0 100.0 5.1 100.0
U.S. 0.8 6.6 1.6 11.5 2.7 14.4 4.2 17.4EU25 1.8 16.5 1.1 8.4 1.0 5.6 2.3 9.8Japan 0.2 0.6 -0.3 -0.7 1.4 2.5 2.7 3.7East Asia 5.4 38.1 7.0 42.6 7.5 35.7 8.2 31.4
Asian NIEs 1.2 1.7 5.3 6.0 3.1 2.7 5.6 3.8ASEAN4 2.8 3.7 4.4 5.0 5.2 4.5 5.8 4.0China 7.5 32.7 8.3 31.6 9.5 28.5 9.5 23.6
BRICs 5.7 49.3 6.1 45.3 7.7 43.9 8.2 38.1Brazil 1.3 1.4 1.9 1.7 0.5 0.4 5.2 2.7Russia 5.1 4.8 4.7 3.8 7.3 4.5 7.1 3.6India 4.8 10.4 4.4 8.1 7.5 10.5 7.3 8.3China (reshown) 7.5 32.7 8.3 31.6 9.5 28.5 9.5 23.6
Sources: IMF, WEO , national statistics, and other sources.
Notes: 1. 2004 prices, weighted for purchasing power parity.2. World growth rates are weighted for puchasing power parity by IMF.
2003 200420022001

2
Table I-2 Percentage contributions to GDP by expenditures g y p(Unit: %)
U.S. China EU25 Japan U.S. China EU25 JapanReal GDP 14.4 28.5 5.6 2.5 17.4 23.6 9.8 3.7PCE (Personal Consumption Expenditure) 11.0 6.3 4.4 0.2 11.3 6.6 4.5 1.1GFCF (Gross Fixed Capital Formulation) 3.0 21.9 0.5 0.4 6.5 13.8 2.2 0.6GCE (Government Consumption Expenditure) 2.4 1.3 1.8 0.4 1.3 1.4 1.3 0.6
Sources: IMF, national statistics, and other sources.
2004
Notes: Real prices in 2004, weighted for purchasing power parity. Percentage contributions to GDP of eachcomponent of demand are in relation to growth in the total value of world GDP. For China, contributions to real GDPby component of demand are calculated according to share of nominal GDP.
2003
Table I-3 Trends in U.S. and Chinese GDP by expenditures (Unit: %)
2000 2001 2002 2003 2004 2000 2001 2002 2003 2004PCE 4.7 2.5 2.7 2.9 3.9 68.7 69.9 70.6 70.8 70.6GFCF 6.1 -1.8 -3.5 3.3 8.4 20.2 19.7 18.7 18.8 19.6GCE 1.7 3.1 4.3 3.0 2.1 14.4 14.8 15.2 15.2 14.9Net exports - - - - - -3.9 -4.0 -4.7 -5.1 -5.6PCE 9.1 7.0 6.5 7.8 12.1 48.0 46.6 45.3 43.3 41.9GFCF 10.7 12.8 13.9 22.4 19.6 36.5 37.3 38.9 42.1 43.6GCE 12.7 11.3 6.8 6.4 10.6 13.1 13.2 12.9 12.2 11.6Net exports - - - - - 2.5 2.2 2.6 2.2 2.5
Note: Calculated in real terms for the U.S., and nominal terms for China.Source: U.S. Department of Commerce, China Statistical Abstract.
U.S
.
Growth rate Share
Chi
na
B. U.S. Economy
The U.S. economy is expected to grow 3% in the two-year period between 2005 and 2006. Neither overheating nor a sudden slowdown is foreseen, while confidence in the Federal Reserve Board’s monetary policy remains strong. Thanks to the U.S. economy’s continuing credibility, capital inflows from abroad will continue to adequately support the nation’s current account and fiscal deficits.
Foreign investors must continue to buy U.S. treasury bonds and other dollar assets in the U.S. to sustain its growing current account deficit. But if investors were to lose confidence in dollar assets, and begin spreading their investments into other currencies, the dollar would devalue, U.S. interest rates would rise and domestic demand would fall. Such developments would, however, shrink the current account deficit.
The real value of the dollar averaged against 26 major currencies peaked in February 2002, then declined by 15.9% as of the end of 2004. From 2005, however, its value began to rise again as the current account deficit increased and the U.S. economy grew. The long-term interest rate (10-year U.S. treasury bonds) rose 2.25 percentage points between June 2004 and June 2005, then leveled off.
With U.S. productivity exceeding that of Japan and the EU between 1996 and 2004, the overall competitiveness of the U.S. economy has remained relatively strong.

3
Fig. I-1 Trends in U.S. current accounts and fiscal deficits
-800
-700
-600
-500
-400
-300
-200
-100
0
100
200
300
1990 1991 1992 1993 1994 1995 1996 1997 1998 1999 2000 2001 2002 2003 2004 2005 2006-7
-6
-5
-4
-3
-2
-1
0
1
2
3経常収支
財政収支
経常収支の対名目GDP比(右軸)
財政収支の対名目GDP比(右軸)
Note: Trade balance forecasts for 2005 and 2006 from IMF, budget expenditure forecasts from OMB. Budget expenditures based on fiscal year (October to September).Sources: U.S. Department of Commerce, U.S. Office of Management and Budget, IMF.
(US$ billion) (%)
Forecast
Twin deficits
(Year)
Current account balance
Budget balance
Current account balance as a percentage ofGDP (right-hand scale)
Budget balance as a percentage of GDP (right-hand scale)
Table I-4 Comparison of labor productivity in Europe, Japan, and U.S.
(Unit: %)Period Country/region Output (Real GDP)
Labor input Hourly productivityHours worked Employment
1981-90 U.S. 3.3 1.7 -0.1 1.8 1.5EU15 2.4 0.1 -0.6 0.7 2.3Japan 3.9 1.0 -0.2 1.2 3.0
1991-95 U.S. 2.5 1.3 0.2 1.1 1.1EU15 1.6 -0.8 -0.3 -0.5 2.5Japan 1.5 -0.4 -1.0 0.7 1.9
1996-2004 U.S. 3.4 0.9 -0.3 1.1 2.5EU15 2.2 0.7 -0.4 1.1 1.5Japan 1.1 -0.8 -0.6 -0.2 2.0
Note: Real prices, average annual growth rates.Sources: Cabinet Office, U.S. Department of Commerce, Eurostat, Groningen Growth and Development Centre, and others.
Table I-5 U.S. real effective exchange rates
(Unit: index, %)2000 2001 2002 2003 2004 2005 1-6
Index 104.9 111.0 111.2 104.5 99.8 97.2Growth rate 3.9 5.8 0.2 -6.1 -4.4 -3.3
Source: U.S. Federal Reserve Board.Note: Percentage year-on-year changes on data for 26 currencies.
C. Chinese Economy
Investment-led growth in China may weaken substantially in the coming years. Investment efficiency, the percentage-point contribution to GDP growth for each 1% increase in investment, fell in the mid-1990s and has remained low when compared with that of other East Asian countries. If China continues to pursue investment-led growth, excess supply and increased bad loans can be expected.
The key to China’s future growth is the improvement of total factor productivity (TFP), which so far has been aided by new technologies introduced by foreign companies investing directly in the country. But in the future, local industries must contribute to TFP. For this to

4
happen, national enterprises must be further privatized and financial institutions must distribute funds more effectively. Better corporate governance will also be required.
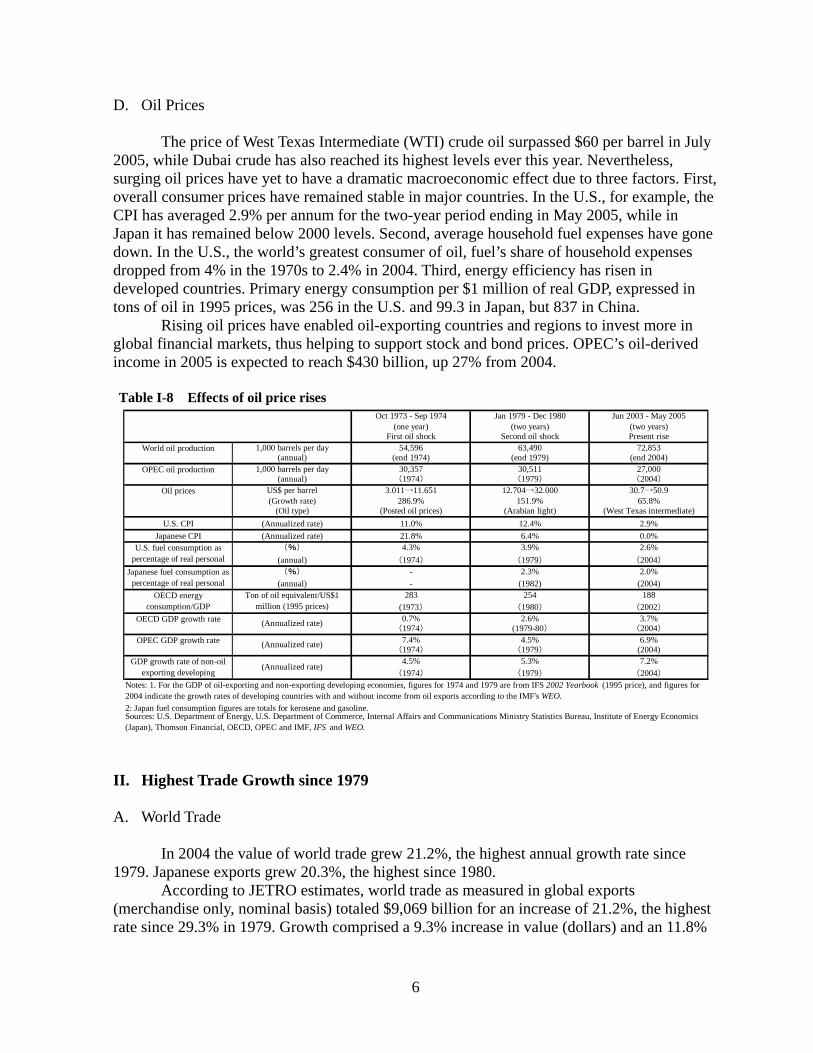
Before the Chinese economy can be driven primarily by personal consumption, rural incomes must increase. To combat the worsening discrepancy between urban and rural incomes, labor-intensive secondary and tertiary industries must be developed in rural areas. In the shorter term, water and power shortages in rural areas will negatively affect investment. The cause of power shortages lies in restrained investment in the power industry in the late 1990s, which was followed by sudden increases in the demand for power. Although power plants are being constructed, transportation and other infrastructure development are lagging behind.
Rapid industrialization and urbanization have also created chronic water shortages. This problem is particularly acute in the northern and northwestern provinces, including Shanxi and Gangsu. While these regions account for 45% of China’s total population and 59% of its total cultivated land, they hold a mere 14% of its water resources, which could constrain economic development there. Yet water shortages are not a nationwide problem and are not expected to create a national bottleneck.
Investment efficiency averaged 0.25 per annum between 1991 and 2004, including 0.22 in 2004. By comparison, the rate averaged 0.34 during Japan’s high-growth period from 1956 to 1972, 0.44 in Taiwan from 1976 to 1990, and 0.28 in South Korea from 1976 to 1990. During China’s period of reform and liberalization from 1978 to 2002, economic growth comprised 60% capital growth, 10% labor force growth and 30% TFP growth. In Japan between 1956 and 1964, the figures were 40% capital, 10% labor force and 50% TFP.
The process of privatizing China’s national enterprises is only half completed. Mechanisms for market supervision are inadequate, the government often interferes with corporate management, while investment is often excessive and executives sometimes treat corporate assets as private possessions. China’s state-owned banks have yet to acquire supervisory and risk-management capabilities, as well as other skills needed to support a market economy.
Fig. I-2 Trends in Chinese investment efficiency
Notes: Investment efficiency = (GDP increase/GDP)/(gross capital formation/GDP) = GDP increase/grosscapital formationInvestment efficiency is the rate of contribution to GDP growth of a 1% increase in investment
Source: China Statistical Yearbook.
0.0
0.1
0.2
0.3
0.4
0.5
79 80 81 82 83 84 85 86 87 88 89 90 91 92 93 94 95 96 97 98 9920
0020
0120
0220
0320
04
Investment efficiency
Trend line
5
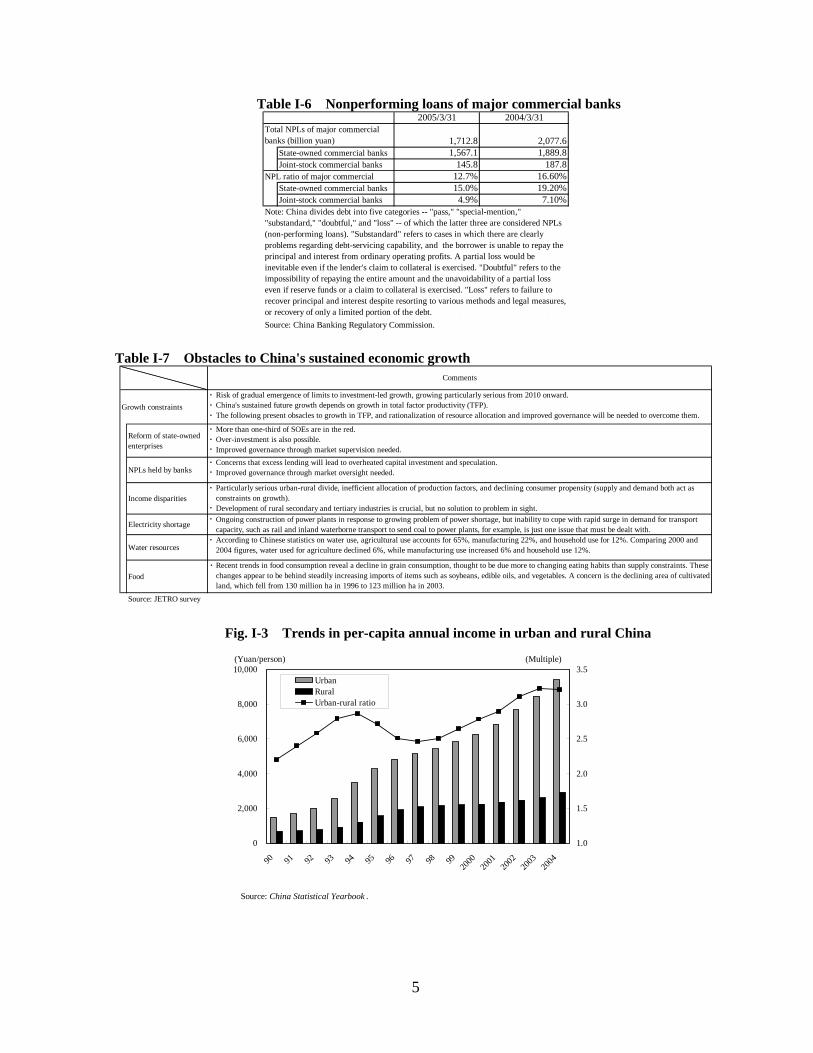
Table I-6 Nonperforming loans of major commercial banks 2005/3/31 2004/3/31
1,712.8 2,077.6State-owned commercial banks 1,567.1 1,889.8Joint-stock commercial banks 145.8 187.8
12.7% 16.60%State-owned commercial banks 15.0% 19.20%Joint-stock commercial banks 4.9% 7.10%
, ,Source: China Banking Regulatory Commission.
Note: China divides debt into five categories -- "pass," "special-mention,""substandard," "doubtful," and "loss" -- of which the latter three are considered NPLs(non-performing loans). "Substandard" refers to cases in which there are clearlyproblems regarding debt-servicing capability, and the borrower is unable to repay theprincipal and interest from ordinary operating profits. A partial loss would beinevitable even if the lender's claim to collateral is exercised. "Doubtful" refers to theimpossibility of repaying the entire amount and the unavoidability of a partial losseven if reserve funds or a claim to collateral is exercised. "Loss" refers to failure torecover principal and interest despite resorting to various methods and legal measures,or recovery of only a limited portion of the debt.
Total NPLs of major commercialbanks (billion yuan)
NPL ratio of major commercial
Table I-7 Obstacles to China's sustained economic growth
Growth constraints・
・
・
Risk of gradual emergence of limits to investment-led growth, growing particularly serious from 2010 onward.China's sustained future growth depends on growth in total factor productivity (TFP).The following present obsacles to growth in TFP, and rationalization of resource allocation and improved governance will be needed to overcome them.
Reform of state-ownedenterprises
・
・・
More than one-third of SOEs are in the red.Over-investment is also possible.Improved governance through market supervision needed.
NPLs held by banks・・
Concerns that excess lending will lead to overheated capital investment and speculation.Improved governance through market oversight needed.
Income disparities・
・
Particularly serious urban-rural divide, inefficient allocation of production factors, and declining consumer propensity (supply and demand both act asconstraints on growth).Development of rural secondary and tertiary industries is crucial, but no solution to problem in sight.
Electricity shortage・ Ongoing construction of power plants in response to growing problem of power shortage, but inability to cope with rapid surge in demand for transport
capacity, such as rail and inland waterborne transport to send coal to power plants, for example, is just one issue that must be dealt with.
Water resources・ According to Chinese statistics on water use, agricultural use accounts for 65%, manufacturing 22%, and household use for 12%. Comparing 2000 and
2004 figures, water used for agriculture declined 6%, while manufacturing use increased 6% and household use 12%.
Food・ Recent trends in food consumption reveal a decline in grain consumption, thought to be due more to changing eating habits than supply constraints. These
changes appear to be behind steadily increasing imports of items such as soybeans, edible oils, and vegetables. A concern is the declining area of cultivatedland, which fell from 130 million ha in 1996 to 123 million ha in 2003.
Source: JETRO survey
Comments
Fig. I-3 Trends in per-capita annual income in urban and rural China
Source: China Statistical Yearbook .
0
2,000
4,000
6,000
8,000
10,000
90 91 92 93 94 95 96 97 98 9920
0020
0120
0220
0320
04
1.0
1.5
2.0
2.5
3.0
3.5UrbanRuralUrban-rural ratio
(Yuan/person) (Multiple)
6
D. Oil Prices
The price of West Texas Intermediate (WTI) crude oil surpassed $60 per barrel in July 2005, while Dubai crude has also reached its highest levels ever this year. Nevertheless, surging oil prices have yet to have a dramatic macroeconomic effect due to three factors. First, overall consumer prices have remained stable in major countries. In the U.S., for example, the CPI has averaged 2.9% per annum for the two-year period ending in May 2005, while in Japan it has remained below 2000 levels. Second, average household fuel expenses have gone down. In the U.S., the world’s greatest consumer of oil, fuel’s share of household expenses dropped from 4% in the 1970s to 2.4% in 2004. Third, energy efficiency has risen in developed countries. Primary energy consumption per $1 million of real GDP, expressed in tons of oil in 1995 prices, was 256 in the U.S. and 99.3 in Japan, but 837 in China.
Rising oil prices have enabled oil-exporting countries and regions to invest more in global financial markets, thus helping to support stock and bond prices. OPEC’s oil-derived income in 2005 is expected to reach $430 billion, up 27% from 2004. Table I-8 Effects of oil price rises
Oct 1973 - Sep 1974 Jan 1979 - Dec 1980 Jun 2003 - May 2005(one year) (two years) (two years)
First oil shock Second oil shock Present rise1,000 barrels per day 54,596 63,490 72,853
(annual) (end 1974) (end 1979) (end 2004)1,000 barrels per day 30,357 30,511 27,000
(annual) (1974) (1979) (2004)
US$ per barrel 3.011→11.651 12.704→32.000 30.7→50.9(Growth rate) 286.9% 151.9% 65.8%
(Oil type) (Posted oil prices) (Arabian light) (West Texas intermediate)U.S. CPI (Annualized rate) 11.0% 12.4% 2.9%
Japanese CPI (Annualized rate) 21.8% 6.4% 0.0%(%) 4.3% 3.9% 2.6%
(annual) (1974) (1979) (2004)
(%) - 2.3% 2.0%(annual) - (1982) (2004)
283 254 188(1973) (1980) (2002)
0.7% 2.6% 3.7%(1974) (1979-80) (2004)
7.4% 4.5% 6.9%(1974) (1979) (2004)4.5% 5.3% 7.2%
(1974) (1979) (2004)
2: Japan fuel consumption figures are totals for kerosene and gasoline.
Notes: 1. For the GDP of oil-exporting and non-exporting developing economies, figures for 1974 and 1979 are from IFS 2002 Yearbook (1995 price), and figures for2004 indicate the growth rates of developing countries with and without income from oil exports according to the IMF's WEO.
Sources: U.S. Department of Energy, U.S. Department of Commerce, Internal Affairs and Communications Ministry Statistics Bureau, Institute of Energy Economics(Japan), Thomson Financial, OECD, OPEC and IMF, IFS and WEO.
Ton of oil equivalent/US$1million (1995 prices)
World oil production
Japanese fuel consumption aspercentage of real personal
U.S. fuel consumption aspercentage of real personal
OECD energyconsumption/GDP
OPEC oil production
Oil prices
OECD GDP growth rate (Annualized rate)
GDP growth rate of non-oilexporting developing
(Annualized rate)
OPEC GDP growth rate (Annualized rate)
II. Highest Trade Growth since 1979 A. World Trade
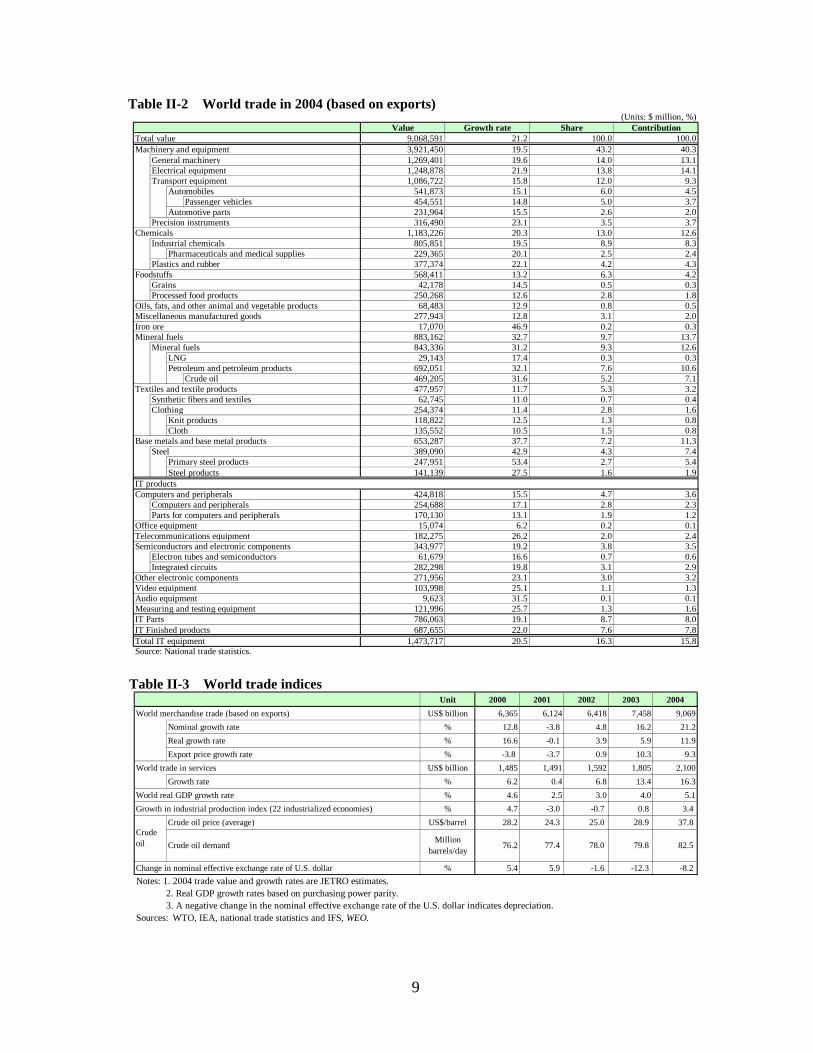
In 2004 the value of world trade grew 21.2%, the highest annual growth rate since
1979. Japanese exports grew 20.3%, the highest since 1980. According to JETRO estimates, world trade as measured in global exports
(merchandise only, nominal basis) totaled $9,069 billion for an increase of 21.2%, the highest rate since 29.3% in 1979. Growth comprised a 9.3% increase in value (dollars) and an 11.8%

7
increase in volume, the latter being the largest increase since 16.6% in 2002. The increase in value resulted from the devaluation of the dollar, which fell 8.2% in nominal effective exchange rate terms, and soaring energy prices. World trade in services increased 6.3% to $2,100 billion.
The increase in world trade was due to three factors: (1) increased trade between China and the U.S., which accounted for 21.8% of the increase in global imports, (2) recovery of international trade in the Asian NIEs and ASEAN, and (3) remarkable growth in emerging markets such as India, Brazil, Russia, Turkey and South Africa, all of which recorded increases of over 30% in both imports and exports. East Asia and other developing countries saw their combined share of world exports rise from 29.9% in 2003 to 31.7% in 2004.
Major contributors to this record growth included trade in energy and mining resources (12.6% contribution), information technology (15.8%) and intermediate commodities such as iron and steel and chemicals (20.0%). The main factors that helped to drive up world trade were China’s robust capital investment and soaring auto sales, strong economic growth in natural-resource exporters such as Russia and Brazil, and booming sales of PCs and digital electronic products such as flat-panel TVs and cell phones.
In the first quarter of 2005, however, world trade began to slow. The total trade of 13 leading economies (for which statistics were available) rose 11.6%, which was down from 18.0% in the preceding quarter. A notable drop-off was seen in China, where imports had risen more than 30% for nine consecutive quarters, but grew just 12.2% in the 2005 first quarter. Nevertheless, Chinese exports grew 34.7%, the 10th consecutive quarterly increase above 30%.
The U.S. saw exports grow 13.0% to $819 billion in 2004, while imports increased 16.9% to $1,470 billion. The EU saw external trade grow 19.2% to $1,323 billion and intraregional trade grow 16.7% to $2,124 billion. East Asian exports rose 26.2% to $1,802 billion, while imports grew 28.5% to $1,678 billion. Chinese exports increased 35.4% to $593 billion and imports climbed 36.0% to $561 billion. The Asian NIEs saw exports grow 22.8% and imports 24.2%, while ASEAN exports increased 20.6% and imports rose 27.5%. The ASEAN region’s high rates of growth were particularly notable in comparison to the single-digit growth rates recorded in 2003.
East Asia’s share of world trade was 19.9% in exports and 17.8% in imports, or more than 60% of total trade among developing countries. The BRIC countries (Brazil, Russia, India and China) also did well. In addition to the figures for China mentioned above, India saw exports grow 31.6% and imports 36.7%, Russia 36.1% and 31.9%, and Brazil 32.0% and 30.0%. The BRICs’ share of world trade was 10.5% in 2004, up from 9.4% in 2003, while China’s share grew from 5.9% to 6.5% in the same period.
By broad commodity category, machinery and equipment, which now accounts for more than 40% of total world trade, increased 19.5% to $3,922 billion. Within this category, digital electronic products grew 20.5% to $1,474 billion, nearly double the 11.9% growth of 2003, with visual and audio equipment doing particularly well. Trade in iron and steel grew 42.9%, to $389 billion, chemicals rose 20.3% to $1,183 billion, iron ore increased 46.7% to $17 billion and petroleum and petroleum products grew 32.1% to $692 billion. In these categories of intermediate products and natural resources, increases occurred both in volume and value.
The oil shock of 1979 caused the price index for international trade to shoot up 17.7%. That year, the world economy achieved 3.8% growth while world trade volume increased

8
11.6%, driven primarily by the U.S., Japan, and Germany.
Table II-1 Value of world trade in 2004 (Units: US$ million, %)
Value Growth rate Share Contribution Value Growth rate Share ContributionNAFTA 1,325,156 14.1 14.6 10.3 1,940,717 16.4 20.6 16.5
U.S. 818,775 13.0 9.0 5.9 1,469,704 16.9 15.6 12.8Canada 317,181 16.5 3.5 2.8 273,710 14.0 2.9 2.0Mexico 189,200 14.8 2.1 1.5 197,303 15.7 2.1 1.6
EU15 3,446,996 17.7 38.0 32.6 3,375,768 18.4 35.9 31.7Germany 911,637 21.2 10.1 10.0 716,859 18.5 7.6 6.7France 447,757 14.1 4.9 3.5 464,052 16.3 4.9 3.9U.K. 347,210 13.4 3.8 2.6 465,397 17.9 4.9 4.3Italy 348,954 16.3 3.8 3.1 351,056 17.8 3.7 3.2Netherlands 357,910 20.8 3.9 3.9 318,951 20.4 3.4 3.3Belgium 306,094 19.7 3.4 3.2 285,216 21.4 3.0 3.0Spain 178,330 14.1 2.0 1.4 248,890 19.1 2.6 2.4Sweden 122,485 19.9 1.4 1.3 99,323 18.8 1.1 1.0
Japan 565,039 20.3 6.2 6.0 454,669 19.2 4.8 4.4East Asia 1,801,487 26.2 19.9 23.6 1,678,215 28.5 17.8 22.5
Asian NIEs 873,377 22.8 9.6 10.2 829,695 24.2 8.8 9.8South Korea 253,845 31.0 2.8 3.8 224,463 25.5 2.4 2.8Taiwan 174,014 20.7 1.9 1.9 167,890 31.9 1.8 2.5Hong Kong 265,763 16.0 2.9 2.3 273,361 16.8 2.9 2.4Singapore 179,755 24.5 2.0 2.2 163,982 28.0 1.7 2.2
ASEAN4 334,741 20.6 3.7 3.6 287,097 27.5 3.1 3.7Thailand 97,701 22.1 1.1 1.1 94,978 26.6 1.0 1.2Malaysia 125,857 25.7 1.4 1.6 105,297 31.5 1.1 1.5Indonesia 71,585 17.2 0.8 0.7 46,525 42.9 0.5 0.8Philippines 39,598 9.3 0.4 0.2 40,297 7.5 0.4 0.2
China 593,369 35.4 6.5 9.8 561,423 36.0 6.0 9.0India 75,631 31.6 0.8 1.1 97,313 36.7 1.0 1.6Switzerland 118,700 17.8 1.3 1.1 111,777 15.8 1.2 0.9Australia 86,362 22.7 1.0 1.0 103,543 22.1 1.1 1.1Brazil 96,475 32.0 1.1 1.5 62,782 30.0 0.7 0.9Argentina 34,453 16.5 0.4 0.3 22,320 61.3 0.2 0.5Russia 181,675 36.1 2.0 3.0 75,549 31.9 0.8 1.1Turkey 63,121 33.6 0.7 1.0 97,540 40.7 1.0 1.7South Africa 45,973 31.4 0.5 0.7 47,653 38.5 0.5 0.8Value of world trade (est.) 9,068,591 21.2 100.0 100.0 9,402,357 21.4 100.0 100.0BRICs 947,150 34.9 10.4 15.4 797,067 35.2 8.5 12.5Note: Value of world trade estimated by JETRO.Source: National trade statistics.
Imports Exports
9
Table II-2 World trade in 2004 (based on exports) (Units: $ million, %)
Value Growth rate Share ContributionTotal value 9,068,591 21.2 100.0 100.0Machinery and equipment 3,921,450 19.5 43.2 40.3
General machinery 1,269,401 19.6 14.0 13.1Electrical equipment 1,248,878 21.9 13.8 14.1Transport equipment 1,086,722 15.8 12.0 9.3
Automobiles 541,873 15.1 6.0 4.5Passenger vehicles 454,551 14.8 5.0 3.7
Automotive parts 231,964 15.5 2.6 2.0Precision instruments 316,490 23.1 3.5 3.7
Chemicals 1,183,226 20.3 13.0 12.6Industrial chemicals 805,851 19.5 8.9 8.3
Pharmaceuticals and medical supplies 229,365 20.1 2.5 2.4Plastics and rubber 377,374 22.1 4.2 4.3
Foodstuffs 568,411 13.2 6.3 4.2Grains 42,178 14.5 0.5 0.3Processed food products 250,268 12.6 2.8 1.8
Oils, fats, and other animal and vegetable products 68,483 12.9 0.8 0.5Miscellaneous manufactured goods 277,943 12.8 3.1 2.0Iron ore 17,070 46.9 0.2 0.3Mineral fuels 883,162 32.7 9.7 13.7
Mineral fuels 843,336 31.2 9.3 12.6LNG 29,143 17.4 0.3 0.3Petroleum and petroleum products 692,051 32.1 7.6 10.6
Crude oil 469,205 31.6 5.2 7.1Textiles and textile products 477,957 11.7 5.3 3.2
Synthetic fibers and textiles 62,745 11.0 0.7 0.4Clothing 254,374 11.4 2.8 1.6
Knit products 118,822 12.5 1.3 0.8Cloth 135,552 10.5 1.5 0.8
Base metals and base metal products 653,287 37.7 7.2 11.3Steel 389,090 42.9 4.3 7.4
Primary steel products 247,951 53.4 2.7 5.4Steel products 141,139 27.5 1.6 1.9
Computers and peripherals 424,818 15.5 4.7 3.6Computers and peripherals 254,688 17.1 2.8 2.3Parts for computers and peripherals 170,130 13.1 1.9 1.2
Office equipment 15,074 6.2 0.2 0.1Telecommunications equipment 182,275 26.2 2.0 2.4Semiconductors and electronic components 343,977 19.2 3.8 3.5
Electron tubes and semiconductors 61,679 16.6 0.7 0.6Integrated circuits 282,298 19.8 3.1 2.9
Other electronic components 271,956 23.1 3.0 3.2Video equipment 103,998 25.1 1.1 1.3Audio equipment 9,623 31.5 0.1 0.1Measuring and testing equipment 121,996 25.7 1.3 1.6IT Parts 786,063 19.1 8.7 8.0IT Finished products 687,655 22.0 7.6 7.8Total IT equipment 1,473,717 20.5 16.3 15.8Source: National trade statistics.
IT products
Table II-3 World trade indices Unit 2000 2001 2002 2003 2004
World merchandise trade (based on exports) US$ billion 6,365 6,124 6,418 7,458 9,069Nominal growth rate % 12.8 -3.8 4.8 16.2 21.2Real growth rate % 16.6 -0.1 3.9 5.9 11.9Export price growth rate % -3.8 -3.7 0.9 10.3 9.3
World trade in services US$ billion 1,485 1,491 1,592 1,805 2,100Growth rate % 6.2 0.4 6.8 13.4 16.3
World real GDP growth rate % 4.6 2.5 3.0 4.0 5.1Growth in industrial production index (22 industrialized economies) % 4.7 -3.0 -0.7 0.8 3.4
Crude oil price (average) US$/barrel 28.2 24.3 25.0 28.9 37.8
Crude oil demandMillion
barrels/day 76.2 77.4 78.0 79.8 82.5
Change in nominal effective exchange rate of U.S. dollar % 5.4 5.9 -1.6 -12.3 -8.2Notes: 1. 2004 trade value and growth rates are JETRO estimates. 2. Real GDP growth rates based on purchasing power parity. 3. A negative change in the nominal effective exchange rate of the U.S. dollar indicates depreciation.Sources: WTO, IEA, national trade statistics and IFS, WEO.
Crudeoil

10
Table II-4 Trends in trade price indices by commodity (Unit: %)
2000 2001 2002 2003 2004
Industrial products -5.7 -3.2 2.5 13.4 8.8
Crude oil 57.0 -13.8 2.5 15.8 30.7
4.5 -4.1 0.8 7.1 18.8
Source: IMF, WEO April 2005 .
Primarycommodities
Fig. II-1 Trends in world trade growth rates
12.8
15.611.6
17.5
39.241.7
4.3
12.8 13.315.8
29.3
19.5
0.6
-7.6
-2.4
6.3
1.4
8.6
18.014.5
8.8
13.6
2.76.5
-0.2
13.8
19.6
4.33.5
-1.6
3.6
-3.8
4.8
16.2
21.2
-20.0
-10.0
0.0
10.0
20.0
30.0
40.0
50.0
70 71 72 73 74 75 76 77 78 79 80 81 82 83 84 85 86 87 88 89 90 91 92 93 94 95 96 97 98 99200
0200
1200
2200
3200
4
Real export value growth rate Export price index growth rateNominal export value (goods) growth rate
Note: JETRO estimates for 2004 world trade value and growth rate.Sources: National trade statistics, and IMF, IFS .
(Year)
(%)
Table II-5 World trade indices in 1979 and 2004 Unit 2004 1979
World merchandise trade (based on exports) US$ billion 9,069 1,628
Nominal growth rate % 21.2 29.3Real growth rate % 11.8 11.6
Export price growth rate % 9.3 17.7World real GDP growth rate % 5.1 3.8
World inflation rate % 3.7 12.4
Growth in industrial production index (22 industrialized economies) % 4.4 3.4Crude oil price (average) US$/barrel 37.8 29.8
Crude oil price growth rate % 30.7 133.4
Change in nominal effective exchange rate of U.S. dollar % -8.2 -1.8Notes: 1. Real GDP growth rates based on purchasing power parity. 2. A negative change in the nominal effective exchange rate of the U.S. dollar indicates depreciation.Sources: National trade statistics, and IMF, IFS and WEO .
Crude oil
11
B. Japanese Trade
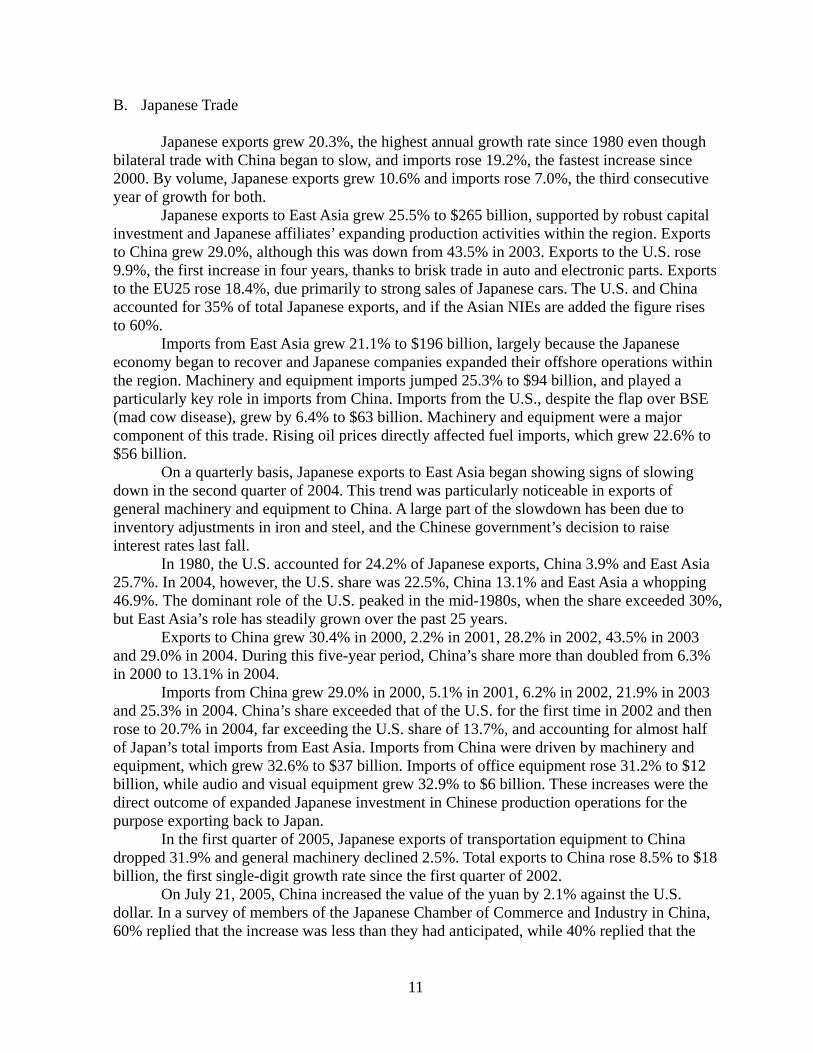
Japanese exports grew 20.3%, the highest annual growth rate since 1980 even though bilateral trade with China began to slow, and imports rose 19.2%, the fastest increase since 2000. By volume, Japanese exports grew 10.6% and imports rose 7.0%, the third consecutive year of growth for both.
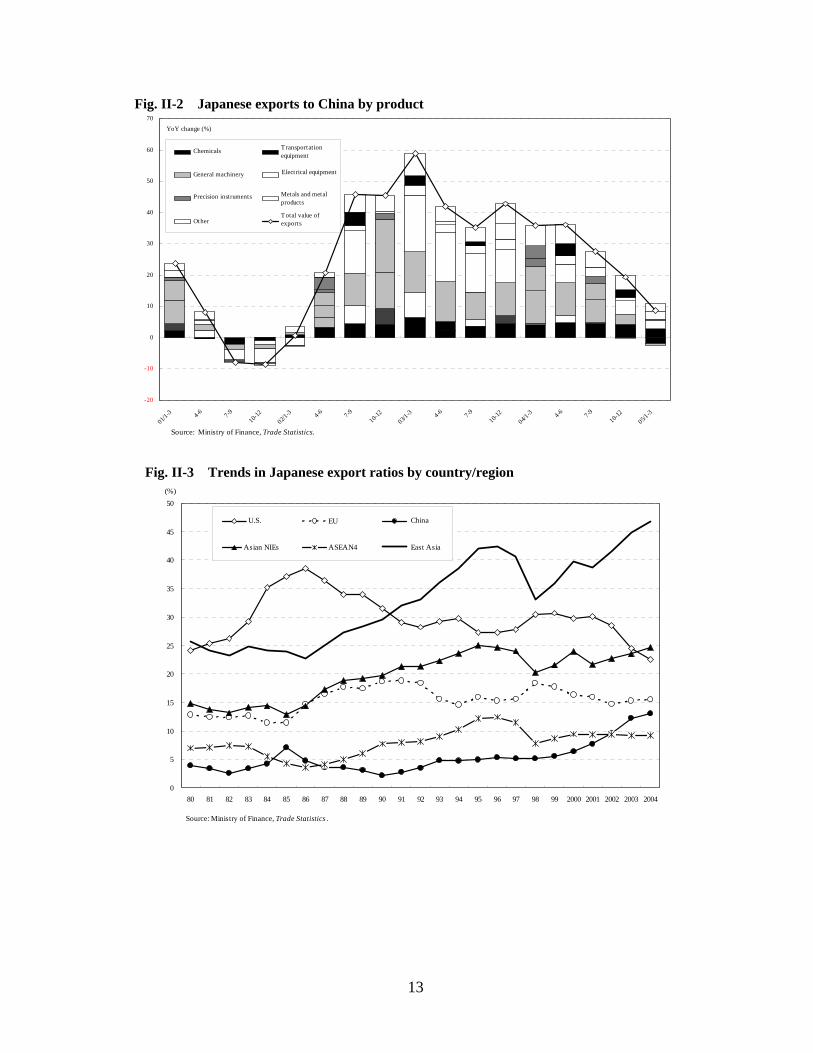
Japanese exports to East Asia grew 25.5% to $265 billion, supported by robust capital investment and Japanese affiliates’ expanding production activities within the region. Exports to China grew 29.0%, although this was down from 43.5% in 2003. Exports to the U.S. rose 9.9%, the first increase in four years, thanks to brisk trade in auto and electronic parts. Exports to the EU25 rose 18.4%, due primarily to strong sales of Japanese cars. The U.S. and China accounted for 35% of total Japanese exports, and if the Asian NIEs are added the figure rises to 60%.
Imports from East Asia grew 21.1% to $196 billion, largely because the Japanese economy began to recover and Japanese companies expanded their offshore operations within the region. Machinery and equipment imports jumped 25.3% to $94 billion, and played a particularly key role in imports from China. Imports from the U.S., despite the flap over BSE (mad cow disease), grew by 6.4% to $63 billion. Machinery and equipment were a major component of this trade. Rising oil prices directly affected fuel imports, which grew 22.6% to $56 billion.
On a quarterly basis, Japanese exports to East Asia began showing signs of slowing down in the second quarter of 2004. This trend was particularly noticeable in exports of general machinery and equipment to China. A large part of the slowdown has been due to inventory adjustments in iron and steel, and the Chinese government’s decision to raise interest rates last fall.
In 1980, the U.S. accounted for 24.2% of Japanese exports, China 3.9% and East Asia 25.7%. In 2004, however, the U.S. share was 22.5%, China 13.1% and East Asia a whopping 46.9%. The dominant role of the U.S. peaked in the mid-1980s, when the share exceeded 30%, but East Asia’s role has steadily grown over the past 25 years.
Exports to China grew 30.4% in 2000, 2.2% in 2001, 28.2% in 2002, 43.5% in 2003 and 29.0% in 2004. During this five-year period, China’s share more than doubled from 6.3% in 2000 to 13.1% in 2004.
Imports from China grew 29.0% in 2000, 5.1% in 2001, 6.2% in 2002, 21.9% in 2003 and 25.3% in 2004. China’s share exceeded that of the U.S. for the first time in 2002 and then rose to 20.7% in 2004, far exceeding the U.S. share of 13.7%, and accounting for almost half of Japan’s total imports from East Asia. Imports from China were driven by machinery and equipment, which grew 32.6% to $37 billion. Imports of office equipment rose 31.2% to $12 billion, while audio and visual equipment grew 32.9% to $6 billion. These increases were the direct outcome of expanded Japanese investment in Chinese production operations for the purpose exporting back to Japan.
In the first quarter of 2005, Japanese exports of transportation equipment to China dropped 31.9% and general machinery declined 2.5%. Total exports to China rose 8.5% to $18 billion, the first single-digit growth rate since the first quarter of 2002.
On July 21, 2005, China increased the value of the yuan by 2.1% against the U.S. dollar. In a survey of members of the Japanese Chamber of Commerce and Industry in China, 60% replied that the increase was less than they had anticipated, while 40% replied that the

12
overall effect on export/import activity would be insignificant.
Table II-6 Trends in Japanese trade 2005
Ⅰ Ⅱ Ⅲ Ⅳ Ⅰ
Exports 469,862 565,039 134,868 138,392 141,765 150,014 144,314YoY change (%) 13.0 20.3 23.6 23.0 21.2 14.3 7.0
Imports 381,528 454,669 106,883 109,650 115,138 122,997 121,301YoY change (%) 13.3 19.2 15.7 18.4 22.0 20.3 13.5
Trade balance 88,335 110,370 27,985 28,742 26,626 27,017 23,013YoY difference 9,304 22,035 11,246 8,821 4,028 -2,060 -4,972
Export volume index 102.5 113.4 109.3 113.8 115.0 115.6 107.2YoY change (%) 4.9 10.6 13.1 13.9 12.0 4.1 -1.9
Import volume index 107.1 114.6 111.3 112.5 114.4 120.0 114.4YoY change (%) 7.1 7.0 9.0 6.6 6.6 5.8 2.8
US$/barrel 29.2 36.4 31.4 34.9 38.5 40.5 40.7YoY change (%) 18.6 24.5 2.9 22.4 35.7 38.4 29.6
12.0 12.3 11.8 11.2 12.9 13.3 13.061.5 61.3 62.4 61.5 60.9 60.4 60.8
Period average 115.9 108.2 107.2 109.7 109.9 105.9 104.5YoY change (%) 8.1 7.2 10.8 8.0 7.0 2.8 2.6
Notes: 1. The base year for volume indices is 2000. 2. Exchange rates are the interbank central rate averages for the period.Sources: Ministry of Finance, Trade Statistics , and Bank of Japan, Economic Statistics Monthly .
Exchange rate(¥/$)
Crude oil import price
2003
Proportion of oil importsProportion of imports of manufactured products
(Units: US$ million, %)
2004 2004
Table II-7 Japanese exports to world and selected destinations (Unit: %)
Value YoY change YoY change Global share YoY change Global share YoY change Global share YoY change Global share YoY change Global shareTotal value 565,039 20.3 9.9 22.5 25.5 46.9 29.0 13.1 26.3 24.7 18.9 9.1Foodstuffs 2,617 13.6 6.4 17.3 14.4 66.1 52.5 11.3 10.9 48.5 -4.5 6.3Textiles and textile products 8,606 11.0 13.7 7.5 10.8 71.1 11.8 41.3 10.3 22.2 7.0 7.6Chemicals 48,245 23.9 7.0 14.4 32.2 64.5 38.4 19.0 31.6 36.2 22.7 9.3Non-metallic mineral manufactures 6,263 22.8 7.5 14.6 26.7 65.3 13.1 14.2 32.6 40.4 25.7 10.7Metals and metal products 37,513 28.6 17.5 9.8 32.3 71.1 36.2 19.0 30.4 33.8 32.2 18.4General machinery 116,453 22.6 15.4 24.2 27.7 47.1 33.5 14.6 28.7 22.9 17.7 9.6Electrical equipment 132,708 19.7 15.0 17.6 19.7 58.1 19.8 14.6 22.2 32.4 12.7 11.1Transportation equipment 130,360 14.2 3.7 35.3 17.0 13.4 9.6 3.2 17.1 5.4 22.4 4.8Precision instruments 24,108 29.7 18.6 16.7 37.7 64.8 44.2 16.5 38.5 43.1 16.0 5.2Other 58,167 21.0 10.4 22.0 28.6 51.5 44.2 14.1 25.1 28.4 19.0 9.0IT products 137,572 16.8 12.3 20.1 16.4 54.7 16.1 13.5 18.8 30.7 10.1 10.4Source: Ministry of Finance, Trade Statistics.
World U.S. East Asia China Asian NIEs ASEAN4
Table II-8 Japanese imports from world and selected origins (Unit: %)
Value YoY change YoY change Global share YoY change Global share YoY change Global share YoY change Global share YoY change Global shareTotal value 454,669 19.2 6.4 13.7 21.1 43.1 25.3 20.7 20.0 10.3 15.4 12.1Foodstuffs 48,994 11.6 -1.3 26.4 12.7 29.4 21.4 15.1 12.9 5.9 -0.2 8.4Raw materials 28,429 24.5 8.2 13.1 20.8 25.3 11.6 5.4 27.8 3.1 22.8 16.8Mineral fuels 98,636 22.9 87.1 1.5 14.4 20.3 28.8 3.3 17.6 3.4 10.7 13.6Chemicals 35,245 18.5 11.0 22.1 30.0 25.5 36.3 8.6 28.8 11.1 23.7 5.7Textile products 27,062 11.6 7.3 1.9 12.3 83.1 13.1 74.6 6.0 3.9 5.9 4.7Non-metallic mineral manufacture 5,466 15.4 28.8 11.0 15.8 48.3 15.4 28.8 13.5 8.7 18.7 10.8Metals and metal products 23,370 41.8 16.6 5.8 51.8 43.0 59.1 21.5 49.8 15.7 34.0 5.8Machinery and equipment 142,183 18.2 7.3 20.5 23.3 57.6 32.6 26.1 15.1 17.0 18.2 14.4Other 45,284 16.2 -3.1 10.7 21.3 62.4 19.9 33.3 28.1 13.5 18.9 15.6IT products 78,745 18.1 6.2 15.7 22.1 75.1 32.4 31.3 13.4 25.0 19.0 18.9Source: Ministry of Finance, Trade Statistics .
World U.S. East Asia China Asian NIEs ASEAN4
13
Fig. II-2 Japanese exports to China by product
-20
-10
0
10
20
30
40
50
60
70
01/1-3 4-6 7-9
10-12
02/1-3 4-6 7-9
10-12
03/1-3 4-6 7-9
10-12
04/1-3 4-6 7-9
10-12
05/1-3
YoY change (%)
化学製品 輸送用機器
一般機械 電気機器
精密機器 金属及び同製品
その他 輸出総額
Source: Ministry of Finance, Trade Statistics.
Chemicals
General machinery
Precision instruments
Other
Transportat ionequipment
Electrical equipment
Metals and metalproducts
Total value ofexports
Fig. II-3 Trends in Japanese export ratios by country/region
0
5
10
15
20
25
30
35
40
45
50
80 81 82 83 84 85 86 87 88 89 90 91 92 93 94 95 96 97 98 99 2000 2001 2002 2003 2004
(%)
米国 EU 中国
アジアNIES ASEAN4 東アジア
Source: Ministry of Finance, Trade Statistics .
U.S.
Asian NIEs
China
East Asia

14
Fig. II-4 Contributions to Japanese exports
-30
-20
-10
0
10
20
30
40
80 81 82 83 84 85 86 87 88 89 90 91 92 93 94 95 96 97 98 99 2000 2001 2002 2003 2004
(% YoY)
Exchange rate factorUnit value factorQuantum factorExports
Notes: 1. The export growth rate is annualized on the basis of growth rates in export quantum indices, export unit value indices and yen/dollar exchange rates for exports. 2. The exchange rate factor includes the residual generated from factor analysis.Source: Ministry of Finance
Fig. II-5 Trends in Japanese import ratios by country/region
0
5
10
15
20
25
30
35
40
45
50
80 81 82 83 84 85 86 87 88 89 90 91 92 93 94 95 96 97 98 99 2000 2001 2002 2003 2004
(%)
U.S. EU China
Asian NIEs ASEAN4 East Asia
Source: Ministry of Finance, Trade Statistics .

15
Table II-9 Japanese trade in 1980 and 2004 (Units: US$ million, %)
Value Share Value ShareTotal value 129,807 100.0 565,039 100.0Foodstuffs and other direct consumer goods 1,610 1.2 2,387 0.4Industrial materials 36,933 28.5 110,873 19.6
Industrial chemicals 6,722 5.2 47,140 8.3Metals 17,372 13.4 29,530 5.2
Capital goods 52,082 40.1 321,316 56.9General machinery 18,088 13.9 116,683 20.7Electrical equipment 12,817 9.9 122,376 21.7Transport equipment 16,044 12.4 52,912 9.4
Non-durable consumer goods 1,382 1.1 3,905 0.7Consumer durables 35,619 27.4 101,063 17.9
Passenger vehicles 16,115 12.4 74,620 13.2Toys and musical instruments 6,060 4.7 9,166 1.6Electrical appliances 5,725 4.4 2,795 0.5
Sources: JETRO, White Paper (1981), Ministry of Finance, Survey of Foreign Trade, and others.
1980 2004Product category (Units: %, yen)1980 2004
Nominal Japanese exports 26.0 20.3Volume of Japanese exports 16.7 10.6
Yen/US$ 3.5 -6.7Yen/US$ (actual value) 226.74 108.19
U.S. GDP -0.2 4.4World GDP 2.3 5.1CRB index 15.6 16.5Note: Year-on-year growth rates.Sources: IMF, Ministry of Finance, and others.
III. FDI Recovers Globally and Increases in Japan
A. Global FDI
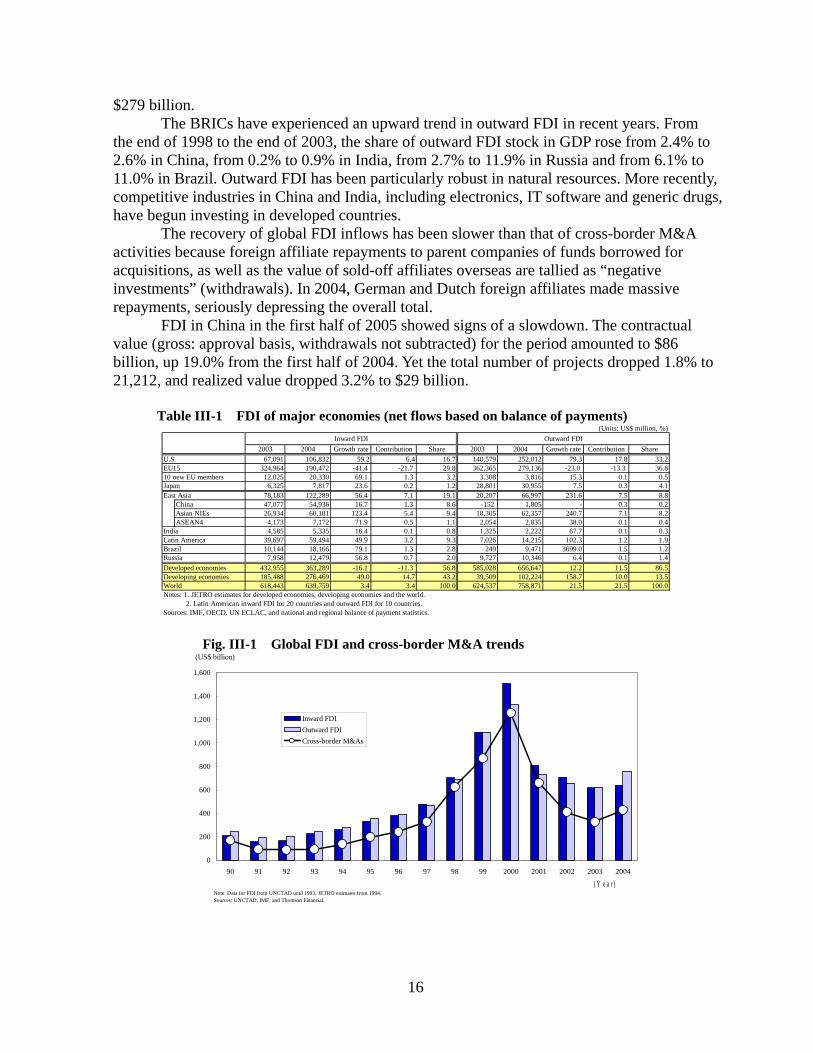
In 2004, global foreign direct investment (FDI) grew 3.4% and cross-border M&A
30.9%, the first increase for both in four years. Global FDI inflows, which peaked in 2000 at $1,500 billion (net inflows on an
international-balance-of-payments basis), quickly began to shrink with the bursting of the IT bubble and falling stock prices, dropping as low as $620 billion in 2003. But according to JETRO estimates, it recovered somewhat in 2004, to $640 billion, reflecting global economic expansion since 2003, accompanied by improvements in corporate profits and stock prices. This recovery revived cross-border M&A and FDI in East Asia and other developing countries.
The U.S. and East Asia accounted for almost 40% of total global FDI inflows. The U.S. remained the largest recipient of FDI at $107 billion, up 59.2%; East Asia received $122 billion, up 56.4%; the Asian NIEs $60 billion (more than double that of the previous year); ASEAN4 $7 billion, up 71.9%; and China, the fourth largest recipient had a record $55 billion, up 16.7%.
In 2004, cross-border M&A (based on completed deals) totaled $429 billion, up 30.9%. M&A in finance and insurance was up 54.3%. M&A in real estate also did very well, rapidly increasing its share in total M&A from 1.1% in 2000 to 9.4% in 2004; so did M&A by investment companies, which grew from 3.4% in 2000 to 15.5% in 2004. These developments point to a trend toward higher operating profits. Brisk recovery has continued into 2005. In the first half of 2005, cross-border M&A totaled $256 billion, up 30.2% from the first half of 2004.
Among countries and regions apart from the U.S. and East Asia, direct investment in Central and South America increased for the first time in five years, while the 10 new members of the EU and Russia also saw increases. However, direct investment in 15 EU members, some of which had been experiencing withdrawals, continued to fall, dropping 41.4% to $191 billion.
In 2004, global FDI outflows increased 21.5% to $759 billion, according to JETRO estimates. The U.S. saw a 79.3% increase to $252 billion (contribution ratio of 17.8%). East Asia had $67 billion, up 231.6%. In contrast, the 15 EU members saw a 23.0% decrease to
16
$279 billion. The BRICs have experienced an upward trend in outward FDI in recent years. From
the end of 1998 to the end of 2003, the share of outward FDI stock in GDP rose from 2.4% to 2.6% in China, from 0.2% to 0.9% in India, from 2.7% to 11.9% in Russia and from 6.1% to 11.0% in Brazil. Outward FDI has been particularly robust in natural resources. More recently, competitive industries in China and India, including electronics, IT software and generic drugs, have begun investing in developed countries.
The recovery of global FDI inflows has been slower than that of cross-border M&A activities because foreign affiliate repayments to parent companies of funds borrowed for acquisitions, as well as the value of sold-off affiliates overseas are tallied as “negative investments” (withdrawals). In 2004, German and Dutch foreign affiliates made massive repayments, seriously depressing the overall total.
FDI in China in the first half of 2005 showed signs of a slowdown. The contractual value (gross: approval basis, withdrawals not subtracted) for the period amounted to $86 billion, up 19.0% from the first half of 2004. Yet the total number of projects dropped 1.8% to 21,212, and realized value dropped 3.2% to $29 billion.
Table III-1 FDI of major economies (net flows based on balance of payments)
(Units: US$ million, %)
2003 2004 Growth rate Contribution Share 2003 2004 Growth rate Contribution ShareU.S. 67,091 106,832 59.2 6.4 16.7 140,579 252,012 79.3 17.8 33.2EU15 324,964 190,472 -41.4 -21.7 29.8 362,365 279,136 -23.0 -13.3 36.810 new EU members 12,025 20,330 69.1 1.3 3.2 3,308 3,816 15.3 0.1 0.5Japan 6,325 7,817 23.6 0.2 1.2 28,801 30,955 7.5 0.3 4.1East Asia 78,183 122,289 56.4 7.1 19.1 20,207 66,997 231.6 7.5 8.8
China 47,077 54,936 16.7 1.3 8.6 -152 1,805 - 0.3 0.2Asian NIEs 26,934 60,181 123.4 5.4 9.4 18,305 62,357 240.7 7.1 8.2ASEAN4 4,173 7,172 71.9 0.5 1.1 2,054 2,835 38.0 0.1 0.4
India 4,585 5,335 16.4 0.1 0.8 1,325 2,222 67.7 0.1 0.3Latin America 39,697 59,494 49.9 3.2 9.3 7,026 14,215 102.3 1.2 1.9Brazil 10,144 18,166 79.1 1.3 2.8 249 9,471 3699.0 1.5 1.2Russia 7,958 12,479 56.8 0.7 2.0 9,727 10,346 6.4 0.1 1.4Developed economies 432,955 363,289 -16.1 -11.3 56.8 585,028 656,647 12.2 11.5 86.5Developing economies 185,488 276,469 49.0 14.7 43.2 39,509 102,224 158.7 10.0 13.5World 618,443 639,759 3.4 3.4 100.0 624,537 758,871 21.5 21.5 100.0Notes: 1. JETRO estimates for developed economies, developing economies and the world. 2. Latin American inward FDI for 20 countries and outward FDI for 10 countries.Sources: IMF, OECD, UN ECLAC, and national and regional balance of payment statistics.
Inward FDI Outward FDI
Fig. III-1 Global FDI and cross-border M&A trends
0
200
400
600
800
1,000
1,200
1,400
1,600
90 91 92 93 94 95 96 97 98 99 2000 2001 2002 2003 2004
Inward FDIOutward FDICross-border M&As
(US$ billion)
Note: Data for FDI from UNCTAD until 1993, JETRO estimates from 1994.Sources: UNCTAD, IMF, and Thomson Financial.
( Y e a r )

17
Fig. III-2 Trends in M&As in real estate and by investment firms
0
10,000
20,000
30,000
40,000
50,000
60,000
70,000
90 91 92 93 94 95 96 97 98 99 2000 2001 2002 2003 2004 (Year)
(US$ million)
0.0
2.0
4.0
6.0
8.0
10.0
12.0
14.0
16.0
18.0(%)
投資会社などによるM&A(金額)
不動産業に対するM&A(金額)
投資会社などのM&A(割合)
不動産業に対するM&A(割合)
Note: Completed cross-border deals. "Share" indicates the percentage of the total value of global cross-border M&As. "M&As by investmentfirms" indicates mergers and acquisitions by investment firms and other financial institutions for the purpose of investment returns.Source: Thomson Financial.
M&As by investment firms (value)
M&As in real estate industry (value)
M&As by investment firms (share)
M&As in real estate industry (share)
Table III-2 Examples of outward FDI from BRICs (from 2004) Country Company Industry Examples of investments
Lenovo Electrical/electronics May 2005 US$1.25 billion purchase of IBM's personal computer business
TCL Electrical/electronicsAugust 2004 establishment of TV/DVD manufacturing joint venture with Thomson of FranceAugust 2004 establishment of cellphone joint venture with Alcatel of France (announcement in May 2005 ofdissolution to form wholly-owned subsidiary)
Haier Electrical/electronics June 2005 proposed US$1.28 billion takeover of major U.S. appliance maker Maytag in partnership with U.S.investment firm
SAIC Automotive October 2004 purchase of Korean car maker Ssangyong for US$500 million
CNOOC Petroleum April 2005 17% (US$120 million) stake in Canadian oil sand enterprise MEG EnergyJune 2005 US$18.5 billion takeover offer for U.S. oil major Unocal
Tata ConsultancyServices IT software November 2004 acquisition of 10% stake in Philippine IT company Philippine Dealing System Holdings
June 2005 decision to establish Chinese joint venture by Microsoft of U.S. and Chinese companies
Infosys Technologies IT software January 2004 acquisition of Australian IT services firm Expert Information ServicesApril 2004 establishment of consulting company in Texas
Wipro IT software August 2004 establishment of local subsidiary in ShanghaiMay 2005 establishment of third German office in Munich
Ranbaxy Pharmaceuticals January 2004 purchase of Aventis' French generics operationJune 2005 purchase of generics operation of Spain's Efarmes
Oil and Natural GasCorporation(ONGC) Petroleum Acquisition of oilfield exploration rights in Australia in August 2004, and in Qatar and Egypt in March 2005
Severstal SteelJanuary 2004 acquisition of fifth biggest U.S. steelmaker Rouge Industries, which had filed for bankruptcy, forUS$290 millionApril 2005 acquisition of Italian large steel maker Lucchini for US$580 million
Norilsk Nickel Nickel March 2004 US$1.2 billion acquisition of 20% stake in South Africa's Gold Fields, world's fifth-ranked goldproducer
Itera Gas May 2004 acquisition of 78% share of Texas oil and gas firm Dune Energy
AmBev Beer August 2004 purchase of Canadian brewer John Labatt, part of Interbrew group, in conjunction with merger withBelgium's Interbrew, for US$7.8 billion
Petrobras Petroleum May 2004 establishment of Beijing liaison office and oil exploration agreement with Sinopec
WEG Motor manufacturing August 2004 establishment of branch in Bangalore, IndiaNovember 2004 takeover of Nantong Electric Motor Manufacturing
Note: Includes some investment proposals and planned investments.Sources: JETRO, Jetro Daily, corporate websites, news media, and others.
Chi
naIn
dia
Rus
sia
Bra
zil

18
B. Japanese FDI
In FY2004, Japan’s FDI inflow exceeded outflows, the first such reversal since FY1961 when record-keeping began. Japan’s FDI outflow in East Asia was up 47.3%.
Japan’s FDI inflow in FY2004 was double that of the previous year, or $37 billion, a record, while Japan’s FDI abroad, down 1.5%, was $35 billion. FDI inflow doubled because the “loans” to Japanese corporations made by U.S. financial institutions more than quadrupled, to $19 billion. However, foreign M&A in Japan was down 18.7%, to $10 billion.
In recent years, FDI inflow to Japan has steadily increased because of economic recovery, deregulation, and gradual adoption of international practices in corporate management, such as governance and accounting. Some foreign companies have begun to locate corporate headquarters for Asia in Japan, while others, like Cisco Systems and AMD, have set up R&D centers in Japan.
Of Japan’s FDI outflow in FY2004, the amount invested in the U.S. was down 55.8% to $4.7 billion, primarily because of large reductions in electric machinery. In contrast, FDI in East Asia was up 47.3% to $9 billion, owing to increased investments in transportation equipment, iron and steel, foods, finance and insurance. FDI in China was $4.6 billion, up 45.3%, the fifth consecutive annual increase. Japanese FDI abroad increased in categories such as iron and steel, electric machinery, retail, and foods, but most remarkably in transportation equipment, which nearly doubled to $1.7 billion. Indeed, the share of Japanese FDI to China in transportation equipment accounted for 46% of the industry total in FY2004, compared with 28.1% in FY2003. Investment in the EU was up 2.7% to $13 billion.
Japan’s direct investment abroad reached $68 billion in FY1999 at the peak of the IT bubble, but since then has hovered between $30 to $40 billion.
In FY2004, Japan’s FDI inflow reached $37 billion (2.0 times the previous year) on reports and notifications basis, or $10 billion (2.2 times) on balance of payments (BOP) basis. The latter amount is smaller because in BOP statistics withdrawals are subtracted (net figures) and some transactions within groups are included. For 2004, inward FDI stock in Japan rose $7.5 billion to $97 billion.
FDI in Japan, meanwhile, has been growing owing to M&A of Japanese corporations by foreign corporations. Among the largest transactions in 2004 were Vodafone’s (UK) increased stake in its Japanese affiliate (a total of $4 billion in June and July 2004) and the purchase of DDI Pocket by the U.S. Carlyle Group and Kyocera ($2 billion in October 2004). Among notable developments in 2004 were investment funds’ continued participation in the real estate industry, as well as their involvement in, and purchase of, corporations in reorganization or bankruptcy.
In preparation for Japan’s lifting of the ban on triangular mergers expected in FY2007, interest in hostile takeovers and corporate defense among Japanese corporations has rapidly heightened. Many hope this process will entail introduction of highly transparent and objective disclosure rules which are beneficial to stockholders, lest investment interest of foreign companies wane or dissipate.
Japanese corporate cross-border M&A in 2004 dropped 33.5%, to $5 billion, and the number of cases by five to 141. The value of these activities had exceeded $20 billion for both 2000 and 2001, but since 2002 has continued dropping each year. However, in business services such as computer-related services, these activities have increased rapidly from $11 million in 2003 (five cases) to $300 million (14 cases) in 2004.

19
Fig. III-3 Trends in Japanese FDI
0
10000
20000
30000
40000
50000
60000
70000
80000
80 81 82 83 84 85 86 87 88 89 90 91 92 93 94 95 96 97 98 99 2000 2001 2002 2003 2004
対外投資 対内投資
(US$ million)
(Fiscal year)Sources: Ministry of Finance, Japanese Inward and Outward Direct Investment .
Inward FDI > outward FDI
$18.7 billion of this was intercompany loans
Outward FDI Inward FDI
Fig. III-4 Trends in out-in Japanese M&As
ValueNumber
0
2,000
4,000
6,000
8,000
10,000
12,000
14,000
16,000
18,000
20,000
95 96 97 98 99 2000 2001 2002 2003 20040
20
40
60
80
100
120
140
160
180No. of deals (right axis)
Value
(US$ million) (Number)
Source: Thomson Financial.

20
Table III-3 Firms with Asian headquarters or R&D facilities in Japan Company Country Industry Remarks
Dupont U.S. Chemicals
Dupont's main Japanese customers are major Japanese auto, electrical equipment andother manufacturers. Most of these customers have R&D facilities in Japan andgenerally develop and test products after selecting materials in Japan. Some of thesecustomers are shifting manufacturing to China and elsewhere in Asia, but Dupont'sstrategy is to market materials to Japanese customers' headquarters during the producttesting phase, after which Dupont's Asian subsidiary undertakes actual supply tocustomers' local subsidiaries. (March 31, 2004, Nikkei Industry Daily )
Nihon L'Oréal France Cosmetics
Japan is the company's development center for Asia. "Japan's cosmetics practices havebecome the model for Asian women. We already have products developed for Japanthat have been introduced in China as well. Shu Uemura (which became an affiliate inJanuary 2004) in particular is a much-anticipated brand in China." (Marc Guerin,vice president, September 17, 2004, Nikkei Industry Daily )
Saint-Gobain France Glass
The firm established its Asia-Pacific headquarters in Japan to avail itself of advancedJapanese R&D capabilities. The company has numerous production sites in R.O.K.,China, and southeast Asia, taking advantage of low labor costs (it has around 10,000employees, including Japanese staff). "Whether to choose China or Japan is a sillyquestion. They supplement each other and each is indispensable to our Asianstrategies." (Jean-Louis Beffa, president, in remarks to a 2003 invest in Japansymposium)
GE Toshiba Silicones U.S. Chemicals
The company shifted its Asia-Pacific regional headquarters from Hong Kong to Japanin 1999 as part of its plans to split the globe into three sectors. It oversees operationsin 12 Asia-Pacific countries and production plants in Gumma Prefecture, Shanghai,Shenzhen, Malaysia and Thailand. It has about 1,000 employees in Asia.
Sources: Newspaper reports, corporate press releases, and others.
Table III-4 Trends in Japanese outward FDI by country (Units: US$ million, %)
Value Growth rate Share
North America 8,449 10,680 4,836 -54.7 13.6U.S. 8,215 10,577 4,677 -55.8 13.2
Latin America 5,746 5,262 6,371 21.1 17.9Europe 15,428 12,623 12,963 2.7 36.5Asia 5,669 6,399 9,388 46.7 26.4
East Asia 5,250 6,233 9,183 47.3 25.8 China 1,766 3,143 4,567 45.3 12.8 Asian NIEs 1,961 1,154 2,678 132.1 7.5 ASEAN4 1,523 1,936 1,938 0.1 5.5Vietnam 60 70 109 56.3 0.3India 310 87 97 10.7 0.3
Oceania 1,335 1,006 1,869 85.8 5.3Other 391 240 260 8.5 0.7
FY2003
Note: Bank of Japan average interbank rate for period used to convert yen amounts to U.S. dollars.Sources: Finance Ministry, Japanese Inward and Outward Direct Investment , Bank of Japan, ForeignExchange Rates.
FY2004FY2002
(Units: US$ million, %)
Manufacturing Value 11,741 14,218 14,689 16,246 13,750Growth rate -72.3 21.1 3.3 10.6 -15.4
Non-manufacturing Value 37,043 17,796 21,860 19,599 21,010Growth rate 48.7 -52.0 22.8 -10.3 7.2
Branches Value 251 283 309 248 788Growth rate 22.0 13.1 9.1 -19.9 218.3
Total Value 49,034 32,297 36,858 36,092 35,548Growth rate -27.4 -34.1 14.1 -2.1 -1.5
Note: Bank of Japan average interbank rate for period was used to convert data published in yen amounts to U.S.dollars.Sources: Ministry of Finance, Japanese Inward and Outward Direct Investment , Bank of Japan, Foreign ExchangeRates .
FY2004FY2000 FY2001 FY2002 FY2003
IV. Growth Strategies for Japanese Corporations
Japanese corporations must devise specific strategies to grow and increase profitability worldwide, particularly in East Asia and the BRICs. Since the end of the bubble economy, Japanese corporations have made every effort to improve their profitability and financial standing. While they have achieved some success, there still is room for improvement. They lag behind their U.S. counterparts in sales growth and profitability, particularly in ROE, and are known for putting long-term goals ahead of short-term profit. Moreover, they have yet to attain the speed and flexibility of their American counterparts in taking bold action, such as M&As. But despite stagnant domestic demand, they have balanced their books, so now they must grow and improve profitability.
Japanese corporations must pursue four strategies: (1) increase competitiveness in volume products by improving product development at factories in East Asia; (2) devise strategies to protect intellectual property across borders to recover R&D investment while

21
enhancing competitiveness; (3) strengthen brand power and enhance product differentiation through new product development; and (4) prepare for business risks while aggressively pursuing markets in the growing BRICs economies.
These growth strategies, together with advantages from existing production and procurement networks in East Asia, will enable Japanese corporations to enhance the value of their manufacturing prowess.
Table IV-1 Comparison of Japanese and U.S. corporate profits (manufacturing)
(Unit: %)
Japan U.S. Japan U.S.1970s 13.2 10.4 15.1 13.31980s 4.5 3.9 8.2 12.21990s 0.3 4.9 3.6 13.02000s -2.9 2.0 2.4 10.52000 6.5 9.6 3.2 15.12001 -9.1 -5.6 0.2 2.02002 -1.4 -1.7 2.2 7.52003 2.0 4.1 3.9 11.52004 - 12.2 - 15.1
Notes: After-tax profits. Fiscal year for Japan.
Change in revenue(annual % change) ROE
Sources: Ministry of Finance, Financial Statements Statistics of Corporations by Industry,U.S. Department of Commerce, Fourth Quarter Financial Reports .
Fig. IV-1 Obstacles to growth for Japanese, Western and Chinese electronics firms
Japanese manufacturers Western manufacturers Chinese manufacturers
Size ○ ○ X
Growth prospects △ ○ ○
Profitability △ ○ ○
Corporate restructuring △ ○ △
Overseas market expansion △ ○ X
R & D ○ ○ X
Delayed restructuring
Western manufacturers' efforts to strengthen competitiveness lead to increased growth and profitability.Japanese manufacturers' efforts to strengthen competitiveness are insufficient, so growth and profitability fall short of their western counterparts.Chinese manufacturers have shown solid growth and profitability, but this has been due to domestic demand, so their international competitiveness is weak.
Notes: 1. ○= good, △= fair and X = poor. Solid lines show business strategies linked to corporate results, and dotted lines show an absence of such linkages. 2. The "Death Valley" phenomenon refers to dead-end R&D that does not lead to product development or new business.Source: JETRO.
Dynamic restructuring
Weak forays intogrowing markets,and weak brand
Vanguard ofgrowth markets
"DeathValley"phenomenon
R&Dsuccessescontribute tobottom line
Some firms carrying bad loans
Growth due todomestic demand,so late starter inoverseas markets
Weak in-houseR&D, so unableto join ranks ofworld leaders
A. Growth Strategy 1: Increased Localization of Product Development in East Asia
Example: Japanese automakers in Thailand Expensive high-tech cars are profitable in Japan, North America and Europe, but these
markets have limited growth potential. In contrast, double-digit growth in car sales continues

22
in East Asia, especially in China. As motorization increases in these emerging markets, it is essential to offer high-quality cars at low prices, since mass-production models will face fierce competition from European, South Korean and, in time, Chinese cars in the medium- to low-price range. Creating the lowest-cost production system will be a key to success.
Japanese automakers have benefited from the ASEAN Free Trade Area (AFTA), and are using their production bases as pivots to step up intra-regional procurement of parts and nurture local manufacturing operations while enhancing local ability to build low-cost production systems. Their primary aims in local development are to 1) shorten the lead times of development, production and sales, 2) cut costs through localization and 3) cope with the shortage of engineers in Japan.
Since the formation of AFTA, the types of auto parts procured in Thailand have shifted from those specifically for local use to those used worldwide in so-called innovative international multipurpose vehicles (IMVs). Japanese enterprises are rushing to build procurement centers to supply ASEAN-procured auto parts not just within East Asia, but markets worldwide as well.
From development to production, there are six stages of automobile manufacturing: 1) basic research (such as fuel cells), 2) advanced technology development (engines), 3) product development, 4) adaptive technologies (models for specific markets), 5) production technologies (improved efficiency), and 6) production (including quality control). While all six stages are performed in Japan, operations in Thailand cover only stage 4 to 6.
Japanese auto plants in the ASEAN region traditionally supplemented operations in Japan, generally to produce for local markets. But during the 10-year period in which AFTA has enabled Thailand to establish an auto industry, investment has geared up these plants to produce cars for the global market. Thailand now supplies pickup trucks to the entire world. Thailand is also one of the few countries that major automakers have chosen for R&D bases.
Toyota’s IMV and Isuzu’s D-MAX pickup trucks were both developed specifically for Thailand, but are also doing well in many other markets. Toyota’s Thai plant, the production base for IMVs, now supplies diesel engines and other parts to India, South Africa and eight other countries. This plant is now regarded as a “mother plant” since it performs parts procurement, production, and distribution. As such, if the plant were to stop operating for some reason, all Toyota factories worldwide would also have to shut down.
Toyota and Isuzu are making substantial investments in Thailand to significantly increase production. They are designing new models there, instead of in Japan, to improve quality and reduce costs, making the new models even more competitive. This past May, Toyota opened a technical center, the first of its kind in East Asia, near Bangkok (see below).
When considering Thailand as an R&D center site, all automakers point to one problem: a shortage of engineers and other appropriate personnel. The shortage is now so acute that automakers cannot find the employees they need. If parts suppliers follow automakers and move their R&D functions to Thailand, as they have usually done elsewhere, personnel demand will quickly rise. Thailand has few engineers with experience in automobile development, so R&D will have to start from scratch. While Thai engineering graduates are said to be better than their Japanese counterparts, only one university-level auto-engineering course is offered in Thailand, at the national Chulalongkorn University.
23
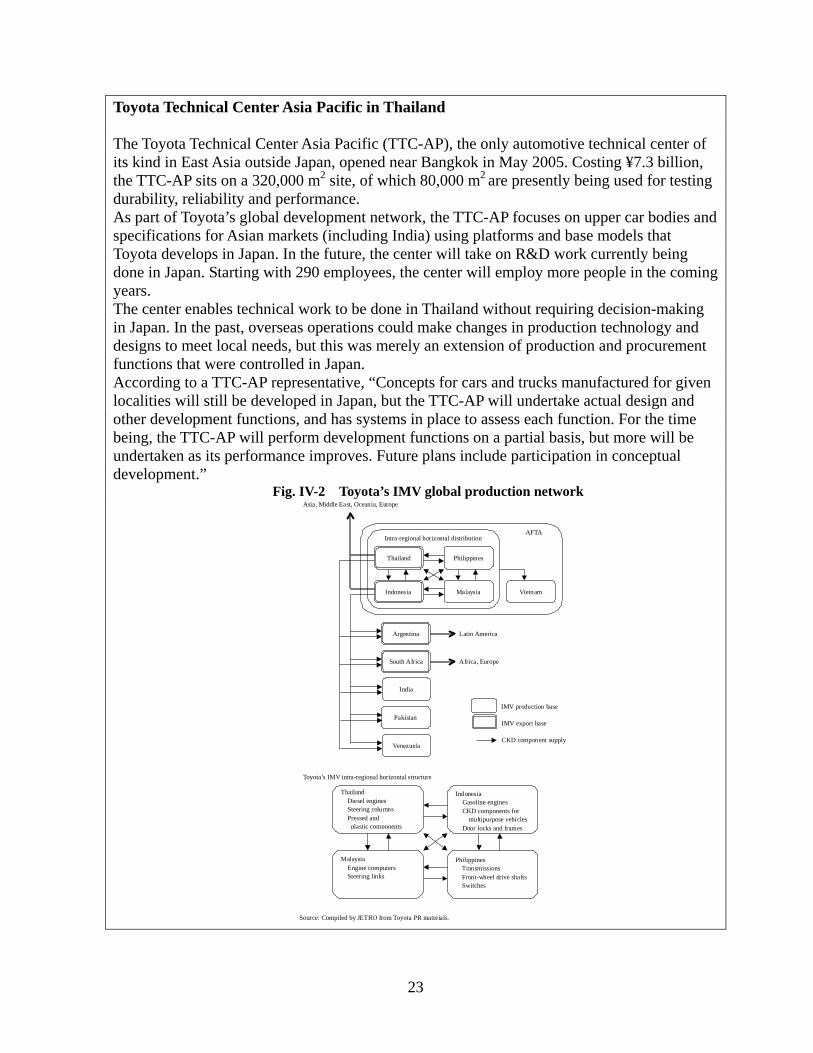
Toyota Technical Center Asia Pacific in Thailand The Toyota Technical Center Asia Pacific (TTC-AP), the only automotive technical center of its kind in East Asia outside Japan, opened near Bangkok in May 2005. Costing ¥7.3 billion, the TTC-AP sits on a 320,000 m2 site, of which 80,000 m2 are presently being used for testing durability, reliability and performance. As part of Toyota’s global development network, the TTC-AP focuses on upper car bodies and specifications for Asian markets (including India) using platforms and base models that Toyota develops in Japan. In the future, the center will take on R&D work currently being done in Japan. Starting with 290 employees, the center will employ more people in the coming years. The center enables technical work to be done in Thailand without requiring decision-making in Japan. In the past, overseas operations could make changes in production technology and designs to meet local needs, but this was merely an extension of production and procurement functions that were controlled in Japan. According to a TTC-AP representative, “Concepts for cars and trucks manufactured for given localities will still be developed in Japan, but the TTC-AP will undertake actual design and other development functions, and has systems in place to assess each function. For the time being, the TTC-AP will perform development functions on a partial basis, but more will be undertaken as its performance improves. Future plans include participation in conceptual development.”
Fig. IV-2 Toyota’s IMV global production network
Thailand
Indonesia
Philippines
Pakistan
Venezuela
Argentina
South Africa
Malaysia
India
Vietnam
Intra-regional horizontal distribution AFTA
Latin America
Africa, Europe
Asia, Middle East, Oceania, Europe
IMV export base
IMV production base
CKD component supply
Toyota’s IMV intra-regional horizontal structure
Philippines Transmissions Front-wheel drive shafts Switches
Thailand Diesel engines Steering columns Pressed and plastic components
Indonesia Gasoline engines CKD components for
multipurpose vehicles Door locks and frames
Malaysia Engine computers Steering links
Source: Compiled by JETRO from Toyota PR materials.

24
B. Growth Strategy 2: Protect Intellectual Property for Better Returns on R&D
Japanese corporations are good at gaining large market shares with products
manufactured using original technologies, but they are seldom able to lead when the technologies mature and general-purpose core parts become widely available. This is because they have allowed their technologies to be used by overseas companies without demanding adequate compensation, and they have neglected to deal effectively with the consequences. In many cases, this has allowed other companies in East Asia and elsewhere to gain solid shares of markets for low-cost, general-purpose products, then reap profits and acquire additional technologies that enable them to increase their shares of markets for more advanced products.
To stop this, Japanese corporations must devise better strategies for patenting inventions and securing technologies, and take immediate action when patent infringements occur, including raising the cost to patent violators. Strategies for protecting intellectual property must be devised from a long-term global perspective by taking into account factors such as maintaining the secrecy, growth potential and market durability of a given technology, as well as market developments and product distribution in specific countries. The ultimate aim is to recoup R&D investment and enhance global competitiveness.
To properly secure proprietary knowledge, Japanese corporations must: 1) increase incentives to retain personnel who have been given access to proprietary knowledge and strengthen their obligations not to move to a competitor either before or after retirement, 2) clarify to employees the illegality of disclosing proprietary knowledge and 3) tighten controls on physical or electronic access to vital knowledge.
Meanwhile, the government has increased intellectual property protection in Japan by revising the Unfair Competition Prevention Law. For example, the disclosure of trade secrets outside Japan is now punishable; before, such an act was punishable only when committed in Japan. Also, before the revision, the law called for criminal penalties only when tangible media, such as CD-ROMs, were removed from company premises. Now, however, someone who leaves an employer after promising a new employer access to trade secrets is also subject to criminal penalty. New rules also call for stronger penalties for corporations convicted of violations.
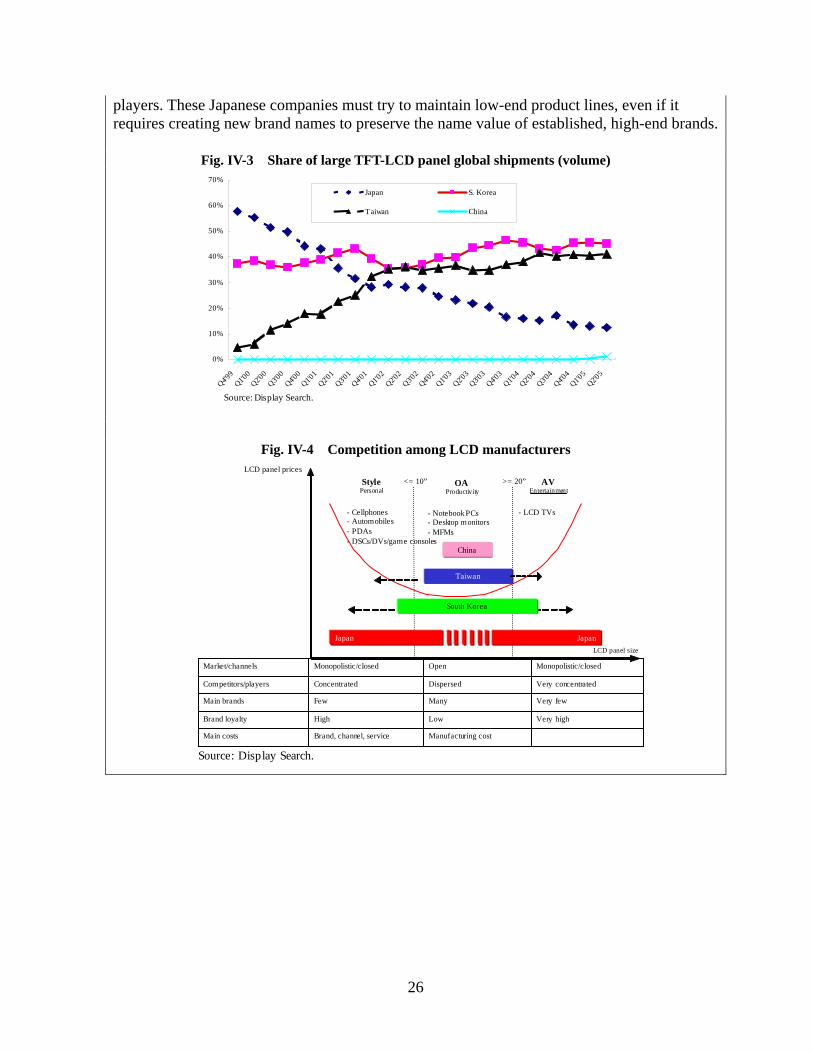
Examples of inadequate protection of patents and knowledge by Japanese corporations abound. Japanese companies patented a number of technologies on liquid crystal panels, but today South Korean and Taiwanese companies lead the field in production. Japanese corporations also led in development and sales of notebook PCs, but now Taiwanese companies have increased their production share, while U.S. companies are stronger in brand names. In the global markets for digital home electronics in 2003, Japanese corporations accounted for 27% of the downstream market (final products), 51% of the midstream market (electronic parts) and 65% of the upstream market (digital material).
As distribution becomes increasingly internationalized and production bases shift from Japan to East Asia, technologies must be protected across a wider scope of countries, requiring corporations to patent more products and areas of expertise. Moreover, in China and other countries, patent application processing takes a long time, technological copying is rampant and enforcement of existing patent laws is woefully inadequate, particularly at the time of discovering the violation. This prompts some to argue that production and other technologies that can be kept secret should be, since the patenting process requires disclosure of detailed

25
information. Japanese corporations need to combine management, business, R&D, and patent
strategies into a single long-term vision. When they participate in government-sponsored research projects targeting fields that are not important to their core businesses, they tend to sell the resulting patents rather cheaply to East Asian companies, sometimes weakening the competitiveness of other Japanese corporations in related fields. The Japanese government should make it a national policy to support vanguard companies when sponsoring joint-research projects.
To increase competitiveness in digital home electronics, Japanese corporations need to devise strategies that not only protect intellectual property, but also specify methods for supplying OEM products, retaining basic software and offering a line of low-priced products. Maintaining Competitiveness in Digital Home Electronics Protecting intellectual property
Japanese corporations first need to devise strategies on patenting inventions and securing proprietary knowledge. Second, they must make every effort to retain employees who have had access to important knowledge that might affect a company’s competitiveness. Third, they must aggressively protect their leading positions in the strategic field of digital home electronics, where Chinese and Taiwanese corporations still have few patents and their regard for patent rights are lax. Japanese corporations should diligently acquire patents in places where they make products, such as Taiwan, and also in the U.S. and EU, the most likely final destinations for these products. Patent infringement is difficult to resolve through lawsuits in Taiwan and other producer countries, but is much easier in the U.S. and EU when patent-infringing products are sold in these markets. This is why Japanese companies should work with American and European companies when patent infringement occurs. Standardization
When technologies mature and standardized, general-purpose basic parts become universal, Japanese corporations tend to lose the ability to lead the global market. In response, they must incorporate their original core parts into finished OEM products and in as many of their own products as possible, while also finding ways to increase the number of those products. This increases in-house demand for self-manufactured core components, making them as competitive as similar components from competitors. Eliminating standardized-product monopolies
Japanese companies or corporate groups should try to dominate the operating systems and microprocessors they use. When this is not realistic, they must establish a forum or consortium and adopt common operating systems and microprocessors to prevent monopolization by a foreign enterprise. New competition in high-tech products
Taiwanese and South Korean companies, previously manufacturers of mass-produced low-end products, have entered many medium- to high-end product markets, taking away share from the Japanese companies that originally developed these products and are still main
26
players. These Japanese companies must try to maintain low-end product lines, even if it requires creating new brand names to preserve the name value of established, high-end brands.
Fig. IV-3 Share of large TFT-LCD panel global shipments (volume)
0%
10%
20%
30%
40%
50%
60%
70%
Q4'99
Q1'00
Q2'00
Q3'00
Q4'00
Q1'01
Q2'01
Q3'01
Q4'01
Q1'02
Q2'02
Q3'02
Q4'02
Q1'03
Q2'03
Q3'03
Q4'03
Q1'04
Q2'04
Q3'04
Q4'04
Q1'05
Q2'05
Japan S. Korea
Taiwan China
Source: Display Search.
Fig. IV-4 Competition among LCD manufacturers
China
LCD panel prices
LCD panel size
OAProductivity
- Notebook PCs- Desktop monitors- MFMs
AVEntertainment
- LCD TVs
StylePersonal
- Cellphones- Automobiles- PDAs- DSCs/DVs/game consoles
Taiwan
South Korea
Japan
Very highLowHighBrand loyalty
Manufacturing costBrand, channel, serviceMain costs
Very fewManyFewMain brands
Very concentratedDispersedConcentratedCompetitors/players
Monopolistic/closedOpenMonopolistic/closedMarket/channels
>= 20”<= 10”
Japan
Source: Display Search.

27
C. Growth Strategy 3: Improving Brand Power Triggered by FTAs, intra-industry trade in East Asia is expected to expand between
fields such as automotives and home electronics. This will be propelled by: 1) increasing middle-class consumers throughout the region, 2) intensifying competition between Japanese corporations and their South Korean counterparts in value-added fields and 3) the rise of Chinese manufacturers in lower-end categories.
In the face of increasing East Asian competition, Japanese corporations must focus on product differentiation. One way to do this is by establishing brand names through marketing and design. Samsung is an outstanding example of global success in this regard.
Brand name is a fifth resource, after personnel, goods, capital and intellectual property. Japanese companies could use distinctive products to enhance their global brand power, such as 1) content (film, TV programs, music, games and sports), 2) regional goods, such as traditional crafts and certain agricultural products, and 3) corporate branding, particularly in the U.S. and Europe.
To strengthen its brand name, Samsung has promoted not only its products (semiconductors, computer displays and cell phones), but also the efforts of its visionary CEO in overcoming the South Korean financial crisis of 1997-98, and the company’s image as a manufacturer of world-leading products.
Various regions in Japan have created brands for distinctive products based on traditional craftsmanship, promoting them in overseas markets. Some have exhibited their products in Europe to improve recognition.
Fig. IV-5 Intra-industry trade indices by country
0
0.2
0.4
0.6
0.8
1
95 00 04日本
98 00 04タイ
95 00 04中国
95 00 04米国
96 00 04ドイツ
Note: Intra-industry trade indices were calculated based on four-digit HS codes, using Aquino's Q correction ofGrubel and Lloyd's B distortion and the Bank of Japan's Analysis of East Asian Trade .Sources: National customs statistics.
High
Low
Level of intra-industry trade
(Indicators)
Japan Thailand China U.S. Germany
a) Samsung’s marketing strategy in China
In 2000, Samsung completely altered its image by using Hong Kong star Kelly Chen in an advertising campaign. Campaigns stressing the company’s brand identity were run during strategic periods in the Chinese calendar, namely, spring (lunar New Year), May Day, summer, national holidays, and the end of the year.
In 2001, the company employed South Korean actor An Jae Wook, a very popular star

28
in China, for computer monitor ads. By appealing to young consumers, Samsung computer monitor sales in China shot up 50% to 1.6 million units.
In 2003, the company devised effective marketing strategies for the Olympic Games and soccer. Working with the Chinese Olympic Commission, it co-sponsored the Beijing Running Festival to commemorate China’s successful bid for the 2008 Beijing Olympic Games. The company also sponsored various soccer matches between China and South Korea.
Other marketing events Samsung has devised to enhance its image in China include the Digital Man Contest, the South Korea-China Green Great Wall Project and Consumer Day events.
b) Improving recognition of Japanese brands in the U.S.
Japanese affiliates in the U.S. often mention that Japanese corporations are good at creating high-quality products, but poor at planning them for, and marketing to, specific markets. Reasons for this include: 1) poor coordination of decision-making between Japanese firms and their U.S. subsidiaries, 2) a shortage of products developed for the U.S. market and 3) problems in hiring outstanding personnel in the U.S. market.
Japanese firms tend to give unilateral directions to their American subsidiaries, particularly in marketing, since the decision-making authority of U.S. affiliates is held to relatively low levels. Also, when launching a new project, Japanese firms customarily rely on memoranda that must be sent to numerous departments for approval, which tends to slow down the decision-making process.
Also, Japanese corporations sometimes try to sell products from the Japanese market in the U.S. market just as they are, without modification. These products are often not what U.S. companies or consumers want. In the global market for high-tech products, U.S.-style rationalism prevails and ordinary consumers no longer seek high quality for its own sake, regardless of the accompanying high prices. In other words, the Japanese tendency to stress quality makes Japanese products less cost-competitive. In the meantime, advancing production systems in South Korea, Taiwan, China, India and other countries are creating greater balance between the cost and quality of products from these countries.
Finally, at most Japanese affiliates in the U.S., Japanese expatriates monopolize the highest positions. Also, Japanese affiliates seldom use stock options and other methods of compensation found commonly in American corporations. In addition, few Japanese affiliates offer adequate training to American employees for fear that they may not stay long, which can lead to even shorter tenures. As a result, Japanese affiliates are rarely able to compete with their American counterparts in employing and securing outstanding personnel.

29
Table IV-2 Corporate advertising expenditures (2003) (Unit: US$ million)
Rank Company Advertisingexpenditure
Annual salesin U.S.*
1 GM 3,430 133,8972 P&G 3,323 21,8533 Time-Warner 3,097 32,1234 Pfizer 2,839 26,8445 DaimlerChrysler 2,318 72,8146 Ford 2,234 103,4357 Walt Disney 2,129 22,1248 Johnson & 1,996 25,2749 Sony 1,815 20,72710 Toyota 1,683 52,32319 Nissan 1,301 29,02826 Honda 1,144 40,30689 Mitsubishi 382 5,247100 Canon 317 8,953*Figures for Walt Disney, Toyota, Nissan, Honda andMitsubishi also include Canada, and for Canon alsoinclude South America.Source: Advertising Age, Leading National Advertisers:U.S. Marketer Profile Edition .
Table IV-3 Strategies to develop a "Japan Brand"
Source: JETRO.
Prêt-à-Porter Paris in January 2006
HirokawamachiCommerce andIndustry Association(Fukuoka Prefecture)
Kurume-gasuri Survival & RevivalTargeted at newly-affluent young people in their 30s and 40s, jeans and other western-style items and accessories using traditional Kurume-gasuri textiles have beendeveloped with the help of an internationally active Japanese designer. The creativepotential of unique Kurume fabric will be showcased in overseas markets.
Sanjo Global Brand ProjectTraditional techniques used in work tool and cutlery foundries have been employed todevelop nail clippers for women and other novel implements with women's needs inmind. Highly functional and attractively designed tools are also being developed toappeal to sophisticated requirements in the proefessional work tool market, and abrand targeted at the European market is also being launched.
Tsubame Chamber ofCommerce andIndustry (NiigataPrefecture)
Tsubame Product Sales Channel Development ProjectBeaten copperware, hot press forming and other rare manufacturing techniques formetal western dinnerware and housewares are being used to develop luxury items withthe aim of developing a brand for export.
Sanjo Chamber ofCommerce andIndustry (NiigataPrefecture)
Association Project overview Overseas trade fairs
Las Vegas in September 2005, SILMOin France in October, and in HongKong in November
Ambiente Germany in February 2006
Maison et Objet in France in January2006
Sabae Chamber ofCommerce andIndustry (FukuiPrefecture)
Brand development for eyeglass sets combining textiles and lacquerwareHigh value-added products, including eyeglass frames and cases, are being developed.Targeted at affluent Japanese and European women from middle age, these productsdraw upon Japanese artisan crafts through collaboration with high-end lacquerwareand textile manufacturers. Plans are underway to develop the brand both domesticallyand overseas.
D. Growth Strategy 4: Entering the BRICs and Other Emerging Markets
Japanese corporations have become overly dependent on the Chinese market, making the development of other emerging markets an urgent priority. Increasing trade and investment in East Asia over the last few decades have created a de-facto East Asian free business area with great ripple effects on the surrounding regions, including the huge markets of India and Russia. Some 679 million people, more than a quarter of the 2.6 billion population of BRICs, have a per-capita GDP of over $5,000 in PPP (purchasing power parity).
In this strategy, it is urgent for Japanese corporations to develop markets in India and Russia where their presence is smaller in comparison with U.S., EU, and South Korean companies.
Developing these emerging markets is key to reducing the heavy reliance on the

30
Chinese market. However, companies entering these markets should be prepared to take some risks, while also considering the lessons learned by Japanese motorcycle manufacturers in Brazil and India. Based on thorough market research (which they continue to carry out to follow evolving consumer preferences and incomes), they began assembling models that met local preferences. Their long-term strategies are designed to improve brand recognition, enhance competitiveness through increased local procurements and expand service networks.
In developing these markets, Japanese corporations should take advantage of existing FTAs. For example, some Thai subsidiaries of Japanese home electronics manufacturers have taken advantage of the Thai-India FTA to get into the Indian market. In this same way, Japanese corporations could use their production bases in East Asia as springboards to expand their markets in the region.
Of the 679 million people in the BRICs with incomes of over $5,000, 446 million are in China (66%), 115 million in Brazil, 100 million in Russia and 17 million in India. To put this into perspective, it has been observed that some people in the $3,000 annual income bracket (adjusted for purchasing power parity) purchase automobiles, and the rate jumps up significantly in the $5,000 income bracket.
South Korean companies such as Hyundai, Samsung and LG Corp are increasing their shares of markets for automobiles, home electronics and cell phones in India, Brazil and Russia. In India, imports from South Korea and China account for larger shares than those from Japan. Among imports entering Mexico, Brazil and Russia combined, China’s 6.3% share surpasses Japan’s 3.0% share, and South Korea is quickly catching up with Japan.
In a November-December 2004 survey of Japanese companies that contract with JETRO for special services, 85.0% have business in China, 37.5% in India, 28.3% in Brazil and 22.5% in Russia. In China, members are engaged in a full range of activities: exporting, importing, sales and production. The main business in the three other countries is exporting, with no more than 5% of respondents carrying out sales or production operations. Asked about plans for the next three years, 76.8% of the firms doing business with China will expand existing business or develop new business. The comparable figure for India was only 31.5%, followed by 26.8% for Russia and 20.3% for Brazil.
Concerning potential risks in doing business in India, Brazil and Russia, the respondents most frequently mentioned the lack of accurate information. Other difficulties include collection of accounts receivable (all three countries), foreign exchange risks (Brazil), lack of transparency in laws and their enforcement (Russia), security issues (Brazil and Russia) and insufficient transportation, electricity and telecommunications (India).
Table IV-4 Regional per-capita GDP in BRICs (Units: no. of regions, million people, %)
Per-capita GDP Regions Population % of total Regions Population % of total Regions Population % of total Regions Population % of total Regions Population % of totalMore than US$30,000 1 3 0.1% - - - 1 3 2.3% - - - - - -US$10,000~30,000 12 107 4.0% 3 55 31.5% 6 12 8.1% - - - 3 40 3.2%US$5,000~10,000 59 568 21.5% 9 60 34.4% 39 85 59.2% 4 17 1.6% 7 406 31.7%US$1,000~5,000 95 1,886 71.2% 15 59 34.1% 32 43 30.1% 27 949 90.5% 21 834 65.1%Less than US$1,000 2 83 3.1% - - - 1 0.5 0.3% 1 83 7.9% - - -
Sources: World Bank and national statistics.
Notes: 1.Regions columns indicate number of states, etc. with the given per-capita GDP. 2.Prices for year 2000, weighted for purchase price parity. Domestic regional price disparities are ignored. Figures in parentheses after country names indicate per-capita GDP at national
China (US$4,379)BRICs Brazil (US$7,480) Russia (US$7,993) India (US$2,572)
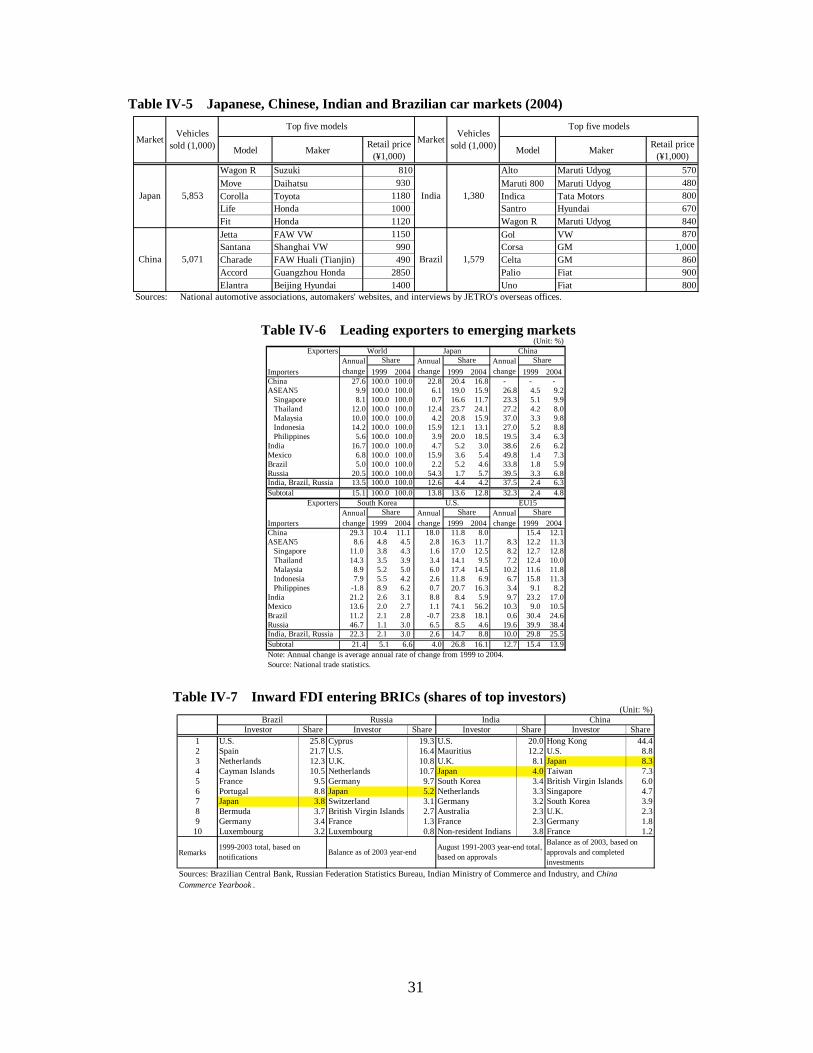
31
Table IV-5 Japanese, Chinese, Indian and Brazilian car markets (2004)
Model Maker Retail price(¥1,000) Model Maker Retail price
(¥1,000)Wagon R Suzuki 810 Alto Maruti Udyog 570Move Daihatsu 930 Maruti 800 Maruti Udyog 480Corolla Toyota 1180 Indica Tata Motors 800Life Honda 1000 Santro Hyundai 670Fit Honda 1120 Wagon R Maruti Udyog 840Jetta FAW VW 1150 Gol VW 870Santana Shanghai VW 990 Corsa GM 1,000Charade FAW Huali (Tianjin) 490 Celta GM 860Accord Guangzhou Honda 2850 Palio Fiat 900Elantra Beijing Hyundai 1400 Uno Fiat 800
Market
China 1,579
Japan 5,853
5,071
Sources: National automotive associations, automakers' websites, and interviews by JETRO's overseas offices.
Vehiclessold (1,000)
Top five modelsTop five modelsVehicles
sold (1,000) Market
India 1,380
Brazil
Table IV-6 Leading exporters to emerging markets (Unit: %)
Exporters
1999 2004 1999 2004 1999 2004China 27.6 100.0 100.0 22.8 20.4 16.8 - - -ASEAN5 9.9 100.0 100.0 6.1 19.0 15.9 26.8 4.5 9.2
Singapore 8.1 100.0 100.0 0.7 16.6 11.7 23.3 5.1 9.9Thailand 12.0 100.0 100.0 12.4 23.7 24.1 27.2 4.2 8.0Malaysia 10.0 100.0 100.0 4.2 20.8 15.9 37.0 3.3 9.8Indonesia 14.2 100.0 100.0 15.9 12.1 13.1 27.0 5.2 8.8Philippines 5.6 100.0 100.0 3.9 20.0 18.5 19.5 3.4 6.3
India 16.7 100.0 100.0 4.7 5.2 3.0 38.6 2.6 6.2Mexico 6.8 100.0 100.0 15.9 3.6 5.4 49.8 1.4 7.3Brazil 5.0 100.0 100.0 2.2 5.2 4.6 33.8 1.8 5.9Russia 20.5 100.0 100.0 54.3 1.7 5.7 39.5 3.3 6.8India, Brazil, Russia 13.5 100.0 100.0 12.6 4.4 4.2 37.5 2.4 6.3Subtotal 15.1 100.0 100.0 13.8 13.6 12.8 32.3 2.4 4.8
Exporters
Importers 1999 2004 1999 2004 1999 2004China 29.3 10.4 11.1 18.0 11.8 8.0 15.4 12.1ASEAN5 8.6 4.8 4.5 2.8 16.3 11.7 8.3 12.2 11.3
Singapore 11.0 3.8 4.3 1.6 17.0 12.5 8.2 12.7 12.8Thailand 14.3 3.5 3.9 3.4 14.1 9.5 7.2 12.4 10.0Malaysia 8.9 5.2 5.0 6.0 17.4 14.5 10.2 11.6 11.8Indonesia 7.9 5.5 4.2 2.6 11.8 6.9 6.7 15.8 11.3Philippines -1.8 8.9 6.2 0.7 20.7 16.3 3.4 9.1 8.2
India 21.2 2.6 3.1 8.8 8.4 5.9 9.7 23.2 17.0Mexico 13.6 2.0 2.7 1.1 74.1 56.2 10.3 9.0 10.5Brazil 11.2 2.1 2.8 -0.7 23.8 18.1 0.6 30.4 24.6Russia 46.7 1.1 3.0 6.5 8.5 4.6 19.6 39.9 38.4India, Brazil, Russia 22.3 2.1 3.0 2.6 14.7 8.8 10.0 29.8 25.5Subtotal 21.4 5.1 6.6 4.0 26.8 16.1 12.7 15.4 13.9
Source: National trade statistics.
Annualchange
Annualchange
Annualchange
EU15Share
Annualchange
Annualchange
Annualchange
Share ShareShare
Note: Annual change is average annual rate of change from 1999 to 2004.
World Japan China
South Korea U.S.Share
Importers
Share
Table IV-7 Inward FDI entering BRICs (shares of top investors) (Unit: %)
Investor Share Investor Share Investor Share Investor Share1 U.S. 25.8 Cyprus 19.3 U.S. 20.0 Hong Kong 44.42 Spain 21.7 U.S. 16.4 Mauritius 12.2 U.S. 8.83 Netherlands 12.3 U.K. 10.8 U.K. 8.1 Japan 8.34 Cayman Islands 10.5 Netherlands 10.7 Japan 4.0 Taiwan 7.35 France 9.5 Germany 9.7 South Korea 3.4 British Virgin Islands 6.06 Portugal 8.8 Japan 5.2 Netherlands 3.3 Singapore 4.77 Japan 3.8 Switzerland 3.1 Germany 3.2 South Korea 3.98 Bermuda 3.7 British Virgin Islands 2.7 Australia 2.3 U.K. 2.39 Germany 3.4 France 1.3 France 2.3 Germany 1.810 Luxembourg 3.2 Luxembourg 0.8 Non-resident Indians 3.8 France 1.2
Remarks
Sources: Brazilian Central Bank, Russian Federation Statistics Bureau, Indian Ministry of Commerce and Industry, and ChinaCommerce Yearbook .
China
Balance as of 2003, based onapprovals and completedinvestments
1999-2003 total, based onnotifications Balance as of 2003 year-end
August 1991-2003 year-end total,based on approvals
Brazil Russia India

32
Table IV-8 Main challenges facing India, Brazil and Russia
• Declining population (low birth and high mortality rates) accompanied bysluggish growth
• Financial institutions manage funds inefficiently
• High ratio of public debt to GDP
• Lack of infrastructure (insufficient national transportation network and ports)• High interest rates, inflationary pressure
• Delays in customs procedures
• Resource-dependent industry structure• Aging manufacturing facilities• Fragile financial system
• Agriculture-reliant industry structure influenced by weather conditions
• High tariffs system
• Poor customs situation
Market trends
• Complex tax system
The agriculture sector has fallen to about 20% of GDP, while the manufacturing and service sectors have maintainedstable growth since 2002. The strong belief is that India has entered a stage of stable, long-term 6%-8% GDP growth.More than one million passenger vehicles were sold for the first time in 2004, with satisfactory sales of commercial andtwo-wheeled vehicles. Automotive and components manufacturers are preparing to expand production. LG, Nokia andother cellphone manufacturers, responding to rapid growth from 13 million subscribers in 2003 to 52 million in 2005, areshifting from imports to local production. Meanwhile, some makers of color TVs, air conditioners, refrigerators and otherelectronics have begun importing from ASEAN countries with which India has FTAs.
Although the market has grown since 1994 thanks to relatively low inflation, the rate of growth has remained low due tomany factors, including 1) the Asian financial crisis in 1997, 2) the decline in value of the real after it was floated in 1999,3) Brazil’s electric power crisis and the Argentine economic crisis in 2001, and 4) economic turmoil accompanying the2002 presidential election. GDP growth of 4.9% in 2004 was the highest rate since 1994, employment has improved andinterest rates have dropped. Sales of motorcycles, cars and consumer electronics, especially DVD players and cellphones,have grown. There are now strong signs that the market is moving from stagnation to recovery. While European and U.S.companies have a strong overall presence, Japanese companies such as Honda, Toyota and Toshiba are also doing well.
• Lack of infrastructure development (unstable power supplies, lack of roadnetworks)
• Rigid labor regulations (difficult to dismiss employees, etc.)
Main challenges
Russia
Russia has registered 4%-10% growth for six straight years since 1999. Growth in personal consumption has bene fueledby increases in disposable income, the emergence of demand for replacement of Soviet-era consumer durables and theinstallment-type sales of autos and consumer electronics. Demand has been increasing for luxury goods, such as cars,consumer electronics and cellphones. While European, U.S. and South Korean companies have been moving into theRussian market, Japanese companies have lagged behind. Cars, consumer electronics and cellphones from South Koreancompanies such as Hyundai, Samsung, and LG are very popular. However, Japanese companies' interest in Russia hasincreased rapidly and they have begun putting more effort into sales and the establishment of local manufacturing bases.Japanese companies have also started investing in manufacturing-related services, such as transportation, andproperty/casualty insurance.
India
Brazil
Table IV-9 Honda's experience in Indian, Brazilian and Chinese motorcycle markets
Honda's presence and position Factors
India
• Hero Honda begins manufacturing and sales, primarily ofmotorcycles, in 1985. Produced more than 10 million unitsby end of 2004.• Honda Motorcycle and Scooter India (HMSI) beginsmanufacturing and sales in 2001. Tops India's scootermarket in just three years.• Honda achieves top share of Indian motorcycle market(36.3% share) in 2002.
• Accurate market research and forecasting. Predicted that the market would shift fromscooters to motorcycles based on studies of the Indian market (body type of Indian people,predominance of male consumers in market, popularity of four-passenger vehicles, etc.).Motorcycles currently account for 80% of the market for two-wheeled vehicles in India.• Developed products tailored to the market (features such as "sari steps" suited to Indiancustomers).• Brand penetration after success in changing consumer thinking. Customers were told thattruly good products are reliable, and that Honda products do not break down. Building brandpower is linked to fast growth in HMSI and Honda Siel (passenger car).• Nationwide sales and service network of 2,000 specialized service and parts shops.• Lower costs achieved through nearly 100% local procurement for almost all models.
Brazil
• Moto Honda da Amazonia set up in Manaus free tradezone in 1975. Honda's current share of Brazilianmotorcycle market is around 80%.• Company overcame raging inflation and other problemsin late '80s.
• Introduction of reliable, high-quality models suited for the market. The CG150 hasperformed well, even over poor road conditions, to become a long-time mainstay.• Nationwide sales and service network of 600 locations.• Promotion of local procurement has resulted in a reliable component supply system,enabling products well suited to market requirements.• Honda's vice president visited the finance minister during the late '80s and negotiatedfavorable arrangements by stressing Honda's policy of promoting localization.
China
• Wuyang-Honda Motorcycle Guangzhou JV wasestablished in 1992, followed by Tianjin Honda Motorcycleand Jialing-Honda Motors in 1993.• Honda formed Sundiro-Honda Motorcycle JV with majorChinese motorcycle maker Sundiro and introduced low-priced models in 2001.• Honda Motorcycle R&D China was established inShanghai in 2002.• With just a 3.7% market share in 2002, the company hasfaced tougher conditions than in other Asian markets andBrazil.
• Urban limits on issuance of license plates due to safety and environmental restrictions.• Excessive number of manufacturers and severe price competition.• Flood of counterfeit products.
Sources: JETRO New Delhi and San Paulo reports, Honda website, Institute of Developing Economies, The Asian Motorcycle Industry.
Table IV-10 Risks and challenges for Japanese firms in BRICs (Unit: %)
Russia Brazil India ChinaNumber of responding firms 193 164 246 592Lack of accurate information about country 54.9 39.0 42.7 27.5Risk of technology leaks, insufficient protection of intellectual pr 11.4 6.1 19.5 44.1Difficulties in collection of accounts receivables 30.6 22.6 26.8 56.3Lack of transparency in laws and their application 36.3 17.1 28.0 67.6High tariffs 11.4 14.6 21.1 24.8Insufficient transport, electricity, communications and other infr 20.7 15.9 39.0 38.5Foreign exchange risk 24.9 36.0 18.7 38.0Security issues 33.2 32.9 23.6 16.0
Source: JETRO, Survey of Overseas Operations of Japanese Companies , Fiscal 2004(conducted November-December 2004).
33
V. Japan’s Role in Integration of East Asian Free Business Area
At present, Japan, China and South Korea are each negotiating a free trade agreement (FTA) or economic partnership agreement (EPA) with ASEAN. For China, a top priority is the steady implementation of the commitments it made when it entered the World Trade Organization. When this has been largely completed as agreed by 2007, the East Asian region will enter its first stage of market liberalization. Then, from around 2008, when China and South Korea are expected to complete their FTA/EPA negotiations with ASEAN, there should be momentum for further liberalization. If all three countries were to complete their respective FTA/EPA negotiations with ASEAN around 2010, an East Asian free business area would take shape earlier than anticipated. More realistically, however, the agreements are expected to be completed by around 2009 for South Korea, 2010 for China and 2012 for Japan.
Problems are expected, however. For one thing, FTAs centering on ASEAN are expected to have disparate rules-of-origin and other provisions. Tariff reductions for a China-ASEAN FTA were introduced in July 2005, although important categories such as automobiles and home appliances have been postponed. Moreover, provisions for services trade, investment and intellectual property will be difficult to work out.
Japan should play a leading role in the de jure integration of an East Asian free business area. First, it should promote its EPA with ASEAN as a model, since the other countries’ agreements are likely to be incomplete in certain areas. Second, the Japanese government should continue offering economic and technical cooperation, including human resources development, to help improve roads, ports, power generation and other infrastructure in the region. Third, it should work toward further liberalization of its own market. For example, as a great importer of agricultural, forestry and fisheries products, Japan should adopt the policy of protectionism as required but compromise whenever possible, in line with the Green Asia-EPA Promotion Strategy (see note at end). Fourth, it must accept the increased immigration of skilled workers. Many countries compete for immigrants in professional and technical fields, and Japan should do the same by accepting people from specific countries when FTA/EPA negotiations are concluded.
The EPA that Japan is negotiating with ASEAN would be a good model for achieving de jure integration of an East Asia free business area because it is comprehensive, covering both the liberalization and facilitation of trade and investment (including rules on investment, competition, standards certification and the protection of intellectual property), in addition to economic partnership and cooperation. It should, however, also include new rules for harmonization and standardization, while following existing FTAs and EPAs for tariff reduction and services trade liberalization. Japan and ASEAN should also set up a committee to improve the business environment, just as the Japan-Mexico EPA does.
East Asia presently has high barriers to trade and investment, an inadequate overall framework for business, and weak infrastructure and supplier (“supporting”) industries (which is why JETRO is engaged in projects to raise the efficiency of cross-border logistics throughout East Asia and to nurture supporting industries in the ASEAN region). Japan, under a policy of pursuing green EPAs, now needs to reform and expand its agricultural sector through increased exports of agricultural, forestry and fishery products.
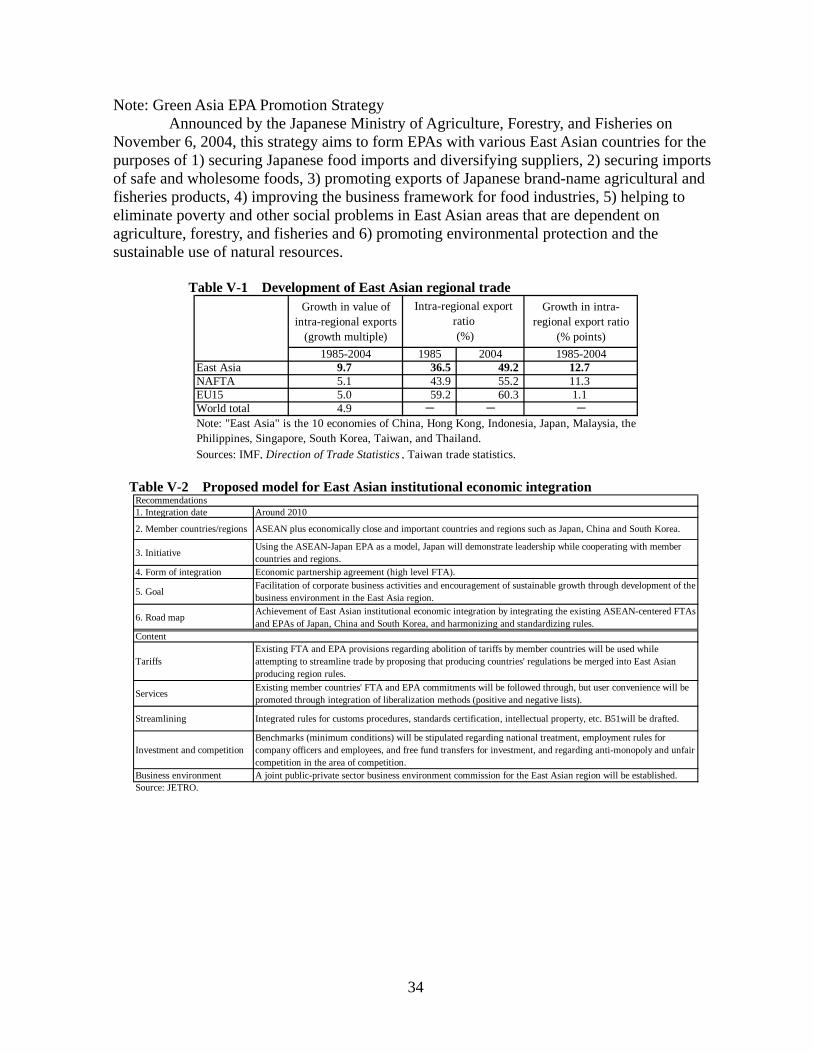
34
Note: Green Asia EPA Promotion Strategy Announced by the Japanese Ministry of Agriculture, Forestry, and Fisheries on
November 6, 2004, this strategy aims to form EPAs with various East Asian countries for the purposes of 1) securing Japanese food imports and diversifying suppliers, 2) securing imports of safe and wholesome foods, 3) promoting exports of Japanese brand-name agricultural and fisheries products, 4) improving the business framework for food industries, 5) helping to eliminate poverty and other social problems in East Asian areas that are dependent on agriculture, forestry, and fisheries and 6) promoting environmental protection and the sustainable use of natural resources.
Table V-1 Development of East Asian regional trade
Growth in value ofintra-regional exports
(growth multiple)
Growth in intra-regional export ratio
(% points)1985-2004 1985 2004 1985-2004
East Asia 9.7 36.5 49.2 12.7NAFTA 5.1 43.9 55.2 11.3EU15 5.0 59.2 60.3 1.1World total 4.9 - - -
Intra-regional exportratio (%)
Note: "East Asia" is the 10 economies of China, Hong Kong, Indonesia, Japan, Malaysia, thePhilippines, Singapore, South Korea, Taiwan, and Thailand.
Sources: IMF, Direction of Trade Statistics , Taiwan trade statistics.
Table V-2 Proposed model for East Asian institutional economic integration Recommendations1. Integration date Around 2010
2. Member countries/regions ASEAN plus economically close and important countries and regions such as Japan, China and South Korea.
3. Initiative Using the ASEAN-Japan EPA as a model, Japan will demonstrate leadership while cooperating with membercountries and regions.
4. Form of integration Economic partnership agreement (high level FTA).
5. Goal Facilitation of corporate business activities and encouragement of sustainable growth through development of thebusiness environment in the East Asia region.
6. Road map Achievement of East Asian institutional economic integration by integrating the existing ASEAN-centered FTAsand EPAs of Japan, China and South Korea, and harmonizing and standardizing rules.
Content
TariffsExisting FTA and EPA provisions regarding abolition of tariffs by member countries will be used whileattempting to streamline trade by proposing that producing countries' regulations be merged into East Asianproducing region rules.
Services Existing member countries' FTA and EPA commitments will be followed through, but user convenience will bepromoted through integration of liberalization methods (positive and negative lists).
Streamlining Integrated rules for customs procedures, standards certification, intellectual property, etc. B51will be drafted.
Investment and competitionBenchmarks (minimum conditions) will be stipulated regarding national treatment, employment rules forcompany officers and employees, and free fund transfers for investment, and regarding anti-monopoly and unfaircompetition in the area of competition.
Business environment A joint public-private sector business environment commission for the East Asian region will be established.Source: JETRO.

35
Table V-3 Issues and developments regarding customs clearance systems in ASEAN region Country/region Details
• Tariff valuations and decisions regarding classifications differ according to the official in charge.• Prior notification system (a framework by which duty codes can be ascertained prior to customs procedures) now being introduced (to beimplemented with FTA partners first).• Start of "one-day clearance service" (enabling receipt of cargo within 24 hours) announced.• "Block system" (system by which all of a shipper's and customs clearing agent's declarations are denied if problems arise with just some).• Arbitrary valuations and classifications depending on the official in charge, problem of how to respond when officials are absent,insufficient port infrastructure, etc.
• Japanese companies offer opinions to the government through the Japan Jakarta Club.• Speedier procedures and improvements in the approvals system for steel, car and other imports.• "Customs Golden Client" program (pilot program designed to speed customs procedures through online connections betweenmanufacturers (shippers) and customs) has been launched.• Delays in customs procedures due to customs computer system failures.• Insufficient port infrastructure.• Regular conferences (monthly) between Japanese firms and customs bureau heads have proved beneficial in solving problems.• Although application of laws and other rules has improved, opaque procedures and sloppy application are still a problem.• Efforts to make customs operations speedier and more transparent through Japan-Vietnam Joint Initiative (signed December 2003).
ASEANinitiatives
• Introduction of "ASEAN Single Window" (framework for bringing ASEAN members' customs procedures in line with WCO, WTO, andother international rules under a joint online format) under consideration.
Source: JETRO Overseas Research Department, Reality and Problems Regarding Tariff and Customs Clearance System in ASEAN Countries (March 2005).
Vietnam
Note: Top line is issues and problems, and bottom line is current efforts.
Philippines
Thailand
Indonesia
Malaysia
Table V-4 Problems for supporting industries in ASEAN region
Thailand
• Few local suppliers of parts, so components must be imported from Japan.• Importing from Japan cuts into price competitiveness.• Continued existence of corporate withholding tax system hurts supporting industries, such as the press andmold sectors, by depressing profits. Also, procedures for tax refunds are complex and tax refunds are notreceived sometimes. Systems that hinder the development and promotion of supporting industries should beabolished.
Malaysia • Locally procured materials are low cost, but the level of quality is still a problem.
Philippines
• Programs to foster and strengthen domestic industries are weak. For example, the parts industry onlyreceives incentives for export processing zones, for the short-term purpose of foreign currency acquisition.• There is too much focus on attracting foreign investment for the electronics industry, so the development ofperipheral industries suffers.• Offshore sourcing of parts is unavoidable, because there are almost no local suppliers.
Source: Japan Machinery Center for Trade and Investment, Trade and Investment Issues and Demands by Country andRegion in Fiscal 2004 (May 2005).

Printed in Japan
JAPAN EXTERNAL TRADE ORGANIZATION
Economic Research Department Ark Mori building, 1-12-32 Akasaka, Minato-ku, Tokyo, Japan, 107-6006
For Distribution in the US: This material is distributed by the US offices of JETRO (Atlanta, Chicago, Denver, Houston, Los Angeles, New York, and San Francisco) on behalf of the Japan External Trade Organization (JETRO), Tokyo, Japan. Additional information is available at the Department of Justice, Washington, D.C.