2005 (pdf, 2.2mb)
TRANSCRIPT


1

2

3
4
.

5
.
CORPORATE INFORMATION
MANAGEMENT COMMITTEE
Martial G. Rolland - Chairman & Managing Director
Shobinder Duggal - Finance & Control
Stewart Dryburgh - Chocolates & Confectionery
Muhammed Hamza - Coffee & Beverages
Shivani Hegde - Food
Christian Van Houtteghem - Infant Nutrition
Vineet Khanna - Supply Chain
Virat Mehta - Communications
B. Murli - Legal & Company Secretary
Suresh Narayanan - Sales
Hari Nariani - Globe
G.G. Pillai - Additional Channels
Beda Rust - Technical
Rajkamal Sharma- Exports
H. K. Singh - Human Resources
R. Singh - Corporate Affairs & Strategic Planning
Mayank Trivedi - Shelf Stable & Chilled Dairy
BANKERS
ABN Amro Bank N.V.
BNP Paribas
Citibank N.A.
HDFC Bank Limited
ICICI Bank Limited
Punjab National Bank
Standard Chartered Bank
State Bank of Hyderabad
AUDITORS
A.F. Ferguson & Co.,
9, Scindia House,
Kasturba Gandhi Marg,
New Delhi - 110 001
REGISTERED OFFICE
M-5A, Connaught Circus, New Delhi - 110 001
Ph: 011- 2341 8891, Fax: 011- 2341 5130
REGISTRAR & TRANSFER AGENTS
MCS Limited
W-40, Okhla Industrial Area, Phase II,
New Delhi – 110 020
Ph : 011- 41406149, Fax : 011- 41709881
HEAD OFFICE
Nestlé House
Jacaranda Marg, ‘M’ Block,
DLF City, Phase II,
Gurgaon 122 002 (Haryana)
BRANCH OFFICES
Spencer Plaza, 6th Floor 769, Anna Salai, Chennai - 600 002 (Tamil Nadu)
7, Hare Street, Kolkata - 700 001 (West Bengal)
Hiranandani Gardens, Main Street, 4th Floor,
Colgate Research Centre Building, Powai, Mumbai - 400 076 (Maharashtra)
M-5A, Connaught Circus, New Delhi – 110 001
FACTORIES
Village Maulinguem (North), Bicholim Taluka - 403 504 (Goa)
Ludhiana - Ferozepur Road, Near Kingwah Canal, Moga - 142 001 (Punjab)
Industrial Area, Nanjangud - 571 301 Mysore District (Karnataka)
P.O. Cherambadi - 643 205 District Nilgiris (Tamil Nadu)
Patti Kalyana, Kiwana Road, Samalkha - 132 101 District Panipat (Haryana)
Plot No. 294-297, Usgao Industrial Area, Ponda - 403 406 (Goa)
LISTING OF EQUITY SHARES (Listing Fees paid)
Bombay Stock Exchange Limited,
Phiroze Jeejeebhoy Towers, Dalal Street, Mumbai - 400 001
ANNUAL GENERAL MEETING
Tuesday, 25th April, 2006 at 10.00 AM at
Air Force Auditorium, Subroto Park, New Delhi - 110 010
Shareholders attending the AGM are requested to bring with them the
enclosed ATTENDANCE SLIP.
Website : www.nestle.in

6
.
DIRECTORS’
REPORT
Dear Members,Your Directors have pleasure in submittingtheir report and the statement of accountsfor the year ended 31st December, 2005.
Financial Results
and Operations
(Rs. in Millions)
2005 2004
Gross Revenue 25,006 22,420
Earning before Interest,
Tax and Depreciation excluding
Other Income (EBITDA) 5,220 4,510
Interest 2 8
Depreciation 568 491
Impairment Loss on
Fixed Assets (Net) (26) 23
Provision for Contingencies (Net) 223 267
Provision for Tax 1,595 1,346
Net Profit 3,096 2,519
Profit Brought Forward 35 443
Balance Available for Appropriation 3,131 2,962
Interim Dividends Paid 2,218 1,928
Final Dividend Proposed 193 434*
Corporate Dividend Tax 338 313
Transfer to General Reserve 310 252
Surplus carried in Profit and
Loss Account 72 35
Key Ratios
Earnings per Share (Rs.) 32.11 26.13
Dividend per Share (Rs.) 25.00 24.50*
* Comprises / Includes a special dividend of
Rs. 4.50 per share of the face value of
Rs. 10/- each, paid mainly out of undistributed
profits of previous financial years.
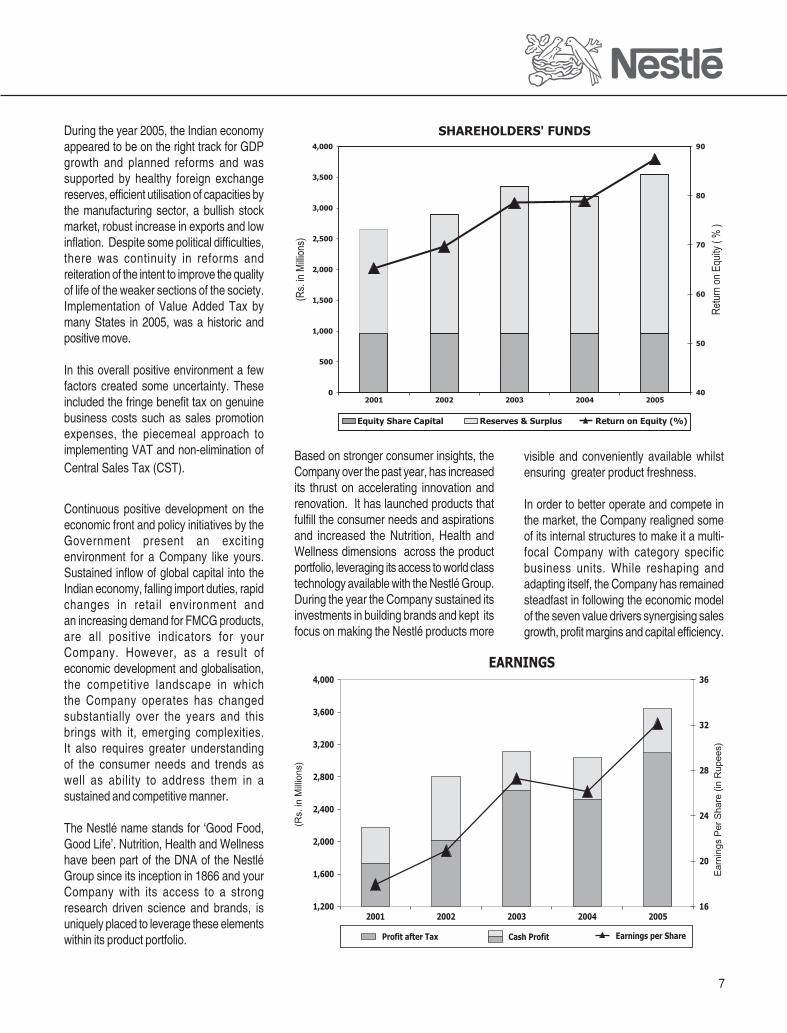
During the year Domestic Sales grew by11.8% and Export Sales grew by 6.4%.
Net Profit for the year 2005 increased to12.4% of Gross Revenue from 11.2% in2004 and EBITDA as a percentage of NetSales increased in 2005 to 21.1% from20.2% in 2004. The increase in EBITDA ismainly due to the positive impact of selectiveprice increases, higher volumes andfavourable product mix, which was partlyoffset by an overall increase in commodity
prices and costs relating to InformationSystems. Nestlé Group savings initiativesmainly Operation Excellence focussing onmore efficient sourcing of raw and packingmaterials, energy costs and efficiencies,manufacturing processes and optimisationof line efficiencies / occupation etc., helpedmitigate the adverse impact of input costsand in controlling other costs throughout theyear. The increase in Net Profit is mainly onaccount of the overall improvement inEBITDA, increase in Other Income andreduction in corporate tax rates, which hasbeen partially offset by the fringe benefit tax.
Other Income for the year 2005 increasedmainly due to returns on the higher surplusliquidities.
Out of business prudence, in 2005 theCompany supplemented the ContingencyProvision with a further amount of Rs.223.2Million (Net), to provide for contingenciesresulting mainly from matters relating tolitigation / dispute and other items requiringmanagement judgement and discretion.This was after the write back of Rs.85.5Million provision, due to the satisfactorysettlement of disputes and other matters.
7
.
During the year 2005, the Indian economyappeared to be on the right track for GDPgrowth and planned reforms and wassupported by healthy foreign exchangereserves, efficient utilisation of capacities bythe manufacturing sector, a bullish stockmarket, robust increase in exports and lowinflation. Despite some political difficulties,there was continuity in reforms andreiteration of the intent to improve the qualityof life of the weaker sections of the society.Implementation of Value Added Tax bymany States in 2005, was a historic andpositive move.
In this overall positive environment a fewfactors created some uncertainty. Theseincluded the fringe benefit tax on genuinebusiness costs such as sales promotionexpenses, the piecemeal approach toimplementing VAT and non-elimination ofCentral Sales Tax (CST).
Continuous positive development on theeconomic front and policy initiatives by theGovernment present an excitingenvironment for a Company like yours.Sustained inflow of global capital into theIndian economy, falling import duties, rapidchanges in retail environment andan increasing demand for FMCG products,are all positive indicators for yourCompany. However, as a result ofeconomic development and globalisation,the competitive landscape in whichthe Company operates has changedsubstantially over the years and thisbrings with it, emerging complexities.It also requires greater understandingof the consumer needs and trends aswell as ability to address them in asustained and competitive manner.
The Nestlé name stands for ‘Good Food,Good Life’. Nutrition, Health and Wellnesshave been part of the DNA of the NestléGroup since its inception in 1866 and yourCompany with its access to a strongresearch driven science and brands, isuniquely placed to leverage these elementswithin its product portfolio.
Based on stronger consumer insights, theCompany over the past year, has increasedits thrust on accelerating innovation andrenovation. It has launched products thatfulfill the consumer needs and aspirationsand increased the Nutrition, Health andWellness dimensions across the productportfolio, leveraging its access to world classtechnology available with the Nestlé Group.During the year the Company sustained itsinvestments in building brands and kept itsfocus on making the Nestlé products more
visible and conveniently available whilstensuring greater product freshness.
In order to better operate and compete inthe market, the Company realigned someof its internal structures to make it a multi-focal Company with category specificbusiness units. While reshaping andadapting itself, the Company has remainedsteadfast in following the economic modelof the seven value drivers synergising salesgrowth, profit margins and capital efficiency.

8
.
It also continued to follow the fourstrategic pillars to achieve sustainablecompetitiveness - ‘Low cost, highly efficientoperations’; ‘Innovation and Renovation’,‘Product availability – whenever, wherever,however’ and ‘Consumer communication’.These have been the cornerstones for theCompany’s sustained performance inrecent years. Your Company is stable,healthy, with strong fundamentals and isfocused on long term, sustainable andprofitable growth.
The current year has commenced as perplan. Your Company will continue toleverage its consumer centric approach andcompetencies to generate demand for itsbrands in the future. Access to the NestléGroup’s proprietary technology, strongbrands and extensive centralised Researchand Development facilities, the culture ofinnovation and renovation within theorganisation and focus on adding value tothe consumer needs will help the Companygrow to its potential. The Company willcontinue to direct its efforts on productinnovation and renovation, to control costs,improve penetration, exploit geographicopportunities and manage price-value forits brands. We remain confident of thelong-term business prospects of theCompany and in its ability to sustain fairreturn to the shareholders.
Exports
Export Sales during 2005 at Rs. 2,591.8Million, increased by 6.4% over the year2004, largely due to the higher realisationfrom Instant Coffee exports to Russia,dueto the higher Green Coffee prices and higherexport of Infant Nutrition products, whichwere partially offset by lower volume ofInstant Coffee sales and lower exports toNepal due to the political turbulence.Although the volume of Instant Coffeeexported to Russia dropped further during2005, exports of other product categorieswere buoyant. Exports of Infant Nutritionproducts within the South Asia Regionincreased during the year, as new products
were added to the portfolio. Exports ofInstant Tea and culinary products weresatisfactory and new businesses werecreated through appropriate productdevelopment.
The efforts to develop new products andgeographies to broaden the Company’sexport portfolio, helped to reducedependence on export of Instant Coffee toRussia. Export of products excludingNESCAFÉ Instant Coffee to Russia,constituted around 45% of the ExportSales, as against 43% in 2004.
Initiatives to develop products for the Indianethnic community abroad are continuing.
Dividends
The Board of Directors has recommendeda final dividend of Rs. 2/- per equity share ofthe face value of Rs.10/- each for the year2005, amounting to Rs. 193 Million. Thefinal dividend, if approved, will be paid to theshareholders whose names appear on theRegister of Members, determined withreference to the book closure from21st April, 2006.
This is in addition to the two interim dividendsfor the year 2005, first at the rate of Rs. 5/-and the second at the rate of Rs. 18/- perequity share, which were paid on 10th May,2005 and 22nd December, 2005 respectively,aggregating to Rs. 23/- per equity share(amounting to Rs. 2,218 Million).
During the year 2004, total dividend ofRs. 24.50 per equity share was paid, whichincluded special dividend of Rs. 4.50 perequity share, mainly out of undistributedprofits of the previous financial years.The aggregate dividend for 2005 ofRs. 25/- per equity share, on comparablebasis (excluding the special dividendpaid for 2004), represents a healthyincrease over the total dividend paidfor 2004 of Rs. 20/- per equity share.The total payout for 2005 of Rs. 2,749Million, which includes the corporatedividend tax, is the highest to date.
Business Development
The Company is committed to providingconsumers high quality, safe and nutritiousfood products. In order to do this, theCompany continuously focuses its efforts tobetter understand the changing needs ofthe consumer, by conducting research andmonitoring consumer panels to measureconsumer satisfaction and anticipating futureneeds. Based on this the Companyconstantly reviews its product portfolio,innovates and renovates to cater toconsumer preferences in order to ensurelong term, sustainable and profitable growth.Over the years, your Company has built astrong bond with its consumers by offeringthem quality products that meet their dailyneeds.
The Company focused on strengthening itsprocesses and initiating changes that willenable it to respond faster to consumerneeds and customer expectations. A newdepartment– the Channel & Category SalesDevelopment (CCSD) was set up to developnew solutions for the various channels andcustomers and improve the implementationof commercial plans in the market place.The Company also created a newdepartment the ‘National Key AccountsManagement Organisation’ to focus onmodern formats in retail trade that aresteadily establishing their presence inthe Indian market. These emergingformats are expected to be partners inaccelerating growth in the coming years.Your Company’s unique access to theNestlé global expertise and competencewill be key in ensuring the success of boththese initiatives.
In ‘Prepared Dishes and Cooking Aids’category, the MAGGI brand is the pioneerin all the areas it operates in, namely, InstantNoodles, Sauces and Ketchup, Soups andBouillons. In order to further enhance theTaste, Health and Wellness dimension inMAGGI products, the Company leveragedthe extensive Research and Developmentexpertise of the Nestlé Group and the

9
.
proposition of ‘Taste Bhi, Health Bhi’ and‘Its Different’ helped to drive growth duringthe year. Your Company launched a newinnovative concept, MAGGI Vegetable AttaNoodles that was developed based onconsumer needs and evolving trendstowards more whole grain based products.MAGGI Vegetable Atta Noodles containwhole wheat and real vegetables thatprovides consumer the goodness of wholewheat while enhancing the nutrition andtaste dimension. The product offering theproposition of ‘Taste Bhi, Health Bhi’ hasbeen liked by the consumers for itsuniqueness and relevance and hasperformed well since its launch. To enhanceits nutritive value further, the very popularMAGGI 2-Minute Noodles were alsorenovated to provide 20% RDA of Calciumand Protein for the core target group.During 2005, MAGGI Noodles continued toexpand and lead the market.
During the last quarter of the year, theCompany also launched a range of NewMAGGI Healthy Soups that are even moredelicious, quick to prepare, convenient andhealthy. The product has been developedto cater to the unique taste of the Indianconsumers and does not contain any addedMSG or added preservatives, no artificialcolours, is cholesterol free and low on fatsand has real vegetables. The initial responseto the New Soups is encouraging. Overallthe performance of Soups improved after thelaunch of the New MAGGI Healthy Soupsand the Company anticipates the trend tocontinue. The reinforcement of nutritivepropositions while ensuring taste andpleasure will form the cornerstone for growthof the MAGGI Healthy Soups portfolio.
The MAGGI brand is also leader in Saucesand Ketchups and during the year, theCompany further widened its portfolio withtwo innovative products – MAGGI TomatoPudina Sauce and MAGGI Tomato ChatpatSauce, each with its unique Indianised tasteof chutney. These products have alsoreceived satisfactory consumer response.The sales volume of MAGGI Saucesincreased during the year.
The year 2005 was another satisfactoryyear for the ‘Chocolates andConfectionery’ category, with the keyNestlé brands demonstrating healthygrowth. NESTLÉ MUNCH, NESTLÉ KITKAT, NESTLÉ MILKYBAR CHOO andNESTLÉ Eclairs continued to grow fasterthan the industry. In this segment NESTLÉMUNCH is the largest distributed brandand NESTLÉ MAHA MUNCH continuedto be the largest selling stock keepingunit [SKU]. In recent months the portfolioin this category has been further reinforcedwith the launch of products at the Rs. 5/-price point namely NESTLÉ MILKYBARCHOO Strawberry, NESTLÉ MAHAMUNCH and NESTLÉ Coconut MUNCH.Presence in the sugar confectionerysegment was strengthened with thelaunch of NESTLÉ Coconut Eclairs. Thereview of NESTLÉ Chocostick wascompleted and the product wasdiscontinued during the year.
In the ‘Beverages’ category, theCompany has performed satisfactorily.NESCAFÉ is number one brand in theworld for coffee and coffee mixes and hasleveraged its understanding of thechanging lifestyles of consumers tocontinuously add value. NESCAFÉcontinues to be the largest brand ofInstant Coffee in the Indian market. Duringthe later part of the year the Companyre-launched NESCAFÉ SUNRISE coffee-chicory blend after it was renovated withsuperior grade of plantation beans toprovide better coffee taste and aroma andcompetitive advantage. During the year,the Company continued to innovate andrenovate and in early 2006, launched NewNESCAFÉ 3-in-1 with the right balanceof coffee, dairy creamer and sugar andspecially formulated to suit the taste profileof the youth who wish to move to themore trendier coffee habit, especially inthe tea drinking areas. The performanceof MILO Chocolate Energy Food Drink isyet to become satisfactory and theCompany is continuing its efforts toimprove its performance.
In the ‘Milk Products and Nutrition’category, the Company remained focusedon introducing products that leverage theNestlé Group’s know-how and Researchand Development competencies. Thebreakthrough in infant feeding that wasachieved with the 3-stage Nestlé NutritionalDevelopment Plan, had earlier enabled theCompany to launch CERELAC 123 wheatbased weaning food and NESTUM 123rice based weaning food, to ensure theright eating experience at the right stageof development of the infant. Theseproducts along with LACTOGEN 3,PRE-LACTOGEN and other InfantNutrition products, continued to do well andfurther reinforces Nestlé’s standing as aCompany using its extensive knowledge toprovide solutions for infant needs.
During the year, the Company alsolaunched NESTLÉ CEREMEAL Daliya, ascientifically balanced meal solution fortoddlers over 2 years of age, packed withessential nutrients to help them growstrong. The initial response to the productis encouraging.
Overall the performance of dairy relatedproducts was not very satisfactory. WhileNESTLÉ EVERYDAY Dairy Whitener grewmodestly NESTLÉ MILKMAID SweetenedCondensed Milk was under pressure. Themarket performance of UHT Milk continuedto be below expectations. In the ChilledDairy category, NESTLÉ Dahi showedgood growth and NESTLÉ Raita waslaunched in select geographies tostrengthen the portfolio. NESTLÉ Butterwas discontinued during the year as itwas not found to be a viable business.
The prices of milk solids continue to be onan upward trend and the efforts of yourCompany will be to improve theperformance of this category withappropriate price management, in a verycompetitive environment.

10
.
With rapidly increasing opportunities in the‘Out of Home’ segment, especially in coffeesand beverages the Company hascontinued to increase ‘NESCAFÉ CoffeeCorners’, ‘ NESTLÉ Consumption Zones’and vending machines in offices, colleges,and other locations that experience highfootfalls. The Company has by far the largestnumber of vending machines installed in themarket, selling over 700 Million cups of hotand cold beverages per annum. YourCompany sees the ‘Out of Home’opportunities as significant to leverage itsskills and competencies in vending and usingits product portfolio to address consumerneeds therein.
Technology and Quality
The Company’s General LicenceAgreement with the Nestlé Group,Switzerland, enables it to access the mostadvanced technology in the food world. TheCompany leverages this continuously toprovide consumers in India with high qualityand safe food products that add value tothem and are affordable. The new projectinitiated during 2004 at the Samalkha factoryto upgrade the production technology forInfant Nutrition products, was commissionedduring the later part of 2005. This puts itamongst the ten most modern plants forInfant Nutrition products in the Nestlé Group,worldwide.
New Factory in Uttaranchal
During the year, the Company announcedsetting up of seventh plant at Pantnagar inUttaranchal, showing your Company’sconfidence in the future and its continuedcommitment to the development of India.
The new Factory in the State of Uttaranchalwill mainly manufacture culinary productsand with the technology and supportreceived from the Nestlé Group, will be astate-of–the-art facility. The project willinvolve an investment of around Rs.1,000Million over 2 to 3 years and it is foreseen
that the Factory will go into commercialproduction during the second half of 2006.The new Factory is being set up in an areabenefiting from tax incentives.
Manpower Development
The Company believes that in order toachieve its 100 % potential, it is necessaryto empower talent and prepare its peoplewith the necessary skills to exploit their ownpotential and the potential of the Company.To enable this, the Company continued toprovide employees with appropriate accessto training and international exposures,where feasible and relevant to improve theirskills. During 2005, the Company increasedits focus on people development, including‘360 degree feedback’ based LeadershipDevelopment programs.
GLOBE (Global BusinessExcellence)
During the first half of 2005, the Companysuccessfully implemented GLOBE. TheCompany smoothly transited from thelegacy system to SAP, using the GLOBEmethodology, without any disruption inbusiness. GLOBE will enable the Companyto adopt best practices, improve operationalefficiencies due to sophisticated andintegrated information technology systems,much needed for a complex value chain.Amongst others, this will help in the supplychain to be even more agile and responsiveto customer demand, streamline sales orderprocessing, control the widely disperseddistribution centers more efficiently, andfurther improve the availability and freshnessof the Nestlé products in the market. GLOBEalso serves as an excellent decision supportsystem in making appropriate businessdecisions with speed.
SWOT Analysis for the Company
Strengths :
� Access to the Nestlé Group’s proprietarytechnology / brands, expertise and the
extensive centralised Research andDevelopment facilities under the GeneralLicence Agreement.
� High quality and safe food products ataffordable prices, endorsed by the NestléSeal of Guarantee.
� Strong and well differentiated brandswith leading market shares.
� Strong equity with consumers as aCompany with “high quality” brands.
� Ongoing Product innovation andrenovation, to convert consumerinsights.
� Well diversified product portfolio.
� Efficient supply chain.
� Distribution structure that allows widereach and coverage in the targetmarkets.
� Capable and committed humanresources.
Weakness :
� Exports of coffee to Russia, constitutessubstantial part of overall exports.
� Complex supply chain configuration.
Threat :
� Competitive environment with diverseplayers.
� Rising prices of raw materials and fuels.
� Change in fiscal benefits/ laws.
Opportunities :
� Potential for expansion in the smallertowns and other geographies.
� Potential for growth through increasedpenetration.
� Growing trend for ‘Out of Home’consumption.
� Leverage Nestlé Technology to developmore products that provide Nutrition,Health and Wellness.

11
.
Contributions to the Exchequer
Your Company has been a leadingtaxpayer of the country and over the yearshas been contributing significantly tovarious taxes. During the year 2005, theCompany through its operations,contributed (directly and indirectly) towardstax collections at Central and State level,close to Rs. 7.2 Billion in the aggregatecompared to around Rs. 6.2 Billion in 2004.
Community Development
Your Company has always focused on longterm, sustainable and profitable growth andhelped communities around its factories toimprove their quality of life in a similarmanner. ‘Nestlé Agricultural Services’ hasused the experience gained by the NestléGroup across the world, from its MilkDistrict Model, to set up a system of directand efficient contacts with the farmers.Company veterinarians and agronomistssupervise the milk routes and advisefarmers on various issues including properfeed for the herds. Milk chilling facilities havebeen set up close to the farmers. Veterinaryservices are provided free, and medicinesprovided at wholesale prices. TheCompany assists farmers in artificialinsemination programs for their cattle,provides subsidy and helps them inprocuring loans. In the past few years, theCompany has invested approximatelyRs. 490 Million towards developinginfrastructure, and Rs. 280 Million inprocuring goods on behalf of the farmers.The Company also recognises the activerole that village women play in adoptinggood dairying practices in dairy farms andregularly conducts special programs thathelp them.
The Company endorses the UnitedNation’s Global Compact that encouragescompanies to take a long term view topromote prosperity in the society. Whilethe operations of the Company have amultiplier effect on the development of theregion, the Company also promotesprojects around its factories to improve thequality of life in the communities.
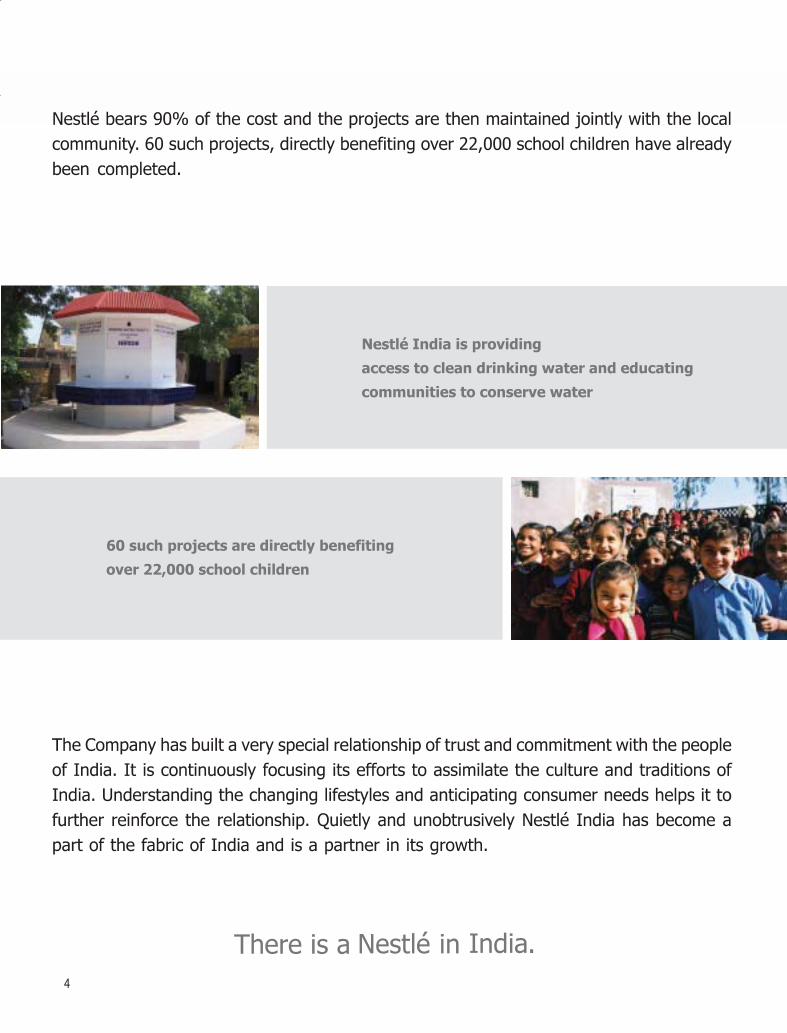
Water is a scarce resource in India.An estimated 200 Million people do nothave access to clean drinking water and itis a major concern for many communities.Your Company is committed to making itsefforts in improving the situation, by creatingawareness among the communities aroundits factories and educating school childrento conserve this scarce resource.The Company is setting up projects whereit organises bore wells to source cleandrinking water, constructs storage tanksand tests the water quality. The projectsare then maintained jointly with the localcommunity. 60 such projects, directlybenefiting over 22,000 school children havealready been completed.
Your Company also supports local schools,helps in the maintenance of public parksand green belts, facilitates blood donationcamps and health awareness programs.The key messages of conservation,hygiene, health and wellness areprogressively built into the communitieswhere the Company has its presence.All these initiatives strengthen the bondbetween your Company and theCommunity and forge our increasingcommitment to the society in which weoperate.
Recognitions
As a partner in India’s growth for the pastover four decades your Company hashelped improve the economic security ofits people and the quality of their lives. It isa matter of pride that during the year 2005,this has been recognised at different fora.
Your Company was bestowed theUDYOG RATNA award by the PHDChamber of Commerce and Industry torecognise Nestlé’s significant contributionto the economic development of Punjab.The factory in Moga was also conferredthe Punjab Government’s award for‘Environmental Excellence’ as a recognitionof the efforts, amongst others, in theconstruction of clean drinking water facilitiesin village schools around the factory.
Safety at the Company’s factories is givenvery high priority and this high safety culturewas recognised by the Government of Indiaduring the year. The Company’s factory atSamalkha was selected for the NationalSafety Award –2004. This Award is given tofactories with high safety over a period ofthree consecutive years.
Your Company was again recognised forits outstanding performance in Exports bythe Coffee Board of India in the ExportAwards 2004-05 as the Best Exporter ofInstant Coffee, Best Exporter to Russia &CIS Countries [coffee] and Best Exporterfor Far East Countries [coffee]. YourCompany has received the highest coffeeexporter award from the Coffee Board ofIndia for many years.
Directors’ ResponsibilityStatement
Pursuant to Section 217(2AA) of theCompanies Act, 1956, the Directors confirmthat:
_ in the preparation of the annualaccounts, the applicable accountingstandards have been followed and nomaterial departures have been madefrom the same;
_ they have selected such accountingpolicies and applied them consistentlyand made judgements and estimatesthat are reasonable and prudent so asto give a true and fair view of the stateof affairs of the Company at the end ofthe financial year and of the profits forthat period;
_ they have taken proper and sufficientcare for the maintenance of adequateaccounting records in accordance withthe provisions of the Companies Act,1956 for safeguarding the assets ofthe Company and for preventing anddetecting fraud and other irregularities;
_ they have prepared the annualaccounts on a going concern basis.
12
.
Corporate Governance
In compliance with the requirements ofClause 49 of the Listing Agreement with theStock Exchange, a separate report onCorporate Governance along with Auditors’certificate on its compliance is attached asAnnexure –1 to this Report.
Cautionary Statement
Statements in this Report, particularly thosewhich relate to Management Discussionand Analysis as explained in the CorporateGovernance Report, describing theCompany’s objectives, projections,estimates and expectations may constitute‘forward looking statements’ within themeaning of applicable laws and regulations.Actual results might differ materially fromthose either expressed or implied in thestatement depending on the circumstances.
Directors
In accordance with Article 119 of the Articlesof Association, Mr. Michael W. O. Garrettretires by rotation and being eligible offershimself for re-appointment.
Auditors
The Statutory Auditors of the Company,M/s. A. F. Ferguson & Co., CharteredAccountants, New Delhi, retire inaccordance with the provisions of theCompanies Act, 1956 and are eligible forre-appointment. M/s. A. F. Ferguson & Co.,Chartered Accountants, New Delhi havesought the re-appointment and haveconfirmed that their re-appointment if made,shall be within the limits of Section 224(1)(B)of the Companies Act, 1956.
The Audit Committee and the Board ofDirectors recommends the re-appointmentof M/s. A. F. Ferguson & Co., CharteredAccountants, as the Auditors of theCompany.
Complying with the provisions ofSection 233-B of the Companies Act, 1956,the Board of Directors have appointed,subject to the approval of the CentralGovernment, M/s. Ramanath Iyer and Co.,Cost Accountants, New Delhi to carryout an audit of cost accounts of theCompany in respect of milk foods for theyear 2006.
Information regardingConservation of Energy etc.and Employees
Information required under Section217(1)(e) of the Companies Act, 1956(hereinafter referred to as ‘the Act’) readwith Rule 2 of the Companies (Disclosureof Particulars in the Report of Board ofDirectors) Rules, 1988 is given in theAnnexure - 2 forming part of this Report.Information as per Section 217(2A) of theAct, read with the Companies (Particularsof Employees) Rules, 1975, as amendedfrom time to time, forms part of this Report.However, as per the provisions of Section219 (1) (b) (iv) of the Act, the Report andAccounts are being sent to all the membersexcluding the statement containing theparticulars of employees to be providedunder Section 217(2A) of the Act. Anymember interested in obtaining suchparticulars may inspect the same at theRegistered Office of the Company or writeto the Company Secretary for a copy.
Trade Relations
The Company maintained healthy,cordial and harmonious industrialrelations at all levels. Despite severecompetition, the enthusiasm and unstintingefforts of the employees have enabled theCompany to remain at the forefront of theIndustry.
Your Company continued to receiveco-operation and unstinted support from thedistributors, retailers, stockists, suppliersand others associated with the Companyas its trading partners.
The Directors wish to place on record theirappreciation for the same and yourCompany will continue in its endeavourto build and nurture strong links withtrade based on mutuality, respect andco-operation with each other andconsistent with consumer interest.
Appreciation
Your Company has been able to operateefficiently because of the culture ofprofessionalism, creativity, integrity andcontinuous improvement in all functions andareas to ensure efficient utilisation of theCompany’s resources for sustainable andprofitable growth. The Directors wish tothank each and every employee for theircontribution to the good performance of theCompany.
On behalf of the Board of Directors
6th March, 2006 MARTIAL G. ROLLAND
Gurgaon CHAIRMAN

13
.
1. We have audited the attached balancesheet of Nestlé India Limited as atDecember 31, 2005, the profit andloss account and also the cash flowstatement for the year ended on thatdate annexed thereto. These financialstatements are the responsibilityof the Company’s management.Our responsibility is to express anopinion on these financial statementsbased on our audit.
2. We conducted our audit in accordancewith auditing standards generallyaccepted in India. Those standardsrequire that we plan and perform theaudit to obtain reasonable assuranceabout whether the financial statementsare free of material misstatements.An audit includes examining, on atest basis, evidence supporting theamounts and disclosures in thefinancial statements. An audit alsoincludes assessing the accountingprinciples used and significantestimates made by management, aswell as evaluating the overall financialstatement presentation. We believethat our audit provides a reasonablebasis for our opinion.
3. As required by the Companies(Auditor’s Report) Order, 2003 issuedby the Central Government of India interms of sub-section (4A) of section227 of the Companies Act, 1956,we enclose in the Annexure astatement on the matters specified inparagraphs 4 and 5 of the said Order.
4. Further to our comments in theannexure referred to in paragraph 3above, we report that:
a) we have obtained all theinformation and explanationswhich to the best of ourknowledge and belief werenecessary for the purposes ofour audit;
b) in our opinion, proper books ofaccount as required by law havebeen kept by the Company, sofar as appears from ourexamination of the books;
c) the balance sheet, the profit andloss account and cash flowstatement dealt with by this reportare in agreement with the booksof account;
d) in our opinion, the balance sheet,profit and loss account and thecash flow statement dealt with bythis report comply with themandatory accounting standardsreferred to in sub-section (3C) ofsection 211 of the Companies Act,1956;
e) on the basis of writtenrepresentations received from thedirectors and taken on record bythe Board of Directors, we reportthat none of the directors of theCompany is disqualified as onDecember 31, 2005 from beingappointed as director of theCompany under clause (g) ofsub-section (1) of section 274 ofthe Companies Act, 1956;
f) in our opinion and to the best ofour information and according tothe explanations given to us, theaccounts give the informationrequired by the CompaniesAct, 1956, in the manner sorequired and give a true and fairview in conformity with theaccounting principles generallyaccepted in India:
(i) in the case of the balancesheet, of the state of affairsof the Company as atDecember 31, 2005;
(ii) in the case of the profit andloss account, of the profit ofthe Company for the yearended on that date; and
(iii) in the case of cash flowstatement, of the cash flowsfor the year ended on thatdate.
For A.F. FERGUSON & CO.
Chartered Accountants
(MANJULA BANERJI)6th March, 2006 PartnerNew Delhi (Membership No. 86423)
AUDITORS’ REPORTTO THE MEMBERSOF NESTLÉ INDIA LIMITED
14
.
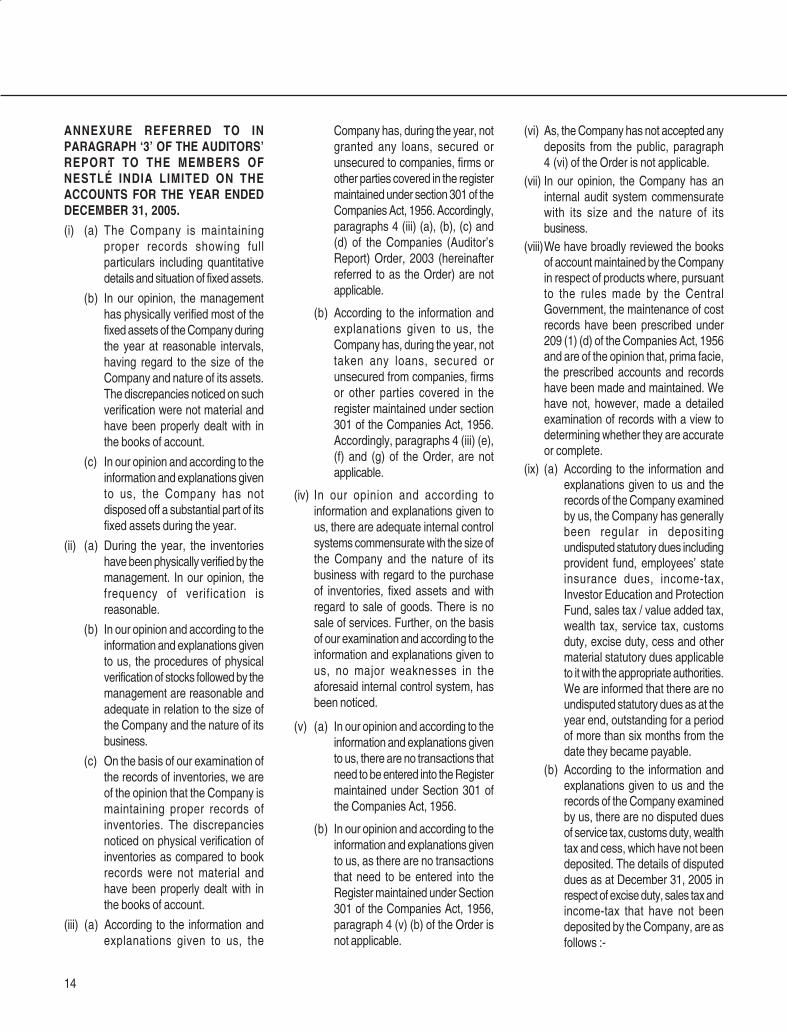
ANNEXURE REFERRED TO INPARAGRAPH ‘3’ OF THE AUDITORS’REPORT TO THE MEMBERS OFNESTLÉ INDIA LIMITED ON THEACCOUNTS FOR THE YEAR ENDEDDECEMBER 31, 2005.
(i) (a) The Company is maintainingproper records showing fullparticulars including quantitativedetails and situation of fixed assets.
(b) In our opinion, the managementhas physically verified most of thefixed assets of the Company duringthe year at reasonable intervals,having regard to the size of theCompany and nature of its assets.The discrepancies noticed on suchverification were not material andhave been properly dealt with inthe books of account.
(c) In our opinion and according to theinformation and explanations givento us, the Company has notdisposed off a substantial part of itsfixed assets during the year.
(ii) (a) During the year, the inventorieshave been physically verified by themanagement. In our opinion, thefrequency of verification isreasonable.
(b) In our opinion and according to theinformation and explanations givento us, the procedures of physicalverification of stocks followed by themanagement are reasonable andadequate in relation to the size ofthe Company and the nature of itsbusiness.
(c) On the basis of our examination ofthe records of inventories, we areof the opinion that the Company ismaintaining proper records ofinventories. The discrepanciesnoticed on physical verification ofinventories as compared to bookrecords were not material andhave been properly dealt with inthe books of account.
(iii) (a) According to the information andexplanations given to us, the
Company has, during the year, notgranted any loans, secured orunsecured to companies, firms orother parties covered in the registermaintained under section 301 of theCompanies Act, 1956. Accordingly,paragraphs 4 (iii) (a), (b), (c) and(d) of the Companies (Auditor’sReport) Order, 2003 (hereinafterreferred to as the Order) are notapplicable.
(b) According to the information andexplanations given to us, theCompany has, during the year, nottaken any loans, secured orunsecured from companies, firmsor other parties covered in theregister maintained under section301 of the Companies Act, 1956.Accordingly, paragraphs 4 (iii) (e),(f) and (g) of the Order, are notapplicable.
(iv) In our opinion and according toinformation and explanations given tous, there are adequate internal controlsystems commensurate with the size ofthe Company and the nature of itsbusiness with regard to the purchaseof inventories, fixed assets and withregard to sale of goods. There is nosale of services. Further, on the basisof our examination and according to theinformation and explanations given tous, no major weaknesses in theaforesaid internal control system, hasbeen noticed.
(v) (a) In our opinion and according to theinformation and explanations givento us, there are no transactions thatneed to be entered into the Registermaintained under Section 301 ofthe Companies Act, 1956.
(b) In our opinion and according to theinformation and explanations givento us, as there are no transactionsthat need to be entered into theRegister maintained under Section301 of the Companies Act, 1956,paragraph 4 (v) (b) of the Order isnot applicable.
(vi) As, the Company has not accepted anydeposits from the public, paragraph4 (vi) of the Order is not applicable.
(vii) In our opinion, the Company has aninternal audit system commensuratewith its size and the nature of itsbusiness.
(viii)We have broadly reviewed the booksof account maintained by the Companyin respect of products where, pursuantto the rules made by the CentralGovernment, the maintenance of costrecords have been prescribed under209 (1) (d) of the Companies Act, 1956and are of the opinion that, prima facie,the prescribed accounts and recordshave been made and maintained. Wehave not, however, made a detailedexamination of records with a view todetermining whether they are accurateor complete.
(ix) (a) According to the information andexplanations given to us and therecords of the Company examinedby us, the Company has generallybeen regular in depositingundisputed statutory dues includingprovident fund, employees’ stateinsurance dues, income-tax,Investor Education and ProtectionFund, sales tax / value added tax,wealth tax, service tax, customsduty, excise duty, cess and othermaterial statutory dues applicableto it with the appropriate authorities.We are informed that there are noundisputed statutory dues as at theyear end, outstanding for a periodof more than six months from thedate they became payable.
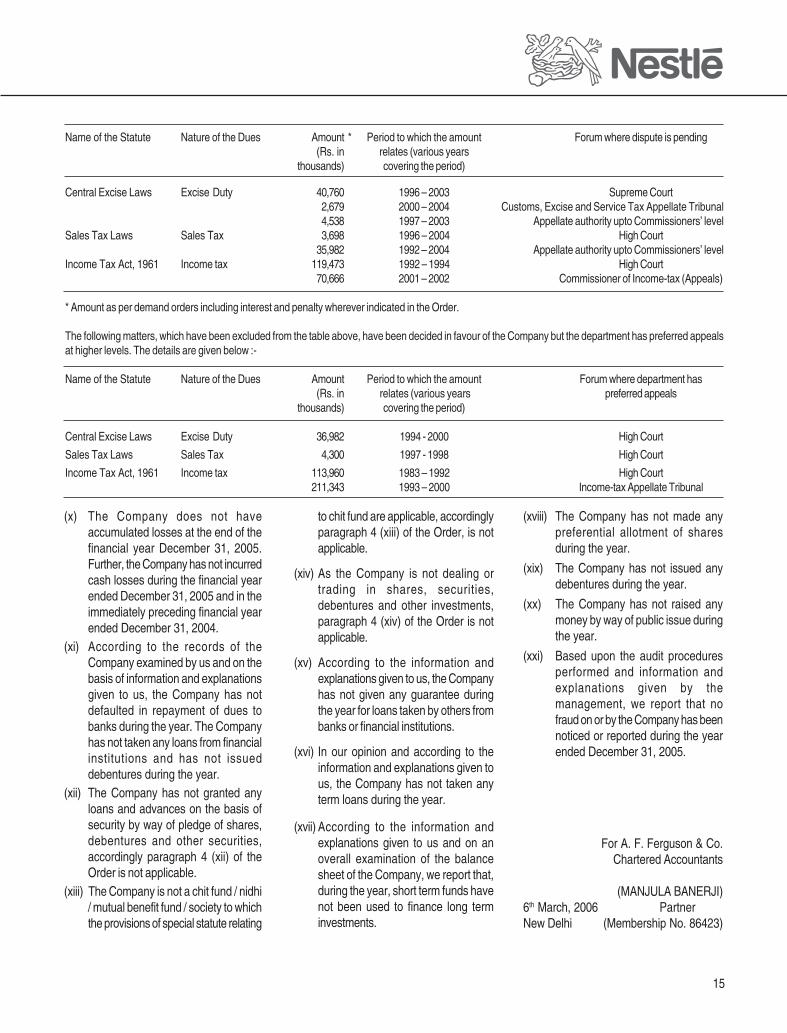
(b) According to the information andexplanations given to us and therecords of the Company examinedby us, there are no disputed duesof service tax, customs duty, wealthtax and cess, which have not beendeposited. The details of disputeddues as at December 31, 2005 inrespect of excise duty, sales tax andincome-tax that have not beendeposited by the Company, are asfollows :-
15
.
(x) The Company does not haveaccumulated losses at the end of thefinancial year December 31, 2005.Further, the Company has not incurredcash losses during the financial yearended December 31, 2005 and in theimmediately preceding financial yearended December 31, 2004.
(xi) According to the records of theCompany examined by us and on thebasis of information and explanationsgiven to us, the Company has notdefaulted in repayment of dues tobanks during the year. The Companyhas not taken any loans from financialinstitutions and has not issueddebentures during the year.
(xii) The Company has not granted anyloans and advances on the basis ofsecurity by way of pledge of shares,debentures and other securities,accordingly paragraph 4 (xii) of theOrder is not applicable.
(xiii) The Company is not a chit fund / nidhi/ mutual benefit fund / society to whichthe provisions of special statute relating
to chit fund are applicable, accordinglyparagraph 4 (xiii) of the Order, is notapplicable.
(xiv) As the Company is not dealing ortrading in shares, securities,debentures and other investments,paragraph 4 (xiv) of the Order is notapplicable.
(xv) According to the information andexplanations given to us, the Companyhas not given any guarantee duringthe year for loans taken by others frombanks or financial institutions.
(xvi) In our opinion and according to theinformation and explanations given tous, the Company has not taken anyterm loans during the year.
(xvii) According to the information andexplanations given to us and on anoverall examination of the balancesheet of the Company, we report that,during the year, short term funds havenot been used to finance long terminvestments.
(xviii) The Company has not made anypreferential allotment of sharesduring the year.
(xix) The Company has not issued anydebentures during the year.
(xx) The Company has not raised anymoney by way of public issue duringthe year.
(xxi) Based upon the audit proceduresperformed and information andexplanations given by themanagement, we report that nofraud on or by the Company has beennoticed or reported during the yearended December 31, 2005.
For A. F. Ferguson & Co.Chartered Accountants
(MANJULA BANERJI)6th March, 2006 PartnerNew Delhi (Membership No. 86423)
Name of the Statute Nature of the Dues Amount * Period to which the amount Forum where dispute is pending
(Rs. in relates (various years
thousands) covering the period)
Central Excise Laws Excise Duty 40,760 1996 – 2003 Supreme Court
2,679 2000 – 2004 Customs, Excise and Service Tax Appellate Tribunal
4,538 1997 – 2003 Appellate authority upto Commissioners’ level
Sales Tax Laws Sales Tax 3,698 1996 – 2004 High Court
35,982 1992 – 2004 Appellate authority upto Commissioners’ level
Income Tax Act, 1961 Income tax 119,473 1992 – 1994 High Court
70,666 2001 – 2002 Commissioner of Income-tax (Appeals)
* Amount as per demand orders including interest and penalty wherever indicated in the Order.
The following matters, which have been excluded from the table above, have been decided in favour of the Company but the department has preferred appeals
at higher levels. The details are given below :-
Name of the Statute Nature of the Dues Amount Period to which the amount Forum where department has
(Rs. in relates (various years preferred appeals
thousands) covering the period)
Central Excise Laws Excise Duty 36,982 1994 - 2000 High Court
Sales Tax Laws Sales Tax 4,300 1997 - 1998 High Court
Income Tax Act, 1961 Income tax 113,960 1983 – 1992 High Court
211,343 1993 – 2000 Income-tax Appellate Tribunal

16
.
BALANCE SHEET AS AT DECEMBER 31, 2005
2005 2004(Rs. in (Rs. in
SOURCES OF FUNDS SCHEDULE thousands) thousands)
SHAREHOLDERS’ FUNDSCapital A 964,157 964,157Reserves and surplus B 2,577,176 3,541,333 2,229,913 3,194,070
LOAN FUNDSSecured C 143,045 79,051
3,684,378 3,273,121APPLICATION OF FUNDS
FIXED ASSETS DGross block 9,494,439 8,381,605Less:Depreciation 4,756,737 4,409,447
Net block 4,737,702 3,972,158Capital work-in-progress 228,251 4,965,953 340,885 4,313,043
INVESTMENTS E 1,044,276 1,548,637
DEFERRED TAX ASSETS/ (LIABILITIES) (NET) F (99,521) 12,038
CURRENT ASSETS, LOANS AND ADVANCES GInventories 2,530,993 2,166,728Sundry debtors 305,247 261,683Cash and bank balances 366,453 94,485Loans and advances 1,424,272 1,058,856
4,626,965 3,581,752Less: CURRENT LIABILITIES
AND PROVISIONS HLiabilities 3,198,326 2,693,640Provisions 3,654,969 3,488,709
6,853,295 6,182,349
NET CURRENT ASSETS (2,226,330) (2,600,597)
3,684,378 3,273,121NOTES TO THE ACCOUNTS O
March 6, 2006 MARTIAL G. ROLLAND SHOBINDER DUGGAL B. MURLIGurgaon Chairman & Managing Director Director - Finance & Control Sr. VP - Legal & Company Secretary
As per our report attachedFor A.F. FERGUSON & CO.,
Chartered Accountants
March 6, 2006 (MANJULA BANERJI)New Delhi Partner
Membership No. 86423
17
.
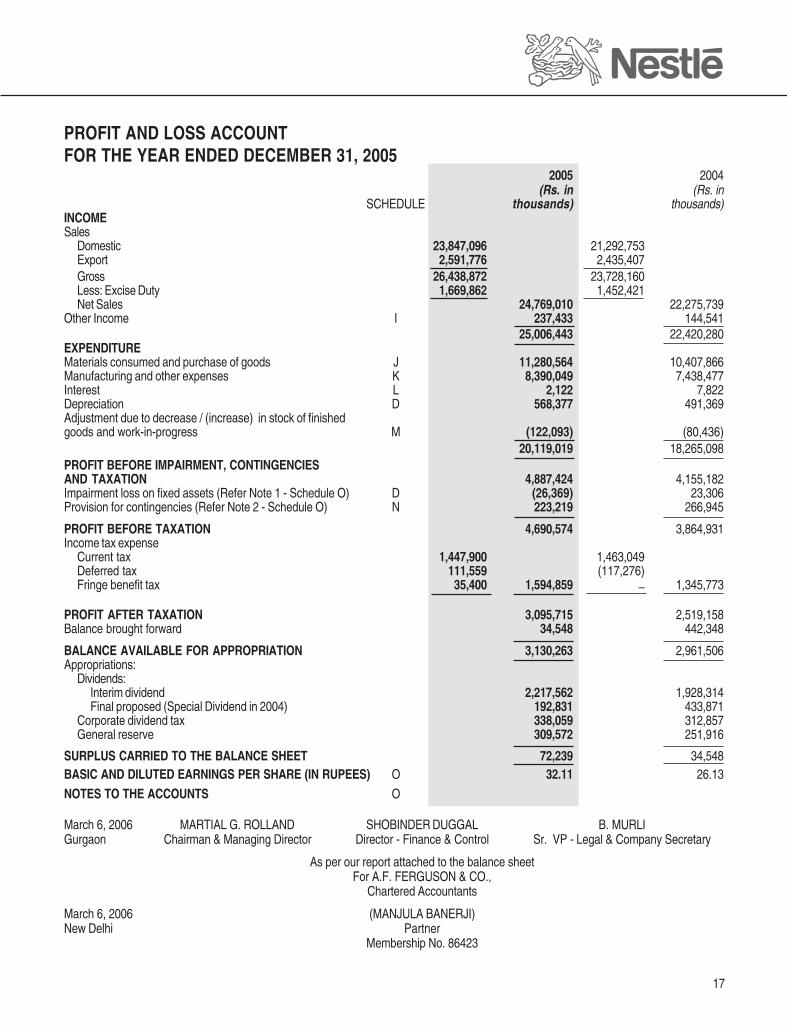
PROFIT AND LOSS ACCOUNTFOR THE YEAR ENDED DECEMBER 31, 2005
2005 2004(Rs. in (Rs. in
SCHEDULE thousands) thousands)INCOMESales
Domestic 23,847,096 21,292,753Export 2,591,776 2,435,407Gross 26,438,872 23,728,160Less: Excise Duty 1,669,862 1,452,421Net Sales 24,769,010 22,275,739
Other Income I 237,433 144,54125,006,443 22,420,280
EXPENDITUREMaterials consumed and purchase of goods J 11,280,564 10,407,866Manufacturing and other expenses K 8,390,049 7,438,477Interest L 2,122 7,822Depreciation D 568,377 491,369Adjustment due to decrease / (increase) in stock of finishedgoods and work-in-progress M (122,093) (80,436)
20,119,019 18,265,098PROFIT BEFORE IMPAIRMENT, CONTINGENCIESAND TAXATION 4,887,424 4,155,182Impairment loss on fixed assets (Refer Note 1 - Schedule O) D (26,369) 23,306Provision for contingencies (Refer Note 2 - Schedule O) N 223,219 266,945
PROFIT BEFORE TAXATION 4,690,574 3,864,931Income tax expense
Current tax 1,447,900 1,463,049Deferred tax 111,559 (117,276)Fringe benefit tax 35,400 1,594,859 – 1,345,773
PROFIT AFTER TAXATION 3,095,715 2,519,158Balance brought forward 34,548 442,348
BALANCE AVAILABLE FOR APPROPRIATION 3,130,263 2,961,506Appropriations:
Dividends:Interim dividend 2,217,562 1,928,314Final proposed (Special Dividend in 2004) 192,831 433,871
Corporate dividend tax 338,059 312,857General reserve 309,572 251,916
SURPLUS CARRIED TO THE BALANCE SHEET 72,239 34,548BASIC AND DILUTED EARNINGS PER SHARE (IN RUPEES) O 32.11 26.13
NOTES TO THE ACCOUNTS O
March 6, 2006 MARTIAL G. ROLLAND SHOBINDER DUGGAL B. MURLIGurgaon Chairman & Managing Director Director - Finance & Control Sr. VP - Legal & Company Secretary
As per our report attached to the balance sheetFor A.F. FERGUSON & CO.,
Chartered Accountants
March 6, 2006 (MANJULA BANERJI)New Delhi Partner
Membership No. 86423

18
.
CASH FLOW STATEMENTFOR THE YEAR ENDED DECEMBER 31, 2005
2005 2004(Rs. in (Rs. in
thousands) thousands)A CASH FLOW FROM OPERATING ACTIVITIES
Net profit before tax 4,690,574 3,864,931Adjustments for :Depreciation 568,377 491,369Unrealised exchange differences 207 (5,334)Deficit/(surplus) on fixed assets sold/scrapped/written off/written back (3,441) 35,601Interest expense 2,122 7,822Impairment loss/(reversal) on fixed assets (26,369) 23,306Provision for wealth tax 1,000 603Interest on inter corporate deposits (6,782) (8,596)
Operating profit before working capital changes 5,225,688 4,409,702
Adjustments for :Decrease/(increase) in trade and other receivables (282,897) (55,735)Decrease/(increase) in inventories (364,265) 27,434Increase/(decrease) in trade payables 526,811 270,816Increase/(decrease) in provision for contingencies 223,219 266,945Increase/(decrease) in provision for pension and gratuity 217,886 193,414
Cash generated from operations 5,546,442 5,112,576Direct taxes paid (1,515,817) (1,460,812)
Net cash from operating activities 4,030,626 3,651,764
B CASH FLOW FROM INVESTING ACTIVITIES
Purchase of fixed assets (adjusted for suppliers payables and capital work in progress) (1,300,477) (784,752)Sale of fixed assets 85,854 5,457Interest received on inter corporate deposits 5,997 8,853Inter corporate deposits refunded – 120,000Inter corporate deposits granted (95,000) –Net cash used in investing activities (1,303,626) (650,442)
C CASH FLOW FROM FINANCING ACTIVITIES
Proceeds/(Repayments) of borrowings 63,994 28,052Interest paid (2,122) (7,822)Dividends paid (2,649,401) (1,925,756)Corporate dividend tax (371,864) (252,007)
Net cash outflow from financing activities (2,959,393) (2,157,533)
Net increase / (decrease) in cash and cash equivalents (A+B+C) (232,393) 843,789
Cash and cash equivalents as at openingCash and bank balances 94,485 62,894Current investments 1,548,627 736,429
Cash and cash equivalents as at opening 1,643,112 799,323
Cash and cash equivalents as at closing
Cash and bank balances 366,453 94,485Current investments 1,044,266 1,548,627
Cash and cash equivalents as at closing 1,410,719 1,643,112
NET INCREASE / (DECREASE) IN CASH AND CASH EQUIVALENTS (232,393) 843,789
March 6, 2006 MARTIAL G. ROLLAND SHOBINDER DUGGAL B. MURLIGurgaon Chairman & Managing Director Director - Finance & Control Sr. VP - Legal & Company Secretary
As per our report attached to the balance sheetFor A.F. FERGUSON & CO.,
Chartered Accountants
March 6, 2006 (MANJULA BANERJI)New Delhi Partner
Membership No. 86423

19
.
SCHEDULES FORMING PART OF THE BALANCE SHEET AS AT DECEMBER 31, 2005
2005 2004
(Rs. in (Rs. in
thousands) thousands)
SCHEDULE A
SHARE CAPITAL
Authorised
100,000,000 Equity shares of Rs.10 each (Previous year 100,000,000) 1,000,000 1,000,000
Issued, subscribed and paid-up
96,415,716 Equity shares of Rs.10 each (Previous year 96,415,716) 964,157 964,157
Of the above:
73,413,626 Shares of Rs.10 each (Previous year 73,413,626) were allotted as fully
paid-up bonus shares by capitalisation of general reserves Rs. 73,897
thousands (Previous year Rs. 73,897 thousands) and share premium
Rs. 660,239 thousands (Previous year Rs. 660,239 thousands).
736,331 Shares of Rs.10 each (Previous year 736,331 ) were allotted as fully paid
up pursuant to a contract without payment being received in cash.
Of the above:
32,166,274 Shares of Rs. 10 each (Previous year 32,166,274) are held by Nestlé S.A.
27,463,680 Shares of Rs. 10 each (Previous year NIL) are held by Maggi Enterprises
Limited, a susidiary of Nestlé S.A._ Shares of Rs. 10 each (Previous year 27,463,680 ) are held by Nestlé’s
Holdings Limited, a susidiary of Nestlé S.A.
SCHEDULE B
RESERVES AND SURPLUS
Share premium
As per last balance sheet 432,363 432,363
Capital subsidy
As per last balance sheet 2,500 2,500
General reserve
As per last balance sheet 1,760,502 1,508,586
Add : Transferred from profit and loss account 309,572 251,916
2,070,074 1,760,502
Surplus, being balance in profit and loss account (undistributed profits) 72,239 34,548
2,577,176 2,229,913
SCHEDULE CSECURED LOANS
From Banks
Secured by a first pari passu charge on all movable assets (excluding plant and machinery), finished 143,045 79,051
goods, work-in-progress, raw materials and book debts.
143,045 79,051

20
.
2005 2004(Rs. in (Rs. in
thousands) thousands)
SCHEDULE E
INVESTMENTS(NON TRADE, UNQUOTED)
LONG TERM
Coffee Futures Exchange India Limited 1 Equity share of the face value of Rs. 10,000 each 10 10
CURRENTGOVERNMENT SECURITIES
Treasury bills Face value of Rs. 1,101,500 thousands (previous yearRs. 1,435,000) purchased and Rs. 1,271,500 thousands(previous year Rs. 1,065,000) sold during the year 197,363 366,129
MUTUAL FUNDS — DEBT[Units of face value Rs. 10 each, unless otherwise stated]
JM Mutual Fund 4,995,608 Units (previous year 9,986,275) of JM High Liquidity FundSuper Institutional Plan - Daily Dividend Option. (111,078,616units purchased and 116,069,283 units sold during the year) 50,038 100,027
— JM Mutual Fund Short Term Plan - Dividend Option. (19,967,806units purchased and sold during the year) – –
Standard Chartered Mutual Fund 3,501,301 Units (previous year 5,000,675) of GCCD Grindlays Cash FundSuper Institutional Plan C - Daily Dividend Option. (96,872,179units purchased and 98,371,553 units sold during the year) 35,013 50,007
Alliance Capital Mutual Fund — Units (previous year Nil) of Alliance Cash Manager IP - DailyDividend. (30,169,567 units purchased and sold during the year) – –
SCHEDULE D
FIXED ASSETS(Rs. in thousands)
GROSS BLOCK DEPRECIATION NET BLOCK
Cost as Additions # Deletions / Cost as at As at For the year Impairment loss ## On deletions / As at As at As atat December adjustments December December adjustments December December December
31, 2004 31, 2005 31, 2004 31, 2005 31, 2005 31, 2004
charged reversed
Tangible Assets (A)
Freehold land 56,026 – – 56,026 – – – – – – 56,026 56,026
Leasehold land – 63,131 – 63,131 – 58 – – – 58 63,073 –
Buildings 1,171,136 67,980 4,862 1,234,254 374,211 34,795 990 – 542 409,454 824,800 796,925
Railway siding 11,738 – 5 11,733 8,013 557 – – – 8,570 3,163 3,725
Plant and machinery 6,297,638 637,906 218,304 6,717,240 3,400,425 345,274 11,658 39,017 142,404 3,575,936 3,141,304 2,897,213
Furniture and fixtures 359,067 42,316 11,591 389,792 228,435 69,478 – – 10,892 287,021 102,771 130,632
Information technology
equipment 415,459 30,932 27,039 419,352 359,482 34,122 – – 27,039 366,565 52,787 55,977
Vehicles 70,541 19,354 15,331 74,564 38,881 13,646 – – 13,841 38,686 35,878 31,660
Sub Total 8,381,605 861,619 277,132 8,966,092 4,409,447 497,930 12,648 39,017 194,718 4,686,290 4,279,802 3,972,158
Intangible Assets (B)
Management
information systems – 528,347 – 528,347 – 70,447 – – – 70,447 457,900 –
Total (A+B) 8,381,605 1,389,966 277,132 9,494,439 4,409,447 568,377 12,648 39,017 194,718 4,756,737 4,737,702
Previous year 7,894,480 614,197 127,072 8,381,605 3,980,786 491,369 104,642 81,336 86,014 4,409,447 3,972,158
Capital work-in-progress including capital advances and machinery-in-transit 228,251 340,885
4,965,953 4,313,043
Notes:
(a) Buildings include Rs. 500 being the cost of share in a Co-operative Housing Society.
(b) Buildings and plant and machinery include Rs. 53,998 thousands (Previous year Rs. 53,998 thousands) being the cost of leasehold improvements.
# Additions for the year include fluctuations in the rate of foreign exchange of Rs. 10,929 thousands (previous year Rs. 12 thousands).
## Refer Note 1 - Schedule O
21
.
2005 2004(Rs. in (Rs. in
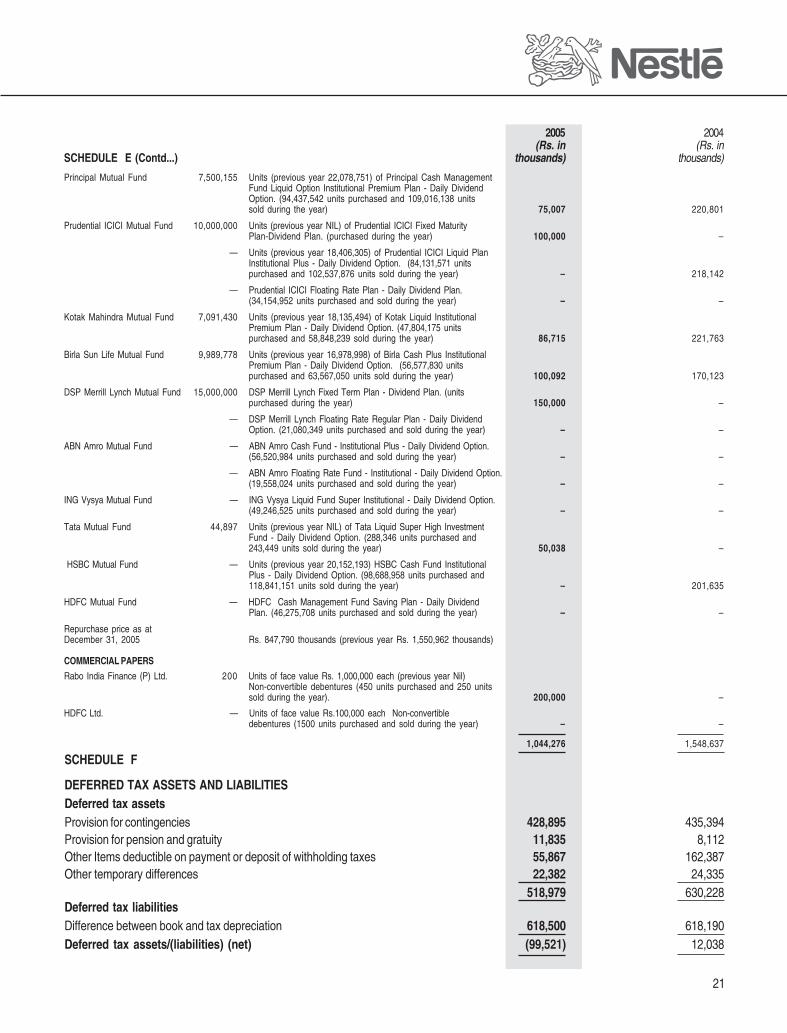
SCHEDULE E (Contd...) thousands) thousands)
Principal Mutual Fund 7,500,155 Units (previous year 22,078,751) of Principal Cash ManagementFund Liquid Option Institutional Premium Plan - Daily DividendOption. (94,437,542 units purchased and 109,016,138 unitssold during the year) 75,007 220,801
Prudential ICICI Mutual Fund 10,000,000 Units (previous year NIL) of Prudential ICICI Fixed MaturityPlan-Dividend Plan. (purchased during the year) 100,000 –
— Units (previous year 18,406,305) of Prudential ICICI Liquid PlanInstitutional Plus - Daily Dividend Option. (84,131,571 unitspurchased and 102,537,876 units sold during the year) – 218,142
— Prudential ICICI Floating Rate Plan - Daily Dividend Plan.(34,154,952 units purchased and sold during the year) – –
Kotak Mahindra Mutual Fund 7,091,430 Units (previous year 18,135,494) of Kotak Liquid InstitutionalPremium Plan - Daily Dividend Option. (47,804,175 unitspurchased and 58,848,239 sold during the year) 86,715 221,763
Birla Sun Life Mutual Fund 9,989,778 Units (previous year 16,978,998) of Birla Cash Plus InstitutionalPremium Plan - Daily Dividend Option. (56,577,830 unitspurchased and 63,567,050 units sold during the year) 100,092 170,123
DSP Merrill Lynch Mutual Fund 15,000,000 DSP Merrill Lynch Fixed Term Plan - Dividend Plan. (unitspurchased during the year) 150,000 –
— DSP Merrill Lynch Floating Rate Regular Plan - Daily DividendOption. (21,080,349 units purchased and sold during the year) – –
ABN Amro Mutual Fund — ABN Amro Cash Fund - Institutional Plus - Daily Dividend Option.(56,520,984 units purchased and sold during the year) – –
— ABN Amro Floating Rate Fund - Institutional - Daily Dividend Option.(19,558,024 units purchased and sold during the year) – –
ING Vysya Mutual Fund — ING Vysya Liquid Fund Super Institutional - Daily Dividend Option.(49,246,525 units purchased and sold during the year) – –
Tata Mutual Fund 44,897 Units (previous year NIL) of Tata Liquid Super High InvestmentFund - Daily Dividend Option. (288,346 units purchased and243,449 units sold during the year) 50,038 –
HSBC Mutual Fund — Units (previous year 20,152,193) HSBC Cash Fund InstitutionalPlus - Daily Dividend Option. (98,688,958 units purchased and118,841,151 units sold during the year) – 201,635
HDFC Mutual Fund — HDFC Cash Management Fund Saving Plan - Daily DividendPlan. (46,275,708 units purchased and sold during the year) – –
Repurchase price as atDecember 31, 2005 Rs. 847,790 thousands (previous year Rs. 1,550,962 thousands)
COMMERCIAL PAPERS
Rabo India Finance (P) Ltd. 200 Units of face value Rs. 1,000,000 each (previous year Nil)Non-convertible debentures (450 units purchased and 250 unitssold during the year). 200,000 –
HDFC Ltd. — Units of face value Rs.100,000 each Non-convertibledebentures (1500 units purchased and sold during the year) – –
1,044,276 1,548,637
SCHEDULE F
DEFERRED TAX ASSETS AND LIABILITIESDeferred tax assetsProvision for contingencies 428,895 435,394Provision for pension and gratuity 11,835 8,112Other Items deductible on payment or deposit of withholding taxes 55,867 162,387Other temporary differences 22,382 24,335
518,979 630,228Deferred tax liabilitiesDifference between book and tax depreciation 618,500 618,190Deferred tax assets/(liabilities) (net) (99,521) 12,038

22
.
2005 2004(Rs. in (Rs. in
thousands) thousands)
SCHEDULE G
CURRENT ASSETS, LOANS AND ADVANCES
InventoriesStores and spare parts * 157,213 141,150Stock-in-trade : **
Finished goods 1,285,707 1,073,759Work-in-progress 271,418 342,419Raw materials 643,214 494,819Packing materials 173,441 114,581
2,530,993 2,166,728* At cost** At cost or net realisable value, whichever is lower
Sundry debtors (Unsecured)Considered good
Over six months 2,437 7,765Others 302,810 305,247 253,918 261,683
Considered doubtfulOver six months 9,823 10,502Others 15,671 25,494 15,000 25,502
330,741 287,185Less: Provision for doubtful debts 25,494 25,502
305,247 261,683
Cash and bank balancesCash in hand 291 303Cheques in hand 16,624 60,275With scheduled banks - on current account 19,508 33,877
- on deposit account 330,030 30366,453 94,485
Loans and advances(Unsecured, considered good - unless otherwise stated)Advances recoverable in cash or in kind or for value to be receivedConsidered good
Secured 34,852 42,863Unsecured 953,204 988,056 706,294 749,157
Considered doubtful 13,626 37,9741,001,682 787,131
Less: Provision for doubtful advances 13,626 37,974
988,056 749,157Inter corporate deposits 172,500 77,500Taxation (payments less provisions) 263,716 232,199
1,424,272 1,058,8564,626,965 3,581,752

23
.
2005 2004(Rs. in (Rs. in
thousands) thousands)
SCHEDULE H
CURRENT LIABILITIES AND PROVISIONS
Current liabilitiesSundry Creditors -
Small scale industrial undertakings * 39,772 44,062Others 3,125,025 2,618,080
Investor Education and Protection Fund shall be credited by the following:Unpaid dividends # 33,529 31,498
3,198,326 2,693,640Provisions
Pension and gratuity 1,363,352 1,145,466Proposed final dividend 192,831 433,871Corporate dividend tax 27,045 60,850Contingencies (Refer Schedule N) 2,071,741 1,848,522
3,654,969 3,488,709
6,853,295 6,182,349
* Refer to Note 18 Schedule O# There is no amount due and outstanding to be credited to Investor Education and
Protection Fund
SCHEDULE I
OTHER INCOME
Dividend on current non trade investments 67,575 15,118Interest on income tax refund in relation to earlier years 5,253 –Interest received on loans and deposits (gross) 71,780 34,089(Tax deducted at source Rs. 11,316 thousandsprevious year Rs. 1,976 thousands)Export incentives 696 3,541Miscellaneous income 88,500 61,715Surplus on fixed assets sold/scrapped/written back 3,441 –Profit on sale of current non trade investments 188 30,078
237,433 144,541
SCHEDULE J
MATERIALS CONSUMED AND PURCHASE OF GOODS
Raw materials consumed 8,819,249 8,122,752Packing materials consumed 2,178,344 1,960,875Purchase of goods - outside manufacture 281,667 322,369
- others 1,304 1,870
11,280,564 10,407,866

24
.
2005 2004(Rs. in (Rs. in
thousands) thousands)
SCHEDULE K
MANUFACTURING AND OTHER EXPENSES
Employees’ cost
Salaries, wages, bonus, pension, gratuity etc. 1,660,714 1,499,467
Contribution to provident and other funds 60,618 52,049
Staff welfare expenses 111,612 1,832,944 90,964 1,642,480
Advertising and sales promotion 1,359,432 1,212,585
Freight, transport and distribution 1,177,179 1,096,792
General licence fees (net of taxes) 821,927 740,673
Taxes on general licence fees 127,385 114,805
Power and fuel 1,039,103 850,667
Maintenance and repairs
Plant and machinery 199,812 182,192
Buildings 26,847 37,402
General 35,870 262,529 40,192 259,786
Travelling 310,715 259,101
Contract manufacturing charges 290,771 228,645
Rates and taxes 196,949 176,406
Rent 153,126 149,131
Information technology and management information systems 242,765 140,132
Milk collection and district development expenses 100,979 81,923
Consumption of stores and spare parts 77,478 72,083
(excluding Rs.161,742 thousands charged to other revenue
accounts, previous year Rs.150,902 thousands)
Training expenses 59,422 68,919
Market research 50,065 37,663
Deficit on fixed assets sold/scrapped/written off – 35,601
Laboratory (quality testing) expenses 52,738 33,975
Insurance 16,860 14,779
Miscellaneous expenses 217,682 222,331
8,390,049 7,438,477

25
.
2005 2004(Rs. in (Rs. in
thousands) thousands)
SCHEDULE L
INTEREST
Interest on fixed loans 276 1,868Others 1,846 5,954
2,122 7,822
SCHEDULE M
ADJUSTMENT DUE TO (INCREASE)/DECREASE IN STOCKOF FINISHED GOODS AND WORK-IN-PROGRESS
Opening stockWork-in-progress 342,419 286,474Finished goods 1,073,759 1,064,179
1,416,178 1,350,653
Less : Excise duty 104,333 119,244Net opening stock (A) 1,311,845 1,231,409
Less : Closing stockWork-in-progress 271,418 342,419Finished goods 1,285,707 1,073,759
1,557,125 1,416,178
Less : Excise duty 123,187 104,333Net closing stock (B) 1,433,938 1,311,845
Movement in opening and closing stock (A-B) (122,093) (80,436)
SCHEDULE N
PROVISION FOR CONTINGENCIES
Balance as at December 31, 2004/2003 1,848,522 1,581,577Add : Created during the year 308,719 380,945Less : Reversed/utlised during the year (85,500) (114,000)Net provision taken to the Profit and Loss Account 223,219 266,945
Balance as at December 31, 2005/2004 2,071,741 1,848,522(Refer Note 2- Schedule O)

26
.
SCHEDULE O
NOTES TO THE ACCOUNTS2005 2004
(Rs. in (Rs. in
thousands) thousands)
1. During the year ended December 31, 2005, the Company has reversed certain impairmentlosses recognised in earlier years and the resultant gain (Gross - Rs. 39,017 thousands,net of deferred taxes - Rs. 25,884 thousands) consequent to the disposal of most itemsof the plant and machinery relating to the erstwhile Water business (discontinued in 2003)has been credited to the profit and loss account.
Impairment loss of fixed assets (Gross - Rs. 12,648 thousands, net of deferred taxes -Rs. 8,391 thousands) relates to various items of building and plant and machinery thathave been brought down to their recoverable values upon evaluation of future economicbenefits from their use.
2. The Company has created a contingency provision of Rs. 308,719 thousands (Previousyear Rs. 380,945 thousands) for various contingencies resulting mainly from issues,which are under litigation / dispute and other items requiring management judgment anddiscretion. The Company has also reversed / utilised contingency provision of Rs. 85,500thousands (Previous year Rs. 114,000 thousands) due to the satisfactory settlement ofcertain disputes and other matters for which provision was no longer required. The detailsof class-wise provisions are given below :
(Rs. in thousands)
Description Class of ProvisionsLitigations and Disputes Others Total
related disputes
Opening Balance 1,174,832 71,000 602,690 1,848,522New Provisions 140,339 65,000 103,380 308,719Utilization / Settlement – (20,000) – (20,000)Reversal – (51,000) (14,500) (65,500)Closing Balance 1,315,171 65,000 691,570 2,071,741
Notes:
(a) Litigations and related disputes- represents estimates made mainly for probableclaims arising out of litigations / disputes pending with revenue authorities under variousstatutes (i.e. Income Tax, Excise Duty, Service Tax, Sales and Purchase Tax etc.).The timing and the probability of the outflow with regard to these matters depends on theultimate settlement / conclusion with the relevant authorities.
(b) Disputes - represents estimates made for probable claims arising out of disputes incommercial dealings with third parties. The settlement period will depend on the course ofaction taken by the parties in dispute.
(c) Others - include estimates made for products sold by the Company which are coveredunder free replacement warranty on becoming unfit for consumption during the prescribedshelf life, investments held by the employee benefit trusts and items requiring managementjudgment and discretion in relation to certain employees related matters. The timing andprobability of outflow with regard to these matters will depend on the external environmentand the consequent decision / conclusion by the Management.
3. Capital commitments remaining to be executed and not provided for 500,435 103,859
27
.
2005 2004(Rs. in (Rs. in
thousands) thousands)
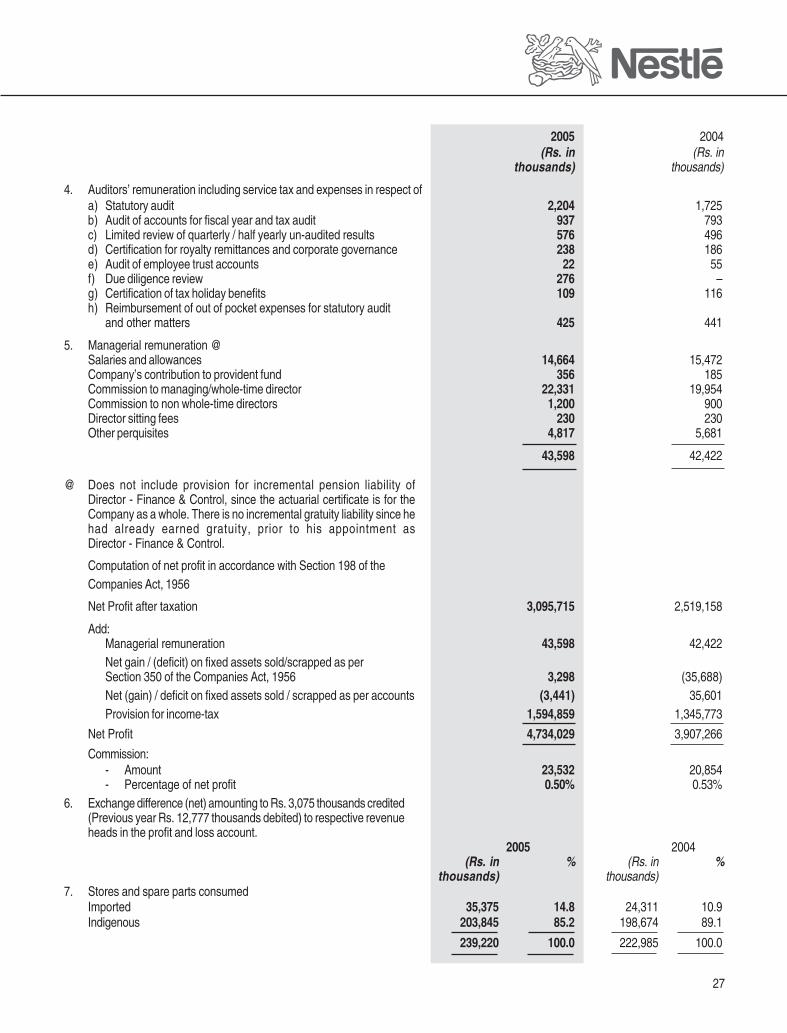
4. Auditors’ remuneration including service tax and expenses in respect ofa) Statutory audit 2,204 1,725b) Audit of accounts for fiscal year and tax audit 937 793c) Limited review of quarterly / half yearly un-audited results 576 496d) Certification for royalty remittances and corporate governance 238 186e) Audit of employee trust accounts 22 55f) Due diligence review 276 –g) Certification of tax holiday benefits 109 116h) Reimbursement of out of pocket expenses for statutory audit
and other matters 425 441
5. Managerial remuneration @Salaries and allowances 14,664 15,472Company’s contribution to provident fund 356 185Commission to managing/whole-time director 22,331 19,954Commission to non whole-time directors 1,200 900Director sitting fees 230 230Other perquisites 4,817 5,681
43,598 42,422
@ Does not include provision for incremental pension liability ofDirector - Finance & Control, since the actuarial certificate is for theCompany as a whole. There is no incremental gratuity liability since hehad already earned gratuity, prior to his appointment asDirector - Finance & Control.
Computation of net profit in accordance with Section 198 of theCompanies Act, 1956
Net Profit after taxation 3,095,715 2,519,158
Add:Managerial remuneration 43,598 42,422Net gain / (deficit) on fixed assets sold/scrapped as perSection 350 of the Companies Act, 1956 3,298 (35,688)Net (gain) / deficit on fixed assets sold / scrapped as per accounts (3,441) 35,601Provision for income-tax 1,594,859 1,345,773
Net Profit 4,734,029 3,907,266
Commission:- Amount 23,532 20,854- Percentage of net profit 0.50% 0.53%
6. Exchange difference (net) amounting to Rs. 3,075 thousands credited(Previous year Rs. 12,777 thousands debited) to respective revenueheads in the profit and loss account.
2005 2004(Rs. in % (Rs. in %
thousands) thousands)7. Stores and spare parts consumed
Imported 35,375 14.8 24,311 10.9Indigenous 203,845 85.2 198,674 89.1
239,220 100.0 222,985 100.0
28
.
2005 2004(Rs. in (Rs. in
thousands) thousands)
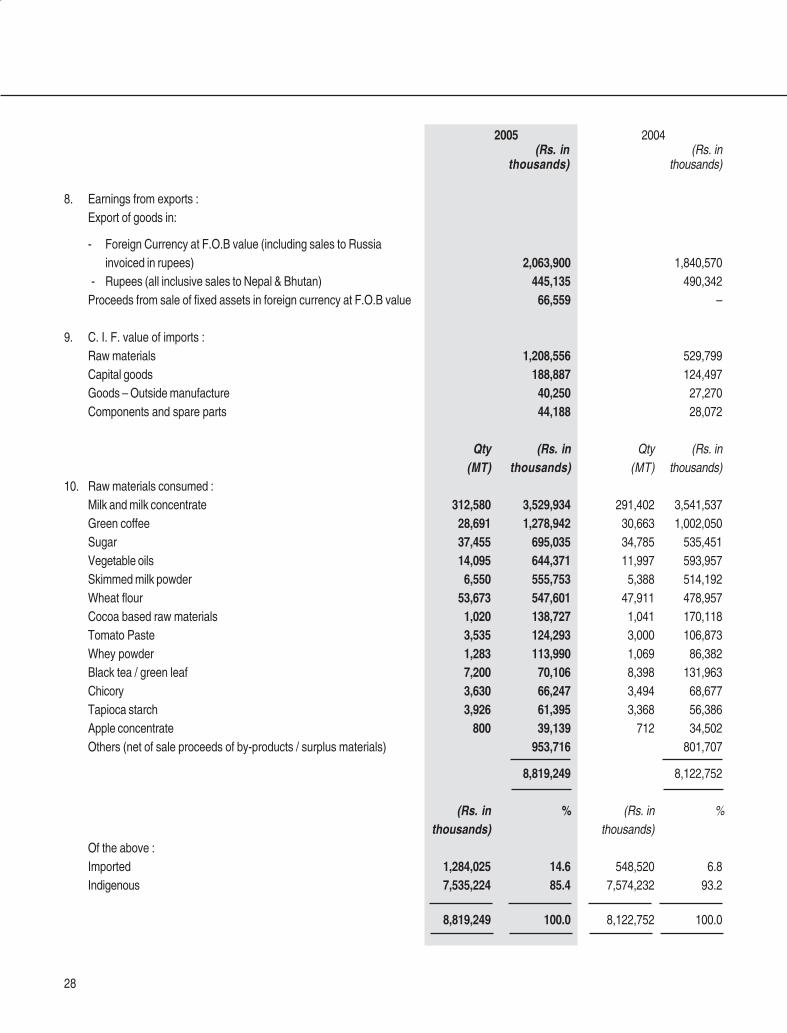
8. Earnings from exports :Export of goods in:
- Foreign Currency at F.O.B value (including sales to Russiainvoiced in rupees) 2,063,900 1,840,570
- Rupees (all inclusive sales to Nepal & Bhutan) 445,135 490,342Proceeds from sale of fixed assets in foreign currency at F.O.B value 66,559 –
9. C. I. F. value of imports :Raw materials 1,208,556 529,799Capital goods 188,887 124,497Goods – Outside manufacture 40,250 27,270Components and spare parts 44,188 28,072
Qty (Rs. in Qty (Rs. in
(MT) thousands) (MT) thousands)
10. Raw materials consumed :Milk and milk concentrate 312,580 3,529,934 291,402 3,541,537Green coffee 28,691 1,278,942 30,663 1,002,050Sugar 37,455 695,035 34,785 535,451Vegetable oils 14,095 644,371 11,997 593,957Skimmed milk powder 6,550 555,753 5,388 514,192Wheat flour 53,673 547,601 47,911 478,957Cocoa based raw materials 1,020 138,727 1,041 170,118Tomato Paste 3,535 124,293 3,000 106,873Whey powder 1,283 113,990 1,069 86,382Black tea / green leaf 7,200 70,106 8,398 131,963Chicory 3,630 66,247 3,494 68,677Tapioca starch 3,926 61,395 3,368 56,386Apple concentrate 800 39,139 712 34,502Others (net of sale proceeds of by-products / surplus materials) 953,716 801,707
8,819,249 8,122,752
(Rs. in % (Rs. in %
thousands) thousands)
Of the above :Imported 1,284,025 14.6 548,520 6.8Indigenous 7,535,224 85.4 7,574,232 93.2
8,819,249 100.0 8,122,752 100.0
29
.
2005 2004(Rs. in (Rs. in
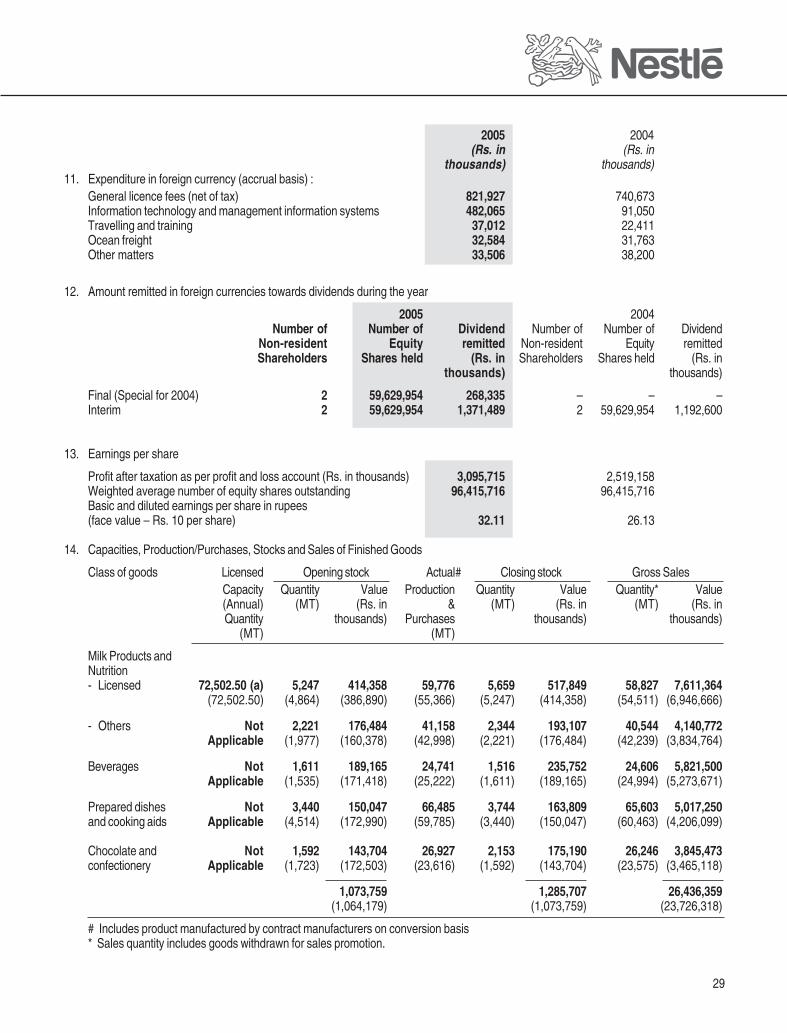
thousands) thousands)11. Expenditure in foreign currency (accrual basis) :
General licence fees (net of tax) 821,927 740,673Information technology and management information systems 482,065 91,050Travelling and training 37,012 22,411Ocean freight 32,584 31,763Other matters 33,506 38,200
12. Amount remitted in foreign currencies towards dividends during the year
2005 2004Number of Number of Dividend Number of Number of Dividend
Non-resident Equity remitted Non-resident Equity remittedShareholders Shares held (Rs. in Shareholders Shares held (Rs. in
thousands) thousands)
Final (Special for 2004) 2 59,629,954 268,335 – – –Interim 2 59,629,954 1,371,489 2 59,629,954 1,192,600
13. Earnings per share
Profit after taxation as per profit and loss account (Rs. in thousands) 3,095,715 2,519,158Weighted average number of equity shares outstanding 96,415,716 96,415,716Basic and diluted earnings per share in rupees(face value – Rs. 10 per share) 32.11 26.13
14. Capacities, Production/Purchases, Stocks and Sales of Finished Goods
Class of goods Licensed Opening stock Actual# Closing stock Gross SalesCapacity Quantity Value Production Quantity Value Quantity* Value(Annual) (MT) (Rs. in & (MT) (Rs. in (MT) (Rs. inQuantity thousands) Purchases thousands) thousands)
(MT) (MT)
Milk Products andNutrition- Licensed 72,502.50 (a) 5,247 414,358 59,776 5,659 517,849 58,827 7,611,364
(72,502.50) (4,864) (386,890) (55,366) (5,247) (414,358) (54,511) (6,946,666)
- Others Not 2,221 176,484 41,158 2,344 193,107 40,544 4,140,772Applicable (1,977) (160,378) (42,998) (2,221) (176,484) (42,239) (3,834,764)
Beverages Not 1,611 189,165 24,741 1,516 235,752 24,606 5,821,500Applicable (1,535) (171,418) (25,222) (1,611) (189,165) (24,994) (5,273,671)
Prepared dishes Not 3,440 150,047 66,485 3,744 163,809 65,603 5,017,250and cooking aids Applicable (4,514) (172,990) (59,785) (3,440) (150,047) (60,463) (4,206,099)
Chocolate and Not 1,592 143,704 26,927 2,153 175,190 26,246 3,845,473confectionery Applicable (1,723) (172,503) (23,616) (1,592) (143,704) (23,575) (3,465,118)
1,073,759 1,285,707 26,436,359(1,064,179) (1,073,759) (23,726,318)
# Includes product manufactured by contract manufacturers on conversion basis* Sales quantity includes goods withdrawn for sales promotion.

30
.
(a) Includes 50,000 MT (50,000 MT) covered by Industrial Entrepreneurs Memorandums in terms of Notification No. 477(E) dated25th July, 1991 of the Department of Industrial Development, Ministry of Industry, Government of India. Milk products comprise sweetenedcondensed milk, baby milk foods, milk powders, acidified infant food and other milk products, which are covered by one class of goods.
(b) The products are manufactured in integrated plants as certified by the Management on which the Auditors have relied. Hence, in respectof all the above class of goods, individual installed capacities cannot be given, as they are mainly dependent on product mix.
(c) Actual production and purchase include purchase of 9,761 MT (13,246 MT) in Milk Products and Nutrition – Others, 85 MT (199 MT) inBeverages, 30 MT (22 MT) in Chocolate and Confectionery. The total value of these purchases is Rs. 281,667 thousands (Rs. 322,369thousands).
(d) Previous year’s figures are indicated in brackets.
15. Quantitative information in respect of other goods
Class of goods Opening stock Purchases Closing stock Sales
Qty Value Qty Value Qty Value Qty Value(MT) (Rs. in (MT) (Rs. in (MT) (Rs. in (MT) (Rs. in
thousands) thousands) thousands) thousands)
Others – – 34 1,413 – – 34 2,513(–) (–) (–) (1,870) (–) (–) (–) (1,842)
Previous year’s figures are indicated in brackets.
16. Segment reporting
Based on the guiding principles given in Accounting Standard on ‘Segment Reporting’ [(AS-17) issued by the Institute of CharteredAccountants of India] the Company’s primary business segment is Food. The food business incorporates product groups viz. MilkProducts and Nutrition, Beverages, Prepared dishes and cooking aids, Chocolates and Confectionery, which mainly have similar risks andreturns. As the Company’s business activity falls within a single primary business segment the disclosure requirements of AS -17 in thisregard are not applicable.
17. Related party disclosures under Accounting Standard 18
Holding companies: Nestlé S.A., Maggi Enterprises Ltd. (w.e.f. September 26, 2005), Nestlé’s Holdings Ltd. (upto September 25,2005).
Fellow subsidiaries are disclosed to comply with para 3 (a) of Accounting Standard -18 on ‘Related party Disclosures’ albeitthese do not control or exercise significant influence on Nestlé India Ltd.:
Alcon India Pvt. Ltd., Eastern Food Specialities Pvt. Ltd., Nestec SA, Nestlé (South Africa) Pty Ltd., Nestlé Australia Ltd., NestléBangladesh Ltd., Nestlé China Ltd., Nestlé Deutschland AG, Nestlé Egypt SAE, Nestlé Food LLC, Nestlé Foods (Malaysia) Sdn Bhd,Nestlé France SAS, Nestlé Hungaria KFT, Nestlé Foods Kenya Ltd., Nestlé Korea Ltd., Nestlé Lanka Ltd., Nestlé Middle East FZE, NestléNederland BV, Nestlé Philippines Inc, Nestlé Polska S.A., Nestlé R & D Centre (Pte) Ltd., Nestlé Suisse S.A., Nestlé Taiwan Ltd., NestléTianjin Ltd., Nestlé Trading (Thailand) Ltd., Nestlé Foods (Thailand) Ltd., Nestlé Turkiye Gida Sanayi A.S., Nestlé UK Ltd, Nestlé USA Inc,Nestlé Vietnam Ltd., P.T Nestlé Indonesia, Societe Des Produits Nestlé S.A., Purina PetCare India Pvt. Ltd., Nestlé (Thai) Ltd., NestléCanada Inc, Nestlé Japan Administration Ltd., Nestlé Manufacturing (Malaysia) Sdn Bhd, Nestlé Pakistan Ltd., Nestrade – Nestlé WorldTrade Corporation, Nestlé Japan Holding Ltd., Nestlé Romania SRL, OJSC ‘Khladoprodukt’, Nestlé South East Africa Trading Ltd.,Nestlé Kuban LLC, OSEM U.K. Ltd., Pulmuone Waters Co. Ltd., Nestlé Waters Philippines Inc.
Whole time directors’: Martial G. Rolland, Chairman & Managing Director; Shobinder Duggal, Director – Finance & Control.
31
.
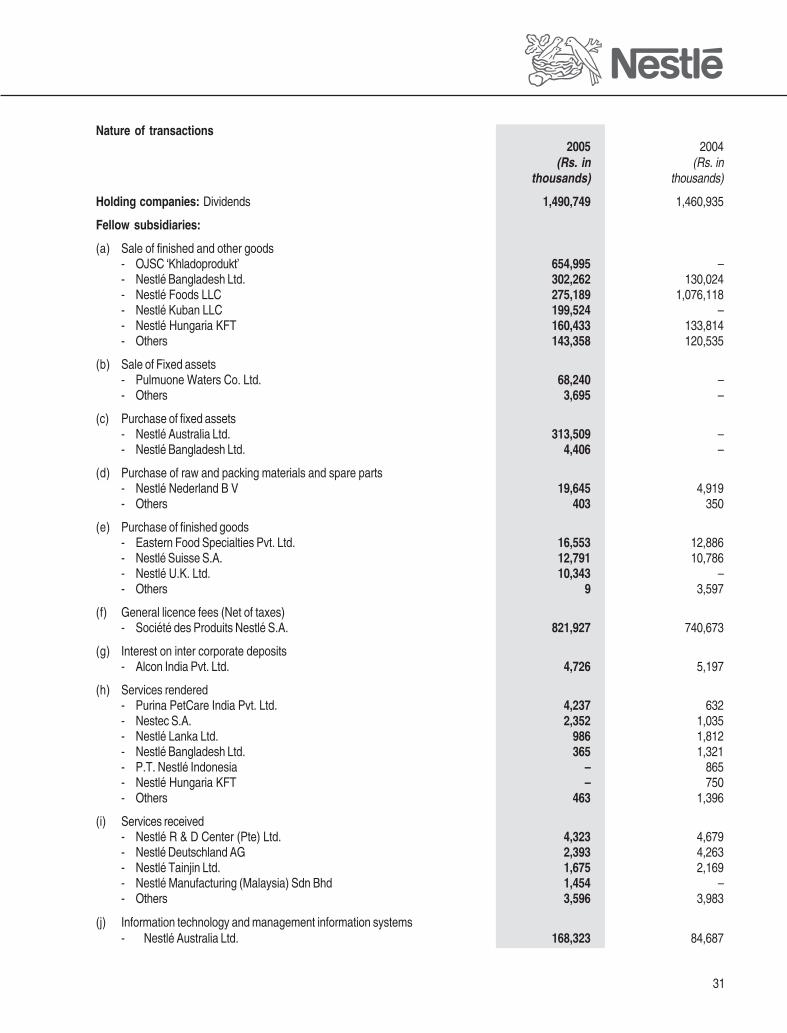
Nature of transactions2005 2004
(Rs. in (Rs. in thousands) thousands)
Holding companies: Dividends 1,490,749 1,460,935
Fellow subsidiaries:
(a) Sale of finished and other goods- OJSC ‘Khladoprodukt’ 654,995 –- Nestlé Bangladesh Ltd. 302,262 130,024- Nestlé Foods LLC 275,189 1,076,118- Nestlé Kuban LLC 199,524 –- Nestlé Hungaria KFT 160,433 133,814- Others 143,358 120,535
(b) Sale of Fixed assets- Pulmuone Waters Co. Ltd. 68,240 –- Others 3,695 –
(c) Purchase of fixed assets- Nestlé Australia Ltd. 313,509 –- Nestlé Bangladesh Ltd. 4,406 –
(d) Purchase of raw and packing materials and spare parts- Nestlé Nederland B V 19,645 4,919- Others 403 350
(e) Purchase of finished goods- Eastern Food Specialties Pvt. Ltd. 16,553 12,886- Nestlé Suisse S.A. 12,791 10,786- Nestlé U.K. Ltd. 10,343 –- Others 9 3,597
(f) General licence fees (Net of taxes)- Société des Produits Nestlé S.A. 821,927 740,673
(g) Interest on inter corporate deposits- Alcon India Pvt. Ltd. 4,726 5,197
(h) Services rendered- Purina PetCare India Pvt. Ltd. 4,237 632- Nestec S.A. 2,352 1,035- Nestlé Lanka Ltd. 986 1,812- Nestlé Bangladesh Ltd. 365 1,321- P.T. Nestlé Indonesia – 865- Nestlé Hungaria KFT – 750- Others 463 1,396
(i) Services received- Nestlé R & D Center (Pte) Ltd. 4,323 4,679- Nestlé Deutschland AG 2,393 4,263- Nestlé Tainjin Ltd. 1,675 2,169- Nestlé Manufacturing (Malaysia) Sdn Bhd 1,454 –- Others 3,596 3,983
(j) Information technology and management information systems- Nestlé Australia Ltd. 168,323 84,687

32
.
2005 2004(Rs. in (Rs. in
thousands) thousands)
(k) Inter corporate deposits refunded- Alcon India Pvt. Ltd. – 30,000
(l) Balance outstanding as at the year end- Inter corporate deposits granted 77,500 77,500- Receivables (Others) 110,648 83,828- Payables 192,038 372,872
Notes:
i. Inter corporate deposits were granted at the then prevailing bank rate or one month commercial paper benchmark plus a spreadthereon, whichever is higher.
ii. Details of remuneration to whole time directors’ are given in the note 5 of the notes to the accounts. Balance payable to whole timedirectors as on December 31, 2005 is Rs. 7,051 thousands (Previous year Rs. 5,790 thousands)
18. The names of Small Scale Industrial Undertakings to whom the Company owe a sum, which is outstanding for more than 30 days as onDecember 31, 2005 are Anand Packaging, Balaji Chemicals, Canton Laboratories, Duetech Printers, Ganpati Hosiery Mills, HeraldPublications Pvt. Ltd., Hindustan Adhesives Ltd., Jagat Machine Tools, Jain Scientific Glass Works, Jeet Engineering Works, Jewel PaperPrivate Ltd., JO Bland Enterprises, Jugraj Mechinical Works, K S Electric Works, Kamet Plastics Pvt. Ltd., Khemka Containers Ltd., KwalityOffset Printers, Laxmi Plastic Industries, Maniesh Offset Pvt. Ltd., Manipal Packaging Industries, Manushree Extrusions Ltd., NationalMotors, Perfect polymers, Perfect Pac Ltd., Polytech Industries, Precision Moulds and Dies Pvt. Ltd., Rajpura Crowns Pvt. Ltd., S Ramuand Company, S S Bedi and Sons, Safeway Security Systems, Shakunt Rubbers, Snap Natural & Alginate Products, Sukhjit Starch andChemicals Ltd., Suraksha Packers Pvt. Ltd. and Unique Plastic Industries. These amounts are not due for payment as per the terms andconditions of the purchase order / contract.
19. The Company implemented Nestlé Groups’ worldwide initiative GLOBE (Global Business Excellence) including Nestlé Groups’ version ofSAP with effect from May 1, 2005, which necessitated a change in the method of raw and packing materials valuation from weightedaverage to first-in-first out (FIFO) resulting in lower consumption value and higher profit for the year [Rs 15,099 thousands, net of tax –Rs.10,016 thousands].
20. Previous year figures have been regrouped/reclassified wherever necessary, to make them comparable.
21. SIGNIFICANT ACCOUNTING POLICIES
ACCOUNTING CONVENTION
The financial statements are prepared under the historical cost convention, in accordance with applicable mandatory accounting standardsissued by the Institute of Chartered Accountants of India and the relevant provisions of the Companies Act, 1956.
SALES
Sale of goods is recognised at the point of despatch to the customer. Sales include excise duty but exclude value added tax / sales tax. In orderto comply with the Accounting Standards Interpretation (ASI-14) issued by the Institute of Chartered Accountants of India, gross sales (includingexcise duty) and net sales (excluding excise duty) is disclosed in the profit and loss account.
INVENTORIES
Stores and spare parts are stated at cost. Stock-in-trade is valued at cost or net realisable value, whichever is lower, as certified by themanagement. The basis of determining cost for various categories of inventories are as follows:Raw and packing materials : First-in -first out (weighted average upto April 30, 2005)Stores and spare parts : Weighted averageWork-in-progress and finished goods : Material cost plus appropriate share of production overheads and excise duty, wherever
applicableRETIREMENT BENEFITS
Contributions to the provident fund and provision for pension and gratuity are charged to revenue every year. Provision for pension is made onthe basis of an actuarial valuation carried out by an independent actuary as at the year-end. Provision for gratuity is made on the basis ofactuarial valuation after taking into account the net result of gratuity trust.
33
.
DEPRECIATION / AMORTISATION
Depreciation is provided as per the straight-line method at rates provided in Schedule XIV to the Companies Act, 1956, except for the followingclasses of fixed assets, where the useful life has been estimated as under: -
Information technology equipments : 3 yearsFurniture and fixtures and Vehicles : 5 yearsLeasehold land and improvements : Lease periodManagement information systems (Intangible fixed asset) : 5 years
IMPAIRMENT OF FIXED ASSETS
Consideration is given at each balance sheet date to determine whether there is any indication of impairment of the carrying amount of theCompany’s fixed assets. If any indication exists, an asset’s recoverable amount is estimated. An impairment loss is recognised whenever thecarrying amount of an asset exceeds its recoverable amount. The recoverable amount is the greater of the net selling price and value in use.In assessing value in use, the estimated future cash flows are discounted to their present value based on an appropriate discount factor.
Reversal of impairment losses recognised in prior years is recorded when there is an indication that the impairment losses recognised for theasset no longer exist or have decreased. However, the increase in carrying amount of an asset due to reversal of an impairment loss isrecognised to the extent it does not exceed the carrying amount that would have been determined (net of depreciation) had no impairment lossbeen recognised for the asset in prior years.
TAXATION
The provision for taxation for the period comprises the residual tax liability for the assessment year 2005-2006 relevant to the periodApril 1, 2004 to March 31, 2005 and the liability, which has accrued on the profit for the period April 1, 2005 to December 31, 2005.
Deferred tax is recognised, subject to the consideration of prudence, on timing difference, being the difference between taxable income andaccounting income that originate in one period and are capable of reversal in one or more subsequent periods.
CONTINGENT LIABILITIES AND PROVISIONS
Contingent liabilities are disclosed after a careful evaluation of the facts and legal aspects of the matter involved. Provisions are recognized whenthe Company has a legal/constructive obligation and on management discretion as a result of a past event, for which it is probable that a cashoutflow may be required and a reliable estimate can be made of the amount of the obligation.
FIXED ASSETS
Fixed assets are stated at cost (net of CENVAT, wherever applicable) less accumulated depreciation. Cost is inclusive of freight, duties, leviesand any directly attributable cost of bringing the assets to their working condition for intended use.
An intangible asset is measured at cost and amortised so as to reflect the pattern in which the asset’s economic benefits are consumed.
INVESTMENTS
Investments are classified into current and long-term investments. Current investments are stated at the lower of cost and fair value. Long-terminvestments are stated at cost.
FOREIGN EXCHANGE TRANSACTIONS
Transactions in foreign currency are recorded on initial recognition at the exchange rate prevailing at the time of the transaction.
Monetary items (i.e. receivables, payables, loans etc.) denominated in foreign currency are reported using the closing exchange rate on eachbalance sheet date.
The exchange difference arising on the settlement of monetary items or on reporting these items at rates different from rates at which thesewere initially recorded / reported in previous financial statements are recognised as income / expense in the period in which they arise exceptwhere the foreign currency liabilities have been incurred in connection with fixed assets acquired up to March 31, 2004 and subsequent theretoin case of fixed assets acquired from a country outside India, where exchange difference are adjusted in the carrying amount of fixed assets.
In case of forward exchange contracts, the premium or discount arising at the inception of such contracts, is amortised as income or expenseover the life of contract as well as exchange difference on such contracts i.e. difference between the exchange rate at the reporting / settlementdate and the exchange rate on the date of inception / the last reporting date, is recognised as income / expense for the period except where theforeign currency liabilities have been incurred in connection with fixed assets acquired up to March 31, 2004 and subsequent thereto in case offixed assets acquired from a country outside India, where the exchange differences are adjusted in the carrying amount of the fixed assets.

34
.
ANNEXURE - 1 TO THE DIRECTORS’ REPORT
Report on Corporate Governance for the year ended December 31, 2005
NESTLÉ’S PHILOSOPHY ON CODE OF GOVERNANCE
Nestlé India Limited, as a part of Nestlé Group, Switzerland has over the years followed best practice of Corporate Governance by adhering topractices laid down by Nestlé Group. The two most significant documents from Nestlé Group, which define the standard of behaviour of NestléIndia, are ‘Nestlé Corporate Business Principles’ and ‘The Nestlé Management and Leadership Principles’.
Nestlé India’s business objective and that of its management and employees is to manufacture and market the Company’s products in such away as to create value that can be sustained over the long term for consumers, shareholders, employees, business partners and the nationaleconomy. Nestlé India is conscious of the fact that the success of a corporation is a reflection of the professionalism, conduct and ethical valuesof its management and employees. In addition to compliance with regulatory requirements, Nestlé India endeavours to ensure that higheststandards of ethical and responsible conduct are met throughout the organisation.
BOARD OF DIRECTORS
Composition, Attendance at the Board Meetings and the last Annual General Meeting, Outside Directorships and other BoardCommittees
Above information as on 31st December, 2005 or for the year 2005, as applicable, is tabulated hereunder:
A Alternate Director to Mr. M. W. O. Garrett.B Directorship in companies registered under the Companies Act, 1956, excluding directorships in private companies, alternate directorship and companies under
Section 25 of the Companies Act, 1956.C Only covers membership / chairmanship of Audit Committee, Remuneration Committee and Shareholder / Investor Grievance Committee.
As at 31st December, 2005, in compliance with the corporate governance norms, the Company’s Board of Directors headed by its executiveChairman, Mr. Martial G. Rolland, comprised of five other directors, out of which three are independent directors. None of the Directors was amember of more than ten Board-level committees, nor a Chairman of more than five such committees, across all companies in which he wasa Director.
Board Meetings held during the year 2005
During the year 2005, five Board Meetings were held on 14th March, 2005, 29th April, 2005, 29th July, 2005, 28th October, 2005 and6th December, 2005. The maximum gap between any two meetings was less than four months.
Director No. of Board Attendance No. of No. of Executive/Meetings at previous outside Membership/ Non-Executive/attended AGM on Directorship Chairmanship in Independent
29.04.2005 held B other BoardCommittees C
Mr. Martial G. Rolland 5 Present Nil Nil Executive
Mr. Shobinder Duggal 5 Present Nil Nil Executive
Mr. Ravinder Narain 5 Present 2 Nil Non-Executive & Independent
Mr. Tejendra Khanna 5 Present 3 4 Non-Executive & Independent
Mr. M. W. O. Garrett 1 Present Nil Nil Non-Executive
Mr. Rajendra S. Pawar 4 Present 11 1 Non-Executive & Independent
Mr. Richard Sykes A Nil Not Present Nil Nil Non-Executive

35
.
BOARD COMMITTEES
Audit CommitteeThe role and terms of reference of the Audit Committee covers the areas mentioned under Clause 49 of the Listing Agreement and Section292A of the Companies Act, 1956 besides other terms as may be referred by the Board of Directors. These include oversight of Company’sfinancial reporting process and disclosure of financial information to ensure that the financial statement is correct, sufficient and credible;reviewing annual and quarterly financial statements with management before submission to the Board; reviewing the adequacy of internalcontrol systems with management, external and internal auditors and reviewing the Company’s financial risk and management policies.The Audit Committee comprises of Mr. Tejendra Khanna (Chairman), Mr. Ravinder Narain and Mr. Rajendra S. Pawar, all beingNon-Executive and Independent Directors. All members of the Audit Committee are financially literate and both Mr. Tejendra Khanna andMr. Rajendra S. Pawar, have related financial management expertise by virtue of their comparable experience and background. Mr. B. Murli,Company Secretary, acts as the Secretary to the Committee.The Audit Committee met five times during the year 2005 on 14th March, 2005, 29th April, 2005, 29th July, 2005,16th September, 2005 and28th October, 2005. All members of the Committee attended the aforesaid meetings except for the Audit Committee Meeting held on16th September, 2005, in which Mr. Rajendra S. Pawar was granted leave of absence.Shareholders CommitteeMr. Ravinder Narain, a Non-Executive and Independent Director, is the Chairman of the Shareholder/ Investor Grievance Committee. Theother member is the Managing Director, Mr. Martial G. Rolland. Mr. B. Murli, Company Secretary is the Compliance Officer. The Committeemet four times during the year on 1st March, 2005, 11th April 2005, 25th July, 2005 and 26th September, 2005. All members of the Committeeattended the aforesaid meetings.The Committee oversees redressal of shareholder and investor grievances, transfers of shares, non-receipt of balance sheet, non-receipt ofdeclared dividends and related matters.During the year 2005, 29 complaints were received from shareholders and investors. All the complaints have generally been solved to thesatisfaction of the complainants and no investor complaint was pending at the beginning or at the end of the year. The Company has acted uponall valid requests for share transfer received during 2005 and no such transfer is pending.Remuneration CommitteeMatters of remuneration of Executive Directors are considered by the Board of Directors of the Company, with the interested ExecutiveDirector(s), not participating or voting. The terms of remuneration of Executive Directors are approved by the shareholders at the AnnualGeneral Meeting. Therefore, no separate Remuneration Committee has been constituted.The remuneration of Non-Executive Directors is decided by the Board of Directors as per the terms approved by the shareholders at the AnnualGeneral Meeting.The remuneration policy of the Company is to remain competitive in the industry to attract and retain talent and appropriately reward employeeson their contributions.REMUNERATION OF DIRECTORS FOR 2005
(Rupees in thousands)
Name of the Director Sitting Fee Salaries Perquisites Commission TotalMr. Martial G. Rolland1 N.A. 11,700 4,180 19,890 35,770Mr. Shobinder Duggal1 N.A. 2,964 993 2,441 6,398Mr. Tejendra Khanna 75 N.A. N.A. 300 @ 375Mr. Ravinder Narain 95 N.A. N.A. 300 @ 395Mr. Rajendra S. Pawar 60 N.A. N.A. 300 @ 360Mr. M.W.O.Garrett – N.A. N.A. 300 @ 3001 The Company has service contract with all Executive Directors for a period of 5 years. The notice period is of three months and the severance fee is the sum
equivalent to remuneration for the notice period or part thereof in case of a shorter notice.
@ The Commission for the year ended 31st December, 2005 will be paid, subject to deduction of tax after adoption of the accounts by the shareholders at the
Annual General Meeting to be held on 25th April, 2006.
Sitting fee also includes payment for Board-level committee meetings.
Remuneration of Mr. Shobinder Duggal excludes provisions for incremental liability for pension, since certification of actuary is for the Companyas a whole. There is no incremental liability for gratuity, since Mr. Duggal had earned gratuity, before being appointed as a Director. Perquisitesof Mr. Duggal include contribution of Rs. 3,55,650/- to provident fund. These are not applicable to the other Executive Director.

36
.
Commission is subject to adequate profits being earned. Performance criteria for the Executive Directors takes into account the business plansand market conditions. The criteria for payment of Commission to Non-Executive Directors takes into account their contribution and currenttrends.
None of the Non-Executive Directors holds any equity shares or convertible instruments in the Company. The Company does not have any stockoption scheme.
GENERAL BODY MEETINGS
Location and time of last three Annual General Meetings (AGMs) are as under:
Year Venue Date Time Special Resolutions passed by the shareholders in the AGMs
2005 Air Force Auditorium, 29thApril, 2005 10.00 A.M. 1. Authorising the payment of commission and sitting fee to the Non-ExecutiveSubroto Park, Directors of the Company.New Delhi - 110 010 2. Authorising the delisting of the equity shares of the Company from the Delhi
Stock Exchange Association Limited, New Delhi.
2004 - do - 30thApril, 2004 10.00 A.M. None
2003 - do - 30thApril, 2003 10.00 A.M. None
There was no other General Body Meeting in the last three years and no resolution was put through postal ballot. There is no special resolutionproposed to be passed through postal ballot.
DISCLOSURESDuring the year 2005, the Company had no materially significant related party transaction, which is considered to have potential conflict with theinterests of the Company at large. Transactions with related parties are disclosed in Note No.17 of Schedule O to the Annual Accounts.The Company has complied with the requirements of regulatory authorities on capital markets and no penalties or strictures has been imposedon the Company by the Stock Exchange, SEBI or any other statutory authority, on any matter relating to the capital markets, during the last threeyears.
MEANS OF COMMUNICATIONThe Quarterly, Half Yearly and Annual Results are generally published by the Company in all editions of the Financial Express and in Jansatta,Delhi.As per the requirement of Clause 51 of the Listing Agreement, all the data related to financial results, shareholding pattern etc. are posted onthe SEBI’s EDIFAR System and the same can be viewed on the SEBI’s website www.sebiedifar.nic.in.The domain name of the Company’s website is www.nestle.in and up-to-date financial results, official press releases, presentations to analystsand institutional investors and other general information about the Company, is available on this website.The presentations made to the institutional investors or analysts, if any, are not communicated to the individual shareholders of the Company,however, the presentations, if any, are sent to the Stock Exchange for dissemination.
MANAGEMENT DISCUSSION AND ANALYSIS REPORT(within the limits set by the Company’s competitive position)
Industry structure and developments, opportunities and threats, segment-wise or product-wise performance, outlook, risks and concerns of theCompany and discussion on financial performance with respect to the operational performance, has been covered in the Directors’ Report –more specifically under the sections on Financial Results and Operations, Exports, Business Development and SWOT Analysis of the Company.The Company has an adequate system of internal controls to ensure that transactions are properly recorded, authorised and reported apartfrom safeguarding its assets. The internal control system is supplemented by well-documented policies, guidelines and procedures and reviewcarried out by the Company’s internal audit function, which submits reports periodically to the Management and the Audit Committee of theBoard.There has been no material development in Human Resources / Industrial relations during the period covered by this Annual Report.Your Company has a favourable work environment that motivates performance, customer focus and innovation while adhering to the highestdegree of quality and integrity. As part of manpower development and training and with an aim to enhance operational efficiency, employeesof the Company have been sent on postings and assignments to the other Nestlé Group Companies.
Manpower figure of the Company as on 31st December, 2005 was 3,205.

37
.
GENERAL SHAREHOLDER INFORMATION
Annual General MeetingDate and Time : 25th April, 2006 at 10.00 a.m.Venue : Air Force Auditorium, Subroto Park, New Delhi – 110 010.Financial Calendar, 2006 :First Quarter Results : Last week April, 2006 Third Quarter Results : Last week October, 2006Second Quarter and Half Yearly Results : Last week July, 2006 Annual Results : March, 2007Financial Year : 1st January to 31st DecemberDate of Book Closure : 21st April, 2006 to 25th April, 2006, both days inclusive.
Dividend payment date: Two interim dividends for the year 2005, first at the rate of Rs.5/- and the second at the rate ofRs. 18/- per equity share, were paid on 10th May, 2005 and 22nd December, 2005, respectively. A final dividend of Rs. 2/- per equity share hasbeen recommended by the Board of Directors and subject to the approval of the shareholders at the ensuing Annual General Meeting, isproposed to be paid on and from 9th May, 2006.
Outstanding ADRs / GDRs / Warrants or any convertible instruments, conversion date and likely impact on equity : Not applicable.
Listing on Stock Exchanges and Stock Code
Shares of the Company are listed at the Bombay Stock Exchange Limited, Mumbai. The Company’s Stock Code is 500790.Pursuant to the shareholders’ approval at the 46th Annual General Meeting of the Company held on 29th April, 2005 under the Securities andExchange Board of India (Delisting of Securities) Guidelines, 2003, the equity shares of the Company were voluntarily delisted from the DelhiStock Exchange Association Limited, New Delhi (Stock Code 0035) with effect from 15th July, 2005.The ISIN Number of Nestlé India Limited on both the NSDL and CDSL is INE239A01016.
Market Price Data: High / Low in each month of Calendar Year, 2005 on the Bombay Stock Exchange Limited, Mumbai (BSE)
Month High (Rs.) Low (Rs.) Month High (Rs.) Low (Rs.)January 590.00 525.25 July 781.00 699.50 February 640.00 570.00 August 920.00 769.90 March 686.00 585.00 September 900.00 835.00 April 670.00 600.00 October 910.00 800.00 May 739.00 652.15 November 970.00 820.00 June 726.00 696.00 December 1,008.00 902.10 [Source: www.bseindia.com]
Performance in comparison to BSE SENSEX
[Source: www.bseindia.com]

38
.
Registrar and Transfer Agents: M/s. MCS Limited, W-40, Okhla Industrial Area, Phase II, New Delhi – 110 020.Share Transfer SystemShare transfers are registered and returned in the normal course within an average period of 21 days from the date of receipt, if the documentsare clear in all respects. Requests for dematerialisation of shares are processed and confirmation is given to the respective depositories i.e.National Securities Depository Limited (NSDL) and Central Depository Services India Limited (CDSL) within 15 days.
Categories of Shareholding as on 31st December, 2005
Category Number of Shares Percent of total sharesPromoters and Associates 59,629,954 61.85Foreign Institutional Investors 7,428,281 7.70Public Financial Institutions (including Banks) 5,865,064 6.08Mutual Funds and UTI 4,385,321 4.55Private Corporate Bodies (including Clearing Members) 1,776,435 1.84NRI’s and OCB’s 65,992 0.07Indian Public 17,264,669 17.91Total 96,415,716 100.00
Distribution of shareholding as on 31st December, 2005
No. of shares Number of shareholders Number of Shares Percent of total shares1 to 500 39,164 4,180,812 4.34501 to 1,000 3,199 2,322,438 2.411,001 to 2,000 1,213 1,721,910 1.792,001 to 3,000 350 875,467 0.913,001 to 4,000 176 612,637 0.644,001 to 5,000 112 504,253 0.525,001 to 10,000 241 1,663,317 1.7310,001 and above 252 84,534,882 87.66Total 44,707 96,415,716 100.00
Dematerialisation of shares: 43.56 % equity shares of the Company have been dematerialised as on 31st December, 2005.Plant Locations: The Company’s plants are located at Moga, Samalkha, Nanjangud, Choladi, Ponda and Bicholim. A new plant is also comingup at Pantnagar, Uttaranchal.Address for correspondence: Shareholder Services, M – 5 A, Connaught Circus, New Delhi – 110 001.E-mail for Investors: [email protected]
On behalf of the Board of Directors
Date : 6th March, 2006 MARTIAL G. ROLLANDPlace : Gurgaon CHAIRMAN
CERTIFICATETO THE MEMBERS OF NESTLÉ INDIA LIMITED
We have examined the compliance of conditions of Corporate Governance by Nestlé India Limited for the year ended December 31, 2005, asstipulated in Clause 49 of the Listing Agreement of the said Company with stock exchanges.The compliance of conditions of Corporate Governance is the responsibility of the management. Our examination was limited to procedures andimplementation thereof, adopted by the Company for ensuring the compliance of the conditions of Corporate Governance. It is neither an auditnor an expression of opinion on the financial statements of the Company.In our opinion and to the best of our information and according to the explanations given to us, we certify that the Company has complied withthe conditions of Corporate Governance as stipulated in the above-mentioned Listing Agreement.We state that in respect of investor grievances received during the year ended December 31, 2005, no investor grievances are pending for aperiod exceeding one month against the Company as per the records maintained by the Company.We further state that such compliance is neither an assurance as to the future viability of the Company nor the efficiency or effectiveness withwhich the management has conducted the affairs of the Company.
For A. F. FERGUSON & CO.,Chartered Accountants
6th March, 2006 (MANJULA BANERJI)New Delhi Partner
Membership No. 86423

39
.
ANNEXURE - 2 TO THE DIRECTORS’ REPORTInformation as required under Section 217(1)(e)of the Companies Act, 1956 read with theCompanies (Disclosure of Particulars in theReport of Board of Directors) Rules, 1988 formingpart of Directors’ Report for the year ended31st December, 2005.
A . CONSERVATION OF ENERGY
(a) Energy Conservation Measures Taken
During the year, the Company continued itsendeavour at optimising the consumption ofvarious sources of energy not only to optimisecosts but also to conserve scarce energy sourcesavailable in the country. For optimising theconsumption of energy, all the areas of operationswere focused, including those for energygeneration and effective usage of sources /equipment used for generation. The significantmeasures taken during 2005, which havecontributed to energy conservation were:
� Replacement of the electric heating by steamheating, wherever possible.
� Maximising the steam generation ex-waste heatrecovery boiler.
� Reduction of energy usage per unit by betterutilisation of purchased power, better D.G. yieldand optimum steam consumption.
� Awareness, monitoring and controls for furtherreduction in water usage.
� Reduction in power consumption of WasteWater Treatment Plant by installation of variablefrequency drives.
� Reduction in power consumption of coolingtowers by provision of temperature cut-offswitches in cooling tower fans.
� Installation of variable frequency drives on highcapacity air fans.
� Increase in D.G. yield by improved monitoringthrough installation of energy meters andinstallation of low temperature after coolers.
� Reduction in energy consumption by increasein boiler yield through steam condensaterecovery and boiler blow down reduction.
� Heat recovery from heat of compression ininert gas plant.
� Replacement of old air compressors withefficient air compressors.
� Use of energy efficient lighting in manufacturingareas.
(b) Additional Investment
Following proposals are at various stages ofimplementation:
� Installation of Reverse Osmosis Plant to reduceboiler blow down.
� Installation of Centrifuge Filters for HeavyPetroleum Stock and Furnace Oil for betterfuel consumption.
� Installation of EGRON-4 (Spray Driers) forpre-heating of primary air with steam, therebyreducing the usage of Heavy Petroleum Stockfor hot air generation.
� Installation of Wiped Film Evaporator for energysaving.
� Installation of Desuper Heating System inChilled Water Plant for heat recovery.
(c) Impact of the measures at (a) and (b) abovefor reduction of energy consumption andconsequent impact on the cost of productionof goods.
The measures taken during 2005, includingmeasures initiated in the past in the above directionhave facilitated efforts for conservation of energyand helped contain the energy costs.
(d) Energy Consumption
Total energy consumption and energy consumptionper unit of production, as per prescribed Form Atogether with the comparative figures for 2004,are given at the end of this part. The Companymanufactures varieties of products each of themusing a combination of various sources of energyin different proportions. Therefore, the comparisonas mentioned in Form A, does not truly reflect theefforts of the Company at reducing consumptionin terms of units of consumption.
B . TECHNOLOGY ABSORPTION
Efforts made in technology absorption as per FormB are furnished below.
Research & Development (R & D)
1. Specific areas in which R&D carried out by theCompany.
Your Company as a part of the Nestlé Group andunder the General Licence Agreement has accessto and advantage of drawing from the extensivecentral Research and Development efforts andactivities of the Nestlé Group. Nestlé Group spendsenormous amounts and efforts in Research andDevelopment and in gaining industrial experiences.It has therefore been possible for your Companyto focus its efforts on testing and modification ofproducts for local conditions. Improving andmaintaining the quality of certain key raw materialsalso continued to receive close attention.
2. Benefits derived as a result of the above R&D
The ability to leverage the Research andDevelopment (R&D) expertise and knowledge ofthe Nestlé Group, has helped your Company toinnovate and renovate, manufacture high qualityand safe products, improve yields, inputsubstitution and achieve more efficient operations.Consequently the consumers perceive theproducts of your Company as a high value fortheir money.
3. Future plan of action
Steps are continuously being taken for innovationand renovation of products including new productdevelopment, improvement of packaging andenhancement of product quality / profile, to offerbetter products at relatively affordable prices tothe consumers.
4. Expenditure on R&D
Your Company benefits from the extensivecentralised Research & Development (R&D)activity and expenditure of the Nestlé Group,at an annual outlay of around 1.5 Billion SwissFrancs. As such Company does not spend onResearch and Development. Expenditure of the
Company broadly in the nature of Research andDevelopment (R&D) are those incurred, primarilyrelating to testing of products and are as under:
(Rs. in thousands)
a) Capital 18,235
b) Recurring 52,738
c) Total 70,973
d) Total R&D as a percentageof total turnover. 0.3%
Technology absorption, adaptation andinnovation
1. Efforts, in brief, made towards technologyabsorption, adaptation and innovation
As a result of the Company’s ongoing access tothe international technology from the Nestlé Group,Switzerland, the Company absorbs and adaptsthe technologies on a continuous basis to meetits specific needs from time to time.
2. Benefits derived as a result of the above efforts
Product innovation and renovation, improvementin yield, product quality, input substitution, costeffectiveness and energy conservation are themajor benefits.
3. Imported Technology
All the food products manufactured and / or soldby the Company are by virtue of the importedtechnology received on an ongoing basis from theCollaborators. Technology transfer has to be anongoing process and not a one-time exercise, forthe Company to remain competitive and offerhigh quality and value for money products to theconsumers. This has been secured by theCompany under the General Licence Agreementwith the Collaborators and provides access forlicence to use the technology and improvementsthereof, for the product categories, manufactured/sold by the Company, on a continuous basis.
C . FOREIGN EXCHANGE EARNINGS ANDOUTGO
(a) Activities relating to exports; initiativestaken to improve the exports; development ofnew export market for products and exportplans:
Members are requested to refer to the Directors’Report under the paragraph of ‘Exports’, for thisinformation.
(b) Total foreign exchange used and earned:
During the year under review, your Company hadearnings from exports of Rs. 2,576 Millioncomprising foreign exchange earnings of Rs. 2,131Million (including sales to Russia invoiced inRupees) and export to neighbouring countries inRupees amounting to Rs. 445 Million and foreignexchange outgo of Rs. 4,529 Million. Details ofearnings from exports and foreign exchange outgoon account of imports, expenditure on travelling,general licence fees, etc. and remittances madeto non-resident shareholders on account ofdividend are shown in Notes 8, 9, 11 and 12respectively of Notes to the Accounts. Membersare requested to refer to these Notes.

40
.
FORM A
CONSERVATION OF ENERGY (CONSOLIDATED)
2005 2004
(A) Power and Fuel Consumption
1. Electricity
(a) Purchased
Units (000’ KWH) 52,061 51,011
Total Cost (Rs. in thousands) 212,717 202,572
Cost/KWH 4.09 3.97
(b) Own Generation
Through Diesel Generator
Units (000' KWH) 36,345 34,288
Units per litre of oil (KWH) 3.66 3.65
Cost/KWH (Rs.) 7.39 5.97
2. Coal (Various grades)
Quantity (Tonne) 31,699 30,216
Total Cost (Rs. in thousands) 136,526 112,812
Cost/Tonne (Rs.) 4,307 3,733
3. Furnace Oil
Quantity (KL) 17,824 18,872
Total Cost (Rs. in thousands) 281,056 241,534
Cost/KL (Rs.) 15,768 12,799
4. Other Consumption of Fuel
(a) High Speed Diesel Oil (HSD) and Superior Kerosene Oil (SKO)
Quantity (KL) 1,685 1,716
Total Cost (Rs. in thousands) 40,109 35,771
Cost/KL (Rs.) 23,809 20,841
(b) Heavy Petroleum Stock (HPS)
Quantity (KL) 2,093 –
Total Cost (Rs. in thousands) 35,106 –
Cost/KL (Rs.) 16,773 –
(c) Non-Conventional Fuels- Coconut Shell & Coffee Husk
Quantity (Tonne) 19,131 11,469
Total Cost (Rs. in thousands) 64,763 34,773
Cost/Tonne (Rs.) 3,385 3,032
(d) Liquid Petroleum Gas (LPG)
Quantity (Tonne) 691 574
Total Cost (Rs. in thousands) 22,222 15,757
Cost/Tonne (Rs.) 32,137 27,444
(B) Consumption per unit of Production
Beverages Milk Products and Nutrition Chocolates and Confectionery Prepared Dishes and Cooking Aids
Current Year Previous Year Current Year Previous Year Current Year Previous Year Current Year Previous Year
2005 2004 2005 2004 2005 2004 2005 2004
Electricity (KWH/T) 1,206.44 1,330.07 431.30 392.88 793.65 774.65 122.88 178.99
Furnace Oil (Ltrs./T) 184.56 220.93 98.91 111.18 60.09 62.20 54.20 59.63
Coal (Kgs./T) 162.29 188.46 312.13 307.90 – – 162.30 183.82
Others:
HSD, HPS (Ltrs./T) 68.39 91.77 26.39 0.26 – – 2.10 –
LPG (Kgs./T) – – 1.21 1.15 45.87 39.64 – –
Note : There are no specific standards available for each category since the product range under each head shown above consists of various products with
different consumption.

NESTLÉ INDIA LIMITED
Balance Sheet Abstract and Company’s General Business Profile
I. Registration Details
Registration No. 0 0 3 7 8 6 State Code 5 5
Balance Sheet Date 3 1 1 2 2 0 0 5
II. Capital Raised during the Year (Amount in Rs. Thousands)
Public Issue Rights Issue
N I L N I L
Bonus Issue Private Placement
N I L N I L
III. Position of Mobilisation and Deployment of Funds (Amount in Rs. Thousands)
Total Liabilities Total Assets
3 6 8 4 3 7 8 3 6 8 4 3 7 8
Sources of Funds Paid-Up Capital Reserves & Surplus
9 6 4 1 5 7 2 5 7 7 1 7 6
Secured Loans Unsecured Loans
1 4 3 0 4 5 N I L
Application of Funds Net Fixed Assets Investments
4 9 6 5 9 5 3 1 0 4 4 2 7 6
Net Current Assets Miscellaneous Expenditure
2 2 2 6 3 3 0 N I L
Accumulated Losses
N I L
IV. Performance of the Company (Amount in Rs. Thousands)
Turnover (Gross Revenue) Total Expenditure
2 5 0 0 6 4 4 3 2 0 1 1 9 0 1 9
Profit/Loss Before Tax Profit/Loss After Tax
4 6 9 0 5 7 4 3 0 9 5 7 1 5
Earnings per share in Rs. Dividend Rate %
3 2 . 1 1 2 5 0
V. Generic Name of Three Principal Products / Services of the Company (as per monetary terms)
Item Code No. (ITC Code) 1 9 . 0 1 . 0 0 0 0
Product Description P R E P A R A T I O N O F
M I L K C R E A M A N D C E R E A L S
Item Code No. (ITC Code) 2 1 . 0 1 . 0 0 0 0
Product Description S O L U B L E C O F F E E S
C O F F E E B L E N D S A N D T E A
Item Code No. (ITC Code) 2 1 . 0 1 . 0 0 0 0
Product Description N O O D L E S
+ -
+
+ -
+
+ -
-
