2005 status of rural texas - small town texas
DESCRIPTION
A demographic report on conditions and trends in rural Texas.TRANSCRIPT

SMALL TOWN TEXAS
The Status of Rural Texas report series The Office of Rural Community Affairs


OFFICE OF RURAL COMMUNITY AFFAIRS
Rick Perry
Governor Executive Committee
William M. Jeter, III, Chair
Charles S. (Charlie) Stone Executive Director
David Alders Nicki Harle Carol Harrell Wallace Klussmann
Lydia Rangel Saenz Ike Sugg
Patrick Wallace Michael Waters
January 1, 2006 The Honorable Rick Perry Governor, State of Texas
The Honorable Tom Craddick Speaker of the House of Representatives, State of Texas
The Honorable David Dewhurst Lieutenant Governor, State of Texas
The Honorable Members 79th Legislature
House Bill 7 (77th Legislature) created the Office of Rural Community Affairs (ORCA) and set forth the following requirement:
“The office shall…compile an annual report describing and
evaluating the condition of rural communities.”
It is with honor that the following report is submitted to you in fulfillment of that requirement. Small Town Texas provides a snapshot of where rural Texas’ small towns stand today and speaks to the broad spectrum of issues that affect rural communities across our state.
Each rural community contributes significantly to the people of the great state of Texas and to Texas’ economy. In addition to offering a vast array of tourism and recreational opportunities, rural Texas is the primary source of agricultural products, livestock, and mineral wealth that enhance the vitality of the Texas economy.
Rural communities are partners in the past, present, and future successes of Texas. Indeed, the viability of rural Texas is critical to the viability of Texas as a state. And because rural, suburban, and urban areas of Texas are inextricably linked, successes in rural Texas are successes for all Texans.
It is our hope that this fourth report on the status of rural Texas will contribute to the ongoing dialogue that is shaping Texas’ future. Small Town Texas examines some of the complex and diverse issues affecting rural Texas and small towns in general. We will continue to monitor developments with all interested parties to maintain an objective focus on the status of life in rural communities.
ORCA is proud to be the state agency, selected by the Texas Legislature, to enhance the economic viability of rural communities and counties through our community development and healthcare programs and services.
Thank you on behalf of the Executive Committee and the staff of the agency for the opportunity to contribute to the future of our rural communities.
Respectfully submitted,
Charles S. (Charlie) Stone Executive Director

SMALL TOWN TEXAS

Table of contents Definition of a small town................................................................................................................. 5 Introduction ...................................................................................................................................... 6
Why Texas is a small town state................................................................................................. 6 The status of small town Texas................................................................................................... 6 The significance of small towns .................................................................................................. 6
Methods of incorporation for Texas communities............................................................................ 7 Type A General Law Municipalities............................................................................................. 7 Type B General Law Municipalities............................................................................................. 8 Type C General Law Municipalities............................................................................................. 8 Home-Rule Charters ................................................................................................................... 8
Small town Texas facts.................................................................................................................... 9 Texas history at a glance............................................................................................................... 11 Measuring the vitality of small communities in Texas ................................................................... 15
Most Texas communities are small........................................................................................... 15 Most small towns are located east of I-35................................................................................. 15 Small towns are a big part of rural Texas.................................................................................. 16 Outside urban areas, the smallest towns more likely to lose population .................................. 16 Small towns experience limited in-migration............................................................................ 17 Aging populations and economic viability ................................................................................. 17 Higher education levels are lower in small towns ..................................................................... 18 Poverty finds a home in small town rural Texas ....................................................................... 18 Key small town employment sectors......................................................................................... 19 Few live and work in their small town....................................................................................... 19 Property values in small town Texas........................................................................................ 20 Fewer managers and financial officers in small towns.............................................................. 21
Small towns and Texas interstates................................................................................................ 23 I-35 ............................................................................................................................................ 24
East of I-35............................................................................................................................ 24 West of I-35........................................................................................................................... 24 On I-35 .................................................................................................................................. 24
I-45 ............................................................................................................................................ 24 Between I-35 and I-45........................................................................................................... 25 East of I-45............................................................................................................................ 25 West of I-45........................................................................................................................... 25 On I-45 .................................................................................................................................. 25
I-10 ............................................................................................................................................ 25 North of I-10 .......................................................................................................................... 25 South of I-10 ......................................................................................................................... 25 On I-10 .................................................................................................................................. 26
I-20 ............................................................................................................................................ 26 Between I-10 and I-20........................................................................................................... 26 On I-20 .................................................................................................................................. 26 North of I-20, South of I-40 ................................................................................................... 26
I-40 ............................................................................................................................................ 27 North of I-40 .......................................................................................................................... 27 On I-40 .................................................................................................................................. 27
A front porch conversation............................................................................................................. 28 Background ............................................................................................................................... 29 Front porch conversation .......................................................................................................... 29 Policy goals and statements from participants.......................................................................... 30
Texas’ Small Town Data Tables.................................................................................................... 32

This report prepared by Kim White and Eric Beverly, Research, Policy, and Governmental Relations Specialists with the Office of Rural Community Affairs. Maps prepared by Dave Darnell, Rural Health Specialist, and Richard Rapier, Special Projects Coordinator, with the Office of Rural Community Affairs. Special thanks to the Texas State Data Center, the Texas State Library and Archives Commission, the Texas Commission on Environmental Quality, the Comptroller of Public Accounts, the Texas Municipal League, and the Texas Association of Counties. Cover Photo: Main street. West, Texas. Source: Library of Congress, Prints & Photographs Division, FSA-OWI Collection, Reproduction number, LC-USF34-034737-D DLC (b&w film neg.).

This page intentionally left blank

Texas’ small towns Population under 10,000 2000 Census
Abbott 300 Abernathy 2839 Ackerly 245 Adrian 159 Agua Dulce 737 Alamo Heights 7319 Alba 430 Albany 1921 Aledo 1726 Alma 302 Alpine 5786 Alto 1190 Alton 4384 Alvarado 3288 Alvord 1007 Ames 1079 Amherst 791 Anahuac 2210 Anderson 257 Andrews 9652 Angus 334 Anna 1225 Annetta North 467 Annetta South 555 Annetta 1108 Annona 282 Anson 2556 Anthony 3850 Anton 1200 Appleby 444 Aquilla 136 Aransas Pass 8138 Archer City 1848 Arcola 1048 Argyle 2365 Arp 901 Asherton 1342 Aspermont 1021 Atlanta 5745 Aubrey 1500 Aurora 853 Austwell 192 Avery 462 Avinger 464 Azle 9600 Bailey 213 Bailey's Prairie 694 Baird 1623 Balcones Heights 3016 Ballinger 4243 Balmorhea 527 Bandera 957 Bangs 1620 Bardwell 583 Barry 209 Barstow 406 Bartlett 1675 Bartonville 1093 Bastrop 5340 Bayou Vista 1644 Bayside 360 Bayview 323 Beach City 1645 Bear Creek 360 Beasley 590 Beckville 752 Bee Cave 656 Bellevue 386 Bellmead 9214 Bells 1190 Bellville 3794 Benavides 1686 Benjamin 264 Berryville 891 Bertram 1122 Beverly Hills 2113 Bevil Oaks 1346 Big Lake 2885 Big Sandy 1288 Big Wells 704 Bishop 3305 Bishop Hills 210 Blackwell 360 Blanco 1505 Blanket 402 Bloomburg 375 Blooming Grove 833 Blossom 1439 Blue Mound 2388 Blue Ridge 672 Blum 399 Boerne 6178 Bogata 1396 Bonham 9990 Bonney 384 Booker 1315 Bovina 1874 Bowie 5219 Boyd 1099 Brackettville 1876 Brady 5523
Brazoria 2787 Breckenridge 5868 Bremond 876 Briarcliff 895 Briaroaks 493 Bridge City 8651 Bridgeport 4309 Broaddus 189 Bronte 1076 Brookshire 3450 Brookside Village 1960 Browndell 219 Brownfield 9488 Brownsboro 796 Bruceville-Eddy 1490 Bryson 528 Buckholts 387 Buda 2404 Buffalo 1804 Buffalo Gap 463 Buffalo Springs 493 Bullard 1150 Bulverde 3761 Bunker Hill Village 3654 Burke 315 Burnet 4735 Burton 359 Byers 517 Bynum 225 Cactus 2538 Caddo Mills 1149 Caldwell 3449 Callisburg 365 Calvert 1426 Cameron 5634 Camp Wood 822 Campbell 734 Canadian 2233 Caney City 236 Canton 3292 Carbon 224 Carl's Corner 134 Carmine 228 Carrizo Springs 5655 Carthage 6664 Castle Hills 4202 Castroville 2664 Celeste 817 Celina 1861 Center 5678 Centerville 903 Chandler 2099 Channing 356 Charlotte 1637 Chester 265 Chico 947 Childress 6778 Chillicothe 798 China 1112 China Grove 1247 Chireno 405 Christine 436 Cibolo 3035 Cisco 3851 Clarendon 1974 Clarksville 3883 Clarksville City 806 Claude 1313 Clear Lake Shores 1205 Cleveland 7605 Clifton 3542 Clint 980 Clyde 3345 Coahoma 932 Cockrell Hill 4443 Coffee City 193 Coldspring 691 Coleman 5127 Collinsville 1235 Colmesneil 638 Colorado City 4281 Columbus 3916 Comanche 4482 Combes 2553 Combine 1788 Commerce 7669 Como 621 Cool 162 Coolidge 848 Cooper 2150 Copper Canyon 1216 Corral City 89 Corrigan 1721 Cottonwood 181 Cottonwood Shores 877 Cotulla 3614 Cove 323 Covington 282 Crandall 2774 Crane 3191 Cranfills Gap 335
Crawford 705 Creedmoor 211 Crockett 7141 Crosbyton 1874 Cross Plains 1068 Cross Roads 603 Cross Timber 277 Crowell 1141 Crowley 7467 Crystal City 7190 Cuero 6571 Cumby 616 Cuney 145 Cushing 637 Cut and Shoot 1158 Daingerfield 2517 Daisetta 1034 Dalhart 7237 Dalworthington Gardens 2186 Danbury 1611 Darrouzett 303 Dawson 852 Dayton 5709 Dayton Lakes 101 De Kalb 1769 De Leon 2433 Dean 341 Decatur 5201 Dell City 413 Denver City 3985 Deport 718 Detroit 776 Devers 416 Devine 4140 Diboll 5470 Dickens 332 Dilley 3674 Dimmitt 4375 Dodd City 419 Dodson 115 Domino 52 Dorchester 109 Double Oak 2179 Douglassville 175 Dripping Springs 1548 Driscoll 825 Dublin 3754 Eagle Lake 3664 Early 2588 Earth 1109 East Mountain 580 East Tawakoni 775 Eastland 3769 Easton 524 Ector 600 Edcouch 3342 Eden 2561 Edgecliff Village 2550 Edgewood 1348 Edmonson 123 Edna 5899 Edom 322 El Cenizo 3545 El Lago 3075 Eldorado 1951 Electra 3168 Elgin 5700 Elkhart 1215 Elmendorf 664 Elsa 5549 Emhouse 159 Emory 1021 Enchanted Oaks 357 Encinal 629 Estelline 168 Eureka 340 Eustace 798 Evant 393 Everman 5836 Fair Oaks Ranch 4695 Fairchilds 678 Fairfield 3094 Fairview 2644 Falfurrias 5297 Falls City 591 Farmersville 3118 Farwell 1364 Fate 497 Fayetteville 261 Ferris 2175 Flatonia 1377 Florence 1054 Floresville 5868 Floydada 3676 Follett 412 Forney 5588 Forsan 226 Fort Stockton 7846 Franklin 1470 Frankston 1209
Fredericksburg 8911 Freer 3241 Friona 3854 Fritch 2235 Frost 648 Fruitvale 418 Fulshear 716 Fulton 1553 Gallatin 378 Ganado 1915 Garden Ridge 1882 Garrett 448 Garrison 844 Gary City 303 George West 2524 Gholson 922 Giddings 5105 Gilmer 4799 Gladewater 6078 Glen Rose 2122 Glenn Heights 7224 Godley 879 Goldsmith 253 Goldthwaite 1802 Goliad 1975 Golinda 423 Gonzales 7202 Goodlow 264 Goodrich 243 Gordon 451 Goree 321 Gorman 1236 Graford 578 Graham 8716 Granbury 5718 Grand Saline 3028 Grandfalls 391 Grandview 1358 Granger 1299 Granite Shoals 2040 Granjeno 313 Grapeland 1451 Grays Prairie 296 Gregory 2318 Grey Forest 418 Groesbeck 4291 Groom 587 Groveton 1107 Gruver 1162 Gun Barrel City 5145 Gunter 1230 Gustine 457 Hackberry 544 Hale Center 2263 Hallettsville 2345 Hallsburg 518 Hallsville 2772 Hamilton 2977 Hamlin 2248 Happy 647 Hardin 755 Hart 1198 Haskell 3106 Haslet 1134 Hawk Cove 457 Hawkins 1331 Hawley 646 Hays 233 Hearne 4690 Heath 4149 Hebron 874 Hedley 379 Hedwig Village 2334 Helotes 4285 Hemphill 1106 Hempstead 4691 Henrietta 3264 Hickory Creek 2078 Hico 1341 Hidalgo 7322 Higgins 425 Highland Haven 450 Highland Park 8842 Hill Country Village 1028 Hillcrest 722 Hillsboro 8232 Hilshire Village 720 Hitchcock 6386 Holiday Lakes 1095 Holland 1102 Holliday 1632 Hollywood Park 2983 Hondo 7897 Honey Grove 1746 Hooks 2973 Horizon City 5233 Howardwick 437 Howe 2478 Hubbard 1586 Hudson 3792 Hudson Oaks 1637
Hughes Springs 1856 Hunters Creek Village 4374 Huntington 2068 Hutchins 2805 Hutto 1250 Huxley 298 Idalou 2157 Impact 39 Indian Lake 541 Industry 304 Ingleside 9388 Ingleside on the Bay 659 Ingram 1740 Iowa Colony 804 Iowa Park 6431 Iraan 1238 Iredell 360 Italy 1993 Itasca 1503 Jacksboro 4533 Jamaica Beach 1075 Jasper 8247 Jayton 513 Jefferson 2024 Jersey Village 6880 Jewett 861 Joaquin 925 Johnson City 1191 Jolly 188 Jones Creek 2130 Jonestown 1681 Josephine 594 Joshua 4528 Jourdanton 3732 Junction 2618 Justin 1891 Karnes City 3457 Kaufman 6490 Keene 5003 Kemah 2330 Kemp 1133 Kempner 1004 Kendleton 466 Kenedy 3487 Kenefick 667 Kennard 317 Kennedale 5850 Kerens 1681 Kermit 5714 Kirby 8673 Kirbyville 2085 Kirvin 122 Knollwood 375 Knox City 1219 Kosse 497 Kountze 2115 Kress 826 Krugerville 903 Krum 1979 Kyle 5314 La Feria 6115 La Grange 4478 La Grulla 1211 La Joya 3303 La Vernia 931 La Villa 1305 La Ward 200 LaCoste 1255 Lacy-Lakeview 5764 Ladonia 667 Lago Vista 4507 Laguna Vista 1658 Lake Bridgeport 372 Lake City 526 Lake Dallas 6166 Lake Tanglewood 825 Lake Worth 4618 Lakeport 861 Lakeside City 984 Lakeside (San Patricio) 333 Lakeside (Tarrant) 1040 Lakeview 152 Lakeway 8002 Lakewood Village 342 Lamesa 9952 Lampasas 6786 Latexo 272 Lavon 387 Lawn 353 Leakey 387 Leander 7596 Leary 555 Lefors 559 Leon Valley 9239 Leona 181 Leonard 1846 Leroy 335 Lexington 1178 Liberty 8033

Texas’ small towns Population under 10,000 2000 Census
Liberty Hill 1409 Lincoln Park 517 Lindale 2954 Linden 2256 Lindsay 788 Lipan 425 Little Elm 3646 Little River-Academy 1645 Littlefield 6507 Live Oak 9156 Liverpool 404 Livingston 5433 Llano 3325 Lockney 2056 Log Cabin 733 Lometa 782 Lone Oak 521 Lone Star 1631 Loraine 656 Lorena 1433 Lorenzo 1372 Los Fresnos 4512 Los Indios 1149 Los Ybanez 32 Lott 724 Lovelady 608 Lowry Crossing 1229 Lucas 2890 Lueders 300 Luling 5080 Lumberton 8731 Lyford 1973 Lytle 2383 Mabank 2151 Madisonville 4159 Magnolia 1111 Malakoff 2257 Malone 278 Manor 1204 Manvel 3046 Marble Falls 4959 Marfa 2121 Marietta 112 Marion 1099 Marlin 6628 Marquez 220 Marshall Creek 431 Mart 2273 Martindale 953 Mason 2134 Matador 740 Mathis 5034 Maud 1028 Maypearl 746 McCamey 1805 McGregor 4727 McLean 830 McLendon-Chisholm 914 Meadow 658 Meadowlakes 1293 Meadows Place 4912 Megargel 248 Melissa 1350 Melvin 155 Memphis 2479 Menard 1653 Meridian 1491 Merkel 2637 Mertens 146 Mertzon 839 Mexia 6563 Miami 588 Midlothian 7480 Midway 288 Milano 400 Mildred 405 Miles 850 Milford 685 Miller's Cove 120 Millican 108 Millsap 353 Mineola 4550 Mingus 246 Mobeetie 107 Mobile City 196 Monahans 6821 Mont Belvieu 2324 Montgomery 489 Moody 1400 Moore Station 184 Moran 233 Morgan 485 Morgan's Point 336 Morgan's Point Resort 2989 Morton 2249 Moulton 944 Mount Calm 310 Mount Enterprise 525 Mount Vernon 2286 Mountain City 671
Muenster 1556 Muleshoe 4530 Mullin 175 Munday 1527 Murchison 592 Murphy 3099 Mustang Ridge 785 Mustang 47 Naples 1410 Nash 2169 Nassau Bay 4170 Natalia 1663 Navarro 191 Navasota 6789 Nazareth 356 Needville 2609 Nesbitt 302 Nevada 563 New Berlin 467 New Boston 4808 New Chapel Hill 553 New Deal 708 New Fairview 877 New Home 320 New Hope 662 New London 987 New Summerfield 998 New Waverly 950 Newark 887 Newcastle 575 Newton 2459 Neylandville 56 Niederwald 584 Nixon 2186 Nocona 3198 Nolanville 2150 Nome 515 Noonday 515 Nordheim 323 Normangee 719 North Cleveland 263 Northlake 921 Novice 142 Oak Grove 710 Oak Leaf 1209 Oak Point 1747 Oak Ridge North 2991 Oak Ridge (Cooke) 224 Oak Ridge (Kaufman) 400 Oak Valley 401 Oakhurst 230 Oakwood 471 O'Brien 132 Odem 2499 O'Donnell 1011 Oglesby 458 Old River-Winfree 1364 Olmos Park 2343 Olney 3396 Olton 2288 Omaha 999 Onalaska 1174 Opdyke West 188 Orange Grove 1288 Orchard 408 Ore City 1106 Overton 2350 Ovilla 3405 Oyster Creek 1192 Paducah 1498 Paint Rock 320 Palacios 5153 Palisades 352 Palm Valley 1298 Palmer 1774 Palmhurst 4872 Palmview 4107 Panhandle 2589 Panorama Village 1965 Pantego 2318 Paradise 459 Parker 1379 Pattison 447 Patton Village 1391 Payne Springs 683 Pearsall 7157 Pecan Gap 214 Pecan Hill 672 Pecos 9501 Pelican Bay 1505 Penelope 211 Penitas 1167 Pernitas Point 269 Perryton 7774 Petersburg 1262 Petrolia 782 Petronila 83 Pilot Point 3538 Pine Forest 632 Pine Island 849 Pinehurst 2274
Pineland 980 Piney Point Village 3380 Pittsburg 4347 Plains 1450 Pleak 947 Pleasant Valley 408 Pleasanton 8266 Plum Grove 930 Point Blank 559 Point 792 Point Comfort 781 Ponder 507 Port Aransas 3370 Port Isabel 4865 Post 3708 Post Oak Bend City 404 Poteet 3305 Poth 1850 Pottsboro 1579 Powell 105 Poynor 314 Prairie View 4410 Premont 2772 Presidio 4167 Primera 2723 Princeton 3477 Progreso 4851 Progreso Lakes 234 Prosper 2097 Putnam 88 Pyote 131 Quanah 3022 Queen City 1613 Quinlan 1370 Quintana 38 Quitaque 432 Quitman 2030 Ralls 2252 Rancho Viejo 1754 Ranger 2584 Rangerville 203 Rankin 800 Ransom Canyon 1011 Ravenna 215 Raymondville 9733 Red Lick 853 Red Oak 4301 Redwater 872 Refugio 2941 Reklaw 327 Reno city (Lamar) 2767 Reno city (Tarrant-Parker) 2441 Retreat 339 Rhome 551 Rice 798 Richland Hills 8132 Richland Springs 350 Richland 291 Richwood 3012 Riesel 973 Rio Bravo 5553 Rio Hondo 1942 Rio Vista 656 Rising Star 835 River Oaks 6985 Riverside 425 Roanoke 2810 Roaring Springs 265 Robert Lee 1171 Robinson 7845 Roby 673 Rochester 378 Rockdale 5439 Rockport 7385 Rocksprings 1285 Rocky Mound 93 Rogers 1117 Rollingwood 1403 Roma 9617 Roman Forest 1279 Ropesville 517 Roscoe 1378 Rose City 519 Rose Hill Acres 480 Rosebud 1493 Ross 228 Rosser 379 Rotan 1611 Round Mountain 111 Round Top 77 Roxton 694 Royse City 2957 Rule 698 Runaway Bay 1104 Runge 1080 Rusk 5085 Sabinal 1586 Sachse 9751 Sadler 404 San Augustine 2475
San Diego 4753 San Felipe 868 San Leanna 384 San Patricio 318 San Perlita 680 San Saba 2637 Sanctuary 256 Sanford 203 Sanger 4534 Sansom Park 4181 Santa Anna 1081 Santa Clara 889 Santa Fe 9548 Santa Rosa 2833 Savoy 850 Schulenburg 2699 Scotland 438 Scottsville 263 Seabrook 9443 Seadrift 1352 Seagraves 2334 Sealy 5248 Selma 788 Seminole 5910 Seven Oaks 131 Seven Points 1145 Seymour 2908 Shady Shores 1461 Shallowater 2086 Shamrock 2029 Shavano Park 1754 Shenandoah 1503 Shepherd 2029 Shiner 2070 Shoreacres 1488 Silsbee 6393 Silverton 771 Simonton 718 Sinton 5676 Skellytown 610 Slaton 6109 Smiley 453 Smithville 3901 Smyer 480 Snook 568 Somerset 1550 Somerville 1704 Sonora 2924 Sour Lake 1667 South Mountain 412 South Padre Island 2422 Southmayd 992 Southside Place 1546 Spearman 3021 Splendora 1275 Spofford 75 Spring Valley 3611 Springlake 135 Springtown 2062 Spur 1088 St. Hedwig 1875 St. Jo 977 St. Paul 630 Stagecoach 455 Stamford 3636 Stanton 2556 Star Harbor 416 Sterling City 1081 Stinnett 1936 Stockdale 1398 Stratford 1991 Strawn 739 Streetman 203 Sudan 1039 Sullivan City 3998 Sun Valley 51 Sundown 1505 Sunnyvale 2693 Sunray 1950 Sunrise Beach Village 704 Sunset 339 Sunset Valley 365 Surfside Beach 763 Sweeny 3624 Taft 3396 Tahoka 2910 Talco 570 Talty 1028 Tatum 1175 Taylor Lake Village 3694 Teague 4557 Tehuacana 307 Tenaha 1046 Terrell Hills 5019 Texhoma 371 Texline 511 The Hills 1492 Thompsons 236 Thorndale 1278 Thornton 525 Thorntonville 442
Thrall 710 Three Rivers 1878 Throckmorton 905 Tiki Island 1016 Timbercreek Canyon 406 Timpson 1094 Tioga 754 Tira 248 Toco 89 Todd Mission 146 Tolar 504 Tom Bean 941 Tomball 9089 Tool 2275 Toyah 100 Trent 318 Trenton 662 Trinidad 1091 Trinity 2721 Trophy Club 6350 Troup 1949 Troy 1378 Tulia 5117 Turkey 494 Tuscola 714 Tye 1158 Uhland 386 Uncertain 150 Union Grove 346 Valentine 187 Valley Mills 1123 Valley View 737 Van Alstyne 2502 Van 2362 Van Horn 2435 Vega 936 Venus 910 Vinton 1892 Waelder 947 Wake Village 5129 Waller 2092 Wallis 1172 Walnut Springs 755 Warren City 343 Waskom 2068 Webster 9083 Weimar 1981 Weinert 177 Weir 591 Wellington 2275 Wellman 203 Wells 769 West 2692 West Columbia 4255 West Lake Hills 3116 West Orange 4111 West Tawakoni 1462 Westbrook 203 Westlake 207 Westminster 390 Weston 635 Westover Hills 658 Westworth Village 2124 Wharton 9237 Wheeler 1378 White Deer 1060 White Oak 5624 Whiteface 465 Whitehouse 5346 Whitesboro 3760 Whitewright 1740 Whitney 1833 Wickett 455 Willis 3985 Willow Park 2849 Wills Point 3496 Wilmer 3393 Wilson 532 Windcrest 5105 Windom 245 Windthorst 440 Winfield 499 Wink 919 Winnsboro 3584 Winona 582 Winters 2880 Wixon Valley 235 Wolfe City 1566 Wolfforth 2554 Woodbranch 1305 Woodcreek 1274 Woodloch 247 Woodsboro 1685 Woodson 296 Woodville 2415 Woodway 8733 Wortham 1082 Yantis 321 Yoakum 5731 Yorktown 2271 Zavalla 647

5
Definition of a small town What does it mean to be a “small town?” For the purposes of this report on small town Texas, the Office of Rural Community Affairs defines a “small town” as an incorporated area (Census city, town, or village) of fewer than 10,000 residents. According to the 2000 Census, Texas has 1,192 incorporated communities—84 percent (or 1,005) of these incorporated communities are small towns. More than half of Texas’ small towns are located in rural Texas (527 of Texas’ 1005 small towns are located in rural Texas). These 527 small towns represent nearly 94 percent of all rural towns in Texas (rural Texas has 562 incorporated places). A red circle indicates a small town; a black square indicates an incorporated place over 10,000 in population. Rural counties are indicated in green and urban counties are indicated in yellow.
Source: 2000 Census, U.S. Census Bureau. Map prepared by the Office of Rural Community Affairs

6
Introduction Why Texas is a small town state Texas’ oldest town, Nacogdoches, was first established as a Spanish mission in 1716. In less than 300 years, Texas’ population has grown to more than 22 million residents. In 1850, Texas had 23 cities and towns. Today, Texas has nearly 1,200 incorporated cities, towns, and villages plus numerous unincorporated communities and Census designated places.
Over time, some cities have become metropolises. In 1860, Harrisburg (Houston) had 1,863 people; Today, Houston has more than two million residents. By and large, though, Texas is still a state of small towns. 84 percent (or 1,005) of Texas’ 1192 incorporated areas have a population of fewer than 10,000 persons. More than two million Texans call a small town home.
The status of small town Texas The Texas Office of Rural Community Affairs (ORCA) was created by the Texas Legislature to improve the quality of life of rural Texans by administering programs that will spur economic and community development, improve access to health care and provide leadership training. The Texas Legislature also tasked ORCA with preparing an annual report describing and evaluating the condition of rural communities. This report represents the fourth installment in the Status of Rural Texas series, and is focused on providing an up-to-date and comprehensive examination of the state of small town Texas. The format of this report is inspired by the Small Towns Fact Book put together by the Rural Center in North Carolina and is one result of ORCA’s partnership with rural centers across the nation.
Texas’ small towns are incredibly diverse. In 2000, Texas’ small towns ranged in size from Los Ybanez (pop. 32) to Bonham (pop. 9,990). Despite popular conception, many small towns are attracting residents, growing businesses, and seizing the opportunities in today’s economy. These small towns are also full of history, down home flavor, and a pronounced sense of community. Marfa (pop. 2121) is attracting new residents, including artists, second homeowners from urban areas, and retirees. Between 2000 and 2004, ten towns doubled or more than doubled in size. Community leaders in these fast-growth small towns faced new challenges as they managed growth and worked to meet increased demand for services. Small towns proximate to urban areas and those with attractive recreational and retirement conditions have fared better overall.
Some small towns, however, are struggling. Between 2000 and 2004, 303 small towns lost population. 227 of those were in rural counties. Empty storefronts in these small towns bear witness to changing economic times. As technological advances have been made in agriculture, manufacturing, and mineral extraction, the need for workers in those industries has decreased. As businesses are shuttered and families leave town, tax bases in some small towns shrink and resources become scarce. Even for these towns, though, all is not lost. Canadian, Texas stands as an example of a small town that has reinvented itself through community action and is now bustling with activity.
In February 2005, ORCA conducted a Rural Policy Symposium with participation from more than 100 individuals passionate about rural Texas, including local and state elected officials as well as representatives from institutions of higher education, associations, healthcare, councils of government, nonprofits, river authorities, economic development organizations, and state and federal agencies. Symposium participants were asked to share what was great about their rural communities in the past, what was working in their communities today, and what they hoped to see in their communities in the future. The results of the rural policy symposium are located in the section “Front porch conversation.”
The significance of small towns Today, small towns in Texas continue to serve as centers of community, commerce, and distribution. The transition from rural to urban living has been an ongoing phenomenon that has changed the face of Texas. Change has come quickly—between 1940 and 1950, Texas’ urban population grew from less than a third to nearly one-half of Texas’ total population. However, the population of rural Texas and the population of small towns in Texas continue to grow. For some, small towns are nostalgic reminders of Texas’ past, harking back to a less complicated time. But these same small towns are home to more than two million Texans who contribute to the state’s growing economy. Small towns matter and deserve careful attention.

7
Incorporation of Texas' cities, towns, and villages, 1830 to present
0
20
40
60
80
100
120
140
160
1830
s18
40s
1850
s18
60s
1870
s18
80s
1890
s19
00s
1910
s19
20s
1930
s19
40s
1950
s19
60s
1970
s19
80s
1990
s20
00s
Num
ber o
f inc
orpo
ratio
ns
Methods of incorporation for Texas communities Texas has two categories of cities: general law and home rule. There are three categories of general law cities: Type A, Type B, and Type C. General law cities operate under one of two forms of government: aldermanic or commission. All general law cities operate according to specific state statutes prescribing their powers and duties. General Law cities are limited to doing what the state authorizes or permit them to do. If state law does not grant general law cities the express or implied power to initiate a particular action, none may be taken. Home rule cities govern themselves as long as charter provisions or ordinances are not inconsistent with state law. Home rule cities derive their power from the Constitution and look to the state legislature only as a limit on that authority.
Source: Texas Municipal League
Type A General Law Municipalities Type A general law municipalities are larger general law municipalities. Most were incorporated under Type B status and then switched to Type A status when their population increased to 600 or more, or when they had at least one manufacturing establishment. The governing body of a municipality operating as a Type A general law municipality is known as the "city council," and varies in size depending on whether the municipality has been divided into wards. If the municipality has been divided into wards, the council consists of a mayor and two council members from each ward—whatever the number. If the municipality has not been divided into wards, the governing body always consists of a mayor and five council members. In addition to the city council, other municipal officers include a treasurer, tax assessor-collector, city secretary, city attorney, and engineer. Whether these offices are elected or appointed

8
depends on the method selected by the city council for filling them. The city council may provide by ordinance for the appointment or election of such other officers as it deems necessary.
Type B General Law Municipalities Most new cities begin as Type B general law cities under a state law that permits the incorporation of any area containing 201 to 10,000 inhabitants. As the population of a city grows to 600 or more, it might make a transition to Type A municipality. In a Type B general law municipality with the aldermanic form of government, the governing body is known as the "board of aldermen" and includes six members (a mayor and five aldermen), all of whom are elected at-large. At its discretion, the board of aldermen may provide by ordinance for the appointment or election of such additional officers as are needed to conduct the business of the municipality. In a municipality with the commission form of government, the governing body is known as the "board of commissioners" and always consists of a mayor and two commissioners. No other elective officers are required; however, the board of commissioners must appoint a city clerk and may provide by ordinance for the election or appointment of other officers as needed to conduct the business of the municipality. In a municipality of 500 or less population, the board of commissioners must follow the requirements applicable to a Type B general law municipality—that is, the board of commissioners has the same powers and duties as the board of aldermen in a Type B general law municipality, except where specifically provided otherwise. In a municipality of over 500 population, the board of commissioners must follow the requirements of a Type A general law municipality, except where specifically provided otherwise.
Type C General Law Municipalities A municipality with the commission form of government operates under the statutes applicable to a Type C general law municipality. The governing body is known as the "board of commissioners" and always consists of a mayor and two commissioners. No other elective officers are required; however, the board of commissioners must appoint a city clerk, and may provide by ordinance for the election or appointment of such other officers as are required. In a municipality of 500 or less population, the board of commissioners must follow the requirements applicable to a Type B general law municipality—that is, the board of commissioners has the same powers and duties as the board of aldermen in a Type B general law municipality except where specifically provided otherwise. In a municipality over 500 in population, the board of commissioners must follow the requirements of a Type A general law municipality except where specifically provided otherwise.
Home-Rule Charters The state constitution authorizes cities with more than 5,000 inhabitants to adopt a home-rule charter. The home-rule charter will specify the type of government and will identify specific powers of the city, the type of city government, and the specific roles of the mayor, council members and staff. A home-rule municipality, which falls below 5,000 in population, does not lose its home-rule charter and may continue to operate under that charter.

9
Small town Texas facts Texas has more than three million rural residents. In 2000, 3,159,940 Texans lived in rural counties. By 2004, rural Texas’ population grew by nearly three percent to 3,242,536. According to the 2000 Census, 1,636,043, or 52 percent of, rural Texans live in incorporated areas. Nearly one million rural Texans live in small towns with less than 10,000 people and nearly 640,000 rural Texans live in incorporated areas with more than 10,000 people. Texas is a state of small towns. Eighty-four percent (or 1,005) of Texas’ 1192 incorporated areas have a population of fewer than 10,000 persons. Millions of Texans choose to live in small towns. In 2000, more than two million Texans lived in rural and urban small towns in Texas. 48 percent of small town residents live in small towns located in rural counties. Most small towns are located in rural counties. More than 52 percent of small towns in Texas are located in rural counties. Most small towns are located east of Interstate 35. 505 out of Texas’ 1,005 small towns are located in counties located east of I-35. 310 small towns are located in counties west of I-35 and 190 small towns are located in counties through which I-35 passes. Most small towns are adding population. Seventy percent of small towns in Texas gained population between 2000 and 2004, according to Census estimates. Overall, small towns grew by 14 percent (In total, small towns grew by more than 200,000 people between 2000 and 2004). Small towns in rural Texas experienced slower growth between 2000 and 2004—2 percent growth. Small towns contain important property wealth. The assessed total market value of private property in small towns is more than $97 billion.

10
Small town residents are likely to be native-born. More than 92 percent of Texas’ small town population is native to Texas. Small town residents tend to be older and to have limited higher education. Thirty-six percent of Texas’ small town population is 45 years of age or older (compared with 28 percent of the population of bigger towns (those with population greater than 10,000). One in six small town residents has a bachelor’s degree (compared with one in four residents of bigger towns). Most small town residents travel to other places for work. Sixty-eight percent of small town residents commute to work outside of town and 26 percent commute to another county. Most small town residents have a commute of less than 30 minutes. Small towns have five key employment sectors. Fifty-four percent of small town Texans are employed in retail trade, manufacturing, health care and social assistance, educational services, and construction. In rural small towns, jobs in healthcare, social assistance, and education services play a large role in the local economy. Many small towns are experiencing population losses. 303 small towns in Texas, 30 percent, lost population between 2000 and 2004 (227 of the 303 are located in rural counties). 265 of those small towns that lost population had populations of less than 5,000 (200 out of 265 are located in rural counties). 115 of the small towns losing population had a population of less than 1,000. Rural small towns have the highest poverty rates. Among Texas’ incorporated places, rural small towns between 5,000 and 9,999 had the highest poverty rate for all categories (birth to 17, 18 to 64, 65 and older, and overall poverty). Smaller towns have fewer professional managers and financial officers. Ninety-six percent of bigger towns (10,000 or greater) have managers compared to 56 percent of small towns. 87 percent of bigger towns have financial officers compared to 26 percent of small towns.

11
Texas history at a glance
1716 Spain establishes a mission at Nacogdoches, Nuestra Senora de Guadalupe de los
Nacogdoches. In 1779, the pueblo of Nacogdoches is established. 1821 Mexico gains independence from Spain. 1820-1822 Moses and Stephen F. Austin work to establish an American colony in Mexican
Tejas. Moses Austin dies prior to completing his plans and responsibility for establishing the colony falls to Stephen. Stephen F. Austin selects a site on the lower Colorado and Brazos rivers, and settles his colonists there in January 1822.
1835 On October 2nd, fighting broke out at Gonzales between Mexican soldiers and Texas
militiamen over a small cannon (the “Come and take it” cannon), marking a clear break between the American colonists and the Mexican government. In December, the Goliad Declaration of Independence is ratified.
1836 Siege and battle of the Alamo (February-March), signing of the Texas Declaration of Independence at Washington-on-the-Brazos (March 2nd), Texas’ first 23 counties were created (March 17th), Texans defeat Santa Anna at San Jacinto (April 21st), Texas- Mexico peace treaty signed (May 14th), Sam Houston becomes first President of the Republic of Texas (October 22nd), and five towns serve as temporary capitals of Texas (Washington-on-the-Brazos, Harrisburg, Galveston, Velasco and Columbia).
Source: The Center for American History, University of Texas at Austin

12
1837 The government of the Republic of Texas begins operating from Houston (April 19th).
1839 Capital of Texas Republic is moved to Waterloo (Austin). The Texas Congress meets in November. Texas president Mirabeau B. Lamar proposes that the Congress establish a system of education endowed by public lands. An act on January 26, 1839 sets aside land for public schools and two universities.
Photo courtesy of the Texas State Library and Archives Commission,
Prints and Photographs Collection, #1/103-48.
1845 Texas becomes the nation’s 28th state (December 29th). 1850 Texas has 212,592 residents. Texas has 23 cities and towns. The largest, Galveston, has a
population of 4,177. The smallest, Hortontown, has a population of 139. 1860 Texas has 42 towns and cities. The largest, San Antonio, has a population of 8,235. The
smallest, Stephensville, has a population of 120. 1861 Texas secedes from the United States and joins the Confederate States of America. 1870 Congressional Reconstruction ends as Texas readmitted to Union (March 30th). 1876 The Texas Constitution is ratified (February 15th). 1880 Texas has only 11 towns and cities with a population over 4,000—Galveston is Texas’
largest city at 22,248. 1885 Dr. Pepper is invented in Waco.

13
1900 Texas ranks as 6th most populous state. A hurricane, the worst natural disaster in U.S. history, devastates Galveston—more than 8,000 deaths are recorded.
1901 In January 1901, a vast oil field is discovered at Spindletop leading to Texas’ first oil boom.
Source: National Park Service, U.S. Department of the Interior
1914 Ernest Tubb born in Crisp, Texas. 1921 Texas’ last county, Kenedy, is created. 1930 Texas’ motto “Friendship” is adopted by the 41st Legislature during the 4th called
special session. 1933 Willie Nelson born in Abbott, Texas. 1940 Texas urban population accounts for less than a third of the state’s total population. 1941 The United States enters the Second World War in December. 1950 Nearly half of Texans live in urban areas. Only four states—Illinois, Michigan, Ohio,
and Texas have a population between 5 and 10 million people. 1953 Dwight D. Eisenhower becomes the first Texas born president. 1955 Earl Campbell born in Tyler (March 29th).

14
1961 The Manned Spacecraft Center Space Center opens (later renamed the Lyndon B. Johnson Space Center).
1969 The first word spoken from the moon was “Houston” (July 20th).
Source: National Aeronautics and Space Administration, National Space Science Data Center
1970 Texas’ population surpasses 11 million—11,196,730. 1978 Jalapeno pepper jelly, which originated in Lake Jackson, is first marketed. 1990 Texas has 1,173 incorporated cites, towns, and villages. 1,001 have a
population less than 10,000. 2000 Only 4 states—California, Illinois, Ohio, and Texas—grew from between 1
and 5 million in 1900 to join the 10-million-and-over club by the end of the century. Texas and California are the only two states to have populations greater than 20 million. Texas gains nearly 18 million residents between 1900 and 2000.
2005 Clark, Texas is renamed Dish, Texas. In exchange, residents receive a decade
of free satellite television.

15
Texas incorporated areas by population
47
140117
453435
3555
220252
050
100150200250300350400450500
Less than1,000
1,000-4,999 5,000-9,999 10,000-49,999
50,000 andgreater
Population
Num
ber
of a
reas
Texas
Rural Texas
Source: U.S. Census Bureau, 2000 Census
Source: U.S. Census Bureau, 2000 Census
Source: U.S. Census Bureau, 2000 Census
Measuring the vitality of small communities in Texas A statistical profile
This statistical profile of Texas’ small towns covers a range of social and economic indicators. The primary source of demographic data is the 2000 Census, unless otherwise noted. Data about property values for incorporated areas was provided by the Comptroller of Public Accounts. In these tables and descriptions, the term “incorporated area” applies to Texas’ incorporated cities, towns, and villages, regardless of size. The term “small town” refers to incorporated areas with fewer than 10,000 people, except when even smaller town sizes are discussed.
References to “urban” and “rural” counties are consistent with definitions of “metropolitan” and “nonmetropolitan,” respectively, as used by the U.S. Office of Management and Budget after 1993 but prior to June 2003. Using these definitions, Texas has 196 rural counties and 58 urban counties.
In the last two installments of the Status of Rural Texas series, we used the June 2003 redefinition of “metropolitan” and “nonmetropolitan” plus the new term “micropolitan.” We are reverting to the 1993 method of defining Texas counties because the new June 2003 definitions of “metropolitan” and “nonmetropolitan” do not correspond well with our notion of “rural.” This statistical profile also looks at growth for small towns in relation to Texas’ interstate system and reveals marked differences in Texas’ regional growth.
Most Texas communities are small. According to the 2000 Census, 75 percent of Texans live in incorporated areas. 84 percent (or 1,005) of Texas’ 1,192 incorporated cities, towns, and villages have a population of fewer than 10,000 persons. 13 percent (or 2,069,907) of the 15,738,989 people living in incorporated areas of Texas in 2000 lived in incorporated areas with fewer than 10,000 persons. In 2000, Texas’ smallest city was Los Ybanez (pop. 32); smallest village was Rangerville (pop. 203); smallest town was Quintana (pop. 38). According to 2004 Census estimates, nine small Texas towns outgrew their small town status (population less than 10,000) between 2000 and 2004.
Most small towns are located east of I-35. 505 out of Texas’ 1,005 small towns are located east of I-35. 310 small towns are located west of I-35 and 190 small towns are located along I-35. Ten counties in Texas have no incorporated areas—six lie west of I-35, four lie east. Forty-three counties in Texas have one incorporated area—Forty-one of those counties are rural.
Texas Counties & InterstatesCounties with 21 or More Municipalities
Counties with 9 to 20 Municipalities
Counties with 4 to 8 Municipalities
Counties with 1 to 3 Municipalities
Counties with No Municipalities
Texas Interstates

Measuring the vitality of small communities in Texas A statistical profile
16
Number of municipalities by size, 2000
35
55
220
252
47
105
62
233
183
0
50
100
150
200
250
300
less than 1,000 1,000-4,999 5,000-9,999 10,000-49,999 50,000 andgreater
Population
Num
ber o
f mun
icip
aliti
es
Rural
Urban
Incorporated areas losing population between 2000 and 2004
115
150
38 34
0
20
40
60
80
100
120
140
160
Less than 1,000 1,000-4,999 5,000-9,999 10,000 and greater
Population of area
Perc
ent o
f are
as b
y si
ze
Source: U.S. Census Bureau, 2000 Census
Source: U.S. Census Bureau, 2000 Census
Small towns are a big part of rural Texas 94 percent of incorporated areas in rural Texas are small towns with fewer than 10,000 people. In 126 rural counties, the incorporated population makes up 50 percent or more of the county’s total population. Nearly half of incorporated areas in rural Texas have a population less than 1,000 (45 percent). Small towns in Texas are almost evenly distributed between rural and urban counties (more than 52 percent are located in rural counties), unlike North Carolina where more than 80 percent of municipalities are located in its rural counties.
Outside urban areas, the smallest towns more likely to lose population Recent population trends show that many Texas small towns are losing population. Overall, 30 percent of small towns (those with a population under 10,000) lost population between 2000 and 2004. The population loss trend was more pronounced among small towns in rural counties where 43 percent lost population during the same time period (compared to 16 percent of small towns in urban counties). Smaller towns (those under 5,000 in population) accounted for 87 percent of all small towns losing population. 115 of Texas’ smallest towns (those under 1,000 population) lost population, accounting for 38 percent of all small towns losing population. During the same time period, 34 incorporated areas with a population greater than 10,000 lost population. Not all small towns lost population—700 small towns gained in population between 2000 and 2004.

Measuring the vitality of small communities in Texas A statistical profile
17
Population of Texas' incorporated places by age, 2000
0%
5%
10%
15%
20%
25%
30%
35%
40%
45%
Under 5 5 to 14 15 to 19 20 to 44 45 to 64 65+Population of place
Perc
ent o
f pop
ulat
ion
more than 10,000
less than 10,000
less than 10,000 (rural)
Source: U.S. Census Bureau, 2000 Census
Source: U.S. Census Bureau, 2000 Census
Small towns experience limited in-migration According to the Census Bureau, nearly 1.4 million people moved to Texas from another state between 1995 and 2000. Small towns in Texas do not appear to have captured a significant portion of in-migration from other states, regardless whether the small town is located in an urban or rural area. The smallest Texas towns (less than 1,000 in population) have the overall highest rate of native born citizens.
Aging populations and economic viability In general, residents of small towns are older than the state population. In rural small towns especially, individuals over 65 make up a larger percentage of the population. In Texas, 75 percent of small towns with a population under 5,000 have a median age that exceeds the state's median age by 10 years. And the smaller the town, the older the population: 80 percent of towns with fewer than 1,000 have a median age that exceeds the state's median age by 10 years. These small communities may have limited economic viability because of, or indicated by, fewer working age inhabitants and fewer young families. Older residents often have fixed incomes and an increased need for services.
Percent born in Texas, 2000
9091
93
95
83
9291
96
75
80
85
90
95
100
less than 1,000 1,000-4,999 5,000-9,999 10,000 and greater
Population of incorporated area
Perc
ent o
f pop
ulat
ion
Rural
Urban
Measuring the vitality of small communities in Texas A statistical profile
18
Source: U.S. Census Bureau, 2000 Census
Source: U.S. Census Bureau, 2000 Census
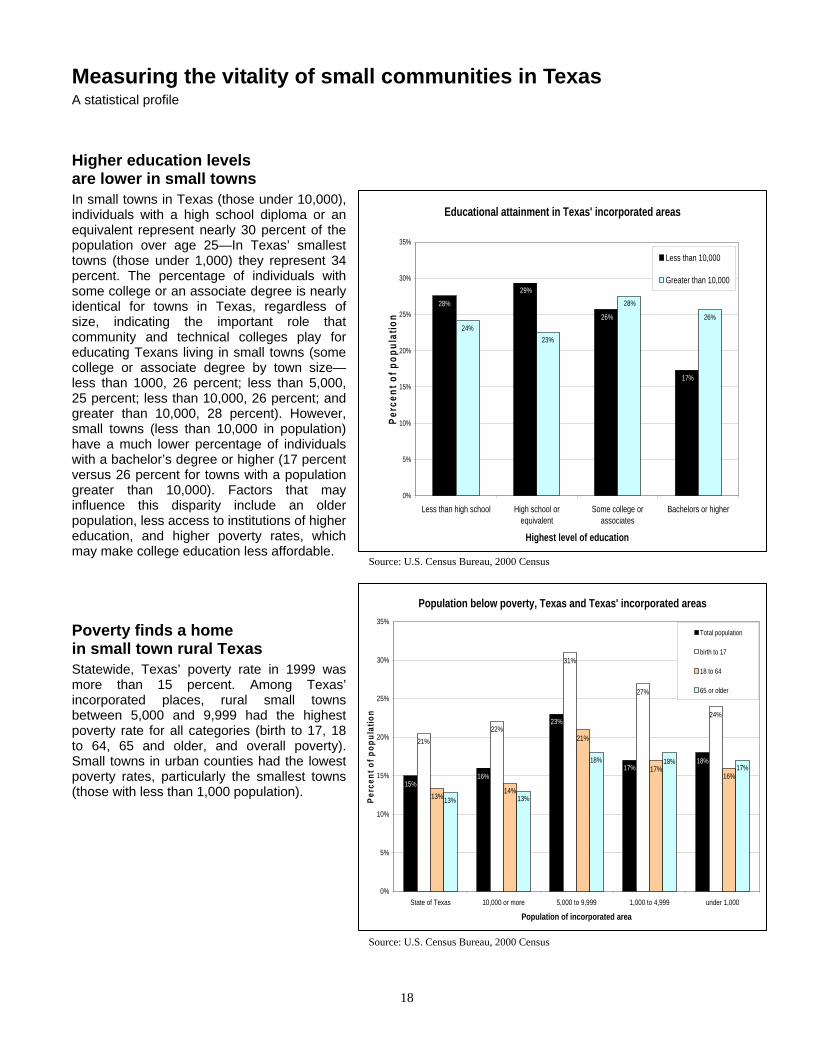
Higher education levels are lower in small towns In small towns in Texas (those under 10,000), individuals with a high school diploma or an equivalent represent nearly 30 percent of the population over age 25—In Texas’ smallest towns (those under 1,000) they represent 34 percent. The percentage of individuals with some college or an associate degree is nearly identical for towns in Texas, regardless of size, indicating the important role that community and technical colleges play for educating Texans living in small towns (some college or associate degree by town size—less than 1000, 26 percent; less than 5,000, 25 percent; less than 10,000, 26 percent; and greater than 10,000, 28 percent). However, small towns (less than 10,000 in population) have a much lower percentage of individuals with a bachelor’s degree or higher (17 percent versus 26 percent for towns with a population greater than 10,000). Factors that may influence this disparity include an older population, less access to institutions of higher education, and higher poverty rates, which may make college education less affordable.
Poverty finds a home in small town rural Texas Statewide, Texas’ poverty rate in 1999 was more than 15 percent. Among Texas’ incorporated places, rural small towns between 5,000 and 9,999 had the highest poverty rate for all categories (birth to 17, 18 to 64, 65 and older, and overall poverty). Small towns in urban counties had the lowest poverty rates, particularly the smallest towns (those with less than 1,000 population).
Educational attainment in Texas' incorporated areas
17%
26%
29%
28%
26%
28%
23%24%
0%
5%
10%
15%
20%
25%
30%
35%
Less than high school High school orequivalent
Some college orassociates
Bachelors or higher
Highest level of education
Perc
ent o
f pop
ulat
ion
Less than 10,000
Greater than 10,000
Population below poverty, Texas and Texas' incorporated areas
18%17%
23%
16%15%
24%
27%
31%
22%21%
16%17%
21%
14%13%
17%18%18%
13%13%
0%
5%
10%
15%
20%
25%
30%
35%
State of Texas 10,000 or more 5,000 to 9,999 1,000 to 4,999 under 1,000
Population of incorporated area
Perc
ent o
f pop
ulat
ion
Total population
birth to 17
18 to 64
65 or older
Measuring the vitality of small communities in Texas A statistical profile
19
Source: U.S. Census Bureau, 2000 Census
Source: U.S. Census Bureau, 2000 Census
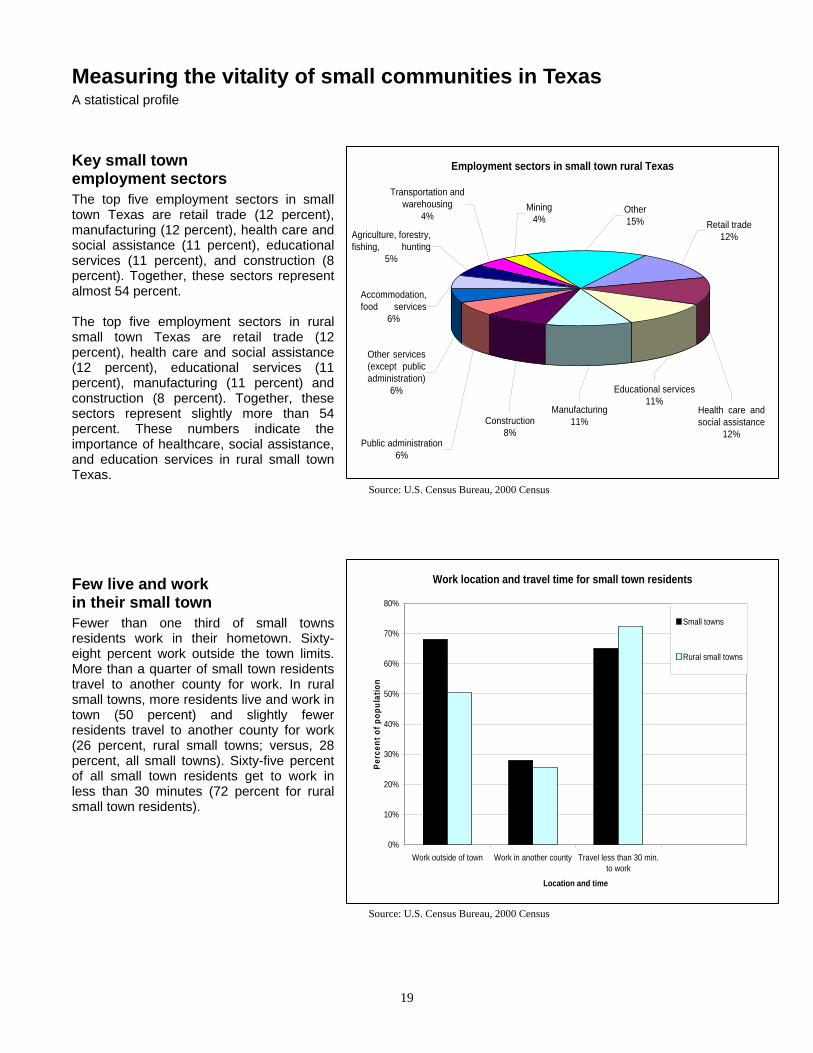
Key small town employment sectors The top five employment sectors in small town Texas are retail trade (12 percent), manufacturing (12 percent), health care and social assistance (11 percent), educational services (11 percent), and construction (8 percent). Together, these sectors represent almost 54 percent. The top five employment sectors in rural small town Texas are retail trade (12 percent), health care and social assistance (12 percent), educational services (11 percent), manufacturing (11 percent) and construction (8 percent). Together, these sectors represent slightly more than 54 percent. These numbers indicate the importance of healthcare, social assistance, and education services in rural small town Texas.
Few live and work in their small town Fewer than one third of small towns residents work in their hometown. Sixty-eight percent work outside the town limits. More than a quarter of small town residents travel to another county for work. In rural small towns, more residents live and work in town (50 percent) and slightly fewer residents travel to another county for work (26 percent, rural small towns; versus, 28 percent, all small towns). Sixty-five percent of all small town residents get to work in less than 30 minutes (72 percent for rural small town residents).
Employment sectors in small town rural Texas
Other services(except publicadministration)
6%
Public administration6%
Agriculture, forestry, fishing, hunting
5%
Transportation and warehousing
4%
Accommodation, food services
6%
Mining4%
Construction8%
Manufacturing11%
Educational services11%
Health care andsocial assistance
12%
Other15% Retail trade
12%
Work location and travel time for small town residents
0%
10%
20%
30%
40%
50%
60%
70%
80%
Work outside of town Work in another county Travel less than 30 min.to work
Location and time
Perc
ent o
f pop
ulat
ion
Small towns
Rural small towns

Measuring the vitality of small communities in Texas A statistical profile
20
Per capita property values and exemptions
0
10,000
20,000
30,000
40,000
50,000
60,000
Texas 10,000 and greater 5,000 to 9,999 1,000 to 4,999 Less than 1,000
Population
Valu
e
Per capita market
Per capita taxable
Per capita exemptions
Source: Texas Comptroller of Public Accounts, 2005
Source: Texas Comptroller of Public Accounts, 2005
Property values in small town Texas In 2004, 855 small towns in Texas (those with a population less than 10,000) self-reported property tax values. The total market value for property for these small towns exceeded $97 billion. While this property wealth is considerable, these small towns, which account for 72 percent of all Texas towns, represent just 11 percent of Texas’ total market value for property. Small towns are faced with smaller tax bases despite the use of fewer property tax exemptions. Small towns have significantly less per capita property value (almost $7,000 less) when compared to bigger towns (10,000 and more). Also, the per capita value of tax exemptions for small towns is much lower than for bigger towns (nearly $1,600 less).
Self-reported property values, 2004
Total market value Total taxable
value Value of
exemptions Exemptions,
percent Texas towns 890,134,700,841 805,552,372,386 84,582,328,455 10%
Small towns (under 10,000) 97,311,090,856 90,612,846,721 6,698,244,135 7% Big towns (10,000+) 792,823,609,985 714,939,525,665 77,884,084,320 10% Small towns in depth 5,000 to 9,999 38,787,760,972 35,767,765,992 3,019,994,980 8% 1,000 to 4,999 51,638,340,906 48,416,942,616 3,221,398,290 6% Less than 1,000 6,884,988,978 6,428,138,113 456,850,865 7%

Measuring the vitality of small communities in Texas A statistical profile
21
Managers, administrators, and financial officers
0%
10%
20%
30%
40%
50%
60%
70%
80%
90%
100%
Under 5,000 Under 10,000 Over 10,000 All
Perc
ent
Manager
Adminstrator
Financial officer
Source: Texas Municipal League, 2005
Fewer managers and financial officers in small towns Most small towns in Texas have either a manager or administrator1. Roughly a quarter of small towns have a financial or budget officer. Small towns under 5,000 are more likely to have administrators than managers and less likely to have financial officers. Bigger towns (those over 10,000 in population) are far more likely to have managers and financial officers. In small town Texas, management issues are more likely to be handled by mayors, alderman, commissioners, and council members.
1 Source: Texas Municipal League. Data from 593 Texas towns and cities (and 391 towns and cities with a population under 10,000 in population) were used for this analysis.

22
This page intentionally left blank

23
Small towns and Texas interstates
Texas Counties & InterstatesCounties with 21 or More Municipalities
Counties with 9 to 20 Municipalities
Counties with 4 to 8 Municipalities
Counties with 1 to 3 Municipalities
Counties with No Municipalities
Texas Interstates

24
I-35 I-35 passes through 19 Texas counties—six are rural. 101 counties lie east of I-35—69 of those counties are rural; 97 out of 101 counties contain incorporated places. 134 counties lie west of I-35—121 of those are rural; 128 out of 134 counties have incorporated places.
Incorporated populations: I-35 by the numbers Urban Rural Grand Total Percent rural by… Population Number of counties
East of I-35 5,580,745 793,120 6,373,865 12% 68% West of I-35 1,617,137 803,853 2,420,990 33% 90% I-35 passes through county 6,867,152 76,982 6,944,134 1% 32% Grand Total 14,065,034 1,673,955 15,738,989 11% 77%
East of I-35 593 incorporated areas lie in counties east of I-35—505 have a population under 10,000 (85 percent). 414 small towns east of I-35 gained population between 2000 and 2004 (82 percent of small towns gained population).
West of I-35 340 incorporated areas lie in counties west of I-35—310 have a population under 10,000 (91 percent). 128 small towns west of I-35 gained population between 2000 and 2004 (41 percent of small towns gained population).
On I-35 I-35 passes through 19 counties with 259 incorporated areas—190 of those have a population under 10,000 (73 percent). 158 small towns in counties that I-35 passes through gained population between 2000 and 2004 (83 percent of small towns gained population).
I-45 I-45 passes through 10 counties—five are rural. Forty-six counties lie east of I-45—30 are rural. 198 counties lie west of I-45—161 are rural.
Incorporated populations: I-45 by the numbers Urban Rural Grand Total Percent rural by… Population Number of counties
East of I-45 1,289,019 349,080 1,638,099 21% 65% West of I-45 7,865,435 1,237,376 9,102,811 14% 81% I-45 passes through county 4,910,580 87,499 4,998,079 2% 50% Grand Total 14,065,034 1,673,955 15,738,989 11% 77%

25
Between I-35 and I-45 211 incorporated areas lie in counties between of I-35 and I-45—175 have a population under 10,000 (83 percent). 136 small towns between of I-35 and I-45 gained population between 2000 and 2004 (78 percent of small towns gained population).
East of I-45 289 incorporated areas lie in counties east of I-45—260 have a population under 10,000 (90 percent). 216 small towns east of I-45 gained population between 2000 and 2004 (83 percent of small towns gained population).
West of I-45 763 incorporated areas lie in counties west of I-45—653 have a population under 10,000 (86 percent). 402 small towns west of I-45 gained population between 2000 and 2004 (62 percent of small towns gained population).
On I-45 I-45 passes through 10 counties with 140 incorporated areas—92 of those have a population under 10,000 (66 percent). 82 small towns in counties that I-45 passes through gained population between 2000 and 2004 (89 percent of small towns gained population).
I-10 I-10 passes through 26 counties—16 of those are rural. 181 counties lie north of I-10—143 of those are rural; four of the 181 counties north of I-10 have no incorporated places. 47 counties lie south of I-10—38 of those are rural; five of the 47 counties south of I-10 have no incorporated places.
Incorporated populations: I-10 by the numbers Urban Rural Grand Total Percent rural by… Population Number of counties
North of I-10 7,665,063 1,178,777 8,843,840 13% 79% South of I-10 1,623,294 386,171 2,009,465 19% 81% I-10 passes through county 4,776,677 109,007 4,885,684 2% 62% Grand Total 14,065,034 1,673,955 15,738,989 11% 77%
North of I-10 865 incorporated areas lie in counties north of I-10—752 have a population under 10,000 (87 percent). 517 small towns north of I-10 gained population between 2000 and 2004 (69 percent of small towns gained population).
South of I-10 176 incorporated areas lie in counties south of I-10—141 have a population under 10,000 (80 percent). 98 small towns south of I-10 gained population between 2000 and 2004 (70 percent of small towns gained population).

26
On I-10 I-10 passes through 26 counties with 151 incorporated areas—112 of those have a population under 10,000 (74 percent). 85 small towns in counties that I-10 passes through gained population between 2000 and 2004 (76 percent of small towns gained population).
I-20 I-20 passes through 12 rural and 10 urban counties. 71 counties are located between I-10 and I-20—75 percent are rural (53 counties); one of the 71 counties has no incorporated places. 73 counties are located north of I-20 and south of I-40—62 of those are rural.
Incorporated populations: Between I-10 and I-20 Urban Rural Grand Total Percent rural by… Population Number of counties
In county between I-10 and I-20 1,841,431 499,791 2,341,222 21% 75%
Between I-10 and I-20 345 incorporated areas lie between I-10 and I-20—314 have a population under 10,000 (91 percent). 247 small towns between I-10 and I-20 gained population between 2000 and 2004 (79 percent of small towns gained population).
Incorporated populations between I-20 and I-40 and along I-20
Urban Rural Grand Total Percent rural by… Population Number of counties
I-20 passes through county 4,215,903 137,629 4,353,532 3% 55% In county between I-20 and I-40 1,507,686 440,757 1,948,443 23% 85%
Grand Total 5,723,589 578,386 6,301,975
On I-20 I-20 passes through 22 counties with 175 incorporated areas—123 of those have a population under 10,000 (70 percent). 85 small towns in counties that I-20 passes through gained population between 2000 and 2004 (69 percent of small towns gained population).
North of I-20, South of I-40 309 incorporated areas lie in counties north of I-20 and south of I-40—284 have a population under 10,000 (92 percent). 176 small towns north of I-20 and south of I-40 gained population between 2000 and 2004 (62 percent of small towns gained population).

27
I-40 I-40 passes through seven counties in North Texas—six are rural. All ten counties north of I-40 are rural. 126 rural counties are located south of I-40 and north of I-10.
Incorporated populations near I-40 Urban Rural Grand Total Percent
rural by…
Population Number of countiesNorth of I-40 64,610 64,610 100% 100% I-40 passes through county 100,043 46,118 146,161 32% 86% Grand Total 100,043 110,728 210,771
North of I-40 Twenty-one incorporated areas lie in counties north of I-40—19 have a population under 10,000 (90 percent). 26 percent of small towns north of I-40 gained population between 2000 and 2004.
On I-40 I-40 passes through seven counties with 18 incorporated areas—15 of those have a population under 10,000 (83 percent). Thirty-three percent of small towns in counties that I-40 passes through gained population between 2000 and 2004.
28
Source: Office of Rural Community Affairs
A front porch conversation

29
A front porch conversation Rural Texans talk about their hometowns
Background Pursuant to House Bill 7 (77th Legislative Session), the Office of Rural Community Affairs (ORCA) is required to “develop a rural policy for the state in consultation with local leaders representing all facets of rural community life, academic and industry experts, and state elected and appointed officials with interests in rural communities.” Beginning in 2002, in an effort to ensure that rural Texans would have their voices heard, the Office of Rural Community Affairs (ORCA) conducted a series of public hearings across the state. The citizens of Alice, Dimmitt, Eagle Lake, Eldorado, Fort Stockton, Johnson City, Rusk, and Seymour generously hosted public hearings that drew participants from far and wide. The discussions were broad and lively (as one might expect!). In public hearing after public hearing, concerned and enthusiastic rural Texans were asked what barriers and challenges their communities, families, and businesses face. ORCA also consulted with federal and state governmental agencies, councils of governments, directors of education service centers, trade associations, local officials, and other rural stakeholders. Outline for Texas’ Rural Policy, submitted in January 2003, was the result of this input. The outline contained basic principles of operation and core objectives for development of Texas’ rural policy. In 2003, ORCA research and policy staff searched Texas statutes to examine existing policies that affecting rural Texas. In February 2004, William M. Jeter, III, Chair of the ORCA Executive Committee, created the Subcommittee on Rural Policy and appointed members. The Subcommittee on Rural Policy of the ORCA Executive Committee held several meetings and continued to partner with those interested in rural policy development.
Front porch conversation In February 2005, ORCA conducted a Rural Policy Symposium with participation from more than 100 individuals passionate about rural Texas, including local and state elected officials as well as representatives from institutions of higher education, associations, healthcare, councils of government, nonprofits, river authorities, economic development organizations, and state and federal agencies. Symposium participants were asked to share what was great about their rural communities in the past, what was working in their communities today, and what they hoped to see in their communities in the future. After a keynote speech by Chuck Fluharty, Director of the Rural Research and Policy Institute, participants at the Rural Policy Symposium organized by region (Central, East, Gulf Coast, North, South, and West/Panhandle). The following represents a distillation of common themes and ideas expressed by those regional workgroups.

30
What was great about our rural communities in the past? Participants recalled self-sufficient towns with a strong sense of community. Vibrant downtowns were populated with mom and pop stores, a bustling town square, pharmacies with soda fountains, and movie theatres. The countryside surrounding towns was dotted with oil fields and family-owned, working farms. Land was less fragmented. There was more money in farming. Townsfolk left their doors unlocked. Tight-knit families filled neighborhoods, went to church, and held barbeques. Quality public schools were made stronger by family and community support. People tended to stay in town after high school or return. Good, stable jobs were plentiful. Milkmen and country doctors made house calls. Healthcare was accessible. What's great about our rural communities right now? Participants are excited now about the new opportunities represented by technology, particularly broadband Internet access. On the economic front, people spoke of the role of entrepreneurship, recreation, and tourism in job creation, the low cost of living, and the abundance of undeveloped space and natural resources in and around their communities. Participants commented about the quality of life they enjoy—low crime rates, clean air, friendly people, lack of traffic, and a slower overall pace. They spoke of their community’s sense of place and social cohesiveness, indicating that their towns are good places to raise children. Participants are proud of their public schools, which tend to be smaller in overall size and have smaller classroom sizes, and their community colleges. Participants noted the role that partnerships play in getting things accomplished—for profits, nonprofits, philanthropic organizations, faith-based organizations, community colleges, and land grant universities are working together. Participants also cited their regional pride and the availability of regional medical facilities. What do we want to see in our rural communities in the future? Participants want to ensure that their communities are economically vibrant and have plans for growth and sustainability. They would like to ensure that community assets are recognized and that their community works more with other communities in their region. They want all cultures and heritages to be treasured. Participants also want to encourage youth to stay in town, to work, and become integral members of the community. Participants seek to create an environment where innovative leadership is created, supported, and encouraged. Participants recognize the need for communication technology that will support global engagement by their communities. Participants also cite the need to move beyond rivalry in government and the desire to do away with unfunded mandates that affect rural tax rates.
Policy goals and statements from participants Create a place where diversity is celebrated and embraced. Assure diversity in the community while promoting economic and cultural changes. Create a place where our young people want to stay and where they can make a living Ensure a quality public education and increase access to higher education. Create and encourage mechanisms that expand and create high wage jobs and high quality businesses in rural areas. Ensure access to good quality water (wet utilities) Reduce regulations required to access funds and resources that address infrastructure improvements. Ensure access to primary healthcare Provide more incentives to attract healthcare providers and services to rural areas. Recognize the importance of amenities—arts, culture, museums, and libraries Recognize and appreciate the cultural and historical assets of rural communities.

31
The need for communities, institutions, individuals, and state agencies to work together Encourage partnerships by improving information sharing and dialogue. The need for community/regional leadership development-champions Provide necessary resources to encourage leadership training in rural Texas. Promote and develop community projects and services. Support and encourage innovative leadership/strong organized political representation Leadership across all sectors is needed to facilitate local efforts/goals and should be done on a coordinated, community-oriented basis. Encourage post-secondary education/entrepreneurship Encourage rural Texas’ strong entrepreneurial spirit when creating growth in all business sectors, allowing both new and existing businesses to flourish. Protect available water resources, public infrastructure, and public health Invest in water and sewer facilities to safeguard public health and position rural communities to compete for jobs. Also, protect the state's natural resource base to ensure long-term, shared prosperity. Provide technology for quality jobs and a sustainable economy that is responsive to the global market place Provide rural communities with state-of-the-art technology to connect them with the global economy. Recognize regional assets and work with other communities Encourage regionalism so that communities work together for long-term stability and growth. Increase civic participation through technology A community’s life will be enhanced through increased use of technology by government, nonprofits, and other organizations, enabling citizens to participate more fully, and build new relationships. Respect for and care of the elderly Encourage coordinated services and programs to meet the needs of the elderly and their care givers. Steps to attain economic vibrancy Remove barriers that exist to work and support economic stability in rural communities by providing necessary resources. Strong, high quality public education that includes technical vocational training Ensure that all students receive a sound, essential education regardless of where they live.

32
Source: Library of Congress, Prints & Photographs Division, FSA-OWI Collection, Reproduction number, LC-USF34-033832-D DLC (b&w film neg.).
Texas’ Small Town Data Tables

Texas’ small town data tables
33
Town Population 2000
Population 2004
% birth to 17, 2000
% 18 to 64,
2000 % 65+, 2000
Median age, 2000
Percent native Texan, 2000
High school or less,
2000
Bachelor or higher,
2000
Poverty rate, 2000
Total jobs, 2000
Work in
town, 2000
Less than 30 minutes to work,
2000
Abbott 300 326 26% 59% 16% 41 97% 43% 18% 8% 151 17% 71% Abernathy 2839 2778 29% 54% 17% 35 97% 66% 10% 9% 1163 30% 64% Ackerly 245 233 28% 63% 9% 35 79% 84% 4% 20% 104 36% 87% Adrian 159 156 13% 71% 16% 46 95% 42% 32% 24% 64 43% 44% Agua Dulce 737 738 33% 57% 11% 32 97% 69% 8% 25% 260 16% 68% Alamo Heights 7319 7307 24% 62% 15% 41 93% 10% 67% 4% 3630 14% 82% Alba 430 472 28% 52% 20% 42 98% 70% 3% 16% 179 25% 63% Albany 1921 1872 28% 55% 17% 39 97% 53% 21% 9% 861 56% 62% Aledo 1726 2430 32% 61% 7% 34 98% 38% 26% 2% 882 14% 59% Alma 302 318 33% 56% 11% 38 97% 55% 10% 8% 150 3% 59% Alpine 5786 6079 25% 61% 15% 34 95% 45% 25% 21% 2550 80% 86% Alto 1190 1140 28% 54% 18% 38 89% 76% 5% 34% 408 39% 63% Alton 4384 6786 35% 57% 8% 25 66% 86% 2% 43% 1365 6% 60% Alvarado 3288 3903 27% 59% 14% 32 93% 69% 7% 14% 1420 20% 43% Alvord 1007 1241 29% 57% 14% 34 96% 64% 11% 7% 469 17% 66% Ames 1079 1148 31% 55% 13% 36 99% 72% 6% 32% 383 2% 54% Amherst 791 773 35% 53% 12% 34 87% 77% 8% 32% 312 41% 84% Anahuac 2210 2153 29% 56% 15% 34 94% 56% 16% 14% 899 40% 57% Anderson 257 274 17% 63% 20% 42 97% 63% 14% 11% 92 18% 38% Andrews 9652 9463 31% 56% 13% 34 89% 65% 12% 18% 3599 66% 73% Angus 334 364 25% 67% 8% 38 96% 65% 8% 14% 161 10% 60% Anna 1225 1500 26% 65% 9% 31 84% 69% 10% 9% 633 14% 55% Annetta North 467 510 28% 55% 17% 41 100% 24% 49% 1% 197 16% 47% Annetta South 555 605 29% 61% 9% 39 97% 25% 37% 2% 319 7% 38% Annetta 1108 1200 35% 58% 6% 39 96% 19% 50% 3% 585 8% 53% Annona 282 264 30% 56% 14% 39 95% 77% 4% 12% 130 8% 63% Anson 2556 2372 30% 53% 17% 37 96% 73% 9% 20% 889 45% 60% Anthony 3850 4042 33% 57% 9% 33 63% 69% 6% 26% 800 20% 67% Anton 1200 1176 32% 53% 14% 34 97% 68% 10% 22% 508 26% 53% Appleby 444 446 22% 65% 14% 38 98% 52% 21% 8% 221 5% 81% Aquilla 136 148 33% 55% 12% 31 100% 67% 4% 6% 51 2% 47% Aransas Pass 8138 8817 28% 58% 13% 36 94% 67% 8% 20% 2795 31% 70% Archer City 1848 1901 26% 56% 18% 39 99% 62% 12% 14% 829 44% 60% Arcola 1048 1194 43% 49% 8% 28 77% 77% 6% 27% 320 3% 42% Argyle 2365 2823 30% 63% 6% 39 98% 24% 44% 3% 1167 14% 39% Arp 901 921 27% 61% 13% 37 98% 62% 13% 5% 428 23% 57% Asherton 1342 1315 37% 49% 14% 31 96% 72% 9% 36% 382 20% 74% Aspermont 1021 851 23% 57% 20% 41 97% 72% 7% 22% 418 75% 84% Atlanta 5745 5616 28% 56% 17% 37 99% 61% 15% 23% 2174 51% 70% Aubrey 1500 2102 31% 60% 9% 31 97% 56% 12% 9% 776 16% 62% Aurora 853 994 27% 63% 10% 37 98% 65% 11% 14% 392 7% 26% Austwell 192 187 25% 58% 17% 49 99% 70% 12% 34% 73 14% 52% Avery 462 442 24% 58% 18% 43 98% 73% 7% 22% 195 23% 54% Avinger 464 454 25% 55% 20% 42 100% 64% 13% 27% 175 32% 72% Azle 9600 10301 26% 62% 12% 37 98% 50% 17% 9% 4370 21% 38% Bailey 213 220 35% 59% 6% 33 96% 61% 12% 21% 111 10% 53% Bailey's Prairie 694 714 22% 69% 9% 40 100% 28% 31% 4% 363 7% 63%

Texas’ small town data tables
34
Town Population 2000
Population 2004
% birth to 17, 2000
% 18 to 64,
2000 % 65+, 2000
Median age, 2000
Percent native Texan, 2000
High school or less,
2000
Bachelor or higher,
2000
Poverty rate, 2000
Total jobs, 2000
Work in
town, 2000
Less than 30 minutes to work,
2000
Baird 1623 1659 24% 54% 22% 41 98% 63% 10% 14% 643 33% 68% Balcones Heights 3016 3014 24% 64% 12% 32 86% 60% 13% 21% 1489 5% 68% Ballinger 4243 4002 28% 54% 18% 38 97% 70% 12% 17% 1558 70% 77% Balmorhea 527 480 32% 54% 14% 29 89% 79% 11% 36% 176 36% 68% Bandera 957 1114 23% 54% 23% 44 98% 62% 12% 15% 404 43% 61% Bangs 1620 1622 29% 54% 17% 39 99% 71% 10% 20% 604 28% 87% Bardwell 583 608 36% 56% 8% 28 78% 86% 0% 25% 232 3% 59% Barry 209 223 25% 54% 22% 37 91% 69% 7% 8% 92 8% 73% Barstow 406 389 30% 48% 22% 40 92% 93% 1% 39% 138 12% 75% Bartlett 1675 1687 29% 56% 15% 36 91% 71% 13% 26% 650 27% 56% Bartonville 1093 1323 28% 66% 6% 41 97% 28% 39% 4% 618 14% 34% Bastrop 5340 7006 27% 59% 13% 36 97% 46% 27% 12% 2638 43% 53% Bayou Vista 1644 1668 10% 75% 15% 48 96% 35% 23% 3% 1006 5% 54% Bayside 360 350 25% 61% 13% 41 99% 57% 18% 22% 158 19% 44% Bayview 323 405 29% 56% 15% 41 88% 41% 28% 11% 171 5% 53% Beach City 1645 1790 27% 66% 7% 40 100% 36% 22% 4% 780 5% 60% Bear Creek 360 377 31% 64% 5% 39 98% 20% 43% 2% 230 5% 35% Beasley 590 659 28% 59% 13% 36 97% 69% 7% 16% 257 9% 51% Beckville 752 750 30% 60% 10% 34 96% 62% 10% 23% 295 16% 56% Bee Cave 656 1308 37% 56% 6% 36 95% 20% 56% 0% 256 21% 51% Bellevue 386 394 25% 65% 10% 36 100% 70% 9% 19% 160 26% 65% Bellmead 9214 9636 29% 59% 12% 32 93% 65% 8% 20% 3870 13% 79% Bells 1190 1245 27% 58% 16% 35 100% 52% 11% 13% 584 12% 73% Bellville 3794 4253 28% 56% 16% 38 95% 49% 25% 8% 1715 41% 69% Benavides 1686 1605 25% 58% 17% 38 96% 66% 14% 29% 606 44% 55% Benjamin 264 245 41% 51% 9% 38 95% 48% 17% 14% 100 34% 78% Berryville 891 956 27% 62% 11% 39 99% 56% 9% 16% 395 5% 35% Bertram 1122 1284 27% 62% 11% 37 96% 72% 6% 8% 485 13% 43% Beverly Hills 2113 2095 28% 58% 14% 31 87% 69% 5% 13% 914 8% 87% Bevil Oaks 1346 1285 20% 63% 17% 44 98% 41% 23% 4% 682 3% 67% Big Lake 2885 2653 36% 55% 9% 32 84% 67% 10% 11% 1148 75% 79% Big Sandy 1288 1335 27% 54% 19% 36 98% 59% 16% 18% 549 28% 58% Big Wells 704 741 29% 56% 15% 40 95% 93% 2% 44% 185 50% 77% Bishop 3305 3243 29% 58% 13% 34 97% 58% 14% 14% 1260 20% 76% Bishop Hills 210 212 22% 59% 20% 46 99% 27% 40% 8% 91 7% 79% Blackwell 360 353 27% 49% 24% 40 99% 70% 11% 11% 132 22% 48% Blanco 1505 1615 29% 56% 15% 39 90% 63% 16% 13% 637 46% 62% Blanket 402 402 29% 57% 15% 39 99% 65% 12% 18% 197 16% 59% Bloomburg 375 370 22% 61% 17% 36 99% 70% 12% 18% 145 14% 66% Blooming Grove 833 890 26% 56% 18% 38 98% 64% 12% 18% 373 22% 50% Blossom 1439 1478 27% 59% 14% 35 95% 62% 9% 13% 644 12% 82% Blue Mound 2388 2375 29% 63% 8% 32 90% 69% 6% 7% 1171 5% 63% Blue Ridge 672 879 34% 55% 11% 30 99% 62% 8% 10% 285 15% 35% Blum 399 440 34% 54% 11% 31 98% 71% 4% 16% 168 18% 34% Boerne 6178 7395 27% 57% 16% 39 97% 39% 28% 10% 2571 45% 59% Bogata 1396 1314 24% 51% 25% 43 99% 70% 7% 20% 471 28% 57% Bonham 9990 10439 25% 57% 17% 36 95% 71% 11% 18% 2860 58% 72%

Texas’ small town data tables
35
Town Population 2000
Population 2004
% birth to 17, 2000
% 18 to 64,
2000 % 65+, 2000
Median age, 2000
Percent native Texan, 2000
High school or less,
2000
Bachelor or higher,
2000
Poverty rate, 2000
Total jobs, 2000
Work in
town, 2000
Less than 30 minutes to work,
2000
Bonney 384 426 31% 68% 1% 32 99% 45% 10% 3% 207 41% 75% Booker 1315 1323 33% 56% 11% 33 75% 59% 16% 20% 514 38% 82% Bovina 1874 1844 39% 53% 9% 28 65% 79% 7% 21% 642 25% 86% Bowie 5219 5470 26% 54% 20% 40 98% 64% 11% 14% 2086 56% 67% Boyd 1099 1281 30% 59% 11% 32 92% 64% 12% 21% 493 27% 46% Brackettville 1876 1837 33% 49% 17% 33 82% 80% 5% 33% 528 66% 76% Brady 5523 5446 28% 52% 20% 37 96% 69% 12% 23% 2051 73% 84% Brazoria 2787 2887 32% 57% 12% 33 96% 61% 6% 13% 1151 17% 63% Breckenridge 5868 5628 30% 56% 14% 35 90% 59% 12% 19% 2551 66% 80% Bremond 876 894 29% 52% 18% 40 100% 72% 8% 19% 335 20% 54% Briarcliff 895 847 20% 71% 9% 41 95% 21% 37% 4% 574 16% 24% Briaroaks 493 531 24% 60% 16% 45 99% 30% 33% 7% 263 11% 34% Bridge City 8651 8729 26% 61% 13% 36 97% 52% 9% 10% 3821 25% 75% Bridgeport 4309 5404 32% 57% 11% 33 85% 66% 13% 17% 1717 44% 68% Broaddus 189 187 28% 46% 26% 35 100% 62% 15% 19% 46 50% 61% Bronte 1076 1013 28% 49% 23% 41 99% 60% 16% 15% 396 47% 63% Brookshire 3450 3572 32% 58% 10% 29 84% 69% 11% 19% 1419 24% 63% Brookside Village 1960 2029 24% 62% 14% 37 77% 61% 13% 16% 921 6% 52% Browndell 219 222 26% 61% 13% 38 100% 79% 4% 14% 84 0% 74% Brownfield 9488 9302 29% 55% 16% 35 95% 70% 9% 26% 3374 68% 78% Brownsboro 796 850 33% 54% 13% 32 99% 57% 16% 22% 328 22% 51% Bruceville-Eddy 1490 1544 30% 59% 10% 35 97% 63% 5% 12% 673 15% 63% Bryson 528 534 29% 59% 12% 38 100% 68% 9% 17% 237 20% 78% Buckholts 387 404 28% 54% 19% 35 93% 73% 8% 17% 146 14% 50% Buda 2404 3724 28% 65% 8% 32 97% 43% 24% 4% 1307 7% 45% Buffalo 1804 1886 30% 58% 11% 33 88% 72% 10% 23% 757 41% 72% Buffalo Gap 463 449 25% 57% 18% 43 98% 58% 12% 13% 180 23% 77% Buffalo Springs 493 487 17% 66% 18% 45 100% 49% 17% 7% 240 2% 82% Bullard 1150 1466 30% 60% 10% 33 99% 44% 16% 7% 533 16% 65% Bulverde 3761 4221 29% 61% 10% 40 97% 34% 28% 2% 1913 11% 34% Bunker Hill Village 3654 3722 30% 54% 17% 44 88% 6% 81% 3% 1326 7% 71% Burke 315 320 22% 63% 14% 31 93% 66% 5% 14% 126 2% 77% Burnet 4735 5415 26% 54% 20% 37 96% 68% 8% 15% 1753 48% 71% Burton 359 364 26% 56% 18% 40 97% 48% 25% 8% 166 33% 83% Byers 517 526 23% 63% 14% 42 99% 63% 14% 9% 268 29% 45% Bynum 225 244 31% 51% 18% 32 98% 73% 11% 33% 69 16% 77% Cactus 2538 2630 42% 54% 3% 22 44% 95% 1% 22% 880 61% 90% Caddo Mills 1149 1210 28% 59% 14% 35 99% 64% 10% 9% 530 17% 60% Caldwell 3449 3804 26% 57% 17% 34 94% 62% 18% 18% 1545 47% 57% Callisburg 365 390 29% 57% 14% 33 98% 59% 7% 11% 163 10% 58% Calvert 1426 1402 30% 53% 18% 38 94% 72% 13% 37% 458 30% 53% Cameron 5634 5863 29% 54% 17% 37 91% 66% 13% 22% 2186 61% 72% Camp Wood 822 806 32% 56% 11% 40 96% 69% 9% 34% 273 53% 69% Campbell 734 780 29% 56% 15% 38 100% 66% 11% 9% 342 13% 67% Canadian 2233 2202 28% 58% 14% 38 91% 55% 18% 14% 1027 64% 83% Caney City 236 258 8% 55% 37% 46 100% 63% 0% 37% 33 27% 27% Canton 3292 3543 21% 53% 26% 42 98% 59% 18% 11% 1264 48% 52%

Texas’ small town data tables
36
Town Population 2000
Population 2004
% birth to 17, 2000
% 18 to 64,
2000 % 65+, 2000
Median age, 2000
Percent native Texan, 2000
High school or less,
2000
Bachelor or higher,
2000
Poverty rate, 2000
Total jobs, 2000
Work in
town, 2000
Less than 30 minutes to work,
2000
Carbon 224 227 24% 64% 12% 45 96% 64% 11% 9% 111 28% 82% Carl's Corner 134 154 26% 64% 10% 37 100% 80% 0% 6% 80 0% 61% Carmine 228 232 26% 49% 25% 43 91% 64% 19% 15% 99 23% 65% Carrizo Springs 5655 5576 33% 53% 14% 31 91% 74% 10% 34% 1777 67% 80% Carthage 6664 6713 27% 56% 18% 37 96% 52% 20% 13% 2588 56% 75% Castle Hills 4202 4191 19% 46% 35% 51 94% 25% 43% 6% 1612 17% 81% Castroville 2664 2900 27% 60% 13% 37 97% 44% 25% 9% 1242 22% 53% Celeste 817 852 32% 57% 11% 33 99% 59% 12% 16% 362 19% 60% Celina 1861 2979 29% 59% 12% 33 86% 62% 12% 13% 831 29% 53% Center 5678 5713 27% 58% 15% 36 86% 69% 11% 24% 2053 74% 83% Centerville 903 937 29% 51% 19% 44 100% 67% 13% 19% 314 49% 69% Chandler 2099 2380 24% 58% 18% 39 99% 44% 21% 10% 890 15% 65% Channing 356 351 25% 63% 12% 40 99% 57% 17% 5% 177 36% 77% Charlotte 1637 1786 34% 54% 11% 30 94% 86% 3% 30% 581 34% 57% Chester 265 264 24% 62% 14% 33 98% 57% 10% 6% 111 13% 65% Chico 947 1052 31% 58% 11% 35 97% 74% 7% 14% 393 24% 70% Childress 6778 6575 28% 55% 17% 36 95% 68% 8% 19% 2122 74% 92% Chillicothe 798 747 30% 53% 16% 35 96% 69% 10% 17% 328 27% 91% China 1112 1087 26% 58% 16% 39 99% 70% 8% 15% 466 7% 65% China Grove 1247 1283 28% 61% 11% 40 99% 43% 21% 3% 655 5% 66% Chireno 405 408 22% 60% 18% 36 95% 65% 13% 24% 170 27% 63% Christine 436 482 44% 47% 10% 30 83% 92% 2% 38% 163 11% 51% Cibolo 3035 5847 32% 63% 5% 35 96% 30% 28% 6% 1573 5% 65% Cisco 3851 3798 26% 55% 19% 38 98% 60% 12% 22% 1595 50% 76% Clarendon 1974 2034 27% 54% 19% 38 98% 45% 18% 15% 824 67% 78% Clarksville 3883 3652 27% 55% 18% 37 95% 70% 10% 24% 1573 67% 76% Clarksville City 806 835 28% 63% 9% 39 98% 55% 8% 11% 410 11% 71% Claude 1313 1321 28% 57% 15% 41 99% 51% 19% 13% 598 39% 54% Clear Lake Shores 1205 1254 17% 74% 9% 45 95% 23% 42% 4% 716 8% 47% Cleveland 7605 8053 30% 56% 15% 33 89% 73% 7% 22% 2512 42% 53% Clifton 3542 3639 29% 52% 19% 42 93% 55% 17% 13% 1291 62% 77% Clint 980 982 26% 62% 12% 38 83% 60% 13% 20% 456 23% 64% Clyde 3345 3606 28% 55% 17% 37 99% 54% 13% 8% 1389 23% 74% Coahoma 932 925 30% 53% 16% 37 99% 60% 9% 9% 382 20% 84% Cockrell Hill 4443 4317 37% 57% 6% 25 56% 81% 5% 18% 1573 3% 54% Coffee City 193 204 14% 69% 16% 46 97% 52% 11% 23% 89 7% 55% Coldspring 691 760 32% 49% 19% 34 99% 70% 13% 20% 256 34% 62% Coleman 5127 4880 24% 53% 23% 41 96% 72% 9% 24% 1932 73% 78% Collinsville 1235 1419 27% 58% 14% 37 96% 58% 8% 10% 559 19% 43% Colmesneil 638 639 27% 58% 14% 38 98% 67% 9% 17% 257 34% 67% Colorado City 4281 3964 29% 55% 17% 37 95% 69% 11% 21% 1640 60% 80% Columbus 3916 3919 23% 57% 20% 40 90% 68% 17% 20% 1463 58% 71% Comanche 4482 4274 30% 50% 20% 36 93% 67% 11% 20% 1667 59% 67% Combes 2553 2846 36% 52% 12% 31 88% 72% 5% 22% 900 6% 77% Combine 1788 2010 29% 64% 7% 38 99% 55% 13% 5% 923 7% 39% Commerce 7669 8669 25% 64% 10% 25 92% 43% 31% 23% 3588 48% 79% Como 621 644 30% 58% 11% 33 82% 78% 5% 23% 256 13% 67%

Texas’ small town data tables
37
Town Population 2000
Population 2004
% birth to 17, 2000
% 18 to 64,
2000 % 65+, 2000
Median age, 2000
Percent native Texan, 2000
High school or less,
2000
Bachelor or higher,
2000
Poverty rate, 2000
Total jobs, 2000
Work in
town, 2000
Less than 30 minutes to work,
2000
Cool 162 179 25% 57% 18% 41 96% 61% 8% 21% 70 12% 67% Coolidge 848 882 31% 57% 12% 30 81% 71% 7% 25% 353 35% 72% Cooper 2150 2189 27% 55% 19% 38 99% 65% 14% 25% 754 39% 60% Copper Canyon 1216 1309 30% 63% 7% 40 98% 29% 44% 2% 573 12% 36% Corral City 89 99 36% 64% 0% 29 94% 44% 0% 25% 23 43% 74% Corrigan 1721 1927 31% 55% 13% 32 93% 74% 8% 32% 534 40% 68% Cottonwood 181 198 31% 59% 10% 36 99% 59% 12% 13% 81 0% 22% Cottonwood Shores 877 1048 29% 60% 11% 34 95% 66% 10% 10% 407 4% 70% Cotulla 3614 3615 33% 53% 14% 32 96% 75% 7% 30% 1304 59% 76% Cove 323 319 23% 67% 10% 36 100% 59% 8% 11% 168 4% 49% Covington 282 305 24% 59% 17% 35 99% 63% 8% 10% 135 10% 36% Crandall 2774 3314 34% 59% 7% 31 97% 53% 15% 3% 1454 13% 40% Crane 3191 3056 34% 56% 10% 33 86% 63% 13% 13% 1157 58% 72% Cranfills Gap 335 351 35% 50% 16% 40 94% 68% 5% 14% 127 17% 45% Crawford 705 788 35% 55% 11% 35 94% 56% 14% 6% 366 13% 71% Creedmoor 211 189 29% 55% 16% 39 93% 76% 9% 4% 89 1% 55% Crockett 7141 7054 30% 53% 17% 35 93% 68% 10% 34% 2288 69% 82% Crosbyton 1874 1744 31% 54% 15% 36 96% 69% 13% 28% 694 54% 76% Cross Plains 1068 1103 22% 55% 23% 42 98% 72% 8% 23% 400 51% 66% Cross Roads 603 640 17% 68% 15% 42 96% 39% 27% 4% 306 12% 45% Cross Timber 277 298 19% 75% 6% 41 100% 47% 19% 4% 140 6% 24% Crowell 1141 1087 26% 52% 22% 40 99% 69% 9% 16% 457 64% 69% Crowley 7467 9337 31% 60% 8% 34 98% 50% 14% 7% 3594 11% 52% Crystal City 7190 7173 34% 52% 14% 29 88% 76% 8% 44% 1667 70% 82% Cuero 6571 6725 28% 55% 18% 38 99% 69% 11% 27% 2582 73% 81% Cumby 616 636 22% 60% 18% 39 97% 67% 14% 12% 292 23% 54% Cuney 145 148 35% 46% 19% 39 100% 71% 8% 37% 55 18% 69% Cushing 637 652 25% 60% 14% 40 97% 67% 11% 17% 228 24% 51% Cut and Shoot 1158 1249 30% 60% 10% 35 97% 67% 10% 9% 476 7% 53% Daingerfield 2517 2501 29% 55% 16% 37 97% 54% 14% 23% 971 36% 71% Daisetta 1034 1093 30% 57% 13% 33 100% 73% 8% 15% 377 8% 54% Dalhart 7237 7127 30% 58% 12% 34 94% 60% 15% 12% 3261 64% 87% Dalworthington Gardens 2186 2347 29% 62% 9% 40 95% 24% 46% 2% 1140 9% 65%
Danbury 1611 1658 33% 61% 7% 32 94% 54% 9% 8% 762 10% 59% Darrouzett 303 299 25% 50% 25% 43 100% 54% 20% 11% 150 34% 70% Dawson 852 897 28% 52% 20% 40 96% 61% 11% 21% 305 23% 54% Dayton 5709 6529 31% 59% 10% 33 97% 57% 14% 21% 2479 31% 60% Dayton Lakes 101 106 38% 57% 5% 37 100% 77% 0% 27% 35 28% 28% De Kalb 1769 1793 27% 51% 22% 42 100% 65% 13% 28% 622 36% 67% De Leon 2433 2367 30% 52% 17% 38 93% 69% 13% 26% 888 48% 74% Dean 341 350 32% 59% 9% 39 99% 71% 7% 8% 158 6% 78% Decatur 5201 5907 28% 58% 14% 34 86% 59% 15% 12% 2242 50% 64% Dell City 413 409 34% 52% 14% 37 63% 82% 4% 29% 191 74% 93% Denver City 3985 3967 34% 56% 10% 34 85% 70% 8% 19% 1579 59% 82% Deport 718 700 21% 56% 23% 43 100% 72% 11% 16% 226 23% 75% Detroit 776 745 29% 55% 16% 34 99% 65% 6% 24% 294 23% 64% Devers 416 438 35% 56% 9% 34 89% 71% 9% 23% 111 15% 53%

Texas’ small town data tables
38
Town Population 2000
Population 2004
% birth to 17, 2000
% 18 to 64,
2000 % 65+, 2000
Median age, 2000
Percent native Texan, 2000
High school or less,
2000
Bachelor or higher,
2000
Poverty rate, 2000
Total jobs, 2000
Work in
town, 2000
Less than 30 minutes to work,
2000
Devine 4140 4336 31% 56% 14% 34 97% 68% 13% 20% 1808 38% 55% Diboll 5470 5461 34% 57% 9% 32 85% 74% 8% 26% 1682 41% 82% Dickens 332 326 27% 54% 19% 39 100% 73% 7% 21% 143 38% 70% Dilley 3674 4204 36% 52% 11% 29 96% 70% 6% 36% 955 52% 78% Dimmitt 4375 4016 34% 54% 13% 32 90% 67% 15% 23% 1694 62% 81% Dodd City 419 435 31% 57% 12% 35 100% 68% 11% 16% 189 14% 67% Dodson 115 110 18% 59% 24% 46 96% 72% 7% 33% 51 18% 76% Domino 52 52 19% 66% 15% 46 100% 52% 7% 16% 33 3% 82% Dorchester 109 114 37% 56% 6% 35 100% 61% 19% 8% 58 14% 46% Double Oak 2179 2641 29% 65% 6% 39 97% 19% 51% 1% 1091 11% 40% Douglassville 175 171 31% 56% 14% 41 100% 53% 20% 9% 86 14% 57% Dripping Springs 1548 1664 30% 60% 10% 36 91% 50% 23% 11% 838 26% 52% Driscoll 825 828 28% 61% 11% 31 93% 77% 5% 14% 298 17% 54% Dublin 3754 3707 34% 51% 16% 32 81% 67% 18% 31% 1287 40% 77% Eagle Lake 3664 3718 32% 54% 14% 34 84% 72% 11% 20% 1443 37% 68% Early 2588 2742 29% 56% 16% 36 98% 55% 18% 13% 1168 23% 90% Earth 1109 1083 32% 54% 14% 34 93% 71% 10% 27% 434 31% 71% East Mountain 580 614 24% 61% 16% 41 98% 61% 8% 10% 255 1% 71% East Tawakoni 775 950 17% 64% 19% 45 97% 61% 8% 8% 311 5% 31% Eastland 3769 3831 28% 54% 19% 38 93% 60% 11% 17% 1585 56% 86% Easton 524 552 41% 50% 9% 31 91% 68% 10% 19% 220 5% 42% Ector 600 622 33% 52% 14% 35 98% 58% 13% 6% 309 18% 66% Edcouch 3342 4447 37% 55% 9% 26 79% 79% 5% 48% 907 24% 64% Eden 2561 2448 27% 56% 17% 34 99% 75% 12% 16% 494 67% 82% Edgecliff Village 2550 2541 20% 59% 20% 47 95% 33% 27% 6% 1243 3% 68% Edgewood 1348 1440 27% 55% 19% 37 99% 60% 13% 17% 506 22% 46% Edmonson 123 123 24% 66% 10% 30 93% 64% 7% 14% 57 28% 88% Edna 5899 5887 28% 55% 16% 35 94% 65% 12% 21% 2246 46% 65% Edom 322 347 32% 52% 16% 40 97% 64% 12% 13% 154 12% 38% El Cenizo 3545 3661 49% 47% 4% 19 58% 94% 1% 68% 572 11% 19% El Lago 3075 2998 23% 63% 14% 41 94% 17% 57% 3% 1661 7% 69% Eldorado 1951 1838 32% 53% 15% 36 83% 69% 11% 26% 748 63% 76% Electra 3168 3001 27% 55% 17% 38 99% 68% 8% 21% 1306 44% 63% Elgin 5700 8007 30% 59% 12% 32 84% 67% 15% 16% 2637 31% 45% Elkhart 1215 1247 27% 56% 17% 42 99% 64% 10% 20% 479 32% 79% Elmendorf 664 707 34% 56% 10% 34 94% 79% 6% 30% 249 4% 38% Elsa 5549 6369 33% 54% 13% 28 82% 76% 7% 38% 1519 21% 73% Emhouse 159 172 37% 48% 15% 35 80% 77% 10% 1% 48 4% 79% Emory 1021 1252 28% 53% 19% 38 99% 68% 13% 14% 425 36% 58% Enchanted Oaks 357 404 23% 46% 31% 56 98% 39% 19% 7% 189 23% 42% Encinal 629 643 30% 56% 14% 31 94% 90% 2% 38% 143 34% 59% Estelline 168 169 24% 59% 17% 39 87% 63% 14% 22% 65 10% 84% Eureka 340 368 29% 58% 13% 37 100% 57% 15% 6% 173 3% 58% Eustace 798 871 27% 60% 13% 34 100% 42% 16% 10% 473 8% 53% Evant 393 388 32% 47% 21% 36 87% 69% 8% 25% 150 32% 62% Everman 5836 5794 31% 60% 9% 32 90% 57% 8% 10% 2580 9% 64% Fair Oaks Ranch 4695 5527 24% 62% 14% 46 97% 12% 59% 2% 2310 10% 44%
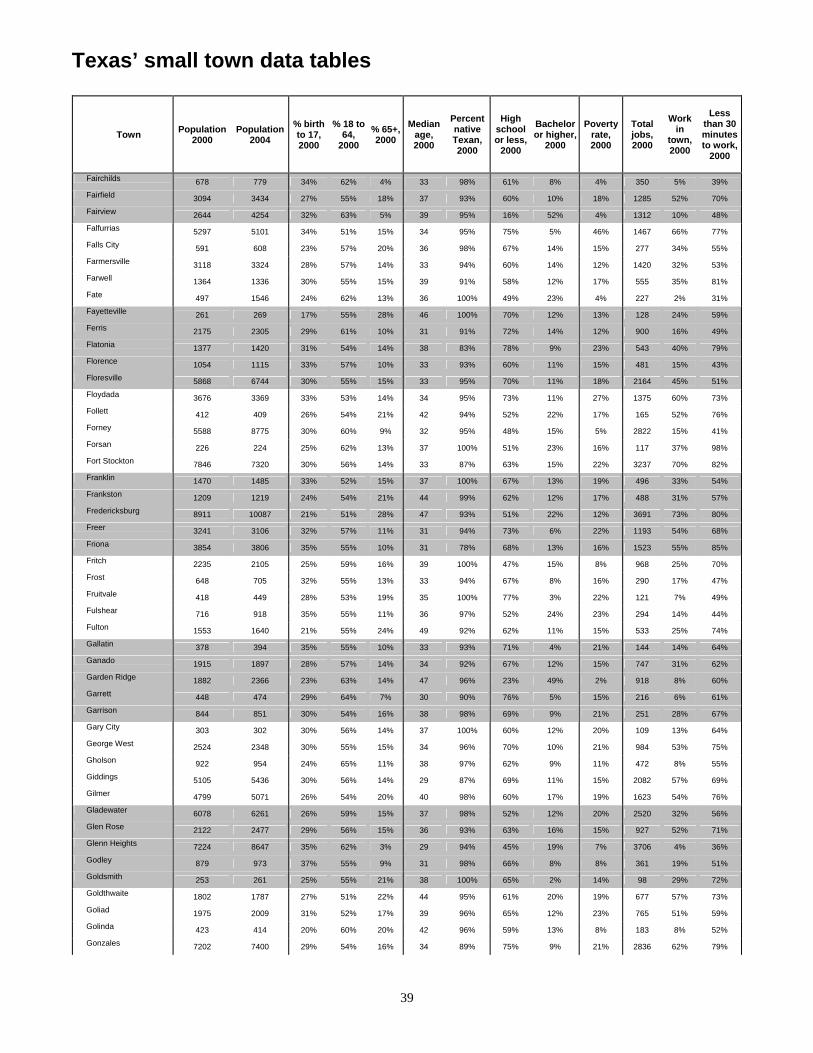
Texas’ small town data tables
39
Town Population 2000
Population 2004
% birth to 17, 2000
% 18 to 64,
2000 % 65+, 2000
Median age, 2000
Percent native Texan, 2000
High school or less,
2000
Bachelor or higher,
2000
Poverty rate, 2000
Total jobs, 2000
Work in
town, 2000
Less than 30 minutes to work,
2000
Fairchilds 678 779 34% 62% 4% 33 98% 61% 8% 4% 350 5% 39% Fairfield 3094 3434 27% 55% 18% 37 93% 60% 10% 18% 1285 52% 70% Fairview 2644 4254 32% 63% 5% 39 95% 16% 52% 4% 1312 10% 48% Falfurrias 5297 5101 34% 51% 15% 34 95% 75% 5% 46% 1467 66% 77% Falls City 591 608 23% 57% 20% 36 98% 67% 14% 15% 277 34% 55% Farmersville 3118 3324 28% 57% 14% 33 94% 60% 14% 12% 1420 32% 53% Farwell 1364 1336 30% 55% 15% 39 91% 58% 12% 17% 555 35% 81% Fate 497 1546 24% 62% 13% 36 100% 49% 23% 4% 227 2% 31% Fayetteville 261 269 17% 55% 28% 46 100% 70% 12% 13% 128 24% 59% Ferris 2175 2305 29% 61% 10% 31 91% 72% 14% 12% 900 16% 49% Flatonia 1377 1420 31% 54% 14% 38 83% 78% 9% 23% 543 40% 79% Florence 1054 1115 33% 57% 10% 33 93% 60% 11% 15% 481 15% 43% Floresville 5868 6744 30% 55% 15% 33 95% 70% 11% 18% 2164 45% 51% Floydada 3676 3369 33% 53% 14% 34 95% 73% 11% 27% 1375 60% 73% Follett 412 409 26% 54% 21% 42 94% 52% 22% 17% 165 52% 76% Forney 5588 8775 30% 60% 9% 32 95% 48% 15% 5% 2822 15% 41% Forsan 226 224 25% 62% 13% 37 100% 51% 23% 16% 117 37% 98% Fort Stockton 7846 7320 30% 56% 14% 33 87% 63% 15% 22% 3237 70% 82% Franklin 1470 1485 33% 52% 15% 37 100% 67% 13% 19% 496 33% 54% Frankston 1209 1219 24% 54% 21% 44 99% 62% 12% 17% 488 31% 57% Fredericksburg 8911 10087 21% 51% 28% 47 93% 51% 22% 12% 3691 73% 80% Freer 3241 3106 32% 57% 11% 31 94% 73% 6% 22% 1193 54% 68% Friona 3854 3806 35% 55% 10% 31 78% 68% 13% 16% 1523 55% 85% Fritch 2235 2105 25% 59% 16% 39 100% 47% 15% 8% 968 25% 70% Frost 648 705 32% 55% 13% 33 94% 67% 8% 16% 290 17% 47% Fruitvale 418 449 28% 53% 19% 35 100% 77% 3% 22% 121 7% 49% Fulshear 716 918 35% 55% 11% 36 97% 52% 24% 23% 294 14% 44% Fulton 1553 1640 21% 55% 24% 49 92% 62% 11% 15% 533 25% 74% Gallatin 378 394 35% 55% 10% 33 93% 71% 4% 21% 144 14% 64% Ganado 1915 1897 28% 57% 14% 34 92% 67% 12% 15% 747 31% 62% Garden Ridge 1882 2366 23% 63% 14% 47 96% 23% 49% 2% 918 8% 60% Garrett 448 474 29% 64% 7% 30 90% 76% 5% 15% 216 6% 61% Garrison 844 851 30% 54% 16% 38 98% 69% 9% 21% 251 28% 67% Gary City 303 302 30% 56% 14% 37 100% 60% 12% 20% 109 13% 64% George West 2524 2348 30% 55% 15% 34 96% 70% 10% 21% 984 53% 75% Gholson 922 954 24% 65% 11% 38 97% 62% 9% 11% 472 8% 55% Giddings 5105 5436 30% 56% 14% 29 87% 69% 11% 15% 2082 57% 69% Gilmer 4799 5071 26% 54% 20% 40 98% 60% 17% 19% 1623 54% 76% Gladewater 6078 6261 26% 59% 15% 37 98% 52% 12% 20% 2520 32% 56% Glen Rose 2122 2477 29% 56% 15% 36 93% 63% 16% 15% 927 52% 71% Glenn Heights 7224 8647 35% 62% 3% 29 94% 45% 19% 7% 3706 4% 36% Godley 879 973 37% 55% 9% 31 98% 66% 8% 8% 361 19% 51% Goldsmith 253 261 25% 55% 21% 38 100% 65% 2% 14% 98 29% 72% Goldthwaite 1802 1787 27% 51% 22% 44 95% 61% 20% 19% 677 57% 73% Goliad 1975 2009 31% 52% 17% 39 96% 65% 12% 23% 765 51% 59% Golinda 423 414 20% 60% 20% 42 96% 59% 13% 8% 183 8% 52% Gonzales 7202 7400 29% 54% 16% 34 89% 75% 9% 21% 2836 62% 79%

Texas’ small town data tables
40
Town Population 2000
Population 2004
% birth to 17, 2000
% 18 to 64,
2000 % 65+, 2000
Median age, 2000
Percent native Texan, 2000
High school or less,
2000
Bachelor or higher,
2000
Poverty rate, 2000
Total jobs, 2000
Work in
town, 2000
Less than 30 minutes to work,
2000
Goodlow 264 281 30% 55% 16% 34 100% 83% 3% 30% 76 3% 41% Goodrich 243 276 33% 57% 11% 36 96% 66% 7% 35% 107 4% 76% Gordon 451 461 24% 57% 19% 41 98% 60% 14% 13% 212 36% 61% Goree 321 295 28% 51% 21% 36 83% 81% 5% 32% 121 23% 83% Gorman 1236 1269 30% 51% 19% 38 86% 70% 9% 16% 465 49% 67% Graford 578 598 31% 57% 12% 34 99% 71% 9% 12% 258 21% 69% Graham 8716 8680 26% 55% 19% 39 94% 59% 13% 17% 3654 78% 83% Granbury 5718 6814 23% 56% 21% 42 96% 48% 20% 10% 2491 53% 66% Grand Saline 3028 3190 28% 56% 16% 36 90% 74% 7% 19% 1106 31% 62% Grandfalls 391 375 31% 54% 16% 34 92% 75% 7% 24% 125 42% 70% Grandview 1358 1550 30% 56% 13% 34 96% 66% 13% 16% 527 27% 46% Granger 1299 1314 33% 53% 14% 37 90% 71% 8% 12% 530 15% 49% Granite Shoals 2040 2286 23% 58% 19% 40 92% 56% 13% 14% 862 13% 65% Granjeno 313 316 28% 58% 14% 30 88% 73% 0% 52% 68 0% 64% Grapeland 1451 1427 26% 53% 21% 42 99% 67% 7% 24% 488 36% 69% Grays Prairie 296 330 26% 65% 9% 35 100% 64% 9% 1% 136 8% 29% Gregory 2318 2274 33% 57% 10% 30 95% 78% 4% 19% 887 11% 74% Grey Forest 418 440 20% 64% 16% 44 98% 29% 37% 2% 258 16% 49% Groesbeck 4291 4352 29% 56% 15% 32 95% 64% 9% 21% 1394 49% 70% Groom 587 578 27% 52% 21% 40 100% 49% 16% 13% 262 37% 59% Groveton 1107 1142 27% 52% 21% 39 93% 74% 9% 27% 345 44% 58% Gruver 1162 1118 32% 54% 14% 35 81% 56% 21% 16% 515 47% 78% Gun Barrel City 5145 5901 21% 56% 24% 43 99% 68% 8% 15% 2110 22% 53% Gunter 1230 1518 34% 58% 8% 35 86% 59% 14% 8% 460 22% 45% Gustine 457 444 20% 63% 17% 38 94% 69% 5% 21% 227 22% 71% Hackberry 544 471 30% 64% 5% 29 74% 89% 2% 9% 249 5% 36% Hale Center 2263 2185 35% 51% 14% 33 94% 70% 13% 19% 852 26% 83% Hallettsville 2345 2482 28% 53% 19% 40 98% 63% 12% 17% 1017 59% 80% Hallsburg 518 536 28% 59% 13% 38 97% 50% 15% 6% 269 6% 62% Hallsville 2772 2840 32% 59% 9% 33 99% 41% 21% 7% 1248 14% 77% Hamilton 2977 2919 26% 53% 21% 41 98% 62% 12% 16% 1181 65% 76% Hamlin 2248 2071 28% 52% 20% 41 96% 66% 8% 21% 930 50% 76% Happy 647 617 26% 57% 18% 38 98% 53% 17% 13% 285 13% 67% Hardin 755 799 25% 62% 14% 38 98% 59% 15% 9% 327 15% 47% Hart 1198 1108 36% 53% 11% 28 81% 78% 8% 17% 432 35% 71% Haskell 3106 2812 26% 51% 23% 43 96% 67% 13% 29% 1158 63% 78% Haslet 1134 1415 29% 65% 6% 38 96% 33% 24% 3% 620 14% 50% Hawk Cove 457 496 26% 52% 22% 40 100% 75% 4% 10% 144 0% 19% Hawkins 1331 1441 26% 57% 17% 39 100% 44% 20% 17% 562 26% 55% Hawley 646 617 28% 61% 10% 34 100% 61% 11% 13% 345 19% 76% Hays 233 243 22% 70% 7% 44 98% 42% 21% 3% 161 2% 37% Hearne 4690 4687 34% 52% 15% 32 95% 78% 8% 31% 1488 37% 55% Heath 4149 6115 32% 59% 9% 39 95% 25% 47% 4% 1768 9% 34% Hebron 874 158 40% 58% 3% 34 91% 12% 70% 0% 403 14% 34% Hedley 379 385 31% 49% 20% 42 100% 73% 10% 20% 139 26% 79% Hedwig Village 2334 2308 27% 58% 15% 41 81% 14% 66% 5% 1099 9% 67% Helotes 4285 5852 29% 61% 10% 39 95% 24% 43% 2% 2163 10% 54%

Texas’ small town data tables
41
Town Population 2000
Population 2004
% birth to 17, 2000
% 18 to 64,
2000 % 65+, 2000
Median age, 2000
Percent native Texan, 2000
High school or less,
2000
Bachelor or higher,
2000
Poverty rate, 2000
Total jobs, 2000
Work in
town, 2000
Less than 30 minutes to work,
2000
Hemphill 1106 1072 26% 54% 19% 39 97% 63% 13% 21% 392 56% 81% Hempstead 4691 6264 29% 60% 11% 29 85% 63% 16% 30% 1759 34% 72% Henrietta 3264 3321 26% 56% 17% 39 99% 56% 15% 12% 1528 41% 67% Hickory Creek 2078 2849 24% 69% 7% 40 96% 38% 25% 4% 1197 6% 46% Hico 1341 1337 27% 53% 20% 40 94% 65% 12% 19% 508 43% 67% Hidalgo 7322 10073 39% 54% 7% 25 57% 78% 6% 44% 2134 25% 76% Higgins 425 432 21% 52% 26% 48 100% 65% 16% 21% 206 38% 66% Highland Haven 450 501 9% 44% 47% 64 99% 39% 25% 1% 135 16% 66% Highland Park 8842 8810 27% 58% 15% 42 96% 5% 75% 3% 3848 14% 79% Hill Country Village 1028 1075 26% 60% 14% 45 93% 13% 66% 5% 449 12% 71% Hillcrest 722 731 28% 57% 14% 44 99% 28% 36% 5% 327 3% 52% Hillsboro 8232 8905 28% 56% 16% 32 85% 68% 13% 22% 3015 68% 79% Hilshire Village 720 727 24% 60% 16% 46 92% 16% 60% 3% 365 13% 74% Hitchcock 6386 7147 29% 58% 13% 36 96% 63% 8% 19% 2507 12% 57% Holiday Lakes 1095 1129 39% 55% 6% 29 78% 79% 3% 16% 386 3% 48% Holland 1102 1084 35% 55% 10% 29 96% 67% 8% 30% 427 12% 54% Holliday 1632 1711 29% 58% 13% 35 100% 59% 14% 13% 782 17% 73% Hollywood Park 2983 3179 17% 53% 30% 49 97% 16% 48% 3% 1255 10% 57% Hondo 7897 8481 31% 55% 14% 30 97% 74% 7% 23% 2516 60% 71% Honey Grove 1746 1807 27% 55% 18% 39 94% 64% 12% 16% 664 34% 59% Hooks 2973 2931 26% 59% 15% 35 100% 58% 10% 17% 1300 17% 77% Horizon City 5233 7797 33% 58% 9% 32 83% 43% 19% 10% 2289 10% 61% Howardwick 437 452 15% 57% 28% 54 100% 59% 13% 16% 171 11% 62% Howe 2478 2679 32% 59% 10% 31 98% 47% 10% 12% 1214 11% 69% Hubbard 1586 1681 30% 54% 17% 39 99% 58% 14% 25% 636 32% 46% Hudson 3792 3965 34% 60% 6% 30 93% 62% 12% 13% 1661 6% 83% Hudson Oaks 1637 1806 32% 59% 9% 39 98% 34% 36% 4% 787 7% 55% Hughes Springs 1856 1867 27% 53% 19% 35 98% 68% 10% 23% 645 31% 74% Hunters Creek Village 4374 4462 31% 53% 16% 43 90% 8% 76% 1% 1661 14% 66% Huntington 2068 2074 31% 59% 9% 32 98% 66% 8% 23% 874 24% 78% Hutchins 2805 2852 30% 63% 8% 31 88% 69% 5% 15% 1122 16% 55% Hutto 1250 5588 30% 62% 8% 29 94% 48% 15% 5% 669 14% 47% Huxley 298 315 14% 51% 34% 56 100% 67% 8% 10% 105 10% 41% Idalou 2157 2097 29% 57% 14% 37 98% 60% 17% 11% 1010 23% 81% Impact 39 38 21% 48% 30% 25 73% 83% 9% 36% 14 0% 45% Indian Lake 541 571 19% 50% 32% 46 85% 64% 14% 14% 138 2% 62% Industry 304 330 27% 56% 17% 38 84% 60% 17% 22% 138 19% 46% Ingleside 9388 9156 32% 61% 7% 28 96% 49% 14% 10% 3079 53% 78% Ingleside on the Bay 659 651 25% 63% 11% 43 97% 37% 25% 12% 274 6% 57% Ingram 1740 1817 30% 61% 9% 35 94% 64% 11% 13% 810 18% 82% Iowa Colony 804 903 28% 62% 10% 36 91% 54% 13% 6% 346 7% 27% Iowa Park 6431 6222 28% 59% 13% 37 99% 60% 11% 10% 3281 26% 82% Iraan 1238 1179 34% 54% 12% 33 88% 60% 15% 7% 594 69% 87% Iredell 360 376 27% 55% 18% 38 99% 66% 15% 24% 166 17% 34% Italy 1993 2092 34% 56% 10% 32 96% 59% 14% 9% 865 18% 48% Itasca 1503 1603 28% 55% 16% 36 89% 66% 10% 20% 605 29% 65% Jacksboro 4533 4570 28% 56% 16% 35 97% 61% 13% 15% 1509 61% 67%

Texas’ small town data tables
42
Town Population 2000
Population 2004
% birth to 17, 2000
% 18 to 64,
2000 % 65+, 2000
Median age, 2000
Percent native Texan, 2000
High school or less,
2000
Bachelor or higher,
2000
Poverty rate, 2000
Total jobs, 2000
Work in
town, 2000
Less than 30 minutes to work,
2000
Jamaica Beach 1075 1105 19% 65% 16% 42 96% 23% 37% 7% 567 10% 53% Jasper 8247 7540 30% 55% 15% 35 96% 65% 12% 28% 2777 65% 78% Jayton 513 446 19% 59% 22% 50 100% 57% 15% 9% 215 68% 87% Jefferson 2024 2011 23% 52% 25% 45 100% 57% 12% 33% 750 55% 71% Jersey Village 6880 7162 22% 70% 7% 38 92% 23% 44% 5% 4183 10% 52% Jewett 861 908 33% 55% 12% 31 88% 77% 7% 26% 344 30% 74% Joaquin 925 940 30% 56% 14% 35 100% 64% 11% 25% 312 23% 69% Johnson City 1191 1437 30% 57% 13% 37 95% 58% 16% 12% 573 47% 62% Jolly 188 191 18% 71% 11% 43 100% 61% 12% 2% 103 9% 76% Jones Creek 2130 2153 27% 61% 11% 37 95% 57% 10% 11% 949 7% 74% Jonestown 1681 1770 27% 66% 7% 37 96% 46% 19% 7% 895 10% 34% Josephine 594 719 32% 60% 8% 36 98% 67% 10% 12% 271 8% 38% Joshua 4528 5376 32% 61% 8% 33 96% 54% 15% 6% 2174 10% 50% Jourdanton 3732 4165 34% 55% 11% 31 96% 72% 6% 13% 1660 23% 62% Junction 2618 2641 29% 53% 17% 38 93% 71% 11% 22% 1071 75% 83% Justin 1891 2664 29% 62% 10% 36 97% 47% 21% 8% 903 16% 48% Karnes City 3457 3439 31% 51% 18% 33 94% 74% 11% 27% 1011 47% 74% Kaufman 6490 7769 30% 59% 11% 30 86% 65% 13% 16% 2731 35% 50% Keene 5003 5731 25% 61% 14% 28 77% 38% 28% 10% 2308 39% 64% Kemah 2330 2377 28% 64% 9% 31 84% 42% 28% 8% 1223 19% 54% Kemp 1133 1233 29% 54% 17% 38 98% 66% 10% 16% 471 25% 39% Kempner 1004 1179 28% 65% 6% 33 93% 49% 9% 9% 430 4% 62% Kendleton 466 515 23% 63% 14% 35 97% 72% 9% 20% 185 13% 43% Kenedy 3487 3453 31% 55% 14% 36 97% 72% 8% 26% 1306 51% 75% Kenefick 667 713 31% 57% 12% 37 100% 65% 7% 9% 296 4% 26% Kennard 317 321 25% 60% 14% 33 98% 75% 14% 24% 113 20% 52% Kennedale 5850 6495 28% 64% 7% 35 97% 48% 17% 6% 3123 12% 55% Kerens 1681 1785 29% 54% 18% 36 97% 63% 10% 20% 621 22% 67% Kermit 5714 5308 30% 54% 15% 35 84% 70% 9% 20% 1963 61% 72% Kirby 8673 8675 30% 59% 11% 33 90% 56% 9% 11% 4070 7% 75% Kirbyville 2085 2028 27% 57% 16% 37 98% 71% 11% 26% 706 48% 65% Kirvin 122 126 33% 55% 12% 27 100% 59% 12% 6% 54 17% 52% Knollwood 375 407 29% 67% 4% 28 93% 64% 4% 2% 177 9% 82% Knox City 1219 1113 27% 54% 19% 42 95% 65% 15% 20% 442 60% 85% Kosse 497 517 24% 61% 15% 36 98% 67% 7% 25% 187 19% 52% Kountze 2115 2137 30% 59% 11% 34 100% 69% 10% 21% 849 36% 53% Kress 826 782 35% 54% 11% 33 92% 76% 8% 18% 302 21% 81% Krugerville 903 1304 28% 65% 7% 37 99% 40% 22% 3% 472 6% 49% Krum 1979 3075 30% 64% 7% 33 99% 40% 24% 2% 1091 15% 66% Kyle 5314 14053 35% 60% 5% 28 93% 57% 16% 7% 2444 11% 46% La Feria 6115 6832 31% 50% 20% 35 80% 69% 11% 29% 2000 29% 76% La Grange 4478 4571 26% 54% 20% 38 89% 63% 13% 13% 1884 58% 78% La Grulla 1211 1768 32% 55% 14% 30 81% 86% 2% 40% 361 34% 64% La Joya 3303 4354 34% 58% 8% 27 59% 77% 6% 41% 1028 30% 58% La Vernia 931 1058 28% 56% 16% 40 98% 54% 15% 12% 359 20% 43% La Villa 1305 1449 37% 54% 9% 25 87% 78% 4% 48% 374 17% 67% La Ward 200 199 24% 55% 21% 32 91% 67% 7% 7% 87 24% 61%

Texas’ small town data tables
43
Town Population 2000
Population 2004
% birth to 17, 2000
% 18 to 64,
2000 % 65+, 2000
Median age, 2000
Percent native Texan, 2000
High school or less,
2000
Bachelor or higher,
2000
Poverty rate, 2000
Total jobs, 2000
Work in
town, 2000
Less than 30 minutes to work,
2000
LaCoste 1255 1353 33% 56% 11% 33 99% 67% 10% 13% 532 10% 47% Lacy-Lakeview 5764 5827 26% 65% 9% 31 95% 54% 11% 11% 2948 11% 83% Ladonia 667 688 25% 58% 17% 38 98% 71% 7% 25% 267 21% 52% Lago Vista 4507 5425 21% 59% 20% 43 96% 28% 33% 4% 2084 27% 34% Laguna Vista 1658 2407 32% 59% 9% 33 92% 39% 31% 11% 752 9% 72% Lake Bridgeport 372 413 22% 65% 13% 36 97% 63% 9% 10% 178 6% 63% Lake City 526 527 20% 58% 22% 46 99% 60% 8% 13% 150 1% 37% Lake Dallas 6166 6894 30% 64% 6% 32 95% 44% 20% 7% 3145 9% 45% Lake Tanglewood 825 853 18% 64% 18% 49 99% 24% 40% 6% 401 8% 65% Lake Worth 4618 4648 26% 59% 15% 38 96% 66% 8% 9% 1991 16% 67% Lakeport 861 908 24% 62% 15% 39 98% 53% 15% 11% 392 3% 74% Lakeside City 984 1046 24% 64% 12% 41 99% 34% 28% 2% 537 3% 81% Lakeside (San Patricio) 333 331 32% 50% 19% 43 98% 62% 13% 28% 108 3% 44% Lakeside (Tarrant) 1040 1135 19% 62% 18% 47 96% 44% 21% 3% 515 10% 56% Lakeview 152 153 37% 54% 8% 29 93% 76% 4% 32% 36 35% 79% Lakeway 8002 8404 25% 59% 16% 43 95% 11% 57% 3% 3846 21% 36% Lakewood Village 342 362 31% 60% 9% 38 98% 32% 22% 2% 171 10% 19% Lamesa 9952 9383 30% 53% 17% 36 96% 69% 13% 22% 3748 72% 86% Lampasas 6786 7883 28% 55% 17% 36 94% 60% 14% 21% 2823 57% 70% Latexo 272 276 27% 54% 19% 39 98% 70% 8% 23% 105 7% 77% Lavon 387 419 28% 61% 10% 38 100% 40% 26% 1% 186 6% 28% Lawn 353 350 30% 55% 15% 39 98% 73% 6% 20% 146 17% 36% Leakey 387 376 23% 56% 21% 40 93% 65% 13% 19% 152 61% 77% Leander 7596 15874 32% 63% 4% 30 94% 39% 22% 4% 3972 10% 34% Leary 555 564 21% 63% 16% 44 100% 70% 6% 11% 238 5% 87% Lefors 559 536 28% 50% 22% 38 100% 69% 5% 10% 220 20% 80% Leon Valley 9239 9376 24% 65% 12% 38 91% 34% 30% 8% 4720 13% 70% Leona 181 192 24% 58% 18% 36 100% 77% 7% 11% 71 23% 51% Leonard 1846 2004 31% 58% 11% 33 97% 62% 14% 18% 826 34% 50% Leroy 335 335 21% 63% 16% 39 99% 64% 11% 6% 202 15% 52% Lexington 1178 1250 28% 58% 14% 33 99% 65% 15% 15% 501 25% 52% Liberty 8033 8304 28% 59% 14% 35 89% 54% 18% 13% 3164 50% 60% Liberty Hill 1409 1477 33% 55% 12% 33 96% 58% 10% 8% 634 21% 34% Lincoln Park 517 572 34% 64% 2% 27 83% 55% 9% 21% 270 4% 56% Lindale 2954 3814 30% 57% 14% 37 98% 50% 12% 12% 1315 21% 55% Linden 2256 2194 24% 58% 19% 43 99% 63% 14% 19% 840 47% 68% Lindsay 788 932 33% 56% 11% 34 98% 42% 22% 4% 430 15% 67% Lipan 425 471 30% 52% 18% 37 97% 59% 15% 6% 186 23% 39% Little Elm 3646 14884 32% 64% 4% 28 89% 49% 17% 12% 1919 14% 36% Little River-Academy 1645 1598 32% 55% 12% 33 97% 57% 12% 10% 706 14% 76% Littlefield 6507 6360 29% 54% 17% 36 96% 66% 9% 21% 2520 57% 77% Live Oak 9156 10023 26% 65% 9% 37 95% 38% 22% 7% 4515 11% 68% Liverpool 404 423 27% 64% 9% 35 99% 50% 10% 7% 186 4% 47% Livingston 5433 6381 29% 57% 14% 35 92% 58% 18% 22% 2363 54% 75% Llano 3325 3382 26% 56% 18% 41 98% 65% 18% 10% 1439 75% 81% Lockney 2056 1921 35% 52% 13% 33 94% 69% 12% 17% 800 45% 80% Log Cabin 733 805 23% 57% 20% 42 100% 69% 5% 28% 304 0% 64%

Texas’ small town data tables
44
Town Population 2000
Population 2004
% birth to 17, 2000
% 18 to 64,
2000 % 65+, 2000
Median age, 2000
Percent native Texan, 2000
High school or less,
2000
Bachelor or higher,
2000
Poverty rate, 2000
Total jobs, 2000
Work in
town, 2000
Less than 30 minutes to work,
2000
Lometa 782 898 31% 55% 14% 34 91% 68% 11% 29% 263 39% 66% Lone Oak 521 554 30% 57% 13% 35 100% 71% 12% 13% 220 22% 70% Lone Star 1631 1607 28% 57% 16% 37 96% 64% 10% 24% 627 21% 71% Loraine 656 611 32% 52% 16% 37 96% 72% 13% 29% 246 25% 77% Lorena 1433 1541 31% 54% 14% 37 97% 40% 20% 5% 691 11% 81% Lorenzo 1372 1281 34% 54% 13% 32 95% 68% 11% 36% 513 28% 57% Los Fresnos 4512 5097 36% 55% 9% 28 70% 66% 13% 34% 1651 21% 55% Los Indios 1149 1177 40% 54% 6% 25 77% 86% 1% 47% 308 9% 51% Los Ybanez 32 31 19% 76% 5% 27 100% 86% 0% 57% 21 19% 100% Lott 724 678 36% 52% 12% 37 97% 68% 11% 27% 228 17% 43% Lovelady 608 615 29% 51% 20% 37 100% 53% 18% 11% 248 25% 69% Lowry Crossing 1229 1658 27% 69% 4% 35 98% 34% 28% 3% 654 4% 37% Lucas 2890 3801 33% 61% 6% 39 98% 23% 46% 4% 1443 12% 40% Lueders 300 284 27% 57% 16% 39 100% 75% 5% 16% 133 25% 58% Luling 5080 5418 31% 53% 16% 35 89% 73% 12% 19% 2033 38% 59% Lumberton 8731 9381 30% 61% 9% 34 99% 48% 18% 7% 4034 23% 60% Lyford 1973 1971 33% 56% 10% 30 82% 79% 8% 31% 655 25% 71% Lytle 2383 2622 30% 59% 11% 34 97% 60% 14% 17% 1023 28% 50% Mabank 2151 2530 28% 57% 15% 35 99% 65% 13% 9% 959 30% 52% Madisonville 4159 4254 30% 54% 16% 33 90% 74% 11% 23% 1421 52% 70% Magnolia 1111 1235 22% 61% 18% 34 97% 61% 14% 9% 514 23% 36% Malakoff 2257 2358 30% 54% 16% 36 94% 64% 10% 28% 850 30% 69% Malone 278 299 33% 51% 15% 31 97% 72% 10% 33% 113 15% 64% Manor 1204 1165 31% 59% 11% 32 87% 77% 6% 12% 557 14% 49% Manvel 3046 3266 24% 65% 11% 38 99% 50% 12% 3% 1500 11% 32% Marble Falls 4959 6059 30% 56% 15% 36 93% 57% 16% 16% 2269 51% 79% Marfa 2121 2005 26% 55% 20% 39 86% 62% 19% 21% 920 64% 81% Marietta 112 110 13% 49% 38% 56 100% 77% 8% 11% 44 16% 50% Marion 1099 1127 31% 59% 10% 34 91% 62% 7% 8% 471 14% 55% Marlin 6628 6298 30% 53% 18% 35 95% 71% 9% 31% 1950 61% 71% Marquez 220 229 19% 52% 29% 41 95% 72% 12% 29% 74 19% 78% Marshall Creek 431 468 25% 65% 10% 34 98% 72% 3% 16% 193 1% 51% Mart 2273 2431 29% 52% 19% 36 99% 61% 11% 21% 862 35% 51% Martindale 953 1012 27% 62% 11% 33 94% 66% 17% 12% 434 6% 63% Mason 2134 2185 29% 53% 18% 44 95% 57% 14% 18% 917 66% 73% Matador 740 676 27% 51% 22% 43 99% 65% 15% 20% 320 62% 77% Mathis 5034 5346 35% 53% 12% 30 98% 77% 6% 38% 1357 46% 57% Maud 1028 1016 25% 56% 19% 40 100% 63% 12% 11% 380 19% 62% Maypearl 746 851 35% 55% 10% 32 91% 64% 10% 8% 315 14% 47% McCamey 1805 1646 30% 56% 14% 36 89% 73% 9% 25% 636 55% 71% McGregor 4727 4776 30% 54% 16% 36 89% 70% 8% 15% 1912 39% 70% McLean 830 789 22% 50% 28% 51 99% 66% 11% 16% 273 58% 71% McLendon-Chisholm 914 946 29% 65% 7% 39 99% 33% 28% 4% 518 8% 45% Meadow 658 642 33% 53% 14% 31 91% 66% 10% 16% 247 25% 63% Meadowlakes 1293 1660 15% 48% 37% 60 98% 27% 43% 3% 444 17% 69% Meadows Place 4912 5770 28% 63% 9% 39 83% 21% 48% 5% 2670 4% 54% Megargel 248 259 22% 60% 18% 41 99% 69% 16% 4% 108 30% 67%

Texas’ small town data tables
45
Town Population 2000
Population 2004
% birth to 17, 2000
% 18 to 64,
2000 % 65+, 2000
Median age, 2000
Percent native Texan, 2000
High school or less,
2000
Bachelor or higher,
2000
Poverty rate, 2000
Total jobs, 2000
Work in
town, 2000
Less than 30 minutes to work,
2000
Melissa 1350 2065 32% 60% 9% 35 94% 49% 25% 5% 600 15% 48% Melvin 155 152 25% 51% 24% 43 91% 68% 12% 50% 60 19% 62% Memphis 2479 2426 28% 52% 20% 40 95% 71% 9% 24% 956 65% 82% Menard 1653 1596 29% 51% 20% 40 94% 71% 12% 33% 635 60% 67% Meridian 1491 1517 30% 54% 16% 36 94% 59% 15% 14% 614 41% 63% Merkel 2637 2609 29% 57% 14% 36 97% 65% 11% 14% 1097 30% 71% Mertens 146 159 21% 56% 23% 41 84% 76% 7% 23% 72 3% 52% Mertzon 839 824 27% 56% 16% 37 97% 62% 14% 10% 389 47% 54% Mexia 6563 6743 31% 55% 14% 33 91% 66% 11% 22% 2421 53% 83% Miami 588 572 25% 58% 16% 42 100% 37% 25% 9% 283 42% 66% Midlothian 7480 11599 31% 60% 9% 31 94% 49% 20% 6% 3677 32% 55% Midway 288 298 33% 55% 12% 39 96% 70% 8% 8% 153 18% 74% Milano 400 418 28% 59% 13% 38 97% 62% 15% 18% 182 31% 47% Mildred 405 438 29% 63% 9% 33 99% 54% 13% 20% 217 8% 77% Miles 850 814 29% 57% 14% 36 91% 64% 13% 17% 399 27% 62% Milford 685 716 24% 58% 18% 34 98% 67% 7% 19% 285 11% 54% Miller's Cove 120 128 26% 68% 5% 23 36% 83% 0% 25% 56 0% 100% Millican 108 102 35% 28% 37% 36 100% 67% 16% 6% 32 0% 100% Millsap 353 385 31% 61% 8% 38 98% 67% 8% 7% 217 15% 60% Mineola 4550 4933 26% 53% 20% 40 90% 58% 14% 19% 1730 44% 63% Mingus 246 253 27% 52% 21% 43 98% 68% 5% 12% 97 23% 61% Mobeetie 107 100 31% 58% 10% 41 100% 66% 9% 3% 60 7% 55% Mobile City 196 211 47% 53% 0% 22 67% 84% 0% 1% 86 2% 79% Monahans 6821 6403 31% 56% 13% 36 93% 61% 15% 17% 2561 62% 74% Mont Belvieu 2324 2489 32% 62% 6% 33 98% 49% 14% 7% 1090 19% 63% Montgomery 489 535 29% 61% 10% 39 96% 55% 20% 12% 237 13% 57% Moody 1400 1404 29% 54% 17% 36 96% 73% 6% 18% 560 17% 50% Moore Station 184 195 29% 52% 19% 41 100% 85% 4% 18% 90 0% 43% Moran 233 227 18% 59% 22% 43 99% 65% 16% 22% 90 29% 53% Morgan 485 515 35% 53% 12% 33 86% 90% 2% 28% 142 10% 46% Morgan's Point 336 344 14% 64% 22% 38 94% 39% 33% 2% 116 4% 58% Morgan's Point Resort 2989 3735 31% 59% 10% 36 97% 43% 21% 6% 1445 4% 70% Morton 2249 1995 32% 54% 13% 34 88% 73% 8% 35% 729 55% 72% Moulton 944 933 25% 50% 25% 43 95% 75% 9% 14% 399 35% 72% Mount Calm 310 339 25% 64% 11% 38 99% 60% 8% 10% 126 22% 66% Mount Enterprise 525 530 24% 54% 22% 39 96% 63% 12% 22% 186 30% 67% Mount Vernon 2286 2540 26% 57% 17% 36 96% 56% 17% 18% 978 48% 82% Mountain City 671 703 32% 65% 3% 38 98% 17% 50% 2% 344 7% 41% Muenster 1556 1659 30% 53% 17% 37 100% 50% 16% 5% 751 49% 77% Muleshoe 4530 4540 33% 54% 14% 33 87% 74% 10% 18% 1735 69% 77% Mullin 175 174 33% 50% 17% 42 100% 89% 6% 35% 79 33% 38% Munday 1527 1395 32% 48% 20% 37 91% 72% 8% 29% 527 56% 85% Murchison 592 632 36% 59% 5% 35 95% 46% 16% 20% 276 16% 63% Murphy 3099 9596 31% 63% 5% 34 89% 20% 48% 2% 1628 8% 51% Mustang Ridge 785 897 32% 60% 8% 33 88% 69% 5% 8% 372 5% 37% Mustang 47 53 35% 62% 4% 26 100% 64% 0% 4% 8 0% 38% Naples 1410 1417 24% 52% 24% 41 99% 64% 13% 28% 476 24% 57%

Texas’ small town data tables
46
Town Population 2000
Population 2004
% birth to 17, 2000
% 18 to 64,
2000 % 65+, 2000
Median age, 2000
Percent native Texan, 2000
High school or less,
2000
Bachelor or higher,
2000
Poverty rate, 2000
Total jobs, 2000
Work in
town, 2000
Less than 30 minutes to work,
2000
Nash 2169 2292 27% 62% 11% 33 99% 49% 13% 15% 968 10% 85% Nassau Bay 4170 4107 17% 65% 18% 47 89% 15% 54% 5% 2294 20% 59% Natalia 1663 1772 36% 54% 10% 29 96% 79% 6% 33% 533 23% 51% Navarro 191 210 42% 53% 5% 31 98% 67% 2% 0% 85 0% 86% Navasota 6789 7287 32% 57% 12% 32 89% 66% 13% 27% 2560 46% 68% Nazareth 356 337 33% 54% 14% 32 99% 39% 25% 5% 185 35% 78% Needville 2609 3147 29% 58% 13% 34 97% 56% 14% 11% 1119 15% 46% Nesbitt 302 311 23% 63% 14% 39 100% 63% 8% 10% 136 8% 63% Nevada 563 596 28% 61% 10% 33 94% 69% 7% 5% 267 8% 28% New Berlin 467 488 23% 66% 11% 37 97% 46% 26% 4% 249 12% 37% New Boston 4808 4644 28% 56% 16% 38 98% 55% 13% 15% 1892 32% 74% New Chapel Hill 553 580 27% 63% 9% 33 100% 51% 13% 3% 294 6% 79% New Deal 708 709 33% 56% 11% 30 98% 63% 10% 15% 345 13% 82% New Fairview 877 1005 30% 66% 4% 32 98% 58% 10% 10% 529 5% 26% New Home 320 307 38% 55% 7% 31 96% 64% 20% 10% 119 21% 70% New Hope 662 702 26% 64% 10% 41 96% 44% 21% 3% 360 6% 48% New London 987 993 29% 56% 14% 39 97% 59% 12% 16% 359 18% 63% New Summerfield 998 1038 37% 54% 9% 26 55% 81% 5% 28% 413 27% 82% New Waverly 950 940 27% 59% 14% 35 99% 69% 12% 22% 409 16% 67% Newark 887 1050 30% 62% 8% 32 98% 70% 7% 12% 400 11% 35% Newcastle 575 571 29% 56% 15% 37 97% 80% 5% 18% 208 23% 77% Newton 2459 2353 32% 55% 12% 33 100% 73% 10% 27% 701 45% 67% Neylandville 56 59 15% 73% 12% 43 100% 77% 9% 15% 22 9% 77% Niederwald 584 645 27% 66% 6% 34 95% 59% 13% 2% 362 3% 29% Nixon 2186 2220 33% 56% 11% 31 83% 78% 8% 28% 785 31% 45% Nocona 3198 3230 27% 55% 18% 38 94% 65% 11% 17% 1292 59% 64% Nolanville 2150 2123 31% 62% 7% 29 93% 55% 10% 12% 934 6% 71% Nome 515 507 27% 55% 18% 37 100% 63% 13% 28% 203 17% 43% Noonday 515 542 28% 63% 9% 39 97% 39% 23% 8% 284 9% 76% Nordheim 323 330 23% 53% 24% 43 99% 64% 17% 10% 134 30% 57% Normangee 719 752 32% 53% 14% 36 99% 74% 10% 18% 273 41% 57% North Cleveland 263 281 22% 54% 24% 41 82% 66% 8% 17% 92 3% 67% Northlake 921 1020 31% 63% 6% 30 96% 56% 22% 9% 513 8% 58% Novice 142 136 30% 53% 17% 39 98% 65% 9% 19% 58 7% 36% Oak Grove 710 847 27% 60% 13% 43 97% 41% 29% 4% 380 6% 50% Oak Leaf 1209 1309 29% 65% 5% 41 98% 29% 32% 2% 677 7% 42% Oak Point 1747 2316 30% 66% 4% 36 97% 32% 32% 2% 955 14% 23% Oak Ridge North 2991 3302 25% 65% 10% 42 94% 29% 34% 5% 1601 9% 50% Oak Ridge (Cooke) 224 255 39% 58% 3% 28 99% 74% 4% 16% 74 3% 80% Oak Ridge (Kaufman) 400 510 20% 58% 21% 41 98% 54% 14% 5% 212 4% 46% Oak Valley 401 446 30% 58% 12% 35 98% 63% 1% 10% 187 5% 70% Oakhurst 230 - 23% 62% 16% 39 100% 73% 7% 18% 108 23% 58% Oakwood 471 493 23% 53% 25% 44 99% 69% 11% 20% 160 26% 61% O'Brien 132 123 29% 45% 26% 44 88% 66% 17% 19% 49 4% 100% Odem 2499 2483 33% 56% 11% 31 97% 70% 7% 19% 939 25% 63% O'Donnell 1011 963 31% 54% 15% 35 93% 72% 10% 25% 318 47% 79% Oglesby 458 454 29% 57% 14% 36 98% 76% 6% 13% 180 12% 64%

Texas’ small town data tables
47
Town Population 2000
Population 2004
% birth to 17, 2000
% 18 to 64,
2000 % 65+, 2000
Median age, 2000
Percent native Texan, 2000
High school or less,
2000
Bachelor or higher,
2000
Poverty rate, 2000
Total jobs, 2000
Work in
town, 2000
Less than 30 minutes to work,
2000
Old River-Winfree 1364 1817 29% 65% 6% 36 99% 61% 8% 7% 638 6% 52% Olmos Park 2343 2326 25% 62% 13% 41 96% 9% 69% 4% 1245 11% 85% Olney 3396 3337 27% 54% 19% 40 98% 63% 16% 21% 1356 62% 78% Olton 2288 2278 35% 51% 14% 32 87% 75% 8% 25% 796 54% 75% Omaha 999 983 28% 56% 16% 41 98% 64% 12% 25% 365 14% 71% Onalaska 1174 1344 21% 57% 22% 48 100% 64% 9% 15% 432 31% 56% Opdyke West 188 198 29% 68% 3% 24 99% 65% 3% 14% 100 5% 69% Orange Grove 1288 1381 29% 57% 14% 33 99% 61% 14% 16% 531 37% 58% Orchard 408 464 29% 62% 8% 33 96% 63% 16% 9% 221 6% 39% Ore City 1106 1156 33% 55% 12% 32 96% 61% 8% 22% 434 17% 49% Overton 2350 2316 26% 57% 17% 38 100% 54% 12% 17% 1009 31% 63% Ovilla 3405 3735 32% 61% 7% 39 99% 26% 41% 2% 1861 10% 46% Oyster Creek 1192 1238 29% 61% 11% 33 95% 69% 5% 19% 543 10% 74% Paducah 1498 1366 25% 49% 26% 45 96% 68% 13% 20% 594 65% 74% Paint Rock 320 295 27% 57% 16% 35 88% 62% 20% 16% 138 30% 62% Palacios 5153 5234 35% 53% 12% 30 78% 66% 13% 24% 1608 48% 77% Palisades 352 369 27% 60% 13% 39 99% 42% 9% 9% 178 6% 58% Palm Valley 1298 1292 14% 48% 38% 57 96% 20% 46% 1% 550 8% 79% Palmer 1774 2016 33% 58% 9% 30 89% 69% 7% 10% 737 10% 49% Palmhurst 4872 5027 38% 56% 6% 26 68% 72% 15% 38% 1735 5% 71% Palmview 4107 4401 38% 54% 9% 26 71% 71% 14% 29% 1347 8% 78% Panhandle 2589 2565 29% 54% 17% 38 96% 47% 19% 7% 1111 39% 68% Panorama Village 1965 2326 19% 52% 30% 51 98% 24% 41% 3% 862 9% 61% Pantego 2318 2337 24% 56% 21% 45 98% 31% 38% 6% 1142 15% 60% Paradise 459 505 30% 56% 14% 37 99% 69% 10% 13% 213 10% 61% Parker 1379 1966 21% 68% 11% 41 93% 24% 45% 3% 764 10% 46% Pattison 447 455 24% 62% 13% 40 92% 38% 30% 7% 208 15% 61% Patton Village 1391 1511 31% 62% 7% 31 95% 77% 3% 24% 568 3% 37% Payne Springs 683 732 23% 54% 23% 42 99% 61% 2% 15% 242 0% 37% Pearsall 7157 7685 33% 55% 12% 31 95% 75% 8% 35% 2383 58% 72% Pecan Gap 214 222 22% 57% 21% 41 100% 45% 28% 19% 108 12% 54% Pecan Hill 672 709 26% 64% 10% 39 99% 47% 19% 3% 307 5% 37% Pecos 9501 8419 33% 55% 12% 33 84% 77% 8% 27% 3460 76% 85% Pelican Bay 1505 1592 33% 60% 7% 29 96% 76% 4% 15% 657 4% 29% Penelope 211 230 26% 63% 11% 39 92% 64% 8% 11% 131 13% 42% Penitas 1167 1192 32% 59% 9% 29 73% 79% 5% 28% 462 16% 64% Pernitas Point 269 261 19% 52% 29% 50 100% 41% 20% 4% 100 3% 16% Perryton 7774 7884 31% 59% 10% 33 83% 61% 15% 13% 3503 75% 83% Petersburg 1262 1256 33% 54% 14% 33 93% 73% 11% 20% 483 38% 52% Petrolia 782 801 28% 57% 15% 36 100% 71% 8% 18% 331 19% 60% Petronila 83 81 23% 61% 16% 36 88% 34% 22% 5% 55 35% 59% Pilot Point 3538 3974 30% 59% 10% 32 89% 58% 17% 11% 1662 34% 54% Pine Forest 632 632 27% 61% 11% 35 100% 67% 6% 6% 289 5% 59% Pine Island 849 845 28% 63% 9% 34 93% 57% 14% 7% 432 4% 49% Pinehurst 2274 2239 22% 57% 20% 45 98% 59% 12% 17% 868 7% 67% Pineland 980 917 26% 59% 15% 37 99% 72% 8% 19% 338 54% 77% Piney Point Village 3380 3427 27% 58% 15% 46 86% 10% 75% 4% 1340 9% 72%

Texas’ small town data tables
48
Town Population 2000
Population 2004
% birth to 17, 2000
% 18 to 64,
2000 % 65+, 2000
Median age, 2000
Percent native Texan, 2000
High school or less,
2000
Bachelor or higher,
2000
Poverty rate, 2000
Total jobs, 2000
Work in
town, 2000
Less than 30 minutes to work,
2000
Pittsburg 4347 4460 31% 54% 15% 32 84% 64% 14% 28% 1449 55% 80% Plains 1450 1447 32% 57% 10% 35 84% 65% 11% 20% 594 52% 86% Pleak 947 1078 22% 68% 9% 38 88% 62% 11% 5% 477 8% 50% Pleasant Valley 408 381 22% 57% 21% 43 98% 50% 19% 10% 164 4% 83% Pleasanton 8266 9220 29% 59% 13% 33 95% 61% 16% 22% 3373 44% 55% Plum Grove 930 994 35% 61% 4% 28 99% 74% 2% 13% 338 2% 30% Point Blank 559 619 12% 59% 30% 56 100% 54% 14% 18% 209 14% 34% Point 792 953 28% 56% 16% 33 98% 81% 8% 19% 289 20% 47% Point Comfort 781 744 32% 57% 11% 33 99% 59% 8% 12% 326 41% 83% Ponder 507 710 24% 66% 10% 37 94% 48% 17% 1% 253 14% 65% Port Aransas 3370 3624 19% 66% 15% 45 96% 39% 28% 11% 1672 67% 72% Port Isabel 4865 5391 30% 58% 12% 32 76% 62% 12% 27% 1907 38% 78% Post 3708 3867 31% 57% 13% 34 93% 72% 8% 28% 1226 78% 80% Post Oak Bend City 404 449 32% 60% 8% 38 99% 51% 24% 11% 189 14% 45% Poteet 3305 3577 34% 54% 12% 29 97% 81% 5% 28% 1139 22% 52% Poth 1850 2099 32% 57% 11% 33 94% 71% 10% 18% 812 25% 51% Pottsboro 1579 1796 35% 57% 8% 35 98% 41% 18% 8% 754 17% 79% Powell 105 112 23% 46% 32% 37 82% 68% 6% 11% 43 44% 67% Poynor 314 336 27% 58% 15% 36 100% 56% 7% 10% 156 17% 39% Prairie View 4410 4635 21% 62% 17% 21 97% 31% 38% 24% 1047 10% 66% Premont 2772 2834 31% 54% 16% 35 96% 72% 11% 34% 934 46% 66% Presidio 4167 4652 37% 52% 11% 29 51% 84% 8% 43% 1206 61% 78% Primera 2723 3102 36% 56% 8% 27 82% 76% 4% 30% 909 5% 81% Princeton 3477 3943 29% 59% 12% 32 96% 61% 12% 9% 1647 16% 52% Progreso 4851 5049 42% 52% 6% 22 65% 89% 4% 51% 1240 21% 76% Progreso Lakes 234 247 36% 50% 14% 43 96% 36% 28% 4% 116 6% 63% Prosper 2097 3499 33% 60% 6% 33 92% 39% 31% 8% 1040 15% 47% Putnam 88 91 15% 61% 24% 45 100% 72% 7% 28% 36 19% 56% Pyote 131 148 27% 56% 17% 40 99% 61% 4% 15% 43 24% 93% Quanah 3022 2774 25% 54% 21% 42 98% 65% 12% 21% 1326 65% 79% Queen City 1613 1586 27% 60% 14% 36 99% 66% 9% 20% 665 19% 71% Quinlan 1370 1451 25% 59% 16% 36 98% 71% 7% 12% 608 23% 52% Quintana 38 38 0% 75% 25% 48 100% 61% 0% 18% 13 23% 77% Quitaque 432 413 29% 54% 17% 42 97% 63% 13% 19% 198 49% 77% Quitman 2030 2151 23% 53% 24% 43 99% 59% 17% 11% 737 48% 71% Ralls 2252 2105 33% 50% 17% 33 97% 74% 8% 29% 720 41% 65% Rancho Viejo 1754 1798 25% 58% 17% 41 78% 19% 51% 10% 739 7% 72% Ranger 2584 2492 25% 56% 19% 36 96% 65% 13% 18% 1022 52% 80% Rangerville 203 - 41% 53% 6% 33 82% 75% 5% 33% 79 10% 86% Rankin 800 747 26% 59% 15% 41 94% 64% 13% 17% 339 60% 73% Ransom Canyon 1011 1063 20% 66% 15% 45 95% 21% 51% 1% 605 6% 82% Ravenna 215 225 29% 53% 18% 38 99% 64% 9% 18% 86 4% 63% Raymondville 9733 9456 33% 52% 15% 30 88% 77% 7% 36% 2678 57% 71% Red Lick 853 856 35% 58% 7% 37 99% 30% 36% 4% 408 10% 83% Red Oak 4301 6444 30% 62% 8% 33 97% 51% 13% 6% 2253 13% 45% Redwater 872 882 33% 56% 11% 33 100% 62% 10% 17% 404 12% 71% Refugio 2941 2804 29% 54% 17% 38 98% 64% 12% 21% 1139 60% 73%

Texas’ small town data tables
49
Town Population 2000
Population 2004
% birth to 17, 2000
% 18 to 64,
2000 % 65+, 2000
Median age, 2000
Percent native Texan, 2000
High school or less,
2000
Bachelor or higher,
2000
Poverty rate, 2000
Total jobs, 2000
Work in
town, 2000
Less than 30 minutes to work,
2000
Reklaw 327 335 23% 57% 20% 41 95% 63% 13% 16% 120 8% 56% Reno (Lamar) 2767 2919 30% 61% 10% 34 99% 43% 19% 7% 1294 7% 85% Reno (Tarrant-Parker) 2441 2778 31% 61% 8% 35 97% 63% 7% 11% 1139 7% 25% Retreat 339 362 19% 72% 9% 40 100% 60% 10% 7% 184 0% 76% Rhome 551 795 29% 59% 12% 33 97% 56% 13% 14% 272 18% 41% Rice 798 896 33% 57% 10% 30 90% 72% 3% 16% 338 11% 63% Richland Hills 8132 8101 24% 57% 18% 40 96% 46% 17% 6% 3870 11% 67% Richland Springs 350 340 26% 53% 21% 39 99% 67% 10% 14% 145 24% 65% Richland 291 314 19% 57% 24% 41 98% 60% 17% 18% 164 12% 53% Richwood 3012 3224 29% 65% 6% 29 95% 44% 18% 10% 1510 8% 82% Riesel 973 1000 30% 56% 14% 36 99% 62% 10% 10% 447 13% 58% Rio Bravo 5553 5755 46% 50% 4% 20 62% 89% 2% 58% 1288 11% 22% Rio Hondo 1942 2074 32% 54% 14% 32 85% 72% 6% 29% 611 16% 75% Rio Vista 656 706 31% 58% 11% 32 99% 71% 4% 11% 285 18% 56% Rising Star 835 851 23% 57% 20% 43 97% 66% 13% 24% 331 40% 63% River Oaks 6985 6944 27% 58% 15% 36 90% 62% 10% 12% 2904 10% 71% Riverside 425 427 29% 57% 14% 39 97% 65% 16% 32% 188 14% 55% Roanoke 2810 3473 26% 69% 5% 31 93% 45% 24% 4% 1612 17% 59% Roaring Springs 265 243 20% 47% 33% 45 100% 54% 10% 18% 104 36% 74% Robert Lee 1171 1102 22% 51% 27% 46 95% 62% 14% 15% 468 53% 76% Robinson 7845 8711 25% 59% 15% 39 98% 50% 16% 4% 4036 15% 80% Roby 673 641 24% 51% 25% 37 99% 63% 10% 16% 250 44% 70% Rochester 378 350 27% 52% 22% 39 91% 80% 8% 29% 125 42% 81% Rockdale 5439 6027 29% 56% 15% 36 94% 69% 11% 18% 2348 46% 71% Rockport 7385 8694 22% 55% 24% 46 94% 43% 24% 20% 2682 58% 72% Rocksprings 1285 1196 34% 53% 12% 32 86% 75% 9% 38% 442 64% 72% Rocky Mound 93 98 25% 62% 13% 40 100% 61% 5% 0% 38 0% 50% Rogers 1117 1059 31% 56% 13% 32 97% 67% 6% 18% 477 22% 64% Rollingwood 1403 1364 30% 59% 11% 42 96% 9% 76% 0% 676 14% 80% Roma 9617 10698 36% 55% 9% 28 53% 81% 9% 54% 2445 59% 73% Roman Forest 1279 2643 28% 62% 10% 39 97% 40% 22% 5% 623 8% 36% Ropesville 517 526 33% 53% 14% 33 96% 68% 8% 15% 232 33% 59% Roscoe 1378 1300 27% 55% 18% 38 92% 74% 11% 25% 540 30% 89% Rose City 519 521 31% 56% 12% 31 97% 74% 2% 15% 197 2% 84% Rose Hill Acres 480 492 30% 55% 16% 40 97% 52% 18% 8% 211 8% 75% Rosebud 1493 1410 31% 49% 20% 40 96% 70% 10% 24% 521 33% 54% Ross 228 235 27% 53% 20% 38 97% 36% 24% 3% 132 12% 62% Rosser 379 427 31% 59% 10% 35 100% 72% 7% 15% 163 14% 36% Rotan 1611 1489 25% 53% 23% 41 98% 70% 10% 23% 612 58% 76% Round Mountain 111 119 24% 62% 14% 43 91% 69% 10% 2% 52 27% 55% Round Top 77 78 13% 48% 39% 58 98% 44% 37% 5% 45 44% 74% Roxton 694 702 32% 52% 16% 37 100% 67% 8% 25% 268 21% 58% Royse City 2957 4873 31% 59% 9% 30 88% 62% 11% 10% 1503 19% 52% Rule 698 644 26% 49% 25% 45 97% 71% 9% 20% 267 36% 73% Runaway Bay 1104 1296 19% 60% 21% 47 99% 40% 28% 4% 522 10% 52% Runge 1080 1092 33% 51% 16% 34 99% 82% 6% 31% 336 29% 62% Rusk 5085 5234 29% 55% 16% 38 99% 63% 9% 21% 1365 56% 71%

Texas’ small town data tables
50
Town Population 2000
Population 2004
% birth to 17, 2000
% 18 to 64,
2000 % 65+, 2000
Median age, 2000
Percent native Texan, 2000
High school or less,
2000
Bachelor or higher,
2000
Poverty rate, 2000
Total jobs, 2000
Work in
town, 2000
Less than 30 minutes to work,
2000
Sabinal 1586 1635 30% 55% 15% 35 95% 70% 10% 22% 618 32% 63% Sachse 9751 16077 32% 64% 4% 32 95% 31% 31% 5% 5272 8% 49% Sadler 404 424 24% 59% 17% 38 100% 63% 10% 15% 154 19% 61% San Augustine 2475 2466 29% 54% 17% 38 97% 72% 12% 25% 872 50% 67% San Diego 4753 4627 33% 55% 12% 31 98% 72% 9% 32% 1559 38% 71% San Felipe 868 939 26% 59% 15% 39 99% 67% 7% 9% 372 8% 52% San Leanna 384 447 25% 65% 11% 44 97% 31% 33% 5% 206 10% 52% San Patricio 318 312 33% 56% 10% 36 97% 61% 12% 15% 126 5% 39% San Perlita 680 683 36% 57% 7% 25 85% 85% 2% 40% 228 18% 71% San Saba 2637 2618 28% 51% 21% 39 92% 71% 9% 20% 1013 71% 78% Sanctuary 256 282 27% 66% 7% 41 98% 46% 11% 8% 143 4% 48% Sanford 203 197 19% 69% 12% 40 96% 59% 10% 28% 99 9% 68% Sanger 4534 5847 30% 61% 8% 32 97% 53% 15% 6% 2291 23% 65% Sansom Park 4181 4154 29% 60% 11% 34 86% 75% 4% 23% 1602 5% 63% Santa Anna 1081 1032 28% 57% 16% 41 95% 67% 9% 23% 396 41% 62% Santa Clara 889 932 28% 62% 10% 37 94% 42% 19% 8% 529 6% 54% Santa Fe 9548 10371 27% 62% 11% 36 98% 54% 11% 6% 4348 15% 54% Santa Rosa 2833 2954 38% 54% 8% 25 79% 83% 5% 39% 873 12% 63% Savoy 850 876 26% 58% 16% 42 99% 66% 8% 9% 356 10% 60% Schulenburg 2699 2740 25% 56% 19% 44 92% 68% 13% 13% 1214 60% 86% Scotland 438 463 33% 54% 13% 34 96% 62% 11% 3% 226 22% 64% Scottsville 263 269 38% 53% 9% 33 98% 73% 6% 21% 130 1% 85% Seabrook 9443 10856 22% 72% 6% 34 89% 24% 41% 6% 5319 17% 60% Seadrift 1352 1382 31% 56% 14% 34 87% 75% 7% 25% 436 22% 59% Seagraves 2334 2305 33% 54% 13% 32 88% 74% 9% 26% 792 52% 76% Sealy 5248 5936 31% 57% 12% 33 85% 62% 12% 16% 2225 34% 66% Selma 788 2187 23% 65% 12% 40 92% 49% 28% 6% 379 21% 64% Seminole 5910 5881 31% 57% 11% 32 89% 66% 14% 18% 2404 64% 84% Seven Oaks 131 149 30% 60% 10% 36 89% 63% 15% 8% 71 6% 73% Seven Points 1145 1247 30% 54% 16% 36 100% 77% 4% 20% 418 16% 45% Seymour 2908 2766 26% 49% 24% 44 98% 66% 10% 19% 1077 70% 76% Shady Shores 1461 1953 31% 63% 6% 37 98% 34% 29% 3% 766 7% 47% Shallowater 2086 2157 31% 57% 12% 36 98% 52% 19% 9% 980 18% 79% Shamrock 2029 1821 25% 54% 21% 42 98% 64% 13% 21% 860 69% 85% Shavano Park 1754 2185 25% 57% 18% 47 94% 14% 62% 2% 762 7% 67% Shenandoah 1503 1556 25% 68% 7% 39 96% 28% 29% 3% 818 8% 55% Shepherd 2029 2267 28% 59% 13% 37 98% 73% 8% 20% 717 26% 45% Shiner 2070 2018 24% 51% 24% 45 100% 67% 16% 11% 954 48% 80% Shoreacres 1488 1573 26% 62% 12% 41 97% 29% 28% 2% 750 6% 70% Silsbee 6393 6620 27% 57% 16% 38 97% 60% 16% 17% 2508 40% 68% Silverton 771 737 26% 52% 22% 38 93% 63% 11% 18% 304 44% 68% Simonton 718 840 22% 64% 15% 41 98% 39% 30% 5% 372 14% 25% Sinton 5676 5517 32% 55% 14% 32 97% 70% 9% 28% 1988 47% 69% Skellytown 610 602 23% 58% 18% 42 100% 58% 7% 15% 268 14% 78% Slaton 6109 5873 29% 55% 16% 35 97% 73% 6% 23% 2351 29% 59% Smiley 453 473 33% 45% 22% 37 91% 78% 14% 27% 154 24% 54% Smithville 3901 4339 28% 57% 16% 37 96% 57% 18% 16% 1588 46% 63%
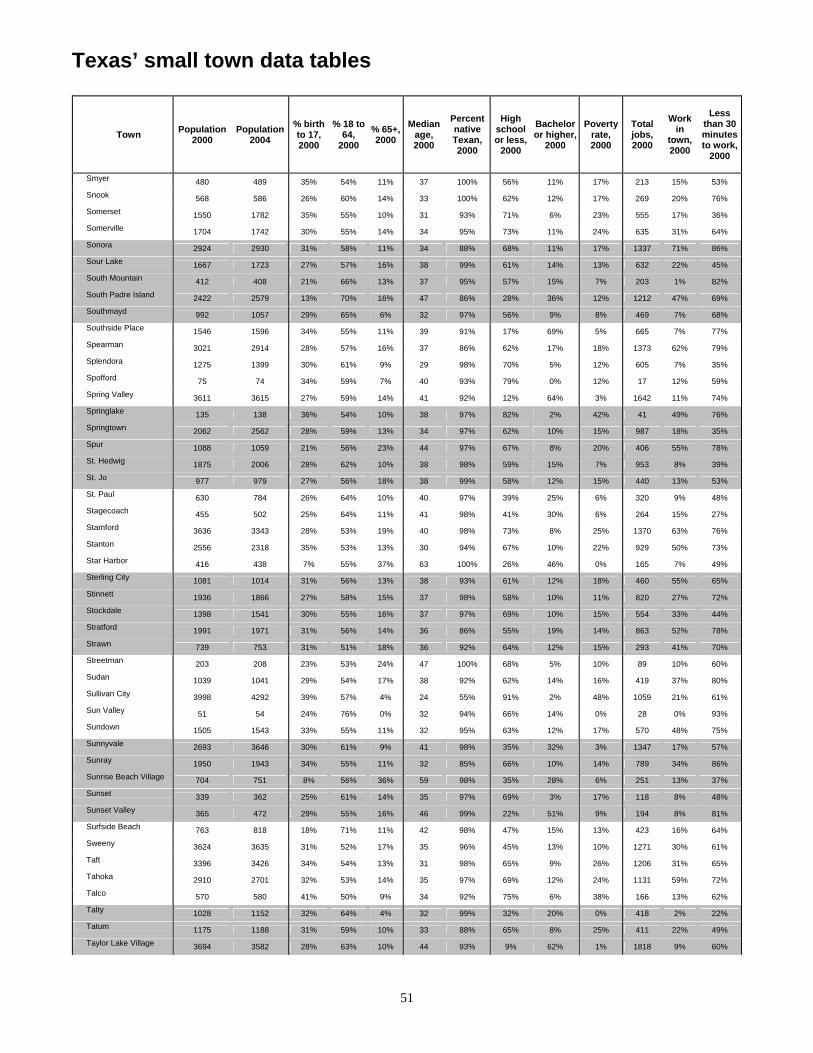
Texas’ small town data tables
51
Town Population 2000
Population 2004
% birth to 17, 2000
% 18 to 64,
2000 % 65+, 2000
Median age, 2000
Percent native Texan, 2000
High school or less,
2000
Bachelor or higher,
2000
Poverty rate, 2000
Total jobs, 2000
Work in
town, 2000
Less than 30 minutes to work,
2000
Smyer 480 489 35% 54% 11% 37 100% 56% 11% 17% 213 15% 53% Snook 568 586 26% 60% 14% 33 100% 62% 12% 17% 269 20% 76% Somerset 1550 1782 35% 55% 10% 31 93% 71% 6% 23% 555 17% 36% Somerville 1704 1742 30% 55% 14% 34 95% 73% 11% 24% 635 31% 64% Sonora 2924 2930 31% 58% 11% 34 88% 68% 11% 17% 1337 71% 86% Sour Lake 1667 1723 27% 57% 16% 38 99% 61% 14% 13% 632 22% 45% South Mountain 412 408 21% 66% 13% 37 95% 57% 15% 7% 203 1% 82% South Padre Island 2422 2579 13% 70% 16% 47 86% 28% 36% 12% 1212 47% 69% Southmayd 992 1057 29% 65% 6% 32 97% 56% 9% 8% 469 7% 68% Southside Place 1546 1596 34% 55% 11% 39 91% 17% 69% 5% 665 7% 77% Spearman 3021 2914 28% 57% 16% 37 86% 62% 17% 18% 1373 62% 79% Splendora 1275 1399 30% 61% 9% 29 98% 70% 5% 12% 605 7% 35% Spofford 75 74 34% 59% 7% 40 93% 79% 0% 12% 17 12% 59% Spring Valley 3611 3615 27% 59% 14% 41 92% 12% 64% 3% 1642 11% 74% Springlake 135 138 36% 54% 10% 38 97% 82% 2% 42% 41 49% 76% Springtown 2062 2562 28% 59% 13% 34 97% 62% 10% 15% 987 18% 35% Spur 1088 1059 21% 56% 23% 44 97% 67% 8% 20% 406 55% 78% St. Hedwig 1875 2006 28% 62% 10% 38 98% 59% 15% 7% 953 8% 39% St. Jo 977 979 27% 56% 18% 38 99% 58% 12% 15% 440 13% 53% St. Paul 630 784 26% 64% 10% 40 97% 39% 25% 6% 320 9% 48% Stagecoach 455 502 25% 64% 11% 41 98% 41% 30% 6% 264 15% 27% Stamford 3636 3343 28% 53% 19% 40 98% 73% 8% 25% 1370 63% 76% Stanton 2556 2318 35% 53% 13% 30 94% 67% 10% 22% 929 50% 73% Star Harbor 416 438 7% 55% 37% 63 100% 26% 46% 0% 165 7% 49% Sterling City 1081 1014 31% 56% 13% 38 93% 61% 12% 18% 460 55% 65% Stinnett 1936 1866 27% 58% 15% 37 98% 58% 10% 11% 820 27% 72% Stockdale 1398 1541 30% 55% 16% 37 97% 69% 10% 15% 554 33% 44% Stratford 1991 1971 31% 56% 14% 36 86% 55% 19% 14% 863 52% 78% Strawn 739 753 31% 51% 18% 36 92% 64% 12% 15% 293 41% 70% Streetman 203 208 23% 53% 24% 47 100% 68% 5% 10% 89 10% 60% Sudan 1039 1041 29% 54% 17% 38 92% 62% 14% 16% 419 37% 80% Sullivan City 3998 4292 39% 57% 4% 24 55% 91% 2% 48% 1059 21% 61% Sun Valley 51 54 24% 76% 0% 32 94% 66% 14% 0% 28 0% 93% Sundown 1505 1543 33% 55% 11% 32 95% 63% 12% 17% 570 48% 75% Sunnyvale 2693 3646 30% 61% 9% 41 98% 35% 32% 3% 1347 17% 57% Sunray 1950 1943 34% 55% 11% 32 85% 66% 10% 14% 789 34% 86% Sunrise Beach Village 704 751 8% 56% 36% 59 98% 35% 28% 6% 251 13% 37% Sunset 339 362 25% 61% 14% 35 97% 69% 3% 17% 118 8% 48% Sunset Valley 365 472 29% 55% 16% 46 99% 22% 51% 9% 194 8% 81% Surfside Beach 763 818 18% 71% 11% 42 98% 47% 15% 13% 423 16% 64% Sweeny 3624 3635 31% 52% 17% 35 96% 45% 13% 10% 1271 30% 61% Taft 3396 3426 34% 54% 13% 31 98% 65% 9% 26% 1206 31% 65% Tahoka 2910 2701 32% 53% 14% 35 97% 69% 12% 24% 1131 59% 72% Talco 570 580 41% 50% 9% 34 92% 75% 6% 38% 166 13% 62% Talty 1028 1152 32% 64% 4% 32 99% 32% 20% 0% 418 2% 22% Tatum 1175 1188 31% 59% 10% 33 88% 65% 8% 25% 411 22% 49% Taylor Lake Village 3694 3582 28% 63% 10% 44 93% 9% 62% 1% 1818 9% 60%

Texas’ small town data tables
52
Town Population 2000
Population 2004
% birth to 17, 2000
% 18 to 64,
2000 % 65+, 2000
Median age, 2000
Percent native Texan, 2000
High school or less,
2000
Bachelor or higher,
2000
Poverty rate, 2000
Total jobs, 2000
Work in
town, 2000
Less than 30 minutes to work,
2000
Teague 4557 4608 27% 55% 17% 31 97% 62% 10% 16% 1309 34% 75% Tehuacana 307 319 21% 62% 17% 42 99% 47% 19% 11% 161 9% 69% Tenaha 1046 1094 32% 58% 11% 32 92% 74% 8% 40% 405 35% 73% Terrell Hills 5019 5088 28% 55% 17% 42 94% 11% 68% 5% 2151 8% 85% Texhoma 371 348 29% 57% 13% 34 96% 51% 22% 12% 151 18% 69% Texline 511 513 28% 63% 9% 33 89% 60% 16% 11% 262 52% 87% The Hills 1492 1868 23% 59% 18% 46 97% 11% 70% 3% 572 19% 33% Thompsons 236 269 18% 66% 16% 39 97% 65% 11% 20% 107 12% 36% Thorndale 1278 1312 29% 56% 15% 35 97% 71% 10% 9% 610 16% 54% Thornton 525 545 28% 58% 14% 37 98% 66% 5% 16% 192 21% 58% Thorntonville 442 426 17% 66% 16% 46 90% 66% 6% 15% 212 9% 73% Thrall 710 839 27% 56% 17% 35 94% 72% 8% 19% 294 11% 56% Three Rivers 1878 1735 29% 59% 12% 36 96% 66% 9% 23% 760 49% 74% Throckmorton 905 795 25% 55% 20% 42 97% 56% 21% 16% 417 51% 79% Tiki Island 1016 1148 11% 78% 12% 50 95% 22% 40% 2% 622 7% 53% Timbercreek Canyon 406 473 26% 66% 8% 43 97% 20% 42% 1% 223 10% 65% Timpson 1094 1138 26% 49% 26% 37 96% 72% 10% 32% 340 42% 64% Tioga 754 880 28% 61% 12% 35 95% 62% 11% 6% 354 15% 47% Tira 248 253 22% 56% 21% 46 100% 60% 18% 6% 128 4% 63% Toco 89 90 40% 46% 14% 43 98% 78% 0% 56% 26 13% 91% Todd Mission 146 160 23% 71% 6% 35 95% 59% 10% 10% 79 9% 25% Tolar 504 627 24% 67% 10% 36 96% 56% 21% 10% 240 8% 69% Tom Bean 941 980 32% 58% 10% 32 99% 47% 11% 9% 446 13% 79% Tomball 9089 9853 26% 61% 12% 35 92% 52% 21% 7% 4509 27% 57% Tool 2275 2423 16% 55% 29% 47 99% 63% 10% 15% 817 13% 29% Toyah 100 91 15% 67% 17% 48 83% 75% 0% 53% 42 45% 75% Trent 318 314 19% 65% 16% 38 96% 70% 9% 9% 161 14% 66% Trenton 662 682 26% 58% 16% 37 97% 63% 13% 15% 293 28% 46% Trinidad 1091 1142 29% 57% 13% 34 99% 62% 8% 16% 449 23% 58% Trinity 2721 2765 27% 55% 18% 36 94% 70% 8% 25% 971 46% 70% Trophy Club 6350 7269 30% 64% 6% 37 96% 17% 46% 2% 3371 14% 48% Troup 1949 2029 32% 54% 14% 35 96% 61% 9% 19% 755 25% 51% Troy 1378 1364 33% 58% 9% 34 98% 54% 12% 11% 656 9% 75% Tulia 5117 4746 31% 51% 18% 33 94% 66% 15% 19% 1870 59% 82% Turkey 494 496 31% 47% 22% 40 77% 80% 5% 32% 163 36% 78% Tuscola 714 719 30% 57% 14% 37 99% 60% 10% 7% 349 14% 67% Tye 1158 1147 31% 60% 9% 33 98% 74% 6% 26% 489 14% 83% Uhland 386 411 34% 57% 9% 28 85% 61% 19% 11% 191 13% 30% Uncertain 150 152 8% 66% 26% 56 100% 61% 18% 13% 57 18% 39% Union Grove 346 367 33% 60% 7% 34 100% 55% 6% 24% 139 4% 56% Valentine 187 189 22% 56% 22% 42 92% 65% 29% 11% 53 51% 51% Valley Mills 1123 1181 27% 54% 19% 38 97% 59% 12% 9% 430 23% 56% Valley View 737 802 31% 56% 12% 34 99% 48% 18% 10% 355 18% 51% Van Alstyne 2502 2633 26% 60% 14% 36 97% 57% 17% 10% 1131 19% 63% Van 2362 2545 28% 57% 16% 36 93% 52% 19% 14% 962 31% 54% Van Horn 2435 2240 33% 56% 11% 32 85% 74% 12% 29% 1021 81% 87% Vega 936 906 27% 57% 17% 39 95% 53% 17% 15% 457 48% 67%

Texas’ small town data tables
53
Town Population 2000
Population 2004
% birth to 17, 2000
% 18 to 64,
2000 % 65+, 2000
Median age, 2000
Percent native Texan, 2000
High school or less,
2000
Bachelor or higher,
2000
Poverty rate, 2000
Total jobs, 2000
Work in
town, 2000
Less than 30 minutes to work,
2000
Venus 910 2157 29% 62% 9% 32 92% 67% 8% 11% 409 15% 54% Vinton 1892 1969 43% 53% 4% 23 64% 76% 4% 30% 577 7% 65% Waelder 947 992 28% 58% 15% 34 84% 91% 4% 28% 411 38% 73% Wake Village 5129 5178 26% 61% 13% 36 99% 39% 26% 12% 2635 8% 87% Waller 2092 2032 30% 61% 9% 29 92% 58% 15% 18% 965 27% 60% Wallis 1172 1263 28% 62% 10% 35 96% 68% 10% 11% 524 16% 49% Walnut Springs 755 800 35% 54% 12% 33 93% 73% 5% 31% 299 22% 67% Warren City 343 349 28% 59% 13% 35 100% 64% 6% 14% 156 1% 66% Waskom 2068 2111 27% 60% 13% 35 94% 68% 6% 24% 740 26% 67% Webster 9083 8905 20% 77% 3% 29 76% 38% 31% 13% 5225 14% 57% Weimar 1981 2003 25% 51% 24% 43 96% 65% 15% 13% 858 46% 73% Weinert 177 164 13% 59% 27% 46 97% 71% 16% 19% 76 27% 84% Weir 591 630 28% 66% 6% 32 94% 51% 13% 5% 366 8% 37% Wellington 2275 2149 30% 50% 21% 38 95% 59% 13% 23% 815 66% 84% Wellman 203 203 29% 57% 14% 38 93% 63% 25% 22% 93 41% 82% Wells 769 784 27% 56% 16% 38 96% 79% 5% 28% 236 17% 62% West 2692 2734 27% 54% 20% 39 94% 63% 14% 16% 1164 33% 67% West Columbia 4255 4282 28% 57% 15% 35 91% 59% 11% 20% 1689 28% 65% West Lake Hills 3116 3013 27% 62% 11% 43 95% 5% 78% 2% 1574 17% 81% West Orange 4111 4015 25% 58% 17% 37 96% 63% 9% 13% 1648 16% 79% West Tawakoni 1462 1654 25% 59% 15% 38 96% 71% 8% 17% 630 8% 36% Westbrook 203 194 28% 60% 12% 37 96% 68% 11% 18% 114 32% 58% Westlake 207 206 27% 61% 12% 47 91% 23% 40% 3% 103 28% 52% Westminster 390 417 26% 66% 8% 35 99% 73% 2% 10% 207 7% 49% Weston 635 693 25% 64% 11% 40 99% 44% 21% 4% 386 13% 40% Westover Hills 658 683 25% 54% 22% 51 98% 8% 68% 2% 244 8% 78% Westworth Village 2124 2107 28% 60% 12% 34 94% 53% 9% 9% 921 7% 70% Wharton 9237 9412 28% 59% 13% 35 94% 56% 18% 22% 3709 54% 67% Wheeler 1378 1222 27% 55% 18% 41 86% 62% 10% 10% 599 55% 75% White Deer 1060 1055 28% 57% 16% 38 98% 51% 14% 6% 494 25% 66% White Oak 5624 6023 31% 59% 11% 34 97% 45% 21% 11% 2458 18% 83% Whiteface 465 414 31% 58% 11% 33 91% 60% 14% 14% 194 36% 85% Whitehouse 5346 6820 34% 58% 7% 32 97% 33% 22% 9% 2604 19% 71% Whitesboro 3760 3964 25% 56% 18% 38 100% 59% 10% 12% 1627 35% 69% Whitewright 1740 1778 26% 54% 20% 39 99% 58% 14% 13% 704 25% 61% Whitney 1833 2023 28% 54% 18% 40 96% 68% 8% 22% 670 36% 64% Wickett 455 428 32% 58% 11% 38 95% 72% 5% 18% 153 18% 73% Willis 3985 4198 34% 59% 7% 27 86% 71% 8% 21% 1548 14% 60% Willow Park 2849 3348 27% 62% 11% 40 99% 26% 38% 2% 1415 8% 50% Wills Point 3496 3781 28% 55% 17% 35 96% 62% 13% 18% 1365 33% 57% Wilmer 3393 3593 34% 61% 6% 29 79% 77% 5% 19% 1260 9% 55% Wilson 532 494 35% 53% 12% 32 91% 65% 12% 26% 199 25% 67% Windcrest 5105 5100 13% 51% 36% 56 90% 25% 42% 6% 1971 12% 69% Windom 245 254 29% 55% 16% 41 100% 60% 18% 10% 105 15% 65% Windthorst 440 452 28% 55% 16% 32 82% 67% 16% 8% 202 50% 67% Winfield 499 526 32% 57% 10% 29 82% 74% 3% 19% 206 14% 87% Wink 919 880 33% 56% 10% 37 95% 50% 17% 14% 391 38% 76%

Texas’ small town data tables
54
Town Population 2000
Population 2004
% birth to 17, 2000
% 18 to 64,
2000 % 65+, 2000
Median age, 2000
Percent native Texan, 2000
High school or less,
2000
Bachelor or higher,
2000
Poverty rate, 2000
Total jobs, 2000
Work in
town, 2000
Less than 30 minutes to work,
2000
Winnsboro 3584 3779 24% 50% 26% 39 97% 63% 11% 15% 1217 57% 70% Winona 582 597 31% 57% 12% 35 99% 58% 9% 12% 246 9% 63% Winters 2880 2735 32% 51% 17% 35 94% 72% 9% 27% 1005 64% 81% Wixon Valley 235 223 29% 57% 13% 36 97% 58% 21% 3% 114 14% 68% Wolfe City 1566 1656 29% 55% 16% 35 98% 69% 9% 19% 612 33% 60% Wolfforth 2554 2704 28% 62% 10% 33 97% 50% 21% 15% 1245 14% 85% Woodbranch 1305 1379 28% 61% 11% 37 98% 55% 9% 7% 656 2% 37% Woodcreek 1274 1443 18% 47% 34% 55 98% 20% 45% 2% 473 12% 48% Woodloch 247 256 24% 73% 4% 36 97% 35% 28% 0% 163 1% 53% Woodsboro 1685 1624 27% 59% 14% 36 97% 69% 8% 17% 739 33% 67% Woodson 296 262 32% 50% 17% 39 99% 58% 8% 12% 132 36% 64% Woodville 2415 2308 27% 51% 22% 41 99% 60% 17% 23% 722 63% 73% Woodway 8733 8750 24% 60% 16% 45 98% 18% 51% 3% 4291 11% 88% Wortham 1082 1081 27% 55% 18% 36 97% 62% 11% 18% 415 30% 75% Yantis 321 354 24% 58% 17% 40 92% 68% 6% 20% 148 14% 57% Yoakum 5731 5720 29% 54% 17% 35 92% 67% 12% 21% 2274 62% 79% Yorktown 2271 2256 27% 52% 21% 40 97% 70% 11% 23% 862 46% 66% Zavalla 647 657 27% 58% 15% 36 100% 76% 5% 28% 210 27% 42%

Main Office Field Offices P.O. Box 12877 Austin, TX 78711 1700 N. Congress Ave., Ste 220 Austin, TX 78701
Phone: 512-936-6701Fax: 512-936-6776
Toll Free: 800-544-2042Email: [email protected]
Web: www.orca.state.tx.us
East Texas Technical Assistance Center, Nacogdoches: 936-560-4188South Texas Technical Assistance Center, Alice: 361-661-1665West Texas Technical Assistance Center, Levelland: 806-897-1113