2005 - textron financial · management’s letter t he year 2005 was very good for textron...
TRANSCRIPT

EFFICIENCY
GROWTH
DISCIPLINE
2005 Annual R
eport
InvestoR InquIRestextron Financial Corporation
treasury Department 40 Westminster street
P.o. Box 6687 Providence, RI 029040-6687
401-621-4200
CoMPAnY PuBLICAtIons AnD GeneRAL InFoRMAtIon
to receive a free copy of textron Financial Corporation’s seC filings or Annual Report, please call (401) 621-4200 or direct written correspondence to the treasury Department
at the address specified above. For more information regarding textron Financial and
its businesses, or an electronic copy of this Annual Report, visit our worldwide website
at www.textronfinancial.com.
© 2006 textron Financial Corporation

With a continuing focus on
attracting, developing and
retaining the best and the
brightest people, we have
never been more confident and
well-positioned for significant
and sustained growth in the
years ahead.
MANAGEMENT’S LETTER
the year 2005 was very good for textron Financial Corporation. It was a year in which we put our liquidating portfolio behind us, and, through our
strategy of focusing on our core businesses, delivered one billion dollars in core managed receivables growth. When you combine this substantial growth with historically low levels of delinquency and non-performing assets, it is clear that we are well-positioned for steady improvement in profitability.
We are focused on strong, disciplined growth and achieving high levels of customer satisfaction. We believe that, by reaching our aggressive customer satisfaction targets, we will achieve our financial objectives and, ultimately, become the premier commercial finance company. our strategy is to focus on growing existing businesses and products more quickly, while leveraging current platforms into adjacent spaces.
While solid growth and exceptional portfolio quality were delivered in 2005, we remain firmly committed to reducing expenses in order to successfully compete in today’s competitive environment. that said, numerous initiatives across our company are helping us to improve our operating efficiency. For instance, the acceleration of textron six sigma Lean is streamlining our processes, making it easier for employees to do their jobs and, therefore, easier for them to focus on the things that matter most – like forming and nurturing customer relationships, and applying extensive product knowledge and industry expertise to meet clients’ needs. Improvements to our technology systems and applications are also enhancing our ability to satisfy customers.
of course, underlying all that we are striving to accomplish is a highly skilled and motivated management team and workforce. With a continuing focus on attracting, developing and retaining the best and the brightest people, we have never been more confident and well-positioned for significant and sustained growth in the years ahead.
on behalf of the entire textron Financial management team, we thank our customers for their business and their loyalty. our greatest honor is to serve them and to work together to ensure the success of their business and ours. We also thank our employees, for it is only through their constant dedication, creativity, teamwork and discipline that we can proudly report steady progress toward our goals.
Ted FrenchChairman and CEO
Jay CarterPresident and COO
CoRPoRAte HeADquARteRstextron Financial Corporation40 Westminster streetProvidence, RI 02903401-621-4200www.textronfinancial.com
BUSINESS DIRECTORY
Aviation FinanceCessna Finance Corporation Leon F. Metzinger, President
220 West Douglas, suite 300 Wichita, Ks 67202 316-660-1206
Revolving Credit Group Jerry W. Britton, Group President
Asset-Based Lending
Business Credit Russell Brant, Division President
11575 Great oaks Way, suite 210 Alpharetta, GA 30022 770-360-9600
Systran Financial Services Corporation John F. enyart, Division President
4949 sW Meadows Road, suite 500 Lake oswego, oR 97035 503-675-5700
Distribution Finance
Diversified Products Russell Baqir, Division President
6110 Golden Hills Drive Golden valley, Mn 55416 763-847-1700
Large Ticket thomas J. Low, Division President
Private Brands Daniel G. Radley, Division President
11575 Great oaks Way, suite 210 Alpharetta, GA 30022 770-360-9600
Technology Finance Keith Boudreau, Division President
1180 Welsh Road, suite 280 north Wales PA 19454 215-412-5700
Golf FinanceRamon J. Munoz, Division President
11575 Great oaks Way, suite 210 Alpharetta, GA30022 770-360-9600
Resort FinanceDavid Wisen, Division President
45 Glastonbury Boulevard Glastonbury, Ct 06033 800-279-9691
Structured Capitalshanuah Y. Beamon, Division President
40 Westminster street Providence, RI 02903 401-621-4200
ServicesCapital Markets eric J. Karlson, President & Managing Director
TBS Insurance Agency Services, Inc. Karen Fox-nuri, vice President
Textron Business Services Inc. Martina Kuhlmeyer, President
40 Westminster street Providence, RI 02903 401-621-4200
Textron Financial Canada Limited Chris sharp, vice President & General Manager
Pierre Major, Division President
5515 north service Rd, 2nd Floor Burlington, on L7L 6G4 877-395-5368
OTHER SENIOR LEADERSHIP TEAM MEMBERS
Buell J. Carter, Jr., President & Chief operating officer
John F. Carey, executive vice President, strategy
thomas J. Cullen, executive vice President & Chief Financial officer
R. Rodney Weaver, executive vice President & Chief Credit officer
Peter n. James, executive vice President, textron six sigma
Charles F. LoCurto, executive vice President & Chief Information officer
Brian F. Lynn, senior vice President & treasurer
thomas n. nichipor, vice President & Corporate Controller
Karen P. Papa, senior vice President, Communications
elizabeth C. Perkins, executive vice President, General Counsel & secretary
Robert M. Powers, executive vice President, Human Resources
Debra A. Raymond, vice President, tax
Adele J. suddes, senior vice President, Marketing

FINANCIAL HIGHLIGHTS
• Managed finance receivables grew 11% or
$860 million to $8,995 million.
• Income from continuing operations before income
taxes and distributions on preferred securities was
$171 million, up 23% from 2004.
• Interest margin increased $18 million, reflecting
higher average receivables, but decreased as
a percentage to 6.40% from 7.14% in 2004,
primarily as a result of lower fee income and a
change in the mix of fixed rate finance receivables.
• Charge-offs improved to 0.51% of average
finance receivables from 1.48% in 2004, reflecting
continued improvement in our core operations
and liquidation of non-core portfolios.
• Non-performing assets were 1.53% of finance
assets, down from 2.08% in 2004, representing a
steady improvement in the quality of our assets.
Delinquency also improved to 0.79% from
1.47% in the prior year.
• Selling and administrative expenses as a
percentage of average managed and serviced
finance receivables was steady at 2.01%. The
performance reflected growth and a shift in mix
to higher expense level operations offset by Six
Sigma operational improvements.

Increase EFFICIENCY
Serving the resort, golf, hospitality and
marina industries, our commercial mortgages and
receivables-based revolving
lines of credit provide funding for acquisitions,
development, and expansion
opportunities.
“In addition to positively affecting our employees’ work experience, we have improved the experience that hundreds of customers have with Textron Financial.”
- Jeff Johnson, Textron Six Sigma Black Belt
Within Textron Financial, a primary focus in 2005 was to boost the efficiency of our processes, our
technology, and our people in order to prepare for consistent growth ahead. By doing so, we built a stronger, leaner foundation upon which we can develop new products and expand into adjacent spaces without increasing costly resources required to support them.
A key efficiency driver has been Textron Six Sigma and the acceleration of Lean, in particular. Lean efforts have greatly enabled our employees to work even more efficiently, which in turn has allowed them to focus more time on the things that matter most to our customers.
Today, we can say we are well on our way to making Six Sigma “the way we do our jobs and the way we do business.” Given the tremendous progress made in 2005, we can confidently claim that there isn’t a process or product that significantly influences our customers’
experience with us that hasn’t or won’t be improved through Six Sigma’s disciplined approach to waste elimination, variability reduction and innovative design.
All in all, operating efficiency has been – and will continue to be – a big deal at Textron Financial. We are driven by a realization that our customers feel the output of our processes. As we operate more efficiently, we believe our customers will become more satisfied with the service they receive – and this is one of our biggest competitive advantages.
Textron Financial earned top honors for best projects and best people at the
2005 Textron Six Sigma Top Gun Summit.
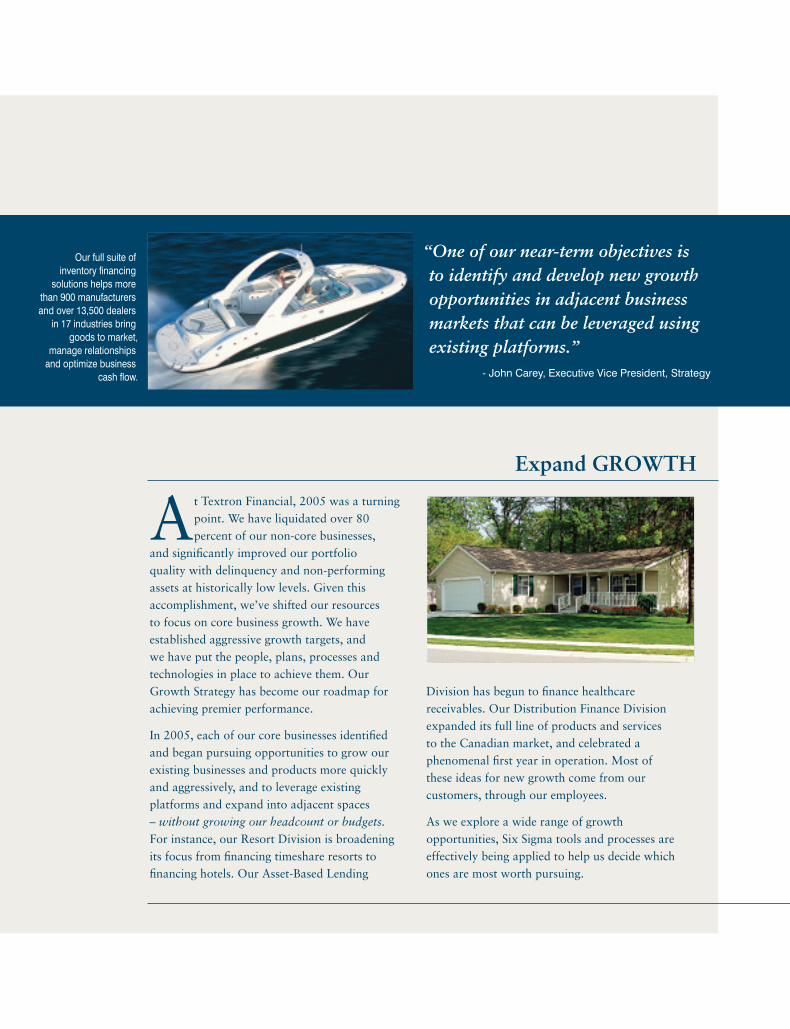
Expand GROWTH
At Textron Financial, 2005 was a turning point. We have liquidated over 80 percent of our non-core businesses,
and significantly improved our portfolio quality with delinquency and non-performing assets at historically low levels. Given this accomplishment, we’ve shifted our resources to focus on core business growth. We have established aggressive growth targets, and we have put the people, plans, processes and technologies in place to achieve them. Our Growth Strategy has become our roadmap for achieving premier performance.
In 2005, each of our core businesses identified and began pursuing opportunities to grow our existing businesses and products more quickly and aggressively, and to leverage existing platforms and expand into adjacent spaces – without growing our headcount or budgets. For instance, our Resort Division is broadening its focus from financing timeshare resorts to financing hotels. Our Asset-Based Lending
Division has begun to finance healthcare receivables. Our Distribution Finance Division expanded its full line of products and services to the Canadian market, and celebrated a phenomenal first year in operation. Most of these ideas for new growth come from our customers, through our employees.
As we explore a wide range of growth opportunities, Six Sigma tools and processes are effectively being applied to help us decide which ones are most worth pursuing.
“One of our near-term objectives is to identify and develop new growth opportunities in adjacent business markets that can be leveraged using existing platforms.”
- John Carey, Executive Vice President, Strategy
Our full suite of inventory financing
solutions helps more than 900 manufacturers and over 13,500 dealers
in 17 industries bring goods to market,
manage relationships and optimize business
cash flow.
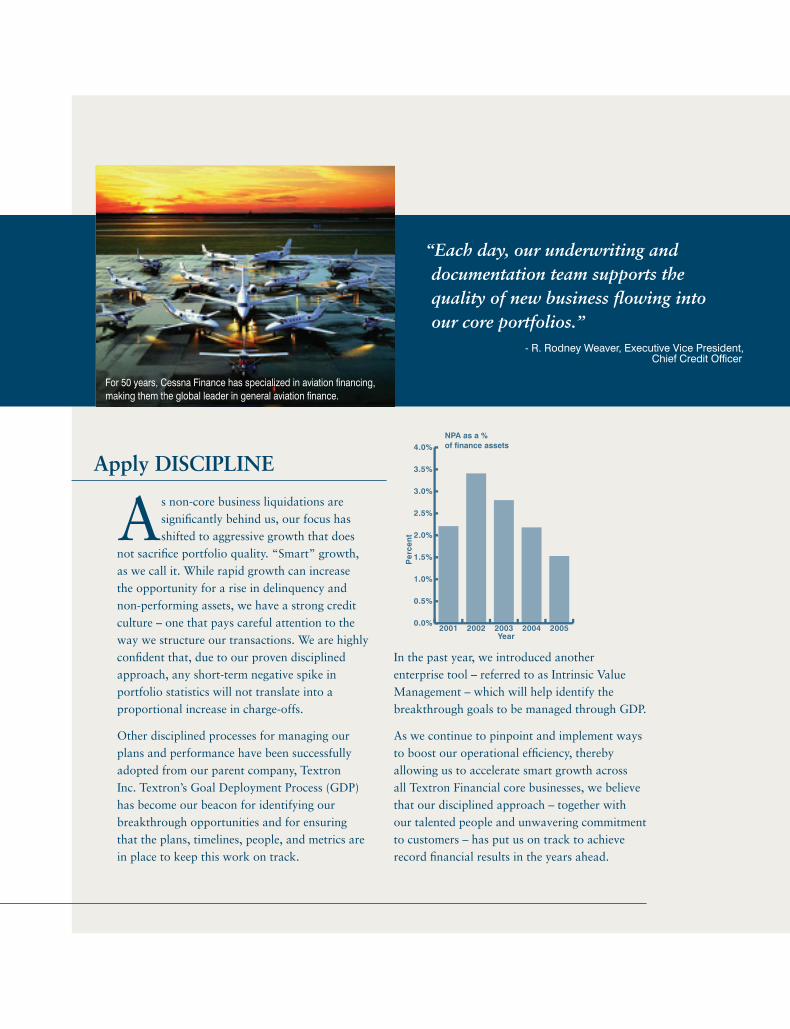
Apply DISCIpLINE
As non-core business liquidations are significantly behind us, our focus has shifted to aggressive growth that does
not sacrifice portfolio quality. “Smart” growth, as we call it. While rapid growth can increase the opportunity for a rise in delinquency and non-performing assets, we have a strong credit culture – one that pays careful attention to the way we structure our transactions. We are highly confident that, due to our proven disciplined approach, any short-term negative spike in portfolio statistics will not translate into a proportional increase in charge-offs.
Other disciplined processes for managing our plans and performance have been successfully adopted from our parent company, Textron Inc. Textron’s Goal Deployment Process (GDP) has become our beacon for identifying our breakthrough opportunities and for ensuring that the plans, timelines, people, and metrics are in place to keep this work on track.
In the past year, we introduced another enterprise tool – referred to as Intrinsic Value Management – which will help identify the breakthrough goals to be managed through GDP.
As we continue to pinpoint and implement ways to boost our operational efficiency, thereby allowing us to accelerate smart growth across all Textron Financial core businesses, we believe that our disciplined approach – together with our talented people and unwavering commitment to customers – has put us on track to achieve record financial results in the years ahead.
“Each day, our underwriting and documentation team supports the quality of new business flowing into our core portfolios.”
- R. Rodney Weaver, Executive Vice President, Chief Credit Officer
For 50 years, Cessna Finance has specialized in aviation financing, making them the global leader in general aviation finance.
UNITED STATESSECURITIES AND EXCHANGE COMMISSION
Washington, D.C. 20549
FORM 10-K¥ ANNUAL REPORT PURSUANT TO SECTION 13 OR 15(d) OF THE
SECURITIES EXCHANGE ACT OF 1934For the fiscal year ended December 31, 2005
OR
n TRANSITION REPORT PURSUANT TO SECTION 13 OR 15(d) OF THESECURITIES EXCHANGE ACT OF 1934
For the transition period from to
Commission file number 0-27559
Textron Financial Corporation(Exact Name of Registrant as Specified in Its Charter)
Delaware 05-6008768(State or Other Jurisdiction ofIncorporation or Organization)
(I.R.S. EmployerIdentification No.)
40 Westminster Street, P.O. Box 6687, Providence, R.I. 02940-6687(401) 621-4200
(Address of Principal Executive Offices)
Securities registered pursuant to Section 12(b) of the Act:Title of Class Name of Each Exchange on Which Registered
$100,000,000 5.125% Notes New York Stock Exchangedue August 15, 2014
Securities registered pursuant to Section 12(g) of the Act:
Common Stock, $100.00 par valueIndicate by check mark if the registrant is a well-known seasoned issuer as defined in Rule 405 of the Securities
Act. Yes ¥ No n
Indicate by check mark if the registrant is not required to file reports pursuant to Section 13 or Section 15(d) of theAct. Yes n No ¥
Indicate by check mark whether the registrant (1) has filed all reports required to be filed by Section 13 or 15(d) of theSecurities Exchange Act of 1934 during the preceding 12 months (or for such shorter period that the registrant was required tofile such reports) and (2) has been subject to such filing requirements for the past 90 days. Yes ¥ No n
Indicate by check mark if disclosure of delinquent filers pursuant to Item 405 of Regulation S-K is not contained herein, andwill not be contained herein, and will not be contained, to the best of registrant’s knowledge, in definitive proxy or informationstatements incorporated by reference in Part III of this Form 10-K or any amendment to this Form 10-K. (Not applicable).
Indicate by check mark whether the registrant is a large accelerated filer, an accelerated filer, or a non-accelerated filer. Seedefinition of “accelerated filer and large accelerated filer” in Rule 12b-2 of the Exchange Act. (Check one):
Large accelerated filer n Accelerated filer n Non-accelerated filer ¥
Indicate by check mark whether the registrant is a shell company (as defined in Exchange ActRule 12b-2). Yes n No ¥
All of the shares of common stock of the registrant are owned by Textron Inc. and there was no voting or non-votingcommon equity held by non-affiliates as of the last business day of the registrant’s most recently completed fiscal quarter.
REGISTRANT MEETS THE CONDITIONS SET FORTH IN GENERAL INSTRUCTION I(1)(a) AND (b) OF FORM 10-K AND IS THEREFORE FILING THIS FORM WITH THE REDUCEDDISCLOSURE FORMAT.

TABLE OF CONTENTS
PART I.Item 1. Business . . . . . . . . . . . . . . . . . . . . . . . . . . . . . . . . . . . . . . . . . . . . . . . . . . . . . . . . . . . . . . . 3
Item 1A. Risk Factors . . . . . . . . . . . . . . . . . . . . . . . . . . . . . . . . . . . . . . . . . . . . . . . . . . . . . . . . . . . . 8
Item 1B. Unresolved Staff Comments . . . . . . . . . . . . . . . . . . . . . . . . . . . . . . . . . . . . . . . . . . . . . . . . . 9
Item 2. Properties . . . . . . . . . . . . . . . . . . . . . . . . . . . . . . . . . . . . . . . . . . . . . . . . . . . . . . . . . . . . . . 9
Item 3. Legal Proceedings . . . . . . . . . . . . . . . . . . . . . . . . . . . . . . . . . . . . . . . . . . . . . . . . . . . . . . . . 9
Item 4. Submission of Matters to a Vote of Security Holders . . . . . . . . . . . . . . . . . . . . . . . . . . . . . . 10
PART II.Item 5. Market for Registrant’s Common Equity and Related Stockholder Matters. . . . . . . . . . . . . . . 10
Item 6. Selected Financial Data . . . . . . . . . . . . . . . . . . . . . . . . . . . . . . . . . . . . . . . . . . . . . . . . . . . . 10
Item 7. Management’s Discussion and Analysis of Financial Condition and Results of Operations . . . 11
Item 7A. Quantitative and Qualitative Disclosure About Market Risk . . . . . . . . . . . . . . . . . . . . . . . . . 26
Item 8. Financial Statements and Supplementary Data . . . . . . . . . . . . . . . . . . . . . . . . . . . . . . . . . . . 27
Item 9. Changes in and Disagreements with Accountants on Accounting and Financial Disclosure . . . 56
Item 9A. Controls and Procedures . . . . . . . . . . . . . . . . . . . . . . . . . . . . . . . . . . . . . . . . . . . . . . . . . . . 56
Item 9B. Other Information . . . . . . . . . . . . . . . . . . . . . . . . . . . . . . . . . . . . . . . . . . . . . . . . . . . . . . . . 56
PART III.Item 10. Directors and Executive Officers of the Registrant . . . . . . . . . . . . . . . . . . . . . . . . . . . . . . . . 57
Item 11. Executive Compensation . . . . . . . . . . . . . . . . . . . . . . . . . . . . . . . . . . . . . . . . . . . . . . . . . . . 57
Item 12. Security Ownership of Certain Beneficial Owners and Management . . . . . . . . . . . . . . . . . . . 57
Item 13. Certain Relationships and Related Transactions . . . . . . . . . . . . . . . . . . . . . . . . . . . . . . . . . . 57
Item 14. Principal Accounting Fees and Services . . . . . . . . . . . . . . . . . . . . . . . . . . . . . . . . . . . . . . . . 57
PART IV.Item 15. Exhibits, Financial Statement Schedules . . . . . . . . . . . . . . . . . . . . . . . . . . . . . . . . . . . . . . . . 57
2
PART I.
Item 1. Business
General
Textron Financial Corporation (Textron Financial or the Company) is a diversified commercial financecompany with core operations in six segments. Aircraft Finance provides financing for new and used Cessnabusiness jets, single engine turboprops, piston-engine airplanes, Bell helicopters, and other general aviation aircraft;Asset-Based Lending provides asset-based loans to middle-market companies in several industries, and providesfactoring arrangements primarily for freight companies; Distribution Finance primarily offers inventory financeprograms for dealers of Textron manufactured products and for dealers of a variety of other household, housing,leisure, agricultural and technology products; Golf Finance primarily makes mortgage loans for the acquisition andrefinancing of golf courses and provides term financing for E-Z-GO golf cars and Jacobsen turf-care equipment;Resort Finance primarily extends loans to developers of vacation interval resorts, secured primarily by notesreceivable and interval inventory; and Structured Capital primarily engages in long-term leases of large-ticketequipment and real estate, primarily with investment grade lessees. Textron Financial Corporation’s other financialservices and products include transaction syndication, equipment appraisal and disposition, and portfolio servicingoffered through Textron Business Services, Inc.
All of Textron Financial’s stock is owned by Textron Inc. (Textron), a global multi-industry company withoperations in four business segments: Bell, Cessna, Industrial and Finance. At December 31, 2005, 19% of TextronFinancial’s total managed finance receivables represent finance receivables originated in connection with the sale orlease of Textron manufactured products. For further information on Textron Financial’s relationship with Textron,see “Relationship with Textron” below.
Textron Financial’s financing activities are confined almost exclusively to secured lending and leasing tocommercial markets. Textron Financial’s services are offered primarily in North America. However, TextronFinancial finances certain Textron products worldwide, principally Bell helicopters and Cessna aircraft.
Textron Financial also maintains an Other segment that includes non-core assets related to franchise financeand media finance, and other liquidating portfolios from product lines that were discontinued in 2001. TheCompany ceased finance receivable originations in these business markets, and continues to actively manage theaccounts to maximize value as the accounts are collected or sold.
Consistent with the Company’s strategy to exit these non-core businesses, Textron Financial sold its smallbusiness direct portfolio (small business finance) in December 2003. The selected financial data in Item 6, and thediscussion of the Company’s results in Item 7, exclude the results of this discontinued operation, as defined bySFAS No. 144, “Accounting for the Impairment or Disposal of Long-lived Assets,” which is described in Note 4 tothe consolidated financial statements in Item 8 of this Form 10-K.
For additional financial information regarding Textron Financial’s business segments, refer to Note 20 to theconsolidated financial statements in Item 8 of this Form 10-K.
Competition
The commercial finance environment in which Textron Financial operates is highly fragmented and extremelycompetitive. Textron Financial is subject to competition from various types of financing institutions, includingbanks, leasing companies, insurance companies, commercial finance companies and finance operations ofequipment vendors. Competition within the commercial finance industry is primarily focused on price, terms,structure and service. The Company may lose market share to the extent that it is unwilling to match competitors’practices. To the extent that Textron Financial matches these practices, the Company may experience decreasedmargins, increased risk of credit losses or both. Many of Textron Financial’s competitors are large companies thathave substantial capital, technological and marketing resources. This has become increasingly the case given theconsolidation activity in the commercial finance industry. In some instances, Textron Financial’s competitors haveaccess to capital at lower costs than Textron Financial.
3

Relationship with Textron
General
Textron Financial derives a portion of its business from financing the sale and lease of products manufacturedand sold by Textron. Textron Financial paid Textron $0.8 billion in 2005 and $0.9 billion in both 2004 and 2003, forthe sale of manufactured products to third parties that were financed by the Company. In addition, the Companypaid Textron $41 million in 2005, $77 million in 2004 and $56 million in 2003 for the purchase of operating leaseequipment. Textron Financial recognized finance charge revenues from Textron and affiliates (net of payments orreimbursements for interest charged at more or less than market rates on Textron manufactured products) of$7 million in 2005 and $6 million in both 2004 and 2003, and operating lease revenues of $26 million in 2005,$24 million in 2004, and $22 million in 2003.
Textron Financial and Textron utilize an intercompany account for the allocation of Textron overhead chargesand for the settlement of captive receivables. For additional information regarding the relationship between TextronFinancial and Textron, see Notes 5, 6, and 11 to the consolidated financial statements in Item 8 of this Form 10-K.
Agreements with Textron
Textron Financial and Textron are parties to several agreements, which govern many areas of the TextronFinancial-Textron relationship. They are described below:
Receivables Purchase Agreement
Under a Receivables Purchase Agreement with Textron, Textron Financial has recourse to Textron with respectto certain finance receivables and operating leases relating to products manufactured and sold by Textron. Financereceivables of $252 million at December 31, 2005 and $330 million at January 1, 2005, and operating leases of$162 million at December 31, 2005, and $136 million at January 1, 2005, were subject to recourse to Textron or duefrom Textron.
Support Agreement with Textron
Under a Support Agreement with Textron dated as of May 25, 1994, Textron is required to pay to TextronFinancial, quarterly, an amount sufficient to provide that Textron Financial’s pre-tax earnings, before extraordinaryitems and fixed charges (including interest on indebtedness and amortization of debt discount “fixed charges”), asadjusted for the inclusion of required payments under the Support Agreement, will not be less than 125% of theCompany’s fixed charges. No such payments under the Support Agreement were required for the years ended 2005,2004 or 2003, when Textron Financial’s fixed-charge coverage ratios (as defined) were 177%, 189%, and 167%,respectively. Textron also has agreed to maintain Textron Financial’s consolidated shareholder’s equity at anamount no less than $200 million. Pursuant to the terms of the Support Agreement, Textron is required to directly orindirectly own 100% of Textron Financial’s common stock. The Support Agreement also contains a third-partybeneficiary provision entitling Textron Financial’s lenders to enforce its provisions against Textron.
Tax Sharing Agreement with Textron
Textron Financial’s revenues and expenses are included in the consolidated federal tax return of Textron. TheCompany files some of its state income tax returns on a separate basis. Under a Tax Sharing Agreement withTextron, Textron Financial is allocated federal tax benefits and charges on the basis of statutory U.S. tax ratesapplied to the Company’s taxable income or loss included in the consolidated returns. The benefits of generalbusiness credits, foreign tax credits and any other tax credits are utilized in computing current tax liability. TextronFinancial is paid for tax benefits generated and utilized in Textron’s consolidated federal and unitary or combinedstate income tax returns, whether or not the Company would have been able to utilize those benefits on a separatetax return. Income tax assets or liabilities are settled on a quarterly basis. Textron has agreed to loan TextronFinancial, on a junior subordinated interest-free basis, an amount equal to Textron’s deferred income tax liabilityattributable to the manufacturing profit not yet recognized for tax purposes on products manufactured by Textron
4
and financed by Textron Financial. Borrowings under this arrangement are reflected in “Amounts due to TextronInc.” on the Consolidated Balance Sheets in Item 8 of this Form 10-K.
Regulations
Textron Financial’s activities are subject, in certain instances, to supervision and regulation by state and federalgovernmental authorities. These activities also may be subject to various laws, including consumer finance laws insome instances, and judicial and administrative decisions imposing various requirements and restrictions, which,among other things:
• Regulate credit-granting activities;
• Establish maximum interest rates, finance charges and other charges;
• Require disclosures to customers;
• Govern secured transactions;
• Affect insurance brokerage activities; and
• Set collection, foreclosure, repossession and claims handling procedures and other trade practices.
Although most states do not intensively regulate commercial finance activity, many states impose limitationson interest rates and other charges, and prohibit certain collection and recovery practices. They also may requirelicensing of certain business activities and specific disclosure of certain contract terms. The Company also may besubject to regulation in those foreign countries in which it has operations.
Existing statutes and regulations have not had a material adverse effect on the Company’s business. However,it is not possible to forecast the nature of future legislation, regulations, judicial decisions, orders or interpretationsor their impact upon Textron Financial’s future business, financial condition, results of operations or prospects.
Employees
As of December 31, 2005, Textron Financial had 1,135 employees. The Company is not subject to anycollective bargaining agreements.
Risk Management
Textron Financial’s business activities involve various elements of risk. The Company considers the principaltypes of risk to be:
• Credit risk;
• Asset/liability risk (including interest rate and foreign exchange risk); and
• Liquidity risk.
Proper management of these risks is essential to maintaining profitability. Accordingly, the Company hasdesigned risk management systems and procedures to identify and quantify these risks. Textron Financial hasestablished appropriate policies and set prudent limits in these areas. The Company’s management of these risks,and levels of compliance with its policies and limits, is continuously monitored by means of administrative andinformation systems.
Credit Risk Management
Textron Financial manages credit risk through:
• Underwriting procedures;
• Centralized approval of individual transactions exceeding certain size limits; and
• Active portfolio and account management.
5
The Company has developed underwriting procedures for each operating unit that assess a prospectivecustomer’s ability to perform in accordance with financing terms. These procedures include:
• Analyzing business or property cash flows and collateral values;
• Performing financial sensitivity analyses; and
• Assessing potential exit strategies.
Textron Financial has developed a tiered credit approval system, which allows certain transaction types andsizes to be approved at the operating unit level. The delegation of credit authority is done under strict policyguidelines. Textron Financial’s operating units are also subject to annual internal audits by the Company andTextron.
Depending on transaction size and complexity, transactions outside of operating unit authority require theapproval of a Group President and Group Credit Officer or Corporate Risk Management Officer. Transactionsexceeding group authority require one or more of the Executive Vice President and Chief Credit Officer, thePresident and Chief Operating Officer, Textron Financial’s Credit Committee, or the Chairman and Chief ExecutiveOfficer depending on the size of the transaction, and in some cases approvals are required by Textron up to andincluding its Board of Directors. Textron Financial’s Credit Committee is comprised of its President and ChiefOperating Officer, Executive Vice President and Chief Credit Officer, Executive Vice President and Chief FinancialOfficer, Executive Vice President, General Counsel and Secretary, Senior Vice President and Treasurer, and GroupPresident of the Revolving Credit Group.
The Company controls the credit risk associated with its portfolio by limiting transaction sizes, as well asdiversifying transactions by industry, geographic area, property type and borrower. Through these practices,Textron Financial identifies and limits exposure to unfavorable risks and seeks favorable financing opportunities.Management reviews receivable aging trends and watch list reports and conducts regular business reviews in orderto monitor portfolio performance. Certain receivable transactions are originated with the intent of fully or partiallyselling them. This strategy provides an additional tool to manage credit risk.
Geographic Concentration
Textron Financial continuously monitors its portfolio to avoid any undue geographic concentration in anyregion of the U.S. or in any foreign country. The largest concentration of domestic receivables was in theSoutheastern U.S., representing 26% of Textron Financial’s total managed finance receivable portfolio at Decem-ber 31, 2005. International receivables are generated mostly in support of Textron product sales. At December 31,2005, international receivables represented 14% of Textron Financial’s managed finance receivable portfolio. Foradditional information regarding Textron Financial’s concentrations, see Note 6 to the consolidated financialstatements in Item 8 of this Form 10-K.
Asset/Liability Risk Management
The Company continuously measures and quantifies interest rate risk and foreign exchange risk, in each casetaking into account the effect of hedging activity. Textron Financial uses derivatives as an integral part of its asset/liability management program in order to reduce:
• Interest rate exposure arising from changes in interest rates; and
• Foreign currency exposure arising from changes in exchange rates.
The Company does not use derivative financial instruments for the purpose of generating earnings fromchanges in market conditions. Before entering into a derivative transaction, the Company determines that there is ahigh correlation between the change in value of, or the cash flows associated with, the hedged asset or liability andthe value of, or the cash flows associated with, the derivative instrument. When Textron Financial executes atransaction, it designates the derivative to a specific asset, liability, or set of cash flows and as either a fair value orcash flow hedge. Textron Financial monitors the effectiveness of derivatives through a review of the amounts and
6
maturities of assets, liabilities and derivative positions. The Company’s Treasurer and Chief Financial Officerregularly review this information, so that appropriate remedial action can be taken, as necessary.
Textron Financial carefully manages exposure to counterparty risk in connection with its derivatives. Ingeneral, the Company engages in transactions with counterparties having ratings of at least A by Standard & Poor’sRating Service or A2 by Moody’s Investors Service. Total credit exposure is monitored by counterparty, andmanaged within prudent limits. At December 31, 2005, the Company’s largest single counterparty credit exposurewas $10 million.
Interest Rate Risk Management
Textron Financial manages interest rate risk by monitoring the duration and interest rate sensitivities of itsassets, and by incurring liabilities (either directly or synthetically with derivatives) having a similar duration andinterest sensitivity profile. The Company’s internal policies limit the aggregate mismatch of floating rate assets andliabilities to 10% of total assets. For additional information regarding Textron Financial’s interest rate risk, see“Management’s Discussion and Analysis of Financial Condition and Results of Operations — Interest RateSensitivity,” in Item 7 of this Form 10-K.
Foreign Exchange Risk Management
A portion of the finance assets owned by Textron Financial are located outside of the United States. Thesereceivables are generally in support of Textron’s overseas product sales and are predominantly denominated inU.S. Dollars. Textron Financial has foreign currency receivables denominated in Canadian Dollars and AustralianDollars. In order to minimize the effect of fluctuations in foreign currency exchange rates on the Company’sfinancial results, Textron Financial borrows in these currencies and/or enters into forward exchange contracts andforeign currency interest rate exchange agreements in amounts sufficient to substantially hedge its foreign currencyexposures.
Liquidity Risk Management
The Company uses cash to fund asset growth and to meet debt obligations and other commitments. TextronFinancial’s primary sources of funds are:
• Cash from operations;
• Commercial paper borrowings;
• Issuances of medium-term notes and other term debt securities; and
• Syndication and securitization of receivables.
All commercial paper borrowings are fully backed by committed bank lines of credit, providing liquidity in theevent of capital market disruption. If Textron Financial is unable to access these markets on acceptable terms, theCompany can draw on its bank line of credit facilities and use cash flows from operations and portfolio liquidationsto satisfy its liquidity needs. For additional information regarding Textron Financial’s liquidity risk management,see “Management’s Discussion and Analysis of Financial Condition and Results of Operations — Liquidity andCapital Resources,” in Item 7 of this Form 10-K.
Available Information
The Company makes available free of charge on its Internet website (http://www.textronfinancial.com) ourAnnual Report on Form 10-K, Quarterly Reports on Form 10-Q, Current Reports on Form 8-K, and amendments tothose reports filed or furnished pursuant to Section 13(a) or 15(d) of the Securities Exchange Act of 1934 as soon asreasonably practicable after the Company electronically files such material with, or furnishes it to, the Securitiesand Exchange Commission.
7
Item 1A. Risk Factors
Our financial results are subject to a number of risks. The factors discussed below are intended to highlightrisks that management believes are most relevant to our current operating environment. This listing is not intendedto capture all risks associated with our business. Additional risks, including those generally affecting the industry inwhich we operate, risks that we currently deem immaterial and risks generally applicable to companies that haverecently undertaken similar transactions, may also negatively impact our liquidity, financial position or results ofoperations.
We may be unable to effectively mitigate pricing pressures
Our business, financial condition and results of operations are subject to various risks, including thosediscussed below, which may affect the value of our securities. The risks discussed below are those that we believeare currently the most significant, although additional risks not presently known to us or that we currently deem lesssignificant may also impact our business, financial condition and results of operations, perhaps materially.
Our business is dependent on its continuing access to reliable capital markets
We depend on our ability to access reliable sources of capital in order to fund asset growth, fund operations,and meet debt obligations and other commitments. We currently raise capital through commercial paper borrow-ings, issuances of medium-term notes and other term debt securities and syndication and securitization ofreceivables. Additional liquidity is provided through bank lines of credit. Much of the capital markets fundingis made possible by the maintenance of credit ratings that are acceptable to investors. If our credit ratings were to belowered, it may disrupt our ability to access the capital markets. We could also lose access to financing for otherreasons, such as a general disruption of the capital markets. Any disruption of our access to the capital markets couldadversely affect our business and profitability.
If we are unable to maintain portfolio credit quality, our financial performance may be adversely affected
A key determinant of financial performance is our ability to maintain the quality of loans, leases and othercredit products in its finance asset portfolios. Portfolio quality may adversely be affected by several factors,including our finance receivable underwriting procedures, collateral quality, geographic or industry concentrations,or general economic downturns. Any inability to successfully collect our finance receivable portfolio and to resolveproblem accounts may adversely affect our cash flow, profitability, and financial condition.
The use of estimates and assumptions in determining our allowance for losses may adversely affect ourprofitability
We examine current delinquencies, historical loss experience, the value of the underlying collateral andgeneral economic conditions in determining our allowance for losses. The use of estimates and assumptions in theaforementioned considerations is inherently subjective, and any changes in these assumptions or estimates maymaterially impact our allowance for losses, profitability and financial condition.
Currency and interest rate fluctuations, and our ability to hedge those transactions may adversely affect ourresults
We are affected by changes in foreign exchange rates and interest rates. Changes in foreign exchange rates mayadversely affect our income from international operations and the value realized on assets and liabilities denom-inated in non-functional currencies. Increases or decreases in interest rates may adversely affect interest marginsdue to variances between the interest rate profile of our receivable portfolio and our debt obligations. Thesevariances can be attributed to a combination of interest rate and currency basis differences, asset/liability durationdifferences, and the portion of our receivable portfolio funded by equity. Changes in our credit ratings may alsoadversely affect interest rates on future borrowings, which would impact our profitability.
In some instances, we enter into hedging instruments to mitigate fluctuations in foreign exchange rates andinterest rates. If our hedging instruments are ineffective, these risks may not be adequately mitigated. Our hedging
8
transactions rely on assumptions regarding portfolio mix, portfolio duration, and currency exposures. Changes inthe assumptions supporting our hedging strategy may have a significant impact on our profitability, financialcondition, or results of operations.
Unanticipated changes in tax rates or exposure to additional income tax liabilities could affect ourprofitability
We are subject to income taxes in both the United States and various foreign jurisdictions, and our domesticand international tax liabilities are subject to the allocation of expenses in different jurisdictions. Our effective taxrates could be adversely affected by changes in the mix of earnings in countries with differing statutory tax rates, inthe valuation of deferred tax assets and liabilities, in tax laws or by material audit assessments, which could affectour profitability. In particular, the carrying value of deferred tax assets is dependent on our ability to generate futuretaxable income. In addition, the amount of income taxes we pay is subject to ongoing audits in various jurisdictions,and a material assessment by a governing tax authority could affect our profitability.
An interruption of our information technology networks may limit our ability to conduct our regular opera-tions and react to sudden changes in market conditions, both of which could adversely impact our results
We are heavily reliant upon the flow of information across the enterprise to facilitate our normal day-to-dayoperations. This information flow is primarily governed by the continuous and uninterrupted dissemination of dataacross our information technology networks. The operational oversight of these networks is the responsibility of athird-party service provider, and any lapse or interruption in the systems’ operations could restrict the flow ofinformation. These interruptions could potentially result in our inability to adequately conduct our operations,including making necessary funds available to repay maturing debt, funding loan commitments to customers, andswiftly reacting to sudden changes in market conditions.
Changes in the regulatory environment in which we operate could have an adverse affect on our businessand earnings
We operate in the United States and certain other foreign markets, and we are subject to the supervision andregulation by governing bodies in those jurisdictions. Any noncompliance with the laws and regulations in thosejurisdictions could result in the suspension or revocation of any licenses we hold or registrations at issue, as well asthe imposition of civil or criminal penalties. Any inability to remain in compliance with applicable regulatoryrequirements could have a material adverse effect on our operations by limiting our access to capital, as well asnegatively impacting our public standing. Additionally, no assurance can be provided that laws and regulations thatare applicable to our current operations will not be amended or interpreted differently, that new laws and regulationswill not be passed which materially change our current business practices or operations, or that we will not beprohibited by state laws from raising interest rates above certain desired levels, any of which could adversely impactour business, financial condition or results of operations.
Item 1B. Unresolved Staff Comments
None.
Item 2. Properties
Textron Financial leases office space from a Textron affiliate for its corporate headquarters at 40 WestminsterStreet, Providence, Rhode Island 02903. The Company leases other offices throughout North America. Foradditional information regarding Textron Financial’s lease obligations, see Note 18 to the consolidated financialstatements in Item 8 of this Form 10-K.
Item 3. Legal Proceedings
There are pending or threatened lawsuits and other proceedings against Textron Financial and its subsidiaries.Some of these suits and proceedings seek compensatory, treble or punitive damages in substantial amounts. Thesesuits and proceedings are being defended by, or contested on behalf of, Textron Financial and its subsidiaries. On the
9
basis of information presently available, Textron Financial believes any such liability would not have a materialeffect on Textron Financial’s financial position or results of operations.
Item 4. Submission of Matters to a Vote of Security Holders
Omitted per Instruction I of Form 10-K.
PART II.
Item 5. Market for Registrant’s Common Equity and Related Stockholder Matters
The common stock of Textron Financial is owned entirely by Textron and, therefore, there is no trading ofTextron Financial’s stock. Dividends of $109 million, $80 million and $114 million were declared and paid in 2005,2004, and 2003, respectively. For additional information regarding restrictions as to dividend availability, seeNote 11 to the consolidated financial statements in Item 8 of this Form 10-K.
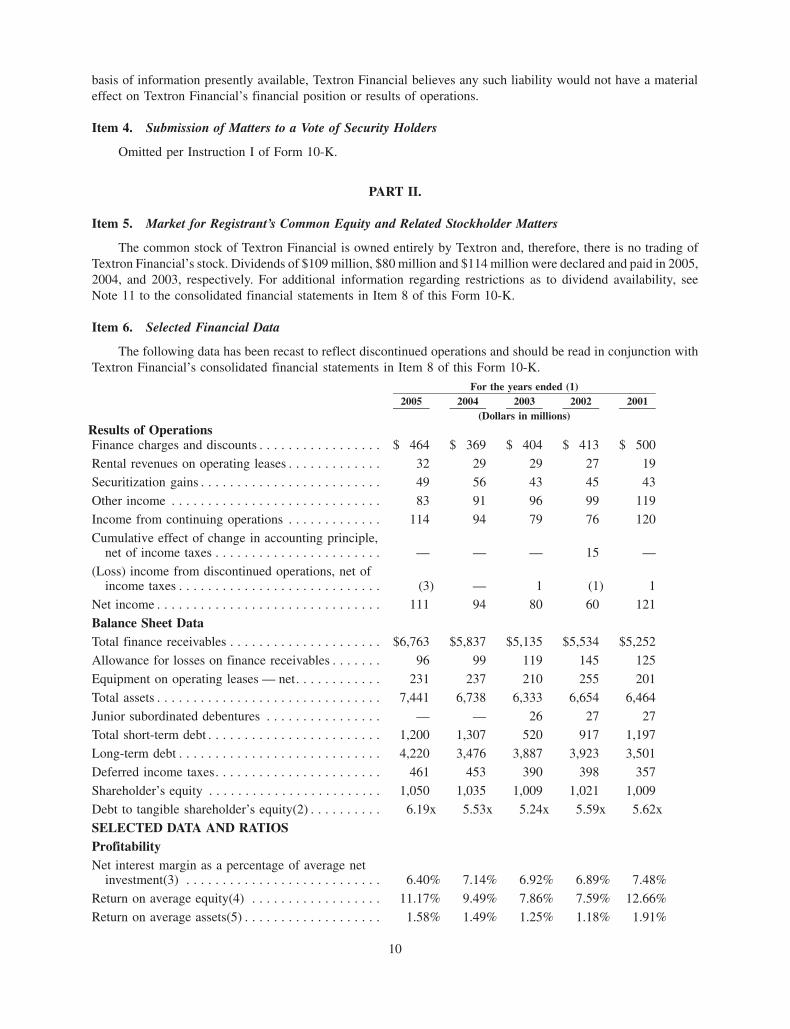
Item 6. Selected Financial Data
The following data has been recast to reflect discontinued operations and should be read in conjunction withTextron Financial’s consolidated financial statements in Item 8 of this Form 10-K.
2005 2004 2003 2002 2001For the years ended (1)
(Dollars in millions)Results of OperationsFinance charges and discounts . . . . . . . . . . . . . . . . . $ 464 $ 369 $ 404 $ 413 $ 500
Rental revenues on operating leases . . . . . . . . . . . . . 32 29 29 27 19Securitization gains . . . . . . . . . . . . . . . . . . . . . . . . . 49 56 43 45 43
Other income . . . . . . . . . . . . . . . . . . . . . . . . . . . . . 83 91 96 99 119
Income from continuing operations . . . . . . . . . . . . . 114 94 79 76 120
Cumulative effect of change in accounting principle,net of income taxes . . . . . . . . . . . . . . . . . . . . . . . — — — 15 —
(Loss) income from discontinued operations, net ofincome taxes . . . . . . . . . . . . . . . . . . . . . . . . . . . . (3) — 1 (1) 1
Net income . . . . . . . . . . . . . . . . . . . . . . . . . . . . . . . 111 94 80 60 121
Balance Sheet DataTotal finance receivables . . . . . . . . . . . . . . . . . . . . . $6,763 $5,837 $5,135 $5,534 $5,252
Allowance for losses on finance receivables . . . . . . . 96 99 119 145 125
Equipment on operating leases — net. . . . . . . . . . . . 231 237 210 255 201
Total assets . . . . . . . . . . . . . . . . . . . . . . . . . . . . . . . 7,441 6,738 6,333 6,654 6,464
Junior subordinated debentures . . . . . . . . . . . . . . . . — — 26 27 27
Total short-term debt . . . . . . . . . . . . . . . . . . . . . . . . 1,200 1,307 520 917 1,197
Long-term debt . . . . . . . . . . . . . . . . . . . . . . . . . . . . 4,220 3,476 3,887 3,923 3,501
Deferred income taxes. . . . . . . . . . . . . . . . . . . . . . . 461 453 390 398 357
Shareholder’s equity . . . . . . . . . . . . . . . . . . . . . . . . 1,050 1,035 1,009 1,021 1,009
Debt to tangible shareholder’s equity(2) . . . . . . . . . . 6.19x 5.53x 5.24x 5.59x 5.62x
SELECTED DATA AND RATIOSProfitabilityNet interest margin as a percentage of average net
investment(3) . . . . . . . . . . . . . . . . . . . . . . . . . . . 6.40% 7.14% 6.92% 6.89% 7.48%
Return on average equity(4) . . . . . . . . . . . . . . . . . . 11.17% 9.49% 7.86% 7.59% 12.66%
Return on average assets(5) . . . . . . . . . . . . . . . . . . . 1.58% 1.49% 1.25% 1.18% 1.91%
10
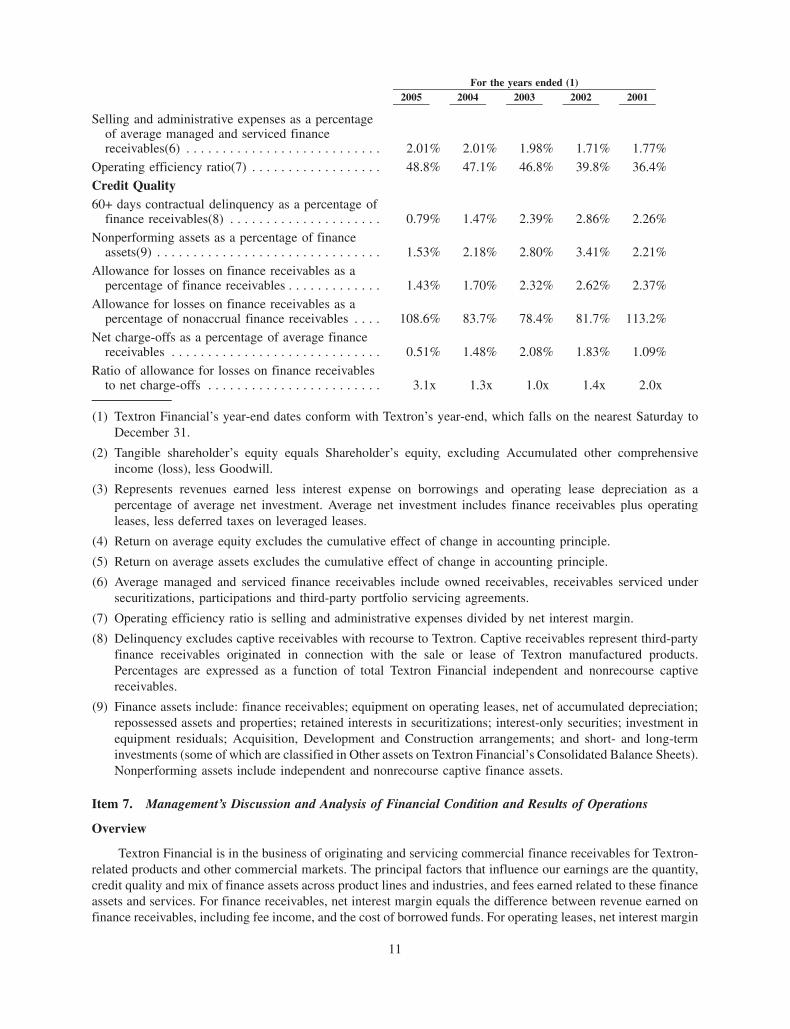
2005 2004 2003 2002 2001For the years ended (1)
Selling and administrative expenses as a percentageof average managed and serviced financereceivables(6) . . . . . . . . . . . . . . . . . . . . . . . . . . . 2.01% 2.01% 1.98% 1.71% 1.77%
Operating efficiency ratio(7) . . . . . . . . . . . . . . . . . . 48.8% 47.1% 46.8% 39.8% 36.4%
Credit Quality60+ days contractual delinquency as a percentage of
finance receivables(8) . . . . . . . . . . . . . . . . . . . . . 0.79% 1.47% 2.39% 2.86% 2.26%
Nonperforming assets as a percentage of financeassets(9) . . . . . . . . . . . . . . . . . . . . . . . . . . . . . . . 1.53% 2.18% 2.80% 3.41% 2.21%
Allowance for losses on finance receivables as apercentage of finance receivables . . . . . . . . . . . . . 1.43% 1.70% 2.32% 2.62% 2.37%
Allowance for losses on finance receivables as apercentage of nonaccrual finance receivables . . . . 108.6% 83.7% 78.4% 81.7% 113.2%
Net charge-offs as a percentage of average financereceivables . . . . . . . . . . . . . . . . . . . . . . . . . . . . . 0.51% 1.48% 2.08% 1.83% 1.09%
Ratio of allowance for losses on finance receivablesto net charge-offs . . . . . . . . . . . . . . . . . . . . . . . . 3.1x 1.3x 1.0x 1.4x 2.0x
(1) Textron Financial’s year-end dates conform with Textron’s year-end, which falls on the nearest Saturday toDecember 31.
(2) Tangible shareholder’s equity equals Shareholder’s equity, excluding Accumulated other comprehensiveincome (loss), less Goodwill.
(3) Represents revenues earned less interest expense on borrowings and operating lease depreciation as apercentage of average net investment. Average net investment includes finance receivables plus operatingleases, less deferred taxes on leveraged leases.
(4) Return on average equity excludes the cumulative effect of change in accounting principle.
(5) Return on average assets excludes the cumulative effect of change in accounting principle.
(6) Average managed and serviced finance receivables include owned receivables, receivables serviced undersecuritizations, participations and third-party portfolio servicing agreements.
(7) Operating efficiency ratio is selling and administrative expenses divided by net interest margin.
(8) Delinquency excludes captive receivables with recourse to Textron. Captive receivables represent third-partyfinance receivables originated in connection with the sale or lease of Textron manufactured products.Percentages are expressed as a function of total Textron Financial independent and nonrecourse captivereceivables.
(9) Finance assets include: finance receivables; equipment on operating leases, net of accumulated depreciation;repossessed assets and properties; retained interests in securitizations; interest-only securities; investment inequipment residuals; Acquisition, Development and Construction arrangements; and short- and long-terminvestments (some of which are classified in Other assets on Textron Financial’s Consolidated Balance Sheets).Nonperforming assets include independent and nonrecourse captive finance assets.
Item 7. Management’s Discussion and Analysis of Financial Condition and Results of Operations
Overview
Textron Financial is in the business of originating and servicing commercial finance receivables for Textron-related products and other commercial markets. The principal factors that influence our earnings are the quantity,credit quality and mix of finance assets across product lines and industries, and fees earned related to these financeassets and services. For finance receivables, net interest margin equals the difference between revenue earned onfinance receivables, including fee income, and the cost of borrowed funds. For operating leases, net interest margin
11

equals revenue earned on operating leases, less depreciation expense and the cost of borrowed funds. On certaintypes of finance receivables, interest rates earned are fixed at the time the contracts are originated, while other typesare based on floating rates that are generally tied to changes in the prime rate offered by major banks or the LondonInterbank Offered Rate (LIBOR). Rental charges on operating leases may be fixed at the time the contracts areoriginated or based on floating rates that are generally tied to changes in LIBOR.
Textron Financial borrows funds at various maturities at both fixed and floating interest rates to match theinterest sensitivities and maturities of its finance receivables. External market conditions and our debt ratings affectthese interest rates. We also may, from time to time, enter into interest rate exchange agreements related to new debtissuances in an effort to access the debt markets in the most efficient manner available at the time of issuance. As analternative source of funding, Textron Financial sells finance receivables in securitizations, retaining an interest inthe sold receivables and continuing to service such receivables for a fee.
Our business performance is assessed on an owned, managed and a serviced basis. The owned basis includesonly the finance receivables owned and reported on the consolidated balance sheet. The managed basis includesowned finance receivables and finance receivables sold in securitizations and whole-loan sale transactions, wherewe have retained substantial credit risk, and continue to service the accounts. The serviced basis includes managedreceivables and serviced-only receivables, which generally consist of finance receivables of resort developers andother third-party financial institutions without retained credit risk.
Textron Financial retains subordinated interests in finance receivables sold in securitizations and recourseobligations on certain whole-loan portfolio sales resulting in credit risk. As a result, we evaluate finance receivablesand leverage on a managed as well as an owned basis. In contrast, we do not have a retained financial interest orcredit risk in the performance of the serviced portfolio and, therefore, performance of these portfolios is limited tobilling and collection activities.
Key Business Initiatives and Trends
During 2005, Textron Financial experienced continued improvements in portfolio quality and growth in itscore businesses. While the collectibility of the Company’s finance receivable portfolio remains one of theCompany’s most significant business risks, the improved portfolio quality statistics in 2005 reflect the Company’ssuccessful efforts to resolve problem accounts. Nonperforming assets as a percentage of total finance assetsdecreased to 1.53% at December 31, 2005 from 2.18% at January 1, 2005, and delinquency as a percentage offinance receivables decreased to 0.79% at December 31, 2005 from 1.47% at January 1, 2005, resulting in a 50%decline in provision for losses in 2005 as compared to 2004. Management expects relative stability in these statisticsduring 2006; however, we could experience an out-of-trend result in any one quarter.
We experienced strong growth in the core business portfolios in 2005. Finance receivables in the corebusinesses increased $1.0 billion as compared to January 1, 2005, primarily related to growth in DistributionFinance ($640 million), Golf Finance ($243 million), and Asset-Based Lending ($179 million). We expect this trendto continue in 2006.
Operating efficiency (the ratio of selling and administrative expenses divided by net interest margin) hascontinued to deteriorate over the last three years, primarily as a consequence of a lower net interest marginpercentage, increased performance-based compensation tied to the Company’s profitability, higher pension costsand stock option expense. The lower net interest margin percentage is a result of a shift in the mix of our fixed ratereceivable portfolios, lower relative receivable pricing due to competitive pressures, the loss of a Prime rate floorbenefit experienced in 2004, and lower other income. We expect the deterioration in operating efficiency to reversein 2006 based on continued process improvement initiatives and increases in net interest margin due to growth in thecore receivable portfolios.
Financial Condition
Liquidity and Capital Resources
Textron Financial mitigates liquidity risk (i.e., the risk that we will be unable to fund maturing liabilities or theorigination of new finance receivables) by developing and preserving reliable sources of capital. We use a variety of
12

financial resources to meet these capital needs. Cash is provided from finance receivable collections, sales andsecuritizations as well as the issuance of commercial paper and term debt in the public and private markets. Thisdiversity of capital resources enhances our funding flexibility, limits dependence on any one source of funds, andresults in cost-effective funding. In making particular funding decisions, management considers market conditions,prevailing interest rates and credit spreads, and the maturity profile of its assets and liabilities.
During 2005, our credit spreads continued to tighten as the result of a very strong corporate bond market andour improving credit profile. Term debt of $1.5 billion was issued in 2005 at historically narrow spreads.
As part of its commercial paper program, Textron Financial has a policy of maintaining unused committedbank lines of credit in an amount not less than outstanding commercial paper balances. These lines of creditcurrently total $1.5 billion, of which $500 million expires in July 2006 and $1.0 billion expires in 2010. The$500 million facility includes a one-year term out option, effectively extending its expiration into 2007. Lines ofcredit not reserved as support for outstanding commercial paper or letters of credit were $300 million atDecember 31, 2005, compared to $187 million at January 1, 2005. In addition, Textron Financial is permittedto borrow under Textron’s $1.3 billion revolving credit facility, which expires in 2010. None of these lines of creditwere used at December 31, 2005 or January 1, 2005. At December 31, 2005, we had a CAD 50 million uncommittedcredit facility, of which CAD $41 million remained unused. We also maintain an AUD 50 million committed creditfacility that expires in 2007, which remained unused at December 31, 2005. We also have a $25 million multi-currency committed credit facility, of which $20 million and $17 million remained unused at December 31, 2005and January 1, 2005, respectively. This facility expires in July 2006 and we expect to renew it prior to expiration.
Under a shelf registration statement filed with the Securities and Exchange Commission, we may issue publicdebt securities in one or more offerings up to a total maximum offering of $4.0 billion. Under this registrationstatement, $1.4 billion of term debt and CAD 0.1 billion of term debt was issued during 2005. The USD and CADproceeds from these issuances were used to fund receivable growth and repay short-term debt. At December 31,2005, Textron Financial had $1.8 billion of capacity under this registration statement.
The following table summarizes Textron Financial’s contractual payments and receipts as of December 31,2005, for the specified periods:
Less than1 Year
1-2Years
2-3Years
3-4Years
4-5Years
More than5 Years Total
Payments / Receipts Due by Period
(In millions)
Contractual payments:Commercial paper and other short-term
debt . . . . . . . . . . . . . . . . . . . . . . . . . . $1,200 $ — $ — $ — $ — $ — $1,200Term debt . . . . . . . . . . . . . . . . . . . . . . . 1,035 1,088 823 542 557 226 4,271Operating lease rental payments . . . . . . . 6 5 5 3 1 1 21
Total contractual payments . . . . . . . . . 2,241 1,093 828 545 558 227 5,492
Contractual receipts:Finance receivables. . . . . . . . . . . . . . . . . 2,350 1,015 850 584 566 1,398 6,763Operating lease rental receipts. . . . . . . . . 24 18 14 12 12 28 108
Total contractual receipts . . . . . . . . . . . . 2,374 1,033 864 596 578 1,426 6,871Cash . . . . . . . . . . . . . . . . . . . . . . . . . . . 10 — — — — — 10
Total cash and contractual receipts. . . . 2,384 1,033 864 596 578 1,426 6,881
Net cash and contractual receipts(payments) . . . . . . . . . . . . . . . . . . . . . $ 143 $ (60) $ 36 $ 51 $ 20 $1,199 $1,389
Cumulative net cash and contractualreceipts . . . . . . . . . . . . . . . . . . . . . . . . $ 143 $ 83 $119 $170 $190 $1,389
Finance receivable receipts are based on contractual cash flows. These amounts could differ due to prepay-ments, charge-offs and other factors. Contractual receipts and payments exclude finance charges and discounts fromreceivables, debt interest payments, proceeds from sale of operating lease equipment and other items.
13

At December 31, 2005, Textron Financial had unused commitments to fund new and existing customers under$1.2 billion of committed revolving lines of credit as compared to $1.0 billion at January 1, 2005. These loancommitments generally expire within one year. Since many of the agreements will not be used to the extentcommitted or will expire unused, the total commitment amount does not necessarily represent future cashrequirements.
Textron Financial’s credit ratings are as follows: Standard & Poor’s (A- long-term, A2 short-term, outlookstable), Moody’s Investors Service (A3 long-term, P2 short-term, outlook stable) and Fitch Ratings (A- long-term,F2 short-term, outlook positive).
Cash provided by operating activities of continuing operations totaled $247 million in 2005, $161 million in2004 and $242 million in 2003. The increase in the cash provided in 2005 was primarily due to the timing of accruedinterest and other liabilities, principally as a result of a $60 million income tax payment in the first quarter of 2004and an increase in income from continuing operations. The decrease in the cash provided in 2004 as compared to2003, was primarily due to the timing of payments of accrued interest and other liabilities, principally as a result ofthe $60 million income tax payment in the first quarter of 2004.
Cash (used) provided by investing activities of continuing operations totaled $(950) million in 2005,$(756) million in 2004 and $273 million in 2003. The decrease in cash flows in 2005 was largely the result ofa $122 million increase in finance receivable originations, net of cash collections as compared to 2004, and lowerproceeds from disposition of operating leases and other assets of $33 million. The decrease in cash flows in 2004was largely the result of a $227 million increase in finance receivable originations, net of cash collections, and a$768 million decrease in proceeds from receivable sales, including securitizations.
Cash provided (used) by financing activities of continuing operations totaled $587 million in 2005, $361 mil-lion in 2004 and $(355) million in 2003. The increase in cash flows during 2005, and 2004 principally reflects anincrease in debt outstanding to fund asset growth. The cash used in 2003 mostly relates to the use of proceedsreceived from finance receivable sales in the fourth quarter to pay down commercial paper and other short-termdebt.
Net cash used by discontinued operations in 2005 and 2004, reflects cash reimbursements related to a losssharing agreement entered into as part of the small business finance sale in 2003. In 2003, net cash provided bydiscontinued operations included the receipt of $421 million upon the sale of substantially all of the small businessfinance operation.
Because the finance business involves the purchase and carrying of receivables, a relatively high ratio ofborrowings to net worth is customary. Debt as a percentage of total capitalization was 84% at December 31, 2005,compared to 82% at January 1, 2005. Our ratio of earnings to fixed charges was 1.77x in 2005, 1.89x in 2004 and1.67x in 2003. Commercial paper and Other short-term debt as a percentage of total debt was 22% at December 31,2005, compared to 27% at January 1, 2005.
In 2005, Textron Financial declared and paid $109 million of dividends to Textron, compared to $80 million ofdividends declared and paid in 2004. The higher level of dividends in 2005 was the result of improved profitability,and a return of capital required to maintain targeted leverage ratios. Textron contributed capital of $9 million toTextron Financial in both 2005 and 2004, which consisted of Textron’s dividend on the preferred stock of TextronFunding Corporation.
Off-Balance Sheet Arrangements
Textron Financial sells finance receivables utilizing both securitizations and whole-loan sales. As a result ofthese transactions, finance receivables are removed from the balance sheet and the proceeds received are used toreduce recorded debt levels. Despite the reduction in the recorded balance sheet position, we generally retain asubordinated interest in the finance receivables sold through securitizations, which may affect operating resultsthrough periodic fair value adjustments. We sell receivables in whole-loan sales in which we retain a continuinginterest, through limited credit enhancement, in the form of a contingent liability related to finance receivable creditlosses and, to a lesser extent, prepayment risk.
14
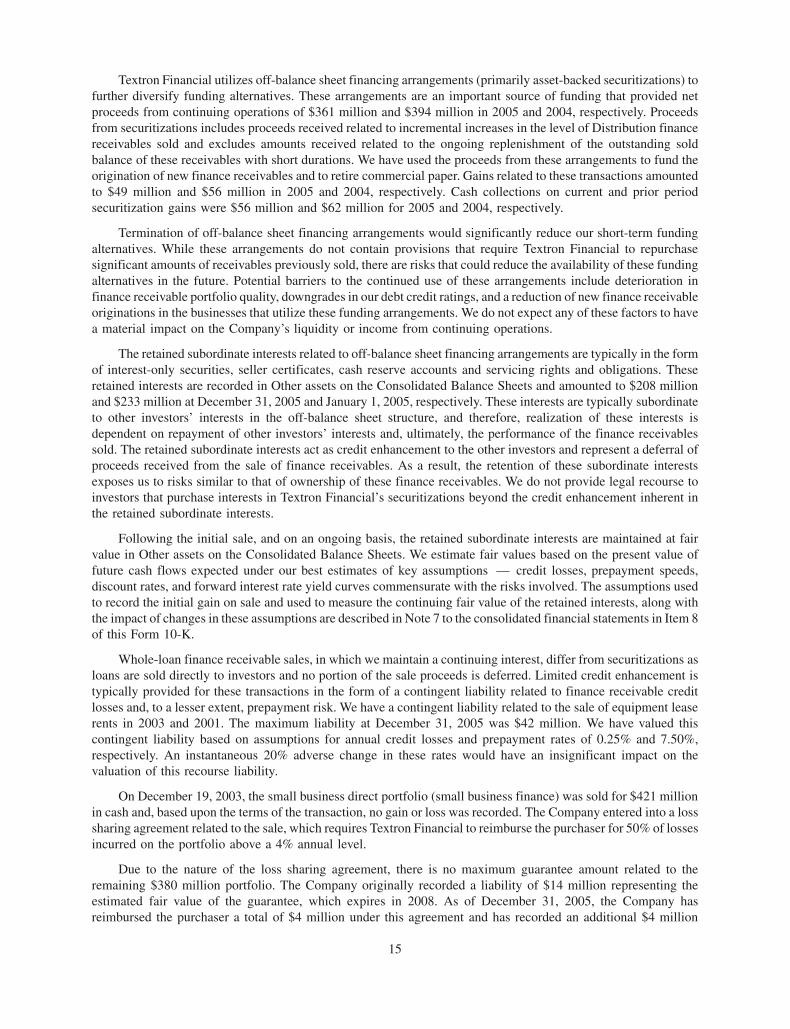
Textron Financial utilizes off-balance sheet financing arrangements (primarily asset-backed securitizations) tofurther diversify funding alternatives. These arrangements are an important source of funding that provided netproceeds from continuing operations of $361 million and $394 million in 2005 and 2004, respectively. Proceedsfrom securitizations includes proceeds received related to incremental increases in the level of Distribution financereceivables sold and excludes amounts received related to the ongoing replenishment of the outstanding soldbalance of these receivables with short durations. We have used the proceeds from these arrangements to fund theorigination of new finance receivables and to retire commercial paper. Gains related to these transactions amountedto $49 million and $56 million in 2005 and 2004, respectively. Cash collections on current and prior periodsecuritization gains were $56 million and $62 million for 2005 and 2004, respectively.
Termination of off-balance sheet financing arrangements would significantly reduce our short-term fundingalternatives. While these arrangements do not contain provisions that require Textron Financial to repurchasesignificant amounts of receivables previously sold, there are risks that could reduce the availability of these fundingalternatives in the future. Potential barriers to the continued use of these arrangements include deterioration infinance receivable portfolio quality, downgrades in our debt credit ratings, and a reduction of new finance receivableoriginations in the businesses that utilize these funding arrangements. We do not expect any of these factors to havea material impact on the Company’s liquidity or income from continuing operations.
The retained subordinate interests related to off-balance sheet financing arrangements are typically in the formof interest-only securities, seller certificates, cash reserve accounts and servicing rights and obligations. Theseretained interests are recorded in Other assets on the Consolidated Balance Sheets and amounted to $208 millionand $233 million at December 31, 2005 and January 1, 2005, respectively. These interests are typically subordinateto other investors’ interests in the off-balance sheet structure, and therefore, realization of these interests isdependent on repayment of other investors’ interests and, ultimately, the performance of the finance receivablessold. The retained subordinate interests act as credit enhancement to the other investors and represent a deferral ofproceeds received from the sale of finance receivables. As a result, the retention of these subordinate interestsexposes us to risks similar to that of ownership of these finance receivables. We do not provide legal recourse toinvestors that purchase interests in Textron Financial’s securitizations beyond the credit enhancement inherent inthe retained subordinate interests.
Following the initial sale, and on an ongoing basis, the retained subordinate interests are maintained at fairvalue in Other assets on the Consolidated Balance Sheets. We estimate fair values based on the present value offuture cash flows expected under our best estimates of key assumptions — credit losses, prepayment speeds,discount rates, and forward interest rate yield curves commensurate with the risks involved. The assumptions usedto record the initial gain on sale and used to measure the continuing fair value of the retained interests, along withthe impact of changes in these assumptions are described in Note 7 to the consolidated financial statements in Item 8of this Form 10-K.
Whole-loan finance receivable sales, in which we maintain a continuing interest, differ from securitizations asloans are sold directly to investors and no portion of the sale proceeds is deferred. Limited credit enhancement istypically provided for these transactions in the form of a contingent liability related to finance receivable creditlosses and, to a lesser extent, prepayment risk. We have a contingent liability related to the sale of equipment leaserents in 2003 and 2001. The maximum liability at December 31, 2005 was $42 million. We have valued thiscontingent liability based on assumptions for annual credit losses and prepayment rates of 0.25% and 7.50%,respectively. An instantaneous 20% adverse change in these rates would have an insignificant impact on thevaluation of this recourse liability.
On December 19, 2003, the small business direct portfolio (small business finance) was sold for $421 millionin cash and, based upon the terms of the transaction, no gain or loss was recorded. The Company entered into a losssharing agreement related to the sale, which requires Textron Financial to reimburse the purchaser for 50% of lossesincurred on the portfolio above a 4% annual level.
Due to the nature of the loss sharing agreement, there is no maximum guarantee amount related to theremaining $380 million portfolio. The Company originally recorded a liability of $14 million representing theestimated fair value of the guarantee, which expires in 2008. As of December 31, 2005, the Company hasreimbursed the purchaser a total of $4 million under this agreement and has recorded an additional $4 million
15

liability based on revisions to the estimated fair value of the guarantee. These revisions reflect management’s bestestimate of the amounts potentially reimbursable to the purchaser based on historical loss experience and theestimated attrition of the portfolio. At December 31, 2005, the Company has a $13 million liability recorded inAccrued interest and other liabilities.
Managed Finance Receivables
Managed finance receivables consist of owned finance receivables, and finance receivables that TextronFinancial continues to service, but has sold in securitizations or similar structures in which substantial risks ofownership are retained. The managed finance receivables of our business segments are presented in the followingtable.
2005 2004(Dollars in millions)
Distribution Finance . . . . . . . . . . . . . . . . . . . . . . . . . . . . . . . . . . . . . . . . . . $2,993 33% $2,269 28%Aircraft Finance . . . . . . . . . . . . . . . . . . . . . . . . . . . . . . . . . . . . . . . . . . . . . 1,664 19% 1,610 20%Golf Finance . . . . . . . . . . . . . . . . . . . . . . . . . . . . . . . . . . . . . . . . . . . . . . . . 1,435 16% 1,296 16%Resort Finance . . . . . . . . . . . . . . . . . . . . . . . . . . . . . . . . . . . . . . . . . . . . . . 1,138 13% 1,183 15%Structured Capital . . . . . . . . . . . . . . . . . . . . . . . . . . . . . . . . . . . . . . . . . . . . 689 8% 745 9%Asset-Based Lending . . . . . . . . . . . . . . . . . . . . . . . . . . . . . . . . . . . . . . . . . . 764 8% 584 7%Other . . . . . . . . . . . . . . . . . . . . . . . . . . . . . . . . . . . . . . . . . . . . . . . . . . . . . 312 3% 448 5%
Total managed finance receivables . . . . . . . . . . . . . . . . . . . . . . . . . . . . . . $8,995 100% $8,135 100%
Managed finance receivables within the Company’s core businesses increased $996 million, primarily as aresult of growth in the large ticket and diversified products portfolios within Distribution Finance, the businesscredit portfolio within Asset-Based Lending, and the golf mortgage portfolio within Golf Finance. The increase waspartially offset by higher collections, net of new finance receivable originations, in the Resort Finance portfolio, andsales in the Structured Capital portfolio. The $136 million decrease in the Other segment represents the continuedportfolio collections and prepayments of the liquidating portfolios. Liquidation of the remaining $312 million islikely to occur at a slower pace due to the long-term nature of the contractual terms in the existing portfolio.
Nonperforming Assets
Nonperforming assets include nonaccrual finance receivables and repossessed assets. We classify receivablesas nonaccrual and suspend the recognition of earnings when accounts are contractually delinquent by more thanthree months, unless collection of principal and interest is not doubtful. In addition, earlier suspension may occur ifwe have significant doubt about the ability of the obligor to meet current contractual terms. Doubt may be created bypayment delinquency, reduction in the obligor’s cash flows, deterioration in the loan to collateral value relationshipor other relevant considerations.
The following table sets forth certain information about nonperforming assets and the related percentages ofowned finance assets by business segment.
2005 2004 2003
(Dollars in millions)
Resort Finance . . . . . . . . . . . . . . . . . . . . . . . . . . . . . . . . . . . $ 31 2.67% $ 53 4.44% $ 55 5.15%Aircraft Finance . . . . . . . . . . . . . . . . . . . . . . . . . . . . . . . . . . 14 1.07% 12 0.96% 26 2.21%Golf Finance . . . . . . . . . . . . . . . . . . . . . . . . . . . . . . . . . . . . 13 0.99% 26 2.34% 22 2.43%Asset-Based Lending . . . . . . . . . . . . . . . . . . . . . . . . . . . . . . 6 0.81% 7 1.17% 6 1.25%Distribution Finance . . . . . . . . . . . . . . . . . . . . . . . . . . . . . . . 2 0.11% 5 0.43% 11 1.35%Other . . . . . . . . . . . . . . . . . . . . . . . . . . . . . . . . . . . . . . . . . . 45 13.64% 37 8.35% 42 5.72%
Total nonperforming assets . . . . . . . . . . . . . . . . . . . . . . . . $111 1.53% $140 2.18% $162 2.80%
In general, we believe that nonperforming assets will generally be in the range of 1% to 4% of finance assetsdepending on economic conditions. We experienced significant improvement in total nonperforming assets with a$29 million decrease in 2005 and a $22 million decrease in 2004. The decrease in 2005 was primarily attributable to
16

the core businesses including Resort Finance ($22 million) and Golf Finance ($13 million), largely related toimproved general economic conditions. The decrease was partially offset by an increase in the Other segment.
The Other segment increased $8 million in 2005 from 2004 primarily related to one media finance loan and onesyndicated bank loan. The Company expects modest improvement as these portfolios liquidate. However, theCompany could realize a temporary, out-of-trend result in any one quarter.
The preceding nonperforming assets table does not include captive receivables with recourse to Textron.Captive receivables with recourse that were 90 days or more delinquent amounted to $8 million, $31 million and$41 million at the years ended 2005, 2004 and 2003, respectively, and were 3.3%, 9.3% and 9.6% of captive financereceivables with recourse, respectively. Revenues recognized on 90 day or more delinquent accounts were$2 million, $3 million and $6 million for the years ended 2005, 2004 and 2003, respectively.
Textron Financial has a performance guarantee from Textron for leases with the U.S. and Canadian subsid-iaries of Collins & Aikman Corporation (“C&A”). At December 31, 2005, these leases had an outstanding balanceof approximately $70 million. During the second quarter of 2005, the U.S. subsidiary of C&A filed for Chapter 11bankruptcy protection. We have not classified this lease as nonaccrual due to the performance guarantee fromTextron.
Interest Rate Sensitivity
Textron Financial’s mix of fixed and floating rate debt is continuously monitored by management and isadjusted, as necessary, based on evaluations of internal and external factors. Management’s strategy of matchingfloating rate assets with floating rate liabilities limits Textron Financial’s risk to changes in interest rates. Thisstrategy includes the use of interest rate exchange agreements. At December 31, 2005, floating rate liabilities inexcess of floating rate assets were $156 million, net of $2.9 billion of interest rate exchange agreements whicheffectively converted fixed rate debt to a floating rate equivalent, and $122 million of interest rate exchangeagreements which effectively converted fixed rate finance receivables to a floating rate equivalent. Classified withinfixed rate assets are $62 million of floating rate loans with index rate floors that are, on average, 42 basis pointsabove the applicable index rate (predominately the prime rate). As a consequence, these assets are classified as fixedrate, and will remain so until the prime rate increases above the floor rates. The Company has benefited from theseinterest rate floor agreements in the recent low rate environment. However, in a rising rate environment, this benefitwill dissipate until the prime rate exceeds the floor rates embedded in these agreements. As a result of recentincreases in short-term interest rates, we no longer benefit from interest rate floors in excess of the applicable indexrate in connection with our ownership of a residual interest in the Distribution Finance securitization trust.
We believe that our asset/liability management policy provides adequate protection against interest rate risks.Increases in interest rates, however, could have an adverse effect on interest margin. Variable rate financereceivables are generally tied to changes in the prime rate offered by major U.S. banks. As a consequence,changes in short-term borrowing costs generally precede changes in variable rate receivable yields. We assess ourexposure to interest rate changes using an analysis that measures the potential loss in net income, over a twelve-month period, resulting from a hypothetical change in interest rates of 100 basis points across all maturitiesoccurring at the outset of the measurement period (sometimes referred to as a “shock test”). The analysis alsoassumes that prospective receivable additions will be match funded, existing portfolios will not prepay andcontractual maturities of both debt and assets will result in issuances or reductions of commercial paper. This shocktest model, when applied to our asset and liability position at December 31, 2005, indicates that an increase ininterest rates of 100 basis points would have a positive impact on net income and cash flows of $0.3 million for thefollowing twelve-month period.
Financial Risk Management
Textron Financial’s results are affected by changes in U.S. and, to a lesser extent, foreign interest rates. As partof managing this risk, we enter into interest rate exchange agreements. The objective of entering into suchagreements is not to speculate for profit, but generally to convert variable rate debt into fixed rate debt and viceversa. The overall objective of our interest rate risk management is to achieve match funding objectives. Theseagreements do not involve a high degree of complexity or risk. The fair values of interest rate exchange agreements
17
are recorded in either Other assets or Accrued interest and other liabilities on the Consolidated Balance Sheets. Wedo not trade in interest rate exchange agreements or enter into leveraged interest rate exchange agreements. The neteffect of the interest rate exchange agreements designated as hedges of debt decreased interest expense by$11 million, $40 million, and $43 million in 2005, 2004, and 2003, respectively.
We manage our foreign currency exposure by funding most foreign currency denominated assets withliabilities in the same currency. We may enter into foreign currency exchange agreements to convert foreigncurrency denominated assets, liabilities and cash flows into functional currency denominated assets, liabilities andcash flows. In addition, as part of managing our foreign currency exposure, we may enter into foreign currencyforward exchange contracts. The objective of such agreements is to manage any remaining foreign currencyexposures to changes in currency rates. The notional amounts of outstanding foreign currency forward exchangecontracts were $39 million and $3 million at December 31, 2005 and January 1, 2005, respectively. The fair valuesof foreign currency forward exchange contracts are recorded in either Other assets or Accrued interest and otherliabilities on the Company’s Consolidated Balance Sheets.
Critical Accounting Policies
Allowance for Losses on Finance Receivables
We evaluate our allowance for losses on finance receivables based on a combination of factors. Forhomogeneous loan pools, we examine current delinquencies, the characteristics of the existing accounts, historicalloss experience, the value of the underlying collateral and general economic conditions and trends. We estimatelosses will range from 0.5% to 4.0% of finance receivables depending on the specific homogeneous loan pool. Forlarger balance commercial loans, borrower specific information, industry trends and estimated discounted cashflows are considered, as well as the factors described above for homogeneous loan pools.
Provisions for losses on finance receivables are charged to income, in amounts sufficient to maintain theallowance for losses on finance receivables at a level considered adequate to cover existing losses in the ownedfinance receivable portfolio, based on management’s evaluation and analysis of this portfolio. While managementbelieves that its consideration of the factors and assumptions referred to above results in an accurate evaluation ofexisting losses in the portfolio based on prior trends and experience, changes in the assumptions or trends withinreasonable historical volatility may have a material impact on our allowance for losses. A 10% variation in ourestimate of allowance for loss adequacy would have approximately a $10 million impact to earnings. During the lastfive years, volatility in losses as a percentage of finance receivables has exceeded 10%.
Finance receivables are charged off when they are deemed uncollectible. Finance receivables are written downto the fair value (less estimated costs to sell) of the related collateral at the earlier of the date the collateral isrepossessed or when no payment has been received for six months, unless management deems the receivablecollectible.
Goodwill
We evaluate the recoverability of goodwill annually in the fourth quarter, or more frequently if events orchanges in circumstances, such as declines in interest margin or cash flows or material adverse changes in thebusiness climate, indicate that the carrying value might be impaired. The annual impairment test was completed inthe fourth quarter of 2005 using the estimates from our long-term strategic plan. No adjustment was required to thecarrying value of goodwill based on the analysis performed.
Goodwill is considered to be impaired when the net book value of a reporting unit exceeds its estimated fairvalue. Fair values are primarily established using a discounted cash flow methodology. The determination ofdiscounted cash flows is based on an extrapolation of the businesses’ multi-year strategic business plans. Theassumptions relative to interest margin, operating expenses and provision for losses included in the plans aremanagement’s best estimates based on current and forecasted market conditions.
A compounded annual growth rate assumption of 5% was used in 2005 to estimate cash flows beyond themulti-year business plan period. Other significant assumptions utilized were an estimated cash flow discount rate of11% and an effective tax rate of 34%. If different assumptions were used in these plans, the related cash flows used
18
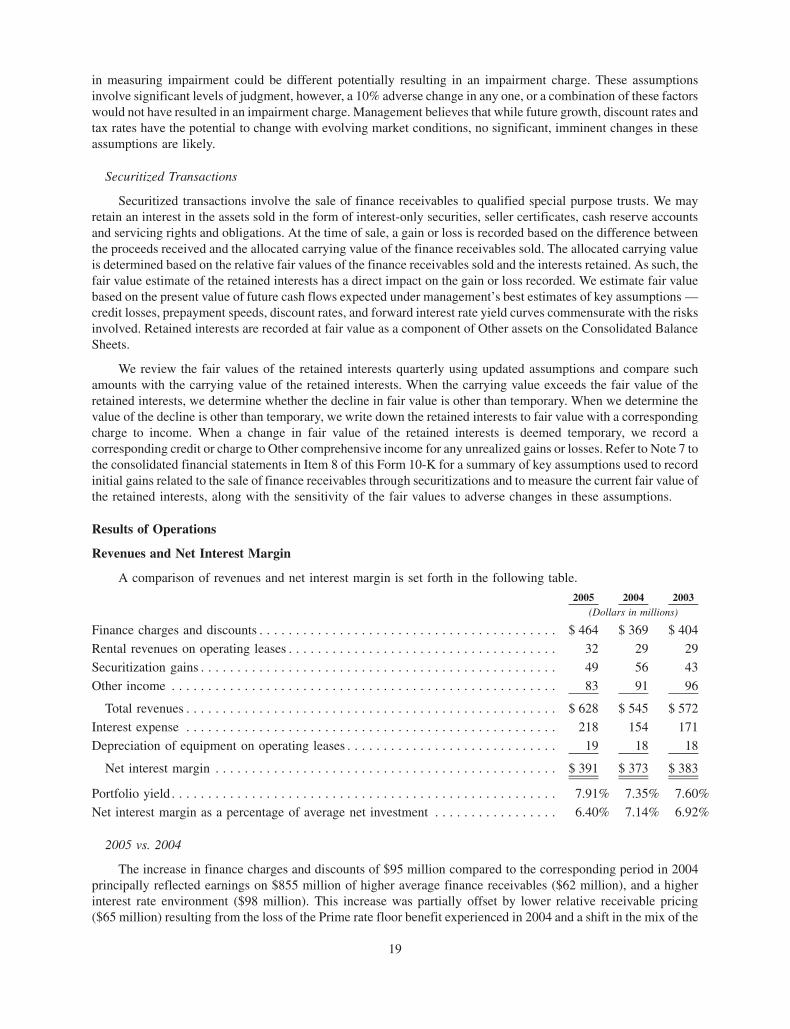
in measuring impairment could be different potentially resulting in an impairment charge. These assumptionsinvolve significant levels of judgment, however, a 10% adverse change in any one, or a combination of these factorswould not have resulted in an impairment charge. Management believes that while future growth, discount rates andtax rates have the potential to change with evolving market conditions, no significant, imminent changes in theseassumptions are likely.
Securitized Transactions
Securitized transactions involve the sale of finance receivables to qualified special purpose trusts. We mayretain an interest in the assets sold in the form of interest-only securities, seller certificates, cash reserve accountsand servicing rights and obligations. At the time of sale, a gain or loss is recorded based on the difference betweenthe proceeds received and the allocated carrying value of the finance receivables sold. The allocated carrying valueis determined based on the relative fair values of the finance receivables sold and the interests retained. As such, thefair value estimate of the retained interests has a direct impact on the gain or loss recorded. We estimate fair valuebased on the present value of future cash flows expected under management’s best estimates of key assumptions —credit losses, prepayment speeds, discount rates, and forward interest rate yield curves commensurate with the risksinvolved. Retained interests are recorded at fair value as a component of Other assets on the Consolidated BalanceSheets.
We review the fair values of the retained interests quarterly using updated assumptions and compare suchamounts with the carrying value of the retained interests. When the carrying value exceeds the fair value of theretained interests, we determine whether the decline in fair value is other than temporary. When we determine thevalue of the decline is other than temporary, we write down the retained interests to fair value with a correspondingcharge to income. When a change in fair value of the retained interests is deemed temporary, we record acorresponding credit or charge to Other comprehensive income for any unrealized gains or losses. Refer to Note 7 tothe consolidated financial statements in Item 8 of this Form 10-K for a summary of key assumptions used to recordinitial gains related to the sale of finance receivables through securitizations and to measure the current fair value ofthe retained interests, along with the sensitivity of the fair values to adverse changes in these assumptions.
Results of Operations
Revenues and Net Interest Margin
A comparison of revenues and net interest margin is set forth in the following table.
2005 2004 2003(Dollars in millions)
Finance charges and discounts . . . . . . . . . . . . . . . . . . . . . . . . . . . . . . . . . . . . . . . . . $ 464 $ 369 $ 404
Rental revenues on operating leases . . . . . . . . . . . . . . . . . . . . . . . . . . . . . . . . . . . . . 32 29 29
Securitization gains . . . . . . . . . . . . . . . . . . . . . . . . . . . . . . . . . . . . . . . . . . . . . . . . . 49 56 43
Other income . . . . . . . . . . . . . . . . . . . . . . . . . . . . . . . . . . . . . . . . . . . . . . . . . . . . . 83 91 96
Total revenues . . . . . . . . . . . . . . . . . . . . . . . . . . . . . . . . . . . . . . . . . . . . . . . . . . . $ 628 $ 545 $ 572
Interest expense . . . . . . . . . . . . . . . . . . . . . . . . . . . . . . . . . . . . . . . . . . . . . . . . . . . 218 154 171
Depreciation of equipment on operating leases . . . . . . . . . . . . . . . . . . . . . . . . . . . . . 19 18 18
Net interest margin . . . . . . . . . . . . . . . . . . . . . . . . . . . . . . . . . . . . . . . . . . . . . . . $ 391 $ 373 $ 383
Portfolio yield . . . . . . . . . . . . . . . . . . . . . . . . . . . . . . . . . . . . . . . . . . . . . . . . . . . . . 7.91% 7.35% 7.60%
Net interest margin as a percentage of average net investment . . . . . . . . . . . . . . . . . 6.40% 7.14% 6.92%
2005 vs. 2004
The increase in finance charges and discounts of $95 million compared to the corresponding period in 2004principally reflected earnings on $855 million of higher average finance receivables ($62 million), and a higherinterest rate environment ($98 million). This increase was partially offset by lower relative receivable pricing($65 million) resulting from the loss of the Prime rate floor benefit experienced in 2004 and a shift in the mix of the
19
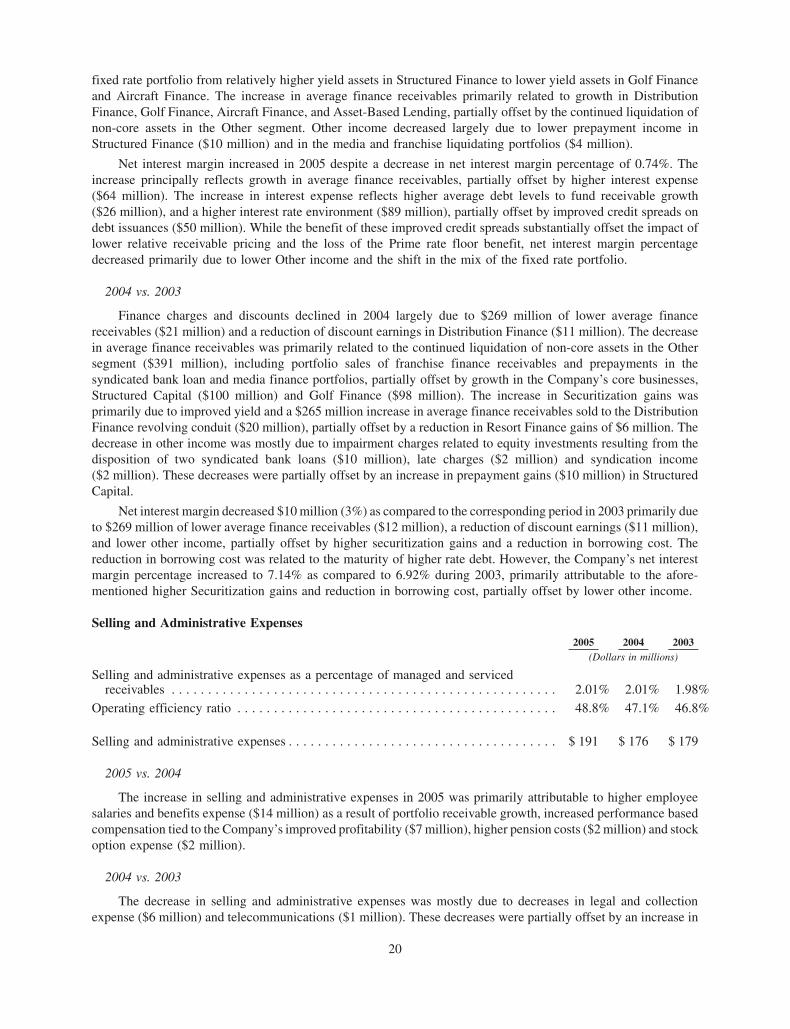
fixed rate portfolio from relatively higher yield assets in Structured Finance to lower yield assets in Golf Financeand Aircraft Finance. The increase in average finance receivables primarily related to growth in DistributionFinance, Golf Finance, Aircraft Finance, and Asset-Based Lending, partially offset by the continued liquidation ofnon-core assets in the Other segment. Other income decreased largely due to lower prepayment income inStructured Finance ($10 million) and in the media and franchise liquidating portfolios ($4 million).
Net interest margin increased in 2005 despite a decrease in net interest margin percentage of 0.74%. Theincrease principally reflects growth in average finance receivables, partially offset by higher interest expense($64 million). The increase in interest expense reflects higher average debt levels to fund receivable growth($26 million), and a higher interest rate environment ($89 million), partially offset by improved credit spreads ondebt issuances ($50 million). While the benefit of these improved credit spreads substantially offset the impact oflower relative receivable pricing and the loss of the Prime rate floor benefit, net interest margin percentagedecreased primarily due to lower Other income and the shift in the mix of the fixed rate portfolio.
2004 vs. 2003
Finance charges and discounts declined in 2004 largely due to $269 million of lower average financereceivables ($21 million) and a reduction of discount earnings in Distribution Finance ($11 million). The decreasein average finance receivables was primarily related to the continued liquidation of non-core assets in the Othersegment ($391 million), including portfolio sales of franchise finance receivables and prepayments in thesyndicated bank loan and media finance portfolios, partially offset by growth in the Company’s core businesses,Structured Capital ($100 million) and Golf Finance ($98 million). The increase in Securitization gains wasprimarily due to improved yield and a $265 million increase in average finance receivables sold to the DistributionFinance revolving conduit ($20 million), partially offset by a reduction in Resort Finance gains of $6 million. Thedecrease in other income was mostly due to impairment charges related to equity investments resulting from thedisposition of two syndicated bank loans ($10 million), late charges ($2 million) and syndication income($2 million). These decreases were partially offset by an increase in prepayment gains ($10 million) in StructuredCapital.
Net interest margin decreased $10 million (3%) as compared to the corresponding period in 2003 primarily dueto $269 million of lower average finance receivables ($12 million), a reduction of discount earnings ($11 million),and lower other income, partially offset by higher securitization gains and a reduction in borrowing cost. Thereduction in borrowing cost was related to the maturity of higher rate debt. However, the Company’s net interestmargin percentage increased to 7.14% as compared to 6.92% during 2003, primarily attributable to the afore-mentioned higher Securitization gains and reduction in borrowing cost, partially offset by lower other income.
Selling and Administrative Expenses2005 2004 2003
(Dollars in millions)
Selling and administrative expenses as a percentage of managed and servicedreceivables . . . . . . . . . . . . . . . . . . . . . . . . . . . . . . . . . . . . . . . . . . . . . . . . . . . . . 2.01% 2.01% 1.98%
Operating efficiency ratio . . . . . . . . . . . . . . . . . . . . . . . . . . . . . . . . . . . . . . . . . . . . 48.8% 47.1% 46.8%
Selling and administrative expenses . . . . . . . . . . . . . . . . . . . . . . . . . . . . . . . . . . . . . $ 191 $ 176 $ 179
2005 vs. 2004
The increase in selling and administrative expenses in 2005 was primarily attributable to higher employeesalaries and benefits expense ($14 million) as a result of portfolio receivable growth, increased performance basedcompensation tied to the Company’s improved profitability ($7 million), higher pension costs ($2 million) and stockoption expense ($2 million).
2004 vs. 2003
The decrease in selling and administrative expenses was mostly due to decreases in legal and collectionexpense ($6 million) and telecommunications ($1 million). These decreases were partially offset by an increase in
20

employee salaries and benefits expense ($4 million) primarily due to higher healthcare and pension costs, andincreased performance based compensation tied to the Company’s improved profitability. The decrease in legal andcollection costs was partially due to lower litigation reserves recorded in 2004.
Provision for Losses
Allowance for losses on finance receivables is presented in the following table.
2005 2004 2003(Dollars in millions)
Allowance for losses on finance receivables beginning of period . . . . . . . . . . . . . . . $ 99 $ 119 $ 145
Provision for losses . . . . . . . . . . . . . . . . . . . . . . . . . . . . . . . . . . . . . . . . . . . . . . . . 29 58 81
Less net charge-offs:
Resort Finance . . . . . . . . . . . . . . . . . . . . . . . . . . . . . . . . . . . . . . . . . . . . . . . . . 10 34 6
Distribution Finance . . . . . . . . . . . . . . . . . . . . . . . . . . . . . . . . . . . . . . . . . . . . . 10 13 19
Aircraft Finance . . . . . . . . . . . . . . . . . . . . . . . . . . . . . . . . . . . . . . . . . . . . . . . . 2 7 16
Golf Finance . . . . . . . . . . . . . . . . . . . . . . . . . . . . . . . . . . . . . . . . . . . . . . . . . . . 3 3 2
Asset-Based Lending . . . . . . . . . . . . . . . . . . . . . . . . . . . . . . . . . . . . . . . . . . . . . — 2 6
Other. . . . . . . . . . . . . . . . . . . . . . . . . . . . . . . . . . . . . . . . . . . . . . . . . . . . . . . . . 7 20 68
Total net charge-offs . . . . . . . . . . . . . . . . . . . . . . . . . . . . . . . . . . . . . . . . . . . . . . . 32 79 117
Acquisitions and other . . . . . . . . . . . . . . . . . . . . . . . . . . . . . . . . . . . . . . . . . . . . . . — 1 10
Allowance for losses on finance receivables end of period . . . . . . . . . . . . . . . . . . . $ 96 $ 99 $ 119
Net charge-offs as a percentage of average finance receivables . . . . . . . . . . . . . . . . 0.5% 1.5% 2.1%
Allowance for losses on finance receivables as a percentage of total financereceivables . . . . . . . . . . . . . . . . . . . . . . . . . . . . . . . . . . . . . . . . . . . . . . . . . . . . 1.4% 1.7% 2.3%
Allowance for losses on finance receivables as a percentage of nonaccrual financereceivables . . . . . . . . . . . . . . . . . . . . . . . . . . . . . . . . . . . . . . . . . . . . . . . . . . . . 108.6% 83.7% 78.4%
2005 vs. 2004
The decrease in provision for losses reflects sustained improvement in portfolio quality as well as a shift in themix of the portfolio, reflecting growth in Distribution Finance, which has traditionally experienced lower levels ofnet charge-offs as compared to the Company’s total receivable portfolio. Provision for losses in Resort Financedecreased by $28 million reflecting no significant additions to nonperforming assets in 2005. In addition, weexperienced lower net charge-offs in the Other segment reflecting the continued liquidation of our non-core assets.
The increase in the allowance for losses on finance receivables as a percentage of nonaccrual financereceivables reflects the combination of additional portfolio reserves related to growth and a $31 million decrease innonaccrual finance receivables. As the level of the allowance for losses related to homogenous loan pools is basedpartially on historical loss experience, decreases in nonaccrual finance receivable balances do not have aninstantaneous impact on the loss rates applied to these homogenous pools of receivables.
2004 vs. 2003
Provision for losses decreased in 2004 largely reflecting an improvement in portfolio quality. Nonaccrualfinance receivables decreased $33 million as compared to the corresponding period in 2003. The decrease in netcharge-offs was primarily attributable to the Other segment reflecting the Company’s reduced level of exposure tonon-core assets. In addition, the Company experienced lower net charge-offs in most of its core businessesincluding reductions in Aircraft Finance, Distribution Finance and Asset-Based Lending. These decreases werepartially offset by an increase in Resort Finance related to the charge-off of two accounts for which reserves hadbeen previously provided.
21

The increase in the allowance for losses on finance receivables as a percentage of nonaccrual financereceivables reflects the combination of a $702 million increase in finance receivables and a $33 million decrease innonaccrual finance receivables. As the level of the allowance for losses related to homogeneous loan pools is basedpartially on historical loss experience, decreases in nonaccrual finance receivable balances do not have aninstantaneous impact on the loss rates applied to these homogeneous pools of receivables.
Although management believes it has made adequate provision for anticipated losses, realization of theseassets remain subject to uncertainties. Subsequent evaluations of nonperforming assets, in light of factors thenprevailing, including economic conditions, may require additional increases in the allowance for losses for suchassets.
Share-Based Compensation
Textron Financial participates in Textron Inc.’s 1999 Long-Term Incentive Plan (the “Plan”). The Plan awardsemployees options to purchase Textron shares and restricted stock. In December 2004, the Financial AccountingStandards Board (“FASB”) issued Statement of Financial Accounting Standards (“SFAS”) No. 123 (Revised 2004),“Share-Based Payment” (“SFAS No. 123-R”), which replaces SFAS No. 123, “Accounting for Stock-BasedCompensation” and supercedes Accounting Principles Board Opinion No. 25, “Accounting for Stock Issued toEmployees.” SFAS No. 123-R requires companies to measure compensation expense for share-based payments toemployees, including stock options, at fair value and expense such compensation over the service period beginningwith the first interim or annual period after June 15, 2005. In April 2005, the Securities and Exchange Commissiondelayed the transition date for companies to the first fiscal year beginning after June 15, 2005, effectively delayingTextron’s required adoption of SFAS No. 123-R until the first quarter of 2006. Textron elected to adoptSFAS No. 123-R in the first quarter of 2005 using the modified prospective method. In connection with theadoption of this standard, the compensation expense recognized related to Textron Financial employees in 2005 was$2.1 million.
Operating Results by Segment
Segment income presented in the tables below represents income from continuing operations before specialcharges, income taxes and distributions on preferred securities.
Distribution Finance2005 2004 2003
(In millions)
Revenues . . . . . . . . . . . . . . . . . . . . . . . . . . . . . . . . . . . . . . . . . . . . . . . . . . . . . . . . . . $178 $159 $151
Net interest margin . . . . . . . . . . . . . . . . . . . . . . . . . . . . . . . . . . . . . . . . . . . . . . . . . . $140 $143 $132
Selling and administrative expenses . . . . . . . . . . . . . . . . . . . . . . . . . . . . . . . . . . . . . . 68 62 53
Provision for losses . . . . . . . . . . . . . . . . . . . . . . . . . . . . . . . . . . . . . . . . . . . . . . . . . . 2 8 21
Segment income. . . . . . . . . . . . . . . . . . . . . . . . . . . . . . . . . . . . . . . . . . . . . . . . . . . $ 70 $ 73 $ 58
The decrease in segment income of $3 million in 2005 reflects lower net interest margin ($3 million), andhigher selling and administrative expenses ($6 million), partially offset by lower provision for losses ($6 million).The reduction in net interest margin principally reflects higher revenues on $414 million of higher average financereceivables ($32 million), and improved borrowing spreads ($9 million), partially offset by lower relative receivablepricing ($39 million). The reduction in relative receivable pricing is primarily attributable to the loss of the Primerate floor benefit experienced in 2004. The increase in selling and administrative expenses was due to portfoliogrowth. Selling and administrative expenses as a percentage of average managed and serviced receivablesdecreased to 2.64% from 3.00% for the years ended 2005 and 2004, respectively. The lower provision for lossesprimarily reflected a change in reserving requirements, reflecting sustained improvements in credit quality.
Distribution Finance segment income increased in 2004 reflecting higher net interest margin and lowerprovision for losses, partially offset by an increase in selling and administrative expenses. The increase in netinterest margin was primarily the result of higher securitization gains ($20 million) due to improved yield and a
22
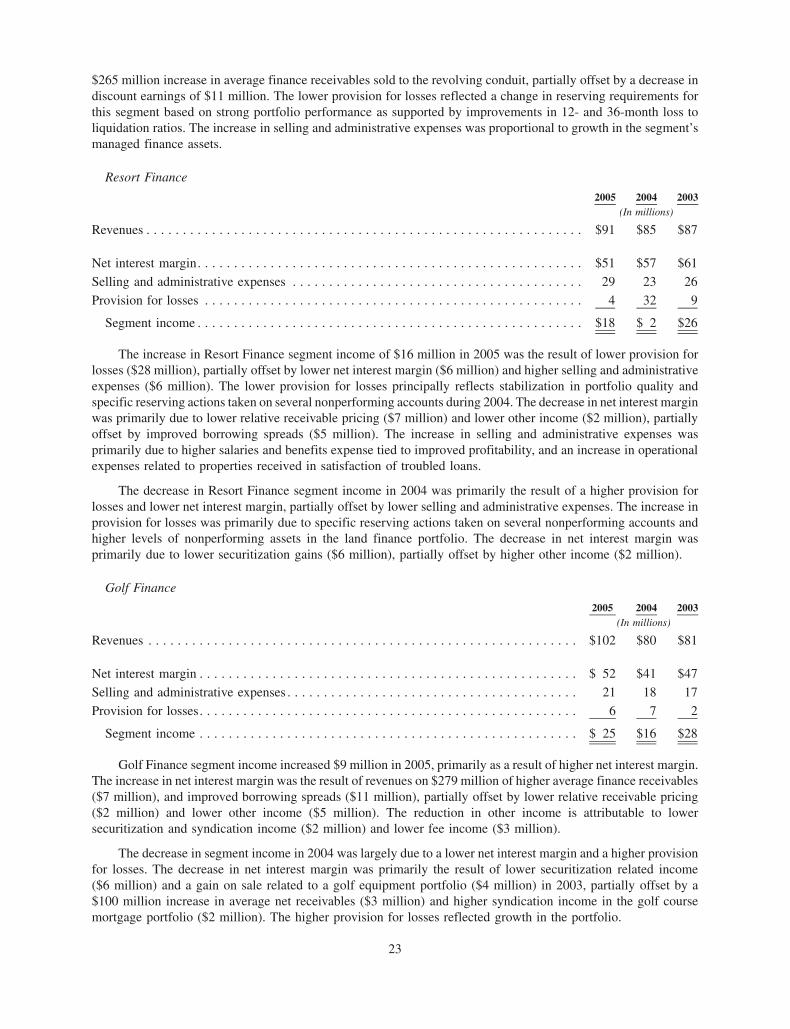
$265 million increase in average finance receivables sold to the revolving conduit, partially offset by a decrease indiscount earnings of $11 million. The lower provision for losses reflected a change in reserving requirements forthis segment based on strong portfolio performance as supported by improvements in 12- and 36-month loss toliquidation ratios. The increase in selling and administrative expenses was proportional to growth in the segment’smanaged finance assets.
Resort Finance
2005 2004 2003(In millions)
Revenues . . . . . . . . . . . . . . . . . . . . . . . . . . . . . . . . . . . . . . . . . . . . . . . . . . . . . . . . . . . . $91 $85 $87
Net interest margin. . . . . . . . . . . . . . . . . . . . . . . . . . . . . . . . . . . . . . . . . . . . . . . . . . . . . $51 $57 $61
Selling and administrative expenses . . . . . . . . . . . . . . . . . . . . . . . . . . . . . . . . . . . . . . . . 29 23 26
Provision for losses . . . . . . . . . . . . . . . . . . . . . . . . . . . . . . . . . . . . . . . . . . . . . . . . . . . . 4 32 9
Segment income . . . . . . . . . . . . . . . . . . . . . . . . . . . . . . . . . . . . . . . . . . . . . . . . . . . . . $18 $ 2 $26
The increase in Resort Finance segment income of $16 million in 2005 was the result of lower provision forlosses ($28 million), partially offset by lower net interest margin ($6 million) and higher selling and administrativeexpenses ($6 million). The lower provision for losses principally reflects stabilization in portfolio quality andspecific reserving actions taken on several nonperforming accounts during 2004. The decrease in net interest marginwas primarily due to lower relative receivable pricing ($7 million) and lower other income ($2 million), partiallyoffset by improved borrowing spreads ($5 million). The increase in selling and administrative expenses wasprimarily due to higher salaries and benefits expense tied to improved profitability, and an increase in operationalexpenses related to properties received in satisfaction of troubled loans.
The decrease in Resort Finance segment income in 2004 was primarily the result of a higher provision forlosses and lower net interest margin, partially offset by lower selling and administrative expenses. The increase inprovision for losses was primarily due to specific reserving actions taken on several nonperforming accounts andhigher levels of nonperforming assets in the land finance portfolio. The decrease in net interest margin wasprimarily due to lower securitization gains ($6 million), partially offset by higher other income ($2 million).
Golf Finance
2005 2004 2003(In millions)
Revenues . . . . . . . . . . . . . . . . . . . . . . . . . . . . . . . . . . . . . . . . . . . . . . . . . . . . . . . . . . . $102 $80 $81
Net interest margin . . . . . . . . . . . . . . . . . . . . . . . . . . . . . . . . . . . . . . . . . . . . . . . . . . . . $ 52 $41 $47
Selling and administrative expenses . . . . . . . . . . . . . . . . . . . . . . . . . . . . . . . . . . . . . . . . 21 18 17
Provision for losses. . . . . . . . . . . . . . . . . . . . . . . . . . . . . . . . . . . . . . . . . . . . . . . . . . . . 6 7 2
Segment income . . . . . . . . . . . . . . . . . . . . . . . . . . . . . . . . . . . . . . . . . . . . . . . . . . . . $ 25 $16 $28
Golf Finance segment income increased $9 million in 2005, primarily as a result of higher net interest margin.The increase in net interest margin was the result of revenues on $279 million of higher average finance receivables($7 million), and improved borrowing spreads ($11 million), partially offset by lower relative receivable pricing($2 million) and lower other income ($5 million). The reduction in other income is attributable to lowersecuritization and syndication income ($2 million) and lower fee income ($3 million).
The decrease in segment income in 2004 was largely due to a lower net interest margin and a higher provisionfor losses. The decrease in net interest margin was primarily the result of lower securitization related income($6 million) and a gain on sale related to a golf equipment portfolio ($4 million) in 2003, partially offset by a$100 million increase in average net receivables ($3 million) and higher syndication income in the golf coursemortgage portfolio ($2 million). The higher provision for losses reflected growth in the portfolio.
23

Aircraft Finance
2005 2004 2003(In millions)
Revenues . . . . . . . . . . . . . . . . . . . . . . . . . . . . . . . . . . . . . . . . . . . . . . . . . . . . . . . . . . . $107 $79 $81
Net interest margin . . . . . . . . . . . . . . . . . . . . . . . . . . . . . . . . . . . . . . . . . . . . . . . . . . . . $ 51 $39 $32
Selling and administrative expenses . . . . . . . . . . . . . . . . . . . . . . . . . . . . . . . . . . . . . . . . 16 14 14
Provision for losses. . . . . . . . . . . . . . . . . . . . . . . . . . . . . . . . . . . . . . . . . . . . . . . . . . . . 3 1 8
Segment income . . . . . . . . . . . . . . . . . . . . . . . . . . . . . . . . . . . . . . . . . . . . . . . . . . . . $ 32 $24 $10
The increase in Aircraft Finance segment income of $8 million in 2005 was primarily the result of higher netinterest margin. Net interest margin increased largely due to higher revenues on $200 million of higher averagefinance receivables ($5 million), improved borrowing spreads ($8 million) and higher other income ($2 million),partially offset by lower relative receivable pricing ($3 million). The increase in other income primarily reflectsimpairment charges on retained interests in securitizations recorded in 2004.
Aircraft Finance segment income improved significantly in 2004 as a result of a higher net interest margin anda lower provision for losses. Net interest margin increased primarily due to higher securitization related income($3 million), an increase in pricing ($2 million) as well as a reduction in borrowing costs related to the maturity ofhigher rate debt ($3 million). These increases were partially offset by a $108 million decrease in average financereceivables ($2 million). The lower provision for losses largely reflected an improvement in portfolio quality.
Asset-Based Lending
2005 2004 2003(In millions)
Revenues . . . . . . . . . . . . . . . . . . . . . . . . . . . . . . . . . . . . . . . . . . . . . . . . . . . . . . . . . . . . $75 $56 $59
Net interest margin. . . . . . . . . . . . . . . . . . . . . . . . . . . . . . . . . . . . . . . . . . . . . . . . . . . . . $51 $44 $48
Selling and administrative expenses . . . . . . . . . . . . . . . . . . . . . . . . . . . . . . . . . . . . . . . . 25 22 26
Provision for losses . . . . . . . . . . . . . . . . . . . . . . . . . . . . . . . . . . . . . . . . . . . . . . . . . . . . 1 5 2
Segment income . . . . . . . . . . . . . . . . . . . . . . . . . . . . . . . . . . . . . . . . . . . . . . . . . . . . . $25 $17 $20
The increase in Asset-Based segment income of $8 million in 2005 principally reflects higher net interestmargin and lower provision for losses. Net interest margin increased as a result of earnings on $150 million ofhigher average finance receivables ($9 million), and improved borrowing spreads ($4 million), partially offset bylower relative receivable pricing ($6 million). The decrease in provision for losses primarily reflects the absence of aneed to create reserves for specific nonperforming accounts as compared to 2004.
The decrease in Asset-Based segment income in 2004 reflected a decrease in net interest margin and anincrease in provision for losses, partially offset by lower selling and administrative expenses. The lower net interestmargin was primarily the result of a decline in portfolio yields ($3 million) and a decrease in other income($2 million), partially offset by a $14 million increase in average finance receivables ($1 million). The increase inprovision for losses reflected growth in the portfolio and the addition of reserves for specific nonperformingaccounts. The reduction in selling and administrative expenses was mostly the result of a restructuring programimplemented during the fourth quarter of 2003.
24

Structured Capital
2005 2004 2003(In millions)
Revenues . . . . . . . . . . . . . . . . . . . . . . . . . . . . . . . . . . . . . . . . . . . . . . . . . . . . . . . . . . . . $54 $52 $35
Net interest margin. . . . . . . . . . . . . . . . . . . . . . . . . . . . . . . . . . . . . . . . . . . . . . . . . . . . . $38 $33 $15Selling and administrative expenses . . . . . . . . . . . . . . . . . . . . . . . . . . . . . . . . . . . . . . . . 4 3 3Provision for losses . . . . . . . . . . . . . . . . . . . . . . . . . . . . . . . . . . . . . . . . . . . . . . . . . . . . — — —
Segment income . . . . . . . . . . . . . . . . . . . . . . . . . . . . . . . . . . . . . . . . . . . . . . . . . . . . . $34 $30 $12
Structured Capital segment income increased $4 million in 2005 principally due to a $5 million increase in netinterest margin. The increase in net interest margin reflected revenues on $71 million of higher average financereceivables ($5 million), and improved borrowing costs ($6 million), partially offset by lower relative receivablepricing ($5 million) and lower other income ($2 million). Other income decreased largely due to lower prepaymentincome in 2005 ($3 million).
The increase in Structured Capital segment income in 2004 was the result of a higher net interest margin,primarily reflecting higher prepayment income ($10 million) and a $79 million increase in average financereceivables ($5 million).
Other Segment2005 2004 2003
(In millions)
Revenues. . . . . . . . . . . . . . . . . . . . . . . . . . . . . . . . . . . . . . . . . . . . . . . . . . . . . . . . . . . $ 21 $ 34 $ 78
Net interest margin . . . . . . . . . . . . . . . . . . . . . . . . . . . . . . . . . . . . . . . . . . . . . . . . . . . $ 8 $ 15 $ 48Selling and administrative expenses . . . . . . . . . . . . . . . . . . . . . . . . . . . . . . . . . . . . . . . 28 33 41Provision for losses . . . . . . . . . . . . . . . . . . . . . . . . . . . . . . . . . . . . . . . . . . . . . . . . . . . 13 5 38
Segment loss . . . . . . . . . . . . . . . . . . . . . . . . . . . . . . . . . . . . . . . . . . . . . . . . . . . . . . $(33) $(23) $(31)
The increase in Other segment loss reflected lower net interest margin ($7 million) and an increase in provisionfor losses ($8 million), partially offset by lower selling and administrative expenses ($5 million), resulting fromportfolio liquidation. The decrease in net interest margin largely reflects lower average finance receivables as aresult of the continued liquidation of the portfolio and lower prepayment income in the media and franchiseportfolios, partially offset by a reduction in other asset impairment charges as compared to 2004. The increase inprovision for losses reflects an increase in specific reserves related to one account in the syndicated bank loanportfolio and one account in the media finance portfolio.
The improvement in Other segment loss in 2004 as compared to 2003 was primarily the result of a significantlylower provision for losses and a decline in selling and administrative expenses, partially offset by a lower netinterest margin. The decrease in the provision for losses reflects a declining level of nonperforming assets anddelinquencies within the portfolio and a decrease in finance receivables during the year of $303 million. The lowernet interest margin reflects the continued liquidation of the finance receivables within these non-core businessesthrough portfolio sales, prepayments and collections, and lower other income primarily due to impairment chargesrelated to equity investments resulting from the disposition of two syndicated bank loans ($10 million).
Income from Continuing Operations
Income from continuing operations increased by $20 million (21%) to $114 million in 2005. The increase wasprimarily due to a reduction in provision for losses ($29 million) as a result of improved portfolio quality, higher netinterest margin ($18 million), partially offset by higher selling and administrative expenses ($15 million), as a resultof growth in average managed finance receivables and higher employee salaries and benefits expense. The increasein employee salaries and benefits expense is the result of portfolio growth, increased performance-based
25
compensation tied to the Company’s improved profitability, pension costs and stock option expense. The effectivetax rate in 2005 compared to 2004 was relatively unchanged.
Income from continuing operations of $94 million for 2004 was $15 million or 19% higher than 2003. Theincrease was due to a lower loss provision ($23 million), a decrease in operating expenses ($3 million) and adecrease in special charges ($6 million), partially offset by a higher effective tax rate ($1 million) and lower interestmargin ($10 million).
Discontinued Operations
Loss from discontinued operations, net of income taxes was $3 million in 2005. The loss relates to a revision tothe estimated fair value of the guarantee associated with the loss sharing agreement recorded upon the sale of thesmall business direct portfolio in 2003.
New Accounting Pronouncements
In November 2005, the FASB issued Staff Position (“FSP”) FAS 140-2, “Clarification of the Application ofParagraphs 40(b) and 40(c) of FASB Statement No. 140.” The FSP specifies criteria that must be met for a derivativefinancial instrument to pertain to beneficial interests issued in a qualifying special-purpose-entity (“qualifyingSPE”). FASB Statement 140 limits the notional amount of derivatives issued in a qualifying SPE to the amount ofthe beneficial interest held by parties other than the transferor, but did not specifically address whether a qualifyingSPE would become disqualified if the derivative notional amount becomes greater than the beneficial interests dueto unexpected events subsequent to the inception of the qualifying SPE. The FSP clarifies that subsequent eventsoutside the control of the transferor would not impair the qualified status of the qualifying SPE. At December 31,2005, qualifying SPE’s in which Textron Financial has retained interests, comply with the provisions set forth inFASB Statement 140 related to the issuance of derivative financial instruments.
Forward-looking Information
Certain statements in this Annual Report on Form 10-K and other oral and written statements made by TextronFinancial from time to time are forward-looking statements, including those that discuss strategies, goals, outlookor other nonhistorical matters; or project revenues, income, returns or other financial measures. These forward-looking statements speak only as of the date on which they are made, and we undertake no obligation to update orrevise any forward-looking statements. These forward-looking statements are subject to risks and uncertainties thatmay cause actual results to differ materially from those contained in the statements, including the following:(a) changes in worldwide economic and political conditions that impact interest and foreign exchange rates; (b) theoccurrence of slowdowns or downturns in customer markets in which Textron products are sold or supplied andfinanced or where we offer financing; (c) the ability to realize full value of receivables and investments in securities;(d) the ability to control costs and successful implementation of various cost reduction programs; (e) increases inpension expenses related to lower than expected asset performance or changes in discount rates; (f) the impact ofchanges in tax legislation; (g) the ability to maintain portfolio credit quality; (h) access to debt financing atcompetitive rates; (i) access to equity in the form of retained earnings and capital contributions from Textron;(j) uncertainty in estimating contingent liabilities and establishing reserves tailored to address such contingenciesand (k) performance of acquisitions.
Item 7A. Quantitative and Qualitative Disclosure About Market Risk
For information regarding Textron Financial’s Quantitative and Qualitative Disclosure about Market Risk, see“Risk Management” in Item 1 and “Management’s Discussion and Analysis of Financial Condition and Results ofOperations — Interest Rate Sensitivity,” in Item 7 of this Form 10-K.
26
Item 8. Financial Statements and Supplementary Data
REPORT OF MANAGEMENT
Management is responsible for the integrity and objectivity of the financial data presented in this AnnualReport on Form 10-K. The consolidated financial statements have been prepared in conformity with accountingprinciples generally accepted in the United States and include amounts based on management’s best estimates andjudgments. Management is also responsible for establishing and maintaining adequate internal control overfinancial reporting for Textron Financial Corporation, as such term is defined in Exchange Act Rules 13a-15(f).With the participation of our management, we conducted an evaluation of the effectiveness of our internal controlover financial reporting based on the framework in Internal Control — Integrated Framework issued by theCommittee of Sponsoring Organizations of the Treadway Commission. Based on our evaluation under theframework in Internal Control — Integrated Framework, we have concluded that Textron Financial Corporationmaintained, in all material respects, effective internal control over financial reporting as of December 31, 2005.
The independent registered public accounting firm, Ernst & Young LLP, has audited the consolidated financialstatements of Textron Financial Corporation and has issued an attestation report on our assessment of theeffectiveness of Textron Financial Corporation’s internal control over financial reporting as of December 31,2005, as stated in its reports, which are included herein.
We conduct our business in accordance with the standards outlined in the Textron Business ConductGuidelines, which is communicated to all employees. Honesty, integrity and high ethical standards are the corevalues of how we conduct business. Textron Financial Corporation prepares and carries out an annual CompliancePlan to ensure these values and standards are maintained. Our internal control structure is designed to providereasonable assurance, at appropriate cost, that assets are safeguarded and that transactions are properly executed andrecorded. The internal control structure includes, among other things, established policies and procedures, aninternal audit function, and the selection and training of qualified personnel. Textron Financial Corporation’smanagement is responsible for implementing effective internal control systems and monitoring their effectiveness,as well as developing and executing an annual internal control plan.
/s/ TED R. FRENCH
Ted R. FrenchChairman and Chief Executive Officer
February 13, 2006
/s/ THOMAS J. CULLEN
Thomas J. CullenExecutive Vice President andChief Financial Officer
February 13, 2006
27
REPORT OF INDEPENDENT REGISTERED PUBLIC ACCOUNTING FIRM ONINTERNAL CONTROL OVER FINANCIAL REPORTING
The Board of DirectorsTextron Financial Corporation
We have audited management’s assessment, included in the accompanying Report of Management, thatTextron Financial Corporation (the “Company”) maintained effective internal control over financial reporting as ofDecember 31, 2005, based on criteria established in Internal Control — Integrated Framework issued by theCommittee of Sponsoring Organizations of the Treadway Commission (the “COSO criteria”). Textron FinancialCorporation’s management is responsible for maintaining effective internal control over financial reporting and forits assessment of the effectiveness of internal control over financial reporting. Our responsibility is to express anopinion on management’s assessment and an opinion on the effectiveness of the Company’s internal control overfinancial reporting based on our audit.
We conducted our audit in accordance with the standards of the Public Company Accounting Oversight Board(United States). Those standards require that we plan and perform the audit to obtain reasonable assurance aboutwhether effective internal control over financial reporting was maintained in all material respects. Our auditincluded obtaining an understanding of internal control over financial reporting, evaluating management’sassessment, testing and evaluating the design and operating effectiveness of internal control, and performingsuch other procedures as we considered necessary in the circumstances. We believe that our audit provides areasonable basis for our opinion.
A company’s internal control over financial reporting is a process designed to provide reasonable assuranceregarding the reliability of financial reporting and the preparation of financial statements for external purposes inaccordance with generally accepted accounting principles. A company’s internal control over financial reportingincludes those policies and procedures that (1) pertain to the maintenance of records that, in reasonable detail,accurately and fairly reflect the transactions and dispositions of the assets of the company; (2) provide reasonableassurance that transactions are recorded as necessary to permit preparation of financial statements in accordancewith generally accepted accounting principles, and that receipts and expenditures of the company are being madeonly in accordance with authorizations of management and directors of the company; and (3) provide reasonableassurance regarding prevention or timely detection of unauthorized acquisition, use, or disposition of the company’sassets that could have a material effect on the financial statements.
Because of its inherent limitations, internal control over financial reporting may not prevent or detectmisstatements. Also, projections of any evaluation of effectiveness to future periods are subject to the risk thatcontrols may become inadequate because of changes in conditions, or that the degree of compliance with thepolicies or procedures may deteriorate.
In our opinion, management’s assessment that Textron Financial Corporation maintained effective internalcontrol over financial reporting as of December 31, 2005, is fairly stated, in all material respects, based on theCOSO criteria. Also, in our opinion, Textron Financial Corporation maintained, in all material respects, effectiveinternal control over financial reporting as of December 31, 2005, based on the COSO criteria.
We also have audited, in accordance with the standards of the Public Company Accounting Oversight Board(United States), the consolidated balance sheets of Textron Financial Corporation as of December 31, 2005 andJanuary 1, 2005, and the related consolidated statements of income, cash flows and changes in shareholder’s equityfor each of the three years in the period ended December 31, 2005 of Textron Financial Corporation and our reportdated February 13, 2006 expressed an unqualified opinion thereon.
Boston, MassachusettsFebruary 13, 2006
28

REPORT OF INDEPENDENT REGISTERED PUBLIC ACCOUNTING FIRM
To the Board of DirectorsTextron Financial Corporation
We have audited the accompanying consolidated balance sheets of Textron Financial Corporation (the“Company”) as of December 31, 2005 and January 1, 2005, and the related consolidated statements of income,cash flows and changes in shareholder’s equity for each of the three years in the period ended December 31, 2005.These financial statements are the responsibility of the Company’s management. Our responsibility is to express anopinion on these financial statements based on our audits.
We conducted our audits in accordance with the standards of the Public Company Accounting Oversight Board(United States). Those standards require that we plan and perform the audit to obtain reasonable assurance aboutwhether the financial statements are free of material misstatement. An audit includes examining, on a test basis,evidence supporting the amounts and disclosures in the financial statements. An audit also includes assessing theaccounting principles used and significant estimates made by management, as well as evaluating the overallfinancial statement presentation. We believe that our audits provide a reasonable basis for our opinion.
In our opinion, the consolidated financial statements referred to above present fairly, in all material respects,the consolidated financial position of Textron Financial Corporation at December 31, 2005 and January 1, 2005 andthe consolidated results of its operations and its cash flows for each of the three years in the period endedDecember 31, 2005, in conformity with U.S. generally accepted accounting principles.
We also have audited, in accordance with the standards of the Public Company Accounting Oversight Board(United States), the effectiveness of Textron Financial Corporation’s internal control over financial reporting as ofDecember 31, 2005 based on criteria established in Internal Control — Integrated Framework issued by theCommittee of Sponsoring Organizations of the Treadway Commission and our report dated February 13, 2006expressed an unqualified opinion thereon.
Boston, MassachusettsFebruary 13, 2006
29

CONSOLIDATED STATEMENTS OF INCOME
For each of the three years in the period ended December 31, 2005
2005 2004 2003(In millions)
Finance charges and discounts . . . . . . . . . . . . . . . . . . . . . . . . . . . . . . . . . . . . . . . . . . $464 $369 $404
Rental revenues on operating leases . . . . . . . . . . . . . . . . . . . . . . . . . . . . . . . . . . . . . . 32 29 29
Securitization gains . . . . . . . . . . . . . . . . . . . . . . . . . . . . . . . . . . . . . . . . . . . . . . . . . . 49 56 43
Other income. . . . . . . . . . . . . . . . . . . . . . . . . . . . . . . . . . . . . . . . . . . . . . . . . . . . . . . 83 91 96
Total revenues . . . . . . . . . . . . . . . . . . . . . . . . . . . . . . . . . . . . . . . . . . . . . . . . . . . . . 628 545 572
Interest expense . . . . . . . . . . . . . . . . . . . . . . . . . . . . . . . . . . . . . . . . . . . . . . . . . . . . . 218 154 171
Depreciation of equipment on operating leases . . . . . . . . . . . . . . . . . . . . . . . . . . . . . . 19 18 18
Net interest margin . . . . . . . . . . . . . . . . . . . . . . . . . . . . . . . . . . . . . . . . . . . . . . . . . 391 373 383
Selling and administrative expenses . . . . . . . . . . . . . . . . . . . . . . . . . . . . . . . . . . . . . . 191 176 179
Provision for losses . . . . . . . . . . . . . . . . . . . . . . . . . . . . . . . . . . . . . . . . . . . . . . . . . . 29 58 81
Special charges . . . . . . . . . . . . . . . . . . . . . . . . . . . . . . . . . . . . . . . . . . . . . . . . . . . . . — — 6
Income from continuing operations before income taxes and distributions onpreferred securities . . . . . . . . . . . . . . . . . . . . . . . . . . . . . . . . . . . . . . . . . . . . . . . . 171 139 117
Income taxes . . . . . . . . . . . . . . . . . . . . . . . . . . . . . . . . . . . . . . . . . . . . . . . . . . . . . . . 57 45 37
Distributions on preferred securities, net of income taxes . . . . . . . . . . . . . . . . . . . . . . — — 1
Income from continuing operations . . . . . . . . . . . . . . . . . . . . . . . . . . . . . . . . . . . . . 114 94 79
(Loss) income from discontinued operations, net of income taxes . . . . . . . . . . . . . . . . (3) — 1
Net income . . . . . . . . . . . . . . . . . . . . . . . . . . . . . . . . . . . . . . . . . . . . . . . . . . . . . . . . $111 $ 94 $ 80
See notes to consolidated financial statements.
30

CONSOLIDATED BALANCE SHEETSDecember 31,
2005January 1,
2005(In millions)
AssetsCash and equivalents . . . . . . . . . . . . . . . . . . . . . . . . . . . . . . . . . . . . . . . . . . . . . . . $ 10 $ 127
Finance receivables, net of unearned income:
Distribution finance receivables . . . . . . . . . . . . . . . . . . . . . . . . . . . . . . . . . . . . . . 1,654 1,026
Revolving loans . . . . . . . . . . . . . . . . . . . . . . . . . . . . . . . . . . . . . . . . . . . . . . . . . 1,633 1,402
Installment contracts . . . . . . . . . . . . . . . . . . . . . . . . . . . . . . . . . . . . . . . . . . . . . . 1,374 1,455
Golf course and resort mortgages . . . . . . . . . . . . . . . . . . . . . . . . . . . . . . . . . . . . 1,020 1,005
Leveraged leases . . . . . . . . . . . . . . . . . . . . . . . . . . . . . . . . . . . . . . . . . . . . . . . . . 569 539
Finance leases . . . . . . . . . . . . . . . . . . . . . . . . . . . . . . . . . . . . . . . . . . . . . . . . . . 513 410
Total finance receivables . . . . . . . . . . . . . . . . . . . . . . . . . . . . . . . . . . . . . . . . . 6,763 5,837
Allowance for losses on finance receivables . . . . . . . . . . . . . . . . . . . . . . . . . . . . . . (96) (99)
Finance receivables — net . . . . . . . . . . . . . . . . . . . . . . . . . . . . . . . . . . . . . . . . 6,667 5,738
Equipment on operating leases — net . . . . . . . . . . . . . . . . . . . . . . . . . . . . . . . . . . . 231 237
Goodwill . . . . . . . . . . . . . . . . . . . . . . . . . . . . . . . . . . . . . . . . . . . . . . . . . . . . . . . . 169 169
Other assets . . . . . . . . . . . . . . . . . . . . . . . . . . . . . . . . . . . . . . . . . . . . . . . . . . . . . . 364 467
Total assets . . . . . . . . . . . . . . . . . . . . . . . . . . . . . . . . . . . . . . . . . . . . . . . . . . . $7,441 $6,738
Liabilities and shareholder’s equityLiabilitiesAccrued interest and other liabilities . . . . . . . . . . . . . . . . . . . . . . . . . . . . . . . . . . . . $ 499 $ 453
Amounts due to Textron Inc. . . . . . . . . . . . . . . . . . . . . . . . . . . . . . . . . . . . . . . . . . 11 14
Deferred income taxes . . . . . . . . . . . . . . . . . . . . . . . . . . . . . . . . . . . . . . . . . . . . . . 461 453
Debt . . . . . . . . . . . . . . . . . . . . . . . . . . . . . . . . . . . . . . . . . . . . . . . . . . . . . . . . . . . 5,420 4,783
Total liabilities . . . . . . . . . . . . . . . . . . . . . . . . . . . . . . . . . . . . . . . . . . . . . . . . 6,391 5,703
Shareholder’s equityCapital surplus . . . . . . . . . . . . . . . . . . . . . . . . . . . . . . . . . . . . . . . . . . . . . . . . . . . . 574 574
Investment in parent company preferred stock . . . . . . . . . . . . . . . . . . . . . . . . . . . . . (25) (25)
Accumulated other comprehensive income . . . . . . . . . . . . . . . . . . . . . . . . . . . . . . . 5 1
Retained earnings . . . . . . . . . . . . . . . . . . . . . . . . . . . . . . . . . . . . . . . . . . . . . . . . . . 496 485
Total shareholder’s equity . . . . . . . . . . . . . . . . . . . . . . . . . . . . . . . . . . . . . . . . 1,050 1,035
Total liabilities and shareholder’s equity . . . . . . . . . . . . . . . . . . . . . . . . . . . . . . $7,441 $6,738
See notes to consolidated financial statements.
31
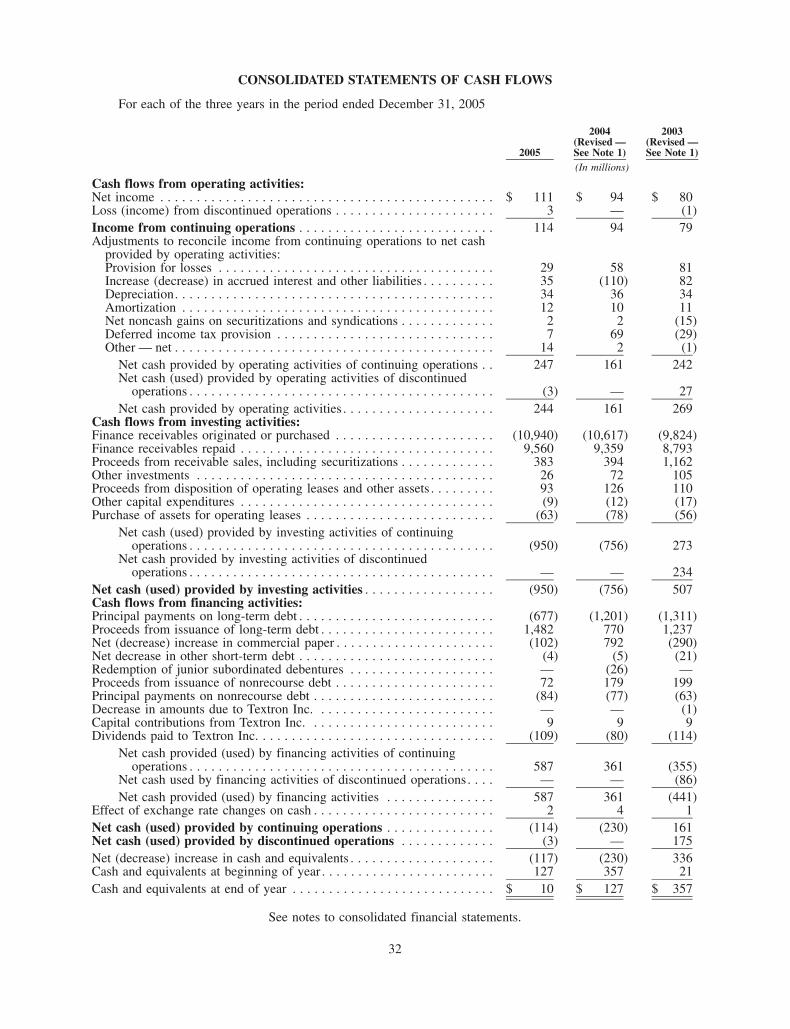
CONSOLIDATED STATEMENTS OF CASH FLOWS
For each of the three years in the period ended December 31, 2005
2005
2004(Revised —See Note 1)
2003(Revised —See Note 1)
(In millions)
Cash flows from operating activities:Net income . . . . . . . . . . . . . . . . . . . . . . . . . . . . . . . . . . . . . . . . . . . . . . $ 111 $ 94 $ 80Loss (income) from discontinued operations . . . . . . . . . . . . . . . . . . . . . . 3 — (1)Income from continuing operations . . . . . . . . . . . . . . . . . . . . . . . . . . . 114 94 79Adjustments to reconcile income from continuing operations to net cash
provided by operating activities:Provision for losses . . . . . . . . . . . . . . . . . . . . . . . . . . . . . . . . . . . . . . 29 58 81Increase (decrease) in accrued interest and other liabilities . . . . . . . . . . 35 (110) 82Depreciation. . . . . . . . . . . . . . . . . . . . . . . . . . . . . . . . . . . . . . . . . . . . 34 36 34Amortization . . . . . . . . . . . . . . . . . . . . . . . . . . . . . . . . . . . . . . . . . . . 12 10 11Net noncash gains on securitizations and syndications . . . . . . . . . . . . . 2 2 (15)Deferred income tax provision . . . . . . . . . . . . . . . . . . . . . . . . . . . . . . 7 69 (29)Other — net . . . . . . . . . . . . . . . . . . . . . . . . . . . . . . . . . . . . . . . . . . . . 14 2 (1)
Net cash provided by operating activities of continuing operations . . 247 161 242Net cash (used) provided by operating activities of discontinued
operations . . . . . . . . . . . . . . . . . . . . . . . . . . . . . . . . . . . . . . . . . . (3) — 27Net cash provided by operating activities . . . . . . . . . . . . . . . . . . . . . 244 161 269
Cash flows from investing activities:Finance receivables originated or purchased . . . . . . . . . . . . . . . . . . . . . . (10,940) (10,617) (9,824)Finance receivables repaid . . . . . . . . . . . . . . . . . . . . . . . . . . . . . . . . . . . 9,560 9,359 8,793Proceeds from receivable sales, including securitizations . . . . . . . . . . . . . 383 394 1,162Other investments . . . . . . . . . . . . . . . . . . . . . . . . . . . . . . . . . . . . . . . . . 26 72 105Proceeds from disposition of operating leases and other assets . . . . . . . . . 93 126 110Other capital expenditures . . . . . . . . . . . . . . . . . . . . . . . . . . . . . . . . . . . (9) (12) (17)Purchase of assets for operating leases . . . . . . . . . . . . . . . . . . . . . . . . . . (63) (78) (56)
Net cash (used) provided by investing activities of continuingoperations . . . . . . . . . . . . . . . . . . . . . . . . . . . . . . . . . . . . . . . . . . (950) (756) 273
Net cash provided by investing activities of discontinuedoperations . . . . . . . . . . . . . . . . . . . . . . . . . . . . . . . . . . . . . . . . . . — — 234
Net cash (used) provided by investing activities . . . . . . . . . . . . . . . . . . (950) (756) 507Cash flows from financing activities:Principal payments on long-term debt . . . . . . . . . . . . . . . . . . . . . . . . . . . (677) (1,201) (1,311)Proceeds from issuance of long-term debt . . . . . . . . . . . . . . . . . . . . . . . . 1,482 770 1,237Net (decrease) increase in commercial paper . . . . . . . . . . . . . . . . . . . . . . (102) 792 (290)Net decrease in other short-term debt . . . . . . . . . . . . . . . . . . . . . . . . . . . (4) (5) (21)Redemption of junior subordinated debentures . . . . . . . . . . . . . . . . . . . . — (26) —Proceeds from issuance of nonrecourse debt . . . . . . . . . . . . . . . . . . . . . . 72 179 199Principal payments on nonrecourse debt . . . . . . . . . . . . . . . . . . . . . . . . . (84) (77) (63)Decrease in amounts due to Textron Inc. . . . . . . . . . . . . . . . . . . . . . . . . — — (1)Capital contributions from Textron Inc. . . . . . . . . . . . . . . . . . . . . . . . . . 9 9 9Dividends paid to Textron Inc. . . . . . . . . . . . . . . . . . . . . . . . . . . . . . . . . (109) (80) (114)
Net cash provided (used) by financing activities of continuingoperations . . . . . . . . . . . . . . . . . . . . . . . . . . . . . . . . . . . . . . . . . . 587 361 (355)
Net cash used by financing activities of discontinued operations. . . . — — (86)Net cash provided (used) by financing activities . . . . . . . . . . . . . . . 587 361 (441)
Effect of exchange rate changes on cash . . . . . . . . . . . . . . . . . . . . . . . . . 2 4 1Net cash (used) provided by continuing operations . . . . . . . . . . . . . . . (114) (230) 161Net cash (used) provided by discontinued operations . . . . . . . . . . . . . (3) — 175Net (decrease) increase in cash and equivalents . . . . . . . . . . . . . . . . . . . . (117) (230) 336Cash and equivalents at beginning of year . . . . . . . . . . . . . . . . . . . . . . . . 127 357 21Cash and equivalents at end of year . . . . . . . . . . . . . . . . . . . . . . . . . . . . $ 10 $ 127 $ 357
See notes to consolidated financial statements.
32
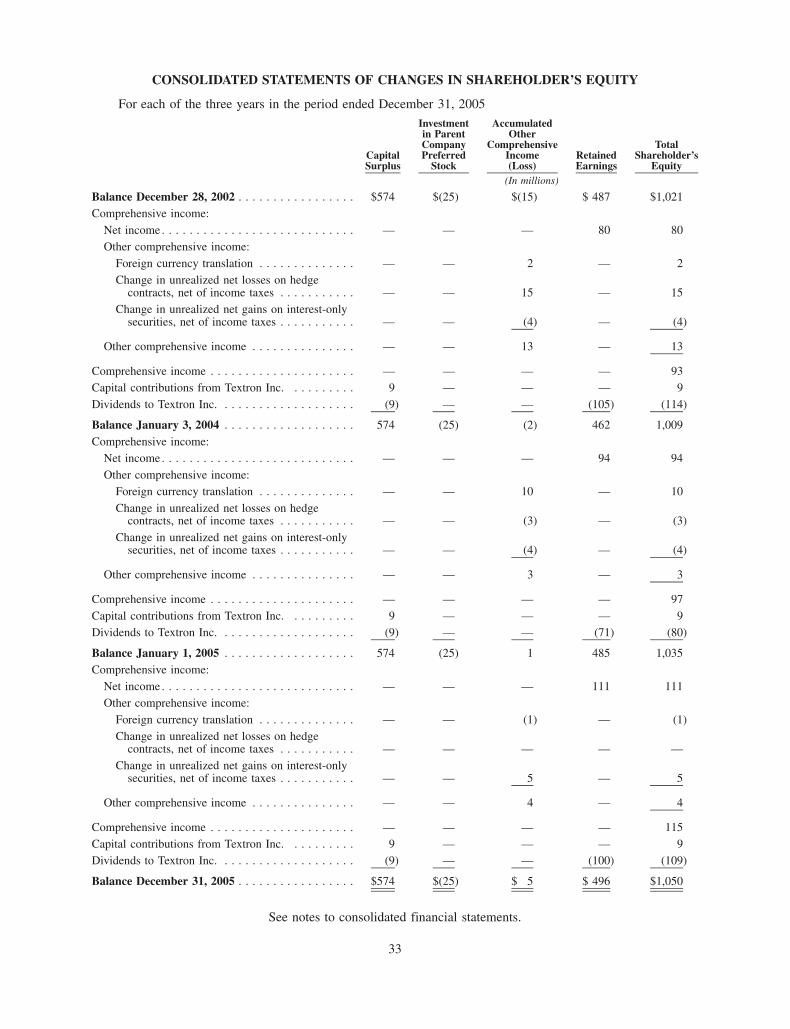
CONSOLIDATED STATEMENTS OF CHANGES IN SHAREHOLDER’S EQUITY
For each of the three years in the period ended December 31, 2005
CapitalSurplus
Investmentin ParentCompanyPreferred
Stock
AccumulatedOther
ComprehensiveIncome(Loss)
RetainedEarnings
TotalShareholder’s
Equity(In millions)
Balance December 28, 2002 . . . . . . . . . . . . . . . . . $574 $(25) $(15) $ 487 $1,021Comprehensive income:
Net income . . . . . . . . . . . . . . . . . . . . . . . . . . . . — — — 80 80Other comprehensive income:
Foreign currency translation . . . . . . . . . . . . . . — — 2 — 2Change in unrealized net losses on hedge
contracts, net of income taxes . . . . . . . . . . . — — 15 — 15Change in unrealized net gains on interest-only
securities, net of income taxes . . . . . . . . . . . — — (4) — (4)
Other comprehensive income . . . . . . . . . . . . . . . — — 13 — 13
Comprehensive income . . . . . . . . . . . . . . . . . . . . . — — — — 93Capital contributions from Textron Inc. . . . . . . . . . 9 — — — 9Dividends to Textron Inc. . . . . . . . . . . . . . . . . . . . (9) — — (105) (114)
Balance January 3, 2004 . . . . . . . . . . . . . . . . . . . 574 (25) (2) 462 1,009Comprehensive income:
Net income . . . . . . . . . . . . . . . . . . . . . . . . . . . . — — — 94 94Other comprehensive income:
Foreign currency translation . . . . . . . . . . . . . . — — 10 — 10Change in unrealized net losses on hedge
contracts, net of income taxes . . . . . . . . . . . — — (3) — (3)Change in unrealized net gains on interest-only
securities, net of income taxes . . . . . . . . . . . — — (4) — (4)
Other comprehensive income . . . . . . . . . . . . . . . — — 3 — 3
Comprehensive income . . . . . . . . . . . . . . . . . . . . . — — — — 97Capital contributions from Textron Inc. . . . . . . . . . 9 — — — 9Dividends to Textron Inc. . . . . . . . . . . . . . . . . . . . (9) — — (71) (80)
Balance January 1, 2005 . . . . . . . . . . . . . . . . . . . 574 (25) 1 485 1,035Comprehensive income:
Net income . . . . . . . . . . . . . . . . . . . . . . . . . . . . — — — 111 111Other comprehensive income:
Foreign currency translation . . . . . . . . . . . . . . — — (1) — (1)Change in unrealized net losses on hedge
contracts, net of income taxes . . . . . . . . . . . — — — — —Change in unrealized net gains on interest-only
securities, net of income taxes . . . . . . . . . . . — — 5 — 5
Other comprehensive income . . . . . . . . . . . . . . . — — 4 — 4
Comprehensive income . . . . . . . . . . . . . . . . . . . . . — — — — 115Capital contributions from Textron Inc. . . . . . . . . . 9 — — — 9Dividends to Textron Inc. . . . . . . . . . . . . . . . . . . . (9) — — (100) (109)
Balance December 31, 2005 . . . . . . . . . . . . . . . . . $574 $(25) $ 5 $ 496 $1,050
See notes to consolidated financial statements.
33

NOTES TO CONSOLIDATED FINANCIAL STATEMENTS
NOTE 1 Summary of Significant Accounting Policies
Nature of Operations
Textron Financial Corporation (Textron Financial or the Company) is a diversified commercial financecompany with operations in six segments: Aircraft Finance, Asset-Based Lending, Distribution Finance, GolfFinance, Resort Finance and Structured Capital. Aircraft Finance provides financing for new and used Cessnabusiness jets, single engine turboprops, piston-engine airplanes, Bell helicopters and other general aviation aircraft.Asset-Based Lending provides asset-based loans to middle-market companies in several industries, and providesfactoring arrangements primarily for freight companies. Distribution Finance primarily offers inventory financeprograms for dealers of Textron manufactured products and for dealers of a variety of other household, housing,leisure, agricultural and technology products. Golf Finance primarily makes mortgage loans for the acquisition andrefinancing of golf courses, and provides term financing for E-Z-GO golf cars and Jacobsen turf-care equipment.Resort Finance primarily extends loans to developers of vacation interval resorts, secured primarily by notesreceivable and interval inventory. Structured Capital primarily engages in long-term leases of large-ticket equip-ment and real estate, primarily with investment grade lessees. Textron Financial’s other financial services andproducts include transaction syndication, equipment appraisal and disposition, and portfolio servicing.
Textron Financial’s financing activities are confined almost exclusively to secured lending and leasing tocommercial markets. Textron Financial’s services are offered primarily in North America. However, TextronFinancial finances certain Textron products worldwide, principally Bell helicopters and Cessna aircraft.
Textron Financial is a subsidiary of Textron Inc. (Textron), a global multi-industry company with operations infour business segments: Bell, Cessna, Industrial and Finance. At December 31, 2005 and January 1, 2005, 19% ofand 21% Textron Financial’s total managed finance receivables were related to the financing of Textron’s products,respectively. Textron Financial’s year-end dates conform with Textron’s year-end, which falls on the nearestSaturday to December 31.
Principles of Consolidation
The accompanying consolidated financial statements include the accounts of Textron Financial and itssubsidiaries, all of which are wholly-owned. All significant intercompany transactions have been eliminated.
In 2005, Textron Financial has separately disclosed the operating, investing and financing portions of the cashflows attributable to its discontinued operations, which in prior periods were reported on a combined basis as asingle amount. Prior periods have been revised to conform to this presentation.
Use of Estimates
The preparation of financial statements in conformity with generally accepted accounting principles requiresmanagement to make estimates and assumptions that affect the amounts reported in those statements andaccompanying notes. Actual results may differ from such estimates.
Finance Charges and Discounts
Finance charges and discounts include interest on loans, capital lease earnings, leveraged lease earnings anddiscounts on certain revolving credit and factoring arrangements. Finance charges are recognized in finance chargerevenues using the interest method to produce a constant rate of return over the terms of the finance assets. Accrualof interest income is suspended for accounts that are contractually delinquent by more than three months, unlesscollection is not doubtful. In addition, detailed reviews of loans may result in earlier suspension if collection isdoubtful. Cash payments on nonaccrual accounts, including finance charges, generally are applied to reduce loanprincipal. Accrual of interest is resumed when the loan becomes contractually current, and suspended interestincome is recognized at that time.
34

Finance Receivable Origination Fees and Costs
Fees received and direct loan origination costs are deferred and amortized to finance charge revenues over thecontractual lives of the respective receivables using the interest method. Unamortized amounts are recognized inrevenues when receivables are sold or paid in full.
Other Income
Other income includes syndication gains on the sale of loans and leases, late charges, prepayment gains,servicing fees, residual gains, investment income and other miscellaneous fees, which are primarily recognized asincome when received. It also includes earnings on retained interests in securitizations including interest on sellercertificates and cash reserve accounts as well as the accretable yield on interest-only securities.
Allowance for Losses on Finance Receivables
Management evaluates its allowance for losses on finance receivables based on a combination of factors. Forits homogeneous loan pools, Textron Financial examines current delinquencies, the characteristics of the existingaccounts, historical loss experience, the value of the underlying collateral and general economic conditions andtrends. For larger balance commercial loans, Textron Financial considers borrower specific information, industrytrends and estimated discounted cash flows, as well as the factors described above for homogeneous loan pools.
Provisions for losses on finance receivables are charged to income, in amounts sufficient to maintain theallowance for losses on finance receivables at a level considered adequate to cover existing losses in the ownedfinance receivable portfolio, based on management’s evaluation and analysis of this portfolio.
Finance receivables are charged off when they are deemed uncollectible. Finance receivables are written downto the fair value (less estimated costs to sell) of the related collateral at the earlier of the date the collateral isrepossessed or when no payment has been received for six months, unless management deems the receivablecollectible.
Loan Impairment
Textron Financial periodically evaluates finance receivables, excluding homogeneous loan portfolios andfinance leases, for impairment. A loan is considered impaired when it is probable that the Company will be unableto collect all amounts due according to the contractual terms of the loan agreement. In addition, the Companyidentifies loans that are considered impaired due to the significant modification of the original loan terms to reflectdeferred principal payments generally at market interest rates, but which continue to accrue finance charges sincefull collection of principal and interest is not doubtful. Impairment is measured by comparing the fair value of a loanto its carrying amount. Fair value is based on the present value of expected future cash flows discounted at the loan’seffective interest rate, the loan’s observable market price or, if the loan is collateral dependent, at the fair value of thecollateral, less selling costs. If the fair value of the loan is less than its carrying amount, the Company establishes areserve based on this difference. This evaluation is inherently subjective, as it requires estimates, including theamount and timing of future cash flows expected to be received on impaired loans, which may differ from actualresults.
Equipment on Operating Leases
Income from operating leases is recognized in equal amounts over the lease terms. The costs of such assets arecapitalized and depreciated to estimated residual values using the straight-line method over the estimated useful lifeof the asset or the lease term.
Goodwill
Management evaluates the recoverability of goodwill annually, or more frequently if events or changes incircumstances, such as declines in interest margin, earnings or cash flows or material adverse changes in thebusiness climate, indicate that the carrying value might be impaired. Goodwill is considered to be impaired whenthe net book value of a reporting unit exceeds its estimated fair value. Fair values are primarily established using a
35
discounted cash flow methodology. The determination of discounted cash flow is based on the businesses’ strategicplans and long-range planning forecasts.
Pension Benefits and Postretirement Benefits Other than Pensions
Textron Financial participates in Textron’s defined contribution and defined benefit pension plans. The cost ofthe defined contribution plan amounted to approximately $1.9 million, $1.1 million and $0.6 million in 2005, 2004and 2003, respectively. The cost of the defined benefit pension plan amounted to approximately $9.5 million,$7.7 million and $6.6 million in 2005, 2004 and 2003, respectively. Defined benefits under salaried plans are basedon salary and years of service. Textron’s funding policy is consistent with federal law and regulations. Pension planassets consist principally of corporate and government bonds and common stocks. Accrued pension expense isincluded in Accrued interest and other liabilities on Textron Financial’s Consolidated Balance Sheets.
Income Taxes
Textron Financial’s revenues and expenses are included in Textron’s consolidated tax return. TextronFinancial’s current tax expense reflects statutory U.S. tax rates applied to taxable income or loss included inTextron’s consolidated returns.
Deferred income taxes are recognized for temporary differences between the financial reporting basis andincome tax basis of assets and liabilities, based on enacted tax rates expected to be in effect when such amounts areexpected to be realized or settled.
Securitized Transactions
Securitized transactions involve the sale of finance receivables to qualified special purpose trusts. TextronFinancial may retain an interest in the assets sold in the form of interest-only securities, seller certificates, cashreserve accounts and servicing rights and obligations. The Company’s retained interests are subordinate to otherinvestors’ interests in the securitizations. Gain or loss on the sale of the loans or leases depends in part on theprevious carrying amount of the financial assets involved in the transfer, allocated between the assets sold and theretained interests based on their relative fair values at the date of transfer. Retained interests are recorded at fairvalue as a component of Other assets on Textron Financial’s Consolidated Balance Sheets. The Company estimatesfair values based on the present value of future cash flows expected under management’s best estimates of keyassumptions — credit losses, prepayment speeds and discount rates commensurate with the risks involved.
Textron Financial reviews the fair values of the retained interests quarterly using updated assumptions andcompares such amounts with the carrying value of the retained interests. When the carrying value exceeds the fairvalue of the retained interests, the Company determines whether the decline in fair value is other than temporary.When the Company determines the value of the decline is other than temporary, it writes down the retained intereststo fair value with a corresponding charge to income. When a change in fair value of the Company’s retained interestsis deemed temporary, the Company records a corresponding credit or charge to Other comprehensive income forany unrealized gains or losses.
Textron Financial does not provide legal recourse to third-party investors that purchase interests in TextronFinancial’s securitizations beyond the credit enhancement inherent in the retained interest-only securities, sellercertificates and cash reserve accounts.
Derivative Financial Instruments
Textron Financial has entered into various interest rate and foreign exchange agreements to mitigate itsexposure to changes in interest and foreign exchange rates. The Company records all derivative financialinstruments on its balance sheet at fair value and recognizes changes in fair values in current earnings unlessthe derivatives qualify as hedges of future cash flows. For derivatives qualifying as hedges of future cash flows, theCompany records the effective portion of the change in fair value as a component of Other comprehensive income inthe periods the hedged transaction affects earnings.
36

Textron Financial recognizes the net interest differential on interest rate exchange agreements as adjustmentsto finance income or interest expense to correspond with the hedged positions. In the event of an early termination ofa derivative financial instrument, the Company defers the gain or loss in Other comprehensive income until itrecognizes the hedged transaction in earnings.
While these exchange agreements expose Textron Financial to credit losses in the event of nonperformance bythe counterparties to the agreements, the Company does not expect any such nonperformance. The Companyminimizes the risk of nonperformance by entering into contracts with financially sound counterparties having long-term bond ratings of generally no less than single A, by continuously monitoring such credit ratings and by limitingits exposure with any one financial institution. At December 31, 2005, the Company’s largest single counterpartycredit exposure was $10 million.
Fair Value of Financial Instruments
Fair values of financial instruments are based upon estimates at a specific point in time using available marketinformation and appropriate valuation methodologies. These estimates are subjective in nature and involveuncertainties and significant judgment in the interpretation of current market data. Therefore, the fair valuespresented are not necessarily indicative of amounts Textron Financial could realize or settle currently.
Cash and Equivalents
Cash and equivalents consist of cash in banks and overnight interest-bearing deposits in banks.
Reclassifications
Certain prior year amounts have been reclassified to conform with the current year presentation.
Share-Based Compensation
Textron Financial participates in Textron Inc.’s 1999 Long-Term Incentive Plan (the “Plan”). The Plan awardsemployees options to purchase Textron shares and restricted stock. In December 2004, the Financial AccountingStandards Board (“FASB”) issued Statement of Financial Accounting Standards (“SFAS”) No. 123 (Revised 2004),“Share-Based Payment” (“SFAS No. 123-R”), which replaces SFAS No. 123, “Accounting for Stock-BasedCompensation” and supercedes Accounting Principles Board Opinion No. 25, “Accounting for Stock Issued toEmployees.” SFAS No. 123-R requires companies to measure compensation expense for share-based payments toemployees, including stock options, at fair value and expense such compensation over the service period beginningwith the first interim or annual period after June 15, 2005. In April 2005, the Securities and Exchange Commissiondelayed the transition date for companies to the first fiscal year beginning after June 15, 2005, effectively delayingTextron’s required adoption of SFAS No. 123-R until the first quarter of 2006. Textron elected to adoptSFAS No. 123-R in the first quarter of 2005 using the modified prospective method. In connection with theadoption of this standard, the compensation expense recognized related to Textron Financial employees in 2005 was$2.1 million.
New Accounting Pronouncements
In November 2005, the FASB issued Staff Position (“FSP”) FAS 140-2, “Clarification of the Application ofParagraphs 40(b) and 40(c) of FASB Statement No. 140.” The FSP specifies criteria that must be met for a derivativefinancial instrument to pertain to beneficial interests issued in a qualifying special-purpose-entity (“qualifyingSPE”). FASB Statement 140 limits the notional amount of derivatives issued in a qualifying SPE to the amount ofthe beneficial interest held by parties other than the transferor, but did not specifically address whether a qualifyingSPE would become disqualified if the derivative notional amount becomes greater than the beneficial interests dueto unexpected events subsequent to the inception of the qualifying SPE. The FSP clarifies that subsequent eventsoutside the control of the transferor would not impair the qualified status of the qualifying SPE. At December 31,2005, qualifying SPE’s, in which Textron Financial has retained interests, comply with the provisions set forth inFASB Statement 140 related to the issuance of derivative financial instruments.
37
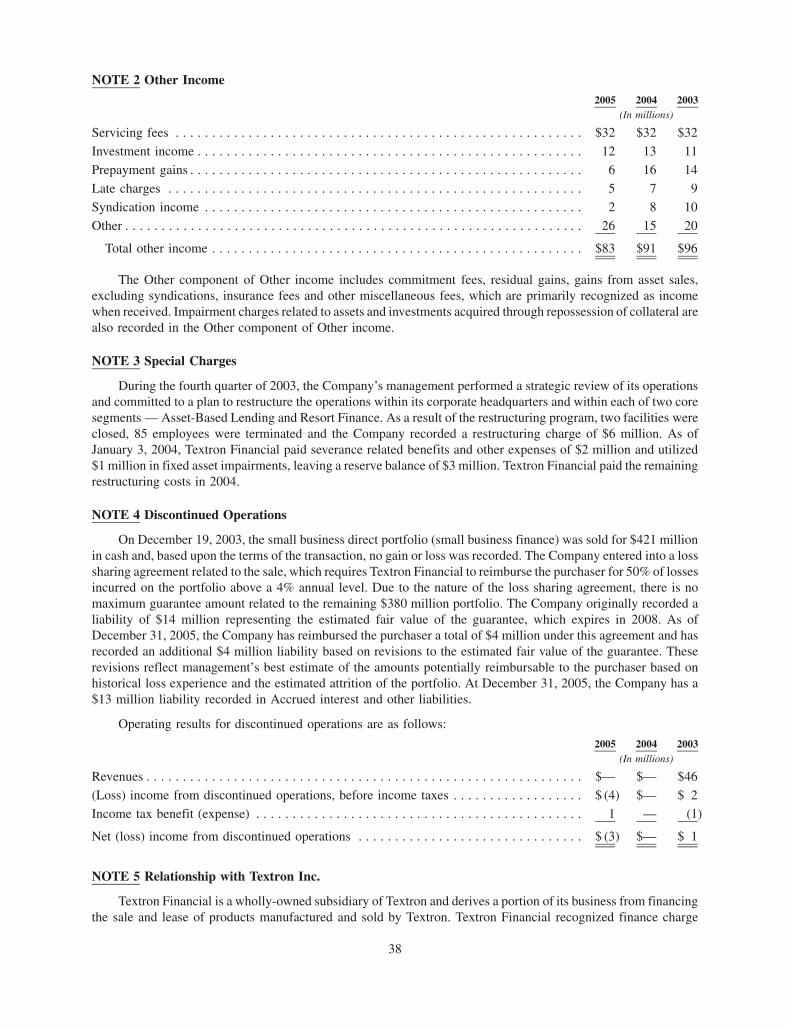
NOTE 2 Other Income
2005 2004 2003(In millions)
Servicing fees . . . . . . . . . . . . . . . . . . . . . . . . . . . . . . . . . . . . . . . . . . . . . . . . . . . . . . . . $32 $32 $32
Investment income . . . . . . . . . . . . . . . . . . . . . . . . . . . . . . . . . . . . . . . . . . . . . . . . . . . . . 12 13 11
Prepayment gains . . . . . . . . . . . . . . . . . . . . . . . . . . . . . . . . . . . . . . . . . . . . . . . . . . . . . . 6 16 14
Late charges . . . . . . . . . . . . . . . . . . . . . . . . . . . . . . . . . . . . . . . . . . . . . . . . . . . . . . . . . 5 7 9
Syndication income . . . . . . . . . . . . . . . . . . . . . . . . . . . . . . . . . . . . . . . . . . . . . . . . . . . . 2 8 10
Other . . . . . . . . . . . . . . . . . . . . . . . . . . . . . . . . . . . . . . . . . . . . . . . . . . . . . . . . . . . . . . . 26 15 20
Total other income . . . . . . . . . . . . . . . . . . . . . . . . . . . . . . . . . . . . . . . . . . . . . . . . . . . $83 $91 $96
The Other component of Other income includes commitment fees, residual gains, gains from asset sales,excluding syndications, insurance fees and other miscellaneous fees, which are primarily recognized as incomewhen received. Impairment charges related to assets and investments acquired through repossession of collateral arealso recorded in the Other component of Other income.
NOTE 3 Special Charges
During the fourth quarter of 2003, the Company’s management performed a strategic review of its operationsand committed to a plan to restructure the operations within its corporate headquarters and within each of two coresegments — Asset-Based Lending and Resort Finance. As a result of the restructuring program, two facilities wereclosed, 85 employees were terminated and the Company recorded a restructuring charge of $6 million. As ofJanuary 3, 2004, Textron Financial paid severance related benefits and other expenses of $2 million and utilized$1 million in fixed asset impairments, leaving a reserve balance of $3 million. Textron Financial paid the remainingrestructuring costs in 2004.
NOTE 4 Discontinued Operations
On December 19, 2003, the small business direct portfolio (small business finance) was sold for $421 millionin cash and, based upon the terms of the transaction, no gain or loss was recorded. The Company entered into a losssharing agreement related to the sale, which requires Textron Financial to reimburse the purchaser for 50% of lossesincurred on the portfolio above a 4% annual level. Due to the nature of the loss sharing agreement, there is nomaximum guarantee amount related to the remaining $380 million portfolio. The Company originally recorded aliability of $14 million representing the estimated fair value of the guarantee, which expires in 2008. As ofDecember 31, 2005, the Company has reimbursed the purchaser a total of $4 million under this agreement and hasrecorded an additional $4 million liability based on revisions to the estimated fair value of the guarantee. Theserevisions reflect management’s best estimate of the amounts potentially reimbursable to the purchaser based onhistorical loss experience and the estimated attrition of the portfolio. At December 31, 2005, the Company has a$13 million liability recorded in Accrued interest and other liabilities.
Operating results for discontinued operations are as follows:
2005 2004 2003(In millions)
Revenues . . . . . . . . . . . . . . . . . . . . . . . . . . . . . . . . . . . . . . . . . . . . . . . . . . . . . . . . . . . . $— $— $46
(Loss) income from discontinued operations, before income taxes . . . . . . . . . . . . . . . . . . $ (4) $— $ 2Income tax benefit (expense) . . . . . . . . . . . . . . . . . . . . . . . . . . . . . . . . . . . . . . . . . . . . . 1 — (1)
Net (loss) income from discontinued operations . . . . . . . . . . . . . . . . . . . . . . . . . . . . . . . $ (3) $— $ 1
NOTE 5 Relationship with Textron Inc.
Textron Financial is a wholly-owned subsidiary of Textron and derives a portion of its business from financingthe sale and lease of products manufactured and sold by Textron. Textron Financial recognized finance charge
38
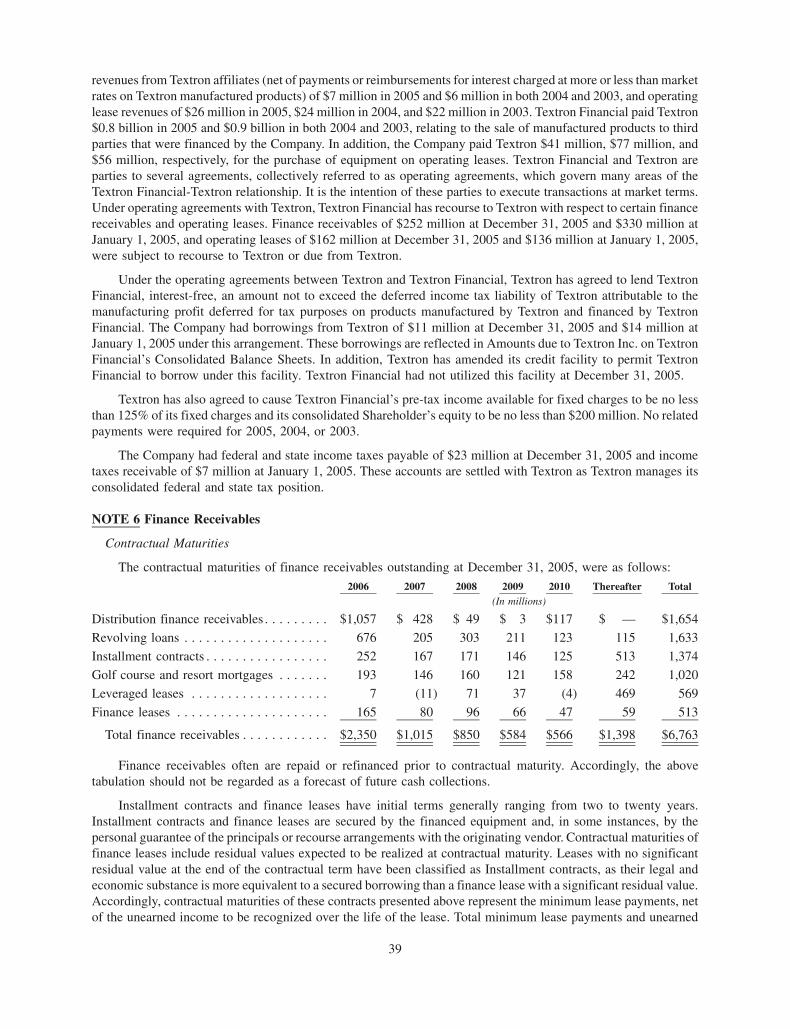
revenues from Textron affiliates (net of payments or reimbursements for interest charged at more or less than marketrates on Textron manufactured products) of $7 million in 2005 and $6 million in both 2004 and 2003, and operatinglease revenues of $26 million in 2005, $24 million in 2004, and $22 million in 2003. Textron Financial paid Textron$0.8 billion in 2005 and $0.9 billion in both 2004 and 2003, relating to the sale of manufactured products to thirdparties that were financed by the Company. In addition, the Company paid Textron $41 million, $77 million, and$56 million, respectively, for the purchase of equipment on operating leases. Textron Financial and Textron areparties to several agreements, collectively referred to as operating agreements, which govern many areas of theTextron Financial-Textron relationship. It is the intention of these parties to execute transactions at market terms.Under operating agreements with Textron, Textron Financial has recourse to Textron with respect to certain financereceivables and operating leases. Finance receivables of $252 million at December 31, 2005 and $330 million atJanuary 1, 2005, and operating leases of $162 million at December 31, 2005 and $136 million at January 1, 2005,were subject to recourse to Textron or due from Textron.
Under the operating agreements between Textron and Textron Financial, Textron has agreed to lend TextronFinancial, interest-free, an amount not to exceed the deferred income tax liability of Textron attributable to themanufacturing profit deferred for tax purposes on products manufactured by Textron and financed by TextronFinancial. The Company had borrowings from Textron of $11 million at December 31, 2005 and $14 million atJanuary 1, 2005 under this arrangement. These borrowings are reflected in Amounts due to Textron Inc. on TextronFinancial’s Consolidated Balance Sheets. In addition, Textron has amended its credit facility to permit TextronFinancial to borrow under this facility. Textron Financial had not utilized this facility at December 31, 2005.
Textron has also agreed to cause Textron Financial’s pre-tax income available for fixed charges to be no lessthan 125% of its fixed charges and its consolidated Shareholder’s equity to be no less than $200 million. No relatedpayments were required for 2005, 2004, or 2003.
The Company had federal and state income taxes payable of $23 million at December 31, 2005 and incometaxes receivable of $7 million at January 1, 2005. These accounts are settled with Textron as Textron manages itsconsolidated federal and state tax position.
NOTE 6 Finance Receivables
Contractual Maturities
The contractual maturities of finance receivables outstanding at December 31, 2005, were as follows:
2006 2007 2008 2009 2010 Thereafter Total(In millions)
Distribution finance receivables . . . . . . . . . $1,057 $ 428 $ 49 $ 3 $117 $ — $1,654
Revolving loans . . . . . . . . . . . . . . . . . . . . 676 205 303 211 123 115 1,633
Installment contracts . . . . . . . . . . . . . . . . . 252 167 171 146 125 513 1,374
Golf course and resort mortgages . . . . . . . 193 146 160 121 158 242 1,020
Leveraged leases . . . . . . . . . . . . . . . . . . . 7 (11) 71 37 (4) 469 569
Finance leases . . . . . . . . . . . . . . . . . . . . . 165 80 96 66 47 59 513
Total finance receivables . . . . . . . . . . . . $2,350 $1,015 $850 $584 $566 $1,398 $6,763
Finance receivables often are repaid or refinanced prior to contractual maturity. Accordingly, the abovetabulation should not be regarded as a forecast of future cash collections.
Installment contracts and finance leases have initial terms generally ranging from two to twenty years.Installment contracts and finance leases are secured by the financed equipment and, in some instances, by thepersonal guarantee of the principals or recourse arrangements with the originating vendor. Contractual maturities offinance leases include residual values expected to be realized at contractual maturity. Leases with no significantresidual value at the end of the contractual term have been classified as Installment contracts, as their legal andeconomic substance is more equivalent to a secured borrowing than a finance lease with a significant residual value.Accordingly, contractual maturities of these contracts presented above represent the minimum lease payments, netof the unearned income to be recognized over the life of the lease. Total minimum lease payments and unearned
39

income related to these contracts were $751 million and $164 million, respectively, at December 31, 2005, and$708 million and $136 million, respectively, at January 1, 2005. Minimum lease payments due under these contractsfor each of the next five years and the aggregate amounts due thereafter are as follows: $150 million in 2006,$125 million in 2007, $109 million in 2008, $108 million in 2009, $81 million in 2010 and $178 million thereafter.
Revolving loans generally have terms of one to five years, and at times convert to term loans that contractuallyamortize over an average term of four years. Revolving loans consist of loans secured by trade receivables,inventory, plant and equipment, pools of vacation interval resort notes receivable, pools of residential andrecreational land loans and the underlying real property.
Golf course mortgages have initial terms generally ranging from five to seven years with amortization periodsfrom 15 to 25 years. Resort mortgages generally represent construction and inventory loans with terms up to twoyears. Golf course and resort mortgages are secured by real property and are generally limited to 75% or less of theproperty’s appraised market value at loan origination. Golf course mortgages, totaling $871 million, consist of loanswith an average balance of $3.4 million and a weighted average remaining contractual maturity of five years. Resortmortgages, totaling $149 million, consist of loans with an average balance of $3.5 million and a weighted averageremaining contractual maturity of two years.
Distribution finance receivables generally mature within one year. Distribution finance receivables are securedby the inventory of the financed distributor or dealer and, in some programs, by recourse arrangements with theoriginating manufacturer. Revolving loans and Distribution finance receivables are cyclical and result in cashturnover that is several times larger than contractual maturities. In 2005, such cash turnover was 5.3 timescontractual maturities.
Leveraged leases are secured by the ownership of the leased equipment and real property. Leveraged leasesreflect contractual maturities net of contractual nonrecourse debt payments and include residual values expected tobe realized at contractual maturity. Leveraged leases have initial terms up to approximately 30 years.
Concentrations
Textron Financial’s finance receivables are diversified across geographic region, borrower industry and type ofcollateral. The Company does not track revenues by geographic region. As an alternative, the Company believesmanaged finance receivables by geographic location is a more meaningful concentration measurement. TextronFinancial’s geographic concentrations (as measured by managed finance receivables) were as follows:
2005 2004(Dollars in millions)
United States:Southeast. . . . . . . . . . . . . . . . . . . . . . . . . . . . . . . . . . . . . . . . . . . . . . . . . $2,311 26% $2,148 26%West . . . . . . . . . . . . . . . . . . . . . . . . . . . . . . . . . . . . . . . . . . . . . . . . . . . . 1,661 19% 1,548 19%Midwest . . . . . . . . . . . . . . . . . . . . . . . . . . . . . . . . . . . . . . . . . . . . . . . . . 1,277 14% 1,100 14%Southwest . . . . . . . . . . . . . . . . . . . . . . . . . . . . . . . . . . . . . . . . . . . . . . . . 1,249 14% 1,041 13%Mideast . . . . . . . . . . . . . . . . . . . . . . . . . . . . . . . . . . . . . . . . . . . . . . . . . . 924 10% 904 11%Northeast. . . . . . . . . . . . . . . . . . . . . . . . . . . . . . . . . . . . . . . . . . . . . . . . . 304 3% 300 4%
Total United States. . . . . . . . . . . . . . . . . . . . . . . . . . . . . . . . . . . . . . . . $7,726 86% $7,041 87%
Canada . . . . . . . . . . . . . . . . . . . . . . . . . . . . . . . . . . . . . . . . . . . . . . . . . . . . 400 4% 258 3%South America . . . . . . . . . . . . . . . . . . . . . . . . . . . . . . . . . . . . . . . . . . . . . . 283 3% 260 3%Mexico . . . . . . . . . . . . . . . . . . . . . . . . . . . . . . . . . . . . . . . . . . . . . . . . . . . . 237 3% 220 3%Other international . . . . . . . . . . . . . . . . . . . . . . . . . . . . . . . . . . . . . . . . . . . 349 4% 356 4%
Total managed finance receivables . . . . . . . . . . . . . . . . . . . . . . . . . . . . $8,995 100% $8,135 100%
40
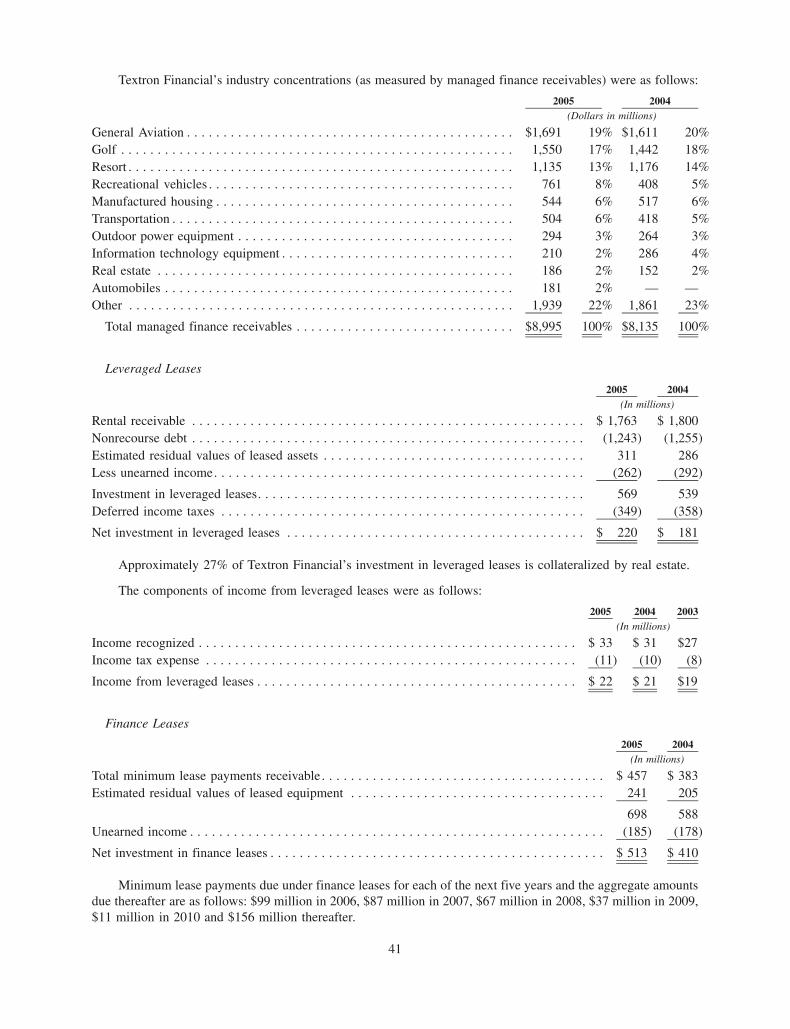
Textron Financial’s industry concentrations (as measured by managed finance receivables) were as follows:
2005 2004(Dollars in millions)
General Aviation . . . . . . . . . . . . . . . . . . . . . . . . . . . . . . . . . . . . . . . . . . . . . $1,691 19% $1,611 20%Golf . . . . . . . . . . . . . . . . . . . . . . . . . . . . . . . . . . . . . . . . . . . . . . . . . . . . . . 1,550 17% 1,442 18%Resort . . . . . . . . . . . . . . . . . . . . . . . . . . . . . . . . . . . . . . . . . . . . . . . . . . . . . 1,135 13% 1,176 14%Recreational vehicles . . . . . . . . . . . . . . . . . . . . . . . . . . . . . . . . . . . . . . . . . . 761 8% 408 5%Manufactured housing . . . . . . . . . . . . . . . . . . . . . . . . . . . . . . . . . . . . . . . . . 544 6% 517 6%Transportation . . . . . . . . . . . . . . . . . . . . . . . . . . . . . . . . . . . . . . . . . . . . . . . 504 6% 418 5%Outdoor power equipment . . . . . . . . . . . . . . . . . . . . . . . . . . . . . . . . . . . . . . 294 3% 264 3%Information technology equipment . . . . . . . . . . . . . . . . . . . . . . . . . . . . . . . . 210 2% 286 4%Real estate . . . . . . . . . . . . . . . . . . . . . . . . . . . . . . . . . . . . . . . . . . . . . . . . . 186 2% 152 2%Automobiles . . . . . . . . . . . . . . . . . . . . . . . . . . . . . . . . . . . . . . . . . . . . . . . . 181 2% — —Other . . . . . . . . . . . . . . . . . . . . . . . . . . . . . . . . . . . . . . . . . . . . . . . . . . . . . 1,939 22% 1,861 23%
Total managed finance receivables . . . . . . . . . . . . . . . . . . . . . . . . . . . . . . $8,995 100% $8,135 100%
Leveraged Leases
2005 2004(In millions)
Rental receivable . . . . . . . . . . . . . . . . . . . . . . . . . . . . . . . . . . . . . . . . . . . . . . . . . . . . . . $ 1,763 $ 1,800Nonrecourse debt . . . . . . . . . . . . . . . . . . . . . . . . . . . . . . . . . . . . . . . . . . . . . . . . . . . . . . (1,243) (1,255)Estimated residual values of leased assets . . . . . . . . . . . . . . . . . . . . . . . . . . . . . . . . . . . . 311 286Less unearned income. . . . . . . . . . . . . . . . . . . . . . . . . . . . . . . . . . . . . . . . . . . . . . . . . . . (262) (292)
Investment in leveraged leases. . . . . . . . . . . . . . . . . . . . . . . . . . . . . . . . . . . . . . . . . . . . . 569 539Deferred income taxes . . . . . . . . . . . . . . . . . . . . . . . . . . . . . . . . . . . . . . . . . . . . . . . . . . (349) (358)
Net investment in leveraged leases . . . . . . . . . . . . . . . . . . . . . . . . . . . . . . . . . . . . . . . . . $ 220 $ 181
Approximately 27% of Textron Financial’s investment in leveraged leases is collateralized by real estate.
The components of income from leveraged leases were as follows:
2005 2004 2003(In millions)
Income recognized . . . . . . . . . . . . . . . . . . . . . . . . . . . . . . . . . . . . . . . . . . . . . . . . . . . . $ 33 $ 31 $27Income tax expense . . . . . . . . . . . . . . . . . . . . . . . . . . . . . . . . . . . . . . . . . . . . . . . . . . . (11) (10) (8)
Income from leveraged leases . . . . . . . . . . . . . . . . . . . . . . . . . . . . . . . . . . . . . . . . . . . . $ 22 $ 21 $19
Finance Leases
2005 2004(In millions)
Total minimum lease payments receivable . . . . . . . . . . . . . . . . . . . . . . . . . . . . . . . . . . . . . . . $ 457 $ 383Estimated residual values of leased equipment . . . . . . . . . . . . . . . . . . . . . . . . . . . . . . . . . . . 241 205
698 588Unearned income . . . . . . . . . . . . . . . . . . . . . . . . . . . . . . . . . . . . . . . . . . . . . . . . . . . . . . . . . (185) (178)
Net investment in finance leases . . . . . . . . . . . . . . . . . . . . . . . . . . . . . . . . . . . . . . . . . . . . . . $ 513 $ 410
Minimum lease payments due under finance leases for each of the next five years and the aggregate amountsdue thereafter are as follows: $99 million in 2006, $87 million in 2007, $67 million in 2008, $37 million in 2009,$11 million in 2010 and $156 million thereafter.
41
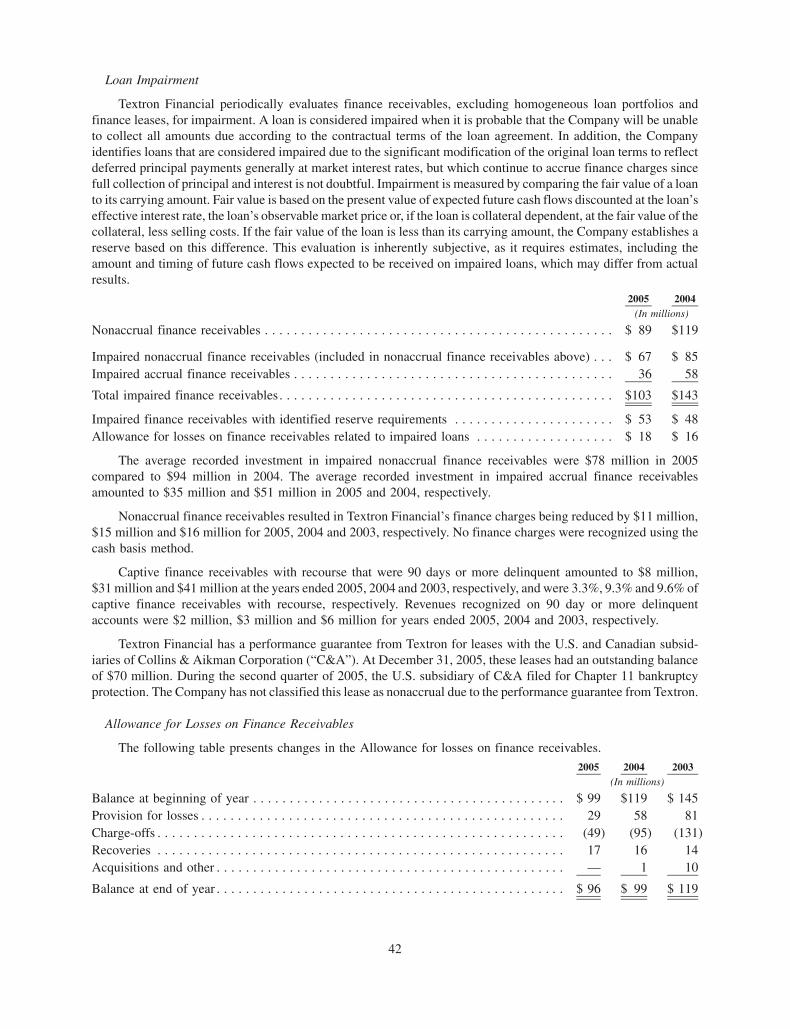
Loan Impairment
Textron Financial periodically evaluates finance receivables, excluding homogeneous loan portfolios andfinance leases, for impairment. A loan is considered impaired when it is probable that the Company will be unableto collect all amounts due according to the contractual terms of the loan agreement. In addition, the Companyidentifies loans that are considered impaired due to the significant modification of the original loan terms to reflectdeferred principal payments generally at market interest rates, but which continue to accrue finance charges sincefull collection of principal and interest is not doubtful. Impairment is measured by comparing the fair value of a loanto its carrying amount. Fair value is based on the present value of expected future cash flows discounted at the loan’seffective interest rate, the loan’s observable market price or, if the loan is collateral dependent, at the fair value of thecollateral, less selling costs. If the fair value of the loan is less than its carrying amount, the Company establishes areserve based on this difference. This evaluation is inherently subjective, as it requires estimates, including theamount and timing of future cash flows expected to be received on impaired loans, which may differ from actualresults.
2005 2004(In millions)
Nonaccrual finance receivables . . . . . . . . . . . . . . . . . . . . . . . . . . . . . . . . . . . . . . . . . . . . . . . . $ 89 $119
Impaired nonaccrual finance receivables (included in nonaccrual finance receivables above) . . . $ 67 $ 85Impaired accrual finance receivables . . . . . . . . . . . . . . . . . . . . . . . . . . . . . . . . . . . . . . . . . . . . 36 58
Total impaired finance receivables. . . . . . . . . . . . . . . . . . . . . . . . . . . . . . . . . . . . . . . . . . . . . . $103 $143
Impaired finance receivables with identified reserve requirements . . . . . . . . . . . . . . . . . . . . . . $ 53 $ 48Allowance for losses on finance receivables related to impaired loans . . . . . . . . . . . . . . . . . . . $ 18 $ 16
The average recorded investment in impaired nonaccrual finance receivables were $78 million in 2005compared to $94 million in 2004. The average recorded investment in impaired accrual finance receivablesamounted to $35 million and $51 million in 2005 and 2004, respectively.
Nonaccrual finance receivables resulted in Textron Financial’s finance charges being reduced by $11 million,$15 million and $16 million for 2005, 2004 and 2003, respectively. No finance charges were recognized using thecash basis method.
Captive finance receivables with recourse that were 90 days or more delinquent amounted to $8 million,$31 million and $41 million at the years ended 2005, 2004 and 2003, respectively, and were 3.3%, 9.3% and 9.6% ofcaptive finance receivables with recourse, respectively. Revenues recognized on 90 day or more delinquentaccounts were $2 million, $3 million and $6 million for years ended 2005, 2004 and 2003, respectively.
Textron Financial has a performance guarantee from Textron for leases with the U.S. and Canadian subsid-iaries of Collins & Aikman Corporation (“C&A”). At December 31, 2005, these leases had an outstanding balanceof $70 million. During the second quarter of 2005, the U.S. subsidiary of C&A filed for Chapter 11 bankruptcyprotection. The Company has not classified this lease as nonaccrual due to the performance guarantee from Textron.
Allowance for Losses on Finance Receivables
The following table presents changes in the Allowance for losses on finance receivables.
2005 2004 2003(In millions)
Balance at beginning of year . . . . . . . . . . . . . . . . . . . . . . . . . . . . . . . . . . . . . . . . . . . $ 99 $119 $ 145Provision for losses . . . . . . . . . . . . . . . . . . . . . . . . . . . . . . . . . . . . . . . . . . . . . . . . . . 29 58 81Charge-offs . . . . . . . . . . . . . . . . . . . . . . . . . . . . . . . . . . . . . . . . . . . . . . . . . . . . . . . . (49) (95) (131)Recoveries . . . . . . . . . . . . . . . . . . . . . . . . . . . . . . . . . . . . . . . . . . . . . . . . . . . . . . . . 17 16 14Acquisitions and other . . . . . . . . . . . . . . . . . . . . . . . . . . . . . . . . . . . . . . . . . . . . . . . . — 1 10
Balance at end of year . . . . . . . . . . . . . . . . . . . . . . . . . . . . . . . . . . . . . . . . . . . . . . . . $ 96 $ 99 $ 119
42
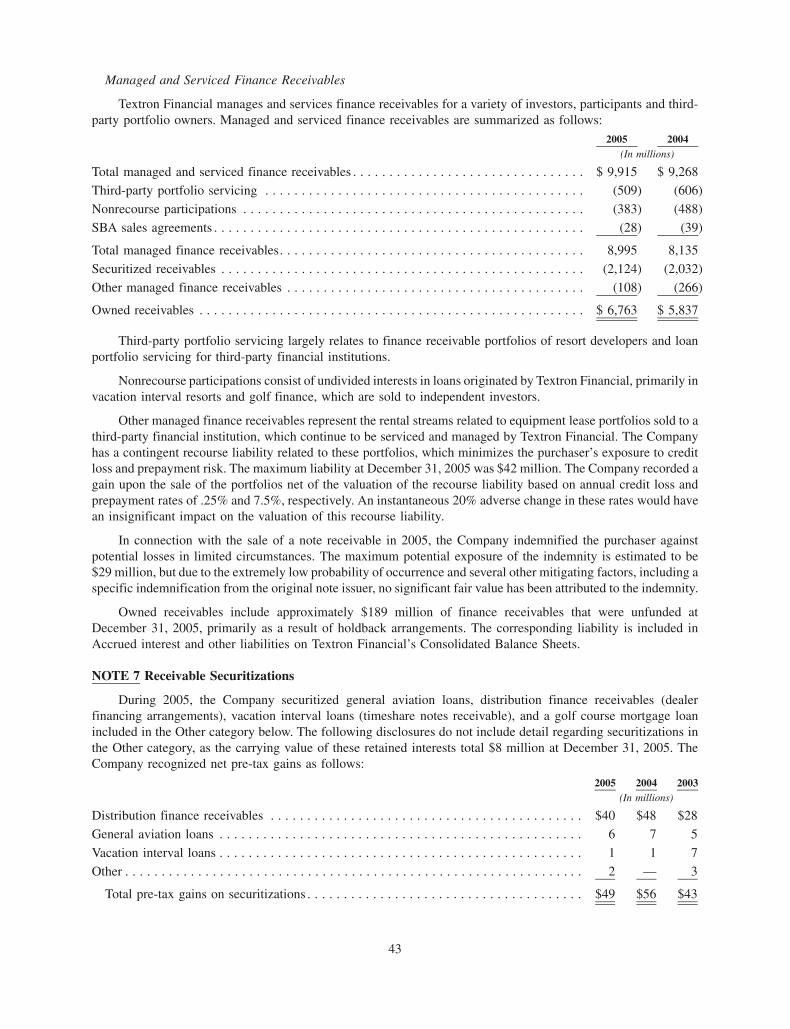
Managed and Serviced Finance Receivables
Textron Financial manages and services finance receivables for a variety of investors, participants and third-party portfolio owners. Managed and serviced finance receivables are summarized as follows:
2005 2004(In millions)
Total managed and serviced finance receivables . . . . . . . . . . . . . . . . . . . . . . . . . . . . . . . . $ 9,915 $ 9,268Third-party portfolio servicing . . . . . . . . . . . . . . . . . . . . . . . . . . . . . . . . . . . . . . . . . . . . (509) (606)
Nonrecourse participations . . . . . . . . . . . . . . . . . . . . . . . . . . . . . . . . . . . . . . . . . . . . . . . (383) (488)
SBA sales agreements . . . . . . . . . . . . . . . . . . . . . . . . . . . . . . . . . . . . . . . . . . . . . . . . . . . (28) (39)
Total managed finance receivables. . . . . . . . . . . . . . . . . . . . . . . . . . . . . . . . . . . . . . . . . . 8,995 8,135
Securitized receivables . . . . . . . . . . . . . . . . . . . . . . . . . . . . . . . . . . . . . . . . . . . . . . . . . . (2,124) (2,032)
Other managed finance receivables . . . . . . . . . . . . . . . . . . . . . . . . . . . . . . . . . . . . . . . . . (108) (266)
Owned receivables . . . . . . . . . . . . . . . . . . . . . . . . . . . . . . . . . . . . . . . . . . . . . . . . . . . . . $ 6,763 $ 5,837
Third-party portfolio servicing largely relates to finance receivable portfolios of resort developers and loanportfolio servicing for third-party financial institutions.
Nonrecourse participations consist of undivided interests in loans originated by Textron Financial, primarily invacation interval resorts and golf finance, which are sold to independent investors.
Other managed finance receivables represent the rental streams related to equipment lease portfolios sold to athird-party financial institution, which continue to be serviced and managed by Textron Financial. The Companyhas a contingent recourse liability related to these portfolios, which minimizes the purchaser’s exposure to creditloss and prepayment risk. The maximum liability at December 31, 2005 was $42 million. The Company recorded again upon the sale of the portfolios net of the valuation of the recourse liability based on annual credit loss andprepayment rates of .25% and 7.5%, respectively. An instantaneous 20% adverse change in these rates would havean insignificant impact on the valuation of this recourse liability.
In connection with the sale of a note receivable in 2005, the Company indemnified the purchaser againstpotential losses in limited circumstances. The maximum potential exposure of the indemnity is estimated to be$29 million, but due to the extremely low probability of occurrence and several other mitigating factors, including aspecific indemnification from the original note issuer, no significant fair value has been attributed to the indemnity.
Owned receivables include approximately $189 million of finance receivables that were unfunded atDecember 31, 2005, primarily as a result of holdback arrangements. The corresponding liability is included inAccrued interest and other liabilities on Textron Financial’s Consolidated Balance Sheets.
NOTE 7 Receivable Securitizations
During 2005, the Company securitized general aviation loans, distribution finance receivables (dealerfinancing arrangements), vacation interval loans (timeshare notes receivable), and a golf course mortgage loanincluded in the Other category below. The following disclosures do not include detail regarding securitizations inthe Other category, as the carrying value of these retained interests total $8 million at December 31, 2005. TheCompany recognized net pre-tax gains as follows:
2005 2004 2003(In millions)
Distribution finance receivables . . . . . . . . . . . . . . . . . . . . . . . . . . . . . . . . . . . . . . . . . . . $40 $48 $28
General aviation loans . . . . . . . . . . . . . . . . . . . . . . . . . . . . . . . . . . . . . . . . . . . . . . . . . . 6 7 5
Vacation interval loans . . . . . . . . . . . . . . . . . . . . . . . . . . . . . . . . . . . . . . . . . . . . . . . . . . 1 1 7
Other . . . . . . . . . . . . . . . . . . . . . . . . . . . . . . . . . . . . . . . . . . . . . . . . . . . . . . . . . . . . . . . 2 — 3
Total pre-tax gains on securitizations . . . . . . . . . . . . . . . . . . . . . . . . . . . . . . . . . . . . . . $49 $56 $43
43
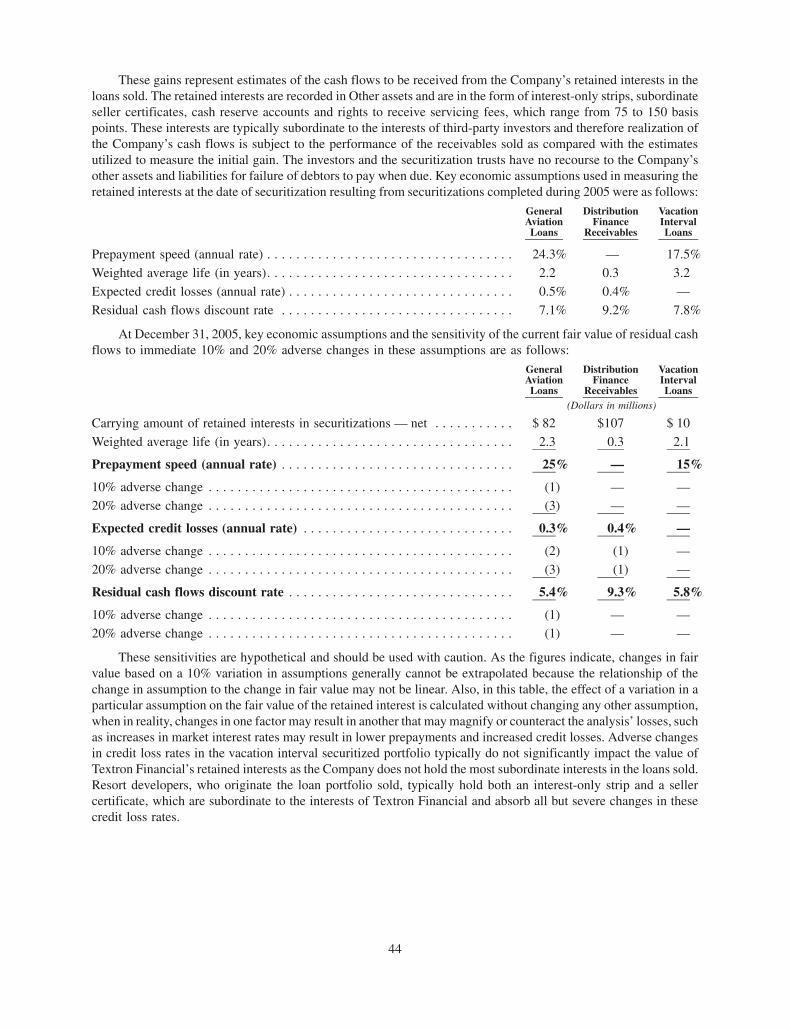
These gains represent estimates of the cash flows to be received from the Company’s retained interests in theloans sold. The retained interests are recorded in Other assets and are in the form of interest-only strips, subordinateseller certificates, cash reserve accounts and rights to receive servicing fees, which range from 75 to 150 basispoints. These interests are typically subordinate to the interests of third-party investors and therefore realization ofthe Company’s cash flows is subject to the performance of the receivables sold as compared with the estimatesutilized to measure the initial gain. The investors and the securitization trusts have no recourse to the Company’sother assets and liabilities for failure of debtors to pay when due. Key economic assumptions used in measuring theretained interests at the date of securitization resulting from securitizations completed during 2005 were as follows:
GeneralAviationLoans
DistributionFinance
Receivables
VacationIntervalLoans
Prepayment speed (annual rate) . . . . . . . . . . . . . . . . . . . . . . . . . . . . . . . . . . 24.3% — 17.5%
Weighted average life (in years). . . . . . . . . . . . . . . . . . . . . . . . . . . . . . . . . . 2.2 0.3 3.2
Expected credit losses (annual rate) . . . . . . . . . . . . . . . . . . . . . . . . . . . . . . . 0.5% 0.4% —
Residual cash flows discount rate . . . . . . . . . . . . . . . . . . . . . . . . . . . . . . . . 7.1% 9.2% 7.8%
At December 31, 2005, key economic assumptions and the sensitivity of the current fair value of residual cashflows to immediate 10% and 20% adverse changes in these assumptions are as follows:
GeneralAviationLoans
DistributionFinance
Receivables
VacationIntervalLoans
(Dollars in millions)
Carrying amount of retained interests in securitizations — net . . . . . . . . . . . $ 82 $107 $ 10
Weighted average life (in years). . . . . . . . . . . . . . . . . . . . . . . . . . . . . . . . . . 2.3 0.3 2.1
Prepayment speed (annual rate) . . . . . . . . . . . . . . . . . . . . . . . . . . . . . . . . 25% — 15%
10% adverse change . . . . . . . . . . . . . . . . . . . . . . . . . . . . . . . . . . . . . . . . . . (1) — —
20% adverse change . . . . . . . . . . . . . . . . . . . . . . . . . . . . . . . . . . . . . . . . . . (3) — —
Expected credit losses (annual rate) . . . . . . . . . . . . . . . . . . . . . . . . . . . . . 0.3% 0.4% —
10% adverse change . . . . . . . . . . . . . . . . . . . . . . . . . . . . . . . . . . . . . . . . . . (2) (1) —
20% adverse change . . . . . . . . . . . . . . . . . . . . . . . . . . . . . . . . . . . . . . . . . . (3) (1) —
Residual cash flows discount rate . . . . . . . . . . . . . . . . . . . . . . . . . . . . . . . 5.4% 9.3% 5.8%
10% adverse change . . . . . . . . . . . . . . . . . . . . . . . . . . . . . . . . . . . . . . . . . . (1) — —
20% adverse change . . . . . . . . . . . . . . . . . . . . . . . . . . . . . . . . . . . . . . . . . . (1) — —
These sensitivities are hypothetical and should be used with caution. As the figures indicate, changes in fairvalue based on a 10% variation in assumptions generally cannot be extrapolated because the relationship of thechange in assumption to the change in fair value may not be linear. Also, in this table, the effect of a variation in aparticular assumption on the fair value of the retained interest is calculated without changing any other assumption,when in reality, changes in one factor may result in another that may magnify or counteract the analysis’ losses, suchas increases in market interest rates may result in lower prepayments and increased credit losses. Adverse changesin credit loss rates in the vacation interval securitized portfolio typically do not significantly impact the value ofTextron Financial’s retained interests as the Company does not hold the most subordinate interests in the loans sold.Resort developers, who originate the loan portfolio sold, typically hold both an interest-only strip and a sellercertificate, which are subordinate to the interests of Textron Financial and absorb all but severe changes in thesecredit loss rates.
44

Static pool losses are calculated by summing the actual and projected future credit losses and dividing them bythe original balance of each pool of assets. At December 31, 2005, static pool losses related to term securitizations inthe general aviation loan portfolio are as follows:
2001 2000
YearSecuritized
Static pool loss rate . . . . . . . . . . . . . . . . . . . . . . . . . . . . . . . . . . . . . . . . . . . . . . . . . . . . . . . . . . 1.0% 0.8%
These loss rates relate to 14% ($98 million) of the total securitized general aviation loans. Static pool losses arenot calculated by the Company for revolving period securitizations, which encompass the majority of thesecuritized portfolio outstanding, as receivables are added to the portfolio on a continual basis and are not trackedas discrete pools. Therefore, loss rates for the entire portfolio are more relevant as a measure of the performance ofretained interests related to revolving period securitizations.
Historical loss and delinquency amounts for Textron Financial’s securitized portfolio and all similarlymanaged owned receivables for the year ended December 31, 2005, were as follows:
Type of Finance Receivable
TotalPrincipalAmountof Loans
and Leases
AggregateContractValue 60
Days or MorePast Due
60+ DaysDelinquency
AverageBalances
Net CreditLosses
CreditLossesAnnual
RateAt December 31, 2005 Year-Ended December 31, 2005
(Dollars in millions)
General aviation loans. . . . . . . . . . . $1,664 $19 1.1% $1,621 $ 3 0.2%
Distribution finance receivables . . . . 2,993 1 — 2,561 10 0.4%
Vacation interval loans . . . . . . . . . . 224 2 0.7% 242 1 0.6%
Total loans held and securitized . . $4,881 $22 $4,424 $14
Consisting of:Loans held in portfolio . . . . . . . . . . $2,582 13
Loans securitized . . . . . . . . . . . . . . 2,299 9
Total loans held and securitized . . $4,881 $22
Data presented above for vacation interval loans represents only the securitized portfolio. This portfolio isoriginated by resort developers and serviced by the Company. Textron Financial does not directly own similarassets. Credit losses reported in the above table are charged against the resort developers’ retained interests, whichare subordinate to Textron Financial’s retained interests.
The table below summarizes certain cash flows received from and paid to securitization trusts during the yearsended December 31, 2005 and January 1, 2005, respectively. Proceeds from securitizations includes proceedsreceived related to incremental increases in the level of Distribution finance receivables sold and excludes amountsreceived related to the ongoing replenishment of the outstanding sold balance of these receivables with shortdurations.
2005 2004(In millions)
Proceeds from securitizations . . . . . . . . . . . . . . . . . . . . . . . . . . . . . . . . . . . . . . . . . . . . . . . . . $361 $394
Servicing fees received . . . . . . . . . . . . . . . . . . . . . . . . . . . . . . . . . . . . . . . . . . . . . . . . . . . . . . 28 26
Cash flows received on retained interests . . . . . . . . . . . . . . . . . . . . . . . . . . . . . . . . . . . . . . . . . 64 70
Cash paid for loan repurchases . . . . . . . . . . . . . . . . . . . . . . . . . . . . . . . . . . . . . . . . . . . . . . . . 26 20
45

NOTE 8 Equipment on Operating Leases
2005 2004(In millions)
Equipment on operating leases, at cost:
Aircraft. . . . . . . . . . . . . . . . . . . . . . . . . . . . . . . . . . . . . . . . . . . . . . . . . . . . . . . . . . . . . . . . $250 $224
Golf cars . . . . . . . . . . . . . . . . . . . . . . . . . . . . . . . . . . . . . . . . . . . . . . . . . . . . . . . . . . . . . . 27 36
Other . . . . . . . . . . . . . . . . . . . . . . . . . . . . . . . . . . . . . . . . . . . . . . . . . . . . . . . . . . . . . . . . . — 14
Accumulated depreciation:
Aircraft. . . . . . . . . . . . . . . . . . . . . . . . . . . . . . . . . . . . . . . . . . . . . . . . . . . . . . . . . . . . . . . . (40) (29)
Golf cars . . . . . . . . . . . . . . . . . . . . . . . . . . . . . . . . . . . . . . . . . . . . . . . . . . . . . . . . . . . . . . (6) (7)
Other . . . . . . . . . . . . . . . . . . . . . . . . . . . . . . . . . . . . . . . . . . . . . . . . . . . . . . . . . . . . . . . . . — (1)
Equipment on operating leases — net . . . . . . . . . . . . . . . . . . . . . . . . . . . . . . . . . . . . . . . . . . . $231 $237
Initial lease terms of equipment on operating leases range from one year to ten years. Future minimum rentalsat December 31, 2005 are $24 million in 2006, $19 million in 2007, $14 million in 2008, $12 million in 2009,$12 million in 2010 and $28 million thereafter.
NOTE 9 Goodwill
Goodwill totaled $110 million in the Resort Finance segment, $43 million in the Asset-Based Lendingsegment and $16 million in the Aircraft Finance segment at both December 31, 2005 and January 1, 2005.
NOTE 10 Other Assets
2005 2004(In millions)
Retained interests in securitizations . . . . . . . . . . . . . . . . . . . . . . . . . . . . . . . . . . . . . . . . . . . . . $208 $233
Other long-term investments . . . . . . . . . . . . . . . . . . . . . . . . . . . . . . . . . . . . . . . . . . . . . . . . . . 53 64
Fixed assets — net . . . . . . . . . . . . . . . . . . . . . . . . . . . . . . . . . . . . . . . . . . . . . . . . . . . . . . . . . 33 41
Repossessed assets and properties . . . . . . . . . . . . . . . . . . . . . . . . . . . . . . . . . . . . . . . . . . . . . . 22 21
Investment in equipment residuals . . . . . . . . . . . . . . . . . . . . . . . . . . . . . . . . . . . . . . . . . . . . . . 10 13
Other . . . . . . . . . . . . . . . . . . . . . . . . . . . . . . . . . . . . . . . . . . . . . . . . . . . . . . . . . . . . . . . . . . . 38 95
Total other assets . . . . . . . . . . . . . . . . . . . . . . . . . . . . . . . . . . . . . . . . . . . . . . . . . . . . . . . . $364 $467
Textron Financial reviews all Other assets for potential impairment on a periodic basis. As a result of thesereviews, the Company recorded impairment charges in other income of $1 million and $5 million on Retainedinterests in securitizations in 2005 and 2004, respectively, and $4 million and $13 million on Other long-terminvestments in 2005 and 2004, respectively.
The cost of fixed assets is being depreciated using the straight-line method based on the estimated useful livesof the assets.
The Investment in equipment residuals represents the remaining equipment residual values associatedprincipally with Textron golf and turf equipment lease payments that were securitized. In December 2004, theCompany legally transferred ownership in $60 million of golf equipment residuals for $71 million in cash proceeds.The proceeds received, net of the carrying value of the assets transferred, are classified in Accrued interest and otherliabilities. The purchaser is entitled to the cash flows from the eventual disposition of the equipment residuals and acontingent recourse obligation of up to 10% of the purchase price maintained by Textron Financial.
Interest-only securities within retained interest in securitizations were $66 million and $62 million atDecember 31, 2005 and January 1, 2005, respectively.
The Other category primarily represents the fair value of derivative instruments and debt acquisition costs.
46
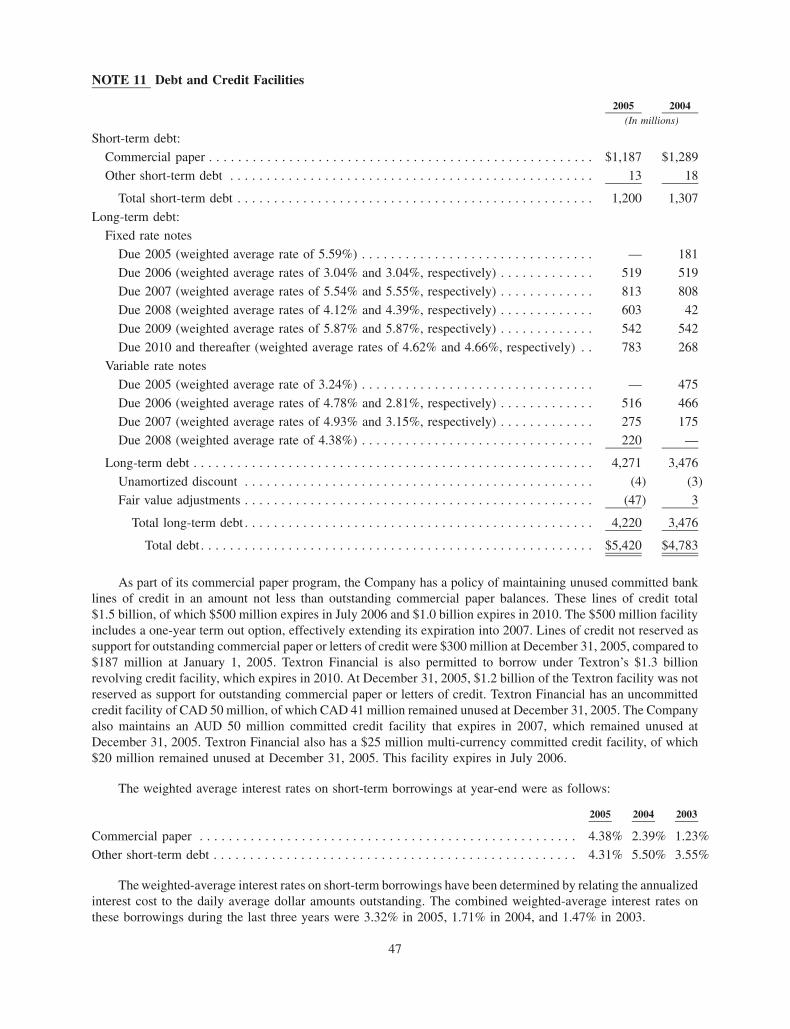
NOTE 11 Debt and Credit Facilities
2005 2004(In millions)
Short-term debt:
Commercial paper . . . . . . . . . . . . . . . . . . . . . . . . . . . . . . . . . . . . . . . . . . . . . . . . . . . . . $1,187 $1,289
Other short-term debt . . . . . . . . . . . . . . . . . . . . . . . . . . . . . . . . . . . . . . . . . . . . . . . . . . 13 18
Total short-term debt . . . . . . . . . . . . . . . . . . . . . . . . . . . . . . . . . . . . . . . . . . . . . . . . . 1,200 1,307
Long-term debt:
Fixed rate notes
Due 2005 (weighted average rate of 5.59%) . . . . . . . . . . . . . . . . . . . . . . . . . . . . . . . . — 181
Due 2006 (weighted average rates of 3.04% and 3.04%, respectively) . . . . . . . . . . . . . 519 519
Due 2007 (weighted average rates of 5.54% and 5.55%, respectively) . . . . . . . . . . . . . 813 808
Due 2008 (weighted average rates of 4.12% and 4.39%, respectively) . . . . . . . . . . . . . 603 42
Due 2009 (weighted average rates of 5.87% and 5.87%, respectively) . . . . . . . . . . . . . 542 542
Due 2010 and thereafter (weighted average rates of 4.62% and 4.66%, respectively) . . 783 268
Variable rate notes
Due 2005 (weighted average rate of 3.24%) . . . . . . . . . . . . . . . . . . . . . . . . . . . . . . . . — 475
Due 2006 (weighted average rates of 4.78% and 2.81%, respectively) . . . . . . . . . . . . . 516 466
Due 2007 (weighted average rates of 4.93% and 3.15%, respectively) . . . . . . . . . . . . . 275 175Due 2008 (weighted average rate of 4.38%) . . . . . . . . . . . . . . . . . . . . . . . . . . . . . . . . 220 —
Long-term debt . . . . . . . . . . . . . . . . . . . . . . . . . . . . . . . . . . . . . . . . . . . . . . . . . . . . . . . 4,271 3,476
Unamortized discount . . . . . . . . . . . . . . . . . . . . . . . . . . . . . . . . . . . . . . . . . . . . . . . . (4) (3)
Fair value adjustments . . . . . . . . . . . . . . . . . . . . . . . . . . . . . . . . . . . . . . . . . . . . . . . . (47) 3
Total long-term debt . . . . . . . . . . . . . . . . . . . . . . . . . . . . . . . . . . . . . . . . . . . . . . . . 4,220 3,476
Total debt . . . . . . . . . . . . . . . . . . . . . . . . . . . . . . . . . . . . . . . . . . . . . . . . . . . . . . $5,420 $4,783
As part of its commercial paper program, the Company has a policy of maintaining unused committed banklines of credit in an amount not less than outstanding commercial paper balances. These lines of credit total$1.5 billion, of which $500 million expires in July 2006 and $1.0 billion expires in 2010. The $500 million facilityincludes a one-year term out option, effectively extending its expiration into 2007. Lines of credit not reserved assupport for outstanding commercial paper or letters of credit were $300 million at December 31, 2005, compared to$187 million at January 1, 2005. Textron Financial is also permitted to borrow under Textron’s $1.3 billionrevolving credit facility, which expires in 2010. At December 31, 2005, $1.2 billion of the Textron facility was notreserved as support for outstanding commercial paper or letters of credit. Textron Financial has an uncommittedcredit facility of CAD 50 million, of which CAD 41 million remained unused at December 31, 2005. The Companyalso maintains an AUD 50 million committed credit facility that expires in 2007, which remained unused atDecember 31, 2005. Textron Financial also has a $25 million multi-currency committed credit facility, of which$20 million remained unused at December 31, 2005. This facility expires in July 2006.
The weighted average interest rates on short-term borrowings at year-end were as follows:
2005 2004 2003
Commercial paper . . . . . . . . . . . . . . . . . . . . . . . . . . . . . . . . . . . . . . . . . . . . . . . . . . . . 4.38% 2.39% 1.23%
Other short-term debt . . . . . . . . . . . . . . . . . . . . . . . . . . . . . . . . . . . . . . . . . . . . . . . . . . 4.31% 5.50% 3.55%
The weighted-average interest rates on short-term borrowings have been determined by relating the annualizedinterest cost to the daily average dollar amounts outstanding. The combined weighted-average interest rates onthese borrowings during the last three years were 3.32% in 2005, 1.71% in 2004, and 1.47% in 2003.
47
The Company had interest rate exchange agreements related to the conversion of fixed rate debt to variable ratedebt of $3.1 billion and $2.2 billion at December 31, 2005 and January 1, 2005, respectively, whereby the Companymakes periodic floating rate payments in exchange for periodic fixed rate receipts. The weighted-average rate ofthese interest rate exchange agreements was 3.99% and 2.79% at December 31, 2005 and January 1, 2005,respectively.
Interest on Textron Financial’s variable rate notes is predominantly tied to the three-month LIBOR forU.S. dollar deposits. The weighted-average interest rate on these notes before consideration of the effect of interestrate exchange agreements, during the last three years were 4.06% in 2005, 2.61% in 2004, and 2.47% in 2003. Inaddition, Textron Financial had $200 million of interest rate exchange agreements at both December 31, 2005 andJanuary 1, 2005, related to the conversion of variable rate debt to fixed rate debt with a weighted-average fixedinterest rate of 3.42%.
Securitizations are an important source of liquidity for Textron Financial and involve the periodic transfer offinance receivables to qualified special purpose trusts. The amount of debt issued by these qualified special purposetrusts was $2.0 billion and $1.9 billion at December 31, 2005 and January 1, 2005, respectively.
Through its subsidiary, Textron Financial Canada Funding Corp. (Textron Canada Funding), the Companyperiodically issues debt securities. Textron Financial owns 100% of the common stock of Textron Canada Funding.Textron Canada Funding is a financing subsidiary of Textron Financial with no operations, revenues or cash flowsother than those related to the issuance, administration and repayment of debt securities that are fully andunconditionally guaranteed by Textron Financial.
The amount of net assets available for dividends and other payments to Textron is restricted by the terms of theCompany’s lending agreements. At December 31, 2005, $384 million of net assets were available to be transferredto Textron under the most restrictive covenant. The lending agreements contain various restrictive provisionsregarding additional debt (not to exceed 800% of consolidated net worth and qualifying subordinated obligations),minimum net worth ($200 million), the creation of liens and the maintenance of a fixed charges coverage ratio (noless than 125%).
Cash payments made by Textron Financial for interest were $204 million in 2005, $157 million in 2004 and$182 million in 2003.
NOTE 12 Derivative Financial Instruments
Textron Financial utilizes derivative instruments to mitigate its exposure to fluctuations in interest rates andforeign currencies. These instruments include interest rate exchange agreements, foreign currency exchangeagreements and interest rate cap and floor agreements. The Company does not hold or issue derivative financialinstruments for trading or speculative purposes. The Company did not experience a significant net gain or loss inearnings as a result of the ineffectiveness, or the exclusion of any component from its assessment of hedgeeffectiveness, of its derivative financial instruments in 2005 and 2004.
In order to mitigate exposure to changes in the fair value of its fixed rate portfolios of receivables and debt dueto fluctuations in interest rates, the Company enters into interest rate exchange agreements, which convert its fixedrate cash flows to floating rate cash flows. The Company has designated these instruments as fair value hedges.Changes in the fair value of these instruments are recorded in Finance charges and discounts and Interest expenserelated to hedges of receivables and debt, respectively, and the corresponding offsetting changes in value in thehedged receivables and debt are also recorded in Finance charges and discounts and Interest expense. AtDecember 31, 2005, the Company had interest rate exchange agreements with a fair value liability of $43.0 milliondesignated as fair value hedges, compared to a fair value asset of $10.8 million at January 1, 2005.
During 2004, the Company entered into interest rate exchange agreements to convert variable rate debt to fixedrate debt to mitigate its risk to variability in the cash flows attributable to certain future interest payments. TheCompany has designated these instruments as cash flow hedges. Changes in the fair value of these instruments arerecorded net of the tax effect in Other comprehensive income. At December 31, 2005, the Company had interest rateexchange agreements with a fair value of $3.6 million, compared to a fair value of $1.3 million at January 1, 2005.
48
The Company expects $2.1 million of net of tax deferred gains to be reclassified to earnings related to these hedgerelationships in 2006.
Textron Financial has also entered into interest rate exchange, cap and floor agreements to mitigate itsexposure to variability in the cash flows received from its investments in interest-only securities resulting fromsecuritizations, which are caused by fluctuations in interest rates. The combination of these instruments convert netresidual floating rate cash flows expected to be received by the Company as a result of the securitization trust’sassets, liabilities and derivative instruments to fixed rate cash flows and are designated as cash flow hedges.Changes in the fair value of these instruments are recorded net of the tax effect in Other comprehensive income. AtDecember 31, 2005, these instruments had a fair value liability of $5.2 million, compared to a fair value liability of$7.8 million at January 1, 2005. The Company expects approximately $0.2 million of net of tax deferred gains to bereclassified to earnings related to these hedge relationships in 2006.
At December 31, 2005, the Company had $4.3 million of net of tax deferred losses recorded in Othercomprehensive income related to terminated forward starting interest rate exchange agreements. These agreementswere executed to hedge the exposure to the variability in cash flows from anticipated future issuances of fixed ratedebt and were terminated upon issuance of the debt. The Company is amortizing the deferred losses into Interestexpense over the remaining life of the hedged debt of 26 months and expects approximately $1.9 million of netdeferred losses to be reclassified to earnings in 2006.
The Company also utilizes foreign currency interest rate exchange agreements to hedge its exposure, in aCanadian dollar functional currency subsidiary, to changes in the fair value of $60 million U.S. dollar denominatedfixed rate debt as a result of changes in both foreign currency exchange rates and Canadian Banker’s Acceptancerates. The Company has designated these agreements as fair value hedges and records changes in the fair value ofthese instruments, as well as the corresponding changes in the fair value of the debt being hedged in Interestexpense. At December 31, 2005, these instruments had a fair value liability of $9.4 million, compared to a fair valueliability of $6.4 million at January 1, 2005.
In relation to one of the Company’s asset-backed securitizations, Textron Financial enters into back-to-backinterest rate exchange agreements with both third-party financial institutions and commercial customers of theResort Finance Segment. These instruments are designed to have an equal and offsetting impact to the Companyand transfer the risk of differences between actual and scheduled cash flows related to the receivables sold from thefinancial institution to the commercial customers who originated the loan contracts sold. Since these instruments areutilized by Textron Financial to facilitate the securitization transaction rather than mitigate interest rate risk to theCompany, they are not designated in hedging relationships. These instruments had no significant impact to theCompany’s earnings in 2005, as gains and losses on these back-to-back interest rate exchange agreements offset.
NOTE 13 Junior Subordinated Debentures
On June 30, 2004, Textron Financial Corporation redeemed all of the $26 million Litchfield 10% Series AJunior Subordinated Debentures, due 2029. The debentures were held by a trust sponsored and wholly-owned byLitchfield Financial Corporation, a subsidiary of Textron Financial Corporation. The proceeds from the redemptionwere used to redeem all of the $26 million Litchfield Capital Trust I 10% Series ATrust Preferred Securities at parvalue of $10 per share. There was no gain or loss on the redemption.
NOTE 14 Investment in Parent Company Preferred Stock
On April 12, 2000, Textron made a $25 million noncash capital contribution to Textron Financial consisting ofall of the outstanding shares of Textron Funding Corporation (Textron Funding), a related corporate holdingcompany. Textron Funding’s only asset is 1,522 shares of Textron Inc. Series D cumulative preferred stock, bearingan annual dividend yield of 5.92%. The preferred stock, which has a face value of $152 million, is carried at itsoriginal cost of $25 million and is presented in a manner similar to treasury stock for financial reporting purposes.Dividends on the preferred stock are treated as additional capital contributions from Textron.
49

NOTE 15 Accumulated Other Comprehensive Income (Loss)
Accumulated other comprehensive income (loss) is summarized as follows:
ForeignCurrency
TranslationAdjustment
DeferredGains
(Losses) onHedge
Contracts
DeferredGains
(Losses) onSecurities Total
(In millions)
Balance December 28, 2002 . . . . . . . . . . . . . . . . . . . . . . . . . . $ (4) $(21) $10 $(15)
Foreign currency translation. . . . . . . . . . . . . . . . . . . . . . . . . . 2 — — 2
Amortization of deferred loss on terminated hedge contracts,net of income taxes of $2 million . . . . . . . . . . . . . . . . . . . . — 3 — 3
Net deferred gain on hedge contracts, net of income taxes of$7 million . . . . . . . . . . . . . . . . . . . . . . . . . . . . . . . . . . . . . — 12 — 12
Net deferred loss on interest-only securities, net of incometax benefit of $2 million . . . . . . . . . . . . . . . . . . . . . . . . . . — — (4) (4)
Balance January 3, 2004 . . . . . . . . . . . . . . . . . . . . . . . . . . . . . (2) (6) 6 (2)
Foreign currency translation. . . . . . . . . . . . . . . . . . . . . . . . . . 10 — — 10
Amortization of deferred loss on terminated hedge contracts,net of income taxes of $2 million . . . . . . . . . . . . . . . . . . . . — 4 — 4
Net deferred loss on hedge contracts, net of income taxbenefit of $4 million . . . . . . . . . . . . . . . . . . . . . . . . . . . . . — (7) — (7)
Net deferred loss on interest-only securities, net of incometax benefit of $3 million . . . . . . . . . . . . . . . . . . . . . . . . . . — — (4) (4)
Balance January 1, 2005 . . . . . . . . . . . . . . . . . . . . . . . . . . . . . 8 (9) 2 1
Foreign currency translation. . . . . . . . . . . . . . . . . . . . . . . . . . (1) — — (1)
Amortization of deferred loss on terminated hedge contracts,net of income taxes of $3 million . . . . . . . . . . . . . . . . . . . . — 5 — 5
Net deferred loss on hedge contracts, net of income taxbenefit of $2 million . . . . . . . . . . . . . . . . . . . . . . . . . . . . . — (5) — (5)
Net deferred gain on interest-only securities, net of incometaxes of $2 million . . . . . . . . . . . . . . . . . . . . . . . . . . . . . . — — 5 5
Balance December 31, 2005 . . . . . . . . . . . . . . . . . . . . . . . . . . $ 7 $ (9) $ 7 $ 5
NOTE 16 Income Taxes
Income from continuing operations before income taxes and distributions on preferred securities:
2005 2004 2003(In millions)
United States . . . . . . . . . . . . . . . . . . . . . . . . . . . . . . . . . . . . . . . . . . . . . . . . . . . . . . . $168 $134 $110
Foreign . . . . . . . . . . . . . . . . . . . . . . . . . . . . . . . . . . . . . . . . . . . . . . . . . . . . . . . . . . . 3 5 7
Total . . . . . . . . . . . . . . . . . . . . . . . . . . . . . . . . . . . . . . . . . . . . . . . . . . . . . . . . . . . $171 $139 $117
50
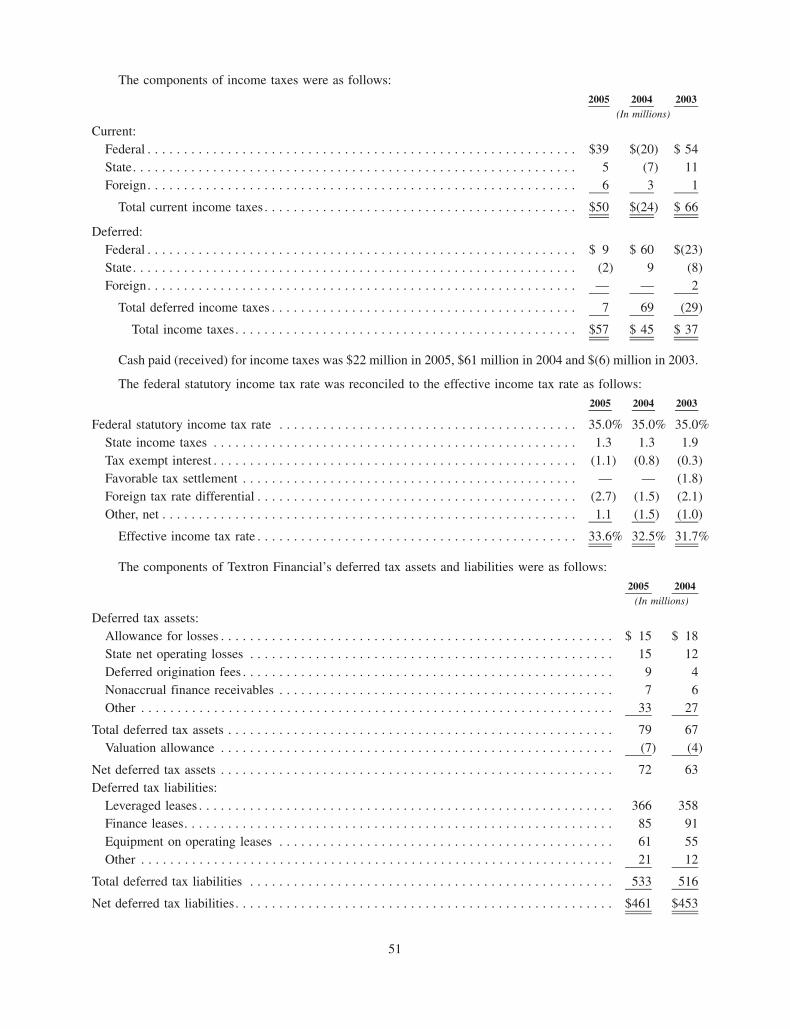
The components of income taxes were as follows:
2005 2004 2003(In millions)
Current:Federal . . . . . . . . . . . . . . . . . . . . . . . . . . . . . . . . . . . . . . . . . . . . . . . . . . . . . . . . . . . $39 $(20) $ 54State. . . . . . . . . . . . . . . . . . . . . . . . . . . . . . . . . . . . . . . . . . . . . . . . . . . . . . . . . . . . . 5 (7) 11Foreign. . . . . . . . . . . . . . . . . . . . . . . . . . . . . . . . . . . . . . . . . . . . . . . . . . . . . . . . . . . 6 3 1
Total current income taxes . . . . . . . . . . . . . . . . . . . . . . . . . . . . . . . . . . . . . . . . . . . $50 $(24) $ 66
Deferred:Federal . . . . . . . . . . . . . . . . . . . . . . . . . . . . . . . . . . . . . . . . . . . . . . . . . . . . . . . . . . . $ 9 $ 60 $(23)State. . . . . . . . . . . . . . . . . . . . . . . . . . . . . . . . . . . . . . . . . . . . . . . . . . . . . . . . . . . . . (2) 9 (8)Foreign. . . . . . . . . . . . . . . . . . . . . . . . . . . . . . . . . . . . . . . . . . . . . . . . . . . . . . . . . . . — — 2
Total deferred income taxes . . . . . . . . . . . . . . . . . . . . . . . . . . . . . . . . . . . . . . . . . . 7 69 (29)
Total income taxes. . . . . . . . . . . . . . . . . . . . . . . . . . . . . . . . . . . . . . . . . . . . . . . $57 $ 45 $ 37
Cash paid (received) for income taxes was $22 million in 2005, $61 million in 2004 and $(6) million in 2003.
The federal statutory income tax rate was reconciled to the effective income tax rate as follows:
2005 2004 2003
Federal statutory income tax rate . . . . . . . . . . . . . . . . . . . . . . . . . . . . . . . . . . . . . . . . . 35.0% 35.0% 35.0%State income taxes . . . . . . . . . . . . . . . . . . . . . . . . . . . . . . . . . . . . . . . . . . . . . . . . . . 1.3 1.3 1.9Tax exempt interest . . . . . . . . . . . . . . . . . . . . . . . . . . . . . . . . . . . . . . . . . . . . . . . . . . (1.1) (0.8) (0.3)Favorable tax settlement . . . . . . . . . . . . . . . . . . . . . . . . . . . . . . . . . . . . . . . . . . . . . . — — (1.8)Foreign tax rate differential . . . . . . . . . . . . . . . . . . . . . . . . . . . . . . . . . . . . . . . . . . . . (2.7) (1.5) (2.1)Other, net . . . . . . . . . . . . . . . . . . . . . . . . . . . . . . . . . . . . . . . . . . . . . . . . . . . . . . . . . 1.1 (1.5) (1.0)
Effective income tax rate . . . . . . . . . . . . . . . . . . . . . . . . . . . . . . . . . . . . . . . . . . . . 33.6% 32.5% 31.7%
The components of Textron Financial’s deferred tax assets and liabilities were as follows:
2005 2004(In millions)
Deferred tax assets:Allowance for losses . . . . . . . . . . . . . . . . . . . . . . . . . . . . . . . . . . . . . . . . . . . . . . . . . . . . . . $ 15 $ 18State net operating losses . . . . . . . . . . . . . . . . . . . . . . . . . . . . . . . . . . . . . . . . . . . . . . . . . . 15 12Deferred origination fees . . . . . . . . . . . . . . . . . . . . . . . . . . . . . . . . . . . . . . . . . . . . . . . . . . . 9 4Nonaccrual finance receivables . . . . . . . . . . . . . . . . . . . . . . . . . . . . . . . . . . . . . . . . . . . . . . 7 6Other . . . . . . . . . . . . . . . . . . . . . . . . . . . . . . . . . . . . . . . . . . . . . . . . . . . . . . . . . . . . . . . . . 33 27
Total deferred tax assets . . . . . . . . . . . . . . . . . . . . . . . . . . . . . . . . . . . . . . . . . . . . . . . . . . . . . 79 67Valuation allowance . . . . . . . . . . . . . . . . . . . . . . . . . . . . . . . . . . . . . . . . . . . . . . . . . . . . . . (7) (4)
Net deferred tax assets . . . . . . . . . . . . . . . . . . . . . . . . . . . . . . . . . . . . . . . . . . . . . . . . . . . . . . 72 63Deferred tax liabilities:
Leveraged leases . . . . . . . . . . . . . . . . . . . . . . . . . . . . . . . . . . . . . . . . . . . . . . . . . . . . . . . . . 366 358Finance leases. . . . . . . . . . . . . . . . . . . . . . . . . . . . . . . . . . . . . . . . . . . . . . . . . . . . . . . . . . . 85 91Equipment on operating leases . . . . . . . . . . . . . . . . . . . . . . . . . . . . . . . . . . . . . . . . . . . . . . 61 55Other . . . . . . . . . . . . . . . . . . . . . . . . . . . . . . . . . . . . . . . . . . . . . . . . . . . . . . . . . . . . . . . . . 21 12
Total deferred tax liabilities . . . . . . . . . . . . . . . . . . . . . . . . . . . . . . . . . . . . . . . . . . . . . . . . . . 533 516
Net deferred tax liabilities. . . . . . . . . . . . . . . . . . . . . . . . . . . . . . . . . . . . . . . . . . . . . . . . . . . . $461 $453
51
At December 31, 2005, Textron Financial had state net operating loss carryforwards of approximately$536 million available to offset future state taxable income. The state net operating loss carryforwards will expire inyears 2006 through 2025. The valuation allowance reported above represents the tax effect of certain state netoperating loss carryforwards. Textron Financial is unable to conclude that “more likely than not” it will realize thebenefit from such carryforwards.
Deferred income taxes have not been provided for the undistributed earnings of foreign subsidiaries, whichapproximated $82 million at the end of 2005, as management intends to reinvest those earnings for an indefiniteperiod. If foreign subsidiaries’ earnings were distributed, 2005 taxes, net of foreign tax credits, would be increasedby approximately $29 million.
NOTE 17 Fair Value of Financial Instruments
The following methods and assumptions were used in estimating the fair value of Textron Financial’s financialinstruments:
Finance Receivables
The estimated fair values of fixed rate installment contracts, revolving loans, golf course and resort mortgagesand distribution finance receivables were estimated based on discounted cash flow analyses using interest ratescurrently being offered for similar loans to borrowers of similar credit quality. The estimated fair values of allvariable rate receivables approximated the net carrying value of such receivables. The estimated fair values ofindividually large balance nonperforming loans were based on discounted cash flow analyses using risk adjustedinterest rates or Textron Financial valuations based on the fair value of the related collateral. Included in theportfolios are the allowance for losses on finance receivables, which represents the credit risk adjustment required toreflect the loan portfolios’ carrying value. The fair values, net of carrying amounts of Textron Financial’s leveragedleases, finance leases and operating leases ($569 million, $513 million and $231 million, respectively, atDecember 31, 2005, and $539 million, $410 million and $237 million, respectively, at January 1, 2005), arespecifically excluded from this disclosure under generally accepted accounting principles. As a result, a significantportion of the assets which are included in the Company’s asset and liability management strategy are excludedfrom this fair value disclosure.
Debt, Interest Rate Exchange Agreements, Foreign Currency Forward Exchange Contracts and ForeignCurrency Exchange Agreements
The estimated fair value of fixed rate debt and variable rate long-term notes was determined by eitherindependent investment bankers or discounted cash flow analyses using interest rates for similar debt withmaturities similar to the remaining terms of the existing debt. The fair values of short-term borrowing supported bycredit facilities approximated their carrying values. The estimated fair values of interest rate exchange agreements,foreign currency forward exchange contracts and foreign currency exchange agreements, were determined byindependent investment bankers and represent the estimated amounts that Textron Financial would be required topay to (or collect from) a third-party to assume Textron Financial’s obligations under the agreements.
52
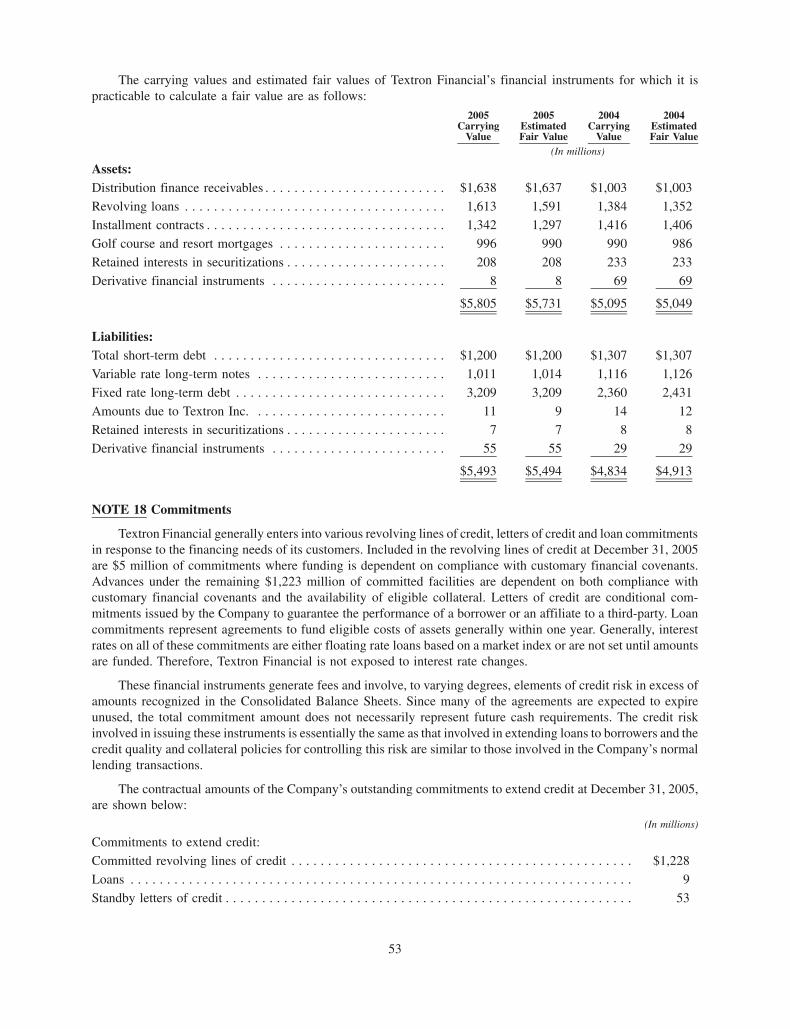
The carrying values and estimated fair values of Textron Financial’s financial instruments for which it ispracticable to calculate a fair value are as follows:
2005Carrying
Value
2005EstimatedFair Value
2004Carrying
Value
2004EstimatedFair Value
(In millions)
Assets:Distribution finance receivables . . . . . . . . . . . . . . . . . . . . . . . . . $1,638 $1,637 $1,003 $1,003
Revolving loans . . . . . . . . . . . . . . . . . . . . . . . . . . . . . . . . . . . . 1,613 1,591 1,384 1,352
Installment contracts . . . . . . . . . . . . . . . . . . . . . . . . . . . . . . . . . 1,342 1,297 1,416 1,406
Golf course and resort mortgages . . . . . . . . . . . . . . . . . . . . . . . 996 990 990 986
Retained interests in securitizations . . . . . . . . . . . . . . . . . . . . . . 208 208 233 233
Derivative financial instruments . . . . . . . . . . . . . . . . . . . . . . . . 8 8 69 69
$5,805 $5,731 $5,095 $5,049
Liabilities:Total short-term debt . . . . . . . . . . . . . . . . . . . . . . . . . . . . . . . . $1,200 $1,200 $1,307 $1,307
Variable rate long-term notes . . . . . . . . . . . . . . . . . . . . . . . . . . 1,011 1,014 1,116 1,126
Fixed rate long-term debt . . . . . . . . . . . . . . . . . . . . . . . . . . . . . 3,209 3,209 2,360 2,431
Amounts due to Textron Inc. . . . . . . . . . . . . . . . . . . . . . . . . . . 11 9 14 12
Retained interests in securitizations . . . . . . . . . . . . . . . . . . . . . . 7 7 8 8
Derivative financial instruments . . . . . . . . . . . . . . . . . . . . . . . . 55 55 29 29
$5,493 $5,494 $4,834 $4,913
NOTE 18 Commitments
Textron Financial generally enters into various revolving lines of credit, letters of credit and loan commitmentsin response to the financing needs of its customers. Included in the revolving lines of credit at December 31, 2005are $5 million of commitments where funding is dependent on compliance with customary financial covenants.Advances under the remaining $1,223 million of committed facilities are dependent on both compliance withcustomary financial covenants and the availability of eligible collateral. Letters of credit are conditional com-mitments issued by the Company to guarantee the performance of a borrower or an affiliate to a third-party. Loancommitments represent agreements to fund eligible costs of assets generally within one year. Generally, interestrates on all of these commitments are either floating rate loans based on a market index or are not set until amountsare funded. Therefore, Textron Financial is not exposed to interest rate changes.
These financial instruments generate fees and involve, to varying degrees, elements of credit risk in excess ofamounts recognized in the Consolidated Balance Sheets. Since many of the agreements are expected to expireunused, the total commitment amount does not necessarily represent future cash requirements. The credit riskinvolved in issuing these instruments is essentially the same as that involved in extending loans to borrowers and thecredit quality and collateral policies for controlling this risk are similar to those involved in the Company’s normallending transactions.
The contractual amounts of the Company’s outstanding commitments to extend credit at December 31, 2005,are shown below:
(In millions)
Commitments to extend credit:
Committed revolving lines of credit . . . . . . . . . . . . . . . . . . . . . . . . . . . . . . . . . . . . . . . . . . . . . . . $1,228
Loans . . . . . . . . . . . . . . . . . . . . . . . . . . . . . . . . . . . . . . . . . . . . . . . . . . . . . . . . . . . . . . . . . . . . . 9
Standby letters of credit . . . . . . . . . . . . . . . . . . . . . . . . . . . . . . . . . . . . . . . . . . . . . . . . . . . . . . . . 53
53

Textron Financial’s offices are occupied under noncancelable operating leases expiring on various datesthrough 2012. Rental expense was $7 million in 2005, $7 million in 2004 and $7 million in 2003. Future minimumrental commitments for all noncancelable operating leases in effect at December 31, 2005 approximated $6 millionfor 2006, $5 million for 2007, $5 million for 2008, $3 million for 2009, $1 million for 2010 and $1 millionthereafter. Of these amounts, $1 million is payable to Textron in each of the years 2006 through 2008.
NOTE 19 Contingencies
On February 3, 2004, in the Court of Common Pleas for Knox County, Ohio, a purported class action lawsuitwas commenced against the Company and Litchfield, certain of their current and former officers, and other third-parties, related to the financing of certain land purchases by consumers through a third-party land developercommonly known as “Buyer’s Source.” Among other claims, the purported class action alleges fraud and failure todisclose certain information in the financing of Buyer’s Source and seeks compensatory damages and punitivedamages in excess of $10 million. The Company intends to aggressively defend this claim. The Company believesthat the purported class action will not have a material effect on the Company’s financial position and results ofoperations.
Textron Financial is subject to challenges from tax authorities regarding amounts of tax due. These challengesmay alter the timing or amount of taxable income or deductions, or the allocation of income among tax jurisdictions.Textron Financial is currently under examination by the Internal Revenue Service (IRS) for the years 1998 through2003. The IRS has issued Notices of Proposed Adjustment that may affect certain leveraged lease transactions witha total initial investment of approximately $94 million related to the 1998 through 2001 tax years. Resolution ofthese issues may result in an adjustment to the timing of taxable income and deductions that reduce the effectiveyield of the leveraged lease transactions and could result in a pre-tax adjustment to income. Management believesthat the proposed IRS adjustments are inconsistent with existing tax law and intends to vigorously defend theCompany’s position. The resolution of these issues and the impact on the Company’s financial position and resultsof operations cannot be reasonably estimated at this time.
There are other pending or threatened lawsuits and other proceedings against Textron Financial and itssubsidiaries. Some of these suits and proceedings seek compensatory, treble or punitive damages in substantialamounts. These suits and proceedings are being defended by, or contested on behalf of, Textron Financial and itssubsidiaries. On the basis of information presently available, Textron Financial believes any such liability would nothave a material effect on Textron Financial’s financial position or results of operations.
NOTE 20 Financial Information About Operating Segments
The Company aligns its business units into six operating segments based on the markets serviced and theproducts offered: Aircraft Finance, Asset-Based Lending, Distribution Finance, Golf Finance, Resort Finance andStructured Capital. In addition, the Company maintains an Other segment (non-core) that includes franchisefinance, media finance, syndicated bank loans and liquidating portfolios related to a strategic realignment of theCompany’s business and product lines into core and non-core businesses.
2005 2004 2003(Dollars in millions)
Revenues:
Distribution Finance . . . . . . . . . . . . . . . . . . . . . . . . . . . $ 178 28% $ 159 29% $ 151 26%
Aircraft Finance . . . . . . . . . . . . . . . . . . . . . . . . . . . . . . 107 17% 79 14% 81 14%
Golf Finance . . . . . . . . . . . . . . . . . . . . . . . . . . . . . . . . . 102 16% 80 15% 81 15%
Resort Finance . . . . . . . . . . . . . . . . . . . . . . . . . . . . . . . 91 15% 85 16% 87 15%
Asset-Based Lending . . . . . . . . . . . . . . . . . . . . . . . . . . . 75 12% 56 10% 59 10%
Structured Capital . . . . . . . . . . . . . . . . . . . . . . . . . . . . . 54 9% 52 10% 35 6%
Other . . . . . . . . . . . . . . . . . . . . . . . . . . . . . . . . . . . . . . 21 3% 34 6% 78 14%
Total revenues . . . . . . . . . . . . . . . . . . . . . . . . . . . . . . . . . $ 628 100% $ 545 100% $ 572 100%
54

2005 2004 2003(Dollars in millions)
Income (loss) before special charges, income taxes,distributions on preferred securities:(1) (2)
Distribution Finance . . . . . . . . . . . . . . . . . . . . . . . . . . . $ 70 $ 73 $ 58
Aircraft Finance . . . . . . . . . . . . . . . . . . . . . . . . . . . . . . 32 24 10
Golf Finance . . . . . . . . . . . . . . . . . . . . . . . . . . . . . . . . . 25 16 28
Resort Finance . . . . . . . . . . . . . . . . . . . . . . . . . . . . . . . 18 2 26
Asset-Based Lending . . . . . . . . . . . . . . . . . . . . . . . . . . . 25 17 20
Structured Capital . . . . . . . . . . . . . . . . . . . . . . . . . . . . . 34 30 12
Other . . . . . . . . . . . . . . . . . . . . . . . . . . . . . . . . . . . . . . (33) (23) (31)
Income from continuing operations before specialcharges, income taxes and distributions on preferredsecurities . . . . . . . . . . . . . . . . . . . . . . . . . . . . . . . . . . . $ 171 $ 139 $ 123
Special charges . . . . . . . . . . . . . . . . . . . . . . . . . . . . . . . . . — — (6)
Income from continuing operations before income taxesand distributions on preferred securities . . . . . . . . . . . $ 171 $ 139 $ 117
Finance assets:(3)
Distribution Finance . . . . . . . . . . . . . . . . . . . . . . . . . . . $1,710 $1,084 $ 825
Golf Finance . . . . . . . . . . . . . . . . . . . . . . . . . . . . . . . . . 1,344 1,100 886
Aircraft Finance . . . . . . . . . . . . . . . . . . . . . . . . . . . . . . 1,278 1,217 1,160
Resort Finance . . . . . . . . . . . . . . . . . . . . . . . . . . . . . . . 1,155 1,196 1,070
Asset-Based Lending . . . . . . . . . . . . . . . . . . . . . . . . . . . 764 584 468
Structured Capital . . . . . . . . . . . . . . . . . . . . . . . . . . . . . 704 774 634
Other . . . . . . . . . . . . . . . . . . . . . . . . . . . . . . . . . . . . . . 332 450 748
Total finance assets . . . . . . . . . . . . . . . . . . . . . . . . . . . . . $7,287 $6,405 $5,791
(1) Interest expense is allocated to each segment in proportion to its net investment in finance assets. Netinvestment in finance assets includes deferred income taxes, security deposits and other specifically identifiedliabilities. The interest allocated matches, to the extent possible, variable rate debt with variable rate financeassets and fixed rate debt with fixed rate finance assets.
(2) Indirect expenses are allocated to each segment based on the use of such resources. Most allocations are basedon the segment’s proportion of net investment in finance assets, headcount, number of transactions, computerresources and senior management time.
(3) Finance assets include: finance receivables; equipment on operating leases, net of accumulated depreciation;repossessed assets and properties; retained interests in securitizations; investment in equipment residuals;Acquisition, Development and Construction arrangements; and other short- and long-term investments (someof which are classified in Other assets on Textron Financial’s Consolidated Balance Sheets).
55
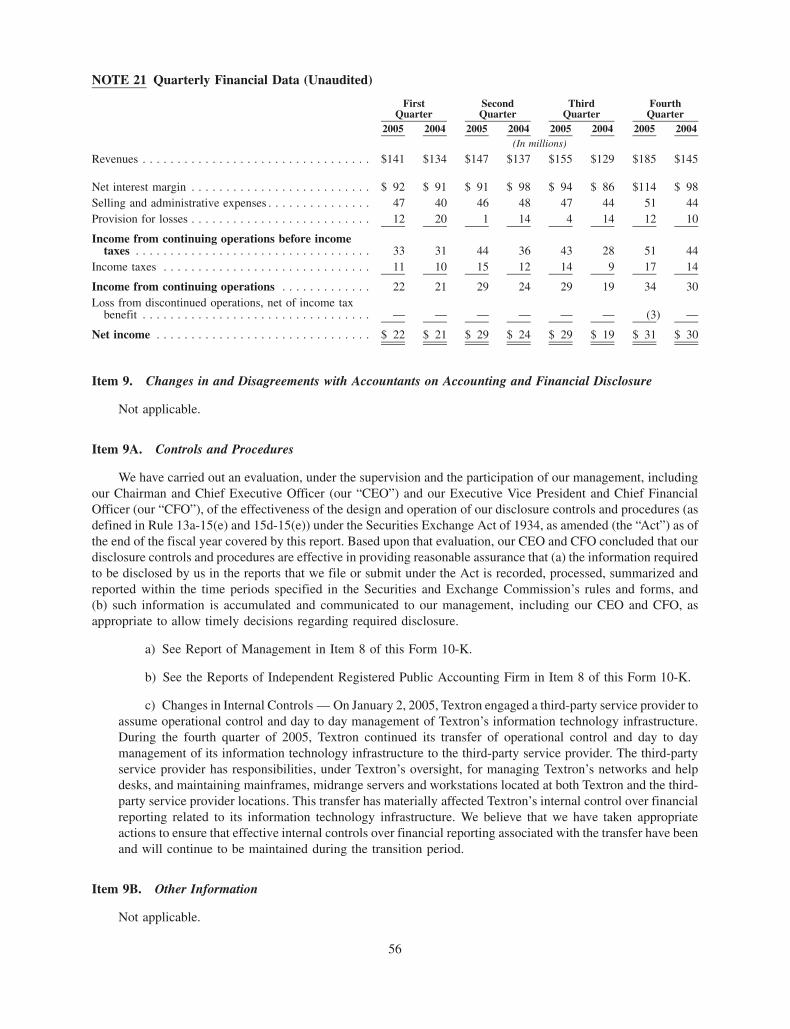
NOTE 21 Quarterly Financial Data (Unaudited)
2005 2004 2005 2004 2005 2004 2005 2004
FirstQuarter
SecondQuarter
ThirdQuarter
FourthQuarter
(In millions)
Revenues . . . . . . . . . . . . . . . . . . . . . . . . . . . . . . . . . $141 $134 $147 $137 $155 $129 $185 $145
Net interest margin . . . . . . . . . . . . . . . . . . . . . . . . . . $ 92 $ 91 $ 91 $ 98 $ 94 $ 86 $114 $ 98Selling and administrative expenses . . . . . . . . . . . . . . . 47 40 46 48 47 44 51 44Provision for losses . . . . . . . . . . . . . . . . . . . . . . . . . . 12 20 1 14 4 14 12 10
Income from continuing operations before incometaxes . . . . . . . . . . . . . . . . . . . . . . . . . . . . . . . . . . 33 31 44 36 43 28 51 44
Income taxes . . . . . . . . . . . . . . . . . . . . . . . . . . . . . . 11 10 15 12 14 9 17 14
Income from continuing operations . . . . . . . . . . . . . 22 21 29 24 29 19 34 30Loss from discontinued operations, net of income tax
benefit . . . . . . . . . . . . . . . . . . . . . . . . . . . . . . . . . — — — — — — (3) —
Net income . . . . . . . . . . . . . . . . . . . . . . . . . . . . . . . $ 22 $ 21 $ 29 $ 24 $ 29 $ 19 $ 31 $ 30
Item 9. Changes in and Disagreements with Accountants on Accounting and Financial Disclosure
Not applicable.
Item 9A. Controls and Procedures
We have carried out an evaluation, under the supervision and the participation of our management, includingour Chairman and Chief Executive Officer (our “CEO”) and our Executive Vice President and Chief FinancialOfficer (our “CFO”), of the effectiveness of the design and operation of our disclosure controls and procedures (asdefined in Rule 13a-15(e) and 15d-15(e)) under the Securities Exchange Act of 1934, as amended (the “Act”) as ofthe end of the fiscal year covered by this report. Based upon that evaluation, our CEO and CFO concluded that ourdisclosure controls and procedures are effective in providing reasonable assurance that (a) the information requiredto be disclosed by us in the reports that we file or submit under the Act is recorded, processed, summarized andreported within the time periods specified in the Securities and Exchange Commission’s rules and forms, and(b) such information is accumulated and communicated to our management, including our CEO and CFO, asappropriate to allow timely decisions regarding required disclosure.
a) See Report of Management in Item 8 of this Form 10-K.
b) See the Reports of Independent Registered Public Accounting Firm in Item 8 of this Form 10-K.
c) Changes in Internal Controls — On January 2, 2005, Textron engaged a third-party service provider toassume operational control and day to day management of Textron’s information technology infrastructure.During the fourth quarter of 2005, Textron continued its transfer of operational control and day to daymanagement of its information technology infrastructure to the third-party service provider. The third-partyservice provider has responsibilities, under Textron’s oversight, for managing Textron’s networks and helpdesks, and maintaining mainframes, midrange servers and workstations located at both Textron and the third-party service provider locations. This transfer has materially affected Textron’s internal control over financialreporting related to its information technology infrastructure. We believe that we have taken appropriateactions to ensure that effective internal controls over financial reporting associated with the transfer have beenand will continue to be maintained during the transition period.
Item 9B. Other Information
Not applicable.
56
PART III.
Item 10. Directors and Executive Officers of the Registrant
Omitted per Instruction I of Form 10-K.
Item 11. Executive Compensation
Omitted per Instruction I of Form 10-K.
Item 12. Security Ownership of Certain Beneficial Owners and Management
Omitted per Instruction I of Form 10-K.
Item 13. Certain Relationships and Related Transactions
Omitted per Instruction I of Form 10-K.
Item 14. Principal Accounting Fees and Services
The aggregate fees for professional services rendered by Ernst & Young LLP during 2005 and 2004 were asfollows:
Audit Fees — Fees for the audit of Textron Financial’s annual financial statements, the reviews of the financialstatements in Textron Financial’s Forms 10-Q, and other services in connection with statutory and regulatory filingsand engagements were $1.2 million, in both 2005 and 2004.
Audit Related Fees — Audit related services include agreed upon procedures relating to securitizations offinance receivables, attest services not required by statute or regulation, and consultations concerning financialaccounting and reporting matters not classified as audit. Fees were $0.1 million and $0.2 million in 2005 and 2004,respectively.
Tax Services — Fees for tax services relating to consultations and compliance were $33 thousand and$18 thousand in 2005 and 2004, respectively.
Other Services — No fees were paid to Ernst & Young LLP for miscellaneous other services in 2005. Feesrelating to miscellaneous other services were $22 thousand in 2004.
No fees were paid to Ernst & Young LLP for financial information systems design and implementationservices during 2005 or 2004.
PART IV.
Item 15. Exhibits, Financial Statement Schedules
(1) List of Financial Statements and Financial Statement Schedules
The following consolidated financial statements of Textron Financial and subsidiaries are included in Item 8:
1. Consolidated Statements of Income for each of the years in the three-year period ended December 31, 2005
2. Consolidated Balance Sheets at December 31, 2005 and January 1, 2005
3. Consolidated Statements of Cash Flows for each of the years in the three-year period ended December 31,2005
4. Consolidated Statements of Changes in Shareholder’s Equity for each of the years in the three-year periodended December 31, 2005
5. Notes to consolidated financial statements
57
All other schedules for which provision is made in the applicable accounting regulation of the Securities andExchange Commission are not required under the related instructions or are inapplicable and therefore have beenomitted.
(2) Exhibits
The following is an Index of Exhibits required by Item 601 of Regulation S-K filed with the Securities andExchange Commission as part of this report.
ExhibitNo.
3.1* Restated Certificate of Incorporation of Textron Financial, dated July 19, 19933.2** By-Laws of Textron Financial as of May 2, 20004.1*** Indenture dated as of December 9, 1999, between Textron Financial Corporation and SunTrust
Bank (formerly known as Sun Trust Bank, Atlanta), (including form of debt securities)4.2**** Indenture dated as of November 30, 2001, between Textron Financial Canada Funding Corp. and
SunTrust Bank, guaranteed by Textron Financial Corporation4.3 Amended and Restated Indenture, dated as of May 26, 2005, by and between Textron Financial
Floorplan Master Note Trust and The Bank of New York, as indenture trustee, incorporated hereinby reference to Exhibit 4.1 of Textron Financial Corporation’s Current Report on Form 8-K datedMay 26, 2005
4.4 Amended and Restated Series 2001-1 Supplement, dated as of May 26, 2005, to the Amended andRestated Indenture, dated as of May 26, 2005, by and among Textron Financial Floorplan MasterNote Trust, The Bank of New York, as indenture trustee, and Textron Financial, as servicer,incorporated herein by reference to Exhibit 4.2 of Textron Financial Corporation’s Current Reporton Form 8-K dated May 26, 2005
4.5 Series 2005-A Supplement, dated as of May 26, 2005, to the Amended and Restated Indenture,dated as of May 26, 2005, by and among Textron Financial Floorplan Master Note Trust, The Bankof New York, as indenture trustee, and Textron Financial, as servicer, incorporated herein byreference to Exhibit 4.3 of Textron Financial Corporation’s Current Report on Form 8-K datedMay 26, 2005
10.1* Support Agreement dated as of May 25, 1994, between Textron Financial and Textron10.2* Receivables Purchase Agreement between Textron Financial and Textron dated as of January 1, 198610.3* Tax Sharing Agreement between Textron Financial and Textron dated as of December 29, 199010.4 364-Day Credit Agreement dated July 28, 2003 among Textron Financial Corporation, the Banks
listed therein, and JPMorgan Chase Bank, as Administrative Agent. Incorporated by reference toExhibit 10.1 to Textron Financial Corporation’s Report on 8-K as filed on August 26, 2003
10.5 Five-Year Credit Agreement dated July 28, 2003 among Textron Financial Corporation, the Bankslisted therein, and JPMorgan Chase Bank, as Administrative Agent. Incorporated by reference toExhibit 10.2 to Textron Financial Corporation’s Report on 8-K as filed on August 26, 2003
10.6 5-Year Credit Agreement, dated as of March 28, 2005, among Textron, the Banks listed therein,JPMorgan Chase Bank, N.A., as Administrative Agent, and Citibank, N.A., as Syndication Agent.Incorporated by reference to Exhibit 10.1 to Textron’s Current Report on Form 8-K filed March 31,2005
10.7 364-Day Credit Agreement dated March 31, 2003 among Textron Inc., the Banks listed therein, andJPMorgan Chase Bank, as Administrative Agent. Incorporated by reference to Exhibit 10.3 toTextron Inc.’s Quarterly Report on Form 10-Q for the fiscal quarter ended March 29, 2003
10.8 Amendment to the 364-Day Credit Agreement dated as of July 28, 2003 among Textron Inc., theBanks listed therein, and JPMorgan Chase Bank, as Administrative Agent. Incorporated byreference to Exhibit 10.5 to Textron Financial Corporation’s Quarterly Report on Form 10-Q for thefiscal quarter ended September 30, 2003
10.9 Amendment No. 2 to the 364-day Credit Agreement among Textron Inc., the Banks listed therein,and JPMorgan Chase Bank, as Administrative Agent. Incorporated by reference to Exhibit 10.1 toTextron’s Quarterly Report on Form 10-Q for the fiscal quarter ended April 3, 2004
58
ExhibitNo.
10.10 Amendment to the 364-day Credit Agreement dated as of July 28, 2003 among Textron FinancialCorporation, the Banks party thereto, and JP Morgan Chase Bank, as Administrative Agent.Incorporated by reference to Exhibit 10.1 to Textron Financial’s Quarterly Report on Form 10-Q forthe fiscal quarter ended September 30, 2004
10.11 Amendment No. 1, dated as of July 25, 2005, to the Five-Year Credit Agreement dated as ofJuly 28, 2003 among Textron Financial, the Banks listed therein, and JPMorgan Chase Bank N.A.,as Administrative Agent. Incorporated by reference to Exhibit 10.1 to Textron FinancialCorporation’s Report on Form 8-K as filed on July 27, 2005
10.12 Amendment No. 2, dated as of July 25, 2005, to the 364-Day Credit Agreement dated as of July 28,2003, among Textron Financial, the Banks listed therein, and JPMorgan Chase Bank N.A., asAdministrative Agent. Incorporated by reference to Exhibit 10.1 to Textron Financial Corporation’sReport on Form 8-K as filed on July 27, 2005
12 Computation of Ratios of Earnings to Fixed Charges21 List of significant subsidiaries23 Consent of Independent Auditors24 Power of Attorney dated as of February 24, 200631.1 Certification of Chief Executive Officer Pursuant to Rule 13a-14(a)31.2 Certification of Chief Financial Officer Pursuant to Rule 13a-14(a)32.1 Certification of Chief Executive Officer Pursuant to 18 U.S.C. Section 135032.2 Certification of Chief Financial Officer Pursuant to 18 U.S.C. Section 135099.1 Amended and Restated Trust Agreement, dated as of May 26, 2005, among Textron Financial,
Textron Receivables Corporation III and SunTrust Delaware Trust Company, as owner trustee,incorporated herein by reference to Exhibit 99.1 of Textron Financial Corporation’s Current Reporton Form 8-K dated May 26, 2005
99.2 Amended and Restated Receivables Purchase Agreement, dated as of May 26, 2005, by and betweenTextron Financial and Textron Receivables Corporation III, incorporated herein by reference toExhibit 99.2 of Textron Financial Corporation’s Current Report on Form 8-K dated May 26, 2005
99.3 Amended and Restated Sale and Servicing Agreement, dated as of May 26, by and among TextronReceivables Corporation III, Textron Financial Floorplan Master Note Trust, and Textron Financial,as servicer, incorporated herein by reference to Exhibit 99.3 of Textron Financial Corporation’sCurrent Report on Form 8-K dated May 26, 2005
99.4 Amended and Restated Administration Agreement, dated as of May 26, 2005, among TextronReceivables Corporation III, Textron Financial and The Bank of New York, as indenture trustee,incorporated herein by reference to Exhibit 99.4 of Textron Financial Corporation’s Current Reporton Form 8-K dated May 26, 2005
Note: Instruments defining the rights of holders of certain issues of long-term debt of Textron Financial have notbeen filed as exhibits to this Report because the authorized principal amount of any one of such issues doesnot exceed 10% of the total assets of Textron Financial and its subsidiaries on a consolidated basis. TextronFinancial agrees to furnish a copy of each such instrument to the Commission upon request.
* Incorporated by reference to the Exhibit with the same number of Textron Financial’s Registration Statementon Form 10 (File No. 0-27559)
** Incorporated by reference to Exhibit 3.1 of Textron Financial’s quarterly report on Form 10-Q datedAugust 11, 2000
*** Incorporated by reference to Exhibit 4.1 to Amendment No. 2 to Textron Financial Corporation’s Regis-tration Statement on Form S-3 (No. 333-88509)
**** Incorporated by reference to Exhibit 4.2 to Amendment No. 1 to Textron Financial Corporation’s Regis-tration Statement on Form S-3 (No. 333-108464)
Textron Financial, Textron, Bell Helicopter, Cessna, Cessna Finance Corporation, Textron Business Services, Inc., AssetControl, a division of Textron Business Services, Inc., Textron Golf, Turf and Specialty Products, E-Z-GO, Jacobsen
turf-care and their related trademark designs and logotypes (and variations of the foregoing) are trademarks,trade names or service marks of Textron Inc., its subsidiaries, affiliates or joint ventures.
59
SIGNATURES
Pursuant to the requirements of Section 13 or 15(d) of the Securities Exchange Act of 1934, the registrant hasduly caused this Annual Report on Form 10-K to be signed on its behalf by the undersigned, thereunto dulyauthorized on this 24 day of February 2006.
Textron Financial CorporationRegistrant
By: *
Ted R. FrenchChairman and Chief Executive Officer
Pursuant to the requirements of the Securities Exchange Act of 1934, this Report has been signed below on this24 day of February 2006, by the following persons on behalf of the registrant and in the capacities indicated:
By: *
Ted R. FrenchChairman and Chief Executive Officer,Director (Principal Executive Officer)
By: *
Buell J. Carter, Jr.President and Chief Operating Officer,Director
By: *
Mary F. LovejoyDirector
By: /s/ THOMAS J. CULLEN
Thomas J. CullenExecutive Vice President and Chief FinancialOfficer (Principal Financial Officer)
By: /s/ THOMAS N. NICHIPOR
Thomas N. NichiporVice President and Corporate Controller(Principal Accounting Officer)
*By: /s/ ELIZABETH C. PERKINS
Elizabeth C. PerkinsAttorney-in-fact
60
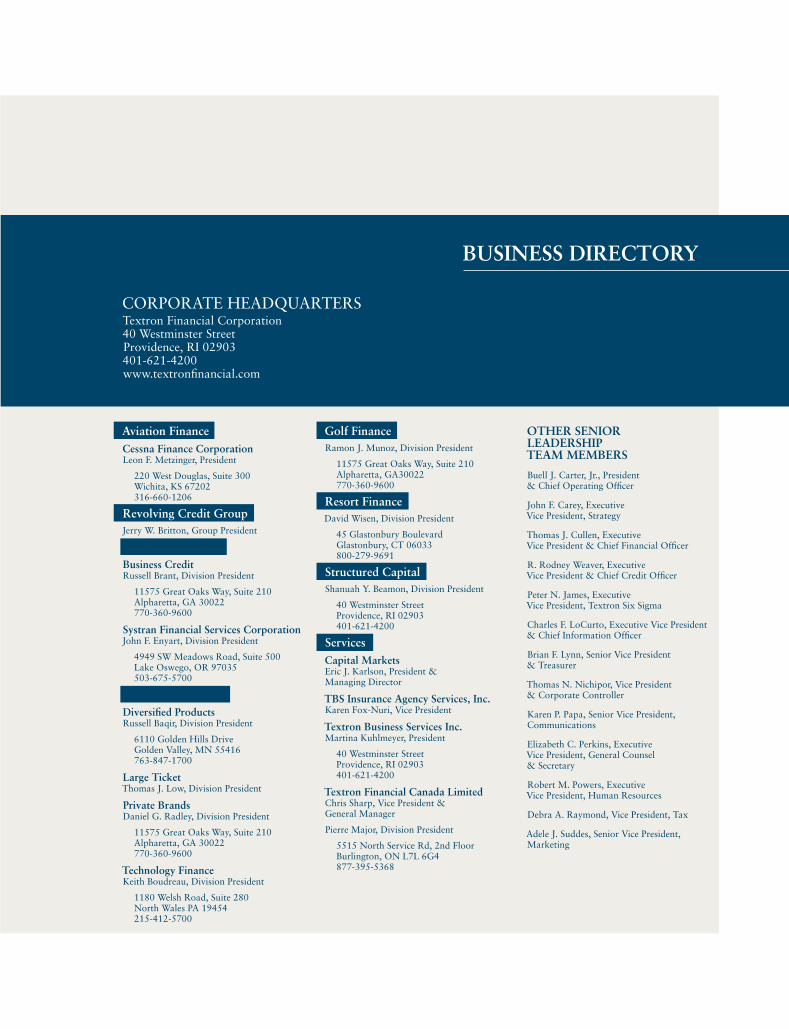
With a continuing focus on
attracting, developing and
retaining the best and the
brightest people, we have
never been more confident and
well-positioned for significant
and sustained growth in the
years ahead.
MANAGEMENT’S LETTER
the year 2005 was very good for textron Financial Corporation. It was a year in which we put our liquidating portfolio behind us, and, through our
strategy of focusing on our core businesses, delivered one billion dollars in core managed receivables growth. When you combine this substantial growth with historically low levels of delinquency and non-performing assets, it is clear that we are well-positioned for steady improvement in profitability.
We are focused on strong, disciplined growth and achieving high levels of customer satisfaction. We believe that, by reaching our aggressive customer satisfaction targets, we will achieve our financial objectives and, ultimately, become the premier commercial finance company. our strategy is to focus on growing existing businesses and products more quickly, while leveraging current platforms into adjacent spaces.
While solid growth and exceptional portfolio quality were delivered in 2005, we remain firmly committed to reducing expenses in order to successfully compete in today’s competitive environment. that said, numerous initiatives across our company are helping us to improve our operating efficiency. For instance, the acceleration of textron six sigma Lean is streamlining our processes, making it easier for employees to do their jobs and, therefore, easier for them to focus on the things that matter most – like forming and nurturing customer relationships, and applying extensive product knowledge and industry expertise to meet clients’ needs. Improvements to our technology systems and applications are also enhancing our ability to satisfy customers.
of course, underlying all that we are striving to accomplish is a highly skilled and motivated management team and workforce. With a continuing focus on attracting, developing and retaining the best and the brightest people, we have never been more confident and well-positioned for significant and sustained growth in the years ahead.
on behalf of the entire textron Financial management team, we thank our customers for their business and their loyalty. our greatest honor is to serve them and to work together to ensure the success of their business and ours. We also thank our employees, for it is only through their constant dedication, creativity, teamwork and discipline that we can proudly report steady progress toward our goals.
Ted FrenchChairman and CEO
Jay CarterPresident and COO
CoRPoRAte HeADquARteRstextron Financial Corporation40 Westminster streetProvidence, RI 02903401-621-4200www.textronfinancial.com
BUSINESS DIRECTORY
Aviation FinanceCessna Finance Corporation Leon F. Metzinger, President
220 West Douglas, suite 300 Wichita, Ks 67202 316-660-1206
Revolving Credit Group Jerry W. Britton, Group President
Asset-Based Lending
Business Credit Russell Brant, Division President
11575 Great oaks Way, suite 210 Alpharetta, GA 30022 770-360-9600
Systran Financial Services Corporation John F. enyart, Division President
4949 sW Meadows Road, suite 500 Lake oswego, oR 97035 503-675-5700
Distribution Finance
Diversified Products Russell Baqir, Division President
6110 Golden Hills Drive Golden valley, Mn 55416 763-847-1700
Large Ticket thomas J. Low, Division President
Private Brands Daniel G. Radley, Division President
11575 Great oaks Way, suite 210 Alpharetta, GA 30022 770-360-9600
Technology Finance Keith Boudreau, Division President
1180 Welsh Road, suite 280 north Wales PA 19454 215-412-5700
Golf FinanceRamon J. Munoz, Division President
11575 Great oaks Way, suite 210 Alpharetta, GA30022 770-360-9600
Resort FinanceDavid Wisen, Division President
45 Glastonbury Boulevard Glastonbury, Ct 06033 800-279-9691
Structured Capitalshanuah Y. Beamon, Division President
40 Westminster street Providence, RI 02903 401-621-4200
ServicesCapital Markets eric J. Karlson, President & Managing Director
TBS Insurance Agency Services, Inc. Karen Fox-nuri, vice President
Textron Business Services Inc. Martina Kuhlmeyer, President
40 Westminster street Providence, RI 02903 401-621-4200
Textron Financial Canada Limited Chris sharp, vice President & General Manager
Pierre Major, Division President
5515 north service Rd, 2nd Floor Burlington, on L7L 6G4 877-395-5368
OTHER SENIOR LEADERSHIP TEAM MEMBERS
Buell J. Carter, Jr., President & Chief operating officer
John F. Carey, executive vice President, strategy
thomas J. Cullen, executive vice President & Chief Financial officer
R. Rodney Weaver, executive vice President & Chief Credit officer
Peter n. James, executive vice President, textron six sigma
Charles F. LoCurto, executive vice President & Chief Information officer
Brian F. Lynn, senior vice President & treasurer
thomas n. nichipor, vice President & Corporate Controller
Karen P. Papa, senior vice President, Communications
elizabeth C. Perkins, executive vice President, General Counsel & secretary
Robert M. Powers, executive vice President, Human Resources
Debra A. Raymond, vice President, tax
Adele J. suddes, senior vice President, Marketing

EFFICIENCY
GROWTH
DISCIPLINE
2005 Annual R
eport
InvestoR InquIRestextron Financial Corporation
treasury Department 40 Westminster street
P.o. Box 6687 Providence, RI 029040-6687
401-621-4200
CoMPAnY PuBLICAtIons AnD GeneRAL InFoRMAtIon
to receive a free copy of textron Financial Corporation’s seC filings or Annual Report, please call (401) 621-4200 or direct written correspondence to the treasury Department
at the address specified above. For more information regarding textron Financial and
its businesses, or an electronic copy of this Annual Report, visit our worldwide website
at www.textronfinancial.com.
© 2006 textron Financial Corporation