2005/09/07-nrc staff prefiled exhibit 65-m, maeda, h. 2005
TRANSCRIPT
DOCKETEDUSNRC
February 24, 2006 (4:12pm)
OFFICE OF SECRETARYRULEMAKINGS AND
ADJUDICATIONS STAFF
Docket No. 70-3103-ML
RAS 11250
Staff Exhibit 65-M
FEIS Purpose and Need
Maeda, H. 2005. ""The Global NuclearFuel Market - Supply and Demand2005-2030: WNA Market Report"
World Nuclear Association AnnualSymposium
WorldNuclearAssociation
World Nuclear Association Annual Symposium7-9 September 2005 - London
The Global Nuclear Fuel Market - Supply and Demand2005-2030.
WNA Market Report
Haruo Maeda
Introduction
Ladies and Gentlemen: today I would like to report on the WNA Market Report,which was investigated, analysed and drafted by a dedicated sub-group withinWNA.
The Nuclear Fuel Working Group, chaired by Mr George Capus of Cogema,judged in September 2004 that the WNA Market Report should now be updated,given that the report had been revised every two years in the past and because thesupply and demand situation had changed since the last issue in 2003. After thisdecision, a new sub-group, called the " Market Report Drafting Group " wasestablished, and it completed the report just a few days ago. What I will discusstoday is all contained in the 2005 Report, which will be available to every WNAmember company. Therefore, you don't have to take notes today!
Drafting Group Members:
WNA Members-Mr Harry Maeda (Chairman)-Mr J6r6me Bonnet-Mrs Penny Buye-Mr Andrew Crockett-Mr Claus Fenzlein-Mr ShuJi Matsumoto-Dr Arthur Max-Mr Kenneth Petersen-Mr Jaroslav Sedina-Mr Patrick Signoret*Ms Nichola Still-Mr Eric Webb-Mr Michael Whitehurst
ITOCHU InternationalCOGEMACamecoUrenco Enrichment CompanyFramatome ANPMitsubishiRWE NukemExelonCEZCOGEMAWestinghouse UAMUx ConsultingUSEC
K World Nuclear Association 2005 I

WNA Market Report
WNA Secretariat*Mr Stephen Kidd (Secretary) Director of Strategy and Research*Ms Irina Borysova Research Officer*Mr Satoshi Tachibana Visiting Research Officer*Mr Martin Taylor Consultant
As you may be aware, this Report is used not only by our industry people, but alsoby outsiders, in the financial sector, consultancies - even by anti-nuclear people.In order to satisfy all of these people, an accurate, neutral, trusted and usefulreport is required. Therefore, we collected expertise from many knowledgeablemembers, both utilities buying nuclear fuel and their suppliers, and also from thethree biggest nuclear power regions, Europe, North America and East Asia.
The work of the drafting group required a lot of cooperation from the members'headquarters companies as well. Please see the names of the group members onthe slide and also the Secretariat staff responsible. I would like to thank everyonevery much for their efforts.
Report Structure
Now I would like firstly to mention the report structure. Please look at the reportindex.
Report Contents:Executive Summary1. Introduction2. Nuclear Generating Capacity3. Nuclear Fuel Demand4. Nuclear Fuel Supply5. Supply, Demand and ConclusionsReferencesAppendices
The report consists of an Executive Summary, followed by five chapters. Wedecided to maintain the structure as used in the 2003 report. In other words, wedecided to maintain from the 2005 Report the main divisions of NuclearGenerating Capacity, Nuclear Fuel Demand, Nuclear Fuel Supply, and Supply,Demand and Conclusions.
To follow this decision, we firstly studied each country's nuclear generationprogramme and updated our forecasts. This was mostly completed by April, andthe drafting of the words was completed in parallel. This is discussed in Chapter 2of the report.
After we developed the big picture of nuclear generation programmes over theworld, the demand for uranium and the fuel cycle services such as conversion,enrichment and fabrication were reviewed. In this review, some careful analysiswas necessary and decisions made. This included nuclear power plant design,reactor load factors, cycle length, tails assay, bum-ups and so on. This isdiscussed in detail in Chapter 3 of the report.
Then, a review of supply sources was made. This was developed by dividing thesupply into that from primary uranium production and from secondary supplysources. This is discussed in Chapter 4.
2 WNA Annual Symposium 2005

Maeda
Finally, Chapter 5 discusses the balance of supply and demand, and reaches someconclusions.
Nuclear Generating Capacity
Now let me talk a little about the essence of the report. This report covers theperiod until the year 2030. This is because we believe that a nuclear generationprogramme always needs a long-term plan, but beyond 2030 is too far to project.
In order to make a demand forecast we needed a forecast of nuclear generationcapacity in each country. Here, we set three cases, optimistic, pessimistic, andneutral to the capacity forecast. We call them the upper scenario, the lowerscenario and the reference scenario.
We forecasted the capacity before 2020 based on the currently known plans orprogramme in each country. Regarding the capacity forecast after 2020, we didnot review it in each country. We reviewed it region by region up to 2030 basedon the trends apparent before 2020. Of course, we considered possible plantclosures which may occur before 2030, given possible license expirations,government policies or financial pressures.
Figure I shows the capacity forecast (this is Figure 2.3 in the Report).
800000
700000
6000000
* 400000 l | l lll
100000
| + ReferSOcO Scenario --- Upper Scenao Lower Scenario
Figure 1. Nuclear Generating Capacity to 2030.
In 2020 under the upper scenario, we estimate the nuclear capacity to beapproximately 520 GWe. This shows a growth of 41% as compared with the year2005. This represents 2.4% average annual growth during the period.
In 2020 under the lower scenario, we estimate the capacity to be approximately365Gwe. This is almost the same capacity as now. In another words, it is zerogrowth as compared with now.
C World Nuclear Association 2005 3

WNA Market Report
In 2020 under the reference scenario, we estimate the capacity to beapproximately 445 GWe. This shows a growth of 21 % as compared with the year2005. This represents 1.3% average annual growth during the period.
What I want to stress under the upper scenario is the growth in East Asia; ahead ofall others, it is Mainland China. Under this scenario, about 30GWe of increase isexpected to occur there and it accounts for additional 30 reactors of the currentpopular size of around 1000 MWe. As a matter of fact, China has started upseveral new reactors since 2002, and the expected growth there is not a dream atall. Also the Report expects about 12GWe growth by 2020 in India, where theeconomic boom continues, and about 2OGWe growth in Japan, where thepopulation is now expected to decrease.
Under the lower scenario, on the other hand, many reactors are expected to shutdown in some countries. Good examples are Germany and the United Kingdom.Anti-nuclear policies and opinion are expected to continue, with no new plantsexpected, while some reactors will be forced to shut down earlier than scheduled.However, we still estimate a certain growth in China, Korea, India and somecountries in this scenario.
22%
20%
amon all poe geeain Th mai reso wh lE prjc suc aeraei
10% *Illlllllll l
wihu les exesin whc I do' beiv wil happen.Th lE reeec scnai exet abu 1.7 anua grwt l enrydmn
0%
r e nt 20 to 3 ye a upprs SanId ty EA 2wi4 Ngro at 2
Figcitre 2. Nuclear share ofmpower generation, %
Just for your reference only, we show a nuclear generation capacity forecastissued by iEA in 2004. This shows a decrease in the share of nuclear generationamong all power generation. The main reason why IEA project such a decrease isbecause they expect most of old aged reactors in Western countries to retirewithout license extension, which I don't believe will happen.
The IEA reference scenario expects about 1.7% annual growth in energy demandfor the next 20 to 30 years, and that electricity demand will grow at 2.45% peryear as the electricity demand will increase more rapidly than the energy demand.
This 2.45% growth is coincidentally the same growth as the growth in nucleargeneration capacity up to 2020 under our upper scenario. Now you can understandthat from the standpoint of the electricity demand increase, our nuclear generation
4 WNA Annual Symposium 2005

'-1 11
Maeda
capacity growth under the upper scenario is not too optimistic. I would rather saya sort of realistic scenario.
Nuclear Fuel Demand
Based on the nuclear generation capacity forecast, we estimated the demand foruranium, and the other fuel cycle services towards 2030. In this estimate, weincluded some reasonable assumptions on nuclear reactor designs, load factors,cycle lengths, tails assays, and others. These are the influencing factors on thedemand forecast.
Factors affecting fuel requirements* Reactor designs* Load factor* Enrichment level* Fuel burnup* Tails assay* Cycle length
Here, I would like to make an additional explanation about the tails assay. Lowertails assays will produce more enrichment requirements with a lower uraniumfeed. The recent uranium price increase has already led to utility companiesspecifying lower tails assays with enrichment companies. The most economic tailsassay to utility companies under the current spot price for uranium, conversionand enrichment is somewhere around 0.25%.
However, we choose 0.27% as our model tails assays. This is because 0.3% orhigher tails assays are still projected by many utilities according to our recentquestionnaire. However, our report provides a detailed sensitivity analysis forvarious tails assays, instead.
180000
16000 l_
140000
120000
-64000 - --- ---
0
L- d. Rd - S 6.. WS- i
-- Low rScenri -- Refrnc ceai Uper Scenuario
Figure 3. Uranium requirements to 2030, tU (Figure 3.3 in the Report)
Here are demand curves for uranium and enrichment services only. These aresimilar to the curves we saw earlier for the nuclear generation capacity increase.
( World Nuclear Association 2005 Is

WNA Market Report
120000
100000
40000
20000
101 ION le le" 11 _ |__
-*- ower Scenano -- Referenc e Scnro pecenario
Figure 4. Enrichment requirements to 2030, 'COOs SWUs
Nuclear Fuel Supply:
* Uranium* Conversion* Enrichment* Fuel fabrication* Primary versus secondary sources
Now I will talk about supply. We estimated nuclear fuel supply component bycomponent, such as uranium, conversion, enrichment and fabrication. Also weconsidered it not only from primary production, but also from secondary supplysources, such as inventory.
Table 1. World uranium production 2004-2004, tU (Table 4.2 in the Report)
2002 2003 2004 % change2003-2004
Australia 6854 7572 8982 19Brazil 270 310 300 -3Canada 11604 10457 11597 11China* 730 750 750 0Czech Republic 465 452 412 -9France 18 9 7 0Germany 212 150 150 0India* 230 230 230 0Kazakhstan 2800 3300 3719 13Namibia 2333 2036 3038 49Niger 3075 3143 3282 4Pakistan* 38 45 45 0Portugal 2 0 0 0Romania* 90 90 90 0Russia* 2900 3150 3200 2South Africa 824 758 755 0Spain 37 0 0 0Ukraine* 800 800 800 0USA 883 779 878 9Uzbekistan 1860 1589 2016 27
Total 36025 35622 40251 13
^WNA estimate
6 WNA Annual Symposium 2005
Maeda
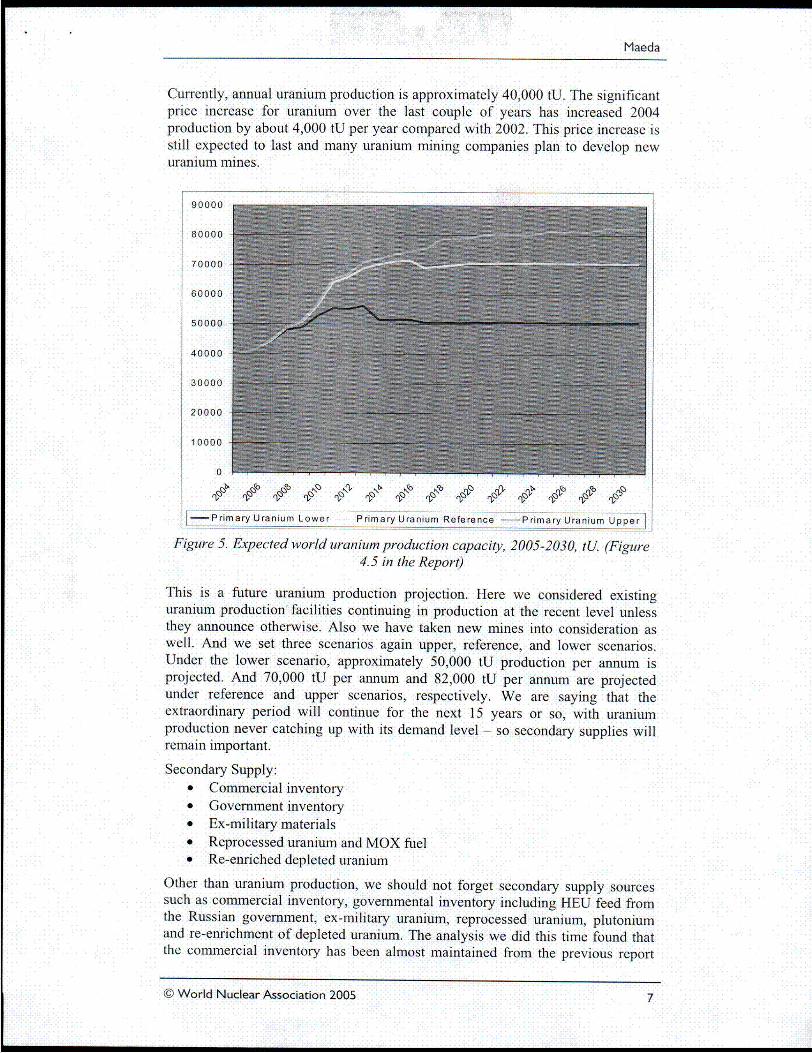
Currently, annual uranium production is approximately 40,000 tU. The significantprice increase for uranium over the last couple of years has increased 2004production by about 4,000 tU per year compared with 2002. This price increase isstill expected to last and many uranium mining companies plan to develop newuranium mines.
90000
80000
70000
60000
40000
30000
20000
1 0000
0-
oooIf,1 11 11 1 1P1
|-Primary Uranium Lower Primary Uranium Reference <---Primary Uranium Upper 1Figure 5. Expected world uranium production capacity, 2005-2030, tU. (Figure
4.5 in the Report)
This is a future uranium production projection. Here we considered existinguranium production facilities continuing in production at the recent level unlessthey announce otherwise. Also we have taken new mines into consideration aswell. And we set three scenarios again upper, reference, and lower scenarios.Under the lower scenario, approximately 50,000 tU production per annum isprojected. And 70,000 tU per annum and 82,000 tU per annum are projectedunder reference and upper scenarios, respectively. We are saying that theextraordinary period will continue for the next 15 years or so, with uraniumproduction never catching up with its demand level - so secondary supplies willremain important.
Secondary Supply:* Commercial inventory* Government inventory* Ex-military materials* Reprocessed uranium and MOX fuel* Re-enriched depleted uranium
Other than uranium production, we should not forget secondary supply sourcessuch as commercial inventory, governmental inventory including HEU feed fromthe Russian government, ex-military uranium, reprocessed uranium, plutoniumand re-enrichment of depleted uranium. The analysis we did this time found thatthe commercial inventory has been almost maintained from the previous report
© World Nuclear Association 2005 7
� World Nuclear Association 2005 7

WNA Market Report
analysis, which is approximately 110,000 tU, 150% of world annual consumption.This tells us that we don't rely on such commercial inventory nowadays. Thistendency will continue, or the inventory will possibly be built up again in theshort term.
Government inventory is also a very important supply source in addition to thecommercial inventory. Most of the government inventory is HEU feed supplyfrom Russia. Currently, the equivalent of approximately 9,000 tU per annum isbeing supplied and this will continue by 2013. A big question is whether this willstay the same after 2013 or not. This will be probably decided NOT by economicreasons, but by political reasons between US and Russia toward 2013. Therefore,this is very difficult to foresee it at this point of time. Our report estimates 2,000tU per annum to be supplied after 2013 under only the upper scenario.
With regard to conversion, enrichment, and fabrication, we just report the currentcapacities and future projected capacities which have been already announced.Russian HEU Feed supply contributes a lot to conversion and enrichment hereagain.
Supply and Demand:
* Russian-origin reactors* Western-origin reactors* Combined to produce world picture
Now let uss see the position of supply and demand based on what I have told you.
Before we come into the details, I need to emphasise that historically the nuclearfuels business has been divided into two fields. One is where Russian originreactors have been built, including Russia and the Newly Independent States(NIS) and the countries of Eastern Europe. The other one is the remainder of theworld, where Western type reactors have been built. More recently, thesesegments have become mixed, but the flow of uranium or its products has beenmainly one way. Therefore, we again analysed supply and demand in the twosections, later bringing together the two sections to see the whole world situation.Today I will just report to you only the reference scenario among the three supplyscenarios, for reasons of time.
Uranium
Let's take a look at the three demand scenarios for Western reactor types.
8 WNA Annual Symposium 2005
8 WNA Annual Symposium 2005
Maeda
1600E x-M ilitary M OX, Lower1 6 0 00 0 *_& Reference
:inventory Reduction,140000 Reference & Upper
:*Russian LEU Export
.120000 lllllll-u
i _ Recycling, Lower &Reference
inTails Re-enrichmentReference &Upper
80000 DOE Sales, Reference
6iHEU Downblended,Lower & Reference
-rE Primary Uranium40000 Reference
Requirem ents Upper
20000 10ll
-. i| Requirements Reference
0
Zo -.N- N Requirem ents Lower l
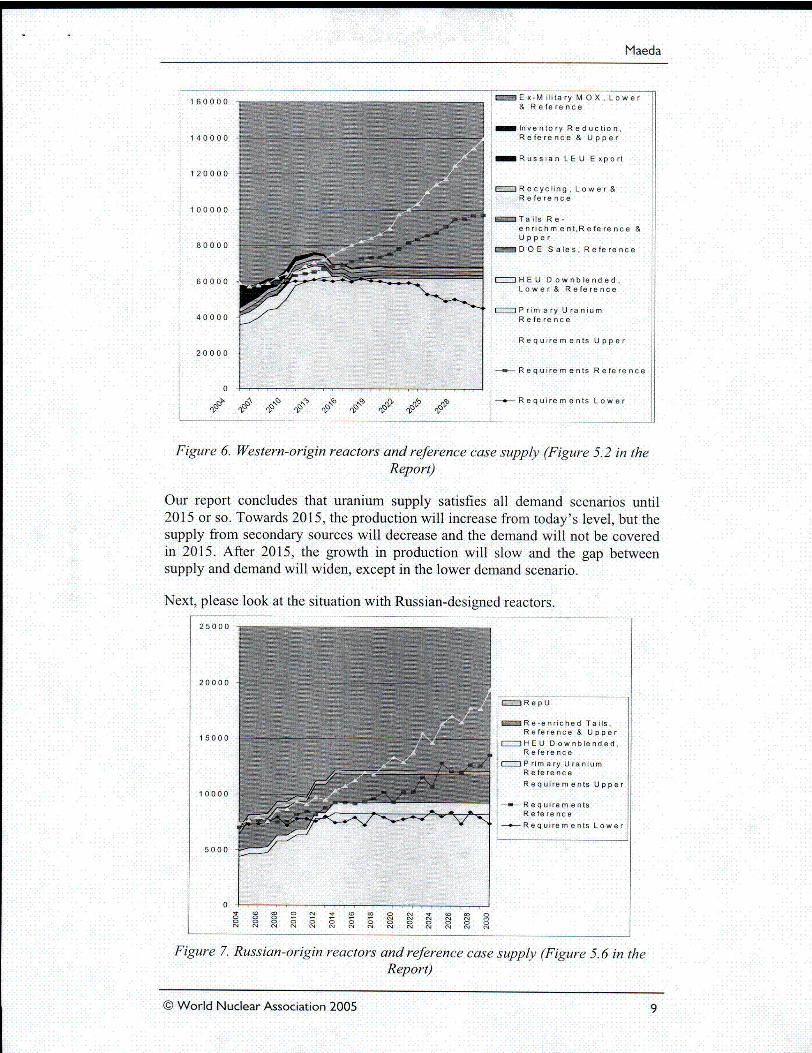
Figure 6. Western-origin reactors and reference case supply (Figure 5.2 in theReport)
Our report concludes that uranium supply satisfies all demand scenarios until2015 or so. Towards 2015, the production will increase from today's level, but thesupply from secondary sources will decrease and the demand will not be coveredin 2015. After 2015, the growth in production will slow and the gap betweensupply and demand will widen, except in the lower demand scenario.
Next, please look at the situation with Russian-designed reactors.
25000 _
'20000
| 77I Rep p U
IRe-enriched Tails,Reference & Upper
._. JHE U Downblended,Reference
,ZJ Primary U ra niumReference
Requirements Upper
| 1000---w- RequiremeantsReference
,-.-Requirements Lower
0t cc cc I e c N f c c
I 0 ( 10…0 NNt ( I N Nt NV N: O
| N ON N N N NE N N N N N N N N
Figure 7. Russian-origin reactors and reference case supply (Figure 5.6 in theReport)
© World Nuclear Association 2005 9
V World Nuclear Association 2005 9

WNA Market Report
Unlike for Western reactors, it looks OK until 2020, except in the upper demand
scenario.
Now let us take a look at the whole world picture, assuming that the uraniumflows continue between the two separate markets.
1 80 0 00 nE x-M ilita ryMO OX. Lowert a o o o __ _ _ * _ 1 & R e fere nc e|
1iWestern Inventory1 6 0 0 0 0 Reduction Reference &
| l lAil l -Upper
1 4 0 00 0 - lRussian LEU Export
1Recycling Lower &12 2 0 00 0 Reference
ENRe-enriched tails,
100000 Reference & Upper
DOQE Sales, Reference
6 00 00 Reference
Requirements Upper
2000 .-
-- Re q uire m e n tR efe re nc e
0
11z Nb ~'~--Requirements Lower
Figure 8. World reactors and reference case supply (Figure 5.9 in the Report)
Again, there is likely to be a significant gap between supply and the demandbetween 2015 and 2020. This is because of the large demand increase in Westerncountries. If the lower demand scenario occurs, this is not going to be a problem.
Let me repeat. Our upper or reference scenarios are not too optimistic. Our upper
demand scenario cannot meet the overall electricity demand growth forecast in the
reference scenario by IEA. In another words, in my opinion, our upper scenario indemand probably has much higher probability than our lower demand scenario.
Conversion
Current production capacity in conversion is 62,000 tU in UF6 and 4,000 tU in
U0 2 respectively. This is almost meeting the current demand, although actualcapacity does not run at 100% and the gap is filled with secondary supply sources.However, this is a much better situation than current uranium supply and demand.
In 2020, our Report estimates that UF6 conversion demand will increase to 80,000tU under the reference scenario, while the secondary supply for conversion will beunstable as well as that for uranium. Therefore, we believe that more capacity willbe required for conversion as well in long term. Of course, the addition is not soeasy. But if our industry gets together to aim for it, I don't think it's so difficult asfor uranium.
I0 WNA Annual Symposium 2005
10 WNA Annual Symposium 2005

Mllaeda
Enrichment
On the other hand, current production capacity for enrichment is large enough tocover current demand. This seems to be good news. However, this market israther oligopolistic with few sellers. If a part of supply is interrupted for whateverreason, we can see all of sudden a shortage.
As a matter of fact, there will be a shortage of capacity after 2010 if demandincreases as planned. Secondary supply will fill the gap here again, but we don'tknow what it will be after 2013.
To make a long story short, for enrichment after 2013, we are very muchdependent on the Russian HEU feed supply. If we want to avoid any unstablesituation where we rely on the Russian HEU, we might need to add more capacitybefore 2013.
Fabrication
Fabrication is the most stable market right now, compared with the other fuelcycle markets. One interesting area here is the amount of MOX fuel fabricationplant. More capacity will be necessary if we are to see more MOX usage, whichwill be the case under our upper scenario.
Conclusion
In conclusion, we now reconfirm our previous Market Report conclusion that thefuel supply is potentially short beyond 2015, unless the lower demand scenariooccurs. In particular, future uranium supply is now a big issue. Actually, theuranium market has been concerned about it for some time and accordingly. theprice has been increasing for the last couple of years. Primary uranium productionnow needs to rise sharply to meet market demand.
One of our concerns is that uncertainties about fuel security in the future maydepress possible investors' confidence in the nuclear power industry. This couldpotentially delay or cancel the nuclear programmes, currently set.
In order to mitigate such issues, in my personal opinion, I believe that moregovernmental inventory could be released and public support for additionaluranium production capacity should be achieved.
Lastly, we had some restrictions in writing this Report, such as time constraints,model simplifications to easily understand, taboos of price expectation and so on.Therefore, we cannot say that this report is 100% correct. Some of you may havemore precise data, or details. Such people may use our Report as a just base datato be modified as necessary. However, we are confident that our Report hits themark more or less. Uranium supply needs to increase substantially to meet marketdemand and constraints that prevent this have to be removed.
A copy of this Report will be sent to each member company. If you wvantadditional copies, please let the WVNA office know - a reasonable number ofcopies will be made available free of charge.
Thank you very much.
© World Nuclear Association 2005 I I