2006-2007 annual report - sacramento state€“2 annual report 2006-2007 vision, mission and goals...
TRANSCRIPT

Annual ReportFIRST 5 CALIFORNIA 2006-2007
CALIFORNIA CHILDREN AND FAMILIES COMMISSION


AnnuAl RepoRt 2006-2007
DiRectoR’s MessAge
The First 5 California Annual Report for Fiscal Year (FY) 2006-2007 provides a summary of the many ways we serve the state’s youngest children and their families. First 5 California and its 58 county partners are passionate about nurturing and protecting the health and education of our children. We have successfully raised awareness in our communities through direct services that improve the lives of families and children in meaningful ways. This annual report is a compilation of the information collected statewide and tells the story of our success.
I want to thank the Evaluation Workgroup, comprised of individuals from First 5 California, representative counties and the First 5 Association of California. This Workgroup helped to focus the nature of the data and the format for the information. Through these collaborative efforts and those of our numerous partners, First 5 California continues to be successful at building an integrated system of services and supports to help all children enter school ready to succeed.
Please use the First 5 California Annual Report for FY 2006-2007 as a resource and a guide for future planning as well as an evaluation of best practices. We appreciate the help and support of our many partners and look forward to a future filled with opportunity for our children.
Kris Perry, Executive Director First 5 California
ii

AnnuAl RepoRt 2006-2007 iii
chApteR 1 FiRst 5 cAliFoRniA oveRview ..............................................................................................1-1
History .................................................................................................................................. 1-1 First 5 County Commissions ................................................................................................ 1-1 Vision, Mission and Goals ....................................................................................................1-2 Funding .................................................................................................................................1-2 Audit Findings ......................................................................................................................1-2 Overview of this Report .......................................................................................................1-2 Fiscal Year 2006-2007 Highlights .......................................................................................1-3
chApteR 2 FiRst 5 cAliFoRniA seRvices ............................................................................................... 2-1
Administration .....................................................................................................................2-1 Public Education and Outreach ...........................................................................................2-1 Research and Evaluation ..................................................................................................... 2-2
chApteR 3 FiRst 5 cAliFoRniA pRogRAMs ........................................................................................... 3-1
School Readiness ..................................................................................................................3-1 Power of Preschool .............................................................................................................. 3-3 Special Needs Project .......................................................................................................... 3-4 Comprehensive Approaches to Raising Educational Standards ........................................ 3-4 Health Access ...................................................................................................................... 3-6 A Place of Our Own and Los Niños en Su Casa ................................................................. 3-6 Migrant and Seasonal Farm Workers Project: Migrant Education Even Start and La Union del Pueblo Entero ................................................................................3-8
Kit for New Parents ............................................................................................................. 3-8 First Smiles .......................................................................................................................... 3-9 Low Income Investment Fund Constructing Connections ...............................................3-10 California Smokers’ Helpline .............................................................................................3-10
chApteR 4 FiRst 5 county coMMission pRogRAM Focus AReAs .............................................. 4-1 Family Functioning ..............................................................................................................4-1 Child Development .............................................................................................................. 4-5 Child Health ......................................................................................................................... 4-9 Systems of Care ..................................................................................................................4-14
Table of Contents

AnnuAl RepoRt 2006-2007iv
exhibit 1 First 5 California Commission Members .......................................................................................... 1-1
exhibit 2 School Readiness-Ethnicity of Children Served by School Readiness Programs for Fiscal Year 2006-2007 ......................................................................................................... 3-1
exhibit 3 School Readiness-Primary Language of Children Served by School Readiness Programs for Fiscal Year 2006-2007 ........................................................................................3-2
exhibit 4 Comprehensive Approaches to Raising Educational Standards-Distribution of Caregivers by Training Track for Fiscal Year 2006-2007 ....................................................3-5
exhibit 5 Percent of Providers Who “Know More” After Viewing A Place of Our Own or Los Niños en Su Casa, by Topic Area ........................................................................................ 3-7
exhibit 6 California Smokers’ Helpline-Ethnicity of Callers for Fiscal Year 2006-2007 .......................3-11
exhibit 7 Family Functioning-Number of Services Provided to Children Ages 0 to 5 by Service Category for Fiscal Year 2006-2007 ............................................................................. 4-1
exhibit 8 Family Functioning-Number of Services Provided to Parents, Guardians, Primary Caregivers, Relatives, and Providers by Service Category for Fiscal Year 2006-2007 ............4-2
exhibit 9 Family Functioning-Services Provided to Children by Ethnicity for Fiscal Year 2006-2007 ....4-2
exhibit 10 Family Functioning-Distribution of Expenditures by Service Category for Fiscal Year 2006-2007 ...............................................................................................................4-3
exhibit 11 Family Functioning-Expenditures by Provider and Service Category for Fiscal Year 2006-2007 ...............................................................................................................4-4
exhibit 12 Child Development-Number of Services Provided to Children Ages 0 to 5 by Service Category for Fiscal Year 2006-2007 ........................................................................4-5
exhibit 13 Child Development-Number of Services Provided to Parents, Guardians, Primary Caregivers, Relatives, and Providers by Service Category for Fiscal Year 2006-2007 ............4-6
exhibit 14 Child Development-Services Provided to Children Ages 0 to 5 by Ethnicity for Fiscal Year 2006-2007 .........................................................................................................4-6
exhibit 15 Child Development-Distribution of Expenditures by Service Category for Fiscal Year 2006-2007 ............................................................................................................... 4-7
exhibit 16 Child Development-Expenditures by Provider and Service Category for Fiscal Year 2006-2007 .........................................................................................................................4-8
exhibit 17 Child Health-Number of Services Provided to Children Ages 0 to 5 by Service Category for Fiscal Year 2006-2007 ....................................................................................... 4-10
exhibit 18 Child Health-Number of Services Provided to Parents, Guardians, Primary Caregivers, Relatives, and Providers by Service Category for Fiscal Year 2006-2007 ..............................4-11
exhibit 19 Child Health-Services Provided to Children Ages 0 to 5 by Ethnicity for Fiscal Year 2006-2007 ............................................................................................................. 4-12
exhibit 20 Child Health-Distribution of Expenditures by Service Category for Fiscal Year 2006-2007 ... 4-12
exhibit 21 Child Health-Expenditures by Provider and Service Category for Fiscal Year 2006-2007 ... 4-13
exhibit 22 Systems of Care-Expenditures by Service Category for Fiscal Year 2006-2007 .................... 4-14
List of Exhibits

AnnuAl RepoRt 2006-2007 1–1
HistoRyProposition 10, also known as the California Children and Families Act of 1998 (the Act) led to the creation of the First 5 California Children and Families Commission (First 5 California). The key purposes of First 5 California are promoting, supporting and improving the early development of children from prenatal to five years of age. The Act specifies that these purposes shall be accomplished through the establishment, institution and coordination of appropriate standards, resources, and integrated and comprehensive programs emphasizing community awareness, education, nurturing, child care, social services, health care, and research.
The Act also authorizes county commissions and sets forth the requirement that each county commission develop a local strategic plan. The Act empowers First 5 California to prepare guidelines to assist county commissions in the formation and execution of their strategic plans.
The Governor, Speaker of the Assembly and Senate Rules Committee appoint the seven voting Commission members, with the Governor appointing the Chairperson and two other members, and the Speaker and Senate Rules each appointing two members. Exhibit 1 shows the First 5 California Commission members.
The Commission hires the First 5 California Executive Director. The current Executive Director is Kris Perry, who has served in this capacity since July 2005.
FiRst 5 County CommissionsEach county commission consists of members appointed by the county board of supervisors. The county commissions include one member from the
Exhibit 1: First 5 California Commission members
county’s board of supervisors and two members from among county health officers and local government health-related service agencies.1 The county board of supervisors appoints the remaining members from either the previously mentioned (non-board) organi-zations or from other county organizations that have valuable early childhood development experience.
1 Pursuant to California Health and Safety Code section 130140, members shall also include persons responsible for county functions such as: children’s services, public health services, behavioral health services, social services, and tobacco and other health substance abuse prevention and treatment services.
Commission member Appointing power
Hector Ramirez, Chair Governor
David Kears, Vice Chair Governor
Maria Minon, M.D. Governor
Donald Attore Speaker of the Assembly
Molly Munger Speaker of the Assembly
Carla Dartis Senate Rules Committee
Eleni Tsakopoulos-Kounalakis Senate Rules Committee
ex officio members
S. Kimberly BelshéSecretary of the California Health and Human Services Agency
David Long California Secretary of Education
1 First 5 California Overview

1–2 AnnuAl RepoRt 2006-2007
Vision, mission And GoAlsIn 2007, First 5 California adopted a new strategic plan. First 5 California’s mission, by 2012, is to be recognized as California’s unequivocal voice for children 0 to 5 to ensure greater equity in their readiness for school. This mission supports the vision that all children in California enter school ready to achieve their greatest potential.
In support of its mission and vision, First 5 California has five strategic goals:
Goal 1: Focus on Policy Development■■ Implement a comprehensive policy agenda that elevates the needs of children 0 to 5.
Goal 2: Invest in Program Development■■ Establish and maintain a distinctive set of sustainable health and education programs for children 0 to 5.
Goal 3: Broaden Public Awareness■■ Build recognition and generate support for the needs of children 0 to 5.
Goal 4: Enhance Research and Evaluation■■ Assess the value of programs for children 0 to 5.
Goal 5: Strengthen Organizational ■■
Operations and Systems Provide quality and cost-effective services to our partners.
FundinGRevenue to fund First 5 California and First 5 county commission activities comes from the Proposition 10 excise tax levied on cigarettes and other tobacco products. The State Board of Equalization collects tobacco tax revenue and deposits it into the California Children and Families Trust Fund. Pursuant to the formula set forth in Proposition 10, 20 percent of these funds are allocated and appropriated to First 5 California and 80 percent to the 58 county com-missions. In Fiscal Year (FY) 2006-2007, First 5 California received $116 million.
In accordance with Proposition 10, the state com-mission funds are allocated and appropriated to the following accounts:
Six percent into the Mass Media ■■
Communications Account
Five percent into the Education Account■■
Three percent into the Child Care Account■■
Three percent into the Research and ■■
Development Account
Two percent into the Unallocated Account■■
One percent into the Administration Account■■
County commissions receive the portion of the total funds available to all county commissions equal to the percentage of the number of births recorded in the relevant county (for the most recent reporting period) in proportion to the entire number of births recorded in California (for the same period).
The county commission funds support the activities of the 58 First 5 county commissions. These com-missions, in turn, fund local family functioning, child development, child health, and systems of care programs and services.
Audit FindinGsAt the close of FY 2006-2007, First 5 California con-tracted with the California Department of Finance (DOF), Office of State Audits and Evaluations, to perform a fiscal audit of First 5 California for that time period. In November 2007, DOF submitted its final Audit Report on the Children and Families Trust Fund and Related Funds. The DOF reflects no negative findings.
oVeRView oF tHis RepoRtChapter 2, First 5 California Services, specifies how First 5 California used its FY 2006-2007 allocation to support First 5 California administration, public education and outreach, and research and evaluation.

1–3
CHAPTER 1 FiRST 5 CALiFoRniA oVERViEw
AnnuAl RepoRt 2006-2007
Chapter 3, First 5 California Programs, provides information about the following First 5 California programs: School Readiness, Power of Preschool, the Special Needs Project, Comprehensive Approaches to Raising Educational Standards, Health Access, A Place of Our Own and Los Niños en Su Casa, the Migrant and Seasonal Farm Workers Project: Migrant Education Even Start and La Union del Pueblo Entero, the Kit for New Parents, First Smiles, Low Income Investment Fund Constructing Connections, and the California Smokers’ Helpline.
Chapter 4, First 5 County Commission Program Focus Areas, provides data on the services provided by county commissions, mapped to four focus areas: family functioning, child development, child health, and systems of care.
FisCAl yeAR 2006-2007 HiGHliGHtsFirst 5 California and the 58 First 5 county commis-sions provided 1.4 million family functioning, child development, child health and systems of care ser-vices to children ages 0 to 5 and more than 1.4 million services to parents, relatives and primary caregivers in FY 2006-2007.2 Latinos and English-language learners received the majority of services. First 5 California and First 5 county commissions lever-aged funds with a variety of partners to maximize the impact of programs designed to ensure children’s readiness for school. Evaluation results demonstrate that First 5 programs are having a positive impact.
Nearly 380,000 family functioning services were provided to children ages 0 to 5 and more than 420,000 services were provided to other participants in FY 2006-2007. The majority of these services for children were related to the provision of basic family needs. Resource and referral services were most commonly received by parents. A sample of evalua-tion results shows programs are successful in terms of more mothers receiving assistance for maternal depression and parent education programs. In addition, participants indicated they gained meaningful parent knowledge.
2 First 5 Glenn County did not report data related to family functioning, child development, children’s health, or systems of care. Thus, the values reported in the text of this section do not include these data.
Child development services to children ages 0 to 5 totaled nearly 430,000 and other participants received approximately 400,000 services. Sixty percent of services for children and 72 percent of services for adults were related to preschool. A variety of tools were used to assess the impact of preschool programs. While evaluation results vary, the consistent theme is that children who participate in these programs demonstrate performance gains in multiple domains (e.g., personal, cognitive and motor development).
First 5 California and First 5 county commissions provided over 570,000 child health services to children ages 0 to 5 and more than 600,000 services were provided to other participants. Sixty percent of services to children were related to health access or oral health. Twenty-seven percent of services to other participants were related to health access. A sample of evaluation results shows that these programs are making a meaningful difference. Oral health evaluation results show year-to-year decreases in the number of participants with cavities. Health Access evaluation results show that participants are more likely to have one place they usually go for medical care.
Systems of care programs impact all those served through family functioning, child development and child health programs. Evaluation results show that these types of programs strengthen links between children with special needs and critical services.
FY 2006-2007 has been a successful year for First 5 California and the county commission partners, with services reaching California’s neediest populations, helping prepare all children to enter kindergarten ready to learn and succeed.


AnnuAl RepoRt 2006-2007 2–1
Pursuant to the California Children and Families Act of 1998, First 5 California uses its funding allocation to support administration, public education and outreach, research and evaluation, and statewide programs. This chapter provides an overview of these services and Chapter 3 contains an overview of statewide programs.
AdministRAtionThe Administrative Services Division provides staff resources to strengthen First 5 California’s operations and systems through oversight and coordination of:
Fiscal management of the California Children ■■
and Families Trust Fund
Tax revenue disbursements to county commissions■■
Procurement and contract management■■
Workforce recruitment and development■■
Information technology■■
Audits and annual fiscal reports■■
Business services■■
The Administrative Services Division administers these programs consistent with all applicable state and federal laws, rules and regulations.
public educAtion And outReAchConsistent with the California Children and Families Act of 1998, First 5 California devotes six percent of its Proposition 10 revenue to public education and outreach campaigns targeting California parents and
caregivers, as well as the general public, with impor-tant messages about early childhood development, the informed selection of child care, health and social services, the prevention of tobacco, alcohol and drug use by pregnant women and the detrimental effects of secondhand smoke.
Throughout FY 2006-2007, First 5 California con-tinued to raise awareness of the importance of early childhood development and its impact on a child’s future success. First 5 California generated more than 116 million earned media impressions and 296 million advertising impressions.
Highlights for FY 2006-2007: First 5 California launched the revised Kit for New Parents with a press event featuring Lisa Leslie of the Los Angeles Sparks and media efforts during Mother’s Day and Father’s Day which garnered more than 2.2 million media impressions in English and more than 7.7 million media impressions nationwide in Spanish. CNN highlighted the Childhood Obesity Prevention campaign in the Asian Pacific Islander American (APIA) community during a segment heralding First 5 California as a national leader in fighting child-hood obesity. Additional efforts included a radio news release to inform parents about the benefits of making healthy choices for their children; these releases reached nearly 4 million listeners statewide.
In 2007, First 5 California created the Leading Ladies for School Readiness Program, through a historic partnership with the California Association of Ministers’ Wives and Ministers’ Widows. Women who play a leadership role within their church serve as local advocates, helping ensure parents and care-givers prepare their children to enter school ready to learn and succeed in life. First 5 California’s partnership with the Spanish-language television
First 5 California Services2

2–2 AnnuAl RepoRt 2006-2007
ReseARch And evAluAtion The California Children and Families Act directs First 5 California to conduct:
[I]ndependent research, including the evalua-tion of any relevant programs, to identify the best standards and practices for optimal early childhood development, and establishing and monitoring demonstration projects.
During FY 2006-2007, First 5 California produced four publications: First 5 School Readiness Program Evaluation: Kindergarten Entry Profiles (KEP) in fall 2006, First 5 California Annual Report, Fiscal Year 2005-2006 in January 2007, Evaluation of the First 5 California Children of Migrant and Seasonal Farm Workers Project: Migrant Education Even Start Component in January 2007, and Characteristics Associated with Early Identification of Special Needs in California in March 2007. This section highlights findings from each of these publications.
The First 5 School Readiness Program Evaluation: KEP represents a snapshot of children’s develop-mental competence based on the National Education Goals Panel’s definition of school readiness at kindergarten entry. Evaluation results indicate that children’s health, early childhood education program participation, family literacy activities, and parenting support services all improve children’s school readiness.
The First 5 California Annual Report, Fiscal Year 2005-2006 provided an overview of:
First 5 California’s history and operations■■
Program outcomes■■
County commission activities■■
network Univision led to 22 news segments reaching 9.4 million viewers with information on special needs and disabilities, obesity prevention, school readiness, and child care, among other issues. In June 2006, First 5 California launched the Hands-On Health mobile exhibit as a grassroots, interactive effort to address key health issues facing children ages 0 to 5. The exhibit visited family-friendly destinations across California to raise awareness of issues ranging from childhood obesity and prenatal care to oral health and immunizations. Since its inception, the exhibit has visited 111 events in approximately 100 cities, reaching more than 165,000 Californians.
First 5 California’s advertising campaign for FY 2006-2007 addressed pediatric obesity preven-tion, school readiness (preschool and parenting) and smoking cessation. Advertising ran in every California media market targeting the general, Latino and APIA communities.
The general market television campaign reached 91 percent of target audiences (ages 18 to 34) 26 times over three months. In the Latino community, the ads reached an average of 62 percent of the target audiences 19 times. First 5 California’s radio ads reached an average of 62 percent of the general market target audience 11 times over three months. The Latino radio campaign reached 51 percent of the target audience 16 times over the course of 12 weeks.
The outdoor campaign, which ran for six months, targeted local communities most at risk for childhood obesity. The effort included over 1,191 billboards, 1,098 buses, and 3,950 interior bus advertisements, delivering 282 million monthly gross impressions. First 5 California also ran radio, print and outdoor advertisements targeting the APIA community on the dangers of smoking around young children.

2–3
CHAPTER 2 FiRsT 5 CAliFoRniA sERviCEs
AnnuAl RepoRt 2006-2007
The proper and prompt identification of children with special needs, coupled with an appropriate course of treatment and education plan, is essential to the academic progress of these children. The study identifies the following subpopulations as vulnerable to late diagnosis and suggests targeting these populations for early intervention:
Girls■■
African Americans■■
English Learners■■
Children in small or rural districts■■
Districts with a high percentage of Latino ■■
students
The Evaluation of the First 5 California Children of Migrant and Seasonal Farm Workers Project: Migrant Education Even Start Component relies on Brigance Developmental Screens to assess participants’ general knowledge and comprehension, speech and language, gross motor skills, fine motor skills, and rote counting. Evaluation results show:
A 30 percent decrease, after receiving services, ■■
in the number of participants scoring at risk of developmental or academic delay
Participants scoring significantly higher than ■■
their cohorts who did not receive services
The report on Characteristics Associated with Early Identification of Special Needs in California provides information on patterns of special needs diagnoses. The study found that children with:
Speech impairments and autism tend to be ■■
diagnosed earlier than children with other special needs
Specific learning disabilities tend to be ■■
diagnosed in kindergarten
Emotional disturbances tend to be diagnosed ■■
during adolescence and high school


AnnuAl RepoRt 2006-2007 3–1
School ReAdineSSThe objective of the School Readiness (SR) Program is to improve the ability of families, schools and com-munities to prepare children to enter school ready to learn. While counties design their programs to fit their specific needs, they must provide services in each of the following four focus areas:
Family Functioning■■
Child Development■■
Child Health■■
Systems of Care■■
First 5 California Programs3
SR programs target children ages 0 to 5 and their families. These programs focus on children in schools with an Academic Performance Index (API) score in the lowest third decile statewide, including children of diverse languages and cultures. In FY 2006-2007, First 5 California funded more than 200 SR programs across 57 counties.1
SR programs statewide provided 370,680 services to individual California residents in FY 2006-2007. In FY 2006-2007, children received 196,905 services: 60,374 child health services; 73,523 child development services; and 63,008 family functioning services. While children and adults from all ethnic groups received services, for those reporting an ethnicity, Latinos were the largest recipient group (see Exhibit 2).
The percentages in this chart may not add to 100 due to rounding.
1 The following is a list of the participating counties and the number of SR programs in each county: Alameda (1), Amador (1), Alpine (1), Butte (1), Calaveras (1), Colusa (1), Contra Costa (3), Del Norte (1), El Dorado (1), Fresno (11), Glenn (1), Humboldt (1), Imperial (1), Inyo (1), Kern (11), Kings (4), Lake (1), Lassen (1), Los Angeles (42), Madera (1), Marin (1), Mariposa (1), Mendocino (1), Merced (8), Modoc (1), Mono (1), Monterey (3), Napa (1), Nevada (1), Orange (13), Plumas (1), Riverside (6), Sacramento (7), San Benito (1), San Bernardino (12), San Diego (8), San Francisco (1), San Joaquin (7), San Luis Obispo (1), San Mateo (1), Santa Barbara (5), Santa Clara (1), Santa Cruz (1), Shasta (1), Sierra (1), Siskiyou (1), Solano (4), Sonoma (1), Stanislaus (7), Sutter (1), Tehama (1), Trinity (1), Tulare (12), Tuolumne (1), Ventura (4), Yolo (2), and Yuba (1).
Latino 75%
White 11%
African American 5%
Other 2%
Asian 4%
Multiracial 2%
Pacific Islander < 1%
Native American 1%
Exhibit 2: School Readiness-ethnicity of children Served by School Readiness programs for Fiscal Year 2006-2007
3–2 AnnuAl RepoRt 2006-2007
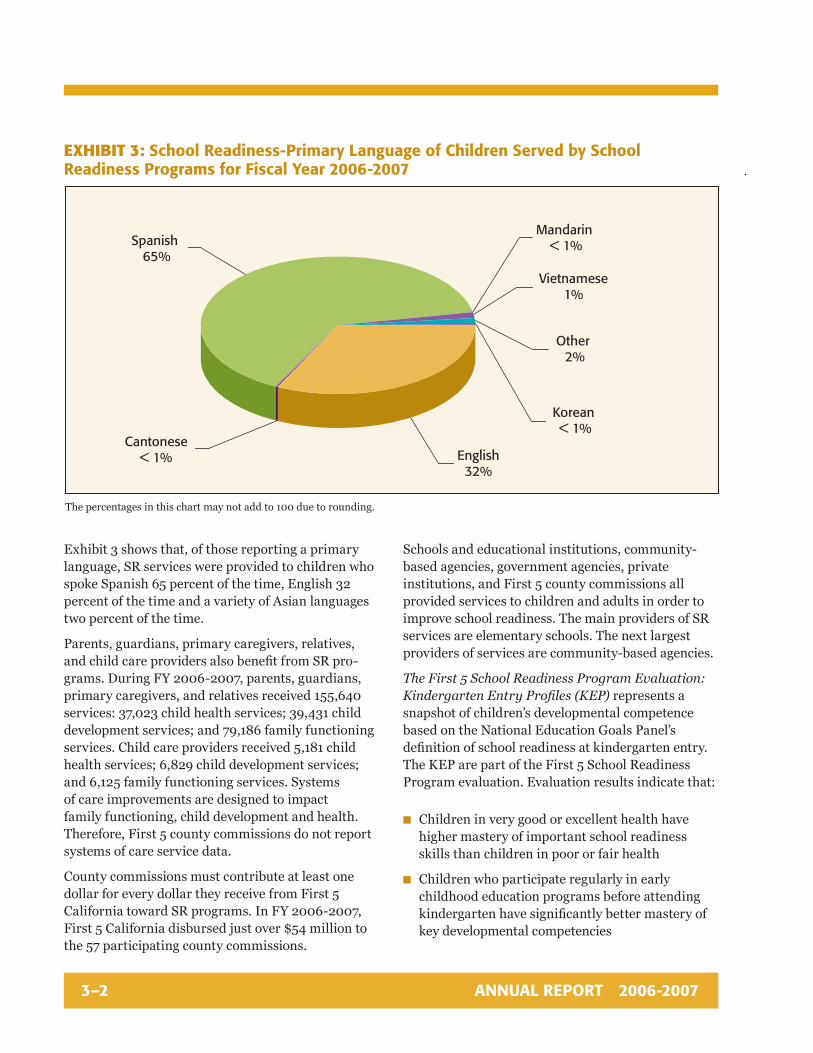
Exhibit 3 shows that, of those reporting a primary language, SR services were provided to children who spoke Spanish 65 percent of the time, English 32 percent of the time and a variety of Asian languages two percent of the time.
Parents, guardians, primary caregivers, relatives, and child care providers also benefit from SR pro-grams. During FY 2006-2007, parents, guardians, primary caregivers, and relatives received 155,640 services: 37,023 child health services; 39,431 child development services; and 79,186 family functioning services. Child care providers received 5,181 child health services; 6,829 child development services; and 6,125 family functioning services. Systems of care improvements are designed to impact family functioning, child development and health. Therefore, First 5 county commissions do not report systems of care service data.
County commissions must contribute at least one dollar for every dollar they receive from First 5 California toward SR programs. In FY 2006-2007, First 5 California disbursed just over $54 million to the 57 participating county commissions.
Schools and educational institutions, community-based agencies, government agencies, private institutions, and First 5 county commissions all provided services to children and adults in order to improve school readiness. The main providers of SR services are elementary schools. The next largest providers of services are community-based agencies.
The First 5 School Readiness Program Evaluation: Kindergarten Entry Profiles (KEP) represents a snapshot of children’s developmental competence based on the National Education Goals Panel’s definition of school readiness at kindergarten entry. The KEP are part of the First 5 School Readiness Program evaluation. Evaluation results indicate that:
Children in very good or excellent health have ■■
higher mastery of important school readiness skills than children in poor or fair health
Children who participate regularly in early ■■
childhood education programs before attending kindergarten have significantly better mastery of key developmental competencies
Exhibit 3: School Readiness-primary language of children Served by School Readiness programs for Fiscal Year 2006-2007
The percentages in this chart may not add to 100 due to rounding.
Spanish 65%
Cantonese< 1% English
32%
Korean < 1%
Vietnamese1%
Other 2%
Mandarin < 1%

3–3
CHAPTER 3 FiRsT 5 CAliFoRniA PRogRAms
AnnuAl RepoRt 2006-2007
Children whose families regularly engage in ■■
literacy activities (reading, singing or storytelling three or more times per week) have significantly better mastery of developmental competencies
Parenting education and support services promote ■■
activities that lead to increased school readiness
First 5 Stanislaus County’s Longitudinal Study of School Readiness Programs shows that these pro-grams have a positive effect on the lives of children. Specifically, these county level data show that SR programs impact kindergarten readiness, literacy skills and social skills. When measuring kinder-garten readiness, the proportion of children at or above standard competency levels increased at least 20 percent for most groups of children.
poweR oF pReSchoolThe objective of Power of Preschool (PoP) is to provide a voluntary, high-quality, part-day preschool program that assists children in becoming personally, socially and physically competent, effective learners, and ready to transition into kindergarten and the elementary grades. PoP demonstration projects pro-vide the blueprint for making high-quality preschool more accessible to all children and their families.
With a focus on developing preschool in underserved and high-priority communities, the PoP program seeks to make quality preschool available to all four-year old children in California, including children with special needs and English-language learners. First 5 California funds nine demonstration projects in nine counties.2
In FY 2006-2007, PoP demonstration projects served 5,165 children. Since its inception in FY 2005-2006, PoP has served 7,288 participants. In FY 2006-2007, First 5 California expended $1.4 million to fund the PoP program.
First 5 California reimburses counties based on teacher qualifications and the number of children served. This program is unique in that it is the only
2 PoP programs operate in the following counties: Los Angeles, Merced, San Diego, San Francisco, San Joaquin, San Mateo, Santa Clara, Ventura, and Yolo.
state-funded program that reimburses based on teacher qualifications. Counties may combine First 5 California funding with other state, federal, county, or private funding.
First 5 California encourages PoP demonstration projects to provide preschool through a diverse delivery system. In FY 2006-2007, PoP demonstration projects used the following provider types:
89 percent through state preschools ■■
67 percent through Head Start■■
56 percent school-based, private, nonprofit, and ■■
family child care homes
Through the PoP program, the children received:
Health and developmental screenings, ■■
assessments and follow-ups
School readiness curricula ■■
Nutritious meals and snacks ■■
Transition support for those entering preschool ■■
or kindergarten
Family partnerships and support services■■
Preliminary data from the implementation phase indicates PoP:
Preschools are high quality – classroom environ-■■
mental assessments rate an average of 5.6 out of a possible score of seven
Teachers are well qualified – 44 percent are ■■
Master Teachers with Bachelor’s degrees in early childhood education
Children are better prepared to be successful in ■■
kindergarten and early elementary grades – post-program assessments indicate that participating children increased their proficiency in the following domains: personal and social competence, effective learning, physical and motor competence, and safety and health

3–4 AnnuAl RepoRt 2006-2007
SpeciAl needS pRoject The objective of the Special Needs Project (SNP) is to improve the school readiness of children with dis-abilities and other special needs by improving early identification, and demonstrating and disseminating best practices for serving these children and their families. The SNP seeks to provide universal access to screening for physical and developmental issues, improve the coordination of resources to serve chil-dren with special needs, and include young children with disabilities and other special needs in child care and other community settings with appropriate supports to help the child succeed.
The SNP targets children and families from First 5 SR program sites in 10 counties.3 SR sites are in communities with schools scoring in the lowest third decile of the API statewide. This at-risk population often receives screenings later than other children. The SNP seeks to identify children with special needs in these communities as early as possible.
County commissions must contribute at least one dollar for every First 5 California dollar they receive for the SNP. First 5 California expended $2.3 million to support the SNP in FY 2006-2007. In FY 2006-2007, the SNP demonstration sites screened just more than 4,000 children. Approximately 40 percent of the children screened were under age three, 70 percent were Latino and 70 percent spoke Spanish at home.
The SNP sites allocate their funds to an array of ser-vices, including screening children to identify those with special needs or at-risk of developing special needs, referral of children with special needs or risk factors for services as appropriate, and coordination of services.
The SNP sites work with partner agencies to create and implement a comprehensive screening, assess-ment and referral system. Examples of partner agencies include early care and education agencies, community-based organizations, public health
3 The following counties have SNP demonstration sites: El Dorado, Los Angeles, Mendocino, Merced, Monterey, Orange, Riverside, San Diego, San Francisco, and Sonoma.
departments, regional centers, early intervention agencies and providers, school district and county offices of education, special education departments, and medical providers.
The SNP sites use a comprehensive protocol con-sisting of a health screening and three developmental screening instruments:
Ages and Stages Questionnaire (ASQ) ■■
ASQ: Social-Emotional■■
Parenting Stress Index – Short Form■■
Child Study Teams at each site interpret and analyze the children’s and families’ scores on the develop-mental and health screening tools to determine if they have developmental delays or risk factors for developmental delays.
compRehenSive AppRoAcheS to RAiSing educAtionAl StAndARdS Comprehensive Approaches to Raising Educational Standards (CARES) encourages education and stability in the Early Care and Education (ECE) work-force through incentives and supports to increase the educational level of family child care providers and center-based teaching staff and directors.
The program targets ECE staff, including home-based, licensed and license-exempt Family Child Care (FCC) providers, FCC assistants, and center-based staff in public and private child care programs in California. CARES gives priority to participants from SR communities, as well as areas with a low supply of licensed child care providers or facilities.
First 5 California selected these target populations because research demonstrates that a high percentage of children under five are in non-parental care while parents are at work. Research further suggests that teachers with specialized training in child develop-ment or those with Bachelor’s degrees provide young children with the best preparation to succeed.
Local programs provide training and support to caregivers along a continuum of care, which

3–5
CHAPTER 3 FiRsT 5 CAliFoRniA PRogRAms
AnnuAl RepoRt 2006-2007
includes the following five tracks: Family, Friend and Neighbor (FFN), Entry, Permit, Degree, and Professional. Participants can advance in tracks based on licensing, level of education and previous CARES progress. Exhibit 4 illustrates the distribution of CARES participants, by track in FY 2006-2007. A key component of the CARES program is the provision of stipends and incentives to CARES participants to pursue education and training along this continuum.
In FY 2006-2007, 44 counties participated in the CARES program.4 CARES provided services to 9,147 caregivers seeking to further their child development education. Participants in these programs improve their education by Degree Tracks, with the largest
4 The following counties administer CARES programs: Alameda, Amador, Butte, Calaveras, Contra Costa, El Dorado, Glenn, Humboldt, Kings, Lake, Lassen, Madera, Marin, Mendocino, Merced, Modoc, Mono, Monterey, Napa, Nevada, Placer, Plumas, Riverside, Sacramento, San Benito, San Diego, San Francisco, San Joaquin, San Mateo, Santa Barbara, Santa Clara, Santa Cruz, Shasta, Sierra, Siskiyou, Solano, Sonoma, Stanislaus, Tehama, Trinity, Tuolumne, Ventura, Yolo, and Yuba.
number of these individuals being in the Permit Track (4,394).
County commissions contribute two or four dollars for every First 5 California dollar they receive for the CARES program. First 5 California expended $7 million to support CARES in FY 2006-2007.
First 5 California’s 2004 evaluation of CARES found 96 percent of participants still working in the ECE field 12 months after joining the program and 93 percent remaining 18 months later. The evaluation also found that CARES participants have an 81 percent center retention rate. In contrast, a review of relevant literature suggests that nationally, center retention is approximately 70 percent per year.
According to the FY 2005-2006 evaluation sum-mary, in the 15 counties that encourage FFNs to pursue licensure, 63 FFNs obtained a Family Child Care License from the Department of Social Services’ Community Care Licensing Division. During FY 2006-2007, 224 providers earned an Associate’s degree, 80 obtained a Bachelor’s degree and 25 obtained a graduate degree.
Exhibit 4: comprehensive Approaches to Raising educational Standards-distribution of caregivers by training track for Fiscal Year 2006-2007
Entry Track 1,167 (13%)
Permit Track 4,394 (47%)
Family, Friend and Neighbor Track
1,256 (14%)
Professional Track 1,342 (15%)
Degree Track 988
(11%)
3–6 AnnuAl RepoRt 2006-2007
heAlth AcceSSThe objective of Health Access is to ensure that all children in California are insured and have access to quality medical, dental and vision care services. First 5 California provides funds to assist with the insurance premiums for Healthy Kids, an expanded health insurance program administered by county coalitions known as Children’s Health Initiatives (CHIs).
Health Access targets children who are ineligible for Medi-Cal and Healthy Families, and who have a family income at or below 300 percent of the Federal Poverty Level, regardless of immigration status.
In FY 2006-2007, 23 counties participated5 and Healthy Kids provided 14,217 children ages 0 to 5 with health insurance. County commissions must contribute at least four dollars for every First 5 California dollar they receive for the Health Access project. First 5 California provided $3 million to support Health Access in FY 2006-2007.
Santa Clara and Los Angeles county evaluations indicate that the Healthy Kids program is having a positive effect on children’s access to care. The evalu-ations show a high level of enrollees ages zero to 18 who have one place where they usually go for medical care. Eighty-nine percent of enrollees in Santa Clara County and 91 percent of enrollees in Los Angeles County had a usual source of care. In contrast, the Santa Clara evaluation found only 49 percent of Healthy Kids enrollees had one place where they usually went for medical care prior to enrolling in Healthy Kids.
5 The Health Access program operates in the following counties: Alameda, Colusa, El Dorado, Fresno, Kern, Los Angeles, Merced, Napa, Riverside, Sacramento, San Bernardino, San Francisco, San Joaquin, San Luis Obispo, San Mateo, Santa Barbara, Santa Clara, Santa Cruz, Solano, Sonoma, Tulare, Yolo, and Yuba.
A PlAce of our own And los niños en su cAsAFirst 5 California sponsors two daily public broad-casting television shows, A Place of Our Own and Los Niños en Su Casa, that provide early learning teaching strategies and child development information for home-based providers using curriculum-based materials. The objectives of the programs are to improve child care providers’ knowledge and practices in providing nurturing and stimulating environments for the children in their care and to improve their understanding of the important role they play in the development of children.
The program targets home-based child care pro-viders, including licensed caregivers, non-licensed caregivers and parents. KCET developed the program utilizing a culturally and regionally diverse team of advisors. First 5 California staff provided feedback and direction during the development and produc-tion. Advisors were experts from all disciplines of early childhood development including early literacy, special needs, pediatrics, learning, and play. Advisors also provided expertise related to speaking Spanish, diversity in the media and adult literacy. Focus groups were used to refine production ideas and content. Their recommendations reflect the best practices for delivering education to home-based caregivers.
During season three, October 1, 2006 through September 30, 2007, the series reached more than 3 million households or 6.6 million viewers state-wide. In addition, community outreach workshops have reached 1,736 child care providers and 8,500 children. First 5 California provided $3.5 million to support KCET in FY 2006-2007.
In association with producing partners 44 Blue and Sesame Workshop, KCET is producing 60 episodes in English and 60 episodes in Spanish. Comprehensive Web sites in English and Spanish, print and DVD materials, and multilingual educational workshops also support the series.

3–7
CHAPTER 3 FiRsT 5 CAliFoRniA PRogRAms
AnnuAl RepoRt 2006-2007
The programs reach diverse audiences. Forty-nine percent of the viewers of A Place of Our Own and 64 percent of the viewers of Los Niños en Su Casa have household incomes of less than $40,000. A Place of Our Own has a 44 percent Latino and 15 percent African American viewing audience, compared to Los Niños en Su Casa, with 77 percent Latino viewers and 13 percent African American viewers. Thirty-five percent of A Place of Our Own viewers have a high school degree or less and 56 percent of the viewers of Los Niños en Su Casa have a high school degree or less.
A season two evaluation assessed the impact of the series on child care providers and parents. Exhibit 5 depicts these evaluation results. Respondents
reported the following changes after viewing the series:
Increased knowledge in each of the 12 topic areas ■■
covered
Changes in the way they think about caring for ■■
children
Positive changes in their approaches to discipline, ■■
food purchases and use of cleaning products
Increased sensitivity to the needs of the children ■■
in their care
Child care providers and parents also reported that the series provided valuable information and that they would recommend the series to others.
Exhibit 5: percent of providers who “Know more” After viewing A Place of our own or los niños en su casa, by topic Area
0%
10%
20%
30%
40%
50%
60%
70%
80%
90%
100%
Diabete
s and
child
ren Manag
ing
asthma
Identify
ing
spec
ial nee
ds
Early
math
Enco
urag
ing
literac
y
Dramati
c play
Develo
pmen
tal
mile
stone
s Read
ing
Posit
ive d
iscipl
ine
strate
gies
Ident
ifying
a go
od
pres
choo
l
Good
eatin
g
habit
s
Amou
nt o
f
phys
ical a
ctivit
y
Know much more than before
Know a little more than before
70%63% 60% 60% 58% 60%
54% 53% 53% 56%50% 53%
21%26% 28% 28% 29% 27%
32% 32% 30% 25%26% 23%

3–8 AnnuAl RepoRt 2006-2007
migRAnt And SeASonAl FARm woRKeRS pRoject: migRAnt educAtion even StARt And lA union del Pueblo entero The objective of the Migrant Education Even Start (MEES) program is to ensure that migrant students have the opportunity to meet California’s challenging educational standards. MEES provides parenting skills and early childhood education services through both home-and center-based programs. La Union del Pueblo Entero (LUPE) uses door-to-door outreach to link families to MEES and promote basic parenting concepts to families in hard-to-reach labor camps and rural indigenous communities.
Both MEES and LUPE target migrant farm worker families with children ages zero to seven. Due to these families’ migrant work and lifestyles, their children might otherwise go without preschool services and their parents might not receive parental education services.
In FY 2006-2007, MEES programs operated within migrant communities in 46 counties and provided services to more than 14,000 children and parents. As of January 2007, enrollment had reached 7,224 children and parents, exceeding First 5 California’s goal of 4,700 by 54 percent. First 5 California expended $2.5 million to support MEES and LUPE in FY 2006-2007.
In FY 2006-2007, MEES established 99 new project sites statewide, augmented hours of service by 30 percent statewide and increased enrollment of parents as well as children. English language development, literacy and general education were provided to 2,350 parents in coordination with other agencies, and an additional 3,800 parents learned parenting skills and parent-child interactive activities. Nearly three in four of the children served received home-based versus center-based services, although the goal is to increase center-based participation. Currently, 33 percent of the children served receive site-based services. MEES expanded transportation services in isolated rural areas through local transportation providers, with approximately 4,000 parents and
over 4,000 children receiving transportation in FY 2006-2007.
In October 2007, a final MEES evaluation showed:
Pre- to post-program developmental screening ■■
scores increased from 60.9 to 81.5 percent
Pre- to post-program at-risk developmental ■■
screening scores decreased from 74 to 44 percent
Participants scored higher than their same-age ■■
comparison counterparts both in average score and in the “at-risk” category
Kit for new PArents The objective of the Kit for New Parents (KIT) is to provide expecting parents, parents with children ages 0 to 5 and children’s caregivers with a resource to improve their parenting skills and enhance their understanding of children’s needs. The Kit is a comprehensive educational resource designed to ensure that children are healthy and ready to thrive on their first day of school. Currently, the Kit for New Parents is available in English and Spanish.
The Kit targets expecting parents, parents with children ages 0 to 5 and children’s caregivers. These individuals are the most influential in shaping the lives of young children and are respon-sible for decisions concerning the child. The Kit is designed to empower parents with evidence-based child care practices and enhance their ability to care for the child.
First 5 California distributes the Kit to each county based on its number of annual births. First 5 county commissions coordinate the distribution of the Kit. In FY 2006-2007, 58 counties distributed Kits to 269,331 individuals. English-speaking individuals may also request a Kit from First 5 California by calling 1-800-543-7025 and Spanish speakers may call 1-800-506-4667. These 800 numbers dispersed 10,973 Kits with 76 percent in English and 24 percent in Spanish in FY 2006-2007.

3–9
CHAPTER 3 FiRsT 5 CAliFoRniA PRogRAms
AnnuAl RepoRt 2006-2007
First 5 California expended $6.5 million to support the Kit in FY 2006-2007. First 5 California covers the cost of each basic Kit, which includes:
A celebrity-hosted DVD covering topics such as ■■
oral health, nutrition, child care, and safety and discipline; VHS tapes are also available upon request
A Parent’s Guide■■ filled with tips and up-to-date information on local resources and services
What to Do When Your Child Gets Sick■■ , an easy-to-read book that answers many questions parents have regarding their child’s health and common illnesses
Puppy and Friends■■ (Baby’s First Book), an inter-active reading experience for parents and children to enjoy together
Obesity Prevention■■ guides
Healthy Families■■ leaflet, Poison Control magnet, Healthy Teeth Begin at Birth brochure, and Paid Family Leave brochure
First 5 county commissions distribute the Kit through local providers and organizations. In addi-tion, some county commissions customize the Kit to meet local needs, adding items in addition to those listed above.
The most recent evaluation found that the majority of parents and caregivers who received the Kit indicated it changed their thinking or behavior in critical areas including:
Child safety practices (76 percent)■■
Ideas on how to help their baby learn (72 percent)■■
Tips for feeding their baby solid food (71 percent)■■
Breastfeeding tips (58 percent)■■
Additionally, the evaluation showed that mothers using the Kit demonstrated improved parenting skills and a greater understanding of their child’s needs.
FiRSt SmileSFirst Smiles consists of two components: training for dental and medical professionals and consumer educa-tion. The objective of these efforts is to improve the prevention, detection and treatment of dental disease in low-income children, including children with disabilities and other special needs.
First Smiles provides training and educational materials to medical and dental providers, as well as to child development professionals. In addition, First Smiles disseminates oral health educational materials through community-based organizations that have significant interaction with parents.
As of June 2007, 13,388 California dental and other healthcare providers attended a First Smiles training session. Participants were more racially diverse than the population of medical and dental providers statewide. Approximately 42 percent of these medical providers and 22 percent of the dental providers had offered services in SR areas. First 5 California expended $1.7 million to support First Smiles in FY 2006-2007.
The California Dental Association Foundation and Dental Health Foundation provide statewide education and training. These organizations provide in-person one-hour, two-hour and full-day training sessions. Providers host on-site trainings at offices, meetings and conferences. Providers can also participate in a home-study correspondence course or access online training through the First Smiles Web site at www.first5oralhealth.org.
A 2007 evaluation of First Smiles showed that of the more than 13,000 dental and health professionals who received training, the average participant “agreed” or “mostly agreed” that they learned new information or skills including:
The practice of medical providers referring patients ■■
to dentists and including oral health in assessments
General dentists’ skills in conducting exams to ■■
accommodate children with special needs and very young children
Communication with parents to provide guidance ■■
about their child’s oral health

3–10 AnnuAl RepoRt 2006-2007
low income inveStment Fund conStRucting connectionSThe objective of Low Income Investment Fund (LIIF) Constructing Connections is to build a comprehen-sive and sustainable financing and support system for child care facility development and to support the creation of 15,000 new child care spaces in California by 2010.
First 5 California funds the Constructing Connections component of the LIIF, which is respon-sible for increasing the local community’s capacity to develop child care spaces.
Constructing Connections coordinates and delivers technical assistance, training, resources and funds supporting all program components through 10 lead agencies in 11 counties.6 First 5 California funds Constructing Connections activities, which bring together child care providers, developers, civic leaders, small business leaders, educators, children’s advocates, and other stakeholders to plan for and support the development of child care spaces. The lead agencies provide in-person training and Web-based tools and guides to assist interested parties in the child care space development process.
A 2006 evaluation found that LIIF is leveraging up to $62.1 million in additional resources to support the creation or renovation of child care spaces. As of June 2007, LIIF has created 11,002 child care spaces, nearing the overall 2010 goal of 15,000 spaces. The evaluation also showed that Constructing Connections is building community support and engaging new stakeholders in the process of devel-oping child care facilities.
As of June 2006, Constructing Connections sites reported 234 active collaborative members and 8,549 child care spaces under development. First 5 California provided $1.4 million to support Constructing Connections in FY 2006-2007.
6 Constructing Connections operates in the following counties: Amador, Calaveras, Kern, Los Angeles, Merced, Orange, Riverside, Sacramento, Santa Barbara, Solano, and Ventura.
cAliFoRniA SmoKeRS’ helplineThe California Smokers’ Helpline is designed to help individuals and families quit smoking by pro-viding self-help materials, one-on-one counseling and referrals to other local resources.
The program assists callers to the 1-800-NO-BUTTS helpline. With First 5 California funds, the Helpline staff developed resources to encourage pregnant women, parents and caregivers of chil-dren to quit smoking. Tobacco use among pregnant women is the leading preventable cause of infant mortality, while secondhand smoke can result in lifelong health problems for children.
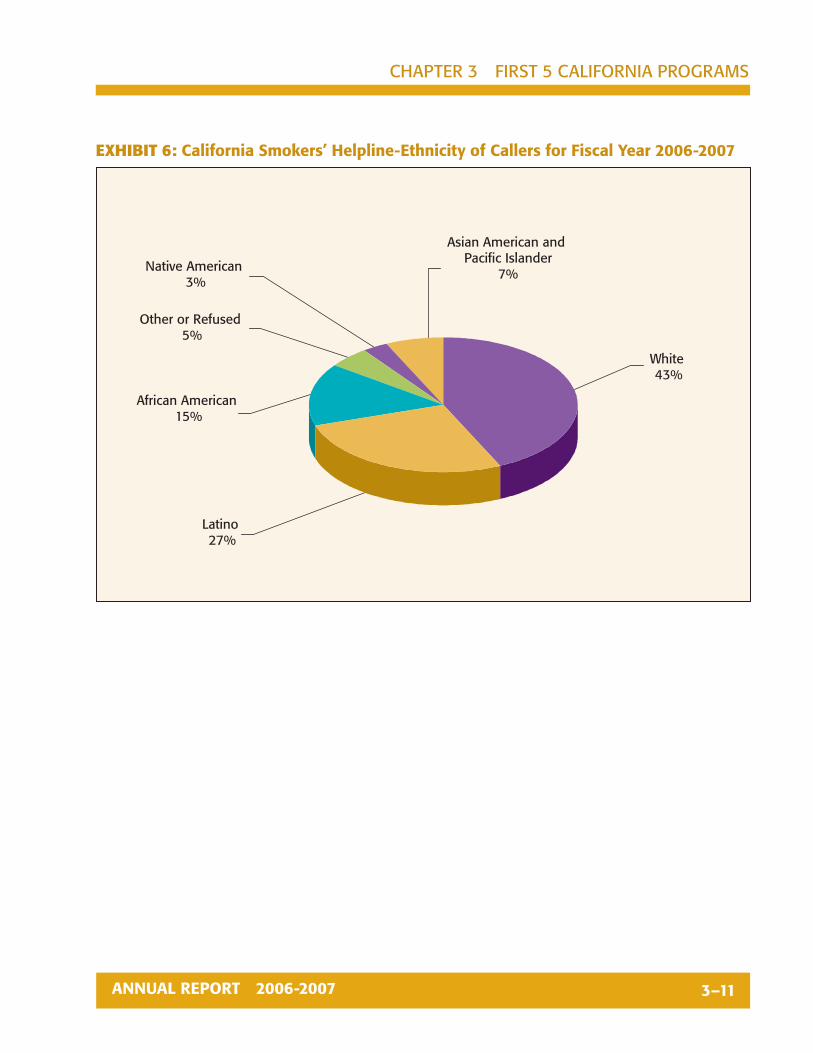
In FY 2006-2007, 31,698 people called the Helpline. About 20 percent of those callers represent the First 5 target population. Approximately 20 percent of the First 5 target population Hotline callers spoke a language other than English. Most non-English speakers spoke Spanish, while others spoke Cantonese, Korean, Mandarin or Vietnamese to pose questions. Exhibit 6 presents the ethnicity of Helpline callers.
The Smokers’ Helpline is a collaborative effort with the California Department of Public Health. The University of California at San Diego operates the Helpline. First 5 California provided $750,000 to support the Helpline in FY 2006-2007.
A 2006 evaluation of pregnant smokers assisted through the Helpline showed a significant demand for cessation services in this population. Furthermore, the pregnancy-specific telephone counseling protocol helped prevent relapse for the group of women in the counseling group more than the women in the self-help group. In other words, women in the counseling group who made a quit attempt were almost twice as likely to be successful as women in the self-help group.
3–11
CHAPTER 3 FiRsT 5 CAliFoRniA PRogRAms
AnnuAl RepoRt 2006-2007
Exhibit 6: california Smokers’ helpline-ethnicity of callers for Fiscal Year 2006-2007
White 43%
Latino 27%
African American 15%
Other or Refused 5%
Native American 3%
Asian American and Pacific Islander
7%


AnnuAl RepoRt 2006-2007 4–1
In 2005, the First 5 California State Commission adopted guidelines requiring counties to report data related to four areas: family functioning, child development, child health, and systems of care. This chapter includes data summarizing how First 5 county commissions spent their local and First 5 California funds in relation to these four focus areas.1
FAmily FunctioningFirst 5 county commissions fund the following services to help improve family functioning:
Adult education and literacy for parents■■
Kit for New Parents■■ distribution
Family literacy■■
General parenting education programs■■
Behavioral, substance abuse and other mental ■■
health services
Community resource and referral services■■
Provision of basic family needs (food, clothing ■■
and housing)
Targeted intensive parent support services ■■
Other family functioning support services■■
In FY 2006-2007, 376,296 services designed to improve family functioning were provided to children ages 0 to 5 and 427,189 services to parents, guardians, primary caregivers, relatives, and providers.
1 First 5 Glenn County did not report data related to family functioning, child development, children’s health, or systems of care. First 5 Del Norte County did not report data related to systems of care. Thus, the values reported in the text and exhibits of this chapter do not include these data.
4 First 5 County Commission Program Focus Areas
Exhibit 7 demonstrates the number of services provided to children ages 0 to 5 in each family func-tioning service category and Exhibit 8 reflects the same information for parents, guardians, primary caregivers, relatives, and providers.
Exhibit 7: Family Functioning-number of Services provided to children Ages 0 to 5 by Service category for Fiscal year 2006-2007
The percentages in this chart may not add to 100 due to rounding.
13,170(4%)
18,540(5%)
19,657(5%)
25,035(7%)
26,226(7%)
29,884(8%)
199,816(53%)
43,553(11%)
415(< 1%)
0 50,000 100,000 150,000 200,000 250,000
ParentEducation and
Literacy
ParentingEducation
BehavioralServices
FamilyLiteracy
KitDistribution
OtherServices
ParentSupport
Resourceand Referral
Basic FamilyNeeds
Number of Services

4–2 AnnuAl RepoRt 2006-2007
The percentages in this chart may not add to 100 due to rounding.
Exhibit 8: Family Functioning-number of Services provided to parents, guardians, primary caregivers, Relatives, and providers by Service category for Fiscal year 2006-2007
Exhibit 9: Family Functioning-Services provided to children by ethnicity for Fiscal year 2006-2007
The percentages in this chart may not add to 100 due to rounding.
35,210(8%)
128,894(30%)
52,646(12%)
54,080(13%)
62,047(15%)
13,764(3%)
32,335(8%)
47,150(11%)
1,063(< 1%)
0 50,000 100,000 150,000
Parent Education and Literacy
Parenting Education
Behavioral Services
Family Literacy
Kit Distribution
Other Services
Parent Support
Resource and Referral
Basic Family Needs
Number of Services
White15%
Latino65%
African American11%
Asian3%
Other4%
Pacific Islander< 1%
Multiracial1%
Native American1%

4–3
CHAPTER 4 FiRsT 5 CounTy Commission PRogRAm FoCus AREAs
AnnuAl RepoRt 2006-2007
While children and adults from all ethnic groups received services, for those reporting an ethnicity, Latinos were the largest recipient group (see Exhibit 9). For children reporting a primary language, services were provided to Spanish speakers 49 percent of the time and English speakers 45 percent of the time.
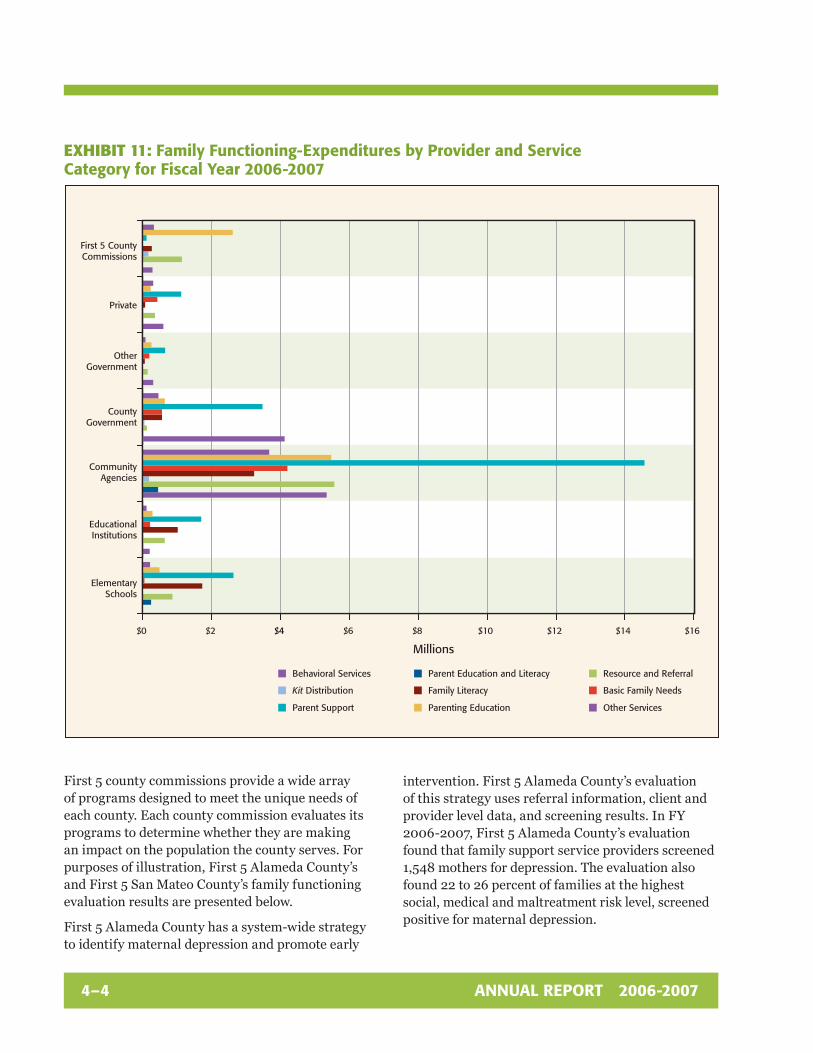
In FY 2006-2007, county commissions expended $72,792,980 to improve family functioning. Exhibit 10 shows the distribution of expenditures by service
category. Schools and educational institutions, community-based agencies, government agencies, private institutions, and First 5 county commissions provided services to children and adults in order to improve family functioning. Exhibit 11 displays expenditures by provider type for each service category. Community-based agencies received 59 percent of all family functioning expenditures in FY 2006-2007.
Exhibit 10: Family Functioning-Distribution of expenditures by Service category for Fiscal year 2006-2007
The percentages in this chart may not add to 100 due to rounding.
Other Services 7%
Parenting Education 14%
Parent Support 33%
Family Literacy 10%
Kit Distribution < 1%
Resource and Referral 12%
Parent Education and Literacy < 1%
Behavioral Services 15%
Basic Family Needs 8%
4–4 AnnuAl RepoRt 2006-2007
First 5 county commissions provide a wide array of programs designed to meet the unique needs of each county. Each county commission evaluates its programs to determine whether they are making an impact on the population the county serves. For purposes of illustration, First 5 Alameda County’s and First 5 San Mateo County’s family functioning evaluation results are presented below.
First 5 Alameda County has a system-wide strategy to identify maternal depression and promote early
Exhibit 11: Family Functioning-expenditures by provider and Service category for Fiscal year 2006-2007
intervention. First 5 Alameda County’s evaluation of this strategy uses referral information, client and provider level data, and screening results. In FY 2006-2007, First 5 Alameda County’s evaluation found that family support service providers screened 1,548 mothers for depression. The evaluation also found 22 to 26 percent of families at the highest social, medical and maltreatment risk level, screened positive for maternal depression.
$2 $4 $6 $8 $10 $12 $14 $16
ElementarySchools
EducationalInstitutions
CommunityAgencies
CountyGovernment
OtherGovernment
Private
First 5 CountyCommissions
Millions
$0
Behavioral Services Parent Education and Literacy Resource and Referral
Kit Distribution Family Literacy Basic Family Needs
Parent Support Parenting Education Other Services

4–5
CHAPTER 4 FiRsT 5 CounTy Commission PRogRAm FoCus AREAs
AnnuAl RepoRt 2006-2007
First 5 San Mateo County’s home visiting program serves pregnant women and children ages zero to three. The program serves approximately 1,300 Medi-Cal eligible families each year. Of those participating, 93 percent reported correctly placing their babies to sleep on their backs compared to 79.6 percent of the general county population. Participants also demonstrated significant improvements on measures of parent-life functioning and parent-child interaction. In addition, participants experienced significant improvements in their sense of parenting competence and efficacy.
chilD Development First 5 county commissions fund the following services to help improve child development:
Preschool for three- and four-year olds■■
State School Readiness programs and local match■■
Local school readiness ■■
Early education programs for children (other ■■
than School Readiness and preschool for three-and four-year olds)
Kindergarten transition services■■
Comprehensive special needs screening and ■■
assessments
Targeted intensive intervention for children ■■
identified with special needs
Early education provider programs■■
Other child development services■■
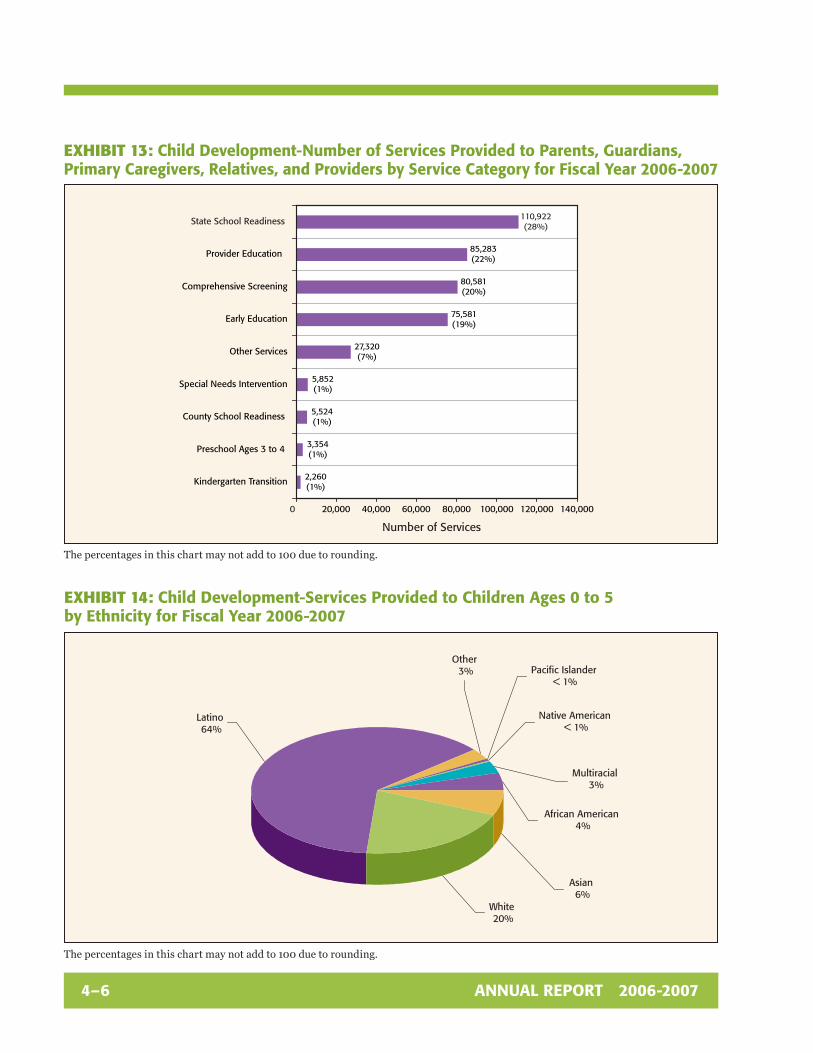
In FY 2006-2007, 429,179 services designed to improve child development were delivered to children ages 0 to 5 and 396,677 services were delivered to parents, guardians, primary caregivers, relatives, and providers. Exhibit 12 shows the number of services provided to children ages 0 to 5 in each child development service category and Exhibit 13 reflects the same information for parents, guardians, primary caregivers, relatives, and providers.
Exhibit 12: child Development-number of Services provided to children Ages 0 to 5 by Service category for Fiscal year 2006-2007
105,172(25%)
105,033(24%)
92,006(21%)
59,136(14%)
34,065(8%)
16,744(4%)
6,682(2%)
5,413(1%)
4,928(1%)
0 20,000 40,000 60,000 80,000 100,000 120,000 140,000
Kindergarten Transition
Special Needs Intervention
County School Readiness
Preschool Ages 3 to 4
Provider Education
Other Services
Early Education
State School Readiness
Comprehensive Screening
Number of Services
4–6 AnnuAl RepoRt 2006-2007
Exhibit 13: child Development-number of Services provided to parents, guardians, primary caregivers, Relatives, and providers by Service category for Fiscal year 2006-2007
The percentages in this chart may not add to 100 due to rounding.
Exhibit 14: child Development-Services provided to children Ages 0 to 5 by ethnicity for Fiscal year 2006-2007
The percentages in this chart may not add to 100 due to rounding.
0 20,000 40,000 60,000 80,000 100,000 120,000 140,000
Kindergarten Transition
Preschool Ages 3 to 4
County School Readiness
Special Needs Intervention
Other Services
Early Education
Comprehensive Screening
Provider Education
State School Readiness
Number of Services
85,283(22%)
110,922(28%)
80,581(20%)
75,581(19%)
27,320(7%)
5,852(1%)
5,524(1%)
3,354(1%)
2,260(1%)
Native American < 1%
Pacific Islander < 1%
Other 3%
Multiracial 3%
African American 4%
Asian 6%
White 20%
Latino 64%

4–7
CHAPTER 4 FiRsT 5 CounTy Commission PRogRAm FoCus AREAs
AnnuAl RepoRt 2006-2007
While children and adults from all ethnic groups received these services, for those reporting an ethnicity, services were delivered to Latinos most often (see Exhibit 14). For those children reporting a primary language, 52 percent of services were delivered to those speaking Spanish and 43 percent to those speaking English.
In FY 2006-2007, county commissions expended $206,108,758 to improve child development. Exhibit 15 shows the distribution of expenditures by service category. Schools and educational institutions, community-based agencies, government agencies, private institutions, and First 5 county commissions provided services to children and adults in order
Exhibit 15: child Development-Distribution of expenditures by Service category for Fiscal year 2006-2007
The percentages in this chart may not add to 100 due to rounding.
to improve child development. Exhibit 16 shows provider expenditures by service category. In FY 2006-2007, private entities received 26 percent of all expenditures to improve child development.
First 5 county commissions provide a wide array of programs designed to meet the unique needs of each county. Each county commission evaluates its programs to determine whether they are making an impact on the population the county serves. By way of illustration, First 5 Ventura County’s and First 5 San Joaquin County’s child development evaluation results are highlighted below.
Preschool Ages 3 to 436%
State School Readiness 26%
County School Readiness
5%
Comprehensive Screening
7%
Special Needs Intervention
2%
Early Education 6%
Other Services1%
Kindergarten Transition 1%
Provider Education 16%

4–8 AnnuAl RepoRt 2006-2007
Exhibit 16: child Development-expenditures by provider and Service category for Fiscal year 2006-2007
Preschool Ages 3 to 4 State School Readiness County School Readiness
Comprehensive Screening Special Needs Intervention Early Education
Provider Education Kindergarten Transition Other Services
$0 $5 $10 $15 $20 $25 $30 $35 $40 $45 $50 $55
ElementarySchools
EducationalInstitutions
CommunityAgencies
CountyGovernment
OtherGovernment
Private
First 5 CountyCommissions
Millions

4–9
CHAPTER 4 FiRsT 5 CounTy Commission PRogRAm FoCus AREAs
AnnuAl RepoRt 2006-2007
First 5 Ventura’s preschool and intensive summer programs prepare children for kindergarten. First 5 Ventura evaluates the impact of these programs using Desired Results Developmental Profile assessment tools. For FY 2006-2007, pre- and post-program evaluation results showed partici-pants’ mastery of fundamental skills increased 65 percent, on average.
First 5 San Joaquin County funds bridge programs providing a curriculum-based approach to ensure children are ready to enter kindergarten. Bridge program activities emphasize the development of social skills, and familiarize children and parents with the school environment. During summer 2006, First 5 San Joaquin County funded a total of 42 bridge programs, with over 1,600 children ages 0 to 5 participating.
A 2006 evaluation used data from bridge teachers, parents of children participating in a bridge program and kindergarten teachers. Evaluation results show that 100 percent of the bridge teachers and 89 percent of the parents reported an increase in the personal development skills of the participating children. Sixty-seven percent of the kindergarten teachers reported seeing an increase in personal development skills in their entering kindergarten class.
Bridge teachers and parents observed similar increases in the cognitive and motor development skill areas as they did with personal develop-ment skills. A majority of kindergarten teachers surveyed, however, did not see increases in their students’ cognitive and motor skills. Bridge and kindergarten teachers reported parents showing increased familiarity with the school setting, increased understanding of kindergarten expecta-tions and increased parent-child interactions related to kindergarten readiness by the conclu-sion of the bridge program.
chilD heAlthFirst 5 county commissions fund the following services to help improve children’s health:
Breastfeeding assistance■■
Nutrition and fitness■■
Other health education■■
Health access■■
Home visitations for newborns■■
Safety education and intentional and ■■
unintentional injury prevention
Oral health■■
Prenatal care■■
Primary care services■■
Comprehensive special needs screening and ■■
assessments
Targeted intensive intervention for children ■■
identified with special needs
Specialty medical services■■
Tobacco cessation education and treatment■■
Other health services■■
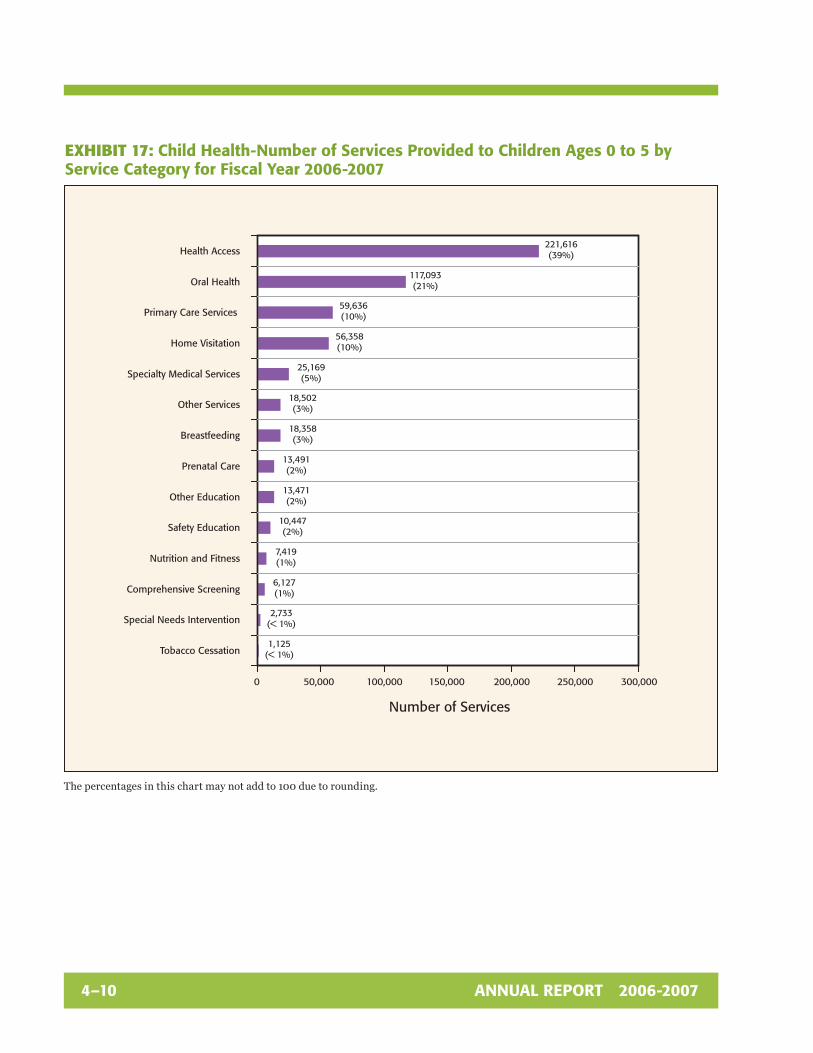
In FY 2006-2007, 571,545 services designed to improve child health were provided to children ages 0 to 5 and 608,297 services were provided to parents, guardians, primary caregivers, relatives, and providers. Exhibit 17 shows the number of ser-vices provided to children ages 0 to 5 for each child health service category and Exhibit 18 reflects the same information for parents, guardians, primary caregivers, relatives, and providers.
4–10 AnnuAl RepoRt 2006-2007
Exhibit 17: child health-number of Services provided to children Ages 0 to 5 by Service category for Fiscal year 2006-2007
The percentages in this chart may not add to 100 due to rounding.
221,616(39%)
117,093(21%)
59,636(10%)
56,358(10%)
25,169(5%)
18,502(3%)
18,358(3%)
13,491(2%)
13,471(2%)
10,447(2%)
7,419(1%)
6,127(1%)
2,733(< 1%)
1,125(< 1%)
0 50,000 100,000 150,000 200,000 250,000 300,000
Tobacco Cessation
Special Needs Intervention
Comprehensive Screening
Nutrition and Fitness
Safety Education
Other Education
Prenatal Care
Breastfeeding
Other Services
Specialty Medical Services
Home Visitation
Primary Care Services
Oral Health
Health Access
Number of Services

4–11
CHAPTER 4 FiRsT 5 CounTy Commission PRogRAm FoCus AREAs
AnnuAl RepoRt 2006-2007
The percentages in this chart may not add to 100 due to rounding.
Exhibit 18: child health-number of Services provided to parents, guardians, primary caregivers, Relatives, and providers by Service category for Fiscal year 2006-2007
164,733(27%)
126,302(21%)
63,025(10%)
50,644(8%)
39,600(7%)
37,846(6%)
34,712(6%)
34,066(5%)
19,014(3%)
12,381(2%)
10,457(2%)
9,895(2%)
2,883(< 1%)
2,739(< 1%)
0 50,000 100,000 150,000 200,000 250,000
Comprehensive Screening
Special Needs Intervention
Nutrition and Fitness
Tobacco Cessation
Other Education
Safety Education
Specialty Medical Services
Breastfeeding
Oral Health
Prenatal Care
Home Visitation
Primary Care Services
Other Services
Health Access
Number of Services
4–12 AnnuAl RepoRt 2006-2007
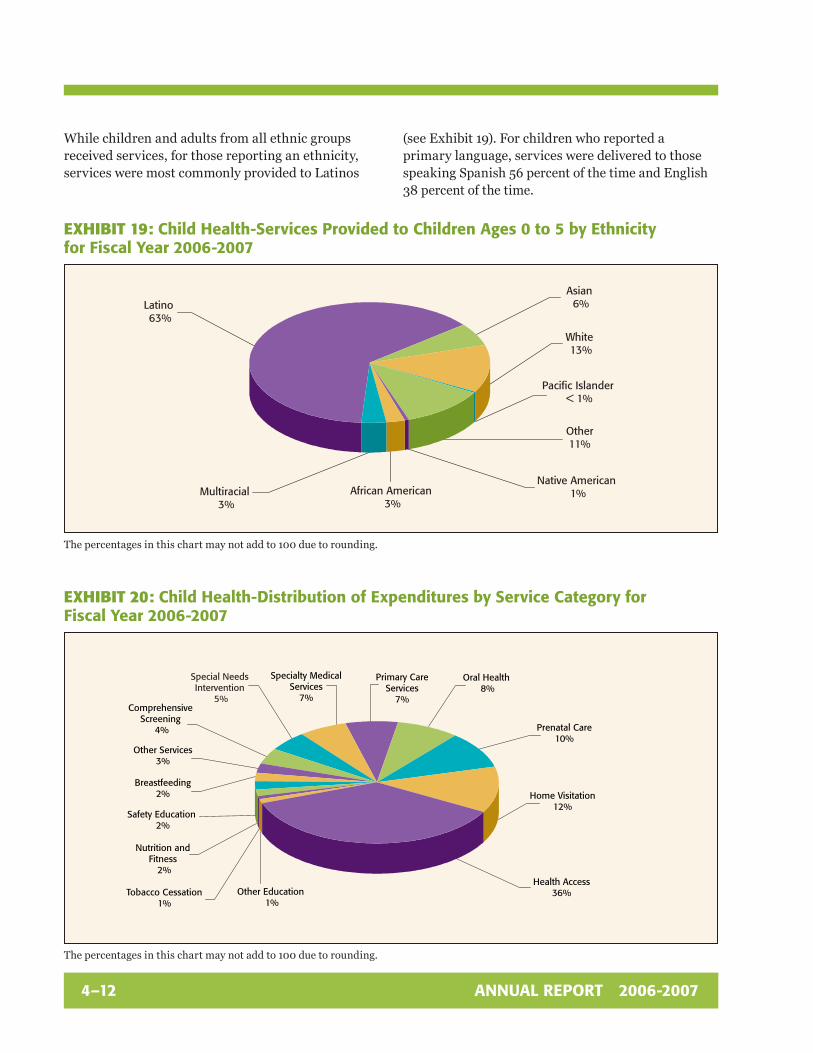
While children and adults from all ethnic groups received services, for those reporting an ethnicity, services were most commonly provided to Latinos
The percentages in this chart may not add to 100 due to rounding.
(see Exhibit 19). For children who reported a primary language, services were delivered to those speaking Spanish 56 percent of the time and English 38 percent of the time.
Exhibit 19: child health-Services provided to children Ages 0 to 5 by ethnicity for Fiscal year 2006-2007
The percentages in this chart may not add to 100 due to rounding.
Exhibit 20: child health-Distribution of expenditures by Service category for Fiscal year 2006-2007
Latino 63%
Asian 6%
White 13%
Pacific Islander < 1%
Multiracial 3%
African American 3%
Native American 1%
Other11%
Oral Health 8%
Special Needs Intervention
5%Comprehensive
Screening 4%
Other Services 3%
Breastfeeding2%
Safety Education 2%
Nutrition and Fitness
2%
Tobacco Cessation 1%
Prenatal Care 10%
Primary Care Services
7%
Specialty Medical Services
7%
Home Visitation 12%
Health Access 36% Other Education
1%

4–13
CHAPTER 4 FiRsT 5 CounTy Commission PRogRAm FoCus AREAs
AnnuAl RepoRt 2006-2007
In FY 2006-2007, county commissions expended $105,412,340 to improve child health. Exhibit 20 shows the distribution of expenditures by service category. Schools and educational institutions, community-based agencies, government agencies,
Exhibit 21: child health-expenditures by provider and Service category for Fiscal year 2006-2007
private institutions and First 5 county commis-sions provided services to children and adults in order to improve child development. Exhibit 21 shows provider expenditures by service category. Community-based agencies accounted for
$0 $2 $4 $6 $8 $10 $12 $14
ElementarySchools
EducationalInstitutions
CommunityAgencies
CountyGovernment
Other Government
First 5 CountyCommissions
MillionsBreastfeeding Nutrition and Fitness Other Education Health Access
Home Visitation Oral Health Prenatal Care Primary Care Services
Special Needs Screening Special Needs Intervention Safety Education Specialty Medical Services
Tobacco Cessation Other Services
Private

4–14 AnnuAl RepoRt 2006-2007
38 percent of all expenditures to improve child health in FY 2006-2007.
First 5 county commissions provide a wide array of programs designed to meet the unique needs of each county. Each county commission evaluates its programs to determine whether they are making an impact on the population the county serves. For purposes of illustration, Lassen County Children and Families Commission’s and Children and Families Commission of Orange County’s child health evalua-tion results are presented below.
Lassen County Children and Families Commission supports application of fluoride as an important prevention strategy. In FY 2006-2007, a total of 364 clients received fluoride treatment and 797 received fluoride varnishes. Sealants were provided at 199 visits and a total of 1,189 teeth were sealed. Comparing year-to-year data shows the effect of these prevention activities. In FY 2005-2006, 48 percent of client visits revealed decay in one or more teeth. In FY 2006-2007, 41 percent of visits revealed visible decay, a seven percent decrease.
Children and Families Commission of Orange County’s Project Connection plays a critical role in reaching out to Orange County’s medically and socially vulnerable children to ensure they receive access to culturally sensitive services that improve children’s overall health and well being. Evaluation findings demonstrate that Project Connection helped increase the number of children with publicly funded health insurance from 65 percent to almost 90 percent. In addition, the evaluation found that 81 percent of Project Connection children secured a medical home. Finally, the evaluation shows that contact with a health access team increased the percent of children with full immunizations from 43 percent to over 75 percent.
SyStemS oF cAReFirst 5 county commissions fund the following services to help improve systems of care:
Provider capacity building (training and support)■■
Community strengthening efforts (awareness and ■■
education events)
Service outreach (planning, support and management)■■
Systems of care improvements are designed to impact family functioning, child development and health. Therefore, First 5 county commissions do not report systems of care service data. In FY 2006-2007, county commissions expended $76,574,834 to improve systems of care. Exhibit 22 displays how county commissions dispersed funds by service category.
Schools and educational institutions, community-based agencies, government agencies, private institutions and First 5 county commissions provided services to children and adults in order to improve systems of care.
First 5 county commissions provide a wide array of programs designed to meet the unique needs of each county. Each county commission evaluates its
Exhibit 22: Systems of care-expenditures by Service category for Fiscal year 2006-2007
Provider Capacity Building, Training
and Support 52%
Service Outreach, Planning, Support, and Management
22%
Community Strengthening Efforts
26%

4–15
CHAPTER 4 FiRsT 5 CounTy Commission PRogRAm FoCus AREAs
AnnuAl RepoRt 2006-2007
programs to determine whether they are making an impact on the population the county serves. For purposes of illustration, First 5 Merced County’s and First 5 Napa County Children and Families Commission’s systems of care evaluation results are highlighted below.
First 5 Merced County’s Families and Children Embracing Success (FACES) project is a multi-agency collaboration focused on identifying and supporting the diverse special needs of children and families. The program is administered through a multidisciplinary team that covers health, social services and early childhood education. Agencies participating in FACES include Merced City School District, Challenged Family Resource Center and the Merced County Public Health Department. Eligible children and families receive developmental screenings, services, and resources and referrals, as needed. During FY 2006-2007, 192 children were screened and 29 referrals were made for additional services and supports.
First 5 Merced County used program data, key stakeholder interviews, program site visits, focus groups, comparison data, and client satisfaction surveys to evaluate FACES. The evaluation found First 5 Merced County funding filled critical service gaps and enabled a newfound synergy to develop across the network of services, particularly in the areas of communication and program referrals. In addition, providers improved and identified new connections with others in Merced County. They also report that these connections improved and
expanded their knowledge base, access to referral agencies, and quality and scope of services.
In FY 2006-2007, First 5 Napa County Children and Families Commission’s Infant-Parent Mental Health Fellowship (IPMHF) aimed to improve systems of care by increasing the confidence and skills of mental health professionals and early childhood education (ECE) providers in delivering infant-parent mental health services. Twenty-three fellows completed 685 hours of training on topics such as: Newborn Behavioral Observation Training and Certification, Touchpoints Model, Individualized Family Service Plan and Pediatric Health, and Development. Eleven ECE providers completed a less comprehensive pro-gram. Upon completion, fellows reported increased knowledge and abilities in assessment, diagnosis, and the development and implementation of treat-ment plans specific to children and their caregivers with varied mental health issues.
The collective work of First 5 California and the First 5 county commissions provides a wide array of services to children ages 0 to 5 most in need. First 5 California and county commission evaluation results show that these services improve family functioning, child development, child health, and systems of care. In future years we will build upon the solid founda-tion our current programs provide to ensure we achieve our mission to be recognized as California’s unequivocal voice for all children ages 0 to 5 to ensure greater equity in their readiness for school.
For more information about First 5 California go to www.ccfc.ca.gov.


This annual report was prepared in conjunction with the Institute for Social Research,California State University, Sacramento.

Annual ReportFIRST 5 CALIFORNIA 2006-2007
CALIFORNIA CHILDREN AND FAMILIES COMMISSION