2006 paul vanraden animal improvement programs laboratory, usda agricultural research service,...
TRANSCRIPT

2006
Paul VanRadenPaul VanRaden
Animal Improvement Programs Laboratory, USDAAgricultural Research Service, Beltsville, MD, [email protected]
Fertility Trait Economics and Fertility Trait Economics and Correlations with Other TraitsCorrelations with Other Traits

Interbull Workshop 2006 (2) P.M. VanRaden200
6
Emphasis on Fertility, LongevityEmphasis on Fertility, Longevity(% of total merit)(% of total merit)
Ctry Fert Long Ctry Fert Long
USA 7 11 DNK 8 9
DEU 1 25 AUS 9 8
NLD 10 8 NZL 10 8
FRA 13 13 GBR 17
CAN 5 7 SWE 6 10
ITA 8 IRL 22 18
Interbull Workshop 2006 (3) P.M. VanRaden200
6
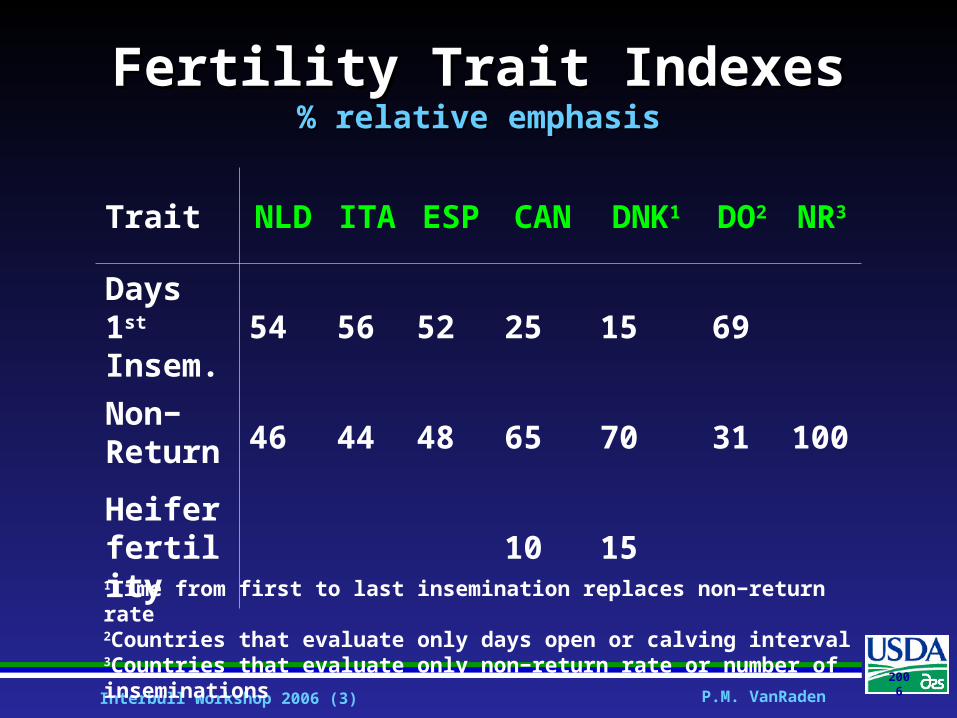
Fertility Trait IndexesFertility Trait Indexes% relative emphasis% relative emphasis
Trait NLD ITA ESP CAN DNK1 DO2 NR3
Days 1st Insem. 54 56 52 25 15 69
Non− Return 46 44 48 65 70 31 100
Heifer fertility 10 15
1Time from first to last insemination replaces non−return rate2Countries that evaluate only days open or calving interval3Countries that evaluate only non−return rate or number of inseminations

Interbull Workshop 2006 (4) P.M. VanRaden200
6
Predict Longevity from FertilityPredict Longevity from Fertility
Which cow fertility trait contributes most to longevity?• Days to first insemination (DFI)• Non−return rate (NR)
Combined longevity includes• 23% DFI and 12% NR in CAN• Only DFI in NLD• Correlations = .33 DFI, .11 NR in USA

Interbull Workshop 2006 (5) P.M. VanRaden200
6
Foreign Bull Fertility PTAsForeign Bull Fertility PTAs
Predict fertility from other traits• Methods similar to multi−trait longevity• Foreign correlations assumed = domestic• MACE longevity, yield get highest weight• Implemented in USA February 2006
Results for top 100 Net Merit bulls• PTA mean was −.3, now −.7
– (as compared to SD of 1.4)(as compared to SD of 1.4)
• REL mean was 28%, now 40%

Interbull Workshop 2006 (6) P.M. VanRaden200
6
Longevity Corr with US DPR, PLLongevity Corr with US DPR, PL(>10 herds in both countries, Interbull longevity correlations)(>10 herds in both countries, Interbull longevity correlations)
Ctry DPR PL Ctry DPR PL
IRL .66 .71 ITA .44 .73
SWE .64 .81 DNK .42 .83
GBR .58 .83 NLD .38 .80
CAN .54 .89 CHE .35 .72
BEL .52 .82 AUS .34 .67
NZL .51 .66 FIN .28 .64
DEU .46 .85 FRA .27 .67
ESP .46 .72 ISR .22 .39
Interbull Workshop 2006 (7) P.M. VanRaden200
6
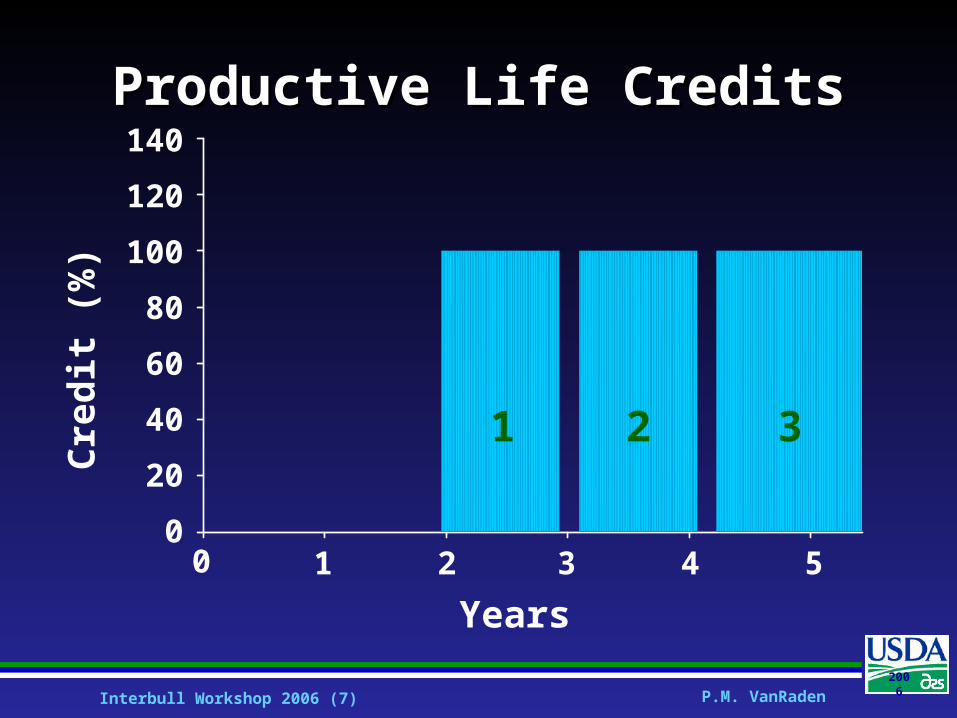
Productive Life CreditsProductive Life Credits
20 3 4 51
Years
20
140
40
60
80
100
120
0
Cre
dit
(%
)
321

Interbull Workshop 2006 (8) P.M. VanRaden200
6
2006 Productive Life Credits2006 Productive Life Credits
20 3 4 51
Years
20
140
40
60
80
100
120
0
Cre
dit
(%
)
321
Interbull Workshop 2006 (9) P.M. VanRaden200
6
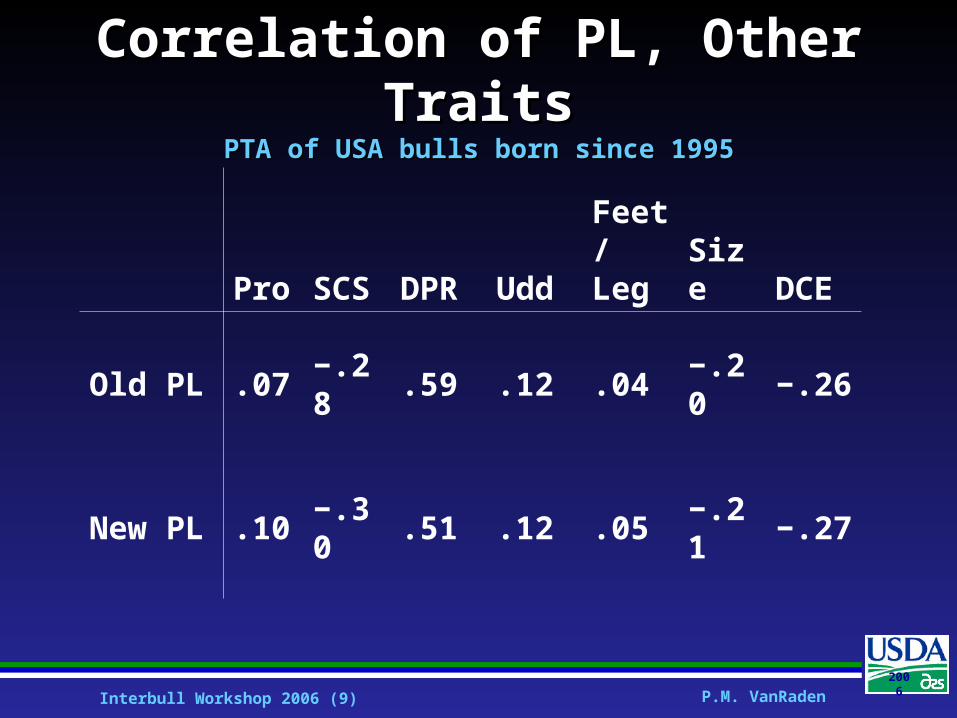
Correlation of PL, Other TraitsCorrelation of PL, Other TraitsPTA of USA bulls born since 1995PTA of USA bulls born since 1995
Pro SCS DPR UddFeet / Leg Size DCE
Old PL .07 −.28 .59 .12 .04 −.20 −.26
New PL .10 −.30 .51 .12 .05 −.21 −.27
Interbull Workshop 2006 (10) P.M. VanRaden200
6
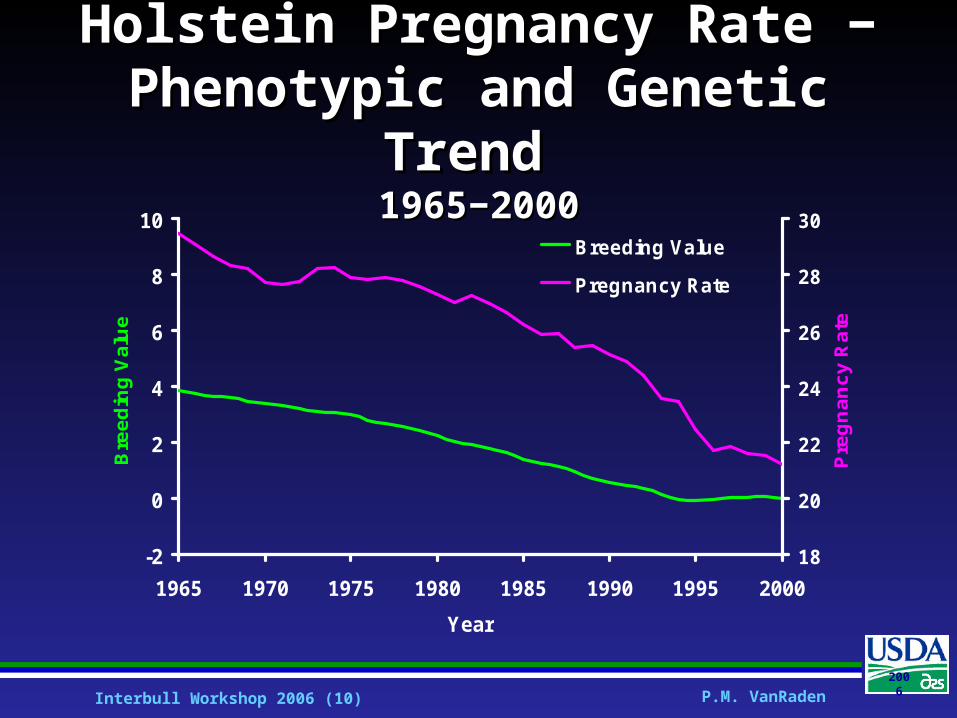
Holstein Pregnancy Rate − Holstein Pregnancy Rate − Phenotypic and Genetic Trend Phenotypic and Genetic Trend
1965−20001965−2000
-2
0
2
4
6
8
10
1965 1970 1975 1980 1985 1990 1995 2000
Year
Bre
ed
ing
Va
lue
18
20
22
24
26
28
30
Pre
gn
an
cy
Ra
te
Breeding Value
Pregnancy Rate
Interbull Workshop 2006 (11) P.M. VanRaden200
6
Heifer Fertility is OKHeifer Fertility is OK
Paul VanRaden, 1995
Interbull Workshop 2006 (12) P.M. VanRaden200
6
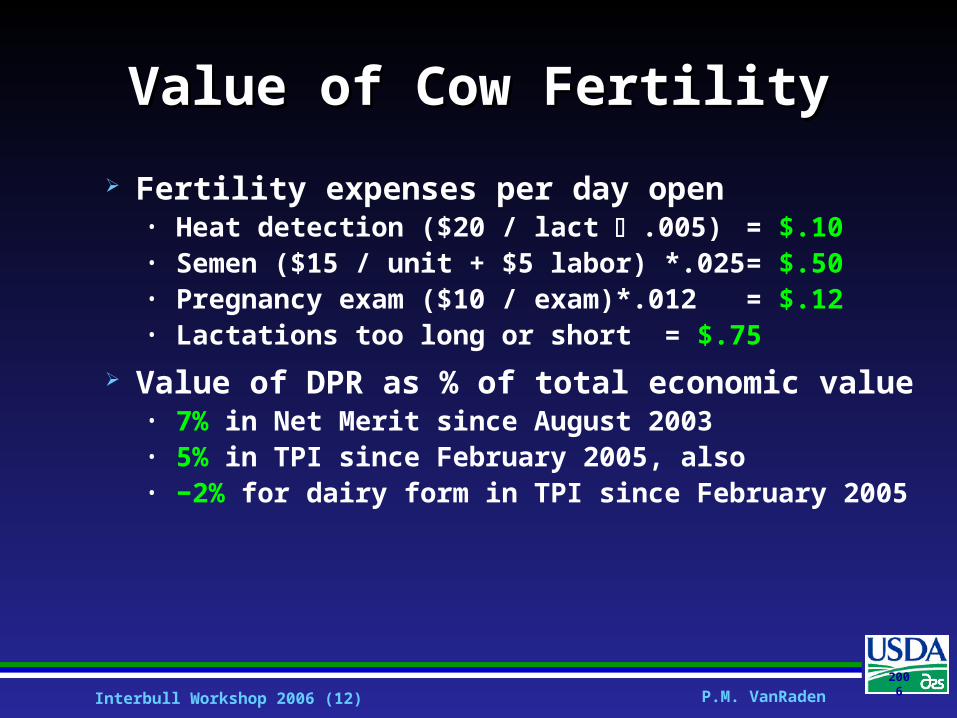
Value of Cow FertilityValue of Cow Fertility
Fertility expenses per day open• Heat detection ($20 / lact .005) = $.10• Semen ($15 / unit + $5 labor) *.025 = $.50• Pregnancy exam ($10 / exam)*.012 = $.12• Lactations too long or short = $.75
Value of DPR as % of total economic value• 7% in Net Merit since August 2003• 5% in TPI since February 2005, also• −2% for dairy form in TPI since February 2005

Interbull Workshop 2006 (13) P.M. VanRaden200
6
ConclusionsConclusions
Fertility and longevity receive a total of 8% to 40% of selection
Corr(fertility, longevity) not uniform
Days to 1st insemination more important than conception rate?
Selection for fertility reduces costs and increases longevity
Interbull Workshop 2006 (14) P.M. VanRaden200
6
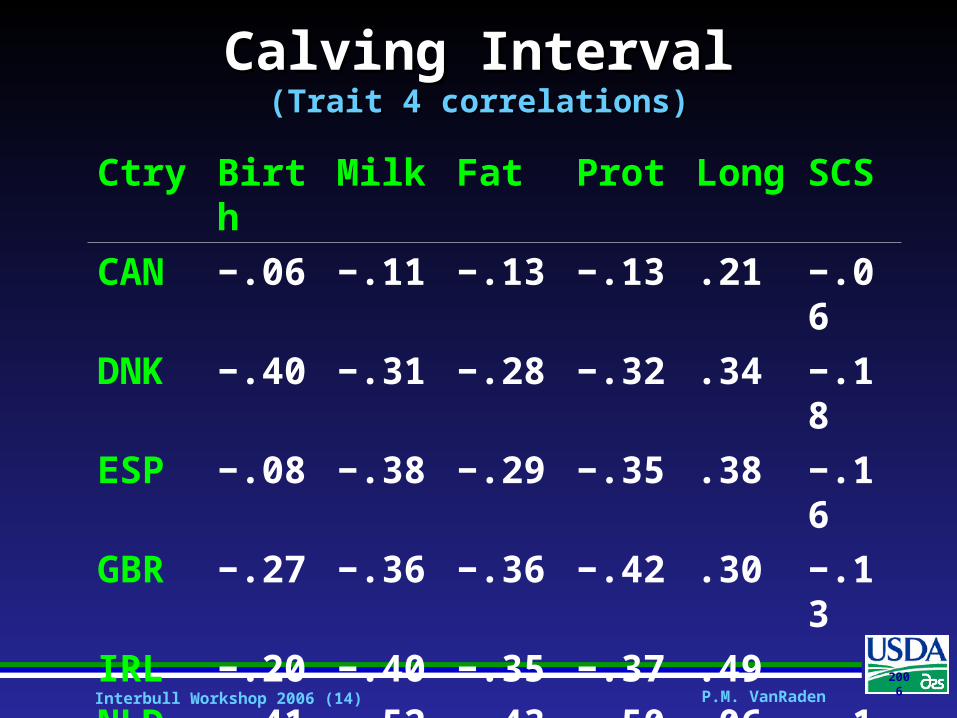
Calving IntervalCalving Interval(Trait 4 correlations)(Trait 4 correlations)
Ctry Birth Milk Fat Prot Long SCS
CAN −.06 −.11 −.13 −.13 .21 −.06
DNK −.40 −.31 −.28 −.32 .34 −.18
ESP −.08 −.38 −.29 −.35 .38 −.16
GBR −.27 −.36 −.36 −.42 .30 −.13
IRL −.20 −.40 −.35 −.37 .49
NLD −.41 −.52 −.43 −.50 .06 −.13
NZL −.11 −.32 −.05 −.21 .59 −.10
USA −.04 −.21 −.21 −.17 .48 −.12

Interbull Workshop 2006 (15) P.M. VanRaden200
6
Conception RateConception Rate(Trait 3 correlations)(Trait 3 correlations)
Ctry Birth Milk Fat Prot Long SCS
CAN −.06 −.07 −.09 −.09 .09 −.04
DEU .06 −.01 −.03 −.02 .17 −.04
DNK −.41 −.43 −.37 −.47 .23 −.17
FRA .09 .00 −.02 .00 .28 −.08
ISR −.06 −.07 −.16 −.27 .38 −.15
NLD −.41 −.39 −.37 −.48 .08 −.04

Interbull Workshop 2006 (16) P.M. VanRaden200
6
Calving to First InseminationCalving to First Insemination(Trait 2 correlations)(Trait 2 correlations)
Ctry Birth Milk Fat Prot Long SCS
CAN −.01 −.26 −.16 −.21 .32 −.12
DNK −.34 −.42 −.36 −.40 .25 −.22
NLD −.33 −.49 −.46 −.50 .04 −.15
NZL −.08 −.29 −.05 −.19 .49 −.10
Interbull Workshop 2006 (17) P.M. VanRaden200
6
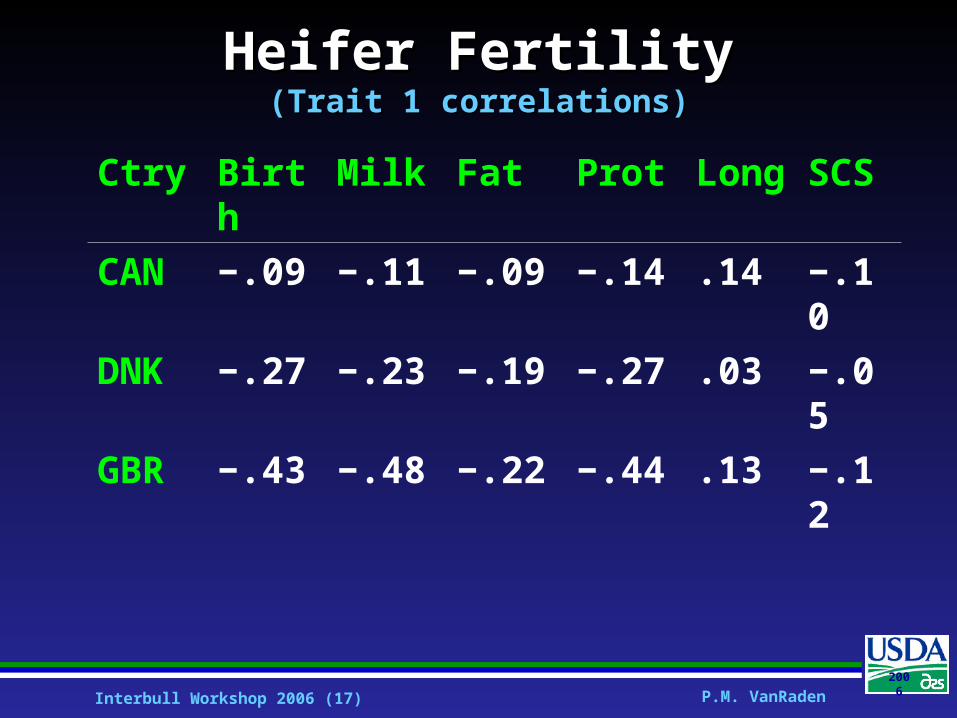
Heifer FertilityHeifer Fertility(Trait 1 correlations)(Trait 1 correlations)
Ctry Birth Milk Fat Prot Long SCS
CAN −.09 −.11 −.09 −.14 .14 −.10
DNK −.27 −.23 −.19 −.27 .03 −.05
GBR −.43 −.48 −.22 −.44 .13 −.12