2007 ... figure 3.11: plum historical export volume vs. price trends 28 figure 3.12: distribution of...
TRANSCRIPT
������������� ��������� ����
The National Agricultural Marketing Council
The National Agricultural Marketing Council
and
Commark Trust
Commissioned by the
Department of Agriculture
������� ��� ��
Layout by Interactive Reality
����� ��������������
� ���������������������� ��!"��"����#��$��������"�!��%� �����&'�� ����������������!�%���%���� �����(���������� ����'��������&���)�������*"!�*��������'&����*�������� ��&����)������&���'(
���!�����!� ��� &�!����!��(� ��!�"*���� �����!������(� ��!��*���� ��� )�� ���� �� ��&������ '��������*�������+���'�'��&(�,����"������,����������&�''����� �����-")��'���%�.����� ��&������!�������*
������'��������&�������)��"'�*�,����"���!$��,��*����������")��'���%
-")��'��*�)����#�(�-��+��������/��0(�-�1.2� �(��(�.����3�4��������0

�������������
This report was prepared, on behalf of the National Agricultural Marketing Council, by
Peter Greeff at the Saasveld Campus of the Nelson Mandela Metropolitan University,
and Mariette Kotzé of Optimal Agricultural Business Systems (OABS).
The NAMC would also like to acknowledge an anonymous peer reviewer for reviewing the
first draft, and Yvonne Kemp for copy editing a subsequent draft. Christine Bothma of
Interactive Reality is also acknowledged for doing the final document design and layout.
�������
In his February 2006 State of the Nation Address, President Thabo Mbeki identified
agriculture as a key contributor to South Africa’s 6% economic growth target. The sector’s
importance lies in its potential to provide significant contribution to economic development
through job creation, assisting with poverty alleviation and earning foreign exchange.
Certain agricultural subsectors are currently delivering growth and are therefore well
positioned for further growth through carefully-designed government collaboration and
support. Others, although important in terms of achievement of broader national objectives,
are not yet competitive and will require government to play a more leading role in unlocking
their potential. A recent study by the Monitor Group identified subsectors that could be
considered both nationally attractive in terms of broader development goals and international
competitiveness. Using the Monitor Group study as a reference, the National Department
of Agriculture commissioned the National Agricultural Marketing Council (NAMC), who later
partnered with ComMark Trust, to undertake diagnostic studies whose purpose would be
to identify growth and development constraints and challenges in each of the following key
subsectors, as well as to recommend interventions to be made towards unlocking their
potential for contribution towards ASGI-SA:
Beef cattle; Poultry meat; Citrus; Viticulture; Wool; Deciduous fruits; Potatoes; Goats;
Rooibos; and Honeybush tea
Six of the subsector reports were outsourced to NAMC partners in academia and industry,
while the rest were prepared within NAMC and Commark Trust.
The Deciduous Fruit Report is the second in a series to be published over the next few
months.
TR RAMABULANA
CEO: NAMC
January 2007
��������� ��������
List of Tables ii
List of Figures iii
List of abbreviations, acronyms and terms iv
Executive Summary v
1. Introduction 1
2. Sector analysis 5
2.1 Production units 5
2.1.1 Major fruit types 5
2.1.2 Age distribution of orchards and vineyards 5
2.1.3 Number of production units 6
2.2 Producer and associated organisations 9
2.3 Fruit exporters 15
2.4 Employment, skills and labour absorption 17
2.5 Inputs and farming requisites 18
2.6 Strategic pointers 19
3. Markets and trends 21
3.1 Turnover of South African fruit and grapes in the export market 21
3.2 South Africa’s position in the global export market 20
3.3 Imports of fruit and grapes into South Africa 26
3.4 Trends in fruit and grape markets 26
3.5 South African trade in apple juice concentrate 30
3.6 Investment in orchards and cold storage 30
3.7 Marketing mix 28
3.8 Competitiveness rankings of the South African apple industry 33
3.9 Market opportunities and future growth potential 35
3.10 Impact on other agricultural subsectors 36
3.11 Conclusion 36
4. Current policies 37
4.1 Summary of current government policy and support 37
4.2 Other support 37
4.3 Status of empowerment process and impact 37
4.4 Evaluation of whether subsector issues are being
adequately addressed 38
i
5. Constraints and challenges 39
5.1 Regulatory issues 39
5.2 Labour markets 39
5.3 Infrastructure 40
5.4 Other 40
6. Opportunities 41
7. Conclusion 43
8. Bibliography 44
APPENDIX 1:
SYNOPSIS OF THE STRATEGIC OBJECTIVES IDENTIFIED
IN THE FRUIT INDUSTRY PLAN 46
����� ��� ����
Table 2.1: Number of fruit and grape growers and hectares per
province in South Africa 7
Table 2.2: Age grouping of deciduous fruit and table grape
plantings in South Africa 8
Table 2.3: Size of the production units per fruit type 8
Table 2.4: Volume of export crop handled by exporters, 2000 – 2005 16
Table 2.5: On-farm employment 18
Table 3.1: Turnover and costs for export fruit and grapes,
2005 season (R millions) 22
Table 3.2: Summarised prices (R/ton) and % crop distribution for
export, local and processed fruit and grapes and total
crop value, 2004/05 23
Table 3.3: Variation in net farm income (%) 2002 – 2005 24
Table 3.4: RSA trade in apple juice concentrate, 2002 – 2004 30
Table 3.5: Full production costs for selected fruit crops, 2004 30
Table 3.6: Apple cultivar market mix 31
Table 3.7: Pear cultivar market mix 32
Table 3.8: Plum cultivar market mix 32
Table 3.9: Ranking of major apple producing country 33
competitiveness, 2006 33
Table 3.10: Slide in South African apple competitiveness rankings 35
ii
����� ��� ������
Figure 1.1: The deciduous fruit and table grape supply chain 4
Figure 2.1: Fruit farm “basket” mix 9
Figure 2.2: Structure of the producer interest in the deciduous
fruit industry 10
Figure 2.3: Inflation on direct cost items, 2000 to 2004 19
Figure 2.4: Inflation on selected cost items, 2000 to 2004 19
Figure 3.1: Distribution of costs incurred in export of all South African
fruit and grapes, 2005 season 23
Figure 3.2: South Africa’s comparative position (tonnage) in global
apple exports, 2004 25
Figure 3.3: South Africa’s comparative position (tonnage) in global
pear exports, 2004 25
Figure 3.4: South Africa’s comparative position (tonnage) in global
plum exports, 2004 25
Figure 3.5: South Africa’s comparative position (tonnage) in global
grape exports, 2004 26
Figure 3.6: Distribution of South African apple crop, 1992 - 2005 27
Figure 3.7: Historical apple export market volumes vs. price 27
Figure 3.8: Apple local market historical volumes vs. price trends 27
Figure 3.9: Distribution of South African plum crop 28
Figure 3.10: Plum historical local market volume vs. price trends 28
Figure 3.11: Plum historical export volume vs. price trends 28
Figure 3.12: Distribution of South African table grape crop 29
Figure 3.13: Table grape local market historical volume vs. price 29
Figure 3.14: Table grape historical export volume vs. price trends 29
Figure 3.15: South African CA cold storage capacity 31
iii
����� ��� ����������� �������� ��� �����
AgriBEE Agricultural Black Economic Empowerment
AgriSETA Agriculture Sector Education and Training Authority
ARC Agricultural Research Council
BEE Black Economic Empowerment
CASP Comprehensive Agriculture Support Programme
CFPA Canned Fruit Producers Association
CPA Cape Pomological Association
DFPT Deciduous Fruit Producers Trust
DFI Dev. Deciduous Industry Development Trust
DTD Dried Fruit Technical Services
EU European Union countries
EurepGAP European Retail Group Good Agricultural Practices
FAWU Food & Allied Worker’s Association
FIP Fruit Industry Plan
FPEF Fresh Produce Exporters Forum
HAACP Hazard Analysis Critical Control Point
IPM Integrated Pest Management
IT Information Technology
JMF Joint Marketing Forum
LRAD Land Redistribution for Agricultural Development
MAFISA Micro-Agricultural Finance Schemes of South Africa
NAMC National Agricultural Marketing Council
NAFU National African Farmers Union
NGO’s Non Governmental Organisation
OABS Optimal Agricultural Business Systems
PDI Previously Disadvantaged Individual
Pome fruit Apples and Pears
POS Point of Sale
QC Quality Control
RSA Republic of South Africa
R & D Research and Development
SAAPA SA Apple & Pear Producer Association
SAPO SA Plant Improvement Organisation
SASPA SA Stone Fruit Producer Association
SAT SA Table grapes
SATI South African Table Grape Industry
SETA Sector Education and Training Authority
Stone fruit Apricots, Peaches, Plums and Nectarines
UK United Kingdom
US United States of America
iv
��� � ���������� �����
The deciduous fruit industry consists mainly of pome fruit (apples and pears), stone fruit
(apricots, peaches & nectarines and plums) as well as table grapes. The total area planted
to deciduous fruit in South Africa amounts to 74 246 hectares. The total number of
deciduous fruit producers is 2 225. The Western Cape has the largest concentration
growers which represent 74% of the total area planted to deciduous fruit. The Northern
Cape is the second largest area representing 15% of the total area followed by the Eastern
Cape (8%).
Industry data within this report reflects that intensive orchard replacement has taken place
since 1995. Increased volumes and new cultivars can also be ascribed to good horticultural
management. The productive life expectancy of pome fruit orchards and table grape
vineyards are 25 years, while stone fruit has a life expectancy of 18 years. The majority of
fruit production units are smaller than 30 hectares, and units larger than 30 ha is found
mainly in the apple growing regions. Economies of scale and consistency in yield and
quality are key characteristics of these larger operations. Large farming units have
strategised forward integration growth by specifically exporting their own products. These
units are identified as grower, packer and exporter.
The South African deciduous fruit industry is an export orientated industry with large volumes
being exported annually. The exporters are represented in the industry by the Fresh Produce
Exporters Forum (FPEF). The current members of the FPEF include 88 of 172 registered
exporters, representing more than 80% of exported volumes. During the 2005 season a
108 exporters were responsible for exporting more than 50% of the total exported volume.
The deciduous industry creates employment for almost 100 000 employees (converted to
permanent equivalents) throughout the whole of South Africa. Permanent labour is mainly
employed to perform task such as harvesting, supervision, operational duties in pack
houses, irrigation management, insect and disease management and on a seasonal basis
tractor and forklift driving. Seasonal labour is mainly employed on a contract basis with
the main purpose of harvesting the crop and or fruit packing. Common problems
experienced in terms of labour are low levels of education and literacy, social problems
such as absenteeism, alcohol abuse and family strife and poor health.
The transformational process is slow and the poor financial performance of new entrants
in the industry is a cause for concern. The reasons cited for this is that new entrants tend
to formulate poorly structured business plans, based on a limited knowledge and regard
for the overall market. Capital grants are often utilised for the purchase of land without
taking into account the amount of operational funds needed to sustain the business during
the gestation period of five to seven years. This is responsible for more or less than 45%
v
of the constraints experienced by emerging farmers. Government capacity to deliver
funds, extension and other services, in line with project schedules, has been lacking and
there is a general lack of professional extension services in farm management and
mentorship programmes.
Among these land reform initiatives, where support is forthcoming is in the form of LRAD
grants, CASP and MAFISA funding. Education and skills funding also receive government
support through tax incentives on AgriSETA accredited programmes. The Department of
Trade and Industries also offered export initiative support programmes, but are of limited
duration.
vi
Subsector Sudy: Deciduous Fruit
1
��� !����������
The deciduous fruit industry in South Africa is well established and primarily aimed at
supplying fresh grapes, apples, pears, peaches, nectarines, plums and apricots to the
export market. Peaches, pears, apricots and grapes are also processed and supplied as
either canned or dried products to the international and local markets. At this time, fresh
South African fruit is available in many northern hemisphere countries during their winter
and spring seasons. The bulk of these sales to the consumer are by means of contractual
agreements via preferred category suppliers to the large supermarket chains. Furthermore,
various export companies or agents conduct this business on the basis of consignment
sales on behalf of the grower or packer.
This subsector study on deciduous fruit is an overview of various aspects of the industry
as stipulated in the terms of reference provided by the National Agricultural Marketing
Council (NAMC). It is based on information compiled from industry data, publications such
as the annual “Key Deciduous Fruit Statistics” and the “Fruit Industry Plan” (FIP). Linkages
between the strategic plan for South African agriculture and the industry are set out in the
FIP and the three key objectives provide the basis for discussion in Sections 5 and 6 of
this report. These three key objectives are as follows:
1. Enhancing equitable access and participation. It is envisaged that this will
be achieved through land reform, restitution and redistribution and agricultural
black economic empowerment (AgriBEE). Land reform will involve the
establishment of new farmers, in line with the target of 30% of land in black
ownership by 2014. Land restitution will ensure the return of land to
dispossessed communities, while land redistribution will involve the provision
of state land for agricultural use by emergent farmers. The AgriBEE
transformational process at both industry and enterprise levels will be promoted
by bringing existing stakeholders from previously disadvantaged groups into
mainstream structures and business operations in terms of ownership,
management and recognised participation at various links in the supply chain
2. Improvement of global competitiveness and profitability. This will require
the capacity to create superior value for customers and improved profits for
stakeholders in the value chain, in comparison to competitor suppliers. The
improvement of profitability and global competitiveness is determined by the
level of productivity in the utilisation of human, capital and natural resources at
each link of the chain. Productivity, in turn, sets wealth in terms of wages,
returns to capital and natural resource endowments. Improved competitiveness
and profitability will create an “engine” for ongoing development in the technical,
social and professional spheres of the industry.
Subsector Sudy: Deciduous Fruit
2
3. Ensuring sustainable management of resources in the farming system.
This concerns the integrated outcome of economic, ecological and social
dimensions of the industry, which are measurable and monitored over time
and are as follows:
� Ongoing financial viability
� Risk management to alleviate potential adverse effects of climate, and
economic and market factors
� Reduction in outputs which put the environment at risk
� Production practices and processes that are socially and morally
acceptable
� Improved quality of life and biodiversity
In the FIP, 47 sub-strategies are identified to align the industry with the strategic plan for
South African agriculture (see Annexure 1). A number of issues raised and discussed in
this document are closely linked to the terms of reference of this subsector report.
Leadership organisations in the deciduous fruit industry have instituted a number of actions
based on the recommendations contained in the plan. The main focus areas are integral
components of the recommendations contained in the latter section of this subsector
report. These focus areas are as follows:
� BEE and land reform
� Rural development
� Human resource development
� Relationship with government
� Research and development, information and technology transfer
� Logistics and infrastructure
� Information and market intelligence
� Marketing and promotion of fruit
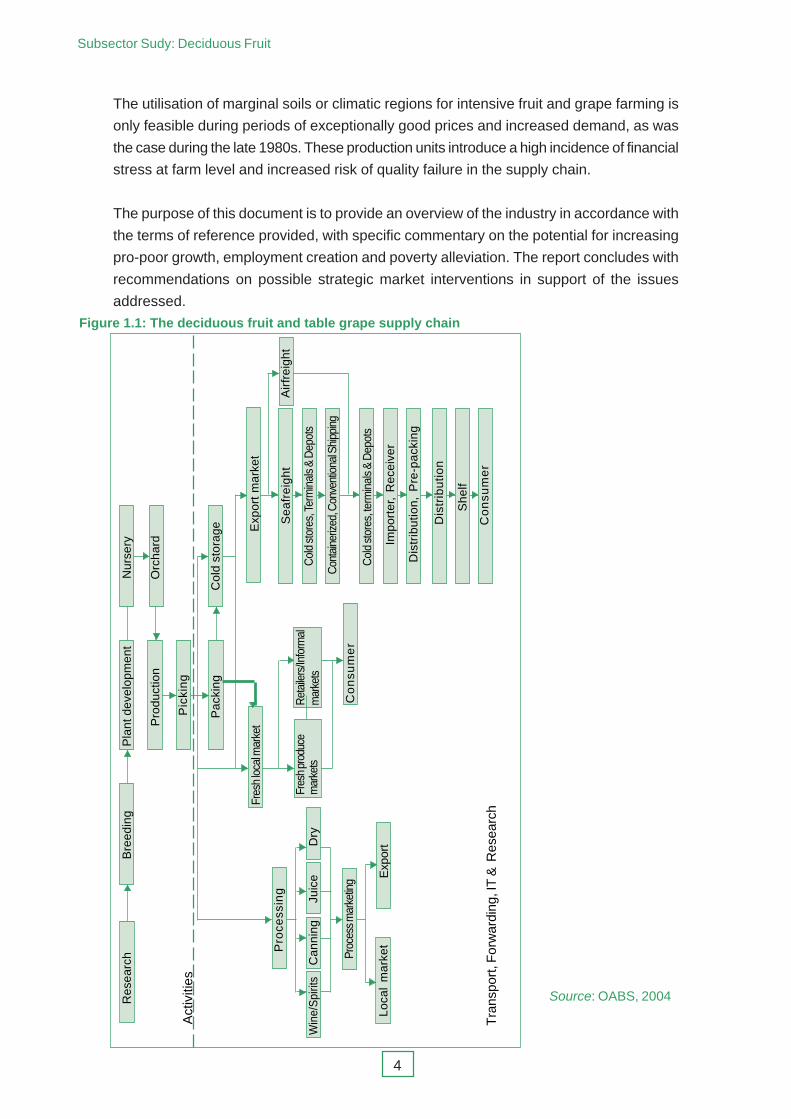
The supply chain is a complex linkage of various production and operational role-players
(see Figure 1.1). Other key stakeholders are producer organisations, organised labour,
NGOs, financial institutions and government.
Traceability measures to ensure food safety by means of various accreditation compliance
schemes (e.g. EurepGAP and HACCP) have been imposed by various foreign
supermarkets. Tracking, (monitoring the path and progress of consignments in the chain)
is of the utmost importance for the producer or packer as the business of exports is based
largely on consignment sales.
Growers, packers and exporters need ready access to point of sale (POS) information in
order to monitor progress, recognise opportunities and take corrective action on threatening
problems. O’Rourke (2006) stresses the matter of “reading market signals correctly”.
Subsector Sudy: Deciduous Fruit
3
High farm-gate returns resulting from currency exchange rates at times when market
values are static (e.g. late 1990s to 2002) are often interpreted incorrectly as the time to
plant. Consequently, recent large-scale plantings in developing Middle East countries will
result in Turkey, Iran, Pakistan and India becoming new players as significant suppliers of
low-cost apples during the new decade. Similarly, production is set to increase in southern
hemisphere countries. The key point is that orchards and vineyards come into full production
five to seven years after planting.
The deciduous fruit industry is capital, technology and labour intensive. Furthermore, it is
very site specific in terms of climatic characteristics, namely:
� Mediterranean type climate – cold winters and hot dry summers
� Temperature
� Winter chill factor for completion of dormancy prior to bud break in spring
� Moderate average maximum temperature range in summer
� Moderate diurnal temperature variation during the growth period
� Cooling of night temperature levels in autumn (for good fruit colour)
� Precipitation
� Water requirement in excess of 600 mm (effective rainfall or
supplementary irrigation), spread over the growing season; winter rain
run-off channelled into dams and storage reservoirs
� Absence of early frost in March and April
� Absence of late frost during the bloom period and the first month of fruit
growth
� Absence of hail during the growing season
� Absence of long wet and cool weather conditions during harvest periods
� Wind – very low incidence of strong winds during the growing season
� Relative humidity – low levels of humidity which do not favour the
development of plant diseases on young foliage or fruit
Orchard and vineyard soils are an integral link in the terroir (plant/climate/soil) concept of
sustainable farming systems. Soils which have the capacity to sustain high yields and
good crop quality are deep, well drained and well aerated with structural stability derived
from the following:
� In situ weathering of the profile, giving rise to apedal or moderate blocky
structured B horizons
� Biologically transformed alluvial and colluvial deposits
� In-site, long-term weathering of ancient tilted shales, giving rise to stable loamy
B horizons
� Sandy landscapes in river valleys (especially for grapes)
Subsector Sudy: Deciduous Fruit
4
The utilisation of marginal soils or climatic regions for intensive fruit and grape farming is
only feasible during periods of exceptionally good prices and increased demand, as was
the case during the late 1980s. These production units introduce a high incidence of financial
stress at farm level and increased risk of quality failure in the supply chain.
The purpose of this document is to provide an overview of the industry in accordance with
the terms of reference provided, with specific commentary on the potential for increasing
pro-poor growth, employment creation and poverty alleviation. The report concludes with
recommendations on possible strategic market interventions in support of the issues
addressed.
Res
earc
h
Bre
edin
g
P
lant
dev
elop
men
t
N
urse
ry
Pro
duct
ion
O
rcha
rd
Pic
kin
g
Pac
king
Col
d st
orag
e Exp
ort
mar
ket
Airf
reig
htS
eafr
eigh
t
Col
d st
ores
, Ter
min
als &
Dep
ots
Con
tain
erize
d, C
onve
ntio
nal S
hipp
ing
Col
d st
ores
, ter
min
als &
Dep
ots
Impo
rter
, R
ecei
ver
Dis
trib
utio
n, P
re-p
acki
ng
Dis
trib
utio
n
She
lf
Co
nsu
me
r
Fres
h lo
cal m
arke
t
Fres
h pr
oduc
em
arke
tsR
etai
lers
/Info
rmal
mar
kets
Co
nsu
me
r
Pro
cess
ing
Win
e/S
pirit
s
Can
ning
Juic
e
Dry
Proc
ess m
arke
ting
Loca
l m
arke
tE
xpor
t
Act
iviti
es
Tra
nspo
rt, F
orw
ardi
ng, I
T &
Res
earc
h
Figure 1.1: The deciduous fruit and table grape supply chain
Source: OABS, 2004
Subsector Sudy: Deciduous Fruit
5
"� ������� ���� �
This section gives attention to the types of firms and the organised associations in the
subsector. Employment, skills and labour absorption are discussed, with particular
emphasis on low-skilled jobs and poverty reduction. The section ends with an overview of
inputs.
��� ����������� �����
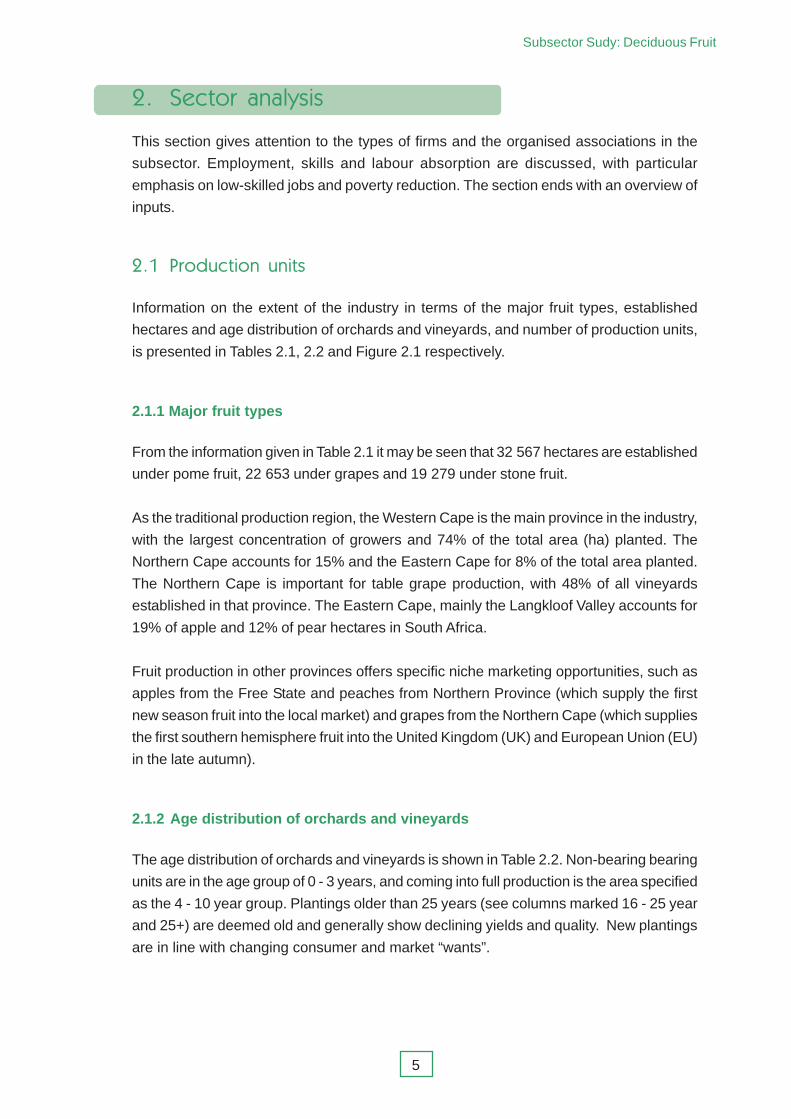
Information on the extent of the industry in terms of the major fruit types, established
hectares and age distribution of orchards and vineyards, and number of production units,
is presented in Tables 2.1, 2.2 and Figure 2.1 respectively.
2.1.1 Major fruit types
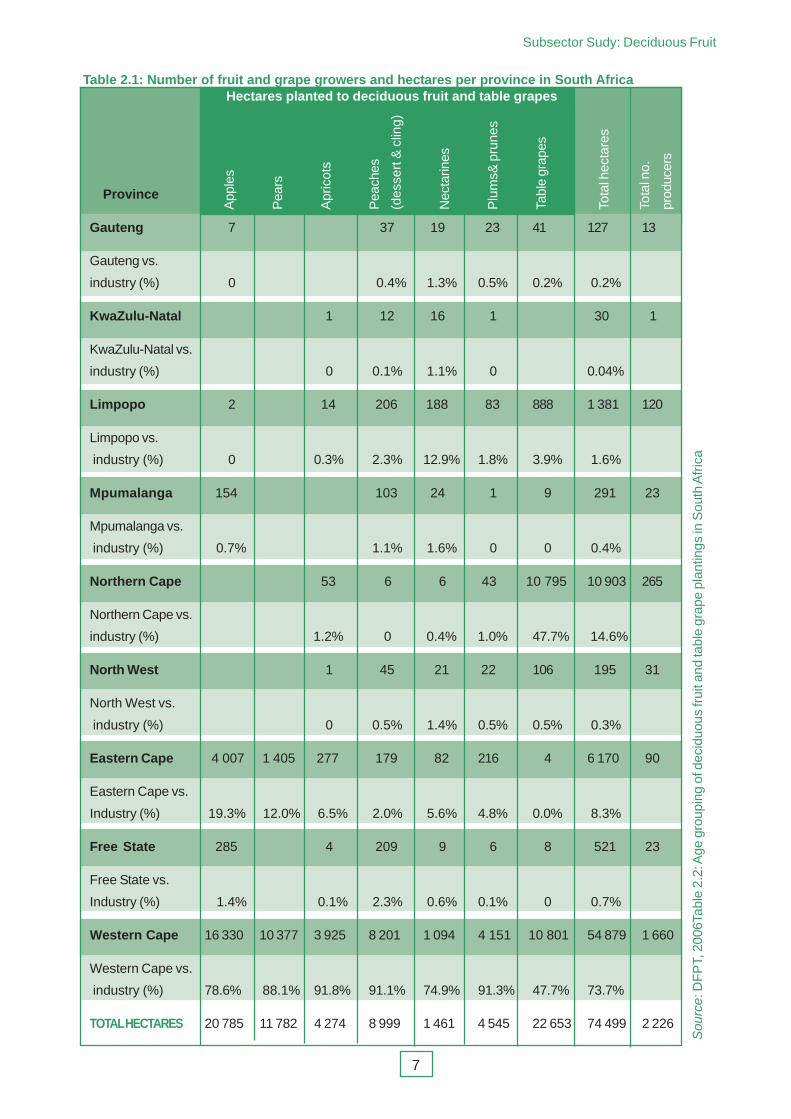
From the information given in Table 2.1 it may be seen that 32 567 hectares are established
under pome fruit, 22 653 under grapes and 19 279 under stone fruit.
As the traditional production region, the Western Cape is the main province in the industry,
with the largest concentration of growers and 74% of the total area (ha) planted. The
Northern Cape accounts for 15% and the Eastern Cape for 8% of the total area planted.
The Northern Cape is important for table grape production, with 48% of all vineyards
established in that province. The Eastern Cape, mainly the Langkloof Valley accounts for
19% of apple and 12% of pear hectares in South Africa.
Fruit production in other provinces offers specific niche marketing opportunities, such as
apples from the Free State and peaches from Northern Province (which supply the first
new season fruit into the local market) and grapes from the Northern Cape (which supplies
the first southern hemisphere fruit into the United Kingdom (UK) and European Union (EU)
in the late autumn).
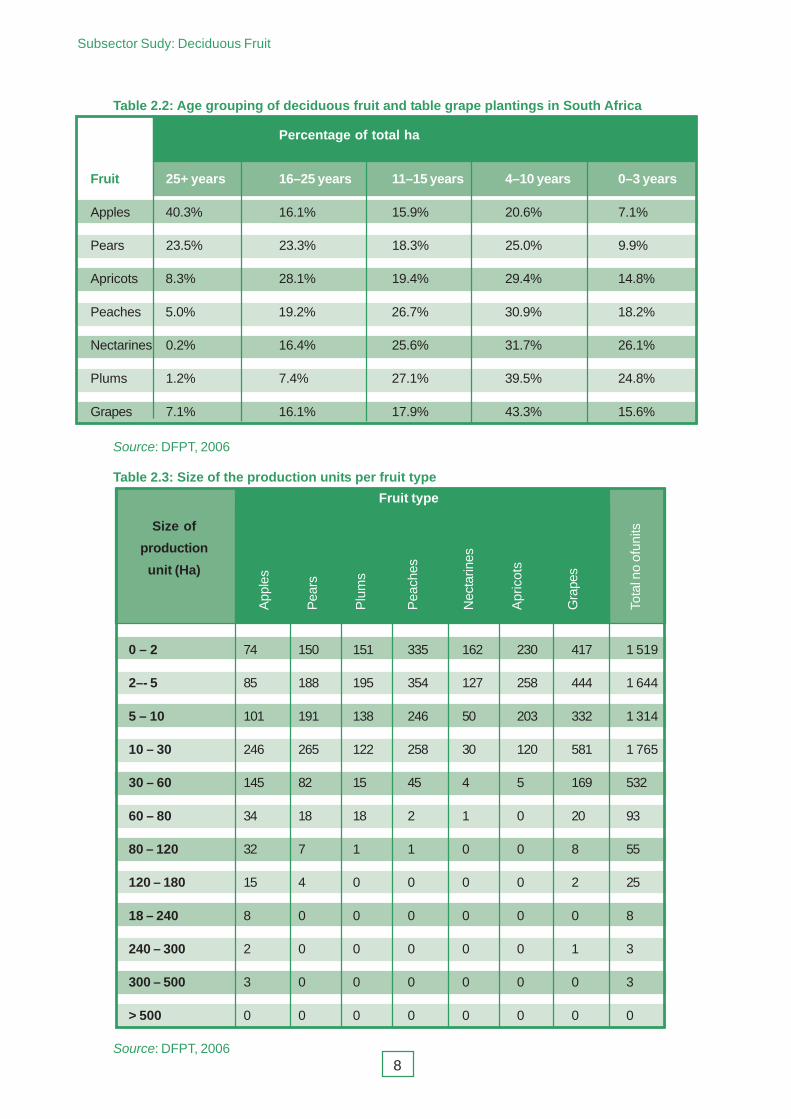
2.1.2 Age distribution of orchards and vineyards
The age distribution of orchards and vineyards is shown in Table 2.2. Non-bearing bearing
units are in the age group of 0 - 3 years, and coming into full production is the area specified
as the 4 - 10 year group. Plantings older than 25 years (see columns marked 16 - 25 year
and 25+) are deemed old and generally show declining yields and quality. New plantings
are in line with changing consumer and market “wants”.

Subsector Sudy: Deciduous Fruit
6
Industry data reflects that intensive orchard replacement (younger than 10 years) in major
fruit types has taken place since 1995. In apples, new plantings (28%) indicate mere
replacement of older orchards (40%) and increased volumes of new cultivars will be the
result of good horticultural management. In pears, orchards under good management are
productive beyond 25 years and the relatively high ratio of new plantings (34%) indicates
increased market volumes during the next five years.
The life expectancy of stone fruit orchards is 18 years. Nectarines and plums reflect a
high percentage of new plantings, which will result in increased market volumes between
2007 and 2012. The high percentage of full bearing orchards in the case of plums (40%)
indicates that the production volumes will remain strong during the next five years, while
with grapes, 60% of vineyards are of prime age, with a good ratio of new plantings as
replacement for the older hectares.
2.1.3 Number of production units
Information presented in Table 2.3 is based on the number of farms under fruit production
and not the number or size of business units. The “fruit basket mix”, or number of fruit
types per farm, is presented in Figure 2.1.
The information based on hectares reflects that the majority of fruit production units are
smaller than 30 ha, thus indicating membership of cooperative or company pack house
facilities (e.g. the large pack house and fruit storage facilities in most Boland towns).
Grapes are packed on the farm close to the site of production. Harvesting and packing are
labour intensive operations and economies of scale are critical, hence the predominance
of small units.
Production units larger than 30 hectares are found mainly in apple-growing. A number of
apple growers (units larger than 60 hectares) also operate their own packing and cold
storage operations. Economies of scale and consistency in yield and quality are three key
characteristics of these operations.
Subsector Sudy: Deciduous Fruit
7
Gauteng 7 37 19 23 41 127 13
Gauteng vs.
industry (%) 0 0.4% 1.3% 0.5% 0.2% 0.2%
KwaZulu-Natal 1 12 16 1 30 1
KwaZulu-Natal vs.
industry (%) 0 0.1% 1.1% 0 0.04%
Limpopo 2 14 206 188 83 888 1 381 120
Limpopo vs.
industry (%) 0 0.3% 2.3% 12.9% 1.8% 3.9% 1.6%
Mpumalanga 154 103 24 1 9 291 23
Mpumalanga vs.
industry (%) 0.7% 1.1% 1.6% 0 0 0.4%
Northern Cape 53 6 6 43 10 795 10 903 265
Northern Cape vs.
industry (%) 1.2% 0 0.4% 1.0% 47.7% 14.6%
North West 1 45 21 22 106 195 31
North West vs.
industry (%) 0 0.5% 1.4% 0.5% 0.5% 0.3%
Eastern Cape 4 007 1 405 277 179 82 216 4 6 170 90
Eastern Cape vs.
Industry (%) 19.3% 12.0% 6.5% 2.0% 5.6% 4.8% 0.0% 8.3%
Free State 285 4 209 9 6 8 521 23
Free State vs.
Industry (%) 1.4% 0.1% 2.3% 0.6% 0.1% 0 0.7%
Western Cape 16 330 10 377 3 925 8 201 1 094 4 151 10 801 54 879 1 660
Western Cape vs.
industry (%) 78.6% 88.1% 91.8% 91.1% 74.9% 91.3% 47.7% 73.7%
TOTAL HECTARES 20 785 11 782 4 274 8 999 1 461 4 545 22 653 74 499 2 226
Province
Hectares planted to deciduous fruit and table grapes
App
les
Pea
rs
Apr
icot
s
Pea
ches
(des
sert
& c
ling)
Nec
tarin
es
Plu
ms&
pru
nes
Tabl
e gr
apes
Tota
l hec
tare
s
Tota
l no.
prod
ucer
s
Table 2.1: Number of fruit and grape growers and hectares per province in South Africa
Sou
rce:
DF
PT,
200
6Tab
le 2
.2: A
ge g
roup
ing
of d
ecid
uous
frui
t and
tabl
e gr
ape
plan
tings
in S
outh
Afr
ica
Subsector Sudy: Deciduous Fruit
8
Table 2.3: Size of the production units per fruit type
Percentage of total ha
Fruit 25+ years 16–25 years 11–15 years 4–10 years 0–3 years
Apples 40.3% 16.1% 15.9% 20.6% 7.1%
Pears 23.5% 23.3% 18.3% 25.0% 9.9%
Apricots 8.3% 28.1% 19.4% 29.4% 14.8%
Peaches 5.0% 19.2% 26.7% 30.9% 18.2%
Nectarines 0.2% 16.4% 25.6% 31.7% 26.1%
Plums 1.2% 7.4% 27.1% 39.5% 24.8%
Grapes 7.1% 16.1% 17.9% 43.3% 15.6%
Table 2.2: Age grouping of deciduous fruit and table grape plantings in South Africa
Source: DFPT, 2006
0 – 2 74 150 151 335 162 230 417 1 519
2–- 5 85 188 195 354 127 258 444 1 644
5 – 10 101 191 138 246 50 203 332 1 314
10 – 30 246 265 122 258 30 120 581 1 765
30 – 60 145 82 15 45 4 5 169 532
60 – 80 34 18 18 2 1 0 20 93
80 – 120 32 7 1 1 0 0 8 55
120 – 180 15 4 0 0 0 0 2 25
18 – 240 8 0 0 0 0 0 0 8
240 – 300 2 0 0 0 0 0 1 3
300 – 500 3 0 0 0 0 0 0 3
> 500 0 0 0 0 0 0 0 0
Size of
production
unit (Ha)
Fruit type
App
les
Pea
rs
Plu
ms
Pea
ches
Nec
tarin
es
Apr
icot
s
Gra
pes
Tota
l no
ofun
its
Source: DFPT, 2006
Subsector Sudy: Deciduous Fruit
9
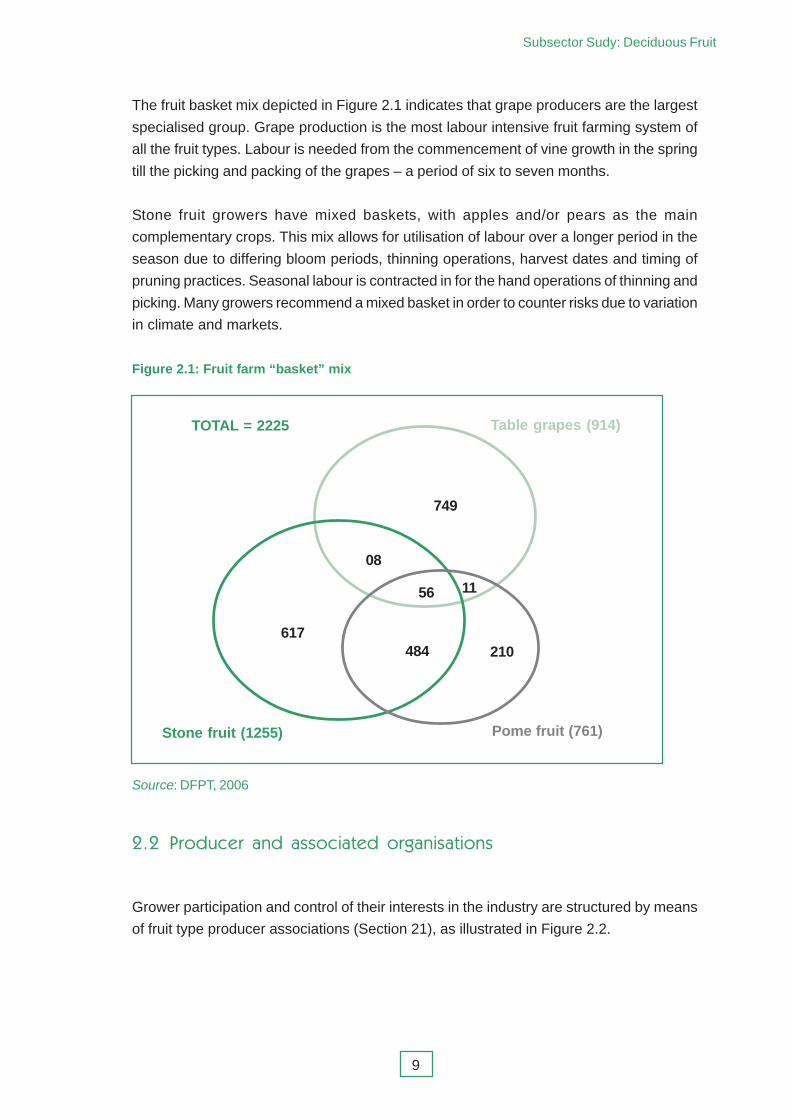
The fruit basket mix depicted in Figure 2.1 indicates that grape producers are the largest
specialised group. Grape production is the most labour intensive fruit farming system of
all the fruit types. Labour is needed from the commencement of vine growth in the spring
till the picking and packing of the grapes – a period of six to seven months.
Stone fruit growers have mixed baskets, with apples and/or pears as the main
complementary crops. This mix allows for utilisation of labour over a longer period in the
season due to differing bloom periods, thinning operations, harvest dates and timing of
pruning practices. Seasonal labour is contracted in for the hand operations of thinning and
picking. Many growers recommend a mixed basket in order to counter risks due to variation
in climate and markets.
Figure 2.1: Fruit farm “basket” mix
TOTAL = 2225 Table grapes (914)
749
08
56 11
210484617
Stone fruit (1255) Pome fruit (761)
Source: DFPT, 2006
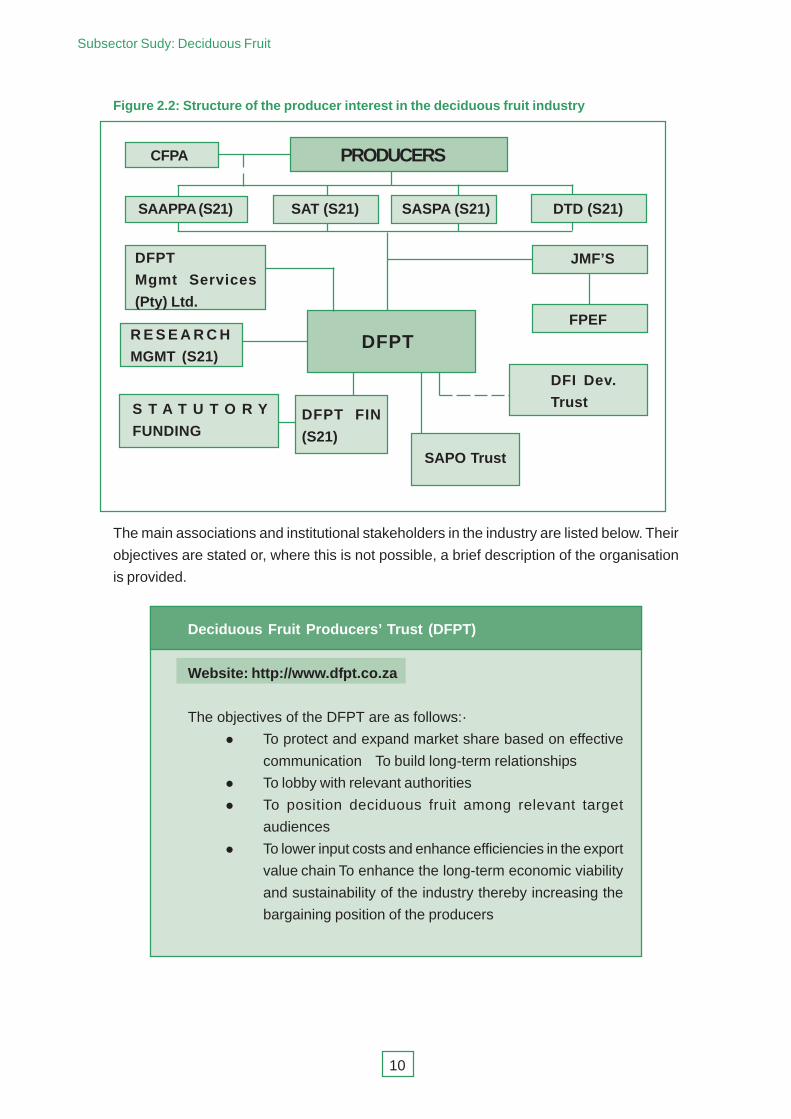
��� ��������� ��� ��������� �����������
Grower participation and control of their interests in the industry are structured by means
of fruit type producer associations (Section 21), as illustrated in Figure 2.2.
Subsector Sudy: Deciduous Fruit
10
Figure 2.2: Structure of the producer interest in the deciduous fruit industry
PRODUCERSCFPA
SAAPPA (S21) SAT (S21) SASPA (S21) DTD (S21)
DFPT
Mgmt Services
(Pty) Ltd.
R E S E A R C H
MGMT (S21)DFPT
S T A T U T O R Y
FUNDINGDFPT FIN
(S21)
JMF’S
FPEF
DFI Dev.
Trust
SAPO Trust
The main associations and institutional stakeholders in the industry are listed below. Their
objectives are stated or, where this is not possible, a brief description of the organisation
is provided.
Deciduous Fruit Producers’ Trust (DFPT)
Website: http://www.dfpt.co.za
The objectives of the DFPT are as follows:·
� To protect and expand market share based on effective
communication To build long-term relationships
� To lobby with relevant authorities
� To position deciduous fruit among relevant target
audiences
� To lower input costs and enhance efficiencies in the export
value chain To enhance the long-term economic viability
and sustainability of the industry thereby increasing the
bargaining position of the producers
Subsector Sudy: Deciduous Fruit
11
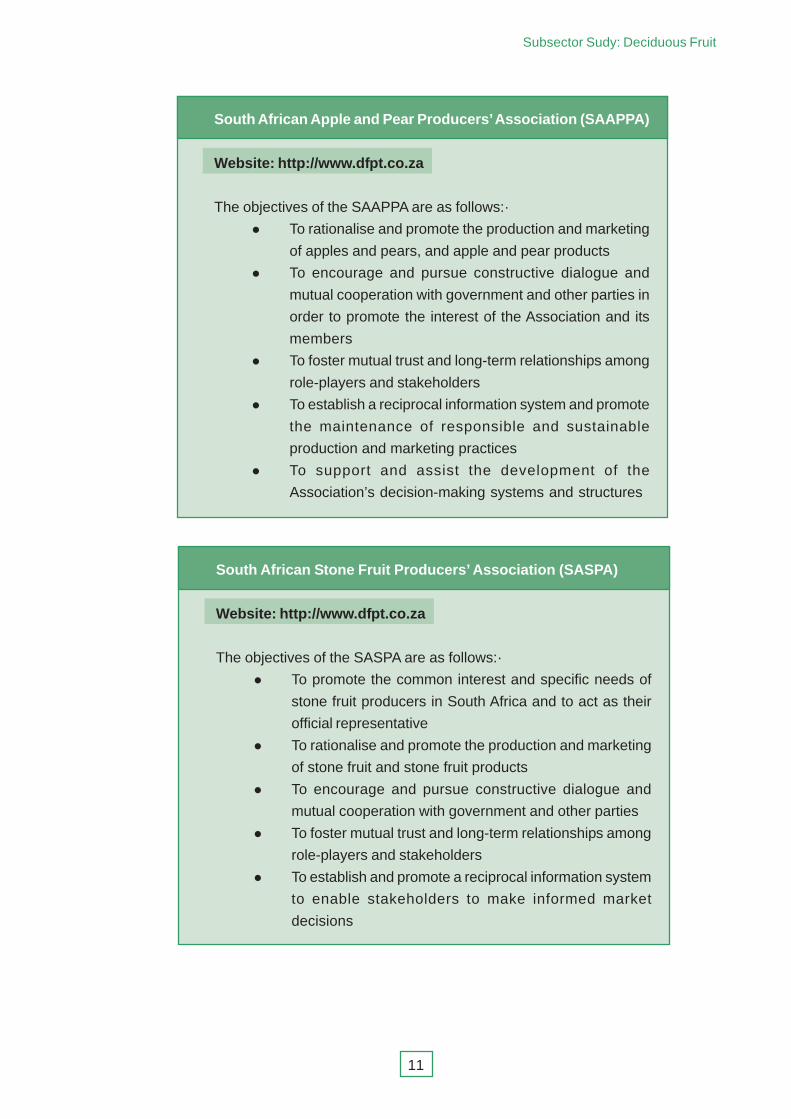
South African Apple and Pear Producers’ Association (SAAPPA)
Website: http://www.dfpt.co.za
The objectives of the SAAPPA are as follows:·
� To rationalise and promote the production and marketing
of apples and pears, and apple and pear products
� To encourage and pursue constructive dialogue and
mutual cooperation with government and other parties in
order to promote the interest of the Association and its
members
� To foster mutual trust and long-term relationships among
role-players and stakeholders
� To establish a reciprocal information system and promote
the maintenance of responsible and sustainable
production and marketing practices
� To support and assist the development of the
Association’s decision-making systems and structures
South African Stone Fruit Producers’ Association (SASPA)
Website: http://www.dfpt.co.za
The objectives of the SASPA are as follows:·
� To promote the common interest and specific needs of
stone fruit producers in South Africa and to act as their
official representative
� To rationalise and promote the production and marketing
of stone fruit and stone fruit products
� To encourage and pursue constructive dialogue and
mutual cooperation with government and other parties
� To foster mutual trust and long-term relationships among
role-players and stakeholders
� To establish and promote a reciprocal information system
to enable stakeholders to make informed market
decisions
Subsector Sudy: Deciduous Fruit
12
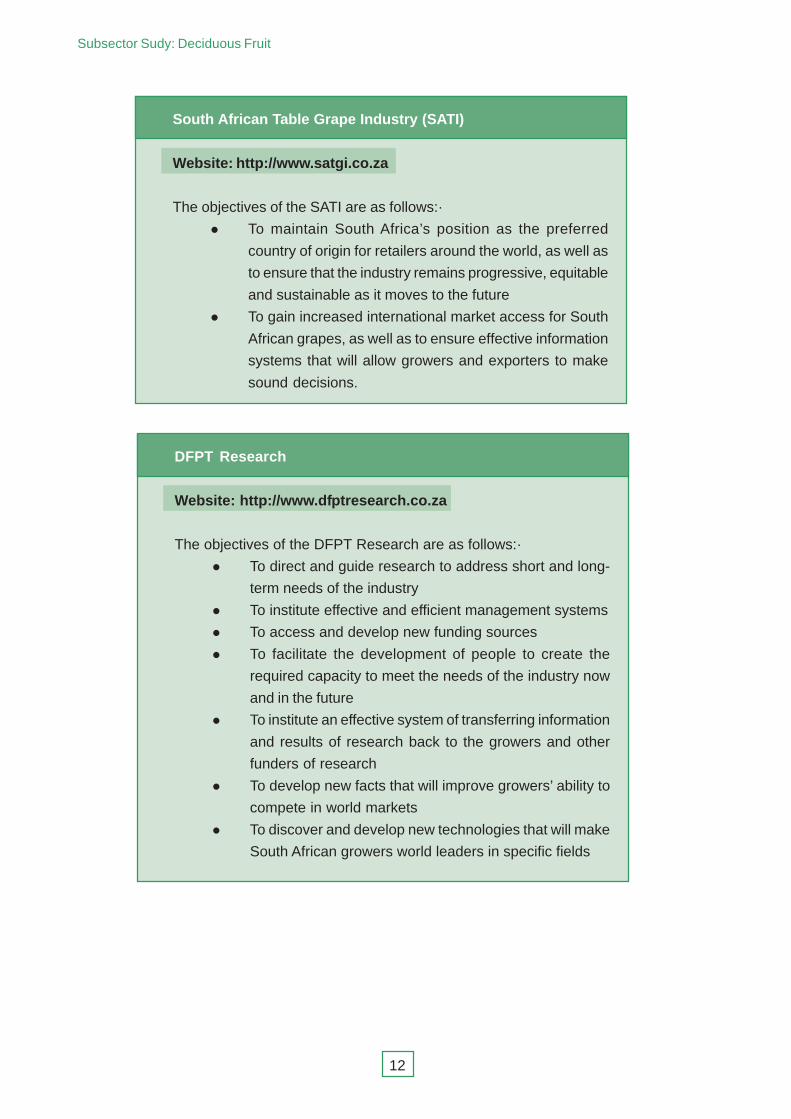
South African Table Grape Industry (SATI)
Website: http://www.satgi.co.za
The objectives of the SATI are as follows:·
� To maintain South Africa’s position as the preferred
country of origin for retailers around the world, as well as
to ensure that the industry remains progressive, equitable
and sustainable as it moves to the future
� To gain increased international market access for South
African grapes, as well as to ensure effective information
systems that will allow growers and exporters to make
sound decisions.
DFPT Research
Website: http://www.dfptresearch.co.za
The objectives of the DFPT Research are as follows:·
� To direct and guide research to address short and long-
term needs of the industry
� To institute effective and efficient management systems
� To access and develop new funding sources
� To facilitate the development of people to create the
required capacity to meet the needs of the industry now
and in the future
� To institute an effective system of transferring information
and results of research back to the growers and other
funders of research
� To develop new facts that will improve growers’ ability to
compete in world markets
� To discover and develop new technologies that will make
South African growers world leaders in specific fields
Subsector Sudy: Deciduous Fruit
13
Fresh Produce Exporters’ Forum (FPEF)
Website: http://www.fpef.co.za
The objectives of the SATI are as follows:·
� The FPEF is a unique consortium of 70 South African
companies. These companies collectively export nearly
90% of all fresh fruit volumes from South Africa.
� The forum sees itself as the international community’s
gateway to providing South Africa’s finest quality produce
from highly reputable South African exporters.
� Membership of the FPEF is open to all exporters, export
agents, grower-exporters and service providers as well
as to the major producer associations.
Perishable Products Export Control Board (PPECB)
Website: http://www.ppecb.com
The objectives of the PPECB are as follows:·
� To advise producers with regard to harvest readiness/
ripeness, pre-harvest grading and orchard residue
samples
� To carry out product inspection (at Inland Pack house or
Intake Depot)
� To provide export notification by means of capturing data
and handling enquiries for information and advice on
optimum post-harvest procedures and carrying conditions
� To handle cold store registration
Food and Allied Workers’ Union (FAWU)
Website: http://www.cosatu.org.za
The objectives of the FAWU are as follows:·
� To improve the material conditions of its members and of
the working people as a whole
� To organise the unorganised
� To ensure worker participation in the struggle for peace
and democracy principles
Subsector Sudy: Deciduous Fruit
14
National African Farmers’ Union (NAFU)
Website:
The objectives of NAFU are as follows:·
� To lobby for policy reforms aimed at levelling the field in
all agricultural matters with particular reference to land
acquisition, agricultural funding, market access and public
policy
� To lobby for the provision of appropriate services, such
as extension, marketing and credit to members
� To identify, quantify and address the needs of members
� To facilitate the provision of training
� To empower women and young people so as to enable
them to participate fully in farming activities
Agricultural Research Council (ARC)
Website: http://www.arc.agric.za
The objectives of the ARC are as follows:·
� To commercialise resource poor agriculture
� To improve natural resource use and management
� To provide information service support
� To improve competitiveness
� To enhance quality of life
National Agricultural Marketing Council (NAMC)
Website: http://www.namc.co.za
The objectives of the NAMC are as follows:·
� To engage in the minimum market intervention
� To increase market access for all market participants
� To promote efficient marketing of agricultural products
� To optimise export earnings of agricultural products
� To enhance the viability of the agricultural sector
Subsector Sudy: Deciduous Fruit
15
��� ����� ���������
The Fresh Produce Exporters’ Forum (FPEF) is made up of voluntary members drawn
from agents and companies engaged in the business of export within the industry. Current
members include 88 of 172 registered exporters, representing more than 80% of exported
volumes
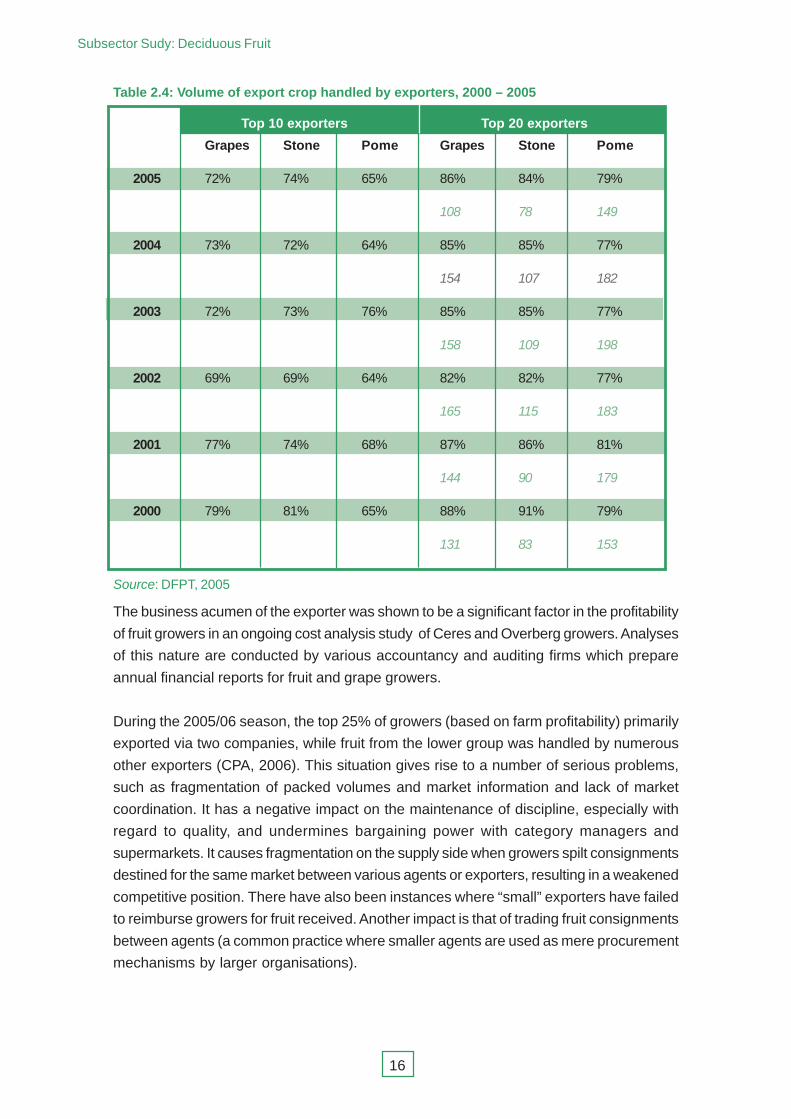
As may be seen from Table 2.4, there is an imbalance in this secondary activity of the
supply chain in that in 2005 the top 20 exporters accounted for 86% of total grape exports,
84% of stone fruit and 79% of pome fruit exports. The italic number represents the number
of exporters responsible for export of the remaining volumes. Thus in 2005, 108 exporters
were responsible for exporting 14% of total grape exports, 16% of stone fruit and 21% of
pome fruit exports. A decreasing trend is evident from 2002 to 2005 in the number of
smaller exporting companies.
South African Plant Improvement Organisation (SAPO)
Website: http://www.saplant.co.za
� SAPO is a specialist plant improvement organisation
owned by deciduous fruit growers, DFPT, CPA, and DTD.
� It is responsible for the production of certifiable,
propagation plant material.
� It is also responsible for phytosanitary and genetic
upgrading (improvement) of deciduous fruit plant material.
This includes virus elimination and testing, establishment
and maintenance of nucleus, foundation and mother
blocks, as well as the selection of propagation plant
material and trueness to variety controls
� SAPO is the main supplier of such propagation plant
material to deciduous fruit nurseries. In the order of 14
million propagation units are distributed to nurseries
annually.
� It is the distribution agent of more than 200 scion varieties
to deciduous tree and vine nurseries.
� It is a specialist in the importation of new varieties
worldwide and a leader in variety development and
commercialisation.
Subsector Sudy: Deciduous Fruit
16
Table 2.4: Volume of export crop handled by exporters, 2000 – 2005
Top 10 exporters Top 20 exporters
Grapes Stone Pome Grapes Stone Pome
2005 72% 74% 65% 86% 84% 79%
108 78 149
2004 73% 72% 64% 85% 85% 77%
154 107 182
2003 72% 73% 76% 85% 85% 77%
158 109 198
2002 69% 69% 64% 82% 82% 77%
165 115 183
2001 77% 74% 68% 87% 86% 81%
144 90 179
2000 79% 81% 65% 88% 91% 79%
131 83 153
Source: DFPT, 2005
The business acumen of the exporter was shown to be a significant factor in the profitability
of fruit growers in an ongoing cost analysis study of Ceres and Overberg growers. Analyses
of this nature are conducted by various accountancy and auditing firms which prepare
annual financial reports for fruit and grape growers.
During the 2005/06 season, the top 25% of growers (based on farm profitability) primarily
exported via two companies, while fruit from the lower group was handled by numerous
other exporters (CPA, 2006). This situation gives rise to a number of serious problems,
such as fragmentation of packed volumes and market information and lack of market
coordination. It has a negative impact on the maintenance of discipline, especially with
regard to quality, and undermines bargaining power with category managers and
supermarkets. It causes fragmentation on the supply side when growers spilt consignments
destined for the same market between various agents or exporters, resulting in a weakened
competitive position. There have also been instances where “small” exporters have failed
to reimburse growers for fruit received. Another impact is that of trading fruit consignments
between agents (a common practice where smaller agents are used as mere procurement
mechanisms by larger organisations).
Subsector Sudy: Deciduous Fruit
17
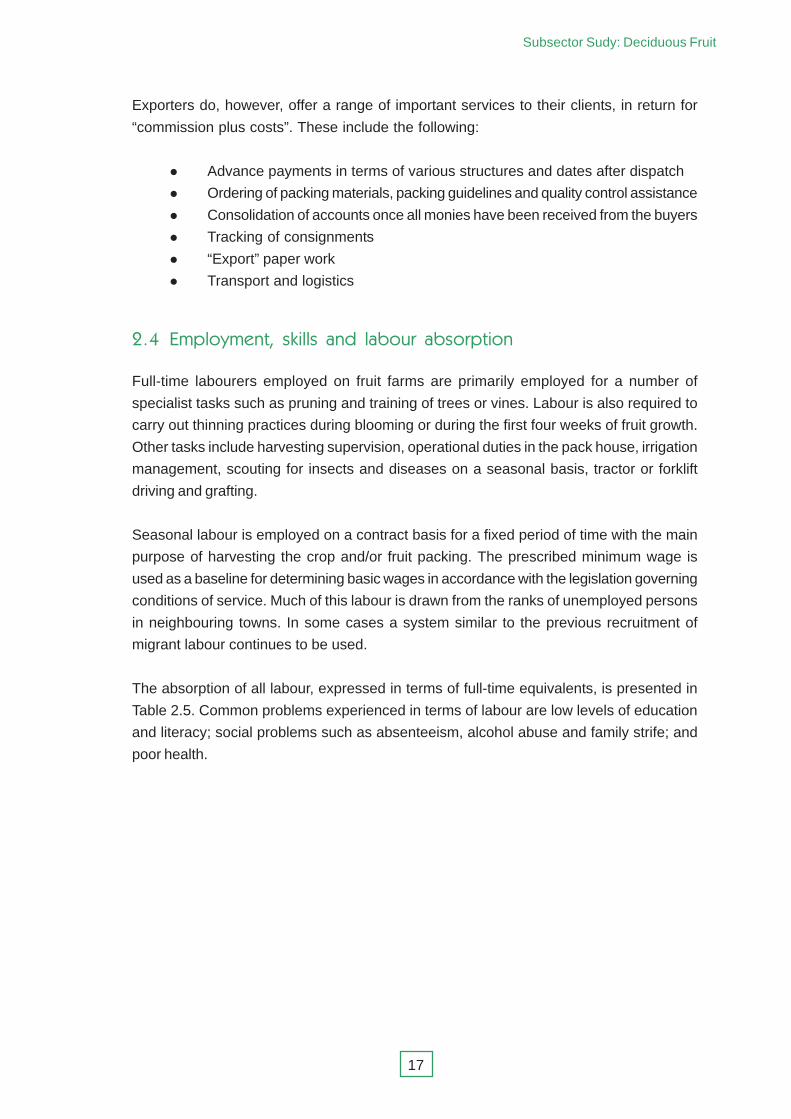
Exporters do, however, offer a range of important services to their clients, in return for
“commission plus costs”. These include the following:
� Advance payments in terms of various structures and dates after dispatch
� Ordering of packing materials, packing guidelines and quality control assistance
� Consolidation of accounts once all monies have been received from the buyers
� Tracking of consignments
� “Export” paper work
� Transport and logistics
��� ����������� �!����� ��� ����� ��������
Full-time labourers employed on fruit farms are primarily employed for a number of
specialist tasks such as pruning and training of trees or vines. Labour is also required to
carry out thinning practices during blooming or during the first four weeks of fruit growth.
Other tasks include harvesting supervision, operational duties in the pack house, irrigation
management, scouting for insects and diseases on a seasonal basis, tractor or forklift
driving and grafting.
Seasonal labour is employed on a contract basis for a fixed period of time with the main
purpose of harvesting the crop and/or fruit packing. The prescribed minimum wage is
used as a baseline for determining basic wages in accordance with the legislation governing
conditions of service. Much of this labour is drawn from the ranks of unemployed persons
in neighbouring towns. In some cases a system similar to the previous recruitment of
migrant labour continues to be used.
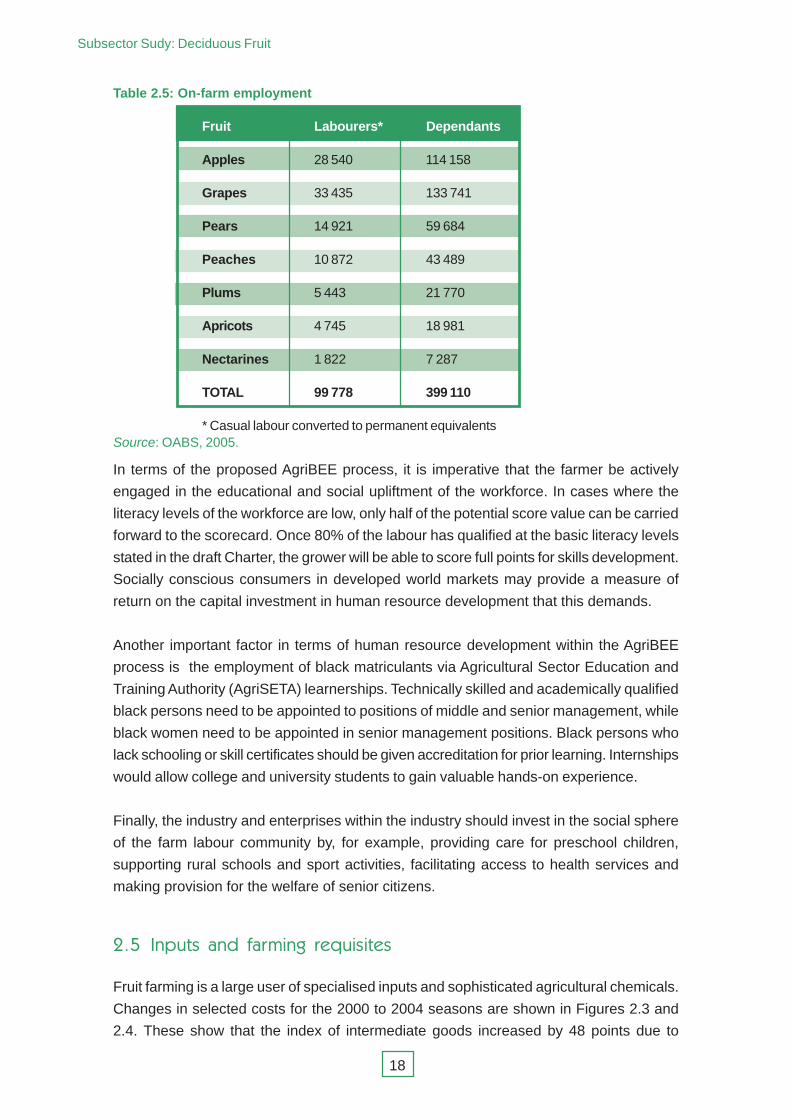
The absorption of all labour, expressed in terms of full-time equivalents, is presented in
Table 2.5. Common problems experienced in terms of labour are low levels of education
and literacy; social problems such as absenteeism, alcohol abuse and family strife; and
poor health.
Subsector Sudy: Deciduous Fruit
18
Table 2.5: On-farm employment
Fruit Labourers* Dependants
Apples 28 540 114 158
Grapes 33 435 133 741
Pears 14 921 59 684
Peaches 10 872 43 489
Plums 5 443 21 770
Apricots 4 745 18 981
Nectarines 1 822 7 287
TOTAL 99 778 399 110
* Casual labour converted to permanent equivalentsSource: OABS, 2005.
In terms of the proposed AgriBEE process, it is imperative that the farmer be actively
engaged in the educational and social upliftment of the workforce. In cases where the
literacy levels of the workforce are low, only half of the potential score value can be carried
forward to the scorecard. Once 80% of the labour has qualified at the basic literacy levels
stated in the draft Charter, the grower will be able to score full points for skills development.
Socially conscious consumers in developed world markets may provide a measure of
return on the capital investment in human resource development that this demands.
Another important factor in terms of human resource development within the AgriBEE
process is the employment of black matriculants via Agricultural Sector Education and
Training Authority (AgriSETA) learnerships. Technically skilled and academically qualified
black persons need to be appointed to positions of middle and senior management, while
black women need to be appointed in senior management positions. Black persons who
lack schooling or skill certificates should be given accreditation for prior learning. Internships
would allow college and university students to gain valuable hands-on experience.
Finally, the industry and enterprises within the industry should invest in the social sphere
of the farm labour community by, for example, providing care for preschool children,
supporting rural schools and sport activities, facilitating access to health services and
making provision for the welfare of senior citizens.
��" #������ ��� ������� ��$�������
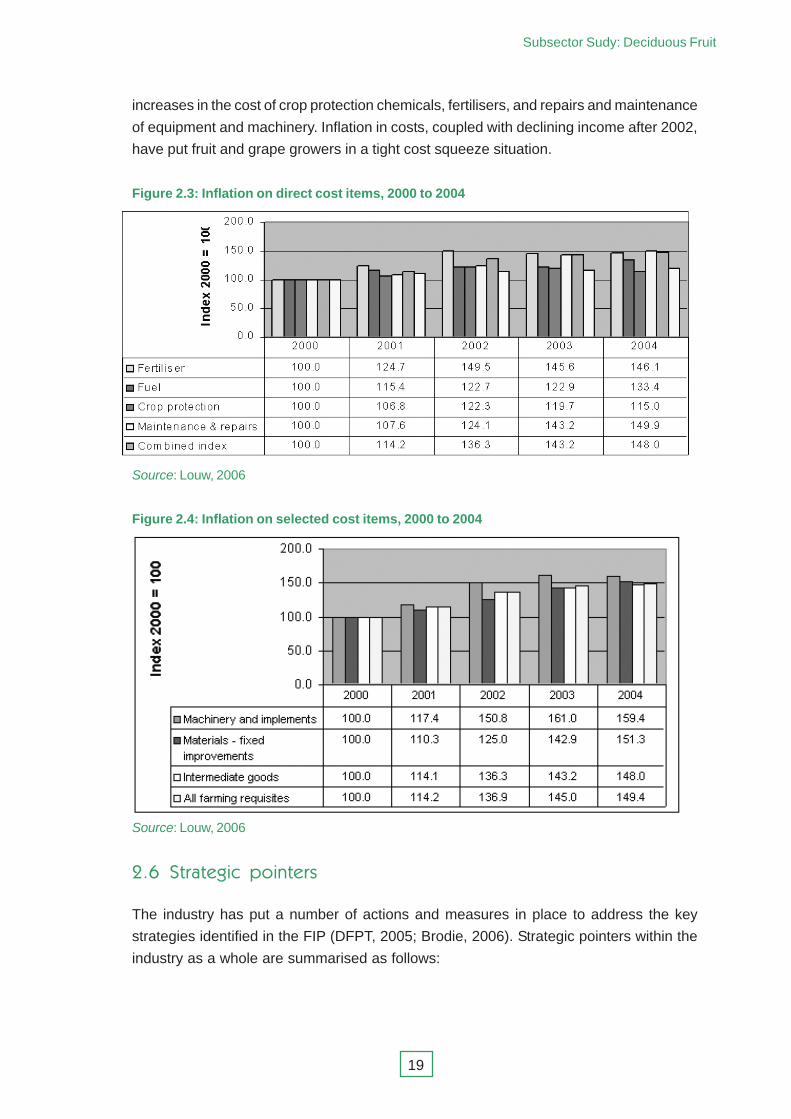
Fruit farming is a large user of specialised inputs and sophisticated agricultural chemicals.
Changes in selected costs for the 2000 to 2004 seasons are shown in Figures 2.3 and
2.4. These show that the index of intermediate goods increased by 48 points due to
Subsector Sudy: Deciduous Fruit
19
Source: Louw, 2006
��% &�������� ��������
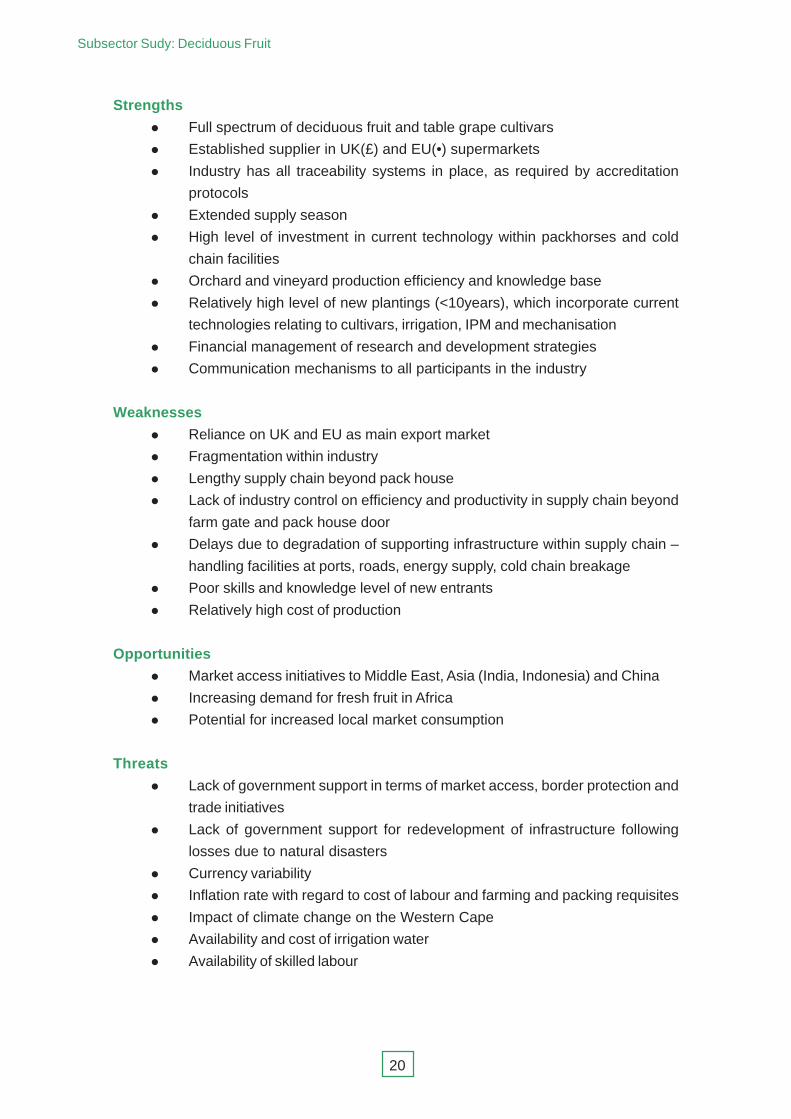
The industry has put a number of actions and measures in place to address the key
strategies identified in the FIP (DFPT, 2005; Brodie, 2006). Strategic pointers within the
industry as a whole are summarised as follows:
increases in the cost of crop protection chemicals, fertilisers, and repairs and maintenance
of equipment and machinery. Inflation in costs, coupled with declining income after 2002,
have put fruit and grape growers in a tight cost squeeze situation.
Figure 2.3: Inflation on direct cost items, 2000 to 2004
Source: Louw, 2006
Figure 2.4: Inflation on selected cost items, 2000 to 2004
Subsector Sudy: Deciduous Fruit
20
Strengths
� Full spectrum of deciduous fruit and table grape cultivars
� Established supplier in UK(£) and EU(•) supermarkets
� Industry has all traceability systems in place, as required by accreditation
protocols
� Extended supply season
� High level of investment in current technology within packhorses and cold
chain facilities
� Orchard and vineyard production efficiency and knowledge base
� Relatively high level of new plantings (<10years), which incorporate current
technologies relating to cultivars, irrigation, IPM and mechanisation
� Financial management of research and development strategies
� Communication mechanisms to all participants in the industry
Weaknesses
� Reliance on UK and EU as main export market
� Fragmentation within industry
� Lengthy supply chain beyond pack house
� Lack of industry control on efficiency and productivity in supply chain beyond
farm gate and pack house door
� Delays due to degradation of supporting infrastructure within supply chain –
handling facilities at ports, roads, energy supply, cold chain breakage
� Poor skills and knowledge level of new entrants
� Relatively high cost of production
Opportunities
� Market access initiatives to Middle East, Asia (India, Indonesia) and China
� Increasing demand for fresh fruit in Africa
� Potential for increased local market consumption
Threats
� Lack of government support in terms of market access, border protection and
trade initiatives
� Lack of government support for redevelopment of infrastructure following
losses due to natural disasters
� Currency variability
� Inflation rate with regard to cost of labour and farming and packing requisites
� Impact of climate change on the Western Cape
� Availability and cost of irrigation water
� Availability of skilled labour
Subsector Sudy: Deciduous Fruit
21
#��$����� � ��� ����
This section provides an overview of trends in turnover, investment, imports and exports.
It summarises the markets in which the industry is operational and gives attention to
market and demand trends and competitiveness. Market opportunities and growth potential
are outlined and the impact on other agricultural subsectors is examined.
��� ��������� ��� &���'� (������ ������ ��� ������ ��� �'�� ���������!��
South African fruit and grapes are mainly destined for the traditional markets in the UK and
EU countries. Thus 70% of apples and 88% of grapes exported are absorbed by these
markets. However, with access to the global market, South African produce is now sold in
significant volumes in other developing northern hemisphere countries, such as the Far
and Middle East, Asia and Russia. Markets have also opened in Africa. The best farm-gate
prices are still obtained for products sold in UK£ and EU• currency, despite the various
accreditations required to participate in these markets.
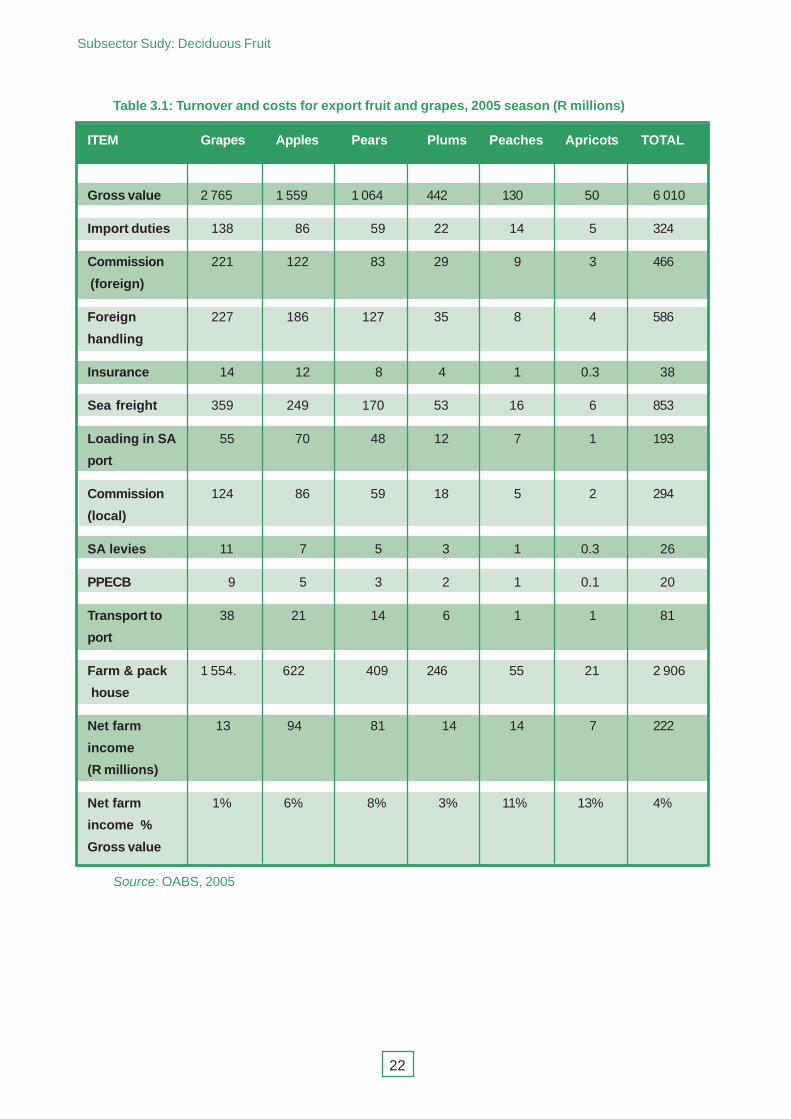
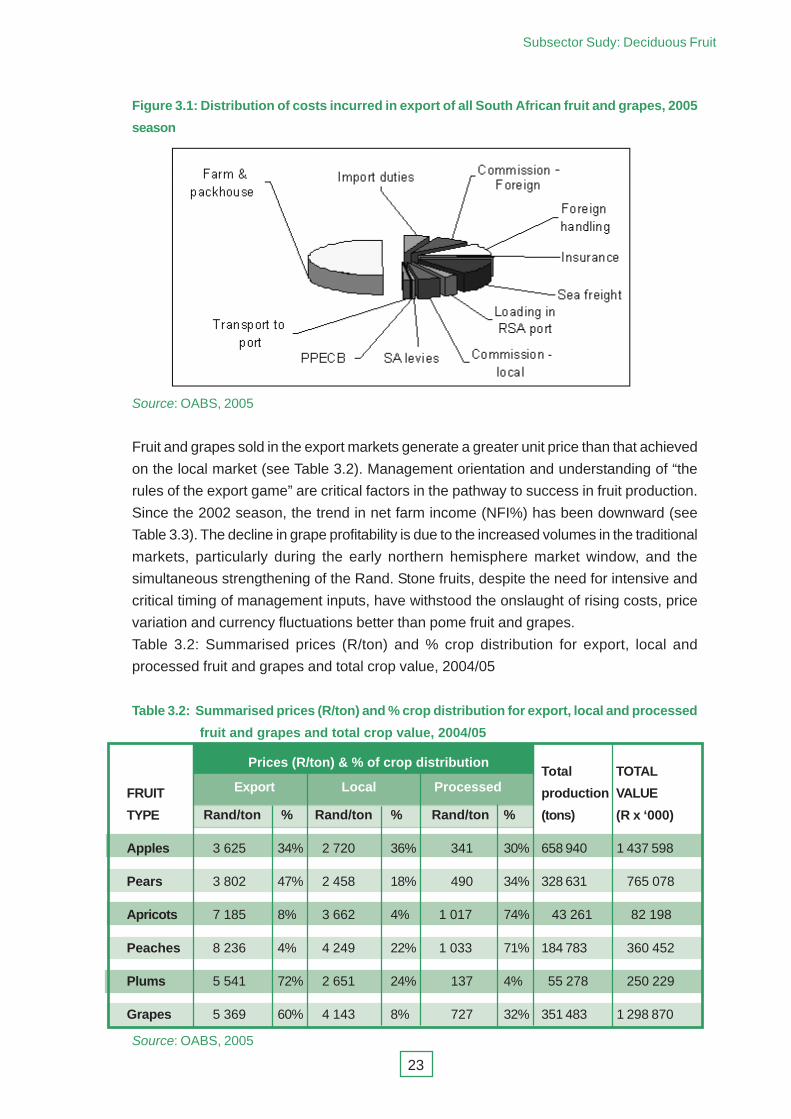
The fruit supply chain (see Figure 1.1) is a complex combination and integration of
stakeholders and role-players. Exports generate substantial off-farm value in terms of
monies paid for services and logistics, as shown in Table 3.1 and Figure 3.1 respectively.
In the current system of selling fruit on a consignment basis as it moves along the chain,
returns at the farm gate amount to only 10% to 20% of the gross product value.
Consequently, once the fruit leaves the farm or pack house, growers are exposed to
business risks which are not directly incurred by them.
Subsector Sudy: Deciduous Fruit
22
Table 3.1: Turnover and costs for export fruit and grapes, 2005 season (R millions)
ITEM Grapes Apples Pears Plums Peaches Apricots TOTAL
Gross value 2 765 1 559 1 064 442 130 50 6 010
Import duties 138 86 59 22 14 5 324
Commission 221 122 83 29 9 3 466
(foreign)
Foreign 227 186 127 35 8 4 586
handling
Insurance 14 12 8 4 1 0.3 38
Sea freight 359 249 170 53 16 6 853
Loading in SA 55 70 48 12 7 1 193
port
Commission 124 86 59 18 5 2 294
(local)
SA levies 11 7 5 3 1 0.3 26
PPECB 9 5 3 2 1 0.1 20
Transport to 38 21 14 6 1 1 81
port
Farm & pack 1 554. 622 409 246 55 21 2 906
house
Net farm 13 94 81 14 14 7 222
income
(R millions)
Net farm 1% 6% 8% 3% 11% 13% 4%
income %
Gross value
Source: OABS, 2005
Subsector Sudy: Deciduous Fruit
23
Figure 3.1: Distribution of costs incurred in export of all South African fruit and grapes, 2005
season
Source: OABS, 2005
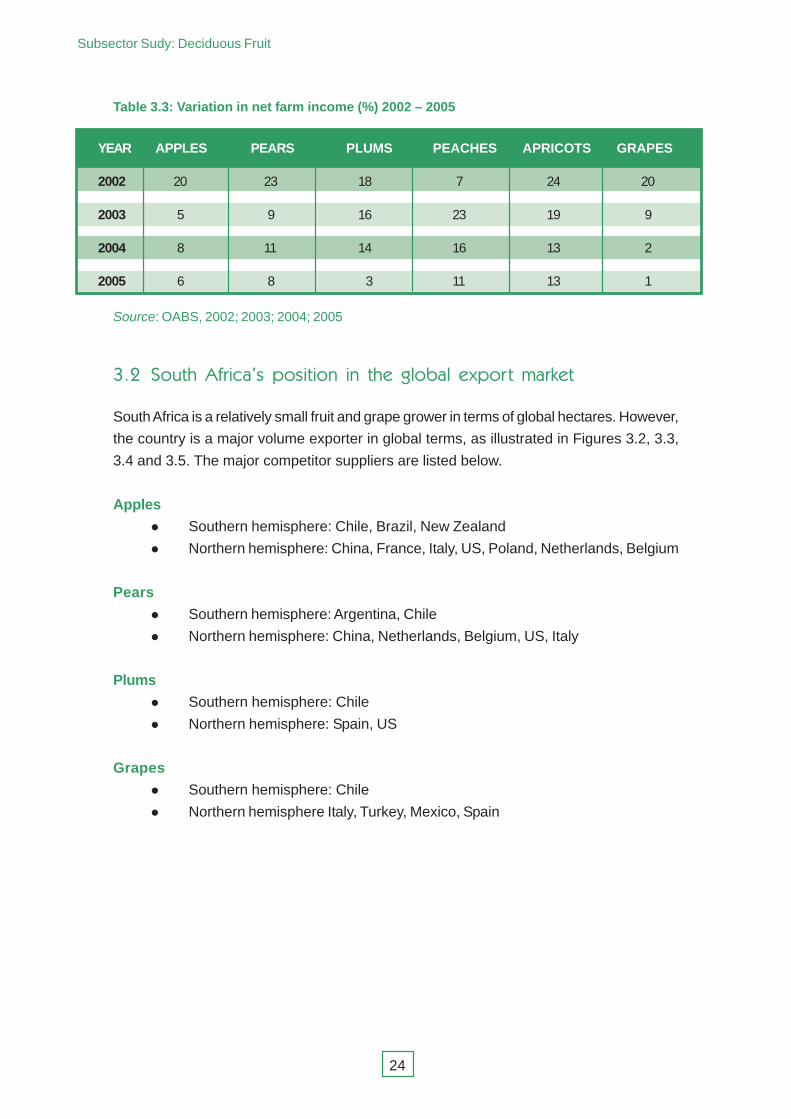
Fruit and grapes sold in the export markets generate a greater unit price than that achieved
on the local market (see Table 3.2). Management orientation and understanding of “the
rules of the export game” are critical factors in the pathway to success in fruit production.
Since the 2002 season, the trend in net farm income (NFI%) has been downward (see
Table 3.3). The decline in grape profitability is due to the increased volumes in the traditional
markets, particularly during the early northern hemisphere market window, and the
simultaneous strengthening of the Rand. Stone fruits, despite the need for intensive and
critical timing of management inputs, have withstood the onslaught of rising costs, price
variation and currency fluctuations better than pome fruit and grapes.
Table 3.2: Summarised prices (R/ton) and % crop distribution for export, local and
processed fruit and grapes and total crop value, 2004/05
Table 3.2: Summarised prices (R/ton) and % crop distribution for export, local and processed
fruit and grapes and total crop value, 2004/05
FRUIT
TYPE
Export Local ProcessedTotal
production
(tons)
Prices (R/ton) & % of crop distributionTOTAL
VALUE
(R x ‘000) Rand/ton % Rand/ton % Rand/ton %
Apples 3 625 34% 2 720 36% 341 30% 658 940 1 437 598
Pears 3 802 47% 2 458 18% 490 34% 328 631 765 078
Apricots 7 185 8% 3 662 4% 1 017 74% 43 261 82 198
Peaches 8 236 4% 4 249 22% 1 033 71% 184 783 360 452
Plums 5 541 72% 2 651 24% 137 4% 55 278 250 229
Grapes 5 369 60% 4 143 8% 727 32% 351 483 1 298 870
Source: OABS, 2005
Subsector Sudy: Deciduous Fruit
24
Table 3.3: Variation in net farm income (%) 2002 – 2005
YEAR APPLES PEARS PLUMS PEACHES APRICOTS GRAPES
2002 20 23 18 7 24 20
2003 5 9 16 23 19 9
2004 8 11 14 16 13 2
2005 6 8 3 11 13 1
Source: OABS, 2002; 2003; 2004; 2005
��� &���'� (����)�� ��������� ��� �'�� ����� ������� ��!��
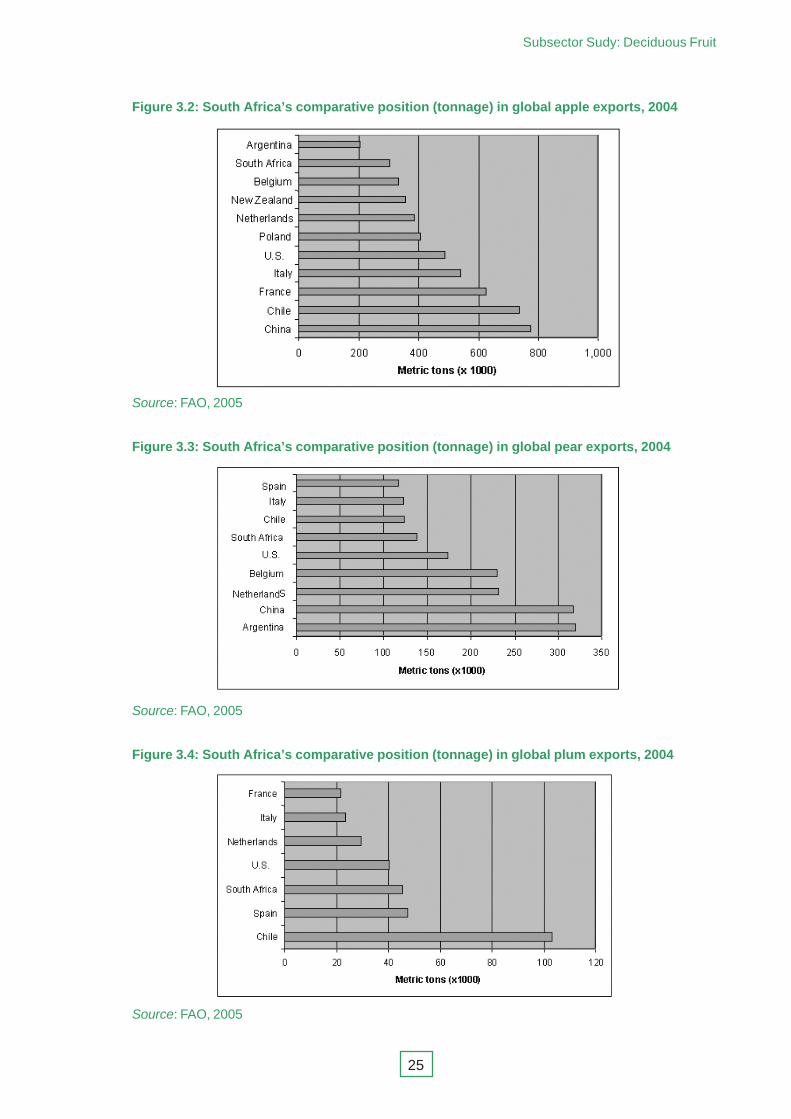
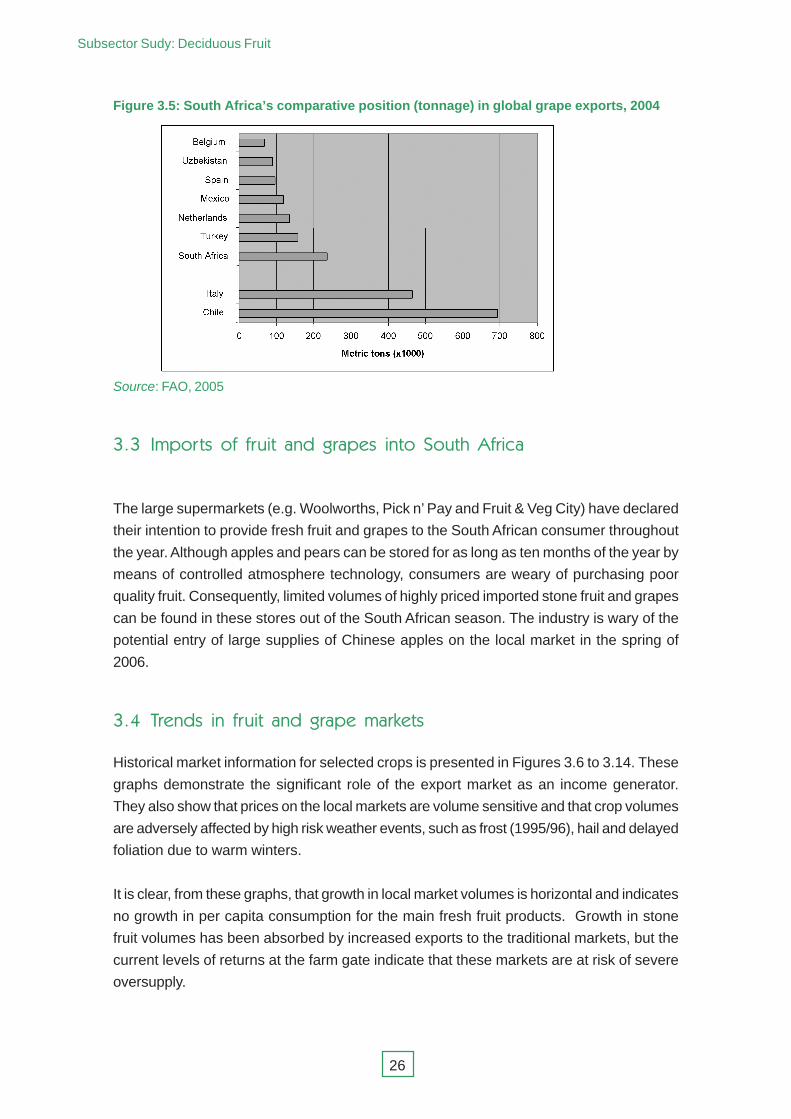
South Africa is a relatively small fruit and grape grower in terms of global hectares. However,
the country is a major volume exporter in global terms, as illustrated in Figures 3.2, 3.3,
3.4 and 3.5. The major competitor suppliers are listed below.
Apples
� Southern hemisphere: Chile, Brazil, New Zealand
� Northern hemisphere: China, France, Italy, US, Poland, Netherlands, Belgium
Pears
� Southern hemisphere: Argentina, Chile
� Northern hemisphere: China, Netherlands, Belgium, US, Italy
Plums
� Southern hemisphere: Chile
� Northern hemisphere: Spain, US
Grapes
� Southern hemisphere: Chile
� Northern hemisphere Italy, Turkey, Mexico, Spain
Subsector Sudy: Deciduous Fruit
25
Figure 3.2: South Africa’s comparative position (tonnage) in global apple exports, 2004
Source: FAO, 2005
Figure 3.3: South Africa’s comparative position (tonnage) in global pear exports, 2004
Source: FAO, 2005
Figure 3.4: South Africa’s comparative position (tonnage) in global plum exports, 2004
Source: FAO, 2005
Subsector Sudy: Deciduous Fruit
26
Source: FAO, 2005
��� #������� ��� ������ ��� ������ ����� &���'� (����
The large supermarkets (e.g. Woolworths, Pick n’ Pay and Fruit & Veg City) have declared
their intention to provide fresh fruit and grapes to the South African consumer throughout
the year. Although apples and pears can be stored for as long as ten months of the year by
means of controlled atmosphere technology, consumers are weary of purchasing poor
quality fruit. Consequently, limited volumes of highly priced imported stone fruit and grapes
can be found in these stores out of the South African season. The industry is wary of the
potential entry of large supplies of Chinese apples on the local market in the spring of
2006.
��� ������� ��� ������ ��� �������!���
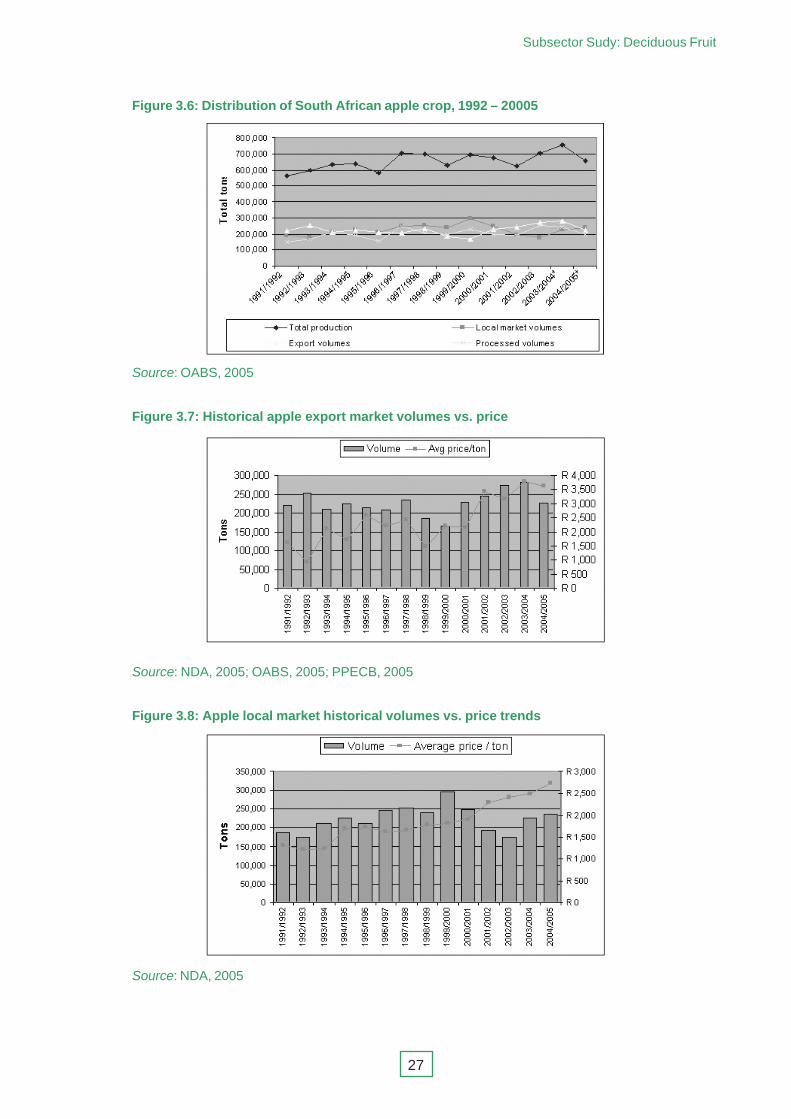
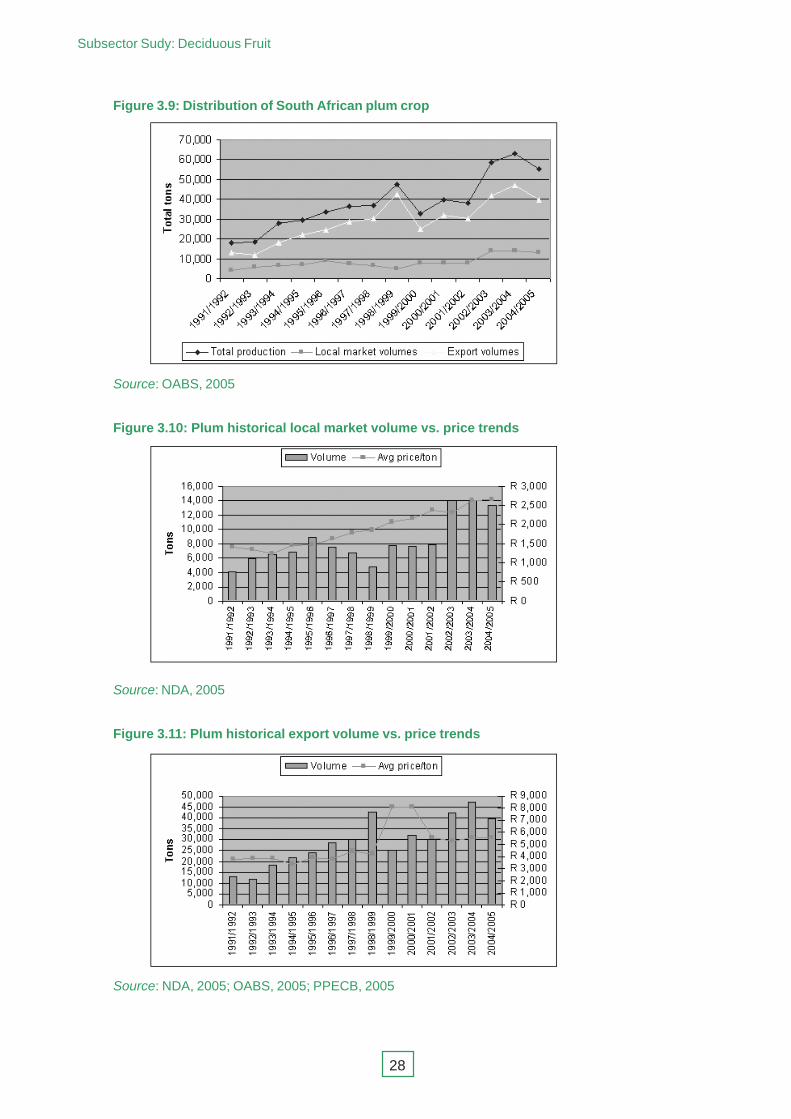
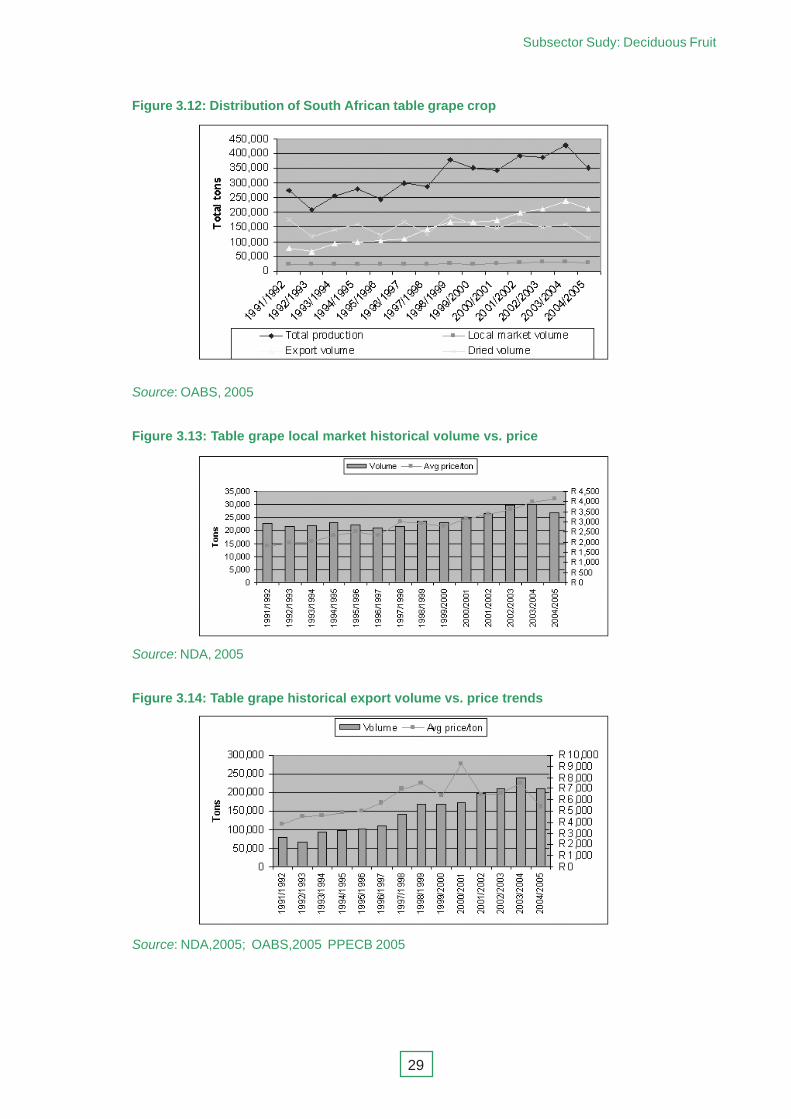
Historical market information for selected crops is presented in Figures 3.6 to 3.14. These
graphs demonstrate the significant role of the export market as an income generator.
They also show that prices on the local markets are volume sensitive and that crop volumes
are adversely affected by high risk weather events, such as frost (1995/96), hail and delayed
foliation due to warm winters.
It is clear, from these graphs, that growth in local market volumes is horizontal and indicates
no growth in per capita consumption for the main fresh fruit products. Growth in stone
fruit volumes has been absorbed by increased exports to the traditional markets, but the
current levels of returns at the farm gate indicate that these markets are at risk of severe
oversupply.
Figure 3.5: South Africa’s comparative position (tonnage) in global grape exports, 2004
Subsector Sudy: Deciduous Fruit
27
Figure 3.6: Distribution of South African apple crop, 1992 – 20005
Source: OABS, 2005
Figure 3.7: Historical apple export market volumes vs. price
Source: NDA, 2005; OABS, 2005; PPECB, 2005
Figure 3.8: Apple local market historical volumes vs. price trends
Source: NDA, 2005
Subsector Sudy: Deciduous Fruit
28
Figure 3.9: Distribution of South African plum crop
Source: OABS, 2005
Figure 3.10: Plum historical local market volume vs. price trends
Source: NDA, 2005
Figure 3.11: Plum historical export volume vs. price trends
Source: NDA, 2005; OABS, 2005; PPECB, 2005
Subsector Sudy: Deciduous Fruit
29
Figure 3.12: Distribution of South African table grape crop
Source: OABS, 2005
Figure 3.13: Table grape local market historical volume vs. price
Source: NDA, 2005
Figure 3.14: Table grape historical export volume vs. price trends
Source: NDA,2005; OABS,2005 PPECB 2005
Subsector Sudy: Deciduous Fruit
30
��" &���'� (������ ����� ��� ����� *����� ����������
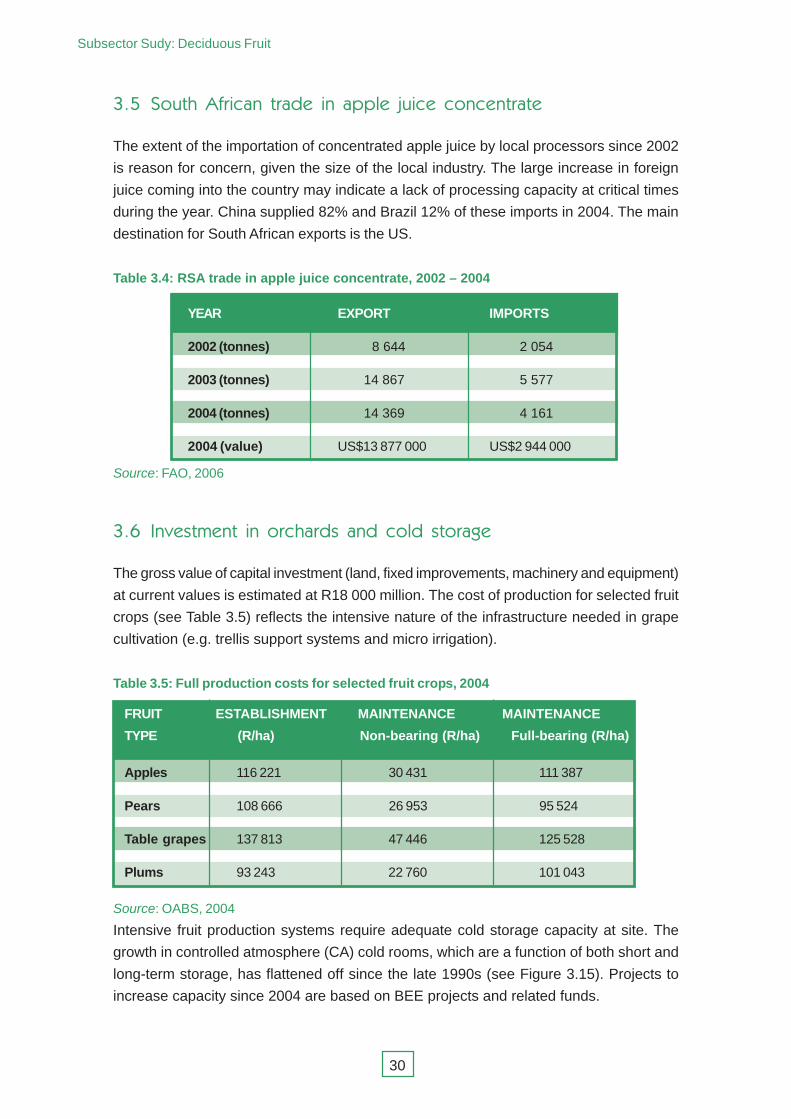
The extent of the importation of concentrated apple juice by local processors since 2002
is reason for concern, given the size of the local industry. The large increase in foreign
juice coming into the country may indicate a lack of processing capacity at critical times
during the year. China supplied 82% and Brazil 12% of these imports in 2004. The main
destination for South African exports is the US.
Table 3.4: RSA trade in apple juice concentrate, 2002 – 2004
YEAR EXPORT IMPORTS
2002 (tonnes) 8 644 2 054
2003 (tonnes) 14 867 5 577
2004 (tonnes) 14 369 4 161
2004 (value) US$13 877 000 US$2 944 000
Source: FAO, 2006
��% #���������� ��� ���'���� ��� ����� ������
The gross value of capital investment (land, fixed improvements, machinery and equipment)
at current values is estimated at R18 000 million. The cost of production for selected fruit
crops (see Table 3.5) reflects the intensive nature of the infrastructure needed in grape
cultivation (e.g. trellis support systems and micro irrigation).
Table 3.5: Full production costs for selected fruit crops, 2004
FRUIT ESTABLISHMENT MAINTENANCE MAINTENANCE
TYPE (R/ha) Non-bearing (R/ha) Full-bearing (R/ha)
Apples 116 221 30 431 111 387
Pears 108 666 26 953 95 524
Table grapes 137 813 47 446 125 528
Plums 93 243 22 760 101 043
Source: OABS, 2004
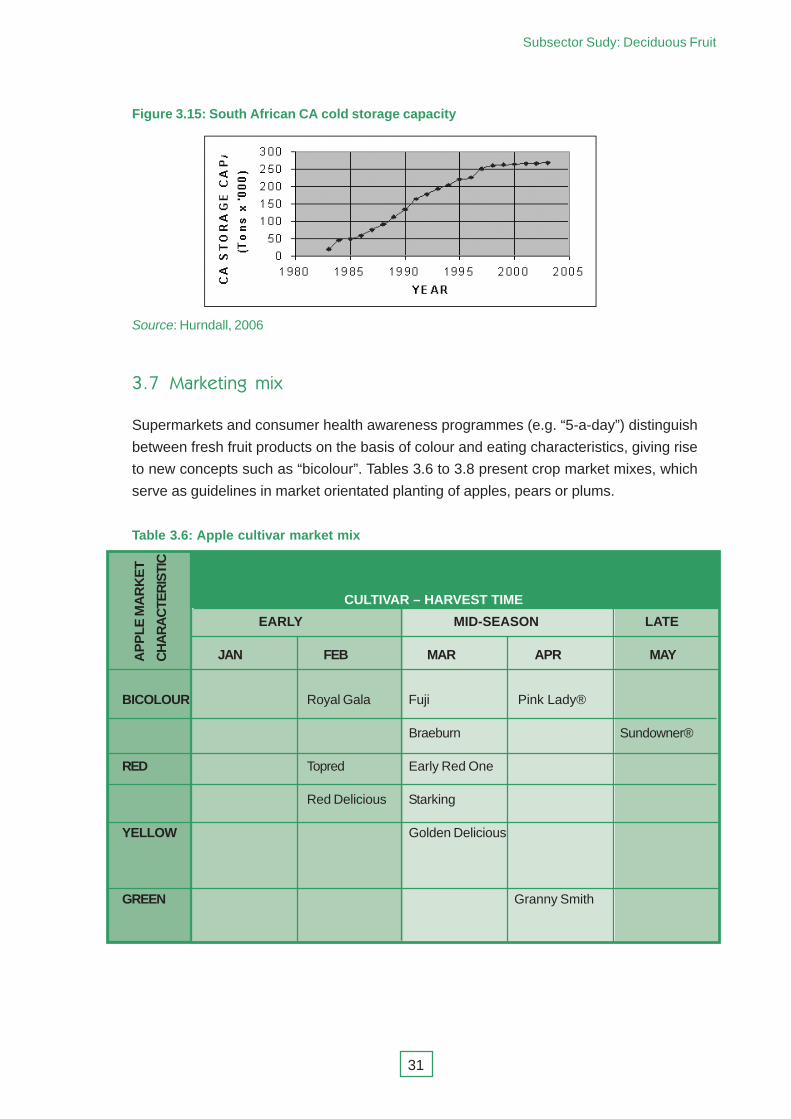
Intensive fruit production systems require adequate cold storage capacity at site. The
growth in controlled atmosphere (CA) cold rooms, which are a function of both short and
long-term storage, has flattened off since the late 1990s (see Figure 3.15). Projects to
increase capacity since 2004 are based on BEE projects and related funds.
Subsector Sudy: Deciduous Fruit
31
Figure 3.15: South African CA cold storage capacity
Source: Hurndall, 2006
��+ ,�!������ ���
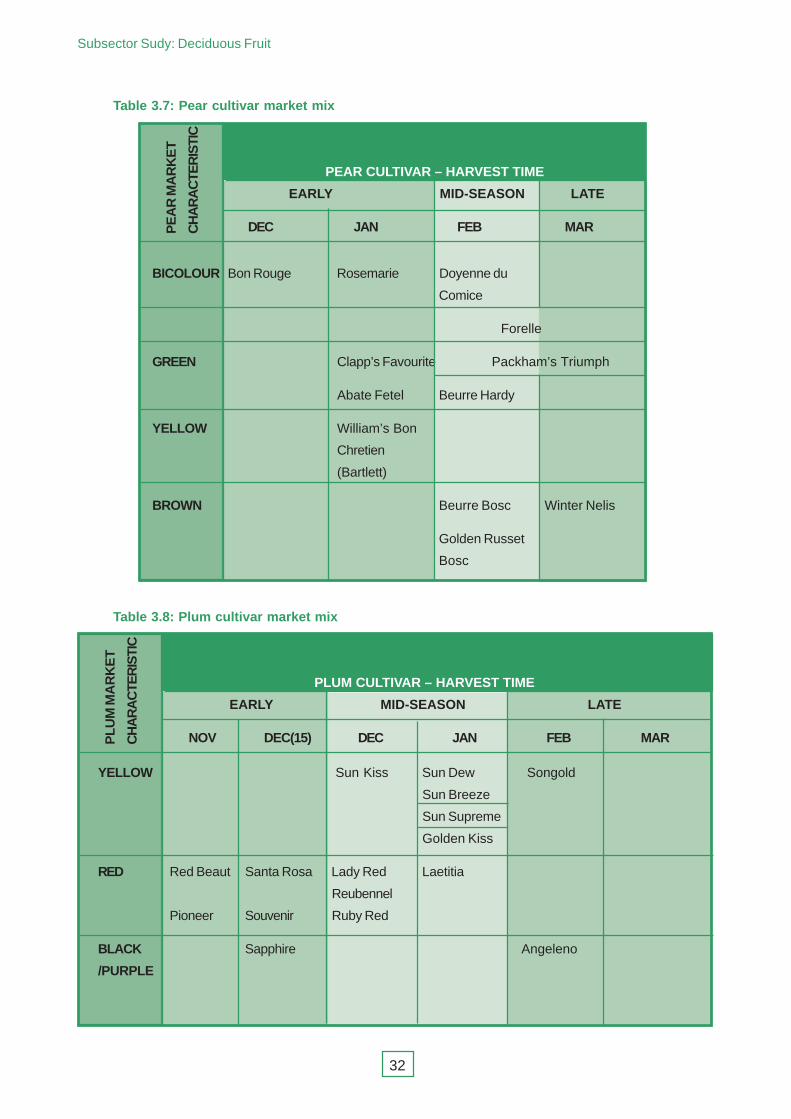
Supermarkets and consumer health awareness programmes (e.g. “5-a-day”) distinguish
between fresh fruit products on the basis of colour and eating characteristics, giving rise
to new concepts such as “bicolour”. Tables 3.6 to 3.8 present crop market mixes, which
serve as guidelines in market orientated planting of apples, pears or plums.
Table 3.6: Apple cultivar market mix
BICOLOUR Royal Gala Fuji Pink Lady®
Braeburn Sundowner®
RED Topred Early Red One
Red Delicious Starking
YELLOW Golden Delicious
GREEN Granny Smith
AP
PLE
MA
RK
ET
CH
AR
AC
TER
ISTI
C
CULTIVAR – HARVEST TIME
EARLY MID-SEASON LATE
JAN FEB MAR APR MAY
Subsector Sudy: Deciduous Fruit
32
Table 3.8: Plum cultivar market mix
Table 3.7: Pear cultivar market mix
BICOLOUR Bon Rouge Rosemarie Doyenne du
Comice
Forelle
GREEN Clapp’s Favourite Packham’s Triumph
Abate Fetel Beurre Hardy
YELLOW William’s Bon
Chretien
(Bartlett)
BROWN Beurre Bosc Winter Nelis
Golden Russet
Bosc
PE
AR
MA
RK
ET
CH
AR
AC
TER
ISTI
C
PEAR CULTIVAR – HARVEST TIME
EARLY MID-SEASON LATE
DEC JAN FEB MAR
YELLOW Sun Kiss Sun Dew Songold
Sun Breeze
Sun Supreme
Golden Kiss
RED Red Beaut Santa Rosa Lady Red Laetitia
Reubennel
Pioneer Souvenir Ruby Red
BLACK Sapphire Angeleno
/PURPLE
PLU
M M
AR
KE
T
CH
AR
AC
TER
ISTI
C
PLUM CULTIVAR – HARVEST TIME
EARLY MID-SEASON LATE
NOV DEC(15) DEC JAN FEB MAR

Subsector Sudy: Deciduous Fruit
33
��- .��������������� ��!����� ��� �'�� &���'� (������ ����� ��������
Competitiveness is described as an industry’s capacity to create superior value for its
customers and improved profits for the stakeholders in the value chain. The driving force
in sustaining a competitive position is productivity, that is, output efficiency in relation to
specific inputs with regard to human, capital and natural resources. The competitiveness
of apple and pear producing countries is determined on an annual basis by Dr Desmond
O’Rourke, Bellrose Inc., in Washington State. His rankings for apples (see Tables 3.9 and
3.10) are used as a guideline for the evaluation of the South African fruit industry. Although
no such analyses are available for stone fruit types and grapes, ranking in terms of off-
farm issues would be similar for these crops.
Table 3.9: Ranking of major apple producing country competitiveness, 2006
OVERALL PRODUCTION INFRASTRUCTURE FINANCIAL &
EFFICIENCY & INPUTS MARKETS
1 Chile Netherlands Chile France
2 New Zealand New Zealand USA Belgium
3 France South Africa New Zealand Italy
4 Italy Chile Argentina Japan
5 Netherlands Italy Canada New Zealand
6 USA France France Chile
7 Japan Austria Brazil Austria
8 Austria Brazil Italy UK
9 Belgium Belgium South Africa Netherlands
10 Canada Japan Japan Canada
11 South Africa Germany Turkey Australia
12 Australia Poland Australia Germany
13 Germany Australia Austria Spain
14 Spain Spain Belgium USA
15 UK USA Germany Portugal
16 Brazil Canada Netherlands Greece
17 Argentina Portugal UK South Africa
RA
NK
Source: O’Rourke, 2006
Subsector Sudy: Deciduous Fruit
34
Key factors in determining the production efficiency index are as follows:
� Relative change in tonnage produced based on a moving three-year average
over a period of five seasons, that is, 1998–2000 to 2003–2005 (SA = +18.6%)
� Relative variability in production during past five seasons, that is, high vs. low
(SA = 1.36)
� Percentage of non-bearing orchards in previous season (SA = 17.3%)
� Percentage of production represented by new cultivars in previous season
(SA = 31.5%)
� Average orchard density in previous season (SA = 929 trees/ha)
� Average orchard yield 2003–2005 (SA = 38.75 ton/ha).
Grower confidence in the industry can be measured in terms of changes in the rate of new
plantings, the adoption of high density orchard technology and the rate of introduction of
new bicolour cultivars.
Key factors in determining the index value for industry infrastructure and inputs are based
on a comparative evaluation of the listed factors for each country, as follows:
� Adequacy of cold storage
� Modern packing facilities
� Marketing system
� Land availability
� Water availability
� Labour availability
� Input cost
Key factors in determining the index for financial and market factors are based on a
comparative evaluation of the listed factors for each country, as follows:
� Interest rates, previous season
� Inflation rates, previous season
� Capital availability
� Security of property rights
� Product quality control
� Percentage of crop exported, three-year moving average
� Average export price, two seasons back (US$/ton)
� Average distance to market (km)
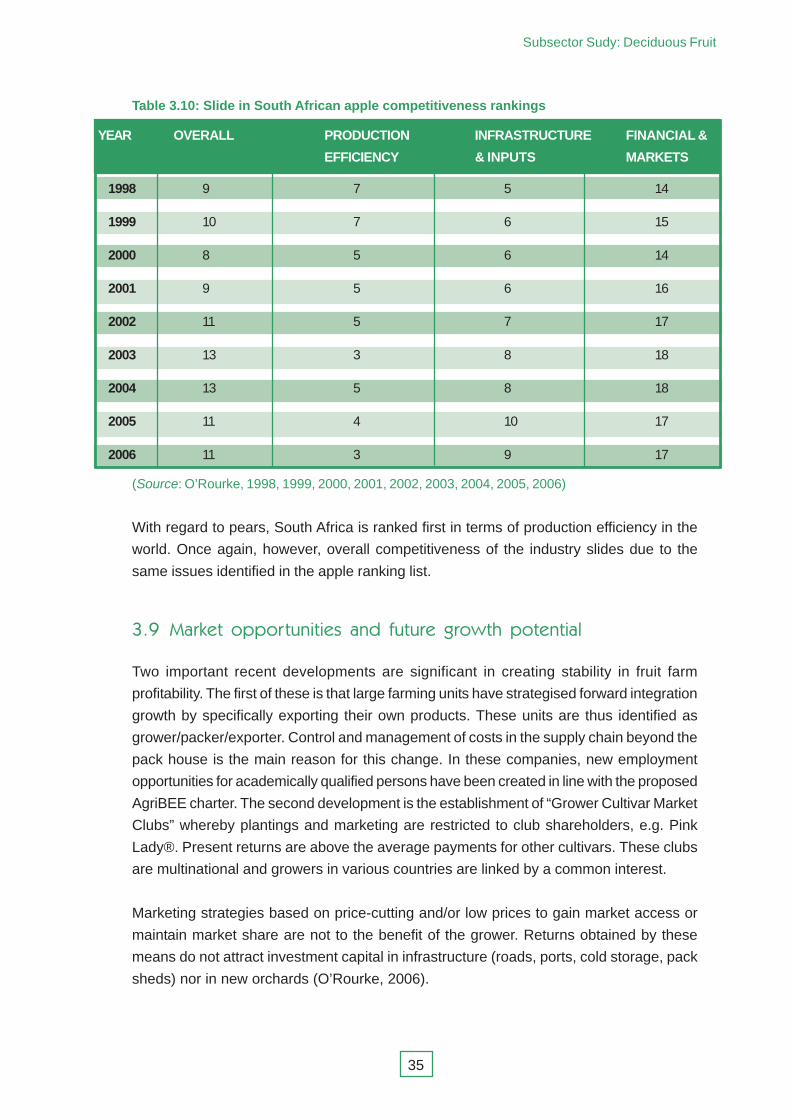
The overall competitiveness of South African apples has weakened since 1998 (see Table
3.10). Although the adoption of new technologies improved production efficiency, overall
competitiveness declined due to problems beyond the “farm gate” or “pack shed door”.
Subsector Sudy: Deciduous Fruit
35
Table 3.10: Slide in South African apple competitiveness rankings
YEAR OVERALL PRODUCTION INFRASTRUCTURE FINANCIAL &
EFFICIENCY & INPUTS MARKETS
1998 9 7 5 14
1999 10 7 6 15
2000 8 5 6 14
2001 9 5 6 16
2002 11 5 7 17
2003 13 3 8 18
2004 13 5 8 18
2005 11 4 10 17
2006 11 3 9 17
(Source: O’Rourke, 1998, 1999, 2000, 2001, 2002, 2003, 2004, 2005, 2006)
With regard to pears, South Africa is ranked first in terms of production efficiency in the
world. Once again, however, overall competitiveness of the industry slides due to the
same issues identified in the apple ranking list.
��/ ,�!��� �������������� ��� ������� ���0�'� ��������
Two important recent developments are significant in creating stability in fruit farm
profitability. The first of these is that large farming units have strategised forward integration
growth by specifically exporting their own products. These units are thus identified as
grower/packer/exporter. Control and management of costs in the supply chain beyond the
pack house is the main reason for this change. In these companies, new employment
opportunities for academically qualified persons have been created in line with the proposed
AgriBEE charter. The second development is the establishment of “Grower Cultivar Market
Clubs” whereby plantings and marketing are restricted to club shareholders, e.g. Pink
Lady®. Present returns are above the average payments for other cultivars. These clubs
are multinational and growers in various countries are linked by a common interest.
Marketing strategies based on price-cutting and/or low prices to gain market access or
maintain market share are not to the benefit of the grower. Returns obtained by these
means do not attract investment capital in infrastructure (roads, ports, cold storage, pack
sheds) nor in new orchards (O’Rourke, 2006).
Subsector Sudy: Deciduous Fruit
36
Since deregulation of the industry, South Africa has lost ground in a number of key functional
areas which contribute to the sustainability of any fruit industry. These include research
capacity, technology transfer, market discipline, promotion and productivity at the ports.
Market penetration by South Africa export fruit into the most populated region of the globe,
namely Asia and the Far East, is very low (e.g. apples 14% and grapes 5%). With the
steady increase in the supply of goods and foodstuffs from those countries to South Africa,
reciprocal trade may prove to be the answer to accommodate increased South African
fruit and grape volumes Government support and leadership to gain entry to these markets
is imperative. In Asian markets, prices of apples are three times that of bananas (O’Rourke,
2006), while in Europe, the prices of apples, citrus and bananas are closely linked.
���1 #����� ��� ��'��� ����������� ���������
Growth and competitiveness will be enhanced by the development of economic clusters
in the main rural areas, whereby the needs and performance of the fruit industry and all its
input suppliers, service providers and associated institutions are present and actively
interlinked (e.g. packaging materials, electricity supply network, cold storage, water, skilled
labour and transport). The Boland/Overberg/Breede River region (Ceres, Worcester,
Grabouw/Villiersdorp, Roberston/Ashton) is an appropriate example of such a cluster.
���� .���������
Growth potential in the fruit industry can be stimulated and sustained by creating a focused,
coordinated approach to entrenching productivity, effectiveness and efficiency at each link
in the value chain. These issues have been addressed in the FIP document and a number
of appointments have been made and operational divisions realigned. Actions regarding
key areas for market growth and development of the industry are the following:
� Increased per capita consumption of all fruit in South Africa
� Sustaining supply of high quality produce in all markets
� Elimination of poor productivity in the supply chain
� Cost management in the supply chain
� Market access into the rising economies of Asia and the Far East
� Accreditation of exporters
� Promotion of mechanisms to bring new farmers on board in the mainstream
of the industry
� Preparation of the industry to move with the AgriBEE transformational charter,
once the final document is published
Subsector Sudy: Deciduous Fruit
37
%�� �������� &������
This section provides a summary of government policy and support, and of support from
other sources. It describes the status of the empowerment process and its impact, and
evaluates the extent to which these issues are being addressed.
��� &������ ��� �������� ����������� ������� ��� �������
The alignment of current agricultural policy and its impact in the fruit industry has been
addressed in the FIP document (Annexure 1). Government support is primarily aligned to
activities in the field of BEE. Foremost among these are land reform initiatives, where
support is forthcoming in the form of LRAD grants, CASP funding and MAFISA funding.
Education and skills development also receive government support through tax incentives
on AgriSETA accredited programmes.
A number of valuable export initiative support programmes are currently offered by the
Department of Trade and Industry. These programmes are, however, of limited duration.
��� 2�'��� �������
The financial sector is very active in providing funds for new projects based on BEE
principles. In each case specific conditions apply. Key players are the Industrial
Development Corporation, commercial banks and the Land bank. The Industrial
Development Corporation has helped fund orchard establishment and packhouses
development, as well as BEE projects in the field of intensive horticulture which will lead to
the creation of jobs. The commercial banks have made available development funds (at
lower interest rates, e.g. via Khula), while the Land Bank provides specialised loans and
grants to new farmers.
��� &����� ��� ����0������� �������� ��� �����
Overall progress in the transformational process is slow. The industry has published a
review of the existing farming projects in the book New leaves (Brodie, 2006). These
projects have been based on and financed by mechanisms supporting equity transfer,
transfer of state land for farming and social responsibility. The AgriBEE process has been
under discussion for a number of years, and industry leaders are awaiting final policy
documentation and guidelines in order to mobilise stakeholders and actions.
Subsector Sudy: Deciduous Fruit
38
The overall poor financial performance of new entrants in the industry is a cause for concern.
One of the reasons cited for this is that new entrants tend to formulate poorly structured
business plans, based on a limited knowledge and regard for the overall market. In addition,
capital grants are often utilised for the purchase of the land without taking into account the
amount of operational funds needed to sustain the business during the gestation period of
five to seven years. This is thought to be responsible for more or less 45% of the constraints
experienced by emerging farmers.
Land grant funding, on the other hand, is often used to expand the business, disregarding
the business plan on the basis of which the monies were supplied to the beneficiary
group. Poor financial returns for export fruit in the industry as a whole have affected new
entrants, and profit margins have been further affected by cost inflation and interest
payments.
Lack of human capacity in terms of technical, managerial and administrative skills has
also contributed to poor financial performance. Related to this are problems regarding
cooperation within groups and difficulties with commercial farmer partners.
New entrants also have to contend with limited physical and financial resources. Many
units are, for example, established on a poor or degraded resource base, while farmer/
labour share equity buy-in schemes have not been successful. Government capacity to
deliver funds, extension and other services, in line with project schedules, has been lacking
and there is a general lack of professional extension services in farm management and
mentorship programmes.
��� �������� ��� 0'��'��� ��������� ������� ��� ����� ��$�������������
The industry is in the process of evaluating a number of the issues raised in the FIP
document and the BEE process, such as the following:
� Database of land reform projects based on fruit farming
� Status of success in these projects
� Formulation of the key role of industry leadership in linkage of new entrants to
the mainstream in order to access markets and secure suitable funding
� Training and educational programmes which are supported by a number of
industry bursaries
� Bringing key farm personnel from previously disadvantaged groups on board
at field days and symposia by means of central funding to subsidise registration
costs.
Subsector Sudy: Deciduous Fruit
39
'�� ��� ������ � ��� �(������
This section identifies constraints and market failures that are currently hindering growth and
employment, with particular emphasis on regulations, labour markets and infrastructure.
"�� 3��������� ������
While labour regulations are often cited as a hindrance to growth, it should be noted that
similar regulatory factors exist in competitor countries, such as Chile and New Zealand.
Furthermore, one of the hallmarks of a competitive industry is its capacity to pay reasonable
wages and social investment, which provides for human resource growth and development.
Current labour legislation in South Africa allows for employers to apply for exemptions regarding
work hours during critical farm activities. In a number of cases, these exemptions have proven
valuable during periods of peak workloads. The following Acts are relevant here:
� Basic Conditions of Employment Act, 1997 (sectoral determination of minimum
wage)
� Labour Relations Act, 1995
� Equity Employment Act, 1998
� Unemployment Insurance Act, 2001
� Skills Development Act, 1998 (Skills Development Levy)
� Workman’s Compensation Act 1977
� Security of Tenure Act 1997
"�� ����� ��!���
The critical need for labour at harvest time offers seasonal work to unemployed persons in
the immediate vicinity of orchards and vineyards. This is a global reality. In most countries,
workers migrate from one region to another as the harvest season progresses from early to
late. However, in the local scenario, labourers lack mobility as well as the skills to find work
outside of crop harvesting.
A major constraint in terms of labour is the lack of skilled labour. At the same time, farm wage
levels do not attract skilled or qualified people to undertake menial and hard work. Smaller
producers, who pay comparatively lower wages, are more exposed than the larger producers
to the threat of labour shortages. Squatter communities have developed within the urban
sprawl of the main fruit industry towns, such as De Doorns and Grabouw, and have given rise
to widespread local social and economic problems that have further eroded the quality of the
available labour. The incidence and prevalence of HIV/Aids is undoubtedly the most serious of
these problems. The industry has launched an awareness programme (DFPT, 2005), “Let’s
Talk Status HIV/Aids”, at farm level.
Subsector Sudy: Deciduous Fruit
40
"�� #������������
In the development of the fruit plan, participants at the various workshops identified similar
constraints in all the different provinces. During the past two seasons(2003/2004 and
2004/2005), a number of other serious problems have been raised, which not only have
an impact on costs (direct and indirect) but also on the competitiveness of the industry.
Solutions to these problems need a focused and purposeful approach and cooperation
among all the relevant role-players. These problems are summarised as follows:
· Imbalance of packed fruit deliveries to the cold storage facilities and the ports, resulting
from large-scale planting of selected cultivars such as Laetitia and Songold plums which
peak in week 8 to 10
· Lack of cold storage capacity at certain times of the year, when grapes, stone fruit
and pome fruit is being harvested (i.e. mid-January till end of February)
· Hygiene and micro-bacterial quality of water available for use in packhorses and
domestic purposes on farms (e.g. E.coli in the Berg River)
· Electricity outages in the Western Cape during the fruit season
· Poor or no communication between the agricultural sector and service providers in
terms of planning and future expansion on issues such as energy and transport
· Transport from the pack house to the market – road, ship, road/rail
· Logistical systems which are not applied at full efficiency
· Inefficient handling operations at South African ports, giving rise to costly delays and
breaks in the cold chain
"�� 2�'��
Competition for scarce natural resources (i.e. water and land) is putting continued pressure
on good farmland that can be used for agricultural purposes. Furthermore, the opening up
of Elgin/Grabouw as a niche wine growing area has resulted in grubbing of orchards in
favour of vineyards and also an opportunity for exit from deciduous fruit.
Fruit production in the Western Cape is under threat from the impact of climate change.
Production of the Forelle pear (high chilling), in particular, could be adversely affected by
warming of the winter season due to rising average temperatures and subsequent loss in
chilling hours. Lack of winter chilling gives rise to delayed foliation and the problem of
small fruit of poor quality. Increased average maximum temperatures in January and
February may result in poor colour development in “bicolour” fruits. The risk of sunburn is
also increased.
Government financial support for land reform initiatives as well as public sector housing
support in a number of key fruit areas is not keeping pace, with the rate at which growers
are geared to implement change (Calvert, 2006).
Subsector Sudy: Deciduous Fruit
41
)���&&���������
In this section possible key interventions and their implications are considered. Market
development interventions are suggested and possible marketing incentive schemes are
examined.
The first and major opportunity for the industry is to re-assess its role in international
trade. All the stakeholders in the industry, and in particular state departments, are needed
to contribute to this process. Besides the state protocols, implementation of phytosanitary
standards and border protection mechanisms need to be understood and agreed upon.
Citrus and sub-tropical fruits are in the same boat and all three fruit groups stand to benefit
from a combined and integrated approach.
The presence of agricultural imports from China in South Africa and the subsequent
impact of these on local market prices in all major agricultural subsectors is reason for
grave concern. Given the need to maintain free trade rules in the greater picture of prosperity
in South African agriculture, the NAMC can offer leadership by facilitating the process to
formulate strategies and measures which will safeguard the affected industries.
Secondly, the poor level of economic performance on the part of empowerment
farming projects should in no way blunt the current momentum. With the advent of the
AgriBEE transformational charter and scorecard (within the immediate future), the industry
will be in need of financial support to fast-track its contribution to the process of change.
Agricultural industries have not been partners in the decisions regarding the establishment
of state or privately funded empowerment projects. Yet, in terms of the AgriBEE process,
industries are accountable for the overall success of bringing these new entrants into the
mainstream. Market intervention in support of the newly established projects is
recommended, but the manner and size thereof should be undertaken under the auspices
of the NAMC, based on current initiatives with the large supermarket chains.
Thirdly, support for promotion of the consumption of all fresh fruit on the local market
is recommended. Per capita consumption of apples at 4 kg, in comparison to Asia’s 13.25
kg and the EU’s 17.6 kg, highlights the scope for increased sales on the local market.
Industries are, however, in need of financial support to drive promotions in the local market.
It is recommended that state-sourced grants be established for this purpose. In financial
terms, grants based on 1:1 (Rand for Rand) would be a valuable contribution to industry
initiatives. Innovative labelling or branding at the point of sale, such as “Genuine South
African”, would give discerning, patriotic consumers a measure of assurance that the fruit
or product on promotion is not of foreign origin.
Subsector Sudy: Deciduous Fruit
42
Fourthly, the industry is dependent on the level of efficiency and productivity of a
number of state and parastatal institutions who provide services at a cost, within the
supply chain. Examples are National Ports, Fresh Fruit Terminals, PPECB, Spoornet and
the National Department of Agriculture. Invention by the NAMC in terms of an efficiency
audit on the role and contribution of these institutions is recommended.
A comprehensive strategy and guidelines for decisions regarding investment in South
African agricultural industries are sorely lacking. Policy makers need to understand the
industry and consult with stakeholders. These guidelines should be based on market
forces and should contain analyses of pertinent short and medium-term prospects and
pointers regarding matters such as markets, cultivar choice, labour productivity indices
and sustainability criteria. This initiative should be a joint venture between the NAMC and
the particular industry.
Subsector Sudy: Deciduous Fruit
43
*�� ������ ���
The nature of the complex relationships within the supply chain in the deciduous fruit
subsector calls for strong, decisive industry leadership and a close relationship with
government and state institutions at the macroeconomic level. The main focus areas with
regard to the fruit industry are the following:
� Attention to gaining market access in the Asian and Far Eastern economies
� Investment in upgrading existing road and harbour infrastructure
� Attention to policies which support sustainable growth in export orientated
industries
� Socio-economic service delivery
The enterprises within the supply chain need to focus on capacity development in terms
of innovativeness and productivity. Growers need to do the following:
� Introduce technology which will result in a reduction in unit costs
� Improve quality control
� Align with proven high performance exporters
Understanding the correctness of signals emanating from the market by all is lacking at
this time and needs to be addressed by industry and the relevant state bodies, such as
the NAMC and National Department of Agriculture, DTI, ARC, AgriSETA. The large increase
in young orchards and vineyards during the past ten years may cause oversupply in the
market driven supply chain and see a number of production units being absorbed by
larger concerns. There is an urgent need to address the impact of decision making which
will influence future outcomes.
Investment in human resources is essential for the development of a professional industry,
which is in line with the social transformational processes in South Africa. Education and
training initiatives therefore need to be fast-tracked and funding mechanisms need to be
instituted to meet the demand that will arise from the implementation of the AgriBEE
mentorship and incentive processes.
Issues contained in the Fruit Industry Plan are under consideration by the industry and its
stakeholders. Relevant matters for the attention of the NAMC will be raised directly by the
industry representatives in due course.
Subsector Sudy: Deciduous Fruit
44
+�� ��,�����&(
ARC. South African deciduous fruit cultivars catalogue. 2nd ed. Stellenbosch: ARC Infruitec-
Nietvoorbij.
Brodie, L. 2006. New leaves. Paarl: Deciduous Fruit Producers’ Trust.
Calvert, R. 2006. HopkinsCalvert Associates, HR Management. Personal communication
CPA, 2006. Canning Producers Association
DFPT. 2005. Annual report. Paarl: Deciduous Fruit Producers’ Trust.
DFPT. 2006. Tree census. Unpublished data.
FAO. 2005. Food and Agriculture Organisation of the United Nations. Statistical database.
Website <http://www.fao.org/waicent/portal/statistics_en.asp>
FAO. 2006. World agricultural trade flows. FAO Statistics Division.
Website <http://www.fao.org/WAICENT/FAOINFO/ECONOMIC/ESS/watf.asp>
Fruit SA. 2006. The future strategy of the fruit industry in South Africa.
Cape Town: Fruit South Africa, Final Report.
R.Hurndall, Deciduous Fruit Producers Trust Research. Personal communication
Louw, D.B. 2006. Deciduous fruit overview. Paarl: OABS.
NDA. 2005. Statistics on national fresh produce markets. Pretoria: National Department
of Agriculture. Website <http://www.nda.agric.za>
Nel, E. & Golman, I. 2006. Investigation of pro-poor local economic development in South
Africa. Website <http://www.khanya_aicdd.org>
OABS. 2001. Key deciduous fruit statistics. Paarl: Optimal Agricultural Business Systems.
OABS. 2002. Key deciduous fruit statistics. Paarl: Optimal Agricultural Business Systems.
OABS. 2003. Key deciduous fruit statistics. Paarl: Optimal Agricultural Business Systems.
OABS. 2004. Key deciduous fruit statistics. Paarl: Optimal Agricultural Business Systems.
Subsector Sudy: Deciduous Fruit
45
OABS. 2005. Key deciduous fruit statistics. Paarl: Optimal Agricultural Business Systems.
OECD. 2006. Agricultural policy reform in South Africa. OECD Policy Brief, April.
O’Rourke, D. 1998. World apple review. Pullman: Belrose Inc.
O’Rourke, D. 1999. World apple review. Pullman: Belrose Inc.
O’Rourke, D. 2000. World apple review. Pullman: Belrose Inc.
O’Rourke, D. 2001. World apple review. Pullman: Belrose Inc.
O’Rourke, D. 2002. World apple review. Pullman: Belrose Inc.
O’Rourke, D. 2003. World Apple Review. Pullman: Belrose Inc.
O’Rourke, D. 2004. World apple review. Pullman: Belrose Inc.
O’Rourke, D. 2005. World apple review. Pullman: Belrose Inc.
O’Rourke, D. 2006. World apple review. Pullman: Belrose Inc.
PPECB. 2005. Export directory. Cape Town: PPECB.
Subsector Sudy: Deciduous Fruit
46
�--��.!/� �0
�1��-�!����� �2�� ��3���4!����5���!6��� !.���!�!�.� !��2�� �37!�� !�.7��31� -���
Forty-seven sub-strategies are identified to align the industry with the strategic plan for
South African agriculture. A number of issues raised and discussed in this document are
closely linked to the terms of reference of this subsector report. The main focus areas and
related considerations of the plan are the following:
4 � ��� ���� ������
� Develop a new farmer programme that is specific to the industry and
incorporates and builds on current initiatives in a properly sequenced and
efficient manner.
� Establish mechanisms to attract, and where necessary build capacity in black
persons at management level throughout the value chain.
� Develop methods and procedures to support land reform in a coordinated and
efficient manner.
� Appraise existing empowerment schemes to determine how to build on
successes and rectify problems.
� Establish a representative, legitimate structure to address BEE and land reform
matters.
� Develop mechanisms to unlock funding of empowerment projects.
3���� �����������
� Develop an overall industry policy on supporting development initiatives in
relevant rural communities.
� Create national, provincial and local networks to disseminate the policy and to
indicate the industry’s willingness to become an active, supportive player in
rural and community development initiatives.
� Stimulate, at local level, the creation of rural and community development
initiatives where these do not currently exist or function effectively.
Subsector Sudy: Deciduous Fruit
47
5���� ��������� �����������
� Improve training and development within the industry to ensure that the industry
is staffed by well-trained, competent and productive employees.
� Ensure legal compliance by assisting all parties in the industry to comply fully
with the letter and spirit of legislation affecting employment by ensuring full
awareness of the relevant legislation.
� Highlight workplace relations to improve the participation of farm employees
through greater transparency and more effective communication.
3�������'���� 0��'� ����������
� Create an industry-wide body for representing the industry in communication
with government.
367�� ����������� ��� ���'������� �������
� Determine resources needed to provide an environment conducive to research
and to ultimately ensure industry growth.
� Establish, maintain and promote sustainable programmes and practices to
ensure improved quality and safety and to comply with market and regulatory
forces, in terms of plant improvement, primary production, harvest, orchard to
pack house/cold store, pack house operations, post-harvest treatments, cold
storage and cold chain management.
� Improve and develop new approaches to ensure optimal market access
procedures.
���������� ��� �������������
� Establish and identify mechanisms to coordinate fruit logistics and infrastructure
planning on regional, national and international levels.
� Revisit and critically evaluate current regimes with regard to packaging and
palletising, and tracking and monitoring.
� Establish mechanisms to improve efficiency at packhorses and cold storage
facilities.
� Establish mechanisms to increase logistical efficiency at ports and of shipping.
� Establish logistical information and communication protocols at each level of
the value chain.
� Establish service level protocols and accreditation.
� Foster good labour relations in the logistical chain.
� Develop and institute appropriate capacity delivery mechanisms to address
training and development in the logistics chain.
Subsector Sudy: Deciduous Fruit
48
� Develop proper, efficient regimes to document all aspects of logistics and
disseminate these timeously to relevant role-players.
� Establish, promote and/or adapt internationally recognised fruit handling
protocols at ports where South African fruit enters overseas markets.
#���������
� Stabilise the current information environment.
� Understand what is needed of information and systems in the industry.
� Plan for the future.
� Determine accountabilities for industry level information and systems.
� Coordinate fruit market and marketing information.
� Create and maintain a strategic information database and capacity to analyse
strategic information.
,�!������ ��� ���������� ��� �����
� Establish and maintain a crop mix that will lower risks associated with changing
consumer tastes and preferences in order to maintain and increase real returns
on investments and profits for all role-players in the value chain.
� Establish, maintain and promote sustainable production, harvesting and packing
strategies that adhere to and comply with market and regulatory forces.
� Identify critical points in the value chain where transaction cost can be reduced,
taking due cognisance of
� demand and supply patterns
� available logistical infrastructure
� transport modes
� level of training
� relationships between role-players
#�������� ��� ��������� ��� ��������� ���'����!���� ��� �� ���'������������
� Establish mechanisms to streamline current export initiatives.
� Improve and develop new approaches to ensure optimal access procedures.
� Determine the optimal market structure and conduct for the domestic fruit
market.
� Improve the local market’s product quality and safety.
� Determine the optimal promotional strategy.