2008-2009 annual report henry ford elementary
TRANSCRIPT

2008-2009 Annual Report Henry Ford Elementary
M i s s i o n :
T h e m i s s i o n o f h e n r y f o r d e l e m e n Ta r y s c h o o l i s T o
c r e aT e a s a f e a n d p o s i T i v e aT m o s p h e r e f o r l e a r n i n g a n d
T h e o p p o r T u n i T y T o d e v e lo p i n d i v i d u a l p oT e n T i a l .
Welcome to our schoolThe school is situated in a metropolitan area approximately 30 miles west of Detroit, Michigan. Our school is nestled in a wooded site located on Clark Road just
past the Green Oaks golf course. Our student body is comprised of 310 students and range from Pre-School to Fifth grade.
Our staff works hard to meet the State benchmarks and standards.
We welcome all parents to become part of our Learning Community by volunteering, joining our PTO or just visiting.
The Principal of Henry Ford Elementary is Ms. JoeAnn Allen. The Superintendent is Dr. Doris Hope-Jackson.
Henry Ford Elementary 2440 E. Clark Road Ypsilanti, Michigan 48198 734.481.8275 734.481.8186 fax http://www.wrcs.k12.mi.us
W i l l o W R u nC O M M u n i T Y S C H O O L S
Henry Ford B.A. BA + 15 credit hours
M.A. M.A. + 15 credit hours
M.A. +30 credit hours
Ph.D.
Professional Qualifications of All Public Elementary and Secondary School Teachers in the District
1.5 3 13.1 1
Percentage of Public Elemen-tary and Secondary School Teachers in the District with Emergency Certification
0%
Percentage of Core Academic Subject Elementary and Secondary School Classes NOT taught by Highly Qualified Teachers
0%
school-Level Teacher Quality ReportWe have 19 highly qualified teachers; 4 highly qualified para-educators and one principal. Any parent who would like to review the credentials of their child’s teacher may do so by contacting the building administrator.
sta
te a
nd
Fed
era
l Re
qu
ired
sch
oo
l in
form
atio
n
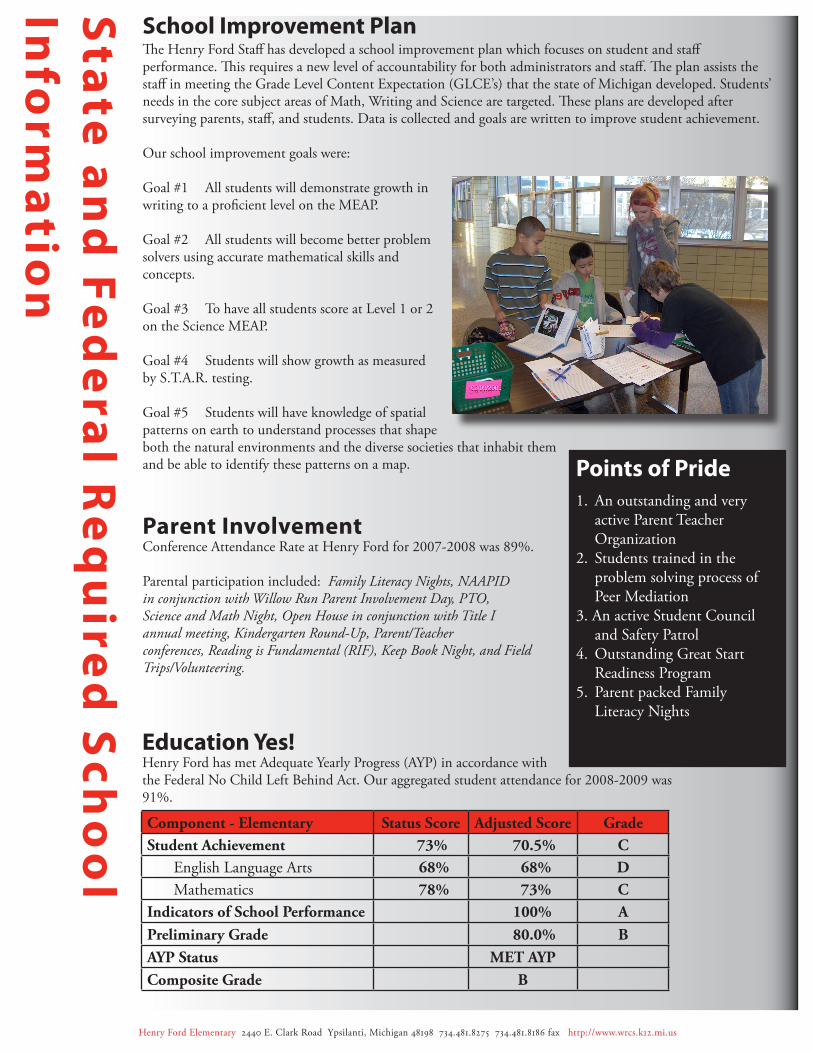
school improvement PlanThe Henry Ford Staff has developed a school improvement plan which focuses on student and staff performance. This requires a new level of accountability for both administrators and staff. The plan assists the staff in meeting the Grade Level Content Expectation (GLCE’s) that the state of Michigan developed. Students’ needs in the core subject areas of Math, Writing and Science are targeted. These plans are developed after surveying parents, staff, and students. Data is collected and goals are written to improve student achievement.
Our school improvement goals were:
Goal #1 All students will demonstrate growth in writing to a proficient level on the MEAP.
Goal #2 All students will become better problem solvers using accurate mathematical skills and concepts.
Goal #3 To have all students score at Level 1 or 2 on the Science MEAP.
Goal #4 Students will show growth as measured by S.T.A.R. testing.
Goal #5 Students will have knowledge of spatial patterns on earth to understand processes that shape both the natural environments and the diverse societies that inhabit them and be able to identify these patterns on a map.
Education Yes!Henry Ford has met Adequate Yearly Progress (AYP) in accordance with the Federal no Child Left Behind Act. Our aggregated student attendance for 2008-2009 was 91%.
Component - Elementary Status Score Adjusted Score GradeStudent Achievement 73% 70.5% C
English Language Arts 68% 68% DMathematics 78% 73% C
Indicators of School Performance 100% APreliminary Grade 80.0% BAYP Status MET AYPComposite Grade B
Points of Pride1. An outstanding and very active Parent Teacher Organization2. Students trained in the problem solving process of Peer Mediation3. An active Student Council and Safety Patrol4. Outstanding Great Start Readiness Program5. Parent packed Family Literacy nights
Parent involvementConference Attendance Rate at Henry Ford for 2007-2008 was 89%.
Parental participation included: Family Literacy Nights, NAAPID in conjunction with Willow Run Parent Involvement Day, PTO, Science and Math Night, Open House in conjunction with Title I annual meeting, Kindergarten Round-Up, Parent/Teacher conferences, Reading is Fundamental (RIF), Keep Book Night, and Field Trips/Volunteering.
Henry Ford Elementary 2440 E. Clark Road Ypsilanti, Michigan 48198 734.481.8275 734.481.8186 fax http://www.wrcs.k12.mi.us

sta
te a
nd
Fed
era
l Re
qu
ired
sch
oo
l in
form
atio
n
MEAP 3rd Grade ELA - Percentage of students Proficient and Advanced
MEAP 3rd Grade Math - Percentage of students Proficient and Advanced
Henry Ford Elementary 2440 E. Clark Road Ypsilanti, Michigan 48198 734.481.8275 734.481.8186 fax http://www.wrcs.k12.mi.us
2008-09 65% 69% 83% 0% 2% 63% 29% 6%
2007-08 73% 60% 81% 6% 27% 45% 24% 3%
2008-09 52% 66% 69% 0% 0% 52% 43% 5%
2007-08 64% 58% 67% 0% 27% 36% 27% 9%
2008-09 < * 90% < < < < <
2007-08 * * 79% * * * * *
2008-09 * * 80% < * * * *
2007-08 * * 90% * * * * *
2008-09 < < 74% < < < < <
2007-08 < < 71% < < < < <
2008-09 77% 72% 87% 0% 5% 73% 18% 5%
2007-08 80% 65% 85% 9% 30% 50% 20% 0%
2008-09 < 33% 55% < < < < <
2007-08 * 10% 53% * * * * *
2008-09 < 70% 69% < < < < <
2007-08 < < 63% < < < < <
2008-09 64% 67% 74% 0% 0% 64% 28% 8%
2007-08 69% 56% 71% 13% 23% 46% 27% 4%
2008-09 * * 64% * * * * *
2007-08 * * 64% * * * * *
2008-09 50% 61% 81% 0% 0% 50% 45% 5%
2007-08 71% 61% 78% 7% 36% 36% 21% 7%
2008-09 78% 80% 86% 0% 4% 74% 15% 7%
2007-08 74% 60% 84% 5% 21% 53% 26% 0%
* No state data
< = less than 10
BelowBasic
Percent of Students in School at Each Achievement Level
Migrant
Proficient BasicAdvanced
School Percent of Students Proficient & Advanced
District Percent of Students Proficient & Advanced
English Language Learners
Student Group
State Percent of Students
Proficient & Advanced
Hispanic
African American
AmericanIndian/NativeAlaskan
Asian/PacificIslander
School Year
All Students
Male
Percent (Not) Tested in School
Female
EconomicallyDisadvantaged
White
Students with Disabilities
2008-09 80% 80% 91% 0% 27% 53% 20% 0%
2007-08 100% 86% 90% 3% 50% 50% 0% 0%
2008-09 71% 74% 79% 0% 14% 57% 29% 0%
2007-08 100% 85% 76% 0% 36% 64% 0% 0%
2008-09 < < 92% < < < < <
2007-08 * * 90% * * * * *
2008-09 * * 96% * * * * *
2007-08 * * 97% * * * * *
2008-09 < < 87% < < < < <
2007-08 < < 85% < * * * *
2008-09 87% 91% 95% 0% 35% 52% 13% 0%
2007-08 100% 86% 94% 5% 62% 38% 0% 0%
2008-09 < 71% 80% < < < < <
2007-08 < 75% 77% < * * * *
2008-09 < 90% 85% < < < < <
2007-08 < < 83% < * * * *
2008-09 83% 78% 86% 0% < < < <
2007-08 100% 84% 84% 10% 44% 56% 0% 0%
2008-09 * * 80% * * * * *
2007-08 * * 85% * * * * *
2008-09 67% 79% 92% 0% 21% 46% 33% 0%
2007-08 100% 87% 90% 6% 53% 47% 0% 0%
2008-09 93% 82% 91% 0% 33% 59% 7% 0%
2007-08 100% 84% 90% 5% 47% 53% 0% 0%
* No state data
< = less than 10
BelowBasic
Percent of Students in School at Each Achievement Level
Migrant
Male
Percent (Not) Tested in School
Advanced Proficient Basic
State Percent of Students
Proficient & Advanced
Hispanic
School Percent of Students Proficient & Advanced
District Percent of Students Proficient & Advanced
English Language Learners
Student Group School Year
All Students
African American
AmericanIndian/NativeAlaskan
Asian/PacificIslander
Female
EconomicallyDisadvantaged
White
Students with Disabilities

sta
te a
nd
Fed
era
l Re
qu
ired
sch
oo
l in
form
atio
n
MEAP 4th Grade ELA - Percentage of students Proficient and Advanced
MEAP 4th Grade Math - Percentage of students Proficient and Advanced
Henry Ford Elementary 2440 E. Clark Road Ypsilanti, Michigan 48198 734.481.8275 734.481.8186 fax http://www.wrcs.k12.mi.us
2008-09 54% 57% 77% 0% 5% 49% 45% 5%
2007-08 53% 53% 76% 5% 11% 42% 42% 5%
2008-09 56% 58% 56% 0% 0% 56% 38% 6%
2007-08 44% 51% 56% 10% 11% 33% 50% 6%
2008-09 < * 73% < < < < <
2007-08 * * 74% * * * * *
2008-09 * * 88% * * * * *
2007-08 * * 86% * * * * *
2008-09 < * 64% < < < < <
2007-08 < < 64% < * * * *
2008-09 53% 51% 83% 0% 11% 42% 47% 0%
2007-08 58% 56% 82% 0% 11% 47% 37% 5%
2008-09 < 13% 44% < < < < <
2007-08 < 20% 43% * * * * *
2008-09 < < 50% < < < < <
2007-08 < < 49% * * * * *
2008-09 45% 50% 64% 0% 0% 45% 52% 3%
2007-08 43% 54% 63% 18% 7% 36% 50% 7%
2008-09 * * 51% * * * * *
2007-08 * * 58% * * * * *
2008-09 50% 58% 74% 0% 5% 45% 40% 10%
2007-08 59% 54% 73% 6% 6% 53% 35% 6%
2008-09 58% 55% 79% 0% 5% 53% 42% 0%
2007-08 48% 51% 80% 5% 14% 33% 48% 5%
* No state data
< = less than 10
BelowBasic
Percent of Students in School at Each Achievement Level
Migrant
Male
Percent (Not) Tested in School
Advanced Proficient Basic
State Percent of Students
Proficient & Advanced
Hispanic
School Percent of Students Proficient & Advanced
District Percent of Students Proficient & Advanced
English Language Learners
Student Group School Year
All Students
African American
AmericanIndian/NativeAlaskan
Asian/PacificIslander
Female
EconomicallyDisadvantaged
White
Students with Disabilities
2008-09 69% 69% 88% 0% 15% 54% 31% 0%
2007-08 82% 72% 86% 5% 24% 58% 16% 3%
2008-09 69% 67% 74% 0% 0% 69% 31% 0%
2007-08 72% 68% 69% 10% 17% 56% 28% 0%
2008-09 < * 87% < < < < <
2007-08 * * 85% * * * * *
2008-09 * * 95% * * * * *
2007-08 * * 95% * * * * *
2008-09 < < 81% < < < < <
2007-08 < < 79% < * * * *
2008-09 79% 75% 92% 0% 32% 47% 21% 0%
2007-08 89% 78% 91% 0% 32% 58% 5% 5%
2008-09 < 44% 68% < < < < <
2007-08 < 40% 65% < * * * *
2008-09 < < 76% < < < < <
2007-08 < < 74% < * * * *
2008-09 66% 65% 80% 6% 10% 55% 34% 0%
2007-08 79% 72% 77% 18% 11% 68% 18% 4%
2008-09 * * 82% * * * * *
2007-08 * * 81% * * * * *
2008-09 75% 72% 88% 0% 20% 55% 25% 0%
2007-08 76% 68% 86% 6% 29% 47% 18% 6%
2008-09 63% 65% 88% 0% 11% 53% 37% 0%
2007-08 86% 76% 86% 5% 19% 67% 14% 0%
* No state data
< = less than 10
BelowBasic
Percent of Students in School at Each Achievement Level
Migrant
Proficient BasicAdvanced
School Percent of Students Proficient & Advanced
District Percent of Students Proficient & Advanced
English Language Learners
Student Group
State Percent of Students
Proficient & Advanced
Hispanic
African American
AmericanIndian/NativeAlaskan
Asian/PacificIslander
School Year
All Students
Male
Percent (Not) Tested in School
Female
EconomicallyDisadvantaged
White
Students with Disabilities
sta
te a
nd
Fed
era
l Re
qu
ired
sch
oo
l in
form
atio
n
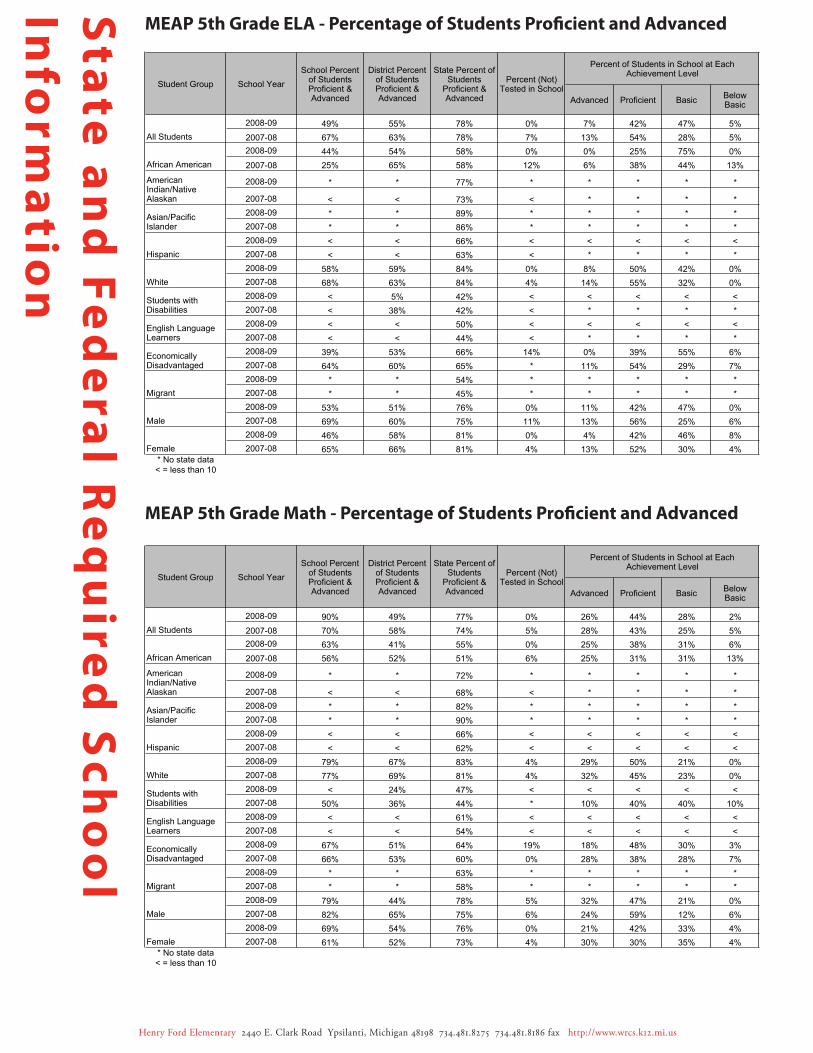
MEAP 5th Grade ELA - Percentage of students Proficient and Advanced
MEAP 5th Grade Math - Percentage of students Proficient and Advanced
Henry Ford Elementary 2440 E. Clark Road Ypsilanti, Michigan 48198 734.481.8275 734.481.8186 fax http://www.wrcs.k12.mi.us
2008-09 49% 55% 78% 0% 7% 42% 47% 5%
2007-08 67% 63% 78% 7% 13% 54% 28% 5%
2008-09 44% 54% 58% 0% 0% 25% 75% 0%
2007-08 25% 65% 58% 12% 6% 38% 44% 13%
2008-09 * * 77% * * * * *
2007-08 < < 73% < * * * *
2008-09 * * 89% * * * * *
2007-08 * * 86% * * * * *
2008-09 < < 66% < < < < <
2007-08 < < 63% < * * * *
2008-09 58% 59% 84% 0% 8% 50% 42% 0%
2007-08 68% 63% 84% 4% 14% 55% 32% 0%
2008-09 < 5% 42% < < < < <
2007-08 < 38% 42% < * * * *
2008-09 < < 50% < < < < <
2007-08 < < 44% < * * * *
2008-09 39% 53% 66% 14% 0% 39% 55% 6%
2007-08 64% 60% 65% * 11% 54% 29% 7%
2008-09 * * 54% * * * * *
2007-08 * * 45% * * * * *
2008-09 53% 51% 76% 0% 11% 42% 47% 0%
2007-08 69% 60% 75% 11% 13% 56% 25% 6%
2008-09 46% 58% 81% 0% 4% 42% 46% 8%
2007-08 65% 66% 81% 4% 13% 52% 30% 4%
* No state data
< = less than 10
BelowBasic
Percent of Students in School at Each Achievement Level
Migrant
Proficient BasicAdvanced
School Percent of Students Proficient & Advanced
District Percent of Students Proficient & Advanced
English Language Learners
Student Group
State Percent of Students
Proficient & Advanced
Hispanic
African American
AmericanIndian/NativeAlaskan
Asian/PacificIslander
School Year
All Students
Male
Percent (Not) Tested in School
Female
EconomicallyDisadvantaged
White
Students with Disabilities
2008-09 90% 49% 77% 0% 26% 44% 28% 2%
2007-08 70% 58% 74% 5% 28% 43% 25% 5%
2008-09 63% 41% 55% 0% 25% 38% 31% 6%
2007-08 56% 52% 51% 6% 25% 31% 31% 13%
2008-09 * * 72% * * * * *
2007-08 < < 68% < * * * *
2008-09 * * 82% * * * * *
2007-08 * * 90% * * * * *
2008-09 < < 66% < < < < <
2007-08 < < 62% < < < < <
2008-09 79% 67% 83% 4% 29% 50% 21% 0%
2007-08 77% 69% 81% 4% 32% 45% 23% 0%
2008-09 < 24% 47% < < < < <
2007-08 50% 36% 44% * 10% 40% 40% 10%
2008-09 < < 61% < < < < <
2007-08 < < 54% < < < < <
2008-09 67% 51% 64% 19% 18% 48% 30% 3%
2007-08 66% 53% 60% 0% 28% 38% 28% 7%
2008-09 * * 63% * * * * *
2007-08 * * 58% * * * * *
2008-09 79% 44% 78% 5% 32% 47% 21% 0%
2007-08 82% 65% 75% 6% 24% 59% 12% 6%
2008-09 69% 54% 76% 0% 21% 42% 33% 4%
2007-08 61% 52% 73% 4% 30% 30% 35% 4%
* No state data
< = less than 10
BelowBasic
Percent of Students in School at Each Achievement Level
Migrant
Male
Percent (Not) Tested in School
Advanced Proficient Basic
State Percent of Students
Proficient & Advanced
Hispanic
School Percent of Students Proficient & Advanced
District Percent of Students Proficient & Advanced
English Language Learners
Student Group School Year
All Students
African American
AmericanIndian/NativeAlaskan
Asian/PacificIslander
Female
EconomicallyDisadvantaged
White
Students with Disabilities

sta
te a
nd
Fed
era
l Re
qu
ired
sch
oo
l in
form
atio
n
MEAP 5th Grade science - Percentage of students Proficient and Advanced
Henry Ford Elementary 2440 E. Clark Road Ypsilanti, Michigan 48198 734.481.8275 734.481.8186 fax http://www.wrcs.k12.mi.us
Category Level 1 Level 2 Level 3 Level 4 Number Met Not Met Total Students
08-09 School 11 (25.6%) 19 (44.2%) 12 (27.9%) 1 (2.3%) 30 (69.8%) 13 (30.2%) 43
07-08 School 10 (24.4%) 22 (53.7%) 7 (17.1%) 2 (4.9%) 32 (78%) 9 (22%) 41
06-07 School 7 (14.9%) 30 (63.8%) 9 (19.1%) 1 (2.1%) 37 (78.7%) 10 (21.3%) 47
05-06 School 7 (16.7%) 18 (42.9%) 17 (40.5%) 0 (0%) 25 (59.5%) 17 (40.5%) 42
08-09 District 27 (17.3%) 67 (42.9%) 41 (26.3%) 21 (13.5%) 94 (60.3%) 62 (39.7%) 156
07-08 District 28 (15.6%) 92 (51.4%) 47 (26.3%) 12 (6.7%) 120 (67%) 59 (33%) 179
06-07 District 31 (17.2%) 103 (57.2%) 41 (22.8%) 5 (2.8%) 134 (74.4%) 46 (25.6%) 180
05-06 District 22 (11.3%) 89 (45.9%) 76 (39.2%) 7 (3.6%) 111 (57.2%) 83 (42.8%) 194
08-09 ISD 1874 (52.1%) 1277 (35.5%) 347 (9.6%) 102 (2.8%) 3151 (87.5%) 449 (12.5%) 3600
07-08 ISD 1765 (49.7%) 1297 (36.5%) 395 (11.1%) 94 (2.6%) 3062 (86.2%) 489 (13.8%) 3551
06-07 ISD 1671 (48.2%) 1385 (40%) 335 (9.7%) 75 (2.2%) 3056 (88.2%) 410 (11.8%) 3466
05-06 ISD 1407 (38.5%) 1593 (43.5%) 571 (15.6%) 87 (2.4%) 3000 (82%) 658 (18%) 3658
08-09 State 50505 (43.2%) 46845 (40.1%) 14755 (12.6%) 4790 (4.1%) 97350 (83.3%) 19545 (16.7%) 116895
07-08 State 48314 (41%) 48136 (40.8%) 15972 (13.6%) 5449 (4.6%) 96450 (81.8%) 21421 (18.2%) 117871
06-07 State 44420 (37.1%) 54976 (45.9%) 16509 (13.8%) 3912 (3.3%) 99396 (83%) 20421 (17%) 119817
05-06 State 36339 (29.6%) 58101 (47.3%) 24007 (19.6%) 4297 (3.5%) 94440 (76.9%) 28304 (23.1%) 122744
Category Level 1 Level 2 Level 3 Level 4 Number Met Not Met Total Students
All 11 (25.6%) 19 (44.2%) 12 (27.9%) 1 (2.3%) 30 (69.8%) 13 (30.2%) 43
Black 4 (25%) 6 (37.5%) 5 (31.2%) 1 (6.2%) 10 (62.5%) 6 (37.5%) 16
Hispanic 0 (0%) 1 (33.3%) 2 (66.7%) 0 (0%) 1 (33.3%) 2 (66.7%) 3
White 7 (29.2%) 12 (50%) 5 (20.8%) 0 (0%) 19 (79.2%) 5 (20.8%) 24
EDD 6 (18.2%) 16 (48.5%) 10 (30.3%) 1 (3%) 22 (66.7%) 11 (33.3%) 33
ELL 0 (0%) 1 (50%) 1 (50%) 0 (0%) 1 (50%) 1 (50%) 2
SWD 1 (12.5%) 2 (25%) 4 (50%) 1 (12.5%) 3 (37.5%) 5 (62.5%) 8
Category Level 1 Level 2 Level 3 Level 4 Number Met Not Met Total Students
All 11 (25.6%) 19 (44.2%) 12 (27.9%) 1 (2.3%) 30 (69.8%) 13 (30.2%) 43
Female 5 (20.8%) 10 (41.7%) 8 (33.3%) 1 (4.2%) 15 (62.5%) 9 (37.5%) 24
Male 6 (31.6%) 9 (47.4%) 4 (21.1%) 0 (0%) 15 (78.9%) 4 (21.1%) 19

sta
te a
nd
Fed
era
l Re
qu
ired
sch
oo
l in
form
atio
n
MEAP 3rd Grade - AYP Data
MEAP 4th Grade - AYP Data
MEAP 5th Grade - AYP Data
Henry Ford Elementary 2440 E. Clark Road Ypsilanti, Michigan 48198 734.481.8275 734.481.8186 fax http://www.wrcs.k12.mi.us
School District State School District State School District State School District State School District State
All Students 100% 100% * 65% 69% 83% 100% 100% * 80% 80% 91%
African American 100% 96% * 52% 66% 69% 100% 97% * 71% 74% 79%AmericanIndian/NativeAlaskan < < * < * 92% < < * < * 92%Asian/PacificIslander * < * * * 80% * < * * * 96%
Hispanic < < * < < 74% < < * < < 87%
White 100% 100% * 77 72% 87% 100% 100% * 87 91% 95%Students with Disabilities < 100% * < 33% 55% < < * < 71% 80%EnglishLanguageLearners < < * < 70% 69% < < * < 90% 85%EconomicallyDisadvantaged 100% 100% * 64% 67% 74% 100% 100% * 83% 78% 86%
Male 100% 99% * 50% 61% 81% 100% 100% * 79% 79% 92%
Female 100% 100% * 78% 80% 86% 100% 100% * 82% 82% 91%
* No state data
< = less than 10
Percent Tested
Goal: 100%
Percent Proficient & Advanced Percent Tested
ELA Mathematics Additional Academic Indicator
Student Group Percent Proficient & Advanced Graduation Rate
Goal: 60% Goal: 100% Goal: 67% Goal: 80%
School District State School District State School District State School District State School District State
All Students 100% 97% * 54% 57% 77% 100% 100% * 69% 69% 88%
African American 100% 91% * 56% 58% 56% 100% 95% * 69% 67% 74%AmericanIndian/NativeAlaskan < < * < * 73% < < * < * 87%Asian/PacificIslander * * * * * 88% * * * * * 95%
Hispanic < < * < < 64% < < * < < 81%
White 100% 87% * 53% 51% 83% 100% 91% * 79% 75% 92%Students with Disabilities < 79% * < 13% 44% < 95% * < 44% 68%EnglishLanguageLearners < < * < < 50% < < * < < 76%EconomicallyDisadvantaged 100% 100% * 45% 50% 64% 94% 100% * 66% 65% 80%
Male 100% 87% * 50% 58% 74% 100% 92% * 75% 72% 88%
Female 100% 96% * 58% 55% 79% 100% 100% * 63% 65% 88%
* No state data
< = less than 10
ELA Mathematics Additional Academic Indicator
Student Group Percent Proficient & Advanced Graduation Rate
Goal: 59% Goal: 100% Goal: 65% Goal: 80%
Percent Tested
Goal: 100%
Percent Proficient & Advanced Percent Tested
School District State School District State School District State School District State School District State
All Students 100% 98% * 49% 55% 78% 100% 98% * 90% 49% 77%
African American 100% 100% * 44% 54% 58% 100% 92% * 69% 41% 55%AmericanIndian/NativeAlaskan * * * * * 77% * * * * * 72%Asian/PacificIslander * * * * * 89% * * * * * 92%
Hispanic < < * < < 66% < < * < < 66%
White 100% 100% * 58% 59% 84% 96% 100% * 79% 67% 83%Students with Disabilities < 100% * < 5% 42% < 75% * < 24% 47%EnglishLanguageLearners < < * < < 50% < < * < < 61%EconomicallyDisadvantaged 86% 100% * 39% 53% 66% 81% 100% * 67% 51% 64%
Male 100% 93% * 53% 51% 76% 95% 92% * 79% 44% 78%
Female 100% 97% * 46% 58% 81% 100% 97% * 69% 54% 76%
* No state data
< = less than 10
Percent Tested
Goal: 100%
Percent Proficient & Advanced Percent Tested
ELA Mathematics Additional Academic Indicator
Student Group Percent Proficient & Advanced Graduation Rate
Goal: 57% Goal: 100% Goal: 62% Goal: 80%