2008-2013 - motilal oswal...2008-2013 18th annual wealth creation study . ... management,...
TRANSCRIPT

Uncommon Profits
By Raamdeo Agrawal
13 December 2013
18th Annual Wealth Creation Study
2008-2013
www.motilaloswal.com 18th Annual Wealth Creation Study

Theme Study
Uncommon Profits
www.motilaloswal.com 18th Annual Wealth Creation Study

2
Theme Discussion Points
Uncommon Profits: What & why
Emergence & Endurance: What & why
Framework to identify Emerging Value Creators
Methodology to shortlist Emerging Value Creators
Why Enduring Value Creators?
Methodology to shortlist Enduring Value Creators
www.motilaloswal.com 18th Annual Wealth Creation Study
Uncommon Profits in companies
=
Uncommon Wealth Creation in markets
A simple mantra for Wealth Creation …

www.motilaloswal.com 18th Annual Wealth Creation Study
Uncommon Wealth Creation #1
0
50
100
150
200
250 1
98
8
19
89
19
90
19
91
19
92
19
93
19
94
19
95
19
96
19
97
19
98
19
99
20
00
20
01
20
02
20
03
20
04
20
05
20
06
20
07
20
08
20
09
20
10
20
11
20
12
20
13
Ambuja Cement Sensex - Rebased
Ambuja up 420x in 25 years; 27% CAGR
Sensex up 45x; 16% CAGR

www.motilaloswal.com 18th Annual Wealth Creation Study
Uncommon Wealth Creation #2
0
150
300
450
600
750
19
98
19
99
20
00
20
01
20
02
20
03
20
04
20
05
20
06
20
07
20
08
20
09
20
10
20
11
20
12
20
13
HDFC Bank Sensex - Re-based
HDFC Bank up 64x in 15 years; 32% CAGR
Sensex up 7x; 14% CAGR
www.motilaloswal.com 18th Annual Wealth Creation Study
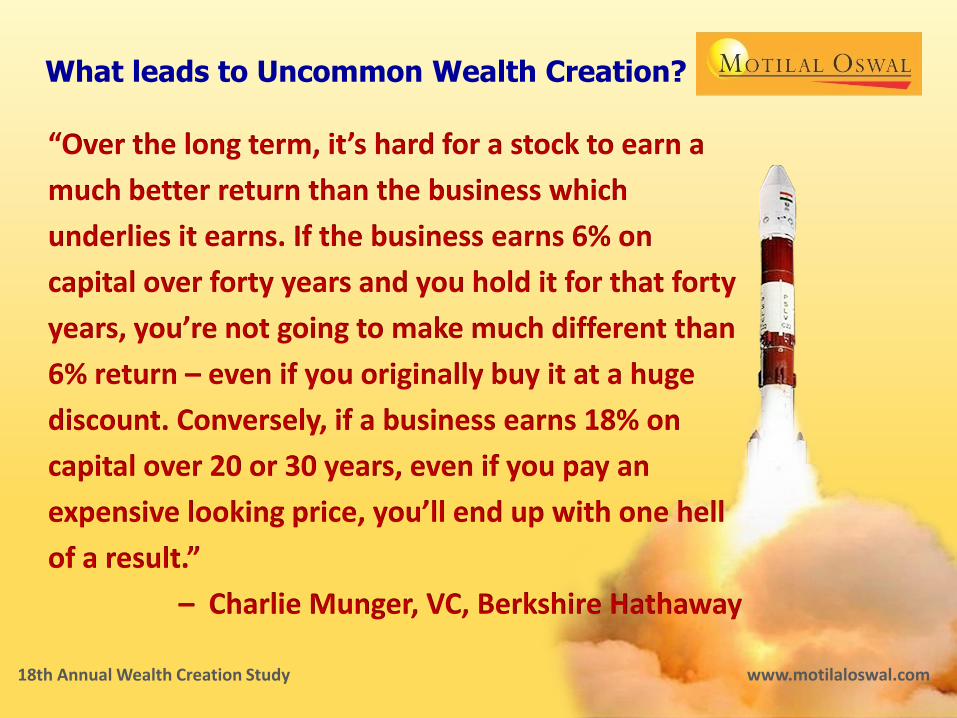
“Over the long term, it’s hard for a stock to earn a
much better return than the business which
underlies it earns. If the business earns 6% on
capital over forty years and you hold it for that forty
years, you’re not going to make much different than
6% return – even if you originally buy it at a huge
discount. Conversely, if a business earns 18% on
capital over 20 or 30 years, even if you pay an
expensive looking price, you’ll end up with one hell
of a result.”
– Charlie Munger, VC, Berkshire Hathaway
What leads to Uncommon Wealth Creation?
www.motilaloswal.com 18th Annual Wealth Creation Study
Uncommon Profits in companies
=
Uncommon Wealth Creation in markets
In simple words …

8
• Uncommon Profitability (%) = RoE > Cost of Equity
• Uncommon Profit (abs) = (RoE – CoE) x Equity employed where RoE = Return on Equity Cost of equity = Opportunity cost of equity or Risk free rate + Equity risk premium
• In Indian context, Cost of Equity = 15%
• Consistent Uncommon Profit earning companies
are Value Creators
What is Uncommon Profit?

9
What is Emergence & Endurance?
• Emergence is first entry of a company into the Uncommon Profit zone i.e. RoE > 15%
• The next challenge is Endurance i.e. sustaining RoE > 15% for several years ahead

10
Uncommon Profit & Company Lifecycle
Pre-Emergence struggle for survival
Time
PAT
POINT OF EMERGENCE
Post-Emergence struggle for Endurance
Introduction Growth Maturity
(b) Decline
(a) Renewal

11
Uncommon Profit Case Study #1
Titan Industries (YoE: 2003)
… Uncommon Wealth Creation
26x in 5 years (85% CAGR),
130x in 10 years (59% CAGR)
Uncommon Profit generation …

12
Uncommon Profit Case Study #2
Gruh Finance (YoE: 2003)
… Uncommon Wealth Creation
10x in 5 years (60% CAGR),
70x in 10 years (54% CAGR)
Uncommon Profit generation …
13
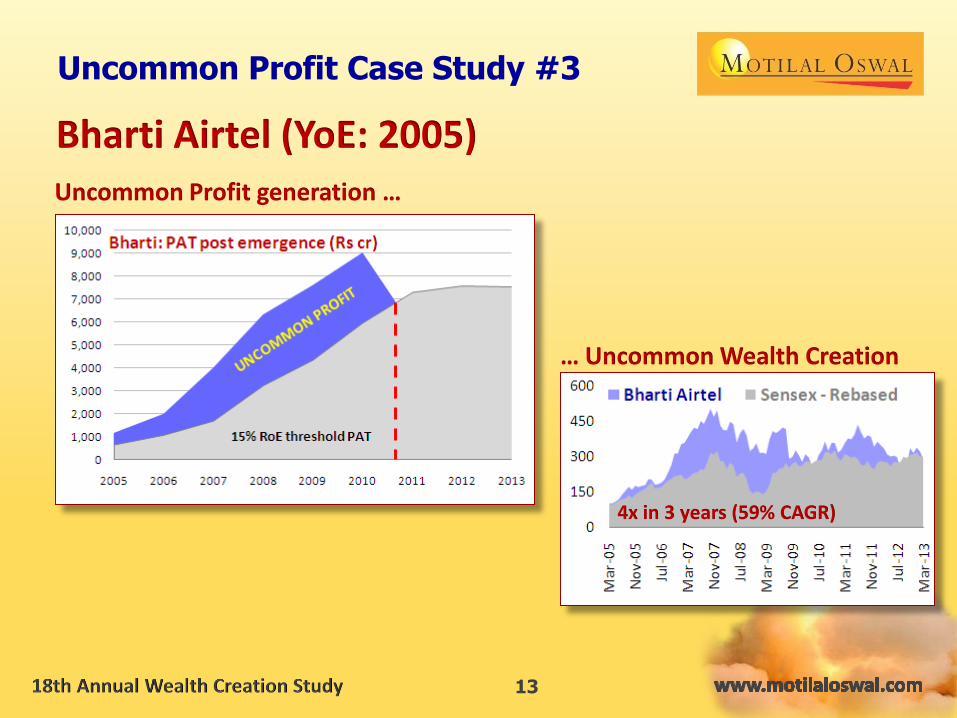
Uncommon Profit Case Study #3
Bharti Airtel (YoE: 2005)
… Uncommon Wealth Creation
4x in 3 years (59% CAGR)
Uncommon Profit generation …

14
Framework to identify Value Creators
Contribution of various factors to abnormal profits
Contributing factor High Performers Low Performers
Emergence Sustainability Emergence Sustainability
Year 2% 3% -7% -5%
Industry 37% 44% 12% 13%
Corporate-parent 18% 19% -4% 2%
Segment-specific 43% 34% 99% 90% Source: Paper by Anita McGahan & Michael Porter
Year – Economic cycle
Industry – Industry-level factors like size of profit pool,
competition, stability, strategic opportunity, etc
Corporate Parent – Promoter or majority owner
Segment-specific – Company-specific factors like quality of
management, strategy/unique value proposition, etc

15
Value Creators: Industry-level factors
#1 Size of profit pool
10 highest PAT sectors (2013)
Sector Rs crores % share
Financials - Banks 84,154 21
Energy - Oil & Natural Gas 39,963 10
Technology - Software 34,702 9
Financials - NBFCs 32,376 8
Mining & Minerals 27,261 7
Energy - Refineries 22,774 6
Utilities 22,349 6
Automobiles 21,931 6
Healthcare 16,518 4
Metals - Non-Ferrous 10,520 3
Total of above 312,547 79
Grand Total 394,786 100
16
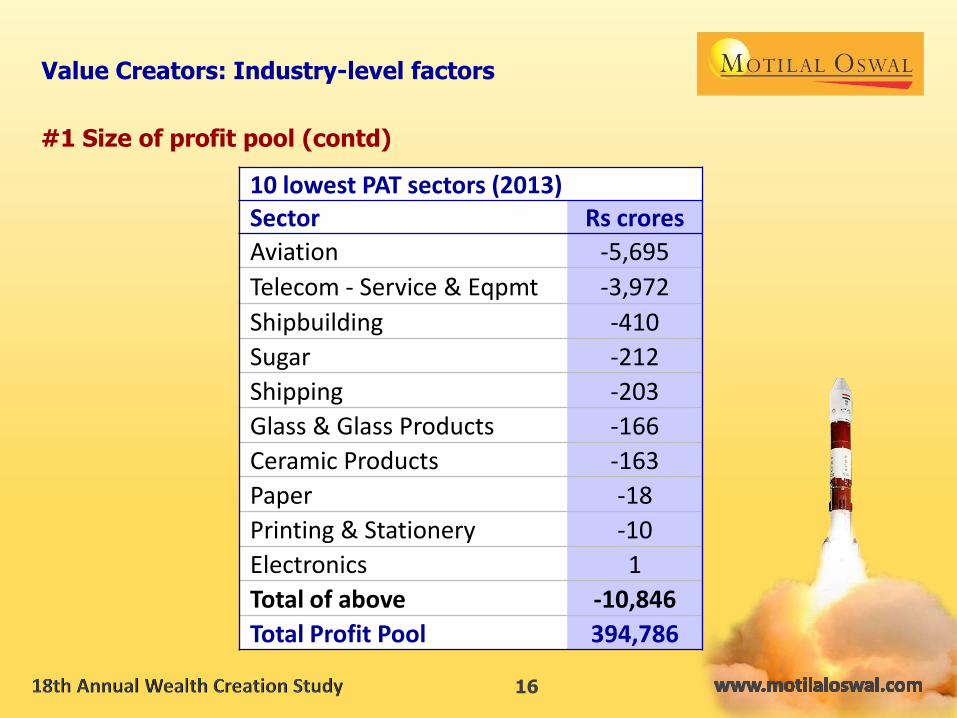
Value Creators: Industry-level factors
#1 Size of profit pool (contd)
10 lowest PAT sectors (2013) Sector Rs crores
Aviation -5,695
Telecom - Service & Eqpmt -3,972
Shipbuilding -410
Sugar -212
Shipping -203
Glass & Glass Products -166
Ceramic Products -163
Paper -18
Printing & Stationery -10
Electronics 1
Total of above -10,846
Total Profit Pool 394,786

17
Value Creators: Industry-level factors
#1 Size of profit pool (contd)
Highest PAT CAGR (03-13) with minimum PAT of Rs 2,000 crores in 2013
Sector 03-13 PAT PAT Sector 03-13 PAT PAT
CAGR (%) Delta CAGR (%) Delta
Textiles L to P 5,653 Infra Developers 28 6,233
Realty L to P 3,799 Metals - Steel 28 3,006
Fertilizers L to P 2,821 Metals - Non-ferrous 27 9,556
Cement 57 7,825 Healthcare 20 13,843
Tech - Software 54 34,239 Capital Goods 19 5,413
Gems & Jewelry 46 3,176 Tobacco Products 18 6,275
Financials - NBFC 46 31,647 Banks 18 67,998
Mining & Minerals 46 26,627 Auto Ancillaries 17 2,917
Automobiles 39 21,101
Chemicals 29 3,115 TOTAL CORP. SECTOR 20 331,719

18
Value Creators: Industry-level factors
#1 Size of profit pool (contd)
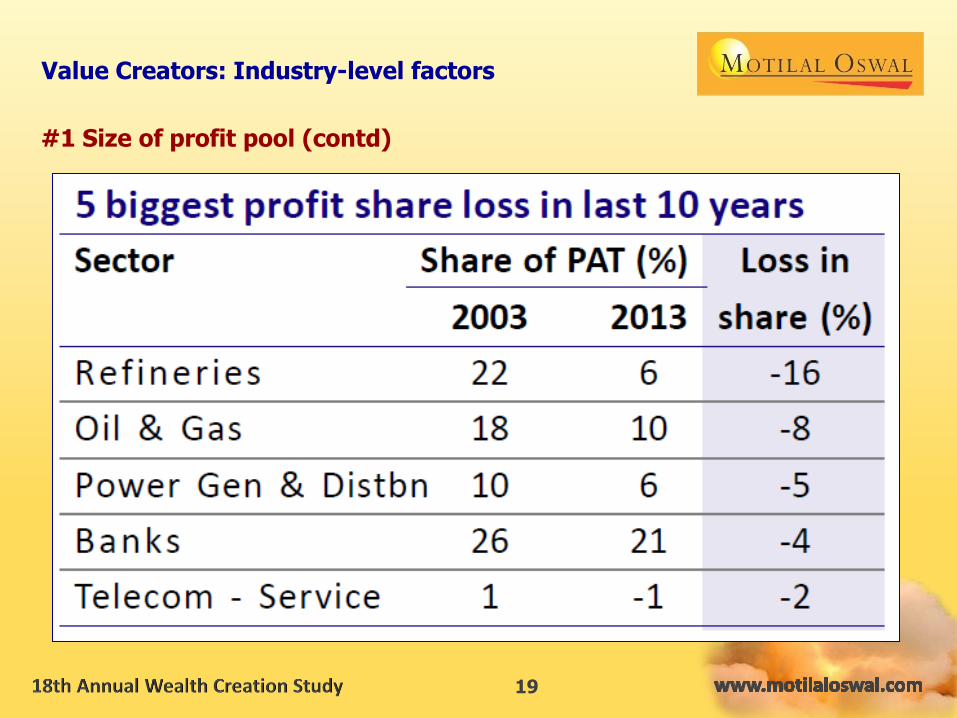
19
Value Creators: Industry-level factors
#1 Size of profit pool (contd)

20
#2 Competitive landscape & bargaining power
Value Creators: Industry-level factors
Porter’s 5 forces
framework to
assess competition
& bargaining power
21
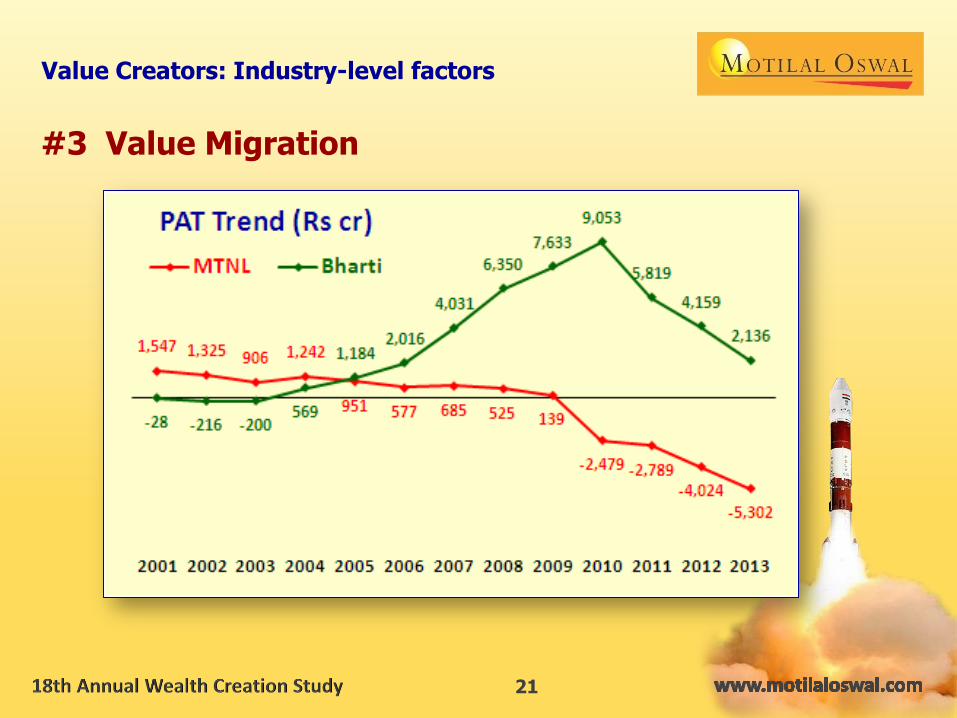
#3 Value Migration
Value Creators: Industry-level factors
22
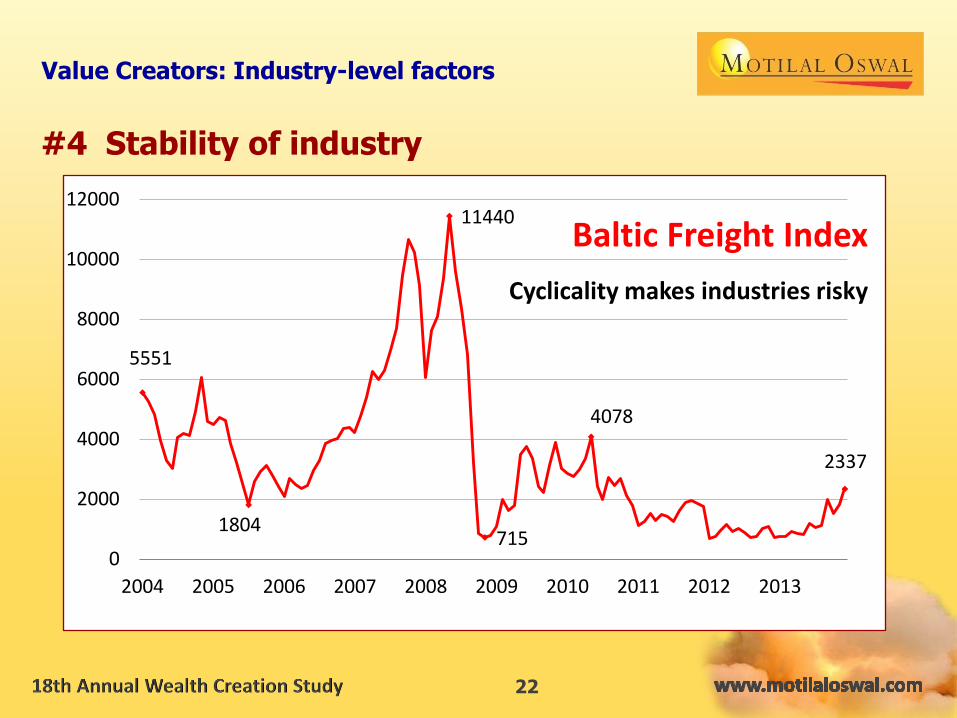
#4 Stability of industry
Value Creators: Industry-level factors
5551
1804
11440
715
4078
2337
0
2000
4000
6000
8000
10000
12000
2004 2005 2006 2007 2008 2009 2010 2011 2012 2013
Baltic Freight Index
Cyclicality makes industries risky

23
#5 Emergence of new industry /strategic opportunity
Value Creators: Industry-level factors
0
300
600
900
1,200
1,500
Feb
-10
May
-10
Au
g-1
0
No
v-1
0
Feb
-11
May
-11
Au
g-1
1
No
v-1
1
Feb
-12
May
-12
Au
g-1
2
No
v-1
2
Feb
-13
May
-13
Au
g-1
3
No
v-1
3
Jubilant Foodworks Sensex - Rebased
Jubilant up 6x in under 4 years; CAGR of 65% v/s 7% for Sensex
Uncommon Wealth Creation
24
Value Creators: Corporate-parent factors
3Is – Integrity + Intelligence + Initiative
#1 Value system
#2 Processes
#3 Capital allocation
#4 Management skill v/s Luck

25
Value Creators: Company-specific factors
#1 Unique value proposition / Strategy
#2 Nature of business: Consumer Adv v/s Production Adv
#3 Market leadership or pioneering

26
Pitfalls to avoid in Emergence
#1 Pre-empting emergence
#2 Emergence during peak of good times
“…the risk of paying too high a price for good-quality
stocks – while a real one – is not the chief hazard
confronting the average buyer of securities.
Observation over many years has taught us that the
chief losses to investors come from the purchase of
low-quality securities at times of favorable business conditions.”
– Benjamin Graham in his book The Intelligent Investor

27
Methodology for Emerging Value Creators
#1 Age criterion
Select listed companies below 25 years of age
#2 Meaningful Emergence
15% RoE for first time with minimum PAT size, say, Rs 10 crores
#3 View on corporate-parent/management
based on group performance, Annual Reports, payout policy, etc
#4 Avoid cyclicals
Incorporating stability of industry
#5 Valuation check considering risk of non-Endurance
P/E typically not exceeding 20x

28
Backtesting during 2001 to 2008
Emerging Value Creators’ financial & stock market performance
Company Year of P/E (x) 5-year post emergence (%) Emerg. in YoE PAT CAGR Price CAGR Rel Perf. Shriram Transport 2001 1 56 85 60 Accelya Kale 2008 3 36 60 56 Shriram City Union 2004 3 45 70 58 GRUH Finance 2003 4 33 60 22 Plastiblends (I) 2004 4 1 4 -8 Manappuram Finance 2007 4 123 70 64 Havells India 2004 7 P to L 39 27 Cera Sanitaryware 2008 7 36 29 17 KPIT Tech 2004 8 36 4 -7 Blue Dart Express 2001 9 22 45 20 Titan Industries 2003 12 53 85 46 Hitachi Home 2006 12 14 22 11 Tata Elxsi 2001 16 20 23 -3 Emami 2007 18 31 33 27 Suprajit Engg. 2006 18 21 0 -12 IL&FS Invt Managers 2007 18 32 9 3 Asahi India Glass 2002 19 25 51 21 AVERAGE 10 24 41 24

29
Backtesting during 2001 to 2008
Applying Value Creator checklist items (“amplifiers”)
Industry Profit pool size
Nature of business
Leadership
Amplifier No. of cos.
5 years post-emergence (%) PAT CAGR Avg RoE Price CAGR Rel. Perf.
Industry Profit Pool High 10 26 29 55 37 Low 7 21 37 20 4
Nature of business advantage Consumer 9 21 34 46 31 Production 8 27 30 34 16
Leadership i.e. among top 3 players Yes 10 19 32 45 28 No 7 31 32 34 18
Portfolio avg 17 24 32 41 24

30
Backtesting during 2001 to 2008
Optimized portfolio with Amplifiers
Company P/E (x) 5-year post emergence (%)
in YoE PAT CAGR Price CAGR Rel. Perf.
Manappuram Finance 4 123 70 64
Shriram Transport 1 56 85 60
Titan Industries 12 53 85 46
Havells India 7 P to L 39 27
Blue Dart Express 9 22 45 20
AVERAGE 7 – 65 43
31
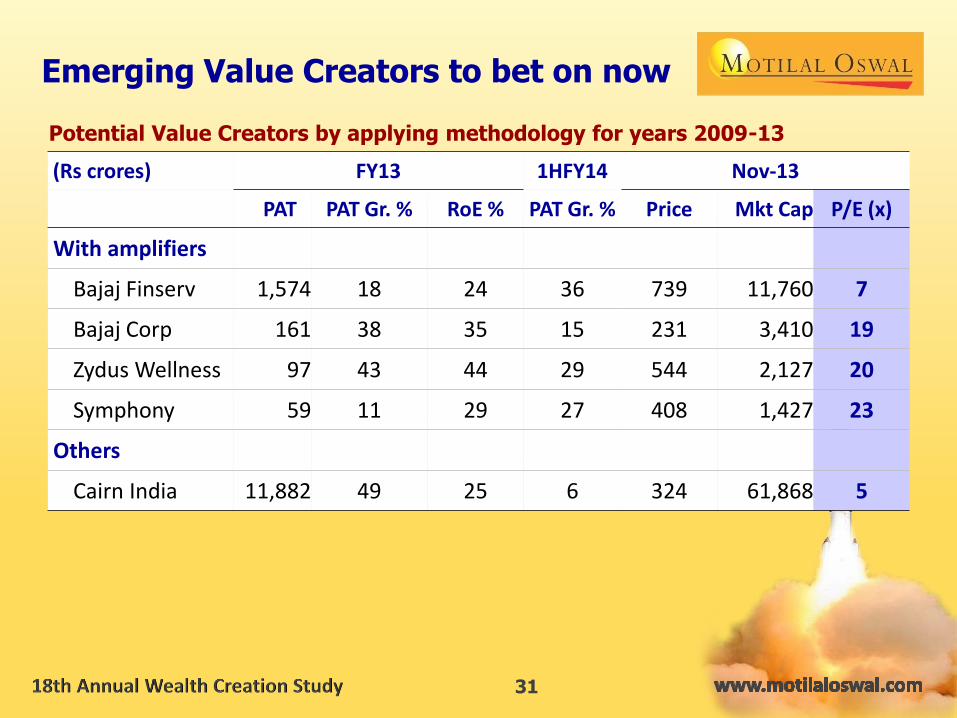
Emerging Value Creators to bet on now
Potential Value Creators by applying methodology for years 2009-13
(Rs crores) FY13 1HFY14 Nov-13
PAT PAT Gr. % RoE % PAT Gr. % Price Mkt Cap P/E (x)
With amplifiers
Bajaj Finserv 1,574 18 24 36 739 11,760 7
Bajaj Corp 161 38 35 15 231 3,410 19
Zydus Wellness 97 43 44 29 544 2,127 20
Symphony 59 11 29 27 408 1,427 23
Others
Cairn India 11,882 49 25 6 324 61,868 5

32
Why Enduring Value Creators
Emerging Value Creators are rare
(we could get only 17 in 8 years 2001-08)
Enduring Value Creators too
outperform despite being fully discovered
and fairly discounted
A suitable methodology may help
to shortlist Enduring Value Creators

33
Methodology for Enduring Value Creators
#1 Quality & Longevity criteria
RoE >= 15% for each of the last 10 consecutive years
#2 View on corporate-parent/management
based on group performance, Annual Reports, payout policy, etc
#3 Growth
Last 3-year CAGR of at least 15%
#4 Value-enhancing growth
Postive delta RoE over the last 5 years
#5 Reasonable valuation
Not more than 50% premium to market
i.e. P/E typically not exceeding 30x

34
Backtesting during 1999 to 2008
2008 Enduring Value Creators’ financial & stock market performance
Company 2008-13 P/E
PAT
CAGR Price CAGR
Rel. Perf.
2008 2013
Berger Paints 19 40 36 12 31
Torrent Pharma 28 38 34 9 13
Asian Paints 22 33 29 28 43
Castrol India 15 27 23 20 33
Colgate-Palmolive 16 27 23 22 34
Marico 18 26 22 26 37
City Union Bank 26 25 21 7 8
H D F C 20 12 8 25 19
Wipro 13 11 7 19 18
Glenmark Pharma -1 -1 -5 19 20
AVERAGE 16 24 20 21 20

35
Enduring Value Creators to bet on now
Applying methodology for years 2004 to 2013; preferred bets highlighted
Company 2010-13 2003-13 P/E Price Return CAGR
PAT CAGR % Avg RoE % (x) (INR) 08-13 (%)
City Union Bank 28 23 7 49 25
Axis Bank 28 20 10 1,155 11
Suprajit Engg 24 31 11 39 34
Torrent Pharma 27 26 15 462 38
HCL Technologies 47 26 16 1,087 25
M & M Financial 36 22 17 296 28
Zydus Wellness 28 37 20 544 38
VST Industries 25 31 20 1,664 37
HDFC Bank 32 18 23 661 19
Astral Poly Technik 29 30 24 250 35
GRUH Finance 28 27 26 233 47
ITC 21 29 34 320 25
Hindustan Unilever 16 77 40 594 17
Page Industries 42 62 44 5,265 51

Thank You !
&
Happy Investing For
Uncommon Profits