2008 annual report - true cost of...
TRANSCRIPT

A
Abbott 2008 Annual Report
2008 Annual Report

Abbott 2008 Annual Report
B
1 Letter to Shareholders12 Abbott Science18 Pharmaceuticals24 Nutritional Products28 Medical Products36 Global Citizenship38 Financial Report40 Consolidated Financial Statements and Notes58 Management Report on Internal Control Over Financial Reporting59 Reports of Independent Registered Public Accounting Firm60 Financial Instruments and Risk Management61 Financial Review70 Summary of Selected Financial Data71 Directors and Corporate Officers72 Shareholder and Corporate Information
Abbott is a global, diversified health care company devoted to the discovery, development, manufacture and marketing of pharmaceuticals, nutritional products for children and adults, and medical products, including devices, diagnostic tests and instruments. The company employs more than 72,000 people and markets its products worldwide.
Five-year-old Mariana Pinto spends hours playing. In order to keep her energy up, she relies on PediaSure formula, a complete, balanced source of nutrition, providing the extra calories, plus the protein, vitamins and minerals needed for healthy growth. PediaSure products come in a variety of “kid approved” flavors.
On the cOver: PediaSureMariana Pinto, Rio de Janeiro, Brazil

1
Abbott 2008 Annual ReportAbbott 2008 Annual Report
Dear Fellow Shareholder: In 2008, Abbott met its major goals and invested in new opportunities that will help us achieve consistent performance in the years ahead. We further positioned the company for sustained success built on new growth franchises, well-defined leadership positions, significant sources of cash flow and a broadly diversified base of reliable earnings. With this strong foundation, our company is particularly well prepared to meet the challenges of the future and to deliver strong, durable earnings growth.
Miles D. WhiteChairman of the Board and Chief Executive Officer
Miles White (left) and Tom Freyman attend the opening in February 2009 of Abbott’s state-of- the-art nutritional products manufacturing facility in Singapore.
Thomas C. FreymanExecutive Vice President, Finance and Chief Financial Officer
Abbott 2008 Annual Report
2
As I’ve discussed with you in these pages over the years, our
primary goal has been to build Abbott for balanced, sustainable,
high-quality sales and earnings growth. 2008 was a perfect
example of the successful execution of our strategy to achieve
that goal. For the year, we delivered double-digit sales growth
across our three major global health care businesses: pharma-
ceuticals, nutritional products and medical products. As a result
of our outstanding performance, we achieved global sales of
nearly $30 billion.
We delivered equally strong financial results for our sharehold-
ers, as earnings per share grew strong double digits again.
We also generated record operating cash flow in 2008, improving
our flexibility by reducing our net debt. We repurchased more
than $1 billion worth of Abbott stock. We marked our 36th
consecutive year of rising dividends with an 11 percent increase,
which returned more than $2 billion in cash to our shareholders.
These dividends, in addition to our strong stock price perfor-
mance, have provided Abbott shareholders a total return on
their investment of 46 percent over the last three years; the total
return of the Standard & Poor’s Index, by contrast, decreased
by 23 percent during the same period.
Sustaining our growth
The core of our corporate strategy is technological and
market leadership across a broad range of health care
businesses. To this end, in 2008, Abbott had nine major
new-product approvals, which were distributed across our major
businesses, providing strong momentum for sustained sales and
earnings growth.
In pharmaceuticals, two new uses for our immunology agent
Humira were approved for patients: chronic plaque psoriasis and
polyarticular juvenile idiopathic arthritis. These contributed to a
more than 40 percent increase in demand for Humira, helping to
build a patient base of approximately 340,000 in 77 countries.
We also launched Simcor, our combination lipid therapy, and
we received U.S. approval to market Trilipix, the first and only
fenofibrate approved in the United States for use in combination
with statin drugs to help manage patients’ cholesterol and
triglycerides. In our vascular business, we received U.S. approval
for our Xience V drug-eluting stent, which became the U.S.
market leader within just three months of its FDA approval and
launch. In diabetes care, we introduced two new FreeStyle
glucose-testing products. Our diagnostics business introduced
the Architect i1000SR analyzer and assays. In nutritional products,
we launched Similac Advance EarlyShield, a new infant formula
developed to improve a baby’s immune system.
And we strengthened our leadership positions across our range
of global businesses. Humira outperformed other biologics
based on its competitive profile and remains well positioned
for continued strong double-digit growth in the years ahead.
In the cholesterol market, Niaspan is the number one drug for
raising HDL, or good cholesterol, and our TriCor/Trilipix franchise
includes the top therapies for reducing triglycerides.
Our nutrition business is one of the strongest globally, with
market-leading positions in the majority of categories in which
we compete, including infant formula and adult, therapeutic
and performance nutrition products. To meet growing demand
around the world, we recently opened our largest-ever nutritional
manufacturing plant in Singapore. In vascular devices, we’re
the market leader in bare-metal stents, carotid stents and
coronary guide wires, and now Xience V is a leading drug-
eluting stent in both the United States and Europe. We look
forward to launching Xience V in Japan by early 2010.
Letter to our shareholders
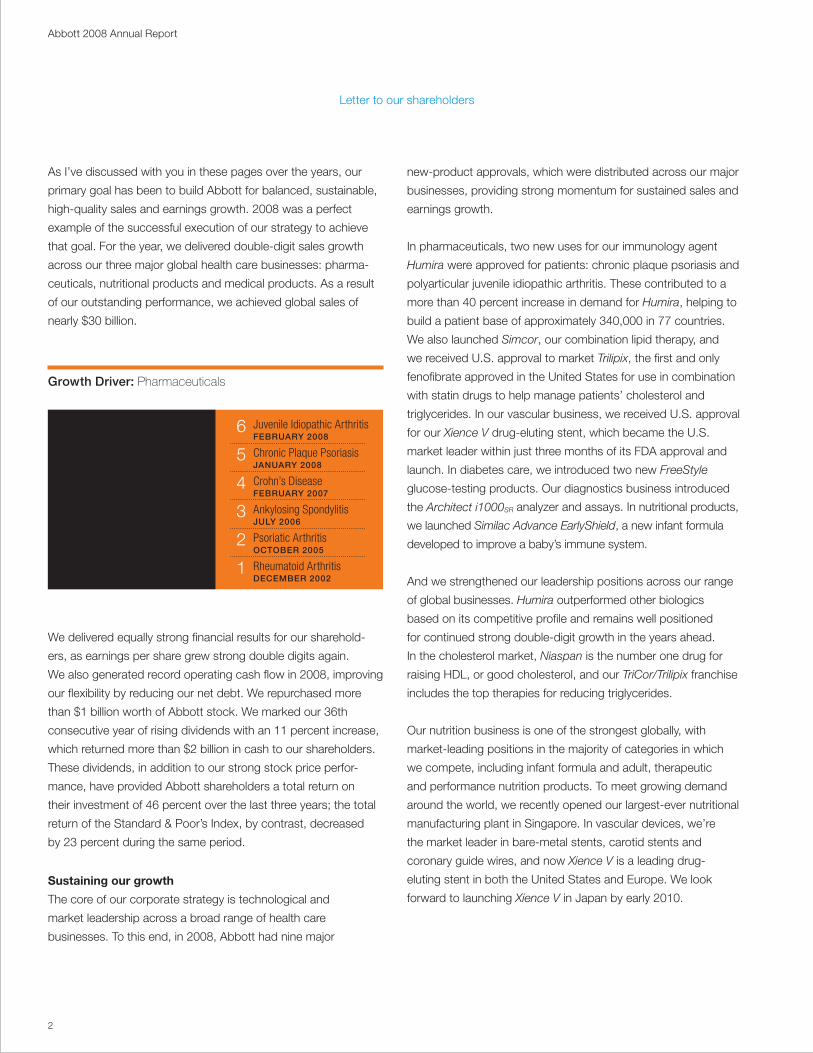
Growth Driver: Pharmaceuticals
Since its initial launch in 2002, Abbott’s biologic, Humira, has helped hundreds of thousands of patients and received approval for several new uses.
Juvenile Idiopathic ArthritisFebRuARy 2008
Chronic Plaque PsoriasisjAnuARy 2008
Crohn’s DiseaseFebRuARy 2007
Ankylosing Spondylitisjuly 2006
Psoriatic ArthritisoctobeR 2005
Rheumatoid ArthritisDecembeR 2002
6
5
4
3
2
1
3
Abbott 2008 Annual Report
Our growth in 2008 was well balanced across our businesses,
as well as geographic markets. We continue to demonstrate
strength in the world’s most developed markets, but are growing
faster in emerging markets. As a result, slightly more than half of
our 2008 sales came from outside the United States.
Advancing our future
In addition to expanding our product offering in 2008, we further
refined our diverse business mix through partnerships, strategic
acquisitions and divestiture of nonstrategic assets. We concluded
our highly successful 30-year TAP joint venture with an equal
division of assets. This brought Abbott the hormone treatment
Lupron, which strengthens our position in cancer therapeutics,
a significant and growing area of interest for Abbott, in which we
conduct cutting-edge internal research.
In early 2009, we further strengthened our ability to innovate
in molecular diagnostics with our acquisition of Ibis Biosciences,
a leader in highly sensitive testing for identifying infectious
agents. The Ibis technology is used in biodefense, forensics,
and infectious disease detection and surveillance. We see
its potential as a powerful diagnostic tool in the hospital and
clinical setting, as well.
In 2008, we sold our small spine business in order to concentrate
on our core businesses and other new opportunities in keeping
with our growth profile.
And we acted on such an opportunity at the beginning of
2009 with our announcement to acquire Advanced Medical
Optics (AMO), a leader in the growing vision-care market. AMO
is a sound addition to our broad mix of technology-driven
businesses, with more than $1 billion in annual sales, thanks to
strong positions in three important vision-care market segments.
Its largest business is cataract surgical devices, in which it’s the
number two player worldwide. It’s the global leader in LASIK
surgical devices, its second-largest business. And its third
segment is eye care, including such consumer brands as the
Complete and Blink lines of contact lens solutions and eyedrops.
Our growth opportunity in the $22 billion global vision-care market
is highly attractive, based on the very favorable demographic
trends supporting it, particularly the steady growth of the elderly
population worldwide. There are more than 700 million people
globally over 60 years of age, more than half of whom have
cataracts. This age segment of the population is expected to
grow to 1 billion by 2020.
In addition to Abbott’s strong, near-term growth drivers, our
new-product pipeline continues to be among the industry’s best,
with cutting-edge technologies in development across our busi-
nesses. With the recent success of our late-stage pipeline, we’re
now focused on an array of early- to mid-stage opportunities.
In pharmaceuticals, we have a number of unique compounds
in early-stage development for neuroscience and pain
management, oncology, immunology, infectious diseases and
other areas of opportunity.
In neuroscience, we’re developing compounds to address
Alzheimer’s disease, schizophrenia, pain and other neurological
conditions. In oncology, our compounds in development
employ unique, less-toxic approaches to inhibit tumor growth
and improve response to common cancer therapies. In
immunology, we’re focused on our strength in biologic research
and development, but we’re also evaluating a number of
small-molecule oral compounds in our preclinical immunology
program. In our hepatitis C research, we’re pursuing both small-
molecule and biologic targets. The compounds in our pipeline
have demonstrated significant potential to improve on current
treatment options. We also have developed proprietary research
Letter to our shareholders
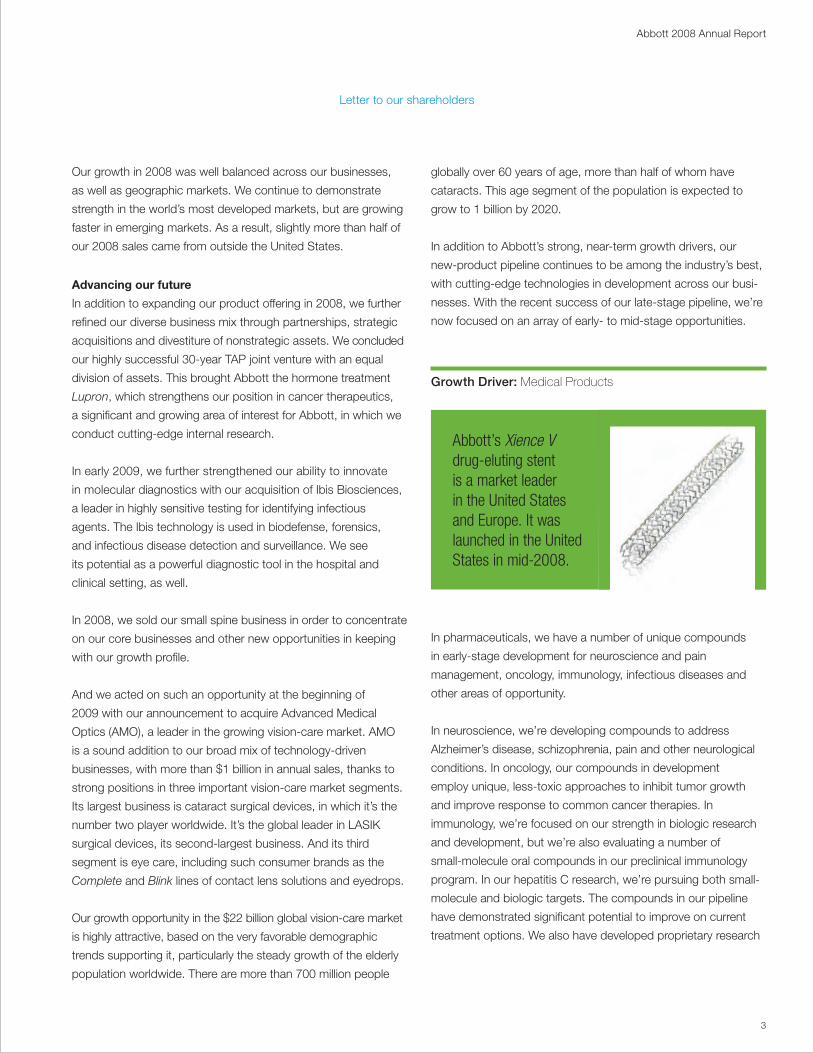
Abbott’s Xience V drug-eluting stent is a market leader in the United States and Europe. It was launched in the United States in mid-2008.
Growth Driver: Medical Products
Abbott 2008 Annual Report
4
technology that could lead to combination biologic therapies with
potential applications in a number of therapeutic areas, including
oncology and immunology.
We are equally committed to expanding our diverse medical
products pipeline. In diagnostics, we’re developing more
sensitive molecular testing that can predict which patients are
likely to benefit from particular therapies. In vascular research,
we’re developing a next-generation Xience V drug-eluting stent
to further enhance deliverability for physicians, especially in
longer lesion lengths. In addition, we’re leading the way in the
development of the next breakthrough in vascular technology,
a bioabsorbable drug-eluting stent. Abbott has an advanced
bioabsorbable drug-eluting stent clinical program, which we
expect will give us a significant advantage in leading this market
in the years ahead.
Reaffirming our vision
Today’s backdrop of high economic uncertainty and global
change emphasizes more than ever the value of Abbott’s proven
combination of strengths. Because of the essential nature of the
products we make, the health care industry is less susceptible
than others to fluctuations in the larger economy. Abbott holds a
uniquely strong position within that industry. No business is 100
percent recession-proof, but the effects of the broad economic
slowdown have been manageable for our company.
Our combination of strengths is rare in today’s business universe.
Consequently, we enter 2009 with optimism about our outlook
and confidence that we can continue to deliver double-digit
earnings-per-share growth. This goal is supported by our
continued focus on increasing margins and returns companywide.
Maintaining this progress is among our top priorities.
The balance of our businesses — and their leadership positions
in desirable, technology-driven markets — underscores Abbott’s
strength and dependability. Our company is not captive to the
dynamics of a single market, and we have many opportunities
to expand, innovate and succeed. Also important, Abbott’s
intellectual property portfolio is secure, with one of the industry’s
lowest exposures to generic competition in the coming years.
The desirable position we occupy is a direct result of the
strategy we’ve executed steadily over the past decade. Abbott’s
strong and tested management team — and more than 72,000
employees worldwide — has delivered consistently, achieving
industry-leading results in recent years. Our accomplishments
are in keeping with our company’s well-established culture of
high performance and steady execution.
We see ourselves as stewards of Abbott’s 120-year tradition —
a stewardship that requires a combination of prudence and
vision. Our company has long been defined by its long-term
perspective and staying power, its unflagging attention to
business fundamentals, its strong managerial discipline and its
constant commitment to the people we serve.
Following a very successful 2008, we are better positioned
strategically, significantly stronger financially and more diverse
operationally. Abbott today provides its stakeholders with a
unique and invaluable combination of strengths — strengths
that clearly stand apart in today’s uncertain business
environment. We’re in the right markets, with outstanding
prospects for sustainable, reliable long-term growth.
Abbott 2008 Annual Report
miles D. WhiteChairman of the Board and Chief Executive OfficerMarch 3, 2009
Letter to our shareholders
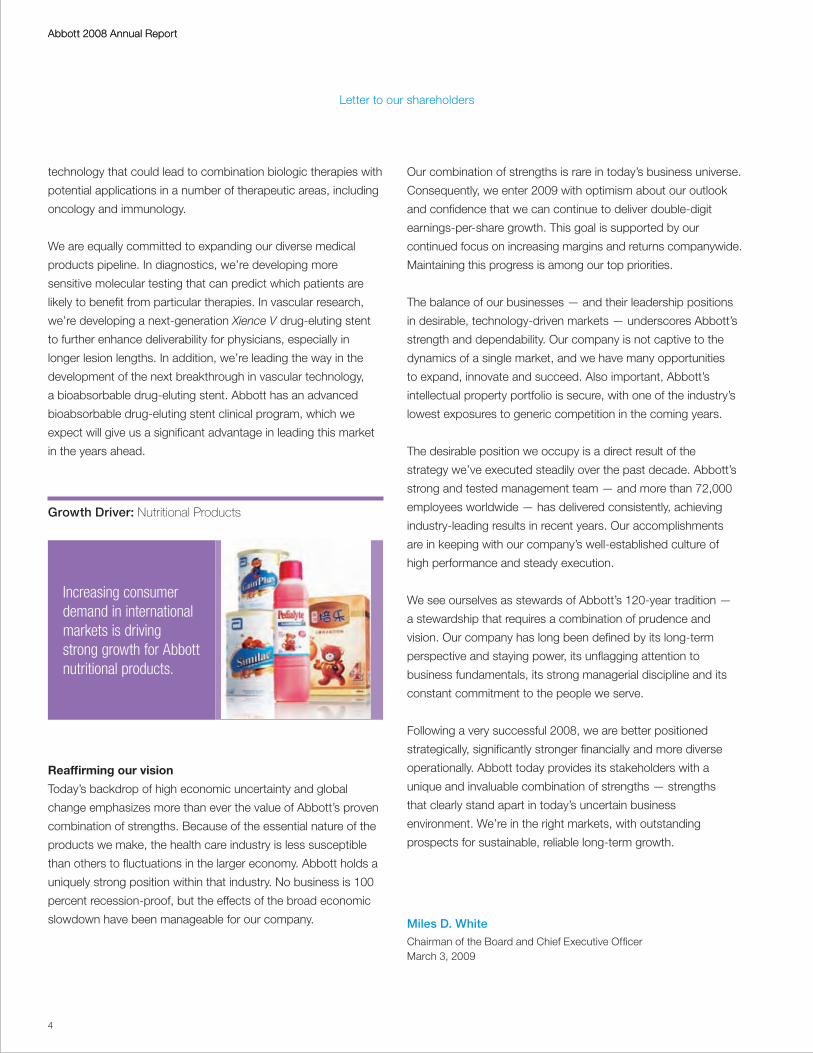
Increasing consumer demand in international markets is driving strong growth for Abbott nutritional products.
Growth Driver: Nutritional Products

5
Abbott 2008 Annual Report
Sustaining our growth.
Advancing our future.
5

Abbott 2008 Annual Report
6
Abbott 2008 Annual Report
Pharmaceuticals
Abbott’s diverse mix of higher-growth, innovation-driven
health care businesses aligns with patient needs worldwide.
Breadth
6
AnesthesiaAnti-infectivesCardiovascularImmunologyMetabolicsNeuroscience
OncologyPain CareRenal CareRespiratory Virology
7
Abbott 2008 Annual ReportAbbott 2008 Annual Report
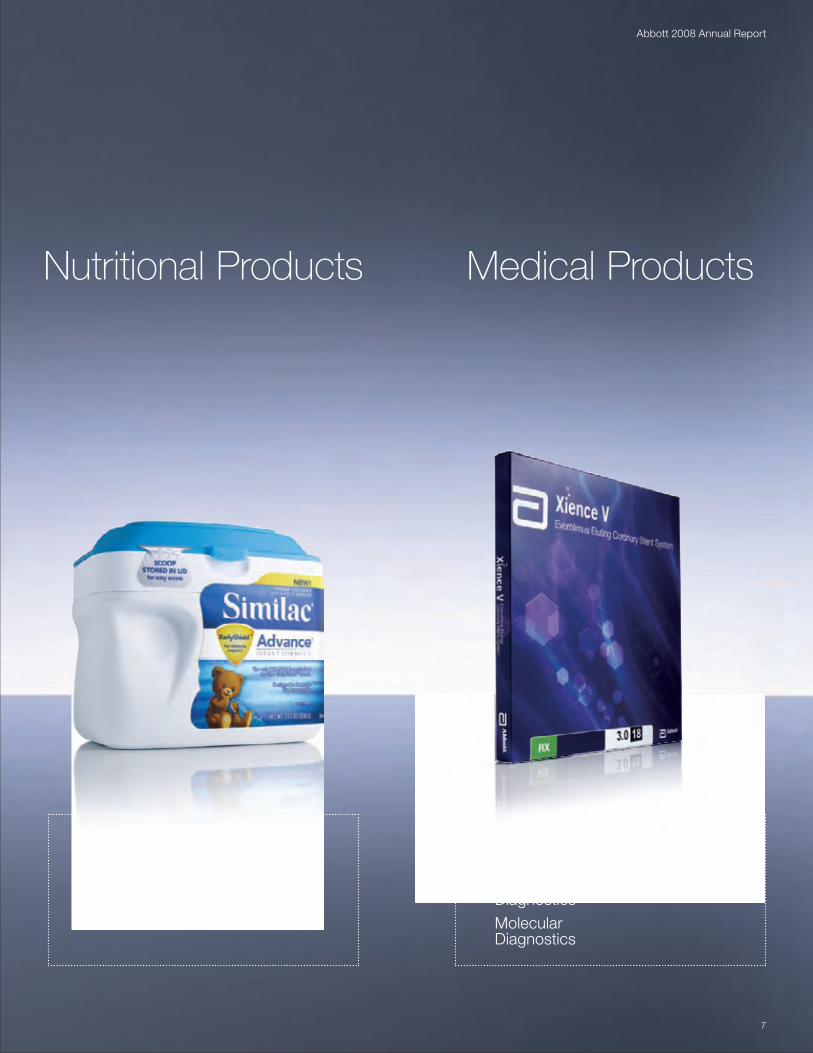
Nutritional Products Medical Products
Animal Health
Diabetes Care
Laboratory Diagnostics
MolecularDiagnostics
Point of Care Diagnostics
Vascular Devices
Adult NutritionPediatric Nutrition
7

Abbott 2008 Annual Report
8
Abbott’s Xience V is a market-leading drug-eluting stent in the United States and Europe for treating coronary artery disease.
An estimated 7 million people worldwide die each year from coronary artery
disease — the number one killer in the United States.
Abbott 2008 Annual Report
Presence
8
Abbott is addressing global health care
concerns and maximizing the impact our products
have for patients around the world.
Chagas disease is a tropical parasitic disease endemic in Latin America. It afflicts an
estimated 15 million people in Mexico, Central America and South America. If left untreated, Chagas is often fatal. In 2008, we launched
a test for Chagas on our Abbott Prism blood-screening instrument.
9
Abbott 2008 Annual ReportAbbott 2008 Annual Report
9
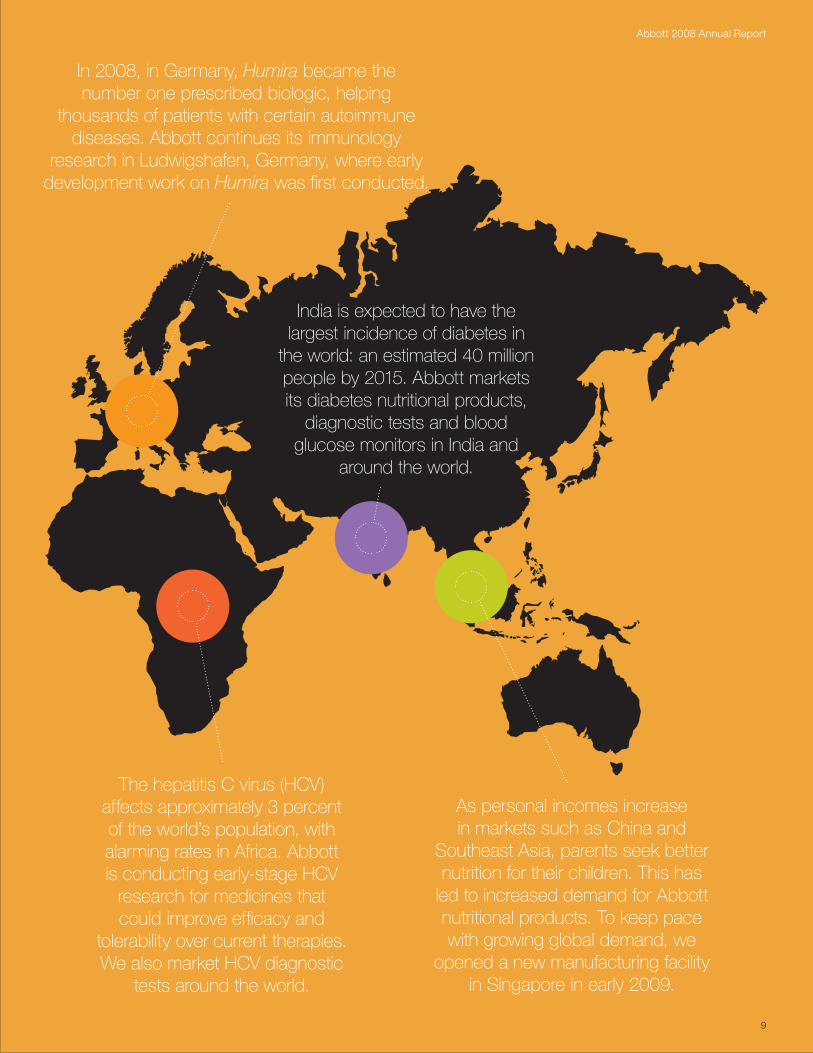
The hepatitis C virus (HCV) affects approximately 3 percent of the world’s population, with alarming rates in Africa. Abbott is conducting early-stage HCV
research for medicines that could improve efficacy and
tolerability over current therapies. We also market HCV diagnostic
tests around the world.
As personal incomes increase in markets such as China and
Southeast Asia, parents seek better nutrition for their children. This has
led to increased demand for Abbott nutritional products. To keep pace with growing global demand, we
opened a new manufacturing facility in Singapore in early 2009.
In 2008, in Germany, Humira became the number one prescribed biologic, helping
thousands of patients with certain autoimmune diseases. Abbott continues its immunology
research in Ludwigshafen, Germany, where early development work on Humira was first conducted.
India is expected to have the largest incidence of diabetes in
the world: an estimated 40 million people by 2015. Abbott markets its diabetes nutritional products,
diagnostic tests and blood glucose monitors in India and
around the world.

Abbott 2008 Annual Report
10
Abbott 2008 Annual Report
Abbott’s track record of strong financial results
provides the foundation for reliable and
sustainable performance.
Strength
10
r&D Investment(dollars in billions)
Abbott continues to increase its investment in a diverse pipeline of medical devices, diagnostics, pharmaceuticals and nutritional products, addressing areas where medical need is greatest.
2004 2005 2006 2007 2008
$1.7$1.8
$2.3
$2.5
$2.7
net Sales Worldwide*(dollars in billions)
*Sales excluding Boehringer Ingelheim products. For sales including these products, see page 70.
In 2008, Abbott delivered sales growth of 13.9 percent, supported by double-digit growth in each of our major global businesses — nutritional products, medical products and pharmaceuticals.
2004 2005 2006 2007 2008
$18.1
$20.0
$22.3
$25.9
$29.5
11
Abbott 2008 Annual Report
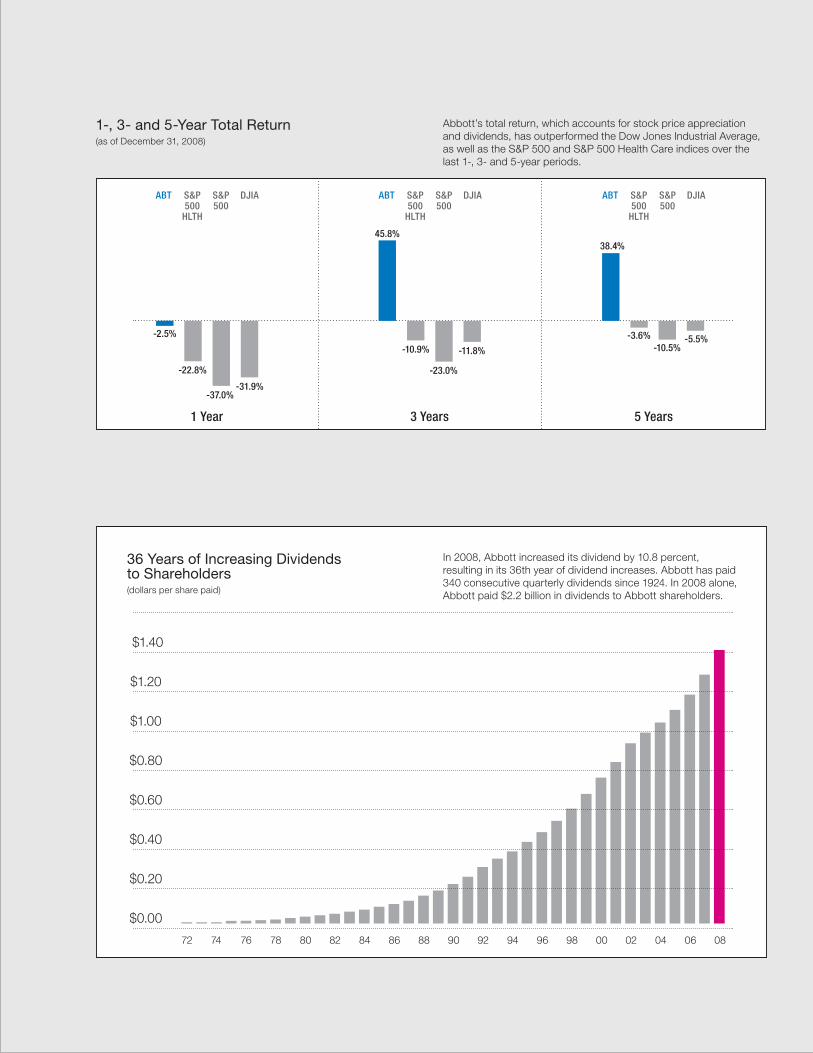
36 Years of Increasing Dividends to Shareholders(dollars per share paid)
72 74 76 78 80 82 84 86 88 90 92 94 96 98 00 02 04 06 08
$1.40
$1.20
$1.00
$0.80
$0.60
$0.40
$0.20
$0.00
In 2008, Abbott increased its dividend by 10.8 percent, resulting in its 36th year of dividend increases. Abbott has paid 340 consecutive quarterly dividends since 1924. In 2008 alone, Abbott paid $2.2 billion in dividends to Abbott shareholders.
1-, 3- and 5-Year total return(as of December 31, 2008)
38.4%
-5.5%-3.6%-10.5%
ABT S&P500
hlTh
S&P500
DJIA
45.8%
-11.8%-10.9%
-23.0%
ABT S&P500
hlTh
S&P500
DJIA
-2.5%
-31.9%
-22.8%
-37.0%
ABT S&P500
hlTh
S&P500
DJIA
Abbott’s total return, which accounts for stock price appreciation and dividends, has outperformed the Dow Jones Industrial Average, as well as the S&P 500 and S&P 500 Health Care indices over the last 1-, 3- and 5-year periods.
3 Years1 Year 5 Years

Abbott 2008 Annual Report
12
There is a growing demand and an urgent priority to find and develop new answers to difficult
health care challenges.
Cancer, heart disease, diabetes, autoimmune disorders, hepatitis,
Alzheimer’s disease — these are among the most serious
threats to a long and healthy life and the key focus areas
of Abbott science.
The following represent select updates from our diverse research
and development pipeline.
Science
Abbott 2008 Annual Report
12
•Onehalfofthepeoplewhoreach85yearsofagewilldevelopAlzheimer’sdisease.
•Oneinthreewomenandhalfofall menwillbediagnosedwithcancer.
•Threepercentoftheworld’spopulation isinfectedwithhepatitisC.
13
Abbott 2008 Annual Report
Abbott science
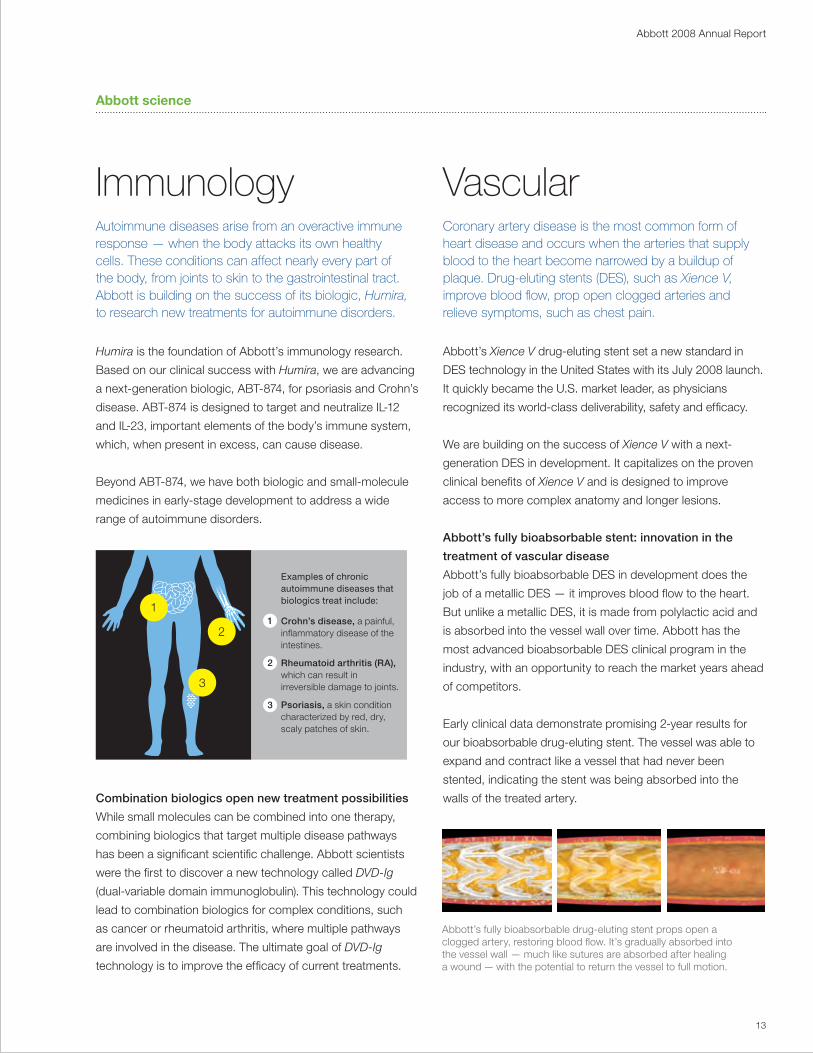
Immunology VascularAutoimmune diseases arise from an overactive immune response — when the body attacks its own healthy cells. These conditions can affect nearly every part of the body, from joints to skin to the gastrointestinal tract. Abbott is building on the success of its biologic, Humira, to research new treatments for autoimmune disorders.
Coronary artery disease is the most common form of heart disease and occurs when the arteries that supply blood to the heart become narrowed by a buildup of plaque. Drug-eluting stents (DES), such as Xience V, improve blood flow, prop open clogged arteries and relieve symptoms, such as chest pain.
Abbott’s Xience V drug-eluting stent set a new standard in
DES technology in the United States with its July 2008 launch.
It quickly became the U.S. market leader, as physicians
recognized its world-class deliverability, safety and efficacy.
We are building on the success of Xience V with a next-
generation DES in development. It capitalizes on the proven
clinical benefits of Xience V and is designed to improve
access to more complex anatomy and longer lesions.
Abbott’s fully bioabsorbable stent: innovation in the
treatment of vascular disease
Abbott’s fully bioabsorbable DES in development does the
job of a metallic DES — it improves blood flow to the heart.
But unlike a metallic DES, it is made from polylactic acid and
is absorbed into the vessel wall over time. Abbott has the
most advanced bioabsorbable DES clinical program in the
industry, with an opportunity to reach the market years ahead
of competitors.
Early clinical data demonstrate promising 2-year results for
our bioabsorbable drug-eluting stent. The vessel was able to
expand and contract like a vessel that had never been
stented, indicating the stent was being absorbed into the
walls of the treated artery.
Humira is the foundation of Abbott’s immunology research.
Based on our clinical success with Humira, we are advancing
a next-generation biologic, ABT-874, for psoriasis and Crohn’s
disease. ABT-874 is designed to target and neutralize IL-12
and IL-23, important elements of the body’s immune system,
which, when present in excess, can cause disease.
Beyond ABT-874, we have both biologic and small-molecule
medicines in early-stage development to address a wide
range of autoimmune disorders.
combination biologics open new treatment possibilities
While small molecules can be combined into one therapy,
combining biologics that target multiple disease pathways
has been a significant scientific challenge. Abbott scientists
were the first to discover a new technology called DVD-Ig
(dual-variable domain immunoglobulin). This technology could
lead to combination biologics for complex conditions, such
as cancer or rheumatoid arthritis, where multiple pathways
are involved in the disease. The ultimate goal of DVD-Ig
technology is to improve the efficacy of current treatments.
Abbott’s fully bioabsorbable drug-eluting stent props open a clogged artery, restoring blood flow. It’s gradually absorbed into the vessel wall — much like sutures are absorbed after healing a wound — with the potential to return the vessel to full motion.
1
2
3
1
2
3
examples of chronic autoimmune diseases that biologics treat include:
crohn’s disease, a painful, inflammatory disease of the intestines.
Rheumatoid arthritis (RA), which can result in irreversible damage to joints.
Psoriasis, a skin condition characterized by red, dry, scaly patches of skin.
Abbott 2008 Annual Report
14
Abbott science
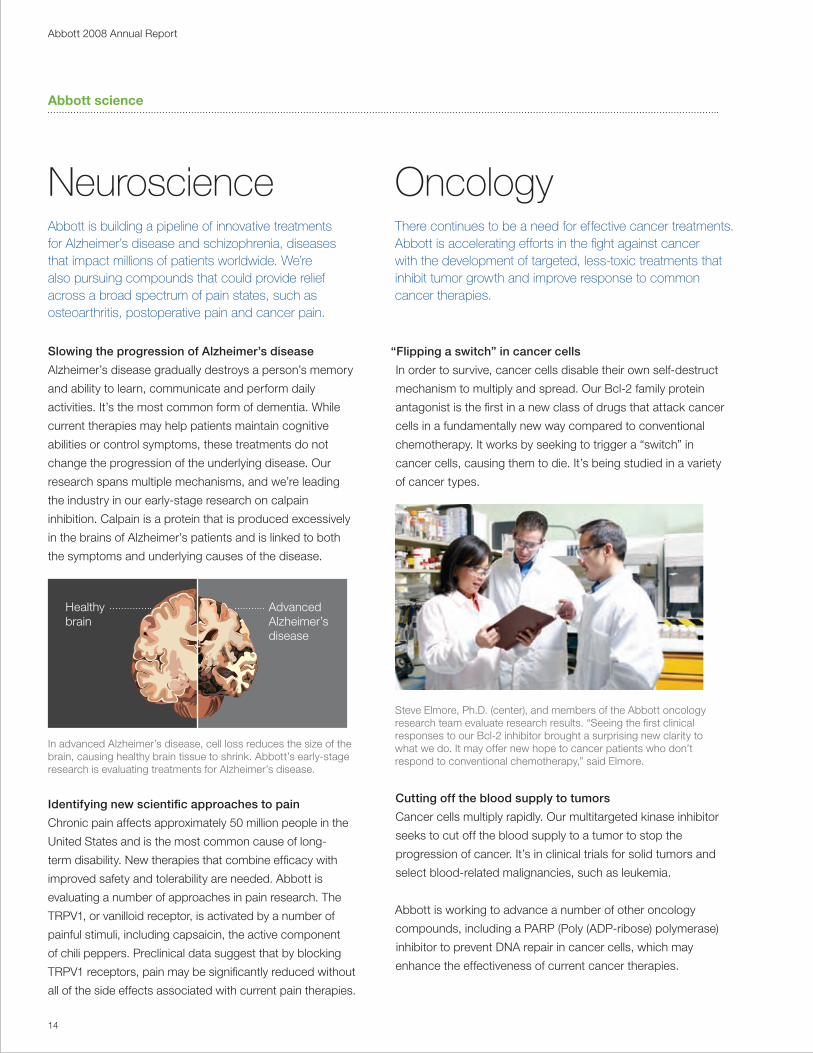
Neuroscience OncologyAbbott is building a pipeline of innovative treatments for Alzheimer’s disease and schizophrenia, diseases that impact millions of patients worldwide. We’re also pursuing compounds that could provide relief across a broad spectrum of pain states, such as osteoarthritis, postoperative pain and cancer pain.
There continues to be a need for effective cancer treatments. Abbott is accelerating efforts in the fight against cancer with the development of targeted, less-toxic treatments that inhibit tumor growth and improve response to common cancer therapies.
Slowing the progression of Alzheimer’s disease
Alzheimer’s disease gradually destroys a person’s memory
and ability to learn, communicate and perform daily
activities. It’s the most common form of dementia. While
current therapies may help patients maintain cognitive
abilities or control symptoms, these treatments do not
change the progression of the underlying disease. Our
research spans multiple mechanisms, and we’re leading
the industry in our early-stage research on calpain
inhibition. Calpain is a protein that is produced excessively
in the brains of Alzheimer’s patients and is linked to both
the symptoms and underlying causes of the disease.
Identifying new scientific approaches to pain
Chronic pain affects approximately 50 million people in the
United States and is the most common cause of long-
term disability. New therapies that combine efficacy with
improved safety and tolerability are needed. Abbott is
evaluating a number of approaches in pain research. The
TRPV1, or vanilloid receptor, is activated by a number of
painful stimuli, including capsaicin, the active component
of chili peppers. Preclinical data suggest that by blocking
TRPV1 receptors, pain may be significantly reduced without
all of the side effects associated with current pain therapies.
“Flipping a switch” in cancer cells
In order to survive, cancer cells disable their own self-destruct
mechanism to multiply and spread. Our Bcl-2 family protein
antagonist is the first in a new class of drugs that attack cancer
cells in a fundamentally new way compared to conventional
chemotherapy. It works by seeking to trigger a “switch” in
cancer cells, causing them to die. It’s being studied in a variety
of cancer types.
cutting off the blood supply to tumors
Cancer cells multiply rapidly. Our multitargeted kinase inhibitor
seeks to cut off the blood supply to a tumor to stop the
progression of cancer. It’s in clinical trials for solid tumors and
select blood-related malignancies, such as leukemia.
Abbott is working to advance a number of other oncology
compounds, including a PARP (Poly (ADP-ribose) polymerase)
inhibitor to prevent DNA repair in cancer cells, which may
enhance the effectiveness of current cancer therapies.
Steve Elmore, Ph.D. (center), and members of the Abbott oncology research team evaluate research results. “Seeing the first clinical responses to our Bcl-2 inhibitor brought a surprising new clarity to what we do. It may offer new hope to cancer patients who don’t respond to conventional chemotherapy,” said Elmore.
AdvancedAlzheimer’sdisease
Healthybrain
In advanced Alzheimer’s disease, cell loss reduces the size of the brain, causing healthy brain tissue to shrink. Abbott’s early-stage research is evaluating treatments for Alzheimer’s disease.
15
Abbott 2008 Annual Report
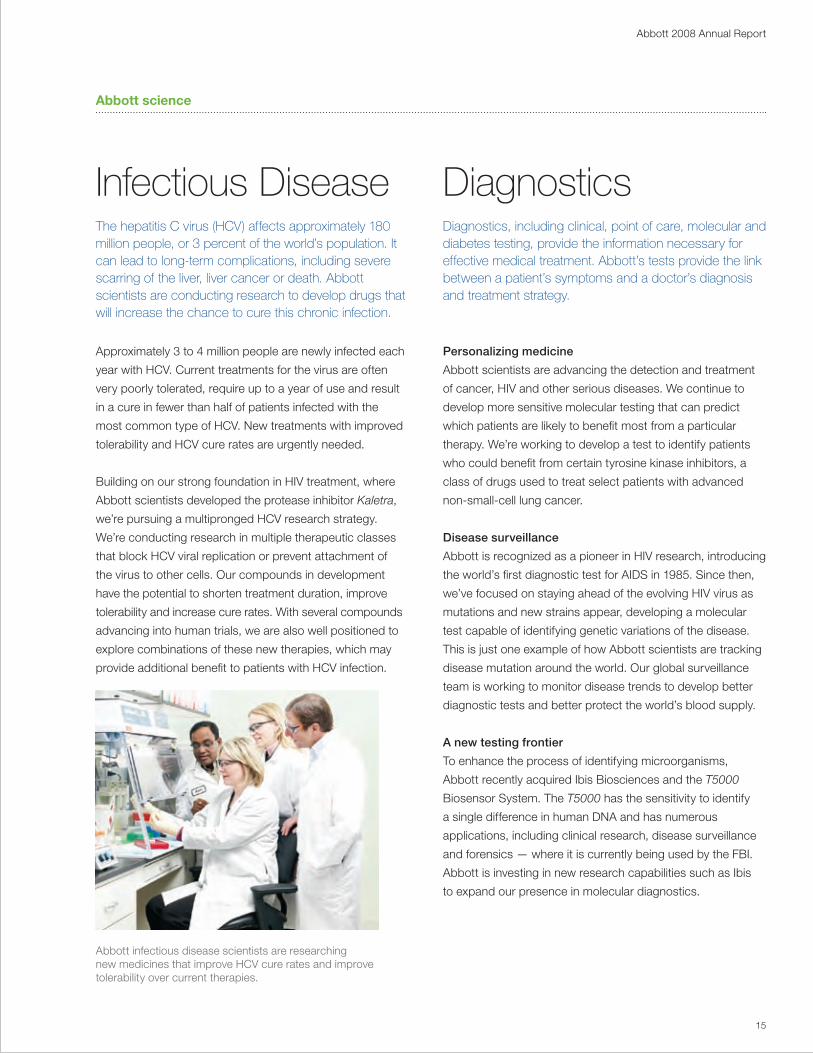
Approximately 3 to 4 million people are newly infected each
year with HCV. Current treatments for the virus are often
very poorly tolerated, require up to a year of use and result
in a cure in fewer than half of patients infected with the
most common type of HCV. New treatments with improved
tolerability and HCV cure rates are urgently needed.
Building on our strong foundation in HIV treatment, where
Abbott scientists developed the protease inhibitor Kaletra,
we’re pursuing a multipronged HCV research strategy.
We’re conducting research in multiple therapeutic classes
that block HCV viral replication or prevent attachment of
the virus to other cells. Our compounds in development
have the potential to shorten treatment duration, improve
tolerability and increase cure rates. With several compounds
advancing into human trials, we are also well positioned to
explore combinations of these new therapies, which may
provide additional benefit to patients with HCV infection.
Abbott science
Infectious Disease DiagnosticsThe hepatitis C virus (HCV) affects approximately 180 million people, or 3 percent of the world’s population. It can lead to long-term complications, including severe scarring of the liver, liver cancer or death. Abbott scientists are conducting research to develop drugs that will increase the chance to cure this chronic infection.
Diagnostics, including clinical, point of care, molecular and diabetes testing, provide the information necessary for effective medical treatment. Abbott’s tests provide the link between a patient’s symptoms and a doctor’s diagnosis and treatment strategy.
Personalizing medicine
Abbott scientists are advancing the detection and treatment
of cancer, HIV and other serious diseases. We continue to
develop more sensitive molecular testing that can predict
which patients are likely to benefit most from a particular
therapy. We’re working to develop a test to identify patients
who could benefit from certain tyrosine kinase inhibitors, a
class of drugs used to treat select patients with advanced
non-small-cell lung cancer.
Disease surveillance
Abbott is recognized as a pioneer in HIV research, introducing
the world’s first diagnostic test for AIDS in 1985. Since then,
we’ve focused on staying ahead of the evolving HIV virus as
mutations and new strains appear, developing a molecular
test capable of identifying genetic variations of the disease.
This is just one example of how Abbott scientists are tracking
disease mutation around the world. Our global surveillance
team is working to monitor disease trends to develop better
diagnostic tests and better protect the world’s blood supply.
A new testing frontier
To enhance the process of identifying microorganisms,
Abbott recently acquired Ibis Biosciences and the T5000
Biosensor System. The T5000 has the sensitivity to identify
a single difference in human DNA and has numerous
applications, including clinical research, disease surveillance
and forensics — where it is currently being used by the FBI.
Abbott is investing in new research capabilities such as Ibis
to expand our presence in molecular diagnostics.
Abbott infectious disease scientists are researching new medicines that improve HCV cure rates and improve tolerability over current therapies.

Abbott 2008 Annual Report
16
Abbott 2008 Annual Report
2008 was a year in which Abbott delivered
strong performance and maintained
leadership positions across its businesses, with a number of new product milestones.
New ProductMilestones
HumiraIntroduced two new Humira indications: moderate to severe chronic plaque psoriasis and polyarticular juvenile idiopathic arthritis. We also launched Humira for rheumatoid arthritis in Japan. Humira has helped hundreds of thousands of patients worldwide.
Launched Similac Advance EarlyShield, the only infant formula that has a unique blend of prebiotics, nucleotides and antioxidants to support a baby’s natural immune system.
Similac AdvanceEarlyShield
16
17
Abbott 2008 Annual ReportAbbott 2008 Annual Report
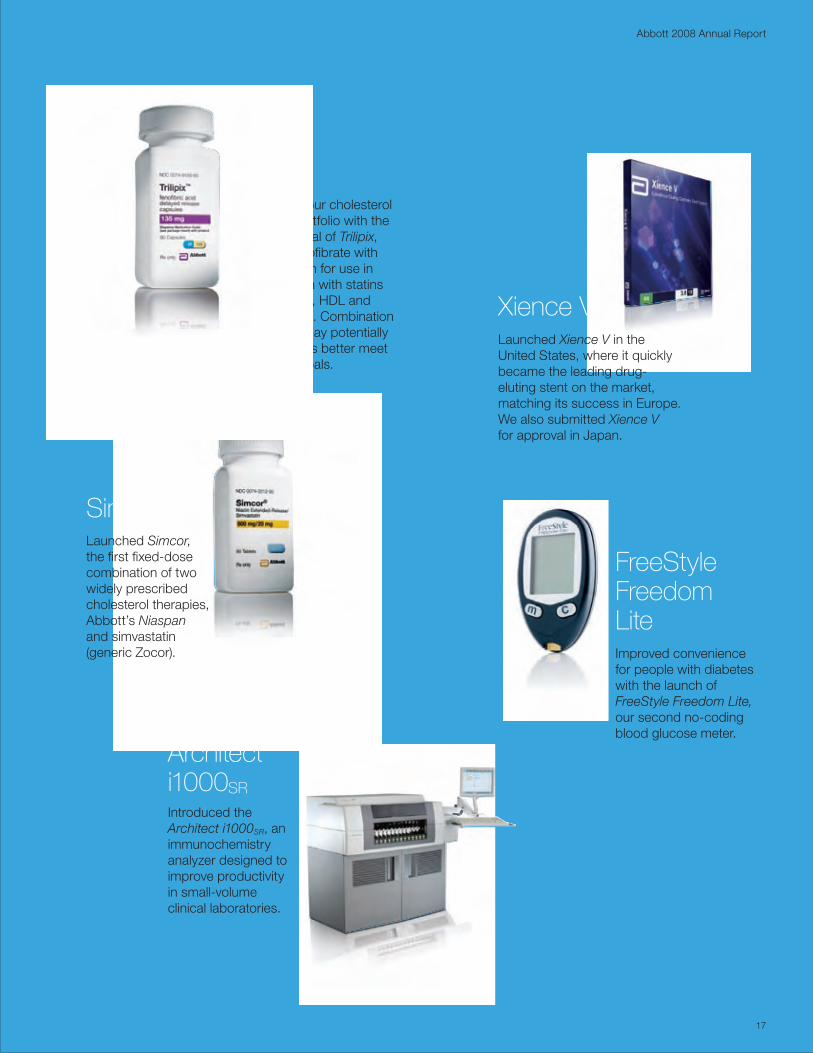
FreeStyleFreedom Lite
Expanded our cholesterol product portfolio with the FDA approval of Trilipix, the first fenofibrate with an indication for use in combination with statins to treat LDL, HDL and triglycerides. Combination treatment may potentially help patients better meet their lipid goals.
Trilipix
Simcor Launched Simcor, the first fixed-dose combination of two widely prescribed cholesterol therapies, Abbott’s Niaspan and simvastatin (generic Zocor).
17
Improved convenience for people with diabetes with the launch of FreeStyle Freedom Lite, our second no-coding blood glucose meter.
Introduced the Architect i1000SR, an immunochemistry analyzer designed to improve productivity in small-volume clinical laboratories.
Architect i1000SR
Xience VLaunched Xience V in the United States, where it quickly became the leading drug-eluting stent on the market, matching its success in Europe. We also submitted Xience V for approval in Japan.

Abbott 2008 Annual Report
18

19
Abbott 2008 Annual Report
K E y F R A N C H I S E S
19
Abbott medicines are used to treat some of the world’s most serious and prevalent diseases, including rheumatoid arthritis, psoriasis, Crohn’s
disease, lipid disorders, kidney disease and HIV. We also continue to pursue new therapeutic indications for existing medications that offer
patients and physicians important treatment options.
Pharmaceuticals
Cardiovascular Immunology Metabolics Renal CareVirology
HumiraPreben LundquistCopenhagen, Denmark
Living with chronic plaque psoriasis, Preben Lundquist has had many outbreaks of psoriasis, affecting areas of his skin with very dry, scaly irritating patches. Preben tried a number of treatments before his doctor recommended Humira therapy. His psoriasis symptoms have improved significantly after taking Humira.
Abbott 2008 Annual Report
20
In 2008, we achieved several important milestones in our
pharmaceuticals business. We successfully launched our
Humira biologic for the treatment of moderate to severe
chronic plaque psoriasis, building on its strong performance
in Crohn’s disease and rheumatoid arthritis (RA). Humira
is now approved in 77 countries and currently treats
approximately 340,000 patients worldwide.
We also enhanced our growing lipid franchise with two new
therapies, Trilipix and Simcor, and continued development of
our fixed-dose combination of Trilipix and AstraZeneca’s statin
therapy, Crestor.
Immunology: continued expansion of Humira
Humira is Abbott’s biologic for the treatment of RA, chronic
plaque psoriasis, Crohn’s disease, psoriatic arthritis,
ankylosing spondylitis and polyarticular juvenile idiopathic
arthritis (JIA) — autoimmune disorders in which a human
protein, tumor necrosis factor (TNF), plays a role in disease
activity. Humira is a fully human recombinant monoclonal
antibody that blocks the body’s production of TNF, reducing
the inflammation and some of the complications associated
with these diseases.
In 2008, we launched Humira for the treatment of two new
diseases — chronic plaque psoriasis and JIA. Psoriasis
symptoms are often painful and characterized by very dry,
scaly areas of skin. Psoriasis affects an estimated 125 million
people worldwide. The severity of the disease varies from
person to person, with approximately 25 percent of people
with psoriasis experiencing moderate to severe disease.
Humira is also used to treat RA and JIA, painful diseases that
can lead to damage of the joints and hinder a patient’s ability
to perform daily activities; Crohn’s disease, characterized by
inflammation in the gastrointestinal tract; psoriatic arthritis,
characterized by both arthritis and psoriatic skin disease; and
ankylosing spondylitis, an inflammation of the spine that can
result in episodes of acute pain and physical limitation.
In Japan, we launched Humira for RA and submitted a
regulatory application for chronic plaque psoriasis.
Humira is also in development for ulcerative colitis (inflammation
of the large intestine) and pediatric Crohn’s disease.
With approvals in multiple autoimmune diseases in a single,
well-established product, Humira should continue to be used
to treat hundreds of thousands of patients for years to come.
lipid management: building market leadership
Abbott’s lipid management product portfolio addresses
the three lipid parameters that contribute to cardiovascular
disease: high triglycerides, low HDL (good cholesterol) and
high LDL (bad cholesterol). Over the past several years,
we’ve taken a number of strategic steps to establish Abbott
as a significant player in the lipid market with a portfolio
uniquely positioned to address the growing need for add-on
or combination therapies.
Of the more than 100 million Americans with lipid disorders,
only an estimated 35 million are treated with lipid therapies.
Of those 35 million treated, fewer than one in three report that
they’ve reached their treatment goals. The majority of patients
are taking single therapies, primarily focused on reducing
LDL. Many patients may benefit from a combination treatment
approach to help manage all three of their lipid levels.
Pharmaceuticals - Year in Review
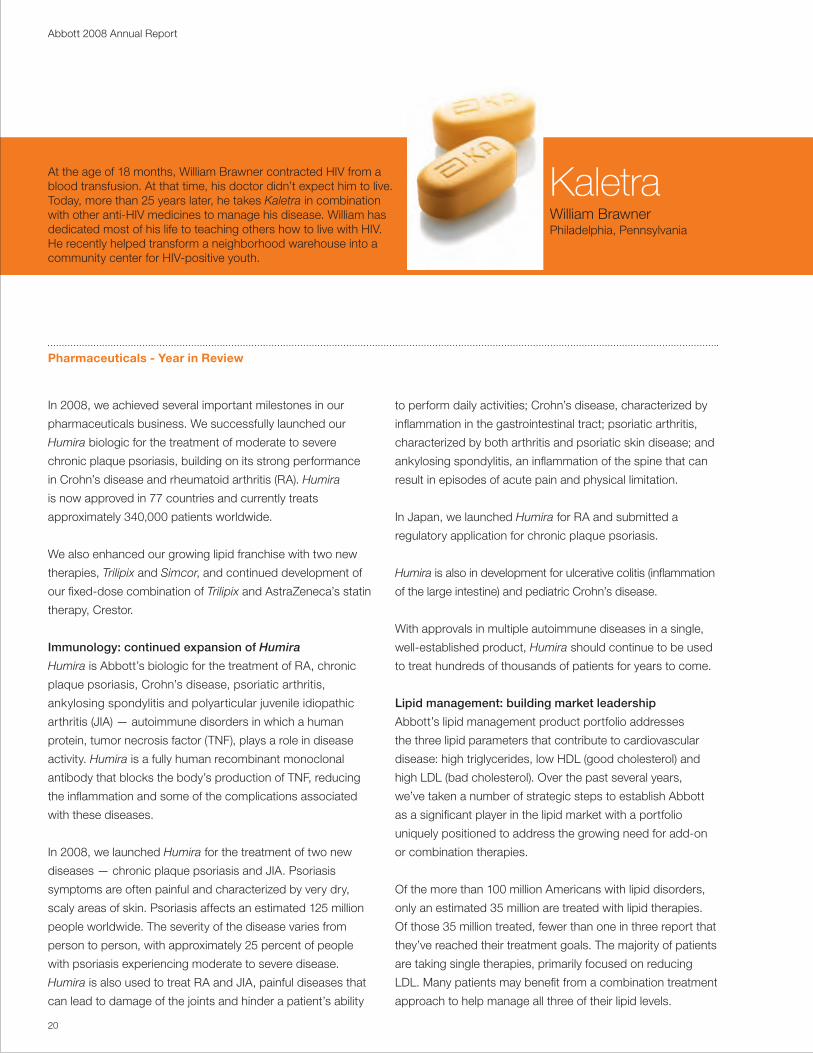
At the age of 18 months, William Brawner contracted HIV from a blood transfusion. At that time, his doctor didn’t expect him to live. Today, more than 25 years later, he takes Kaletra in combination with other anti-HIV medicines to manage his disease. William has dedicated most of his life to teaching others how to live with HIV. He recently helped transform a neighborhood warehouse into a community center for HIV-positive youth.
KaletraWilliam BrawnerPhiladelphia, Pennsylvania

21
Abbott 2008 Annual Report

Abbott 2008 Annual Report
22

23
Abbott 2008 Annual Report
In 2008, Abbott received U.S. Food and Drug Administration
(FDA) approval for Trilipix, a fenofibrate for the reduction
of triglycerides. It’s the first and only fenofibrate with an
FDA-approved indication for combination use with statins.
Supported by the largest clinical program of its kind, Trilipix
demonstrated safety and efficacy when used alone or in
combination with the three most commonly prescribed
statins — Crestor, Lipitor and Zocor. Studies showed that
Trilipix in combination with a statin was safe and effective,
improving HDL, LDL and triglyceride levels.
Also in 2008, we received U.S. FDA approval for Simcor, a
fixed-dose combination of Niaspan and simvastatin (generic
Zocor) that addresses both HDL and LDL. In a single pill,
Simcor combines the HDL-raising benefits of Niaspan with
the LDL-lowering effects of a statin.
In our cardiovascular pipeline, development continues on
a single-pill, fixed-dose combination therapy of Trilipix and
AstraZeneca’s Crestor, which targets all three blood lipids.
We plan to submit a new drug application to the FDA in 2009.
By 2010, Abbott’s growing cholesterol franchise has the
potential to include many patient therapies — TriCor, Trilipix
and a fixed-dose combination of Trilipix and Crestor, as well
as Niaspan and Simcor.
Virology: continued leadership in HIV
Kaletra, our protease inhibitor, remains a leader for the
treatment of HIV. Today, HIV is considered a chronic
disease. As a result, long-term viral suppression, tolerability
and convenience are important for patient success. Kaletra
has robust resistance data. This is important because
resistance — when the virus is no longer sensitive to a
drug — is a leading cause of HIV treatment failure. In 2008,
in Europe, Abbott launched a new, lower-strength Kaletra
tablet, the first and only coformulated protease inhibitor tablet
approved for use in children with HIV.
Also in 2008, Abbott submitted U.S. and European regulatory
applications for a new heat-stable tablet formulation of Norvir,
another leading protease inhibitor for treating HIV. This new
formulation does not require refrigeration, which is particularly
important in developing countries.
Abbott science: innovative therapies to advance
patient care
In addition to advancing a number of Humira indications
and cholesterol compounds in our late-stage pipeline,
we continued development work on several innovative
earlier-stage therapies in oncology, neuroscience and pain
management, immunology, infectious diseases and
asthma. Many of the compounds in our pharmaceutical
pipeline represent truly novel science and, if successful,
would result in significant advances in treatment for patients.
We continue early work on several Abbott-discovered
oncology compounds, with breakthrough research focused
on unique, less-toxic treatments. In neuroscience, we are
researching potential treatments for Alzheimer’s disease,
schizophrenia and pain. In immunology, our anti-IL-12/23
biologic, ABT-874, has demonstrated promising results in
psoriasis and is also being studied in Crohn’s disease. In
infectious diseases, we’re conducting early-stage research
to develop treatments for hepatitis C. We continue late-stage
development of Flutiform, an investigational combination
asthma treatment, with our partner SkyePharma.
Pharmaceuticals - Year in Review
Suzan Soule was recently diagnosed with high LDL (bad cholesterol) and low HDL (good cholesterol). To better manage her cholesterol, she improved her diet and added an exercise program, walking regularly near her Colorado home. Suzan also began treatment with Niaspan, Abbott’s leading therapy for raising HDL.
NiaspanSuzan SouleCastle Rock, Colorado

Abbott 2008 Annual Report
24

25
Abbott 2008 Annual Report
25
Abbott offers some of the world’s most trusted pediatric nutrition, adult nutrition, therapeutic nutrition, performance nutrition and
nutritious snack products, including Similac Advance EarlyShield, Gain Advance, PediaSure, Ensure, Glucerna and EAS brands. We also provide specially formulated medical nutrition products
for patients with unique dietary needs due to illness or injury.
Nutritional Products
K E y F R A N C H I S E S
SimilacSensitiveSamuel ShepardColumbus, Ohio
As a newborn, Samuel Shepard struggled with feeding time, and it was a challenge for his parents. He experienced common feeding issues that made him uncomfortable. Samuel’s pediatrician recommended Abbott’s Similac Sensitive infant formula, designed to ease fussiness and gas due to lactose sensitivity. It also provides a strong start for Samuel’s developing digestive system.
Pediatric Nutrition Adult Nutrition

Abbott 2008 Annual Report
26
In 2008, in the United States, Abbott introduced a number
of new products, including Similac Advance EarlyShield
infant formula, designed to be closer to breast milk. The
Similac Advance EarlyShield brand is available in a unique,
redesigned SimplePac container. We also expanded our sales
and marketing efforts for nutritional products in international
markets, such as Latin America and Asia.
u.S. nutrition: expanding our product portfolio
In the multi-billion-dollar U.S. nutrition market, we continue to
launch new and improved products to better meet the changing
needs of consumers and health care professionals. For
instance, Similac Advance EarlyShield sets a new standard in
infant nutrition and is closer than ever to breast milk. It’s the
only infant formula that has a unique blend of prebiotics,
nucleotides and antioxidants to support a baby’s natural
immune system. We introduced Similac Advance EarlyShield
in our new SimplePac package — redesigned with parent-
friendly features, such as a one-hand grip and a hinged lid with
a secure scoop, which make the product more convenient to
use. In the United States, we’ve upgraded our powdered Similac
product line to SimplePac packaging.
Abbott’s leading pediatric product portfolio also includes
Similac Sensitive for babies with formula-tolerance issues;
Similac Go & Grow, designed for older babies and toddlers;
and Similac Organic, the first certified organic infant formula
from a major-brand manufacturer. We also market PediaSure,
a complete, balanced nutritional formula for toddlers and
children, and Pedialyte, which helps children maintain
electrolytes and avoid dehydration.
Abbott is also dedicated to developing therapeutic nutrition
products for people with special dietary needs. For instance,
all of our Glucerna products are specially formulated for people
with diabetes and contain unique carbohydrate blends that are
designed to help manage blood glucose response. We also
market Juven therapeutic nutrition drink mix to help patients
build lean body mass and support wound healing.
As a leader in the adult nutrition and nutritious snacks
segment, we market a number of products designed for active
adults seeking convenient, balanced nutrition. Our Ensure,
ZonePerfect, EAS Myoplex and EAS brands all offer a variety
of snack and meal options. In our ZonePerfect product line, we
recently introduced new dark chocolate flavors.
International nutrition: growth in emerging markets
Increasing personal incomes and growing populations in
emerging markets, such as China, Southeast Asia and Latin
America, are driving demand for our nutritional products.
The fastest-growing segments are products for toddlers and
children. As a result, demand for Abbott’s pediatric nutritional
products — such as Similac Advance infant formula, Gain
Advance formula for older infants and PediaSure formula for
children — has increased significantly.
We have focused our business to address these developing
opportunities and continue to invest in new products that will
meet the needs of our growing customer base. In early
2009, we opened a state-of-the-art manufacturing facility in
Singapore that will help us meet growing global demand.
Abbott 2008 Annual Report
Nutritional Products - Year in Review
Crystal Gullion relies on Glucerna shakes and snack bars to better prevent blood sugar spikes and to more actively manage her diabetes. Abbott’s Glucerna products are specially formulated for people with diabetes.
GlucernaCrystal GullionLouisville, Kentucky

27
Abbott 2008 Annual Report

Abbott 2008 Annual Report
28
29
Abbott 2008 Annual Report
K E y F R A N C H I S E S
29
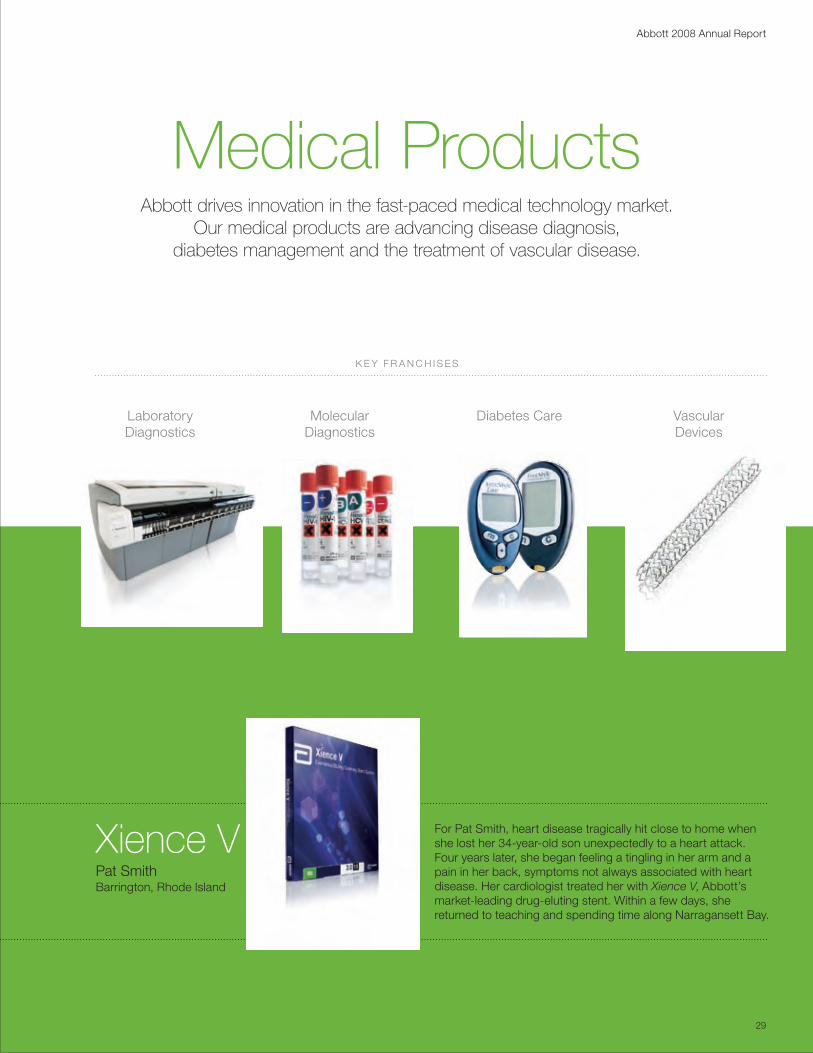
Abbott drives innovation in the fast-paced medical technology market. Our medical products are advancing disease diagnosis,
diabetes management and the treatment of vascular disease.
Medical Products
LaboratoryDiagnostics
MolecularDiagnostics
Diabetes Care VascularDevices
For Pat Smith, heart disease tragically hit close to home when she lost her 34-year-old son unexpectedly to a heart attack. Four years later, she began feeling a tingling in her arm and a pain in her back, symptoms not always associated with heart disease. Her cardiologist treated her with Xience V, Abbott’s market-leading drug-eluting stent. Within a few days, she returned to teaching and spending time along Narragansett Bay.
Xience VPat SmithBarrington, Rhode Island

Abbott 2008 Annual Report
30
Medical Products - Year in Review
In 2008, our medical products business introduced new
products and advanced a promising pipeline in high-growth,
technology-driven markets. Most notably, we launched
our market-leading Xience V drug-eluting stent (DES) in the
United States and introduced our second no-coding glucose
meter, FreeStyle Freedom Lite.
Vascular Devices: breadth, depth and leadership
With three distinct vascular segments — coronary,
endovascular and vessel closure — and an industry-leading
pipeline, Abbott has established itself as a leader in vascular
care. In 2008, we received FDA approval for Xience V in
the United States for the treatment of coronary artery disease.
Xience V is the only drug-eluting stent to demonstrate
superiority in reducing vessel renarrowing over another
drug-eluting stent in two randomized, pivotal clinical trials.
Xience V quickly became the U.S. market leader, as
physicians embraced its safety, world-class deliverability
and efficacy. Xience V is the number one DES in Europe.
In 2008, we submitted Xience V for approval in Japan.
Coronary artery disease is the most common type of
heart disease. It occurs when arteries that supply blood
to the heart narrow or become blocked by a buildup of
plaque — cholesterol or other fatty deposits that accumulate
on the inner wall of the artery. Drug-eluting stents are tiny
metal scaffolds placed in diseased arteries to keep them
open and reestablish blood flow — a treatment alternative
to open-heart surgery. Xience V features Abbott’s
market-leading Multi-Link Vision coronary stent platform
and everolimus, a drug that reduces tissue growth.
Beyond Xience V, Abbott is developing a next-generation
DES to further improve deliverability, especially in more
complex anatomy and longer lesion lengths. We also have
a fully bioabsorbable DES in early-stage development.
It’s made of polylactic acid, which is absorbed by the body.
It functions much like a metallic stent, but absorbs over
time into the walls of treated arteries. Abbott’s bioabsorbable
DES program is the most advanced in the industry.
Abbott’s endovascular business offers a portfolio of carotid
stents, embolic protection devices, balloons, guide wires
and vessel closure devices. Carotid stenting is a less-invasive
alternative to surgery for patients at risk of stroke from a
partially blocked carotid artery, the major blood vessel in the
neck that supplies blood to the brain. Our Xact and RX
Acculink stents are the most widely used devices to treat
diseased carotid arteries in the United States.
As a pioneer in closure technologies, Abbott offers products
designed to facilitate secure closure of the vascular access
site following catheterizations. In 2008, we launched
the next generation of our novel clip-based technology,
the StarClose SE, which enables the operator to close the
femoral artery securely in a matter of seconds.
Diabetes care: improving disease management
Globally, more than 170 million people have diabetes, and
the prevalence is expected to increase at an alarming rate
over the next 10 years. Diabetes is a leading cause of kidney
failure, blindness and amputations, and a major cause of
heart disease and stroke. People with diabetes can take steps
to control the disease and lower the risk of complications
through careful management.
First-grader Blake Nordmeyer loves all kinds of sports. Last year, he was diagnosed with type 1 diabetes, which hasn’t prevented him from taking on new challenges, such as snowboarding. Every day, he uses the FreeStyle Lite blood glucose monitoring system to help manage his diabetes. This small, discreet meter is perfect for Blake and other people living with diabetes.
FreeStyleLiteBlake NordmeyerSaylorsburg, Pennsylvania

31
Abbott 2008 Annual Report

Abbott 2008 Annual Report
32
33
Abbott 2008 Annual Report
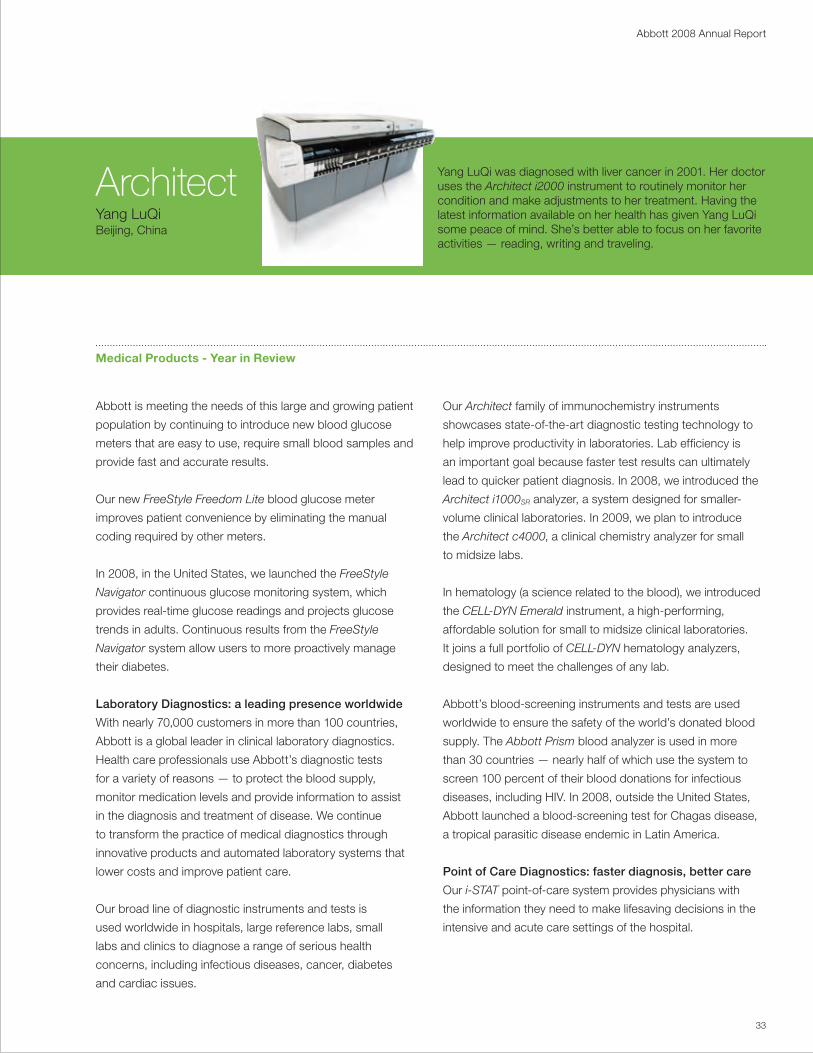
yang LuQi was diagnosed with liver cancer in 2001. Her doctor uses the Architect i2000 instrument to routinely monitor her condition and make adjustments to her treatment. Having the latest information available on her health has given yang LuQi some peace of mind. She’s better able to focus on her favorite activities — reading, writing and traveling.
Abbott is meeting the needs of this large and growing patient
population by continuing to introduce new blood glucose
meters that are easy to use, require small blood samples and
provide fast and accurate results.
Our new FreeStyle Freedom Lite blood glucose meter
improves patient convenience by eliminating the manual
coding required by other meters.
In 2008, in the United States, we launched the FreeStyle
Navigator continuous glucose monitoring system, which
provides real-time glucose readings and projects glucose
trends in adults. Continuous results from the FreeStyle
Navigator system allow users to more proactively manage
their diabetes.
laboratory Diagnostics: a leading presence worldwide
With nearly 70,000 customers in more than 100 countries,
Abbott is a global leader in clinical laboratory diagnostics.
Health care professionals use Abbott’s diagnostic tests
for a variety of reasons — to protect the blood supply,
monitor medication levels and provide information to assist
in the diagnosis and treatment of disease. We continue
to transform the practice of medical diagnostics through
innovative products and automated laboratory systems that
lower costs and improve patient care.
Our broad line of diagnostic instruments and tests is
used worldwide in hospitals, large reference labs, small
labs and clinics to diagnose a range of serious health
concerns, including infectious diseases, cancer, diabetes
and cardiac issues.
Our Architect family of immunochemistry instruments
showcases state-of-the-art diagnostic testing technology to
help improve productivity in laboratories. Lab efficiency is
an important goal because faster test results can ultimately
lead to quicker patient diagnosis. In 2008, we introduced the
Architect i1000SR analyzer, a system designed for smaller-
volume clinical laboratories. In 2009, we plan to introduce
the Architect c4000, a clinical chemistry analyzer for small
to midsize labs.
In hematology (a science related to the blood), we introduced
the CELL-DYN Emerald instrument, a high-performing,
affordable solution for small to midsize clinical laboratories.
It joins a full portfolio of CELL-DYN hematology analyzers,
designed to meet the challenges of any lab.
Abbott’s blood-screening instruments and tests are used
worldwide to ensure the safety of the world’s donated blood
supply. The Abbott Prism blood analyzer is used in more
than 30 countries — nearly half of which use the system to
screen 100 percent of their blood donations for infectious
diseases, including HIV. In 2008, outside the United States,
Abbott launched a blood-screening test for Chagas disease,
a tropical parasitic disease endemic in Latin America.
Point of care Diagnostics: faster diagnosis, better care
Our i-STAT point-of-care system provides physicians with
the information they need to make lifesaving decisions in the
intensive and acute care settings of the hospital.
Medical Products - Year in Review
Architectyang LuQiBeijing, China
Abbott 2008 Annual Report
34
Our broad point-of-care portfolio features tests for cardiac
diagnosis and routine diagnostic assessments, including
our i-STAT Chem8+ test, which combines eight tests from
the most commonly requested chemistry panel on a single
cartridge. The i-STAT system is now used in one out of every
three U.S. hospitals and in more than 500 emergency rooms.
molecular Diagnostics: advancing technology to
improve patient outcomes
Molecular diagnostics — the analysis of DNA and RNA at
the molecular level — is a fast-growing market, driven by
our growing understanding of the human genome. Our
tests provide physicians with critical information based on
abnormal genes. Their ability to provide highly accurate
detection of viruses and bacteria allows for earlier diagnosis,
selection of appropriate therapies and monitoring of
disease progression.
Abbott’s product portfolio includes the m2000, an
automated instrument for molecular testing based on
real-time PCR (polymerase chain reaction) technology.
We market the m2000 in the United States with tests for
HIV and chlamydia/gonorrhea. Internationally, the m2000
offers a complete menu of infectious disease assays,
including HPV (human papillomavirus), the most common
sexually transmitted disease.
We continue to actively explore opportunities in the area
of pharmacogenomics — the practice of identifying which
patients are likely to benefit the most from a specific treatment
option. For example, our PathVysion HER-2 assay is a DNA-
based test that identifies which patients are likely to benefit
from Herceptin, a targeted breast cancer therapy. We are
working to develop a similar test to identify patients likely to
benefit from certain tyrosine kinase inhibitors, a class of drugs
for select patients with advanced non-small-cell lung cancer.
In early 2009, Abbott acquired Ibis Biosciences, a subsidiary
of Isis Pharmaceuticals, to expand its molecular diagnostic
research capabilities and market opportunities. Traditional
diagnostic testing methods require the user to anticipate
possible outcomes when running a test. The Ibis T5000
Biosensor System does not require this step to detect and
characterize a broad array of pathogens. It is capable of
identifying virtually all bacteria, viruses and fungi. In addition,
the system can analyze human DNA during molecular testing.
The T5000 has numerous applications, including clinical
research, epidemiological surveillance and forensics, and
offers significant potential for human diagnostics.
Animal Health: leveraging our expertise
Abbott is advancing veterinary medicine and bringing value
to small-animal veterinarians and pet owners by leveraging
our strengths in human health. We market the AlphaTrak
blood glucose monitoring system for cats and dogs, which,
based on our FreeStyle blood glucose monitoring technology,
provides a fast, accurate response using only a minute blood
sample. Our surgical suite product line addresses veterinary
needs in anesthesia, fluid therapy and medical devices.
Medical Products - Year in Review
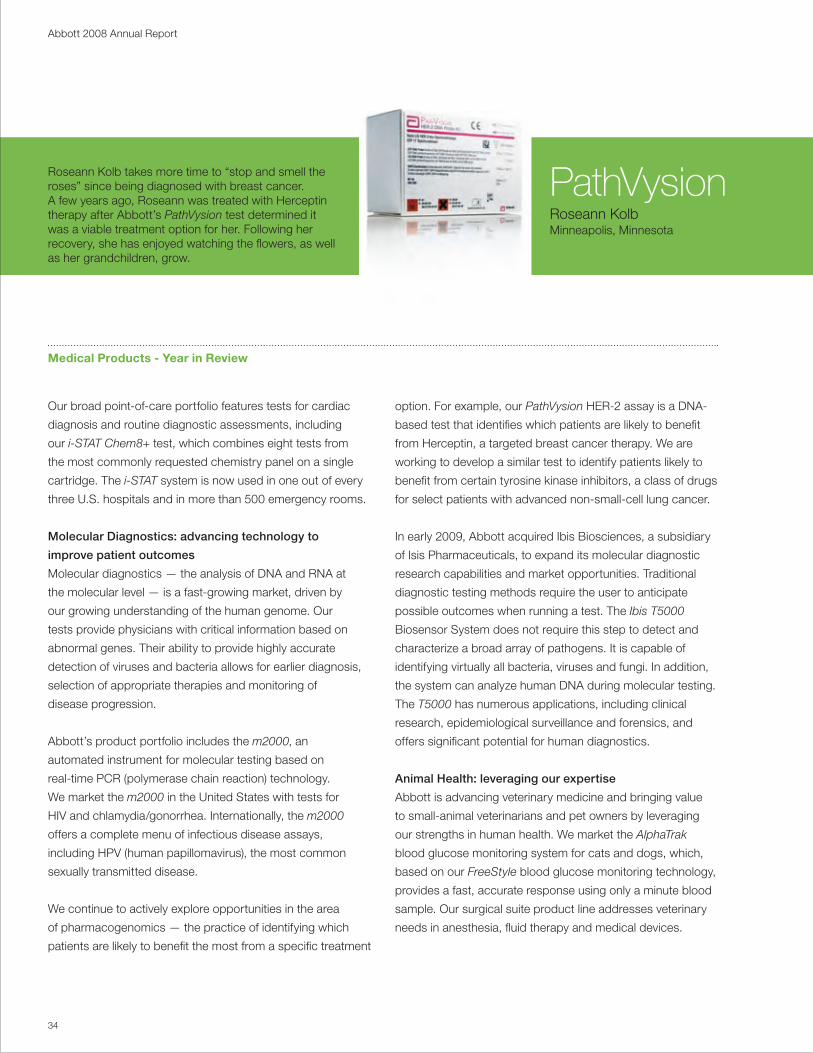
PathVysionRoseann KolbMinneapolis, Minnesota
Roseann Kolb takes more time to “stop and smell the roses” since being diagnosed with breast cancer. A few years ago, Roseann was treated with Herceptin therapy after Abbott’s PathVysion test determined it was a viable treatment option for her. Following her recovery, she has enjoyed watching the flowers, as well as her grandchildren, grow.

35
Abbott 2008 Annual Report

Abbott 2008 Annual Report
36
Global CitizenshipGood corporate citizenship is integral to Abbott’s mission as a global
health care company. We are committed to doing business in a responsible and sustainable way that brings wide-ranging benefits —
health, social, economic — to the communities where we live and work.
Citizenship influences all aspects of Abbott — how we advance
business objectives, engage stakeholders, implement policies,
apply social investment and philanthropy, and exercise influence
to make a productive contribution to society.
Each year, we continue to improve our corporate citizenship,
and 2008 marked the fourth straight year in which Abbott
was named to the Dow Jones Sustainability World and North
America indices. These indices are the leading benchmarks
of best-in-class economic and social performance of global
companies. The following is a brief summary of our ongoing
global citizenship efforts:
Innovating for the future
Abbott is using its expertise in science, technology and health
to address important areas where we can make a difference.
Our commitment to innovation is evident in Abbott’s research
and development activities, where we invested $2.7 billion
during 2008. Innovation is equally important in every other
aspect of our business — from devising better manufacturing
processes, to improving the effectiveness and reach of our
marketing and educational programs, to the distribution of our
products and the general conduct of our organization.
Improving access
Developing effective health care products is only part of our
goal. We must also work to ensure that those in need get
access to them. We are dedicated to improving access to our
medicines and our other health care products through Abbott’s
own programs and by partnering with others who can help.
In 2008, our contributions totaled more than $460 million,
and more than 155,000 patients were helped by assistance
programs offered or supported by Abbott. Through these
programs, Abbott provided products valued at more than
$255 million.
Protecting patients and consumers
We work diligently to ensure the quality of our products and the
health and safety of those who use and come into contact with
them. As part of this process, we not only work to protect the
patient, but also the health and safety of our employees and the
communities where we live and work.
Safeguarding the environment
Abbott is committed to helping address the global challenges
of climate change and water scarcity and to minimizing the
environmental impacts of our products, our manufacturing
and all other aspects of our business. In 2008, we achieved sig-
nificant improvement in the eco-efficiency of our manufacturing
sites. We reduced our greenhouse gas emissions by 3 percent
and our water usage by 4 percent from our 2007 levels.
For more details on our citizenship efforts, download the
report at www.abbott.com/citizenship.
Opposite Page: Since 2006, Abbott and the Abbott Fund have partnered with Direct Relief International to improve pediatric nutrition at the Angkor Hospital for Children in Cambodia. The program has assisted more than 250,000 children and trained more than 500 hospital and government health care workers in the fight against global malnutrition.

37
Abbott 2008 Annual Report
Abbott 2008 Annual Report
38
Abbott 2008 Annual Report
2008 Financial Report
38

39
Abbott 2008 Annual Report
40 Consolidated Statement of Earnings
41 Consolidated Statement of Cash Flows
42 Consolidated Balance Sheet
44 Consolidated Statement of Shareholders’ Investment
45 Notes to Consolidated Financial Statements
58 Management Report on Internal Control Over Financial Reporting
59 Reports of Independent Registered Public Accounting Firm
60 Financial Instruments and Risk Management
61 Financial Review
69 Performance Graph
70 Summary of Selected Financial Data
71 Directors and Corporate Officers
72 Shareholder and Corporate Information

40
Abbott 2008 Annual Report
Year Ended December 31 2008 2007 2006
Net Sales $29,527,552 $25,914,238 $22,476,322
Cost of products sold 12,612,022 11,422,046 9,815,147
Research and development 2,688,811 2,505,649 2,255,271
Acquired in-process and collaborations research and development 97,256 — 2,014,000
Selling, general and administrative 8,435,624 7,407,998 6,349,685
Total Operating Cost and Expenses 23,833,713 21,335,693 20,434,103
Operating Earnings 5,693,839 4,578,545 2,042,219
Interest expense 528,474 593,142 416,172
Interest (income) (201,229) (136,752) (123,825)
(Income) from TAP Pharmaceutical Products Inc. joint venture (118,997) (498,016) (475,811)
Net foreign exchange (gain) loss 84,244 14,997 28,441
Other (income) expense, net (454,939) 135,526 (79,128)
Earnings from Continuing Operations Before Taxes 5,856,286 4,469,648 2,276,370
Taxes on Earnings from Continuing Operations 1,122,070 863,334 559,615
Earnings from Continuing Operations 4,734,216 3,606,314 1,716,755
Gain on Sale of Discontinued Operations, net of taxes 146,503 — —
Net Earnings $ 4,880,719 $ 3,606,314 $ 1,716,755
Basic Earnings Per Common Share —
Continuing Operations $ 3.06 $ 2.34 $ 1.12
Gain on Sale of Discontinued Operations, net of taxes 0.10 — —
Net Earnings $ 3.16 $ 2.34 $ 1.12
Diluted Earnings Per Common Share —
Continuing Operations $ 3.03 $ 2.31 $ 1.12
Gain on Sale of Discontinued Operations, net of taxes 0.09 — —
Net Earnings $ 3.12 $ 2.31 $ 1.12
Average Number of Common Shares Outstanding
Used for Basic Earnings Per Common Share 1,545,355 1,543,082 1,529,848
Dilutive Common Stock Options and Awards 15,398 16,975 6,876
Average Number of Common Shares Outstanding
Plus Dilutive Common Stock Options and Awards 1,560,753 1,560,057 1,536,724
Outstanding Common Stock Options Having No Dilutive Effect 30,579 6,406 23,567
The accompanying notes to consolidated financial statements are an integral part of this statement.
Consolidated Statement of Earnings(dollars and shares in thousands except per share data)

41
Abbott 2008 Annual Report
Year Ended December 31 2008 2007 2006
Cash Flow From (Used in) Operating Activities of Continuing Operations:
Net earnings $ 4,880,719 $ 3,606,314 $ 1,716,755
Less: Gain on sale of discontinued operations 146,503 — —
Earnings from continuing operations 4,734,216 3,606,314 1,716,755
Adjustments to reconcile earnings from continuing operations
to net cash from operating activities of continuing operations —
Depreciation 1,051,728 1,072,855 983,485
Amortization of intangible assets 787,101 782,031 575,265
Share-based compensation 347,015 429,677 329,957
Gain on dissolution of TAP Pharmaceutical Products Inc. joint venture (94,248) — —
Acquired in-process research and development 97,256 — 1,927,300
Investing and financing (gains) losses, net 111,238 356,331 277,388
Trade receivables (948,314) (431,846) (101,781)
Inventories (257,476) 131,324 104,653
Prepaid expenses and other assets 436,218 (418,344) (283,455)
Trade accounts payable and other liabilities 569,056 (82,960) (183,203)
Income taxes 160,830 (261,539) (84,275)
Net Cash From Operating Activities of Continuing Operations 6,994,620 5,183,843 5,262,089
Cash Flow From (Used in) Investing Activities of Continuing Operations:
Contingent consideration paid relating to a business acquisition (250,000) — —
Acquisitions of businesses and technologies, net of cash acquired — — (7,923,163)
Acquisitions of property and equipment (1,287,724) (1,656,207) (1,337,818)
Sales of (investment in) Boston Scientific common stock;
and (investments in) note receivable and derivative financial instruments 318,645 568,437 (2,095,780)
Purchases of investment securities (923,937) (32,852) (33,632)
Proceeds from sales of investment securities 130,586 17,830 18,476
Other (75,061) (33,485) (25,712)
Net Cash (Used in) Investing Activities of Continuing Operations (2,087,491) (1,136,277) (11,397,629)
Cash Flow From (Used in) Financing Activities of Continuing Operations:
(Repayments of) net proceeds from issuance of short-term debt and other (324,739) (3,603,481) 5,183,225
Proceeds from issuance of long-term debt — 3,500,000 4,000,000
Repayments of long-term debt (913,948) (441,012) (3,532,408)
Purchases of common shares (1,081,806) (1,058,793) (754,502)
Proceeds from stock options exercised, including income tax benefit 1,008,843 1,249,804 502,782
Dividends paid (2,174,252) (1,959,150) (1,777,170)
Net Cash (Used in) From Financing Activities of Continuing Operations (3,485,902) (2,312,632) 3,621,927
Effect of exchange rate changes on cash and cash equivalents (115,160) 200,258 73,966
Net cash provided from the sale of discontinued operations in 2008 and from
operating activities of discontinued operations of Hospira, Inc. in 2006 349,571 — 67,152
Net Increase (Decrease) in Cash and Cash Equivalents 1,655,638 1,935,192 (2,372,495)
Cash and Cash Equivalents, Beginning of Year 2,456,384 521,192 2,893,687
Cash and Cash Equivalents, End of Year $ 4,112,022 $ 2,456,384 $ 521,192
The accompanying notes to consolidated financial statements are an integral part of this statement.
Consolidated Statement of Cash Flows(dollars in thousands)
42
Abbott 2008 Annual Report
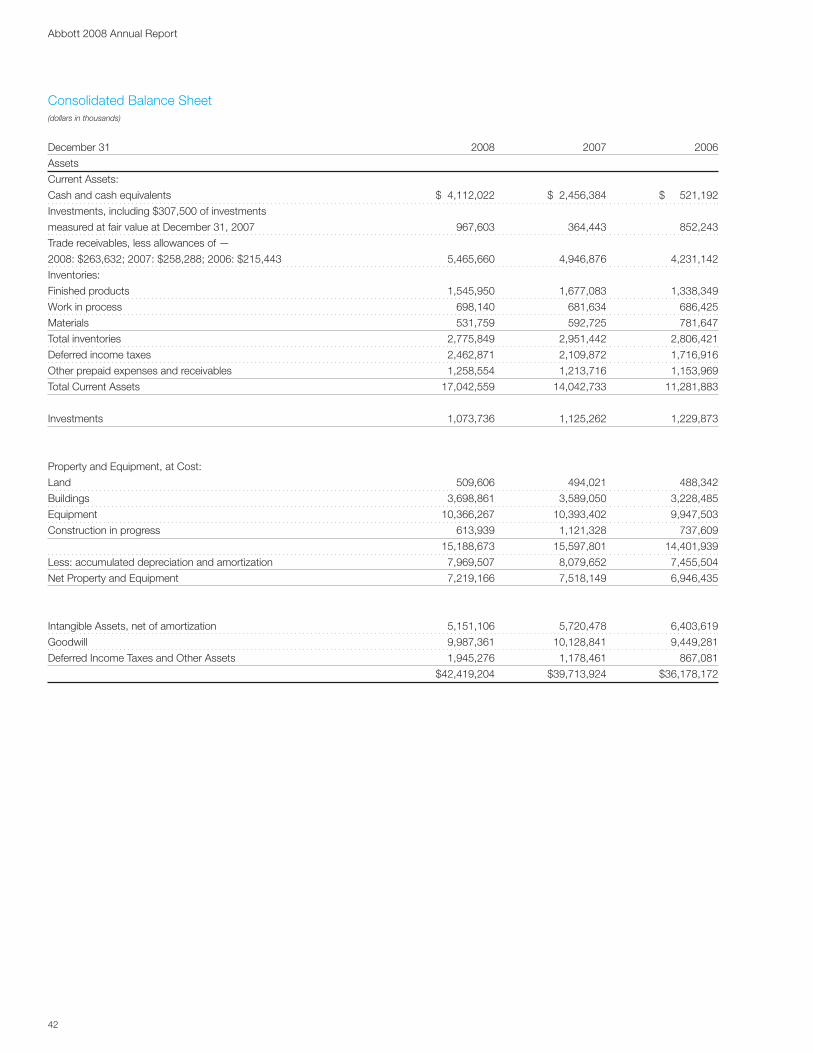
December 31 2008 2007 2006
Assets
Current Assets:
Cash and cash equivalents $ 4,112,022 $ 2,456,384 $ 521,192
Investments, including $307,500 of investments
measured at fair value at December 31, 2007 967,603 364,443 852,243
Trade receivables, less allowances of —
2008: $263,632; 2007: $258,288; 2006: $215,443 5,465,660 4,946,876 4,231,142
Inventories:
Finished products 1,545,950 1,677,083 1,338,349
Work in process 698,140 681,634 686,425
Materials 531,759 592,725 781,647
Total inventories 2,775,849 2,951,442 2,806,421
Deferred income taxes 2,462,871 2,109,872 1,716,916
Other prepaid expenses and receivables 1,258,554 1,213,716 1,153,969
Total Current Assets 17,042,559 14,042,733 11,281,883
Investments 1,073,736 1,125,262 1,229,873
Property and Equipment, at Cost:
Land 509,606 494,021 488,342
Buildings 3,698,861 3,589,050 3,228,485
Equipment 10,366,267 10,393,402 9,947,503
Construction in progress 613,939 1,121,328 737,609
15,188,673 15,597,801 14,401,939
Less: accumulated depreciation and amortization 7,969,507 8,079,652 7,455,504
Net Property and Equipment 7,219,166 7,518,149 6,946,435
Intangible Assets, net of amortization 5,151,106 5,720,478 6,403,619
Goodwill 9,987,361 10,128,841 9,449,281
Deferred Income Taxes and Other Assets 1,945,276 1,178,461 867,081
$42,419,204 $39,713,924 $36,178,172
Consolidated Balance Sheet(dollars in thousands)

43
Abbott 2008 Annual Report
Consolidated Balance Sheet(dollars in thousands)
December 31 2008 2007 2006
Liabilities and Shareholders’ Investment
Current Liabilities:
Short-term borrowings $ 1,691,069 $ 1,827,361 $ 5,305,985
Trade accounts payable 1,351,436 1,219,529 1,175,590
Salaries, wages and commissions 1,011,312 859,784 807,283
Other accrued liabilities 4,216,742 3,713,104 3,850,723
Dividends payable 559,064 504,540 453,994
Income taxes payable 805,397 80,406 262,344
Obligation in connection with conclusion of
TAP Pharmaceutical Products Inc. joint venture 915,982 — —
Current portion of long-term debt 1,040,906 898,554 95,276
Total Current Liabilities 11,591,908 9,103,278 11,951,195
Long-term Debt 8,713,327 9,487,789 7,009,664
Post-employment Obligations and Other Long-term Liabilities 4,634,418 3,344,317 3,163,127
Commitments and Contingencies
Shareholders’ Investment:
Preferred shares, one dollar par value
Authorized — 1,000,000 shares, none issued — — —
Common shares, without par value
Authorized — 2,400,000,000 shares
Issued at stated capital amount —
Shares: 2008: 1,601,580,899; 2007:
1,580,854,677; 2006: 1,550,590,438 7,444,411 6,104,102 4,290,929
Common shares held in treasury, at cost —
Shares: 2008: 49,147,968;
2007: 30,944,537; 2006: 13,347,272 (2,626,404) (1,213,134) (195,237)
Earnings employed in the business 13,825,383 10,805,809 9,568,728
Accumulated other comprehensive income (loss) (1,163,839) 2,081,763 389,766
Total Shareholders’ Investment 17,479,551 17,778,540 14,054,186
$42,419,204 $39,713,924 $36,178,172
The accompanying notes to consolidated financial statements are an integral part of this statement.
44
Abbott 2008 Annual Report
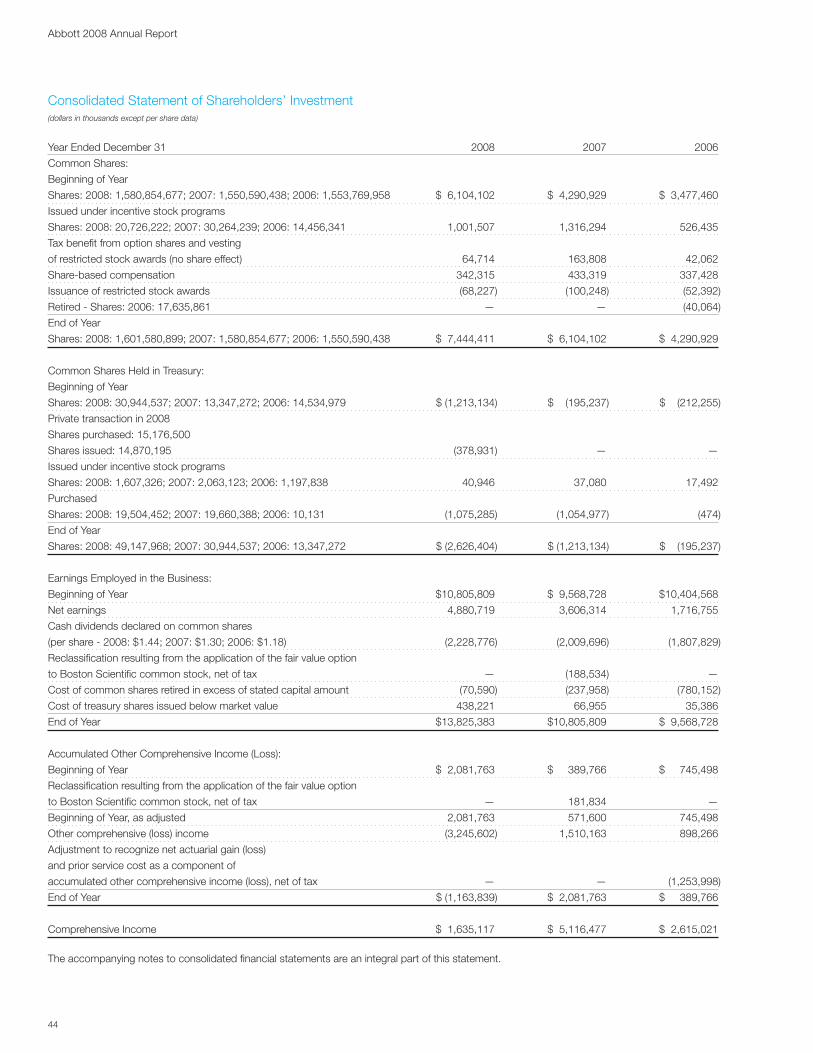
Year Ended December 31 2008 2007 2006
Common Shares:
Beginning of Year
Shares: 2008: 1,580,854,677; 2007: 1,550,590,438; 2006: 1,553,769,958 $ 6,104,102 $ 4,290,929 $ 3,477,460
Issued under incentive stock programs
Shares: 2008: 20,726,222; 2007: 30,264,239; 2006: 14,456,341 1,001,507 1,316,294 526,435
Tax benefit from option shares and vesting
of restricted stock awards (no share effect) 64,714 163,808 42,062
Share-based compensation 342,315 433,319 337,428
Issuance of restricted stock awards (68,227) (100,248) (52,392)
Retired - Shares: 2006: 17,635,861 — — (40,064)
End of Year
Shares: 2008: 1,601,580,899; 2007: 1,580,854,677; 2006: 1,550,590,438 $ 7,444,411 $ 6,104,102 $ 4,290,929
Common Shares Held in Treasury:
Beginning of Year
Shares: 2008: 30,944,537; 2007: 13,347,272; 2006: 14,534,979 $ (1,213,134) $ (195,237) $ (212,255)
Private transaction in 2008
Shares purchased: 15,176,500
Shares issued: 14,870,195 (378,931) — —
Issued under incentive stock programs
Shares: 2008: 1,607,326; 2007: 2,063,123; 2006: 1,197,838 40,946 37,080 17,492
Purchased
Shares: 2008: 19,504,452; 2007: 19,660,388; 2006: 10,131 (1,075,285) (1,054,977) (474)
End of Year
Shares: 2008: 49,147,968; 2007: 30,944,537; 2006: 13,347,272 $ (2,626,404) $ (1,213,134) $ (195,237)
Earnings Employed in the Business:
Beginning of Year $10,805,809 $ 9,568,728 $10,404,568
Net earnings 4,880,719 3,606,314 1,716,755
Cash dividends declared on common shares
(per share - 2008: $1.44; 2007: $1.30; 2006: $1.18) (2,228,776) (2,009,696) (1,807,829)
Reclassification resulting from the application of the fair value option
to Boston Scientific common stock, net of tax — (188,534) —
Cost of common shares retired in excess of stated capital amount (70,590) (237,958) (780,152)
Cost of treasury shares issued below market value 438,221 66,955 35,386
End of Year $13,825,383 $10,805,809 $ 9,568,728
Accumulated Other Comprehensive Income (Loss):
Beginning of Year $ 2,081,763 $ 389,766 $ 745,498
Reclassification resulting from the application of the fair value option
to Boston Scientific common stock, net of tax — 181,834 —
Beginning of Year, as adjusted 2,081,763 571,600 745,498
Other comprehensive (loss) income (3,245,602) 1,510,163 898,266
Adjustment to recognize net actuarial gain (loss)
and prior service cost as a component of
accumulated other comprehensive income (loss), net of tax — — (1,253,998)
End of Year $ (1,163,839) $ 2,081,763 $ 389,766
Comprehensive Income $ 1,635,117 $ 5,116,477 $ 2,615,021
The accompanying notes to consolidated financial statements are an integral part of this statement.
Consolidated Statement of Shareholders’ Investment(dollars in thousands except per share data)
45
Abbott 2008 Annual Report
Note 1 — Summary of Significant Accounting Policies
Nature of Business — Abbott’s principal business is the discovery, development, manufacture and sale of a broad line of health care products.
Concentration of Risk and Guarantees — Due to the nature of its operations, Abbott is not subject to significant concentration risks relating to customers, products or geographic locations, except that three U.S. wholesalers accounted for 27 percent, 25 percent and 23 percent of trade receivables as of December 31, 2008, 2007 and 2006, respectively. Product warranties are not significant.
Abbott has no material exposures to off-balance sheet arrangements; no special purpose entities; nor activities that include non-exchange-traded contracts accounted for at fair value. Abbott has periodically entered into agreements in the ordinary course of business, such as assignment of product rights, with other companies which has resulted in Abbott becoming secondarily liable for obligations that Abbott was previously primarily liable. Since Abbott no longer main-tains a business relationship with the other parties, Abbott is unable to develop an estimate of the maximum potential amount of future payments, if any, under these obligations. Based upon past experi-ence, the likelihood of payments under these agreements is remote. Abbott periodically acquires a business or product rights in which Abbott agrees to pay contingent consideration based on attaining certain thresholds or based on the occurrence of certain events. In connection with the spin-off of Hospira, Inc., Abbott has retained liabilities for taxes on income prior to the spin-off and certain potential liabilities, if any, related to alleged improper pricing practices in con-nection with federal, state and private reimbursement for certain drugs.
Basis of Consolidation — The consolidated financial statements include the accounts of the parent company and subsidiaries, after elimination of intercompany transactions. The accounts of foreign sub-sidiaries are consolidated as of November 30, due to the time needed to consolidate these subsidiaries. No events occurred related to these foreign subsidiaries in December 2008, 2007 and 2006 that materially affected the financial position, results of operations or cash flows.
Use Of Estimates — The financial statements have been prepared in accordance with generally accepted accounting principles in the United States and necessarily include amounts based on estimates and assumptions by management. Actual results could differ from those amounts. Significant estimates include amounts for sales rebates, income taxes, pension and other post-employment benefits, valuation of intangible assets, litigation, share-based compensation, derivative financial instruments, and inventory and accounts receivable exposures.
Revenue Recognition — Revenue from product sales is recognized upon passage of title and risk of loss to customers. Provisions for discounts, rebates and sales incentives to customers, and returns and other adjustments are provided for in the period the related sales are recorded. Sales incentives to customers are not material. Historical data is readily available and reliable, and is used for estimating the amount of the reduction in gross sales. Revenue from the launch of a new product, from an improved version of an existing product, or for shipments in excess of a customer’s normal require-ments are recorded when the conditions noted above are met. In those situations, management records a returns reserve for such
revenue, if necessary. Sales of product rights for marketable products are recorded as revenue upon disposition of the rights. Revenue from license of product rights, or for performance of research or selling activities, is recorded over the periods earned.
Income Taxes — On January 1, 2007, Abbott adopted the provisions of FASB Interpretation No. 48 “Accounting for Uncertainty in Income Taxes.” Under this Interpretation, in order to recognize an uncertain tax benefit, the taxpayer must be more likely than not of sustaining the position, and the measurement of the benefit is calculated as the largest amount that is more than 50 percent likely to be realized upon resolution of the benefit. Deferred income taxes are provided for the tax effect of differences between the tax bases of assets and liabilities and their reported amounts in the financial statements at the enacted statutory rate to be in effect when the taxes are paid. U.S. income taxes are provided on those earnings of foreign subsidiaries which are intended to be remitted to the parent company. Deferred income taxes are not provided on undistributed earnings reinvested indefinitely in foreign subsidiaries as working capital and plant and equipment. Interest and penalties on income tax obligations are included in taxes on income.
Pension and Post-Employment Benefits — Abbott accrues for the actuarially determined cost of pension and post-employment benefits over the service attribution periods of the employees. Abbott must develop long-term assumptions, the most significant of which are the health care cost trend rates, discount rates and the expected return on plan assets. Differences between the expected long-term return on plan assets and the actual return are amortized over a five-year period. Actuarial losses and gains are amortized over the remaining service attribution periods of the employees under the corridor method. On December 31, 2006, Abbott adopted the provisions of SFAS No. 158 “Employers’ Accounting for Defined Benefit Pension and Other Postretirement Plans.” This statement requires recognition of the deferrals on the balance sheet with a corresponding charge to Accumulated other comprehensive income (loss). Adoption of this statement on December 31, 2006 resulted in a decrease in Abbott’s shareholders’ equity of approximately $1.3 billion.
Fair Value Measurements — On January 1, 2007, Abbott adopted SFAS No. 157 “Fair Value Measurements.” Adoption of the provisions of this standard did not have a material effect on Abbott’s financial position. For assets and liabilities that are measured using quoted prices in active markets, total fair value is the published market price per unit multiplied by the number of units held without consideration of transaction costs. Assets and liabilities that are measured using signifi-cant other observable inputs are valued by reference to similar assets or liabilities, adjusted for contract restrictions and other terms specific to that asset or liability. For these items, a significant portion of fair value is derived by reference to quoted prices of similar assets or liabil-ities in active markets. For all remaining assets and liabilities, fair value is derived using a fair value model, such as a discounted cash flow model or Black-Scholes model. Purchased intangible assets are recorded at fair value. The fair value of significant purchased intangible assets is based on independent appraisals. Abbott uses a discounted cash flow model to value intangible assets. The discounted cash flow model requires assumptions about the timing and amount of future net cash flows, risk, the cost of capital, terminal values and market participants. Intangible assets and goodwill are reviewed for impair-ment at least on a quarterly and annual basis, respectively.
Notes to Consolidated Financial Statements
46
Abbott 2008 Annual Report
Share-Based Compensation — The value of stock options and restricted stock awards and units are amortized over their service period, which could be shorter than the vesting period if an employee is retirement eligible, with a charge to compensation expense.
Litigation — Abbott accounts for litigation losses in accordance with SFAS No. 5. Under SFAS No. 5, loss contingency provisions are recorded for probable losses at management’s best estimate of a loss, or when a best estimate cannot be made, a minimum loss contin-gency amount is recorded.
Cash, Cash Equivalents and Investments — Cash equivalents consist of time deposits and certificates of deposit with original maturities of three months or less. Except for Abbott’s investment in the common stock of Boston Scientific, investments in marketable equity securities are classified as available-for-sale and are recorded at fair value with any unrealized holding gains or losses, net of tax, included in Accumulated other comprehensive income (loss). Beginning on January 1, 2007, the investment in the common stock of Boston Scientific was accounted for as a trading security with changes in fair value recorded in income. Investments in equity securities that are not traded on public stock exchanges are recorded at cost. Investments in debt securities are classified as held-to-maturity, as management has both the intent and ability to hold these securities to maturity, and are reported at cost, net of any unamortized premium or discount. Income relating to these securities is reported as interest income.
Abbott reviews the carrying value of investments each quarter to determine whether an other than temporary decline in market value exists. Abbott considers factors affecting the investee, factors affecting the industry the investee operates in and general equity market trends. Abbott considers the length of time an investment’s market value has been below carrying value and the near-term prospects for recovery to carrying value. When Abbott determines that an other than temporary decline has occurred, the investment is written down with a charge to Other (income) expense, net.
Inventories — Inventories are stated at the lower of cost (first-in, first-out basis) or market. Cost includes material and conversion costs.
Property and Equipment — Depreciation and amortization are provided on a straight-line basis over the estimated useful lives of the assets. The following table shows estimated useful lives of property and equipment:
Classification Estimated Useful Lives
Buildings 10 to 50 years (average 27 years)
Equipment 3 to 20 years (average 11 years)
Product Liability — Abbott accrues for product liability claims, on an undiscounted basis, when it is probable that a liability has been incurred and the amount of the liability can be reasonably estimated based on existing information. The liabilities are adjusted quarterly as additional information becomes available. Receivables for insurance recoveries for product liability claims are recorded as assets, on an undiscounted basis, when it is probable that a recovery will be real-ized. Abbott carried third-party insurance coverage in amounts that reflect historical loss experience, which does not include coverage for sizable losses. Subsequent to 2008, product liability losses will be self-insured.
Research and Development Costs — Internal research and develop-ment costs are expensed as incurred. Clinical trial costs incurred by third parties are expensed as the contracted work is performed. Where contingent milestone payments are due to third parties under research and development arrangements, the milestone payment obligations are expensed when the milestone results are achieved.
Note 2 — Supplemental Financial Information
(dollars in millions)
Current Investments: 2008 2007 2006
Time deposits and certificates of deposit $ 968 $ 56 $ 77
Boston Scientific common stock — 308 775
Total $ 968 $ 364 $ 852
(dollars in millions)
Long-term Investments: 2008 2007 2006
Boston Scientific common stock $ — $ — $ 248
Other equity securities 147 229 130
Note receivable from Boston Scientific,
4% interest, due in 2011 865 851 837
Other 62 45 15
Total $1,074 $1,125 $1,230
In 2007, the Financial Accounting Standards Board issued Statement of Financial Accounting Standards No. 159 “The Fair Value Option for Financial Assets and Financial Liabilities.” SFAS No. 159 allows companies to measure specific financial assets and liabilities at fair value, such as debt or equity investments. The fair value option for the investment in Boston Scientific common stock was applied effective January 1, 2007. Abbott applied the fair value option to its investment in Boston Scientific stock under SFAS No. 159 because, unlike its other equity investments, the Boston Scientific stock is not a strategic investment and Abbott was required to dispose of the stock no later than October 2008. Abbott was subject to a limitation on the amount of shares it may sell in any one month through October 2007 and Abbott did not reacquire the Boston Scientific shares it sold. Accordingly, since at adoption, realized gains or losses were expected in the near future, the fair value option better represented the near-term expected earnings impact from sales of the stock. Under the fair value option, any cumulative unrealized gains or losses on an equity investment previously accounted for as an available-for-sale security is recorded as a cumulative effect adjustment to retained earnings as of the date of adoption of the standard. The pretax and after tax adjustment to Earnings employed in the business upon adoption was $297 million and $189 million, respectively, and the fair value and carrying amount of the investment before and after adoption was approximately $1.0 billion. The pretax and after tax adjustment to Accumulated other comprehensive income (loss) was $303 million and $182 million, respectively. The effect of the adoption on deferred income taxes was not significant.
As described in footnote 3, Abbott recorded a gain of approximately $94 million in connection with the dissolution of the TAP Pharmaceutical Products Inc. joint venture in 2008, which is included in Other (income) expense, net. Other (income) expense, net for 2008 also includes a gain of approximately $52 million on the sale of an equity investment accounted for as an available-for-sale investment. The remainder of
Notes to Consolidated Financial Statements
47
Abbott 2008 Annual Report
Other (income) expense, net for 2008 relates primarily to contractual payments based on specified development, approval and commercial events being achieved with respect to products retained by Takeda and payments from Takeda based on sales of products retained by Takeda. Other (income) expense, net for 2007 includes a $190 million fair market value loss adjustment to Abbott’s investment in Boston Scientific common stock and a realized gain of $37 million on the sales of Boston Scientific common stock. Other (income) expense, net for 2007 and 2006 includes fair value gain adjustments of $28 million and $91 million, respectively, to certain derivative financial instruments included with the investment in Boston Scientific common stock.
(dollars in millions)
Other Accrued Liabilities: 2008 2007 2006
Accrued rebates payable
to government agencies $ 577 $ 662 $ 661
Accrued other rebates (a) 455 444 391
All other 3,185 2,607 2,799
Total $4,217 $3,713 $3,851
(a) Accrued wholesaler chargeback rebates of $210, $157 and $123 at December 31, 2008,
2007 and 2006, respectively, are netted in trade receivables because Abbott’s customers
are invoiced at a higher catalog price but only remit to Abbott their contract price for
the products.
(dollars in millions)
Post-employment Obligations and
Other Long-term Liabilities: 2008 2007 2006
Defined benefit pension plans and
post-employment medical and
dental plans for significant plans $2,713 $1,872 $1,897
All other 1,921 1,472 1,266
Total $4,634 $3,344 $3,163
(dollars in millions)
Comprehensive Income, net of tax: 2008 2007 2006
Foreign currency (loss) gain
translation adjustments $(2,208) $1,153 $1,039
Net actuarial (losses) gains and
prior service cost and credits and
amortization of net actuarial losses
and prior service cost and credits,
net of taxes of $638 in 2008
and $(226) in 2007 (987) 343 —
Unrealized (losses) gains on
marketable equity securities,
net of taxes of $28 in 2008,
$(31) in 2007 and $119 in 2006 (49) 54 (178)
Net adjustments for derivative
instruments designated
as cash flow hedges (2) (40) 37
Other comprehensive (loss) income (3,246) 1,510 898
Net Earnings 4,881 3,606 1,717
Comprehensive Income $ 1,635 $5,116 $2,615
(dollars in millions)
Supplemental Accumulated Other
Comprehensive Income Information,
net of tax: 2008 2007 2006
Cumulative foreign currency
translation (gain) adjustments $ (740) $(2,948) $(1,795)
Net actuarial losses and
prior service cost and credits 1,901 914 1,257
Cumulative unrealized (gains) loss
on marketable equity securities (17) (66) 169
Cumulative losses (gain) on
derivative instruments designated
as cash flow hedges 20 18 (21)
On December 31, 2006, Abbott adopted the provisions of SFAS No. 158 “Employers’ Accounting for Defined Benefit Pension and Other Postretirement Plans.” Adoption of this statement resulted in a decrease in Abbott’s shareholders’ equity of $1.3 billion net of taxes of approximately $733 million.
(dollars in millions)
Supplemental Cash Flow Information: 2008 2007 2006
Income taxes paid $772 $952 $1,282
Interest paid 561 564 429
For the acquired Lupron business in 2008, as discussed in footnote 3, Abbott recorded intangible assets, primarily Lupron product rights, of approximately $700 million, goodwill of approximately $350 million and deferred tax liabilities related to the intangible assets of approximately $260 million. Abbott also recorded a liability of approximately $1.1 bil-lion relating to an agreement to remit cash to Takeda if certain research and development events are not achieved on the development assets retained by Takeda. Related deferred tax assets of approximately $410 million were also recorded, resulting in an after-tax liability of approximately $700 million. The sale of Abbott’s equity interest in TAP resulted in the recording of net assets related to the Lupron business, primarily cash, receivables, inventory and other assets, net of accounts payable and other accrued liabilities, offset by a credit to Abbott’s investment in TAP in the amount of approximately $280 million.
Note 3 — Conclusion of TAP Pharmaceutical Products Inc. Joint Venture and Sale of Abbott’s Spine Business
On April 30, 2008, Abbott and Takeda concluded their TAP Pharmaceutical Products Inc. (TAP) joint venture, evenly splitting the value and assets of the joint venture. Abbott exchanged its 50 percent equity interest in TAP for the assets, liabilities and employees related to TAP’s Lupron business. Subsequent to the conclusion of the joint venture, TAP was merged into two Takeda entities. The exchange of Abbott’s investment in TAP for TAP’s Lupron business resulted in a gain at closing of approximately $94 million. The Internal Revenue Service has issued a private letter ruling that the transaction qualifies as tax-free for U.S. income tax purposes.
Notes to Consolidated Financial Statements
48
Abbott 2008 Annual Report
Notes to Consolidated Financial Statements
Beginning on May 1, 2008, Abbott began recording U.S. Lupron net sales and costs in its operating results and no longer records income from the TAP joint venture. TAP’s sales of Lupron were $182 million for the four months ended April 30, 2008 and $645 million and $662 million in 2007 and 2006, respectively. Abbott also receives payments based on specified development, approval and commercial events being achieved with respect to products retained by Takeda and payments from Takeda based on sales of products retained by Takeda, which are recorded by Abbott as Other (income) expense, net as earned. Such payments, which are subject to tax, are expected to approximate $1.4 billion over the five-year period beginning on May 1, 2008.
The exchange transaction was accounted for as a sale of Abbott’s equity interest in TAP and as an acquisition of TAP’s Lupron business under SFAS No. 141 “Business Combinations.” The sale of Abbott’s equity interest in TAP resulted in the recording of net assets related to the Lupron business, primarily cash, receivables, inventory and other assets, net of accounts payable and other accrued liabilities, offset by a credit to Abbott’s investment in TAP in the amount of approximately $280 million.
For the acquired Lupron business, Abbott recorded intangible assets, primarily Lupron product rights, of approximately $700 million, goodwill of approximately $350 million and deferred tax liabilities related primarily to the intangible assets of approximately $260 million. The intangible assets are being amortized over 15 years. Abbott has also agreed to remit cash to Takeda if certain research and development events are not achieved on the development assets retained by Takeda. These amounts were recorded as a liability at closing in the amount of approxi-mately $1.1 billion. Related deferred tax assets of approximately $410 million were also recorded, resulting in an after-tax liability of approximately $700 million. Of the $1.1 billion, Abbott made a tax-deductible payment of $200 million in 2008 and Abbott will make a tax-deductible payment of approximately $120 million in 2009. If the remaining payments are not required, the liability would be reduced and a gain would be recorded.
The 50 percent-owned joint venture was accounted for under the equity method of accounting. Summarized financial information for TAP follows below. The results for 2008 include results through April 30.
(dollars in millions)
Year Ended December 31 2008 2007 2006
Net sales $853 $3,002 $3,363
Cost of sales 229 720 836
Income before taxes 356 1,564 1,524
Net income 238 996 952
In the fourth quarter of 2008, Abbott sold its spine business for approxi-mately $360 million in cash, resulting in an after-tax gain of approximately $147 million which is presented as Gain on sale of discontinued opera-tions, net of taxes, in the accompanying statement of income. The operations and financial position of the spine business are not presented as discontinued operations because the effects would not be significant.
Note 4 — Financial Instruments, Derivatives and Fair Value Measures
Certain Abbott foreign subsidiaries enter into foreign currency forward exchange contracts to manage exposures to changes in foreign exchange rates for anticipated intercompany purchases by those subsidiaries whose functional currencies are not the U.S. dollar. These contracts, totaling $129 million, $281 million and $768 million at December 31, 2008, 2007 and 2006, respectively, are designated as cash flow hedges of the variability of the cash flows due to changes in foreign exchange rates. Abbott records the contracts at fair value, resulting in charges of $2 million and $12 million in 2008 and 2007, respectively, and a credit of $16 million to Accumulated other compre-hensive income (loss) in 2006. Ineffectiveness recorded in 2008, 2007 or 2006 was not significant. Accumulated gains and losses as of December 31, 2008 will be included in Cost of products sold at the time the products are sold, generally through the next twelve months.
Abbott enters into foreign currency forward exchange contracts to manage currency exposures for foreign currency denominated third-party trade payables and receivables, and for intercompany loans and trade accounts payable where the receivable or payable is denomi-nated in a currency other than the functional currency of the entity. For intercompany loans, the contracts require Abbott to sell or buy foreign currencies, primarily European currencies and Japanese yen, in exchange for primarily U.S. dollars and other European currencies. For intercompany and trade payables and receivables, the currency exposures are primarily the U.S. dollar, European currencies and Japanese yen. These contracts are recorded at fair value, with the resulting gains or losses reflected in income as Net foreign exchange (gain) loss. At December 31, 2008, 2007 and 2006, Abbott held $8.3 billion, $5.5 billion and $5.6 billion, respectively, of such foreign currency forward exchange contracts.
Abbott has designated foreign denominated short-term debt as a hedge of the net investment in certain foreign subsidiaries of approximately $585 million and approximately $1.7 billion as of December 31, 2008 and 2007, respectively. Accordingly, changes in the fair value of this debt due to changes in exchange rates are recorded in Accumulated other comprehensive income (loss), net of tax, resulting in charges of $134 million and $72 million to Accumulated other comprehensive income (loss) in 2008 and 2007, respectively.
Abbott is a party to interest rate hedge contracts totaling $2.5 billion at December 31, 2008 and $1.5 billion at December 31, 2007 and 2006 to manage its exposure to changes in the fair value of $2.5 billion and $1.5 billion, respectively, of fixed-rate debt due 2009 through 2017. These contracts are designated as fair value hedges of the variability of the fair value of fixed-rate debt due to changes in the long-term benchmark interest rates. The effect of the hedge is to change a fixed-rate interest obligation to a variable rate for that portion of the debt. Abbott records the contracts at fair value and adjusts the carry-ing amount of the fixed-rate debt by an offsetting amount. No hedge ineffectiveness was recorded in income in 2008, 2007 and 2006.

49
Abbott 2008 Annual Report
(dollars in millions) 2008 2007 2006
Carrying Fair Carrying Fair Carrying Fair
Value Value Value Value Value Value
Current Investments:
Available-for-Sale Equity Securities $ — $ — $ — $ — $ 775 $ 775
Trading Securities — — 308 308 — —
Other 968 968 56 56 77 77
Long-term Investments:
Available-for-Sale Equity Securities 147 147 229 229 378 378
Note Receivable 865 824 851 809 837 849
Other 62 56 45 40 15 15
Total Long-term Debt (9,754) (10,458) (10,386) (10,593) (7,105) (7,113)
Foreign Currency Forward Exchange Contracts:
Receivable position 148 148 24 24 34 34
(Payable) position (100) (100) (45) (45) (86) (86)
Interest Rate Hedge Contracts 170 170 (25) (25) (85) (85)
The following table summarizes the bases used to measure certain assets and liabilities at fair value on a recurring basis in the balance sheet:
(dollars in millions) Basis of Fair Value Measurement
Outstanding Quoted Prices in Significant Other Significant
December 31, 2008: Balances Active Markets Observable Inputs Unobservable Inputs
Equity and other securities $ 144 $105 $ 10 $29
Foreign currency forward exchange contracts 148 — 148 —
Interest rate swap financial instruments 170 — 170 —
Financial assets relating to TAP employees’ stock options 16 — — 16
Total Assets $ 478 $105 $ 328 $45
Fair value of hedged long-term debt $2,670 $ — $2,670 $ —
Foreign currency forward exchange contracts 100 — 100 —
Financial liabilities relating to TAP employees’ stock options 24 — — 24
Total Liabilities $2,794 $ — $2,770 $24
December 31, 2007:
Trading securities $ 308 $308 $ — $ —
Marketable available-for-sale securities 193 193 — —
Foreign currency forward exchange contracts 24 — 24 —
Total Assets $ 525 $501 $ 24 $ —
Fair value of hedged long-term debt $1,475 $ — $1,475 $ —
Interest rate swap financial instruments 25 — 25 —
Foreign currency forward exchange contracts 45 — 45 —
Total Liabilities $1,545 $ — $1,545 $ —
Notes to Consolidated Financial Statements
Gross unrealized holding gains (losses) on available-for-sale equity securities totaled $55 million and $(23) million, respectively, at December 31, 2008; $108 million and $(3) million, respectively, at December 31, 2007 and $21 million and $(304) million, respectively, at December 31, 2006.
The carrying values and fair values of certain financial instruments as of December 31 are shown in the table below. The carrying values of all other financial instruments approximate their estimated fair values. The counter parties to financial instruments consist of select major international financial institutions. Abbott does not expect any losses from nonperformance by these counter parties.
In connection with the conclusion of the TAP Pharmaceutical Products Inc. joint venture, Abbott recorded derivative financial assets and liabili-ties related to stock options previously granted to TAP’s employees. The amounts of these assets and liabilities were calculated using both the Black-Scholes option-pricing model and the intrinsic value of the options. From April 30, 2008 to December 31, 2008, both the assets and liabilities decreased by approximately $29 million. The effect of the changes in these assets and liabilities substantially offset each other.
In addition, Abbott received investments in 2008 that are valued using significant unobservable inputs. The recorded value of these invest-ments did not change significantly. In 2007, adjustments to record a derivative financial instrument liability whose value was derived using significant unobservable inputs resulted in a credit to Other (income) expense, net, in the amount of $25 million. The value of this derivative financial instrument liability was zero at December 31, 2007.

50
Abbott 2008 Annual Report
Notes to Consolidated Financial Statements
(dollars in millions) Defined Benefit Plans Medical and Dental Plans
2008 2007 2006 2008 2007 2006
Service cost — benefits earned during the year $ 233 $ 249 $ 219 $ 43 $ 58 $ 56
Interest cost on projected benefit obligations 353 316 275 92 97 80
Expected return on plans’ assets (487) (426) (382) (33) (24) (16)
Amortization of actuarial losses 34 81 78 29 55 44
Amortization of prior service cost (credits) 4 4 — (21) (22) (21)
Total cost $ 137 $ 224 $ 190 $110 $164 $143
Note 5 — Post-Employment Benefits
Retirement plans consist of defined benefit, defined contribution and medical and dental plans. Information for Abbott’s major defined benefit plans and post-employment medical and dental benefit plans is as follows:
(dollars in millions) Defined Benefit Plans Medical and Dental Plans
2008 2007 2006 2008 2007 2006
Projected benefit obligations, January 1 $ 5,783 $5,614 $5,041 $ 1,514 $ 1,520 $ 1,292
Service cost — benefits earned during the year 233 249 219 43 58 56
Interest cost on projected benefit obligations 353 316 275 92 97 80
Losses (gains), primarily changes in discount and medical
cost trend rates, plan design changes, law changes and
differences between actual and estimated health care costs (278) (309) 64 (158) (100) 134
Benefits paid (241) (228) (213) (68) (61) (68)
Other, primarily foreign currency translation (309) 141 228 20 — 26
Projected benefit obligations, December 31 $ 5,541 $5,783 $5,614 $ 1,443 $ 1,514 $ 1,520
Plans’ assets at fair value, January 1 $ 5,667 $5,086 $4,349 $ 307 $ 212 $ 149
Actual return on plans’ assets (1,568) 442 508 (106) 20 23
Company contributions 285 283 266 133 136 108
Benefits paid (241) (228) (213) (68) (61) (68)
Other, primarily foreign currency translation (146) 84 176 — — —
Plans’ assets at fair value, December 31 $ 3,997 $5,667 $5,086 $ 266 $ 307 $ 212
Projected benefit obligations greater than
plans’ assets, December 31 $(1,544) $ (116) $ (528) $(1,177) $(1,207) $(1,308)
Long-term assets $ 16 $ 576 $ 84 $ — $ — $ —
Short-term liabilities (24) (27) (23) — — —
Long-term liabilities (1,536) (665) (589) (1,177) (1,207) (1,308)
Net liability $(1,544) $ (116) $ (528) $(1,177) $(1,207) $(1,308)
Amounts Recognized in Accumulated Other
Comprehensive Income (loss):
Actuarial losses, net $ 2,554 $ 920 $1,343 $ 587 $ 635 $ 786
Prior service cost (credits) 38 40 43 (206) (227) (249)
Total $ 2,592 $ 960 $1,386 $ 381 $ 408 $ 537
The projected benefit obligations for non-U.S. defined benefit plans was $1.3 billion, $1.8 billion and $1.5 billion at December 31, 2008, 2007 and 2006, respectively. The accumulated benefit obligations for all defined benefit plans was $4.7 billion, $4.9 billion and $4.7 billion at December 31, 2008, 2007 and 2006, respectively. For plans where the accumulated benefit obligations exceeded plan assets at
December 31, 2008, 2007 and 2006, the aggregate accumulated benefit obligations were $4.2 billion, $697 million and $544 million, respectively; the projected benefit obligations were $4.8 billion, $770 million and $592 million, respectively; and the aggregate plan assets were $3.3 billion, $84 million and $22 million, respectively.

51
Abbott 2008 Annual Report
Other comprehensive income (loss) for 2008 includes amortization of actuarial losses and prior service cost of $34 million and $4 million, respectively, and net actuarial losses of $1.6 billion for defined benefit plans and amortization of actuarial losses and prior service credits of $29 million and $21 million, respectively, and net actuarial gains of $19 million for medical and dental plans. Other comprehensive income (loss) for 2007 includes amortization of actuarial losses and prior ser-vice cost of $81 million and $4 million, respectively, and net actuarial gains of $341 million for defined benefit plans and amortization of actuarial losses and prior service credits of $55 million and $22 million, respectively, and net actuarial gains of $96 million for medical and dental plans. The pretax amount of actuarial losses and prior service cost (credits) included in Accumulated other comprehensive income (loss) at December 31, 2008 that is expected to be recognized in the net periodic benefit cost in 2009 is $61 million and $4 million, respectively, for defined benefit pension plans and $32 million and $(22) million, respectively, for medical and dental plans.
The weighted average assumptions used to determine benefit obligations for defined benefit plans and medical and dental plans are as follows:
2008 2007 2006
Discount rate 6.7% 6.2% 5.7%
Expected aggregate average
long-term change in compensation 4.3% 4.2% 4.2%
The weighted average assumptions used to determine the net cost for defined benefit plans and medical and dental plans are as follows:
2008 2007 2006
Discount rate 6.2% 5.7% 5.5%
Expected return on plan assets 8.4% 8.3% 8.5%
Expected aggregate average
long-term change in compensation 4.2% 4.2% 4.2%
The assumed health care cost trend rates for medical and dental plans at December 31 were as follows:
2008 2007 2006
Health care cost trend rate
assumed for the next year 7% 7% 7%
Rate that the cost trend rate
gradually declines to 5% 5% 5%
Year that rate reaches the
assumed ultimate rate 2012 2012 2012
The discount rates used to measure liabilities were determined based on high-quality fixed income securities that match the duration of the expected retiree benefits. The health care cost trend rates represent Abbott’s expected annual rates of change in the cost of health care benefits and is a forward projection of health care costs as of the measurement date. A one-percentage point increase/(decrease) in
the assumed health care cost trend rate would increase/(decrease) the accumulated post-employment benefit obligations as of December 31, 2008, by $193 million /$(157) million, and the total of the service and interest cost components of net post-employment health care cost for the year then ended by approximately $23 million /$(18) million.
Approximately 58 percent of Abbott’s U.S. defined benefit plans and medical and dental plans assets are invested in equity securities, 30 percent in fixed income securities, and the remainder in other secu-rities, which consist of investment partnerships that employ diverse investment strategies across a wide variety of asset classes and finan-cial instruments. The investment mix of equity securities, fixed income and other securities is based upon achieving a desired return, balanc-ing higher return, more volatile equity securities, and lower return, less volatile fixed income securities. Abbott’s domestic plans are invested in diversified portfolios of public-market equity and fixed-income secu-rities. Investment allocations are made across a range of markets, industry sectors, capitalization sizes, and in the case of fixed income securities, maturities and credit quality. The plans do not directly hold any securities of Abbott. Abbott’s international defined benefit plans are invested approximately 70 percent in equities and 30 percent in fixed income securities.
The plans’ expected return on assets, as shown above, is based on management’s expectations of long-term average rates of return to be achieved by the underlying investment portfolios. In establishing this assumption, management considers historical and expected returns for the asset classes in which the plans are invested, as well as current economic and capital market conditions.
Abbott funds its domestic pension plans according to IRS funding limitations. In 2008, 2007 and 2006, $200 million was funded to the main domestic pension plan. International pension plans are funded according to similar regulations. Abbott expects pension funding for its main domestic pension plan of $700 million in 2009 and $200 million annually thereafter.
Total benefit payments expected to be paid to participants, which includes payments funded from company assets as well as paid from the plans, are as follows:
Defined Medical and
(dollars in millions) Benefit Plans Dental Plans
2009 $ 237 $ 80
2010 245 85
2011 253 90
2012 266 94
2013 277 97
2014 to 2018 1,706 557
The Abbott Stock Retirement Plan is the principal defined contribution plan. Abbott’s contributions to this plan were $129 million in 2008, $119 million in 2007 and $102 million in 2006.
Abbott provides certain other post-employment benefits, primarily salary continuation plans, to qualifying domestic employees, and accrues for the related cost over the service lives of the employees.
Notes to Consolidated Financial Statements

52
Abbott 2008 Annual Report
Notes to Consolidated Financial Statements
Note 6 — Taxes on Earnings
Taxes on earnings from continuing operations reflect the annual effective rates, including charges for interest and penalties. Deferred income taxes reflect the tax consequences on future years of differences between the tax bases of assets and liabilities and their financial report-ing amounts. U.S. income taxes are provided on those earnings of foreign subsidiaries which are intended to be remitted to the parent company. Abbott does not record deferred income taxes on earnings reinvested indefinitely in foreign subsidiaries. Undistributed earnings reinvested indefinitely in foreign subsidiaries as working capital and plant and equipment aggregated $14.9 billion at December 31, 2008. It is not practicable to determine the amount of deferred income taxes not provided on these earnings. In the U.S., Abbott’s federal income tax returns through 2005 are settled, and the income tax returns for years after 2005 are open. There are numerous other income tax jurisdictions for which tax returns are not yet settled, none of which are individually significant. Reserves for interest and penalties are not significant.
Earnings from continuing operations before taxes, and the related provi-sions for taxes on earnings from continuing operations, were as follows:
(dollars in millions)
Earnings From Continuing
Operations Before Taxes: 2008 2007 2006
Domestic $ (81) $ 670 $ (869)
Foreign 5,937 3,800 3,145
Total $5,856 $4,470 $2,276
Taxes on Earnings From
Continuing Operations: 2008 2007 2006
Current:
U.S. Federal, State and Possessions $1,188 $ 564 $ 509
Foreign 782 675 634
Total current 1,970 1,239 1,143
Deferred:
Domestic (845) (304) (545)
Foreign (3) (72) (38)
Total deferred (848) (376) (583)
Total $1,122 $ 863 $ 560
Differences between the effective income tax rate and the U.S. statutory tax rate were as follows:
2008 2007 2006
Statutory tax rate on earnings
from continuing operations 35.0% 35.0% 35.0%
Benefit of lower foreign tax rates
and tax exemptions (16.7) (12.6) (18.4)
Effect of non-deductible
acquired in-process
research and development — — 19.4
State taxes, net of federal benefit 0.2 0.4 0.3
Adjustments primarily related
to resolution of prior years’
accrual requirements (0.5) — (5.8)
Domestic dividend exclusion (0.6) (3.1) (5.9)
All other, net 1.8 (0.4) —
Effective tax rate on earnings
from continuing operations 19.2% 19.3% 24.6%
As of December 31, 2008, 2007 and 2006, total deferred tax assets were $5.4 billion, $3.6 billion and $3.2 billion, respectively, and total deferred tax liabilities were $1.4 billion, $1.4 billion and $1.1 billion, respectively. Valuation allowances for deferred tax assets were not significant. The tax effect of the differences that give rise to deferred tax assets and liabilities were as follows:
(dollars in millions) 2008 2007 2006
Compensation and employee benefits $ 1,496 $ 862 $ 921
Trade receivable reserves 434 337 236
Inventory reserves 261 220 163
Deferred intercompany profit 248 262 390
State income taxes 137 84 52
Depreciation (64) (105) (135)
Acquired in-process research and
development and other accruals and
reserves not currently deductible 2,771 1,751 1,269
Other, primarily the excess of book
basis over tax basis of intangible assets (1,293) (1,197) (872)
Total $ 3,990 $ 2,214 $2,024
On January 1, 2007, Abbott adopted the provisions of FASB Interpretation No. 48 “Accounting for Uncertainty in Income Taxes.” Under this Interpretation, in order to recognize an uncertain tax benefit, the taxpayer must be more likely than not of sustaining the position, and the measurement of the benefit is calculated as the largest amount that is more than 50 percent likely to be realized upon resolu-tion of the benefit. Adoption of this Interpretation did not have a material impact on Abbott’s financial position. The following table summarizes the gross amounts of unrecognized tax benefits without regard to reduction in tax liabilities or additions to deferred tax assets and liabilities if such unrecognized tax benefits were settled.
(dollars in millions) 2008 2007
January 1 $1,126 $ 713
Increase due to current year tax positions 385 339
Increase due to prior year tax positions 418 147
Decrease due to current year tax positions (25) —
Decrease due to prior year tax positions (240) (11)
Settlements (121) (62)
Lapse of statute (20) —
December 31 $1,523 $1,126
The total amount of unrecognized tax benefits that, if recognized, would affect the effective tax rate is approximately $1.4 billion. Abbott believes that it is reasonably possible that unrecognized tax benefits will be settled within the next twelve months as a result of concluding various tax matters. Abbott expects the range of the decrease in the recorded amounts of unrecognized tax benefits, primarily as a result of cash adjustments, to range from $400 million to $650 million, arising from the conclusion of these tax matters.

53
Abbott 2008 Annual Report
(dollars in millions) 2008 2007 2006
Total Reportable Segment
Operating Earnings $7,770 $6,428 $5,853
Corporate functions and
benefit plans costs (377) (421) (449)
Non-reportable segments 133 298 197
Net interest expense (327) (456) (292)
Acquired in-process and collaborations
research and development (97) — (2,014)
Income from TAP Pharmaceutical
Products Inc. joint venture 119 498 476
Share-based compensation (d) (347) (430) (330)
Other, net (e) (1,018) (1,447) (1,165)
Consolidated Earnings from
Continuing Operations Before Taxes $5,856 $4,470 $2,276
(d) The increase in share-based compensation in 2007 is partially due to the granting
of replacement stock options as a result of the increase in the market value of Abbott
common stock.
(e) Other, net for 2007 includes $197 for restructuring plans; $256 for acquisition
integration and related costs primarily associated with the acquisitions of Guidant’s
vascular intervention and endovascular solutions businesses and Kos Pharmaceuticals Inc.
and a $190 fair market value loss adjustment to Abbott’s investment in Boston Scientific
common stock.
(dollars in millions) 2008 2007 2006
Total Reportable Segment Assets $21,616 $20,956 $19,882
Cash and investments 6,153 3,946 2,603
Current deferred income taxes 2,463 2,110 1,717
Non-reportable segments 1,094 1,575 1,486
All other, net, primarily goodwill
and intangible assets not allocated
to reportable segments 11,093 11,127 10,490
Total Assets $42,419 $39,714 $36,178
Notes to Consolidated Financial Statements
Net Sales to Operating Depreciation Additions to (dollars in millions) External Customers (a) Earnings (Loss) (a) and Amortization Long-term Assets Total Assets
2008 2007 2006 2008 2007 2006 2008 2007 2006 2008 2007 2006 2008 2007 2006
Pharmaceuticals (b) $16,708 $14,632 $12,395 $6,331 $5,509 $4,522 $ 323 $330 $150 $ 831 $ 407 $2,615 $10,356 $ 9,197 $ 9,281
Nutritionals (c) 4,924 4,388 4,313 859 855 1,206 135 115 112 281 388 184 3,220 3,261 2,467
Diagnostics 3,575 3,158 2,843 375 252 240 312 286 248 270 374 373 3,218 3,792 3,734
Vascular (b) 2,241 1,663 1,082 205 (188) (115) 240 234 157 489 312 3,637 4,822 4,706 4,400
Total Reportable
Segments 27,448 23,841 20,633 $7,770 $6,428 $5,853 $1,010 $965 $667 $1,871 $1,481 $6,809 $21,616 $20,956 $19,882
Other 2,080 2,073 1,843
Net Sales $29,528 $25,914 $22,476
(a) Net sales and operating earnings for 2008 and 2007 were favorably affected by the relatively weaker U.S. dollar and were unfavorably affected by the relatively stronger U.S. dollar in 2006.
(b) Additions to long-term assets for the Pharmaceutical Products segment includes acquired intangible assets of $700 in 2008 and $821 in 2006 and goodwill of $1,590 in 2006 and for the
Vascular Products segment, includes goodwill of $321 and $1,688 in 2008 and 2006, respectively, and acquired intangible assets of $1,195 in 2006.
(c) The decrease in the Nutritional Products segment operating earnings in 2007 was primarily due to the completion of the U.S. co-promotion of Synagis in 2006.
Note 7 — Segment and Geographic Area Information
Abbott’s principal business is the discovery, development, manufacture and sale of a broad line of health care products. Abbott’s products are generally sold directly to retailers, wholesalers, hospitals, health care facilities, laboratories, physicians’ offices and government agencies throughout the world. Abbott’s reportable segments are as follows:
Pharmaceutical Products — Worldwide sales of a broad line of pharmaceuticals. For segment reporting purposes, two pharmaceuti-cal divisions are aggregated and reported as the Pharmaceutical Products segment.
Nutritional Products — Worldwide sales of a broad line of adult and pediatric nutritional products.
Diagnostic Products — Worldwide sales of diagnostic systems and tests for blood banks, hospitals, commercial laboratories and alter-nate-care testing sites. For segment reporting purposes, three diagnostic divisions are aggregated and reported as the Diagnostic Products segment.
Vascular Products — Worldwide sales of coronary, endovascular and vessel closure products.
Abbott’s underlying accounting records are maintained on a legal entity basis for government and public reporting requirements. Segment disclosures are on a performance basis consistent with inter-nal management reporting. Intersegment transfers of inventory are recorded at standard cost and are not a measure of segment operat-ing earnings. The cost of some corporate functions and the cost of certain employee benefits are charged to segments at predetermined rates that approximate cost. Remaining costs, if any, are not allocated to segments. For acquisitions prior to 2006, substantially all intangible assets and related amortization are not allocated to segments. The following segment information has been prepared in accordance with the internal accounting policies of Abbott, as described above, and are not presented in accordance with generally accepted accounting principles applied to the consolidated financial statements.

54
Abbott 2008 Annual Report
Notes to Consolidated Financial Statements
Net Sales to
(dollars in millions) External Customers (f) Long-term Assets
2008 2007 2006 2008 2007 2006
United States $14,495 $13,252 $11,995 $14,271 $12,870 $13,536
Japan 1,249 1,111 1,054 1,046 987 974
Germany 1,381 1,235 885 5,833 6,822 6,154
The Netherlands 1,753 1,271 1,061 175 211 185
Italy 1,089 974 848 248 288 256
Canada 924 832 762 131 156 74
France 977 854 696 114 142 131
Spain 909 731 583 284 336 283
United Kingdom 725 627 517 1,008 1,371 1,446
All Other Countries 6,026 5,027 4,075 2,267 2,488 1,857
Consolidated $29,528 $25,914 $22,476 $25,377 $25,671 $24,896
(f) Sales by country are based on the country that sold the product.
Note 8 — Litigation and Environmental Matters
Abbott has been identified as a potentially responsible party for investigation and cleanup costs at a number of locations in the United States and Puerto Rico under federal and state remediation laws and is investigating potential contamination at a number of company-owned locations. Abbott has recorded an estimated cleanup cost for each site for which management believes Abbott has a probable loss exposure. No individual site cleanup exposure is expected to exceed $3 million, and the aggregate cleanup exposure is not expected to exceed $15 million.
There are a number of patent disputes with third parties who claim Abbott’s products infringe their patents. In one of those disputes, filed in April 2007, Abbott is unable to estimate a range of possible loss, if any, and no reserve has been recorded. Abbott’s acquisition of Kos Pharmaceuticals Inc. resulted in the assumption of various cases and investigations and Abbott has recorded reserves related to several of those cases and investigations.
There are several civil actions pending brought by individuals or entities that allege generally that Abbott and numerous pharmaceutical com-panies reported false or misleading pricing information relating to the average wholesale price of certain pharmaceutical products in connec-tion with federal, state and private reimbursement. Civil actions have also been brought against Abbott, and in some cases other members of the pharmaceutical industry, by state attorneys general seeking to recover alleged damages on behalf of state Medicaid programs. In May 2006, Abbott was notified that the U.S. Department of Justice
intervened in a civil whistle-blower lawsuit alleging that Abbott inflated prices for Medicaid and Medicare reimbursable drugs. Abbott has settled a few of the cases and recorded reserves for its estimated losses in a few other cases, however, Abbott is unable to estimate the range or amount of possible loss for the majority of the cases, and no loss reserves have been recorded for them. Many of the products involved in these cases are Hospira products. Hospira, Abbott’s former hospital products business, was spun off to Abbott’s shareholders in 2004. Abbott retained liability for losses that result from these cases and investigations to the extent any such losses both relate to the sale of Hospira’s products prior to the spin-off of Hospira and relate to allegations that were made in such pending and future cases and investigations that were the same as allegations existing at the date of the spin-off.
There are several civil actions pending brought by state attorneys general and private entities alleging antitrust and unfair competition claims in connection with the sales of TriCor. Abbott licenses TriCor from a third party and the licensor has also been named as a defen-dant. In the fourth quarter of 2008, settlements were reached in all of these cases except the state attorneys general and indirect purchas-ers, however, Abbott is unable to estimate a range of loss, if any, and no loss reserves have been recorded for the remaining TriCor cases. There are several civil actions pending brought by private payers and others alleging antitrust claims in connection with the pricing of Norvir.
Within the next year, legal proceedings may occur that may result in a change in the estimated reserves recorded by Abbott. For its legal proceedings and environmental exposures, except as noted above, Abbott estimates the range of possible loss to be from approximately $255 million to $495 million. The recorded reserve balance at December 31, 2008 for these proceedings and exposures was approximately $325 million. These reserve and range amounts include $135 million of settled amounts that were paid in 2009. These reserves represent management’s best estimate of probable loss, as defined by Statement of Financial Accounting Standards No. 5 “Accounting for Contingencies.”
While it is not feasible to predict the outcome of all such proceedings and exposures with certainty, management believes that their ultimate disposition should not have a material adverse effect on Abbott’s financial position, cash flows, or results of operations, except for the cases and investigations discussed in the third paragraph and the patent case discussed in the second paragraph of this footnote, the resolution of which could be material to cash flows or results of operations for a quarter.
55
Abbott 2008 Annual Report
Note 9 — Incentive Stock Program
The 1996 Incentive Stock Program authorizes the granting of stock options, replacement stock options, stock appreciation rights, limited stock appreciation rights, restricted stock awards, restricted stock units, performance units and foreign qualified benefits. Stock options, replacement stock options and restricted stock awards and units comprise the majority of benefits that have been granted and are currently outstanding under this program. In 2008, Abbott granted 20,544,577 stock options, 4,425,398 replacement stock options, 829,491 restricted stock awards and 567,624 restricted stock units under the program. The purchase price of shares under option must be at least equal to the fair market value of the common stock on the date of grant, and the maximum term of an option is 10 years. Options vest equally over three years except for replacement options, which vest in six months. Options granted before January 1, 2005 included a replacement feature. Except for options outstanding that have a replacement feature, options granted after December 31, 2004 do not include a replacement feature. When an employee tenders mature shares to Abbott upon exercise of a stock option, a replace-ment stock option may be granted equal to the amount of shares tendered. Replacement options are granted at the then current market price for a term that expires on the date of the underlying option grant. Upon a change in control of Abbott, all outstanding stock options become fully exercisable, and all terms and conditions of all restricted stock awards and units are deemed satisfied. Restricted stock awards
granted generally vest between 3 and 5 years and for restricted stock awards that vest over 5 years, no more than one-third of the award vests in any one year upon Abbott reaching a minimum return on equity target. Restricted stock units vest over three years and upon vesting, the recipient receives one share of Abbott stock for each vested restricted stock unit. The aggregate fair market value of restricted stock awards and units is recognized as expense over the service period. Restricted stock awards and settlement of vested restricted stock units are issued out of treasury shares. Abbott issues new shares for exercises of stock options. Abbott does not have a policy of purchasing its shares relating to its share-based programs. At January 1, 2009, approximately 56 million shares were reserved for future grants under the 1996 Program. Subsequent to year-end, the Board of Directors granted approximately 8 million stock options and restricted stock awards and units from this reserve.
The number of restricted stock awards and units outstanding and the weighted-average grant-date fair value at December 31, 2007 and December 31, 2008 was 3,740,341 and $49.04 and 3,574,445 and $52.21, respectively. The number of restricted stock awards and units, and the weighted-average grant-date fair value, that were granted, vested and lapsed during 2008 were 1,444,465 and $55.53, 1,389,085 and $47.09 and 221,276 and $51.15, respectively. The fair market value of restricted stock awards and units vested in 2008, 2007 and 2006 was $76 million, $114 million and $32 million, respectively.
Notes to Consolidated Financial Statements
Options Outstanding Exercisable Options
Weighted Weighted Weighted Weighted
Average Average Average Average
Exercise Remaining Exercise Remaining
Shares Price Life (Years) Shares Price Life (Years)
December 31, 2007 132,992,850 $47.19 6.6 88,057,465 $46.22 5.5
Granted 24,969,975 55.79
Exercised (25,872,104) 45.13
Lapsed (3,263,586) 51.77
December 31, 2008 128,827,135 $49.16 6.4 87,770,715 $47.39 5.4
The aggregate intrinsic value of options outstanding and exercisable at December 31, 2008 was $632 million and $559 million, respectively. The total intrinsic value of options exercised in 2008, 2007 and 2006 was $314 million, $613 million and $205 million, respectively. The total unrecognized compensation cost related to all share-based compensation plans at December 31, 2008 amounted to approxi-mately $220 million which is expected to be recognized over the next three years.
Total non-cash compensation expense charged against income in 2008, 2007 and 2006 for share-based plans totaled approximately $350 million, $430 million and $330 million, respectively, and the tax benefit recognized was approximately $117 million, $142 million and $78 million, respectively. Compensation cost capitalized as part of inventory is not significant.
The fair value of an option granted in 2008, 2007 and 2006 was $11.42, $12.88 and $11.72, respectively. The fair value of an option grant was estimated using the Black-Scholes option-pricing model with the following assumptions:
2008 2007 2006
Risk-free interest rate 3.0% 4.5% 4.6%
Average life of options (years) 6.0 5.9 6.1
Volatility 24.0% 25.0% 28.0%
Dividend yield 2.6% 2.5% 2.7%
The risk-free interest rate is based on the rates available at the time of the grant for zero-coupon U.S. government issues with a remaining term equal to the option’s expected life. The average life of an option is based on both historical and projected exercise and lapsing data. Expected volatility is based on implied volatilities from traded options on Abbott’s stock and historical volatility of Abbott’s stock over the expected life of the option. Dividend yield is based on the option’s exercise price and annual dividend rate at the time of grant.
56
Abbott 2008 Annual Report
Note 10 — Debt and Lines of Credit
The following is a summary of long-term debt at December 31:
(dollars in millions) 2008 2007 2006
Various notes, due 2008 $ — $ — $1,095
3.5% Notes, due 2009 — 500 500
5.375% Notes, due 2009 — 500 500
1.51% Yen notes, due 2010 157 135 129
3.75% Notes, due 2011 500 500 500
5.6% Notes, due 2011 1,500 1,500 1,500
5.15% Notes, due 2012 1,000 1,000 —
1.95% Yen notes, due 2013 262 226 216
4.35% Notes, due 2014 500 500 500
5.875% Notes, due 2016 2,000 2,000 2,000
5.6% Notes, due 2017 1,500 1,500 —
6.15% Notes, due 2037 1,000 1,000 —
Other, including fair value adjustments
relating to interest rate hedge contracts
designated as fair value hedges 294 127 70
Total, net of current maturities 8,713 9,488 7,010
Current maturities of long-term debt 1,041 898 95
Total carrying amount $9,754 $10,386 $7,105
Principal payments required on long-term debt outstanding at December 31, 2008, are $1.0 billion in 2009, $160 million in 2010, $2.0 billion in 2011, $1.0 billion in 2012, $265 million in 2013 and $5.1 billion thereafter.
At December 31, 2008, Abbott’s long-term debt rating was AA by Standard & Poor’s Corporation and A1 by Moody’s Investors Service. Abbott has readily available financial resources, including unused lines of credit of $5.3 billion that support commercial paper borrowing arrangements of which a $2.3 billion facility expires in December 2009 and a $3.0 billion facility expires in 2012. Related compensating balances, which are subject to withdrawal by Abbott at its option, and commitment fees are not material. Abbott’s access to short-term financing has not been affected by the recent credit market conditions. Abbott’s weighted-average interest rate on short-term borrowings was 0.5% at December 31, 2008, 3.7% at December 31, 2007 and 5.0% at December 31, 2006.
Note 11 — Business Combinations, Technology Acquisitions and Related Transactions
In December 2006, Abbott acquired Kos Pharmaceuticals Inc. for cash of approximately $3.8 billion, net of cash held by Kos Pharmaceuticals Inc., to expand Abbott’s presence in the lipid management market and to provide several on-market and late-stage pipeline products. Kos Pharmaceuticals Inc. was a specialty pharmaceutical company that developed and marketed proprietary medications for the treatment of chronic cardiovascular, metabolic and respiratory diseases. This business was acquired on December 13, 2006 and the financial results of the acquired operations are included in these financial statements beginning on that date. The acquisition was financed
primarily with short-term debt. The allocation of the purchase price resulted in a charge of $1.3 billion for acquired in-process research and development, intangible assets of $821 million, goodwill (primarily non-deductible) of $1.6 billion and net liabilities, primarily deferred income taxes recorded at acquisition of $331 million. Acquired intangible assets are being amortized over 4 to 15 years. Non-deductible acquired in-process research and development was charged to income in 2006.
In order to expand Abbott’s presence in the growing vascular market, Abbott acquired Guidant’s vascular intervention and endovascular solu-tions businesses on April 21, 2006 for approximately $4.1 billion, in cash, in connection with Boston Scientific’s acquisition of Guidant. In addition, Abbott agreed to pay to Boston Scientific $250 million each upon government approvals to market the Xience V drug-eluting stent in the U.S. and in Japan. In 2008, the FDA approved the marketing of Xience V and Abbott paid Boston Scientific $250 million, resulting in the recording of additional goodwill. Government approval in Japan is anticipated in late 2009 or early 2010 which will also result in the record-ing of additional goodwill. The allocation of the purchase price resulted in a charge of $665 million for acquired in-process research and devel-opment, intangible assets of $1.2 billion, goodwill (primarily deductible) of $1.7 billion and tangible net assets of $580 million. Acquired intangi-ble assets are being amortized over 4 to 15 years. Deductible acquired in-process research and development was charged to income in 2006. The net tangible assets acquired consist primarily of property and equipment of approximately $530 million, trade accounts receivable of approximately $250 million and inventories of approximately $120 mil-lion, net of assumed liabilities, primarily trade accounts payable, litigation reserves and other liabilities.
Had the above acquisitions taken place on January 1 of the previous year, consolidated net sales and income would not have been signifi-cantly different from reported amounts.
In order to facilitate Boston Scientific’s acquisition of Guidant, Abbott also acquired 64.6 million shares of Boston Scientific common stock directly from Boston Scientific and loaned $900 million to a wholly-owned subsidiary of Boston Scientific. The common stock was valued at $1.3 billion and the note receivable was valued at $829 million at the acquisition date. In connection with the acquisition of the shares, Boston Scientific was entitled to certain after-tax gains upon Abbott’s sale of the shares. In addition, Boston Scientific agreed to reimburse Abbott for certain borrowing costs on debt incurred to acquire the Boston Scientific shares. Abbott recorded a net derivative financial instruments liability of $59 million for the gain-sharing derivative finan-cial instrument liability and the interest derivative financial instrument asset. The effect of recording the shares, the loan to Boston Scientific and the derivative financial instruments at fair value on the date of acquisition resulted in the recording of additional goodwill of approxi-mately $204 million. Changes in the fair value of the derivative financial instruments, net were recorded in Other (income) expense, net.
Notes to Consolidated Financial Statements

57
Abbott 2008 Annual Report
Note 12 — Goodwill and Intangible Assets
In 2008, Abbott paid $250 million to Boston Scientific as a result of the FDA’s approval to market the Xience V drug-eluting stent in the U.S., resulting in an increase in goodwill in the Vascular Products segment. In addition, the conclusion of the TAP Pharmaceuticals Products Inc. joint venture resulted in the recording of $350 million of goodwill related to the Pharmaceutical Products segment. Abbott recorded goodwill of $53 million and $3.7 billion in 2007 and 2006, respectively, related to acquisitions. Goodwill adjustments recorded in 2007 allocated to the Pharmaceutical Products segment amounted to $194 million and goodwill allocated to the Vascular Products segment amounted to $(141) million. Acquired goodwill allocated to the Pharmaceutical Products segment amounted to $1.6 billion in 2006 and goodwill allocated to the Vascular Products segment amounted to $1.7 billion in 2006. Foreign currency translation and other adjustments (decreased) increased goodwill in 2008, 2007 and 2006 by $(677) million, $627 million and $509 million, respectively. The amount of goodwill related to reportable segments at December 31, 2008 was $6.0 billion for the Pharmaceutical Products segment, $206 million for the Nutritional Products segment, $268 million for the Diagnostic Products segment, and $2.2 billion for the Vascular Products segment. Goodwill was reduced by approximately $64 million in connection with the sale of Abbott’s spine business in 2008. There were no other reductions of goodwill relating to impairments or disposal of all or a portion of a business.
The gross amount of amortizable intangible assets, primarily product rights and technology was $9.4 billion, $9.0 billion and $9.0 billion as of December 31, 2008, 2007 and 2006, respectively, and accumu-lated amortization was $4.2 billion, $3.3 billion and $2.6 billion as of December 31, 2008, 2007 and 2006, respectively. The estimated annual amortization expense for intangible assets is approximately $780 million in 2009, $770 million in 2010, $760 million in 2011, $750 million in 2012 and $720 million in 2013. Intangible assets are amortized over 4 to 25 years (average 11 years).
Note 13 — Restructuring Plans
In 2008, Abbott management approved a plan to streamline global manufacturing operations, reduce overall costs, and improve efficien-cies in Abbott’s core diagnostic business. This plan will result in pretax charges of approximately $370 million over the next several years. These charges include employee-related costs of approximately $110 million, accelerated depreciation of approximately $75 million, and other related exit costs of approximately $185 million, mainly related to product transfers. In 2008, Abbott recorded a charge to Cost of products sold of approximately $129 million under the plan. Additional charges of approximately $16 million were recorded in 2008 relating to this restructuring, primarily for accelerated depreciation. The remainder of the charges will occur through 2011 as a result of prod-uct re-registration timelines required under manufacturing regulations in a number of countries and product transition timelines. The following summarizes the activity for this restructuring:
(dollars in millions) 2008
2008 restructuring charge $129
Payments and other adjustments (19)
Accrued balance at December 31 $110
In 2008, 2007 and 2006, Abbott management approved plans to realign its worldwide pharmaceutical and vascular manufacturing oper-ations and selected domestic and international commercial and research and development operations in order to reduce costs. In 2008, 2007 and 2006, Abbott recorded charges of approximately $36 million, $107 million and $210 million, respectively, reflecting the impairment of manufacturing facilities and other assets, employee severance and other related charges. Approximately $94 million and $181 million in 2007 and 2006, respectively, is classified as cost of products sold, $3 million and $29 million in 2007 and 2006, respec-tively, as research and development and $36 million and $10 million in 2008 and 2007, respectively, as selling, general and administrative. Fair value for the determination of the amount of asset impairments was determined primarily based on a discounted cash flow method. An additional $81 million, $90 million and $70 million were subse-quently recorded in 2008, 2007 and 2006, respectively, relating to these restructurings, primarily for accelerated depreciation. In addition, Abbott implemented facilities restructuring plans in 2007 related to the acquired operations of Kos Pharmaceuticals Inc., which resulted in an increase to goodwill of approximately $52 million. Abbott expects to incur up to an additional $21 million in future periods for these restructuring plans, primarily for accelerated depreciation. The following summarizes the activity for these restructurings:
Employee-
Related Asset
(dollars in millions) and Other Impairments Total
Accrued balance at January 1, 2006 $ 155 $ — $ 155
2006 restructuring charges 117 93 210
Payments, impairments
and other adjustments (79) (93) (172)
Accrued balance at December 31, 2006 193 — 193
2007 restructuring charges 121 38 159
Payments, impairments
and other adjustments (120) (38) (158)
Accrued balance at December 31, 2007 194 — 194
2008 restructuring charges 36 — 36
Payments and other adjustments (125) — (125)
Accrued balance at December 31, 2008 $ 105 $ — $ 105
Note 14- Subsequent Event — Business Combination
In January 2009, Abbott announced an agreement to acquire Advanced Medical Optics, Inc. (AMO), a marketer of ophthalmic surgical technology and devices, as well as eye care solutions, for approximately $2.8 billion, in cash and debt, to take advantage of increasing demand for vision care technologies due to population growth and demographic shifts. The transaction is expected to close in the first quarter of 2009. AMO’s sales are more than $1 billion per year.
Notes to Consolidated Financial Statements

58
Abbott 2008 Annual Report
The management of Abbott Laboratories is responsible for establishing and maintaining adequate internal control over financial reporting. Abbott’s internal control system was designed to provide reasonable assurance to the company’s management and board of directors regarding the preparation and fair presentation of published financial statements.
All internal control systems, no matter how well designed, have inherent limitations. Therefore, even those systems determined to be effective can provide only reasonable assurance with respect to financial statement preparation and presentation.
Abbott’s management assessed the effectiveness of the company’s internal control over financial reporting as of December 31, 2008. In making this assessment, it used the criteria set forth in Internal Control-Integrated Framework issued by the Committee of Sponsoring Organizations of the Treadway Commission. Based on our assess-ment, we believe that, as of December 31, 2008, the company’s internal control over financial reporting was effective based on those criteria.
Abbott’s independent registered public accounting firm has issued an audit report on their assessment of the effectiveness of the company’s internal control over financial reporting. This report appears on page 59.
Miles D. WhiteChairman of the Board and Chief Executive Officer
Thomas C. FreymanExecutive Vice President, Finance and Chief Financial Officer
Greg W. LinderVice President and Controller
February 19, 2009
Notes to Consolidated Financial Statements
Note 15 — Quarterly Results (Unaudited)
(dollars in millions except per share data) 2008 2007 2006
First Quarter
Net Sales $6,765.6 $5,945.5 $5,183.5
Gross Profit 3,804.5 3,353.5 3,013.8
Net Earnings 937.9 697.6 865.0
Basic Earnings Per Common Share (a) .61 .45 .57
Diluted Earnings Per Common Share (b) .60 .45 .56
Market Price Per Share-High 61.09 57.26 45.58
Market Price Per Share-Low 50.09 48.75 39.18
Second Quarter
Net Sales $7,314.0 $6,370.6 $5,501.1
Gross Profit 4,194.4 3,566.3 3,112.5
Net Earnings (c) 1,322.0 988.7 612.2
Basic Earnings Per Common Share (a) (c) .86 .64 .40
Diluted Earnings Per Common Share (b) (c) .85 .63 .40
Market Price Per Share-High 57.04 59.50 43.61
Market Price Per Share-Low 50.09 52.80 40.55
Third Quarter
Net Sales $7,497.7 $6,376.7 $5,573.8
Gross Profit 4,144.8 3,512.7 3,182.5
Net Earnings 1,084.6 717.0 715.8
Basic Earnings Per Common Share (a) .70 .46 .47
Diluted Earnings Per Common Share (b) .69 .46 .46
Market Price Per Share-High 60.78 56.91 49.87
Market Price Per Share-Low 52.63 49.58 43.25
Fourth Quarter
Net Sales $7,950.3 $7,221.4 $6,218.0
Gross Profit 4,771.9 4,059.7 3,352.4
Net Earnings (Loss) (d) 1,536.2 1,203.0 (476.2)
Basic Earnings (Loss)
Per Common Share (a) (d) .99 .78 (.31)
Diluted Earnings (Loss)
Per Common Share (b) (d) .98 .77 (.31)
Market Price Per Share-High 59.93 59.48 49.10
Market Price Per Share-Low 45.75 50.51 45.41
(a) The sum of the quarters’ basic earnings per share for 2007 and 2006 does not add
to the full year earnings per share amount due to rounding.
(b) The sum of the quarters’ diluted earnings per share for 2006 does not add to the
full year earnings per share amount due to rounding.
(c) Second quarter 2006 includes a pretax charge of $493 for acquired in-process and
collaborations research and development.
(d) Fourth quarter 2006 includes a pretax charge of $1,307 for acquired in-process and
collaborations research and development.
Management Report on Internal Control Over Financial Reporting
59
Abbott 2008 Annual Report
To the Board of Directors and Shareholders of Abbott Laboratories:
We have audited the accompanying consolidated balance sheets of Abbott Laboratories and subsidiaries (the “Company”) as of December 31, 2008, 2007, and 2006, and the related consolidated statements of earnings, shareholders’ investment, and cash flows for the years then ended. These financial statements are the responsibility of the Company’s management. Our responsibility is to express an opinion on these financial statements based on our audits.
We conducted our audits in accordance with the standards of the Public Company Accounting Oversight Board (United States). Those standards require that we plan and perform the audit to obtain reason-able assurance about whether the financial statements are free of material misstatement. An audit includes examining, on a test basis, evidence supporting the amounts and disclosures in the financial statements. An audit also includes assessing the accounting principles used and significant estimates made by management, as well as evaluating the overall financial statement presentation. We believe that our audits provide a reasonable basis for our opinion.
In our opinion, such consolidated financial statements present fairly, in all material respects, the financial position of the Company as of December 31, 2008, 2007, and 2006, and the results of its operations and its cash flows for the years then ended in conformity with account-ing principles generally accepted in the United States of America.
As discussed in Notes 1, 2, and 4 to the consolidated financial statements, the Company changed its method of accounting for fair value measurements to adopt Statement of Financial Accounting Standards (“SFAS”) No. 157, Fair Value Measurements, and adopted the fair value option under SFAS No. 159, The Fair Value Option for Financial Assets and Financial Liabilities, for certain investments in 2007, and the Company changed its method of accounting for pension and other post employment benefits to adopt SFAS No. 158, Employers’ Accounting for Defined Benefit Pension and Other Postretirement Plans in 2006.
We have also audited, in accordance with the standards of the Public Company Accounting Oversight Board (United States), the Company’s internal control over financial reporting as of December 31, 2008, based on the criteria established in Internal Control—Integrated Framework issued by the Committee of Sponsoring Organizations of the Treadway Commission and our report dated February 19, 2009 expressed an unqualified opinion on the Company’s internal control over financial reporting.
Deloitte & Touche LLPChicago, IllinoisFebruary 19, 2009
To the Board of Directors and Shareholders of Abbott Laboratories:
We have audited the internal control over financial reporting of Abbott Laboratories and subsidiaries (the “Company”) as of December 31, 2008, based on criteria established in Internal Control—Integrated Framework issued by the Committee of Sponsoring Organizations of the Treadway Commission. The Company’s management is responsi-ble for maintaining effective internal control over financial reporting and for its assessment of the effectiveness of internal control over financial reporting, included in the accompanying Management Report on
Internal Control over Financial Reporting. Our responsibility is to express an opinion on the Company’s internal control over financial reporting based on our audit.
We conducted our audit in accordance with the standards of the Public Company Accounting Oversight Board (United States). Those standards require that we plan and perform the audit to obtain reason-able assurance about whether effective internal control over financial reporting was maintained in all material respects. Our audit included obtaining an understanding of internal control over financial reporting, assessing the risk that a material weakness exists, testing and evaluat-ing the design and operating effectiveness of internal control based on the assessed risk, and performing such other procedures as we considered necessary in the circumstances. We believe that our audit provides a reasonable basis for our opinion.
A company’s internal control over financial reporting is a process designed by, or under the supervision of, the company’s principal executive and principal financial officers, or persons performing similar functions, and effected by the company’s board of directors, manage-ment, and other personnel to provide reasonable assurance regarding the reliability of financial reporting and the preparation of financial state-ments for external purposes in accordance with generally accepted accounting principles. A company’s internal control over financial reporting includes those policies and procedures that (1) pertain to the maintenance of records that, in reasonable detail, accurately and fairly reflect the transactions and dispositions of the assets of the company; (2) provide reasonable assurance that transactions are recorded as necessary to permit preparation of financial statements in accordance with generally accepted accounting principles, and that receipts and expenditures of the company are being made only in accordance with authorizations of management and directors of the company; and (3) provide reasonable assurance regarding prevention or timely detec-tion of unauthorized acquisition, use, or disposition of the company’s assets that could have a material effect on the financial statements.
Because of the inherent limitations of internal control over financial reporting, including the possibility of collusion or improper manage-ment override of controls, material misstatements due to error or fraud may not be prevented or detected on a timely basis. Also, projections of any evaluation of the effectiveness of the internal control over finan-cial reporting to future periods are subject to the risk that the controls may become inadequate because of changes in conditions, or that the degree of compliance with the policies or procedures may deteriorate.
In our opinion, the Company maintained, in all material respects, effec-tive internal control over financial reporting as of December 31, 2008, based on the criteria established in Internal Control—Integrated Framework issued by the Committee of Sponsoring Organizations of the Treadway Commission.
We have also audited, in accordance with the standards of the Public Company Accounting Oversight Board (United States), the consolidated financial statements of the Company as of and for the year ended December 31, 2008 and our report dated February 19, 2009 expressed an unqualified opinion on those financial statements.
Deloitte & Touche LLPChicago, IllinoisFebruary 19, 2009
Reports of Independent Registered Public Accounting Firm

60
Abbott 2008 Annual Report
Investment in Boston Scientific Common Stock and Note Receivable
At December 31, 2007, Abbott held 26.4 million shares, or approxi-mately $300 million of Boston Scientific common stock. In 2008 all of these shares were sold resulting in a small gain. Abbott also has a $900 million loan, due in April 2011, to a wholly-owned subsidiary of Boston Scientific as of December 31, 2008 and 2007, and, as such, is subject to credit risk.
Other Market Price Sensitive Investments
Abbott holds available-for-sale equity securities from strategic technology acquisitions, excluding Boston Scientific. The market value of these investments was approximately $105 million and $193 million, respec-tively, as of December 31, 2008 and 2007. Abbott monitors these investments for other than temporary declines in market value, and charges impairment losses to income when an other than temporary decline in value occurs. A hypothetical 20 percent decrease in the share prices of these investments would decrease their fair value at December 31, 2008 by approximately $21 million. (A 20 percent decrease is believed to be a reasonably possible near-term change in share prices.)
Non-Publicly Traded Equity Securities
Abbott holds equity securities from strategic technology acquisitions that are not traded on public stock exchanges. The carrying value of these investments was approximately $42 million and $37 million as of December 31, 2008 and 2007, respectively. No individual invest-ment is in excess of $13 million. Abbott monitors these investments for other than temporary declines in market value, and charges impair-ment losses to income when an other than temporary decline in estimated value occurs.
Interest Rate Sensitive Financial Instruments
At December 31, 2008 and 2007, Abbott had interest rate hedge con-tracts totaling $2.5 billion and $1.5 billion, respectively, to manage its exposure to changes in the fair value of debt due in 2009 through 2017. The effect of these hedges is to change the fixed interest rate to a variable rate. Abbott does not use derivative financial instruments, such as interest rate swaps, to manage its exposure to changes in interest rates for its investment securities. At December 31, 2008, Abbott had $1.0 billion of domestic commercial paper outstanding
with an average annual interest rate of 0.2% with an average remaining life of 11 days. The fair value of long-term debt at December 31, 2008 and 2007 amounted to $10.5 billion and $10.6 billion, respectively (average interest rates of 5.2% and 5.0%, respectively) with maturities through 2037. At December 31, 2008 and 2007, the fair value of cur-rent and long-term investment securities amounted to $1.8 billion and $896 million, respectively. A hypothetical 100-basis point change in the interest rates would not have a material effect on cash flows, income or market values. (A 100-basis point change is believed to be a rea-sonably possible near-term change in rates.)
Foreign Currency Sensitive Financial Instruments
Abbott enters into foreign currency forward exchange contracts to manage its exposure to foreign currency denominated intercompany loans and trade payables and third-party trade payables and receiv-ables. The contracts are marked-to-market, and resulting gains or losses are reflected in income and are generally offset by losses or gains on the foreign currency exposure being managed. At December 31, 2008 and 2007, Abbott held $8.3 billion and $5.5 billion, respectively, of such contracts, which mature in the next twelve months.
In addition, certain Abbott foreign subsidiaries enter into foreign cur-rency forward exchange contracts to manage exposures to changes in foreign exchange rates for anticipated intercompany purchases by those subsidiaries whose functional currencies are not the U.S. dollar. These contracts are designated as cash flow hedges of the variability of the cash flows due to changes in foreign currency exchange rates and are marked-to-market with the resulting gains or losses reflected in Accumulated other comprehensive income (loss). Gains or losses will be included in Cost of products sold at the time the products are sold, generally within the next twelve months. At December 31, 2008 and 2007, Abbott held $129 million and $281 million, respectively, of such contracts, which all mature in the following calendar year.
Abbott has designated approximately $585 million of foreign denomi-nated short-term debt as a hedge of the net investment in certain foreign subsidiaries. Accordingly, changes in the fair value of this debt due to changes in exchange rates are recorded in Accumulated other comprehensive income (loss).
The following table reflects the total foreign currency forward contracts outstanding at December 31, 2008 and 2007:
Financial Instruments and Risk Management
2008 2007
Fair and Fair and
Carrying Carrying
Average Value Average Value
Contract Exchange Receivable/ Contract Exchange Receivable/
(dollars in millions) Amount Rate (Payable) Amount Rate (Payable)
Receive primarily U.S. Dollars
in exchange for the following currencies:
Euro $3,963 1.286 $ 3 $2,630 1.464 $(11)
British Pound 1,208 1.553 (31) 1,030 2.041 —
Japanese Yen 1,788 99.6 54 939 113.9 (5)
Canadian Dollar 163 1.240 3 426 0.995 (1)
All other currencies 1,254 N/A 19 716 N/A (4)
Total $8,376 $ 48 $5,741 $(21)

61
Abbott 2008 Annual Report
Abbott’s revenues are derived primarily from the sale of a broad line of health care products under short-term receivable arrangements. Patent protection and licenses, technological and performance features, and inclusion of Abbott’s products under a contract or by a pharmacy benefit manager most impact which products are sold; price controls, competition and rebates most impact the net selling prices of products; and foreign currency translation impacts the measurement of net sales and costs. Abbott’s primary products are prescription pharmaceuticals, nutritional products, diagnostic testing products and vascular products. Sales in international markets are approximately 50 percent of consolidated net sales.
The worldwide launch of additional indications for HUMIRA, the conclusion of the TAP Pharmaceutical Products Inc. joint venture, the acquisitions of Kos Pharmaceuticals Inc., and Guidant’s vascular intervention and endovascular solutions businesses, followed by the launch of the Xience V drug eluting stent, the amendment ending the U.S. Synagis co-promotion agreement, the loss of patent protection for some pharmaceutical products, and realized gains and unrealized losses on the Boston Scientific common stock have impacted Abbott’s sales, costs and financial position over the last three years.
Pharmaceutical research and development is focused on therapeutic areas that include immunology, oncology, neuroscience, pain manage-ment and infectious diseases. In 2003, Abbott began the worldwide launch of HUMIRA for rheumatoid arthritis, followed by launches for five additional indications, which increased HUMIRA’s worldwide sales to $4.5 billion in 2008 compared to $3.0 billion in 2007, and $2.0 billion in 2006. Abbott forecasts worldwide HUMIRA sales to increase more than 25 percent in 2009. Abbott is studying two additional indications for HUMIRA. Substantial research and development and selling support has been and continues to be dedicated to maximizing the worldwide potential of HUMIRA. In December 2006, Abbott acquired Kos Pharmaceuticals Inc. which complemented Abbott’s existing franchise in the dyslipidemia market and strengthened the pharmaceutical pipeline for cholesterol management. Abbott’s Trilipix, a next-generation product for management of triglycerides and the first product approved for use in combination with a statin was launched in 2008. Increased generic competition has resulted in U.S. sales of Omnicef declining from $637 million in 2006 to $25 million in 2008, and worldwide sales of clarithromycin declining from $816 million in 2006 to $651 million in 2008. Abbott has seen generic competition begin in the second half of 2008 for Depakote, which had U.S. sales of $1.3 billion in 2008.
On December 31, 2006, the U.S. co-promotion agreement for Synagis terminated. Revenues for co-promotion of Synagis were $373 million in 2006. In 2007, Abbott’s nutritional products businesses were reor-ganized into a worldwide business to better leverage the opportunities available for strong nutritional brands. Significant efforts have been focused on capturing those opportunities, particularly in developing markets where growth has been strong.
In April 2006, Abbott acquired Guidant’s vascular intervention and endovascular solutions businesses and began to integrate it with Abbott’s vascular business. The acquisition significantly improved Abbott’s competitive position in this business that is characterized by rapid innovation. In 2008, Abbott received FDA approval to market the Xience V drug eluting stent in the U.S. and in 2006 received European Union approval. Xience V became the market-leading drug eluting stent in the U.S. in the fourth quarter of 2008.
In April 2006, Abbott acquired 64.6 million shares of Boston Scientific in connection with Abbott’s acquisition of the vascular intervention and endovascular solutions businesses of Guidant. In 2007, the net loss charged to expense for the investment was $153 million. At December 31, 2007, Abbott held 26.4 million shares of Boston Scientific common stock. In 2008, all of these shares were sold resulting in a small gain. Abbott’s short- and long-term debt totaled $11.4 billion at December 31, 2008, largely incurred to finance recent acquisitions. Operating cash flows in excess of capital expenditures and cash dividends have partially funded acquisitions over the last three years. At December 31, 2008, Abbott’s long-term debt rating was AA by Standard and Poor’s Corporation and A1 by Moody’s Investors Service. Abbott’s access to short-term financing has not been affected by the recent credit market conditions.
In April 2008, Abbott and Takeda concluded their TAP Pharmaceutical Products Inc. (TAP) joint venture, evenly splitting the value and assets of the joint venture in a tax-free exchange. Abbott received TAP’s Lupron business in exchange for Abbott’s 50 percent ownership in TAP. Lupron’s U.S. results are now included in the Pharmaceutical Products segment beginning in May 2008.
In 2009, Abbott will focus on several key initiatives. Abbott announced the agreement to acquire Advanced Medical Optics, Inc. (AMO), a new line of business, in January of 2009. The investment in AMO will be approximately $2.8 billion, including debt, and will be financed with operating cash flow and debt. AMO’s sales are more than $1 billion per year. In the pharmaceutical business, Abbott will continue maxi-mizing the market potential for HUMIRA and continue to leverage the product and pipeline opportunities of its lipid franchise. Pharmaceutical research and development efforts will continue to focus on the thera-peutic areas noted above with a significant portion of the development expenditures allocated to new HUMIRA indications, Trilipix/Crestor fixed dose combination, ABT-874 (a biologic for psoriasis and Crohn’s disease) and pain relief medication, as well as several Phase I and Phase II clinical programs in neuroscience, oncology and Hepatitis C. In the vascular business, Abbott will continue the launch of the Xience V drug-eluting stent in the U.S. after the FDA’s approval in 2008, and will focus on development of its next generation drug eluting stent and its bioabsorbable stent. For diabetes care, Abbott will build upon the 2008 launch of the FreeStyle Freedom Lite monitor in the U.S. In the other business segments, Abbott will focus on developing or acquiring differentiated technologies in higher growth segments of those markets.
Critical Accounting Policies
Sales Rebates — Approximately 47 percent of Abbott’s consolidated gross revenues are subject to various forms of rebates and allowances that Abbott records as reductions of revenues at the time of sale. Most of these rebates and allowances are in the Pharmaceutical Products segment and the Nutritional Products segment. Abbott provides rebates to pharmacy benefit management companies, state agencies that administer the federal Medicaid program, insurance companies that administer Medicare drug plans, state agencies that administer the Special Supplemental Nutrition Program for Women, Infants, and Children (WIC), wholesalers, group purchasing organizations, and other government agencies and private entities. Rebate amounts are usually based upon the volume of purchases using contractual or stat-utory prices for a product. Factors used in the rebate calculations
Financial Review
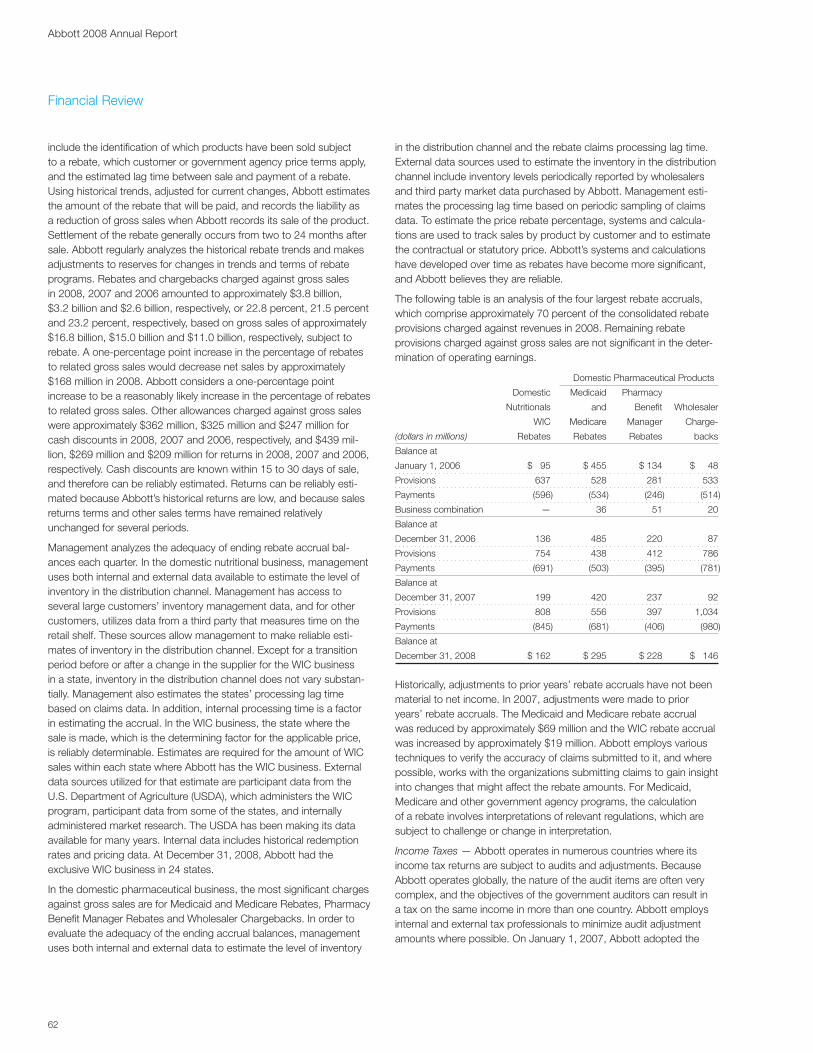
62
Abbott 2008 Annual Report
include the identification of which products have been sold subject to a rebate, which customer or government agency price terms apply, and the estimated lag time between sale and payment of a rebate. Using historical trends, adjusted for current changes, Abbott estimates the amount of the rebate that will be paid, and records the liability as a reduction of gross sales when Abbott records its sale of the product. Settlement of the rebate generally occurs from two to 24 months after sale. Abbott regularly analyzes the historical rebate trends and makes adjustments to reserves for changes in trends and terms of rebate programs. Rebates and chargebacks charged against gross sales in 2008, 2007 and 2006 amounted to approximately $3.8 billion, $3.2 billion and $2.6 billion, respectively, or 22.8 percent, 21.5 percent and 23.2 percent, respectively, based on gross sales of approximately $16.8 billion, $15.0 billion and $11.0 billion, respectively, subject to rebate. A one-percentage point increase in the percentage of rebates to related gross sales would decrease net sales by approximately $168 million in 2008. Abbott considers a one-percentage point increase to be a reasonably likely increase in the percentage of rebates to related gross sales. Other allowances charged against gross sales were approximately $362 million, $325 million and $247 million for cash discounts in 2008, 2007 and 2006, respectively, and $439 mil-lion, $269 million and $209 million for returns in 2008, 2007 and 2006, respectively. Cash discounts are known within 15 to 30 days of sale, and therefore can be reliably estimated. Returns can be reliably esti-mated because Abbott’s historical returns are low, and because sales returns terms and other sales terms have remained relatively unchanged for several periods.
Management analyzes the adequacy of ending rebate accrual bal-ances each quarter. In the domestic nutritional business, management uses both internal and external data available to estimate the level of inventory in the distribution channel. Management has access to several large customers’ inventory management data, and for other customers, utilizes data from a third party that measures time on the retail shelf. These sources allow management to make reliable esti-mates of inventory in the distribution channel. Except for a transition period before or after a change in the supplier for the WIC business in a state, inventory in the distribution channel does not vary substan-tially. Management also estimates the states’ processing lag time based on claims data. In addition, internal processing time is a factor in estimating the accrual. In the WIC business, the state where the sale is made, which is the determining factor for the applicable price, is reliably determinable. Estimates are required for the amount of WIC sales within each state where Abbott has the WIC business. External data sources utilized for that estimate are participant data from the U.S. Department of Agriculture (USDA), which administers the WIC program, participant data from some of the states, and internally administered market research. The USDA has been making its data available for many years. Internal data includes historical redemption rates and pricing data. At December 31, 2008, Abbott had the exclusive WIC business in 24 states.
In the domestic pharmaceutical business, the most significant charges against gross sales are for Medicaid and Medicare Rebates, Pharmacy Benefit Manager Rebates and Wholesaler Chargebacks. In order to evaluate the adequacy of the ending accrual balances, management uses both internal and external data to estimate the level of inventory
in the distribution channel and the rebate claims processing lag time. External data sources used to estimate the inventory in the distribution channel include inventory levels periodically reported by wholesalers and third party market data purchased by Abbott. Management esti-mates the processing lag time based on periodic sampling of claims data. To estimate the price rebate percentage, systems and calcula-tions are used to track sales by product by customer and to estimate the contractual or statutory price. Abbott’s systems and calculations have developed over time as rebates have become more significant, and Abbott believes they are reliable.
The following table is an analysis of the four largest rebate accruals, which comprise approximately 70 percent of the consolidated rebate provisions charged against revenues in 2008. Remaining rebate provisions charged against gross sales are not significant in the deter-mination of operating earnings.
Domestic Pharmaceutical Products
Domestic Medicaid Pharmacy
Nutritionals and Benefit Wholesaler
WIC Medicare Manager Charge-
(dollars in millions) Rebates Rebates Rebates backs
Balance at
January 1, 2006 $ 95 $ 455 $ 134 $ 48
Provisions 637 528 281 533
Payments (596) (534) (246) (514)
Business combination — 36 51 20
Balance at
December 31, 2006 136 485 220 87
Provisions 754 438 412 786
Payments (691) (503) (395) (781)
Balance at
December 31, 2007 199 420 237 92
Provisions 808 556 397 1,034
Payments (845) (681) (406) (980)
Balance at
December 31, 2008 $ 162 $ 295 $ 228 $ 146
Historically, adjustments to prior years’ rebate accruals have not been material to net income. In 2007, adjustments were made to prior years’ rebate accruals. The Medicaid and Medicare rebate accrual was reduced by approximately $69 million and the WIC rebate accrual was increased by approximately $19 million. Abbott employs various techniques to verify the accuracy of claims submitted to it, and where possible, works with the organizations submitting claims to gain insight into changes that might affect the rebate amounts. For Medicaid, Medicare and other government agency programs, the calculation of a rebate involves interpretations of relevant regulations, which are subject to challenge or change in interpretation.
Income Taxes — Abbott operates in numerous countries where its income tax returns are subject to audits and adjustments. Because Abbott operates globally, the nature of the audit items are often very complex, and the objectives of the government auditors can result in a tax on the same income in more than one country. Abbott employs internal and external tax professionals to minimize audit adjustment amounts where possible. On January 1, 2007, Abbott adopted the
Financial Review
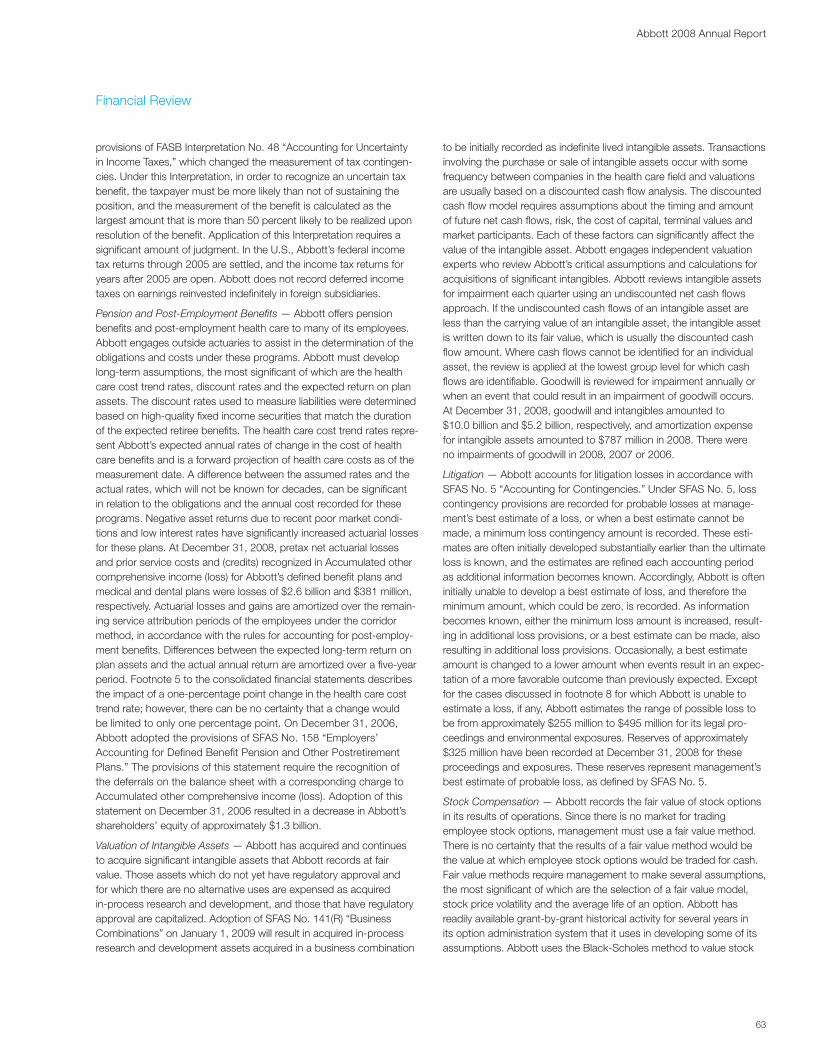
63
Abbott 2008 Annual Report
provisions of FASB Interpretation No. 48 “Accounting for Uncertainty in Income Taxes,” which changed the measurement of tax contingen-cies. Under this Interpretation, in order to recognize an uncertain tax benefit, the taxpayer must be more likely than not of sustaining the position, and the measurement of the benefit is calculated as the largest amount that is more than 50 percent likely to be realized upon resolution of the benefit. Application of this Interpretation requires a significant amount of judgment. In the U.S., Abbott’s federal income tax returns through 2005 are settled, and the income tax returns for years after 2005 are open. Abbott does not record deferred income taxes on earnings reinvested indefinitely in foreign subsidiaries.
Pension and Post-Employment Benefits — Abbott offers pension benefits and post-employment health care to many of its employees. Abbott engages outside actuaries to assist in the determination of the obligations and costs under these programs. Abbott must develop long-term assumptions, the most significant of which are the health care cost trend rates, discount rates and the expected return on plan assets. The discount rates used to measure liabilities were determined based on high-quality fixed income securities that match the duration of the expected retiree benefits. The health care cost trend rates repre-sent Abbott’s expected annual rates of change in the cost of health care benefits and is a forward projection of health care costs as of the measurement date. A difference between the assumed rates and the actual rates, which will not be known for decades, can be significant in relation to the obligations and the annual cost recorded for these programs. Negative asset returns due to recent poor market condi-tions and low interest rates have significantly increased actuarial losses for these plans. At December 31, 2008, pretax net actuarial losses and prior service costs and (credits) recognized in Accumulated other comprehensive income (loss) for Abbott’s defined benefit plans and medical and dental plans were losses of $2.6 billion and $381 million, respectively. Actuarial losses and gains are amortized over the remain-ing service attribution periods of the employees under the corridor method, in accordance with the rules for accounting for post-employ-ment benefits. Differences between the expected long-term return on plan assets and the actual annual return are amortized over a five-year period. Footnote 5 to the consolidated financial statements describes the impact of a one-percentage point change in the health care cost trend rate; however, there can be no certainty that a change would be limited to only one percentage point. On December 31, 2006, Abbott adopted the provisions of SFAS No. 158 “Employers’ Accounting for Defined Benefit Pension and Other Postretirement Plans.” The provisions of this statement require the recognition of the deferrals on the balance sheet with a corresponding charge to Accumulated other comprehensive income (loss). Adoption of this statement on December 31, 2006 resulted in a decrease in Abbott’s shareholders’ equity of approximately $1.3 billion.
Valuation of Intangible Assets — Abbott has acquired and continues to acquire significant intangible assets that Abbott records at fair value. Those assets which do not yet have regulatory approval and for which there are no alternative uses are expensed as acquired in-process research and development, and those that have regulatory approval are capitalized. Adoption of SFAS No. 141(R) “Business Combinations” on January 1, 2009 will result in acquired in-process research and development assets acquired in a business combination
to be initially recorded as indefinite lived intangible assets. Transactions involving the purchase or sale of intangible assets occur with some frequency between companies in the health care field and valuations are usually based on a discounted cash flow analysis. The discounted cash flow model requires assumptions about the timing and amount of future net cash flows, risk, the cost of capital, terminal values and market participants. Each of these factors can significantly affect the value of the intangible asset. Abbott engages independent valuation experts who review Abbott’s critical assumptions and calculations for acquisitions of significant intangibles. Abbott reviews intangible assets for impairment each quarter using an undiscounted net cash flows approach. If the undiscounted cash flows of an intangible asset are less than the carrying value of an intangible asset, the intangible asset is written down to its fair value, which is usually the discounted cash flow amount. Where cash flows cannot be identified for an individual asset, the review is applied at the lowest group level for which cash flows are identifiable. Goodwill is reviewed for impairment annually or when an event that could result in an impairment of goodwill occurs. At December 31, 2008, goodwill and intangibles amounted to $10.0 billion and $5.2 billion, respectively, and amortization expense for intangible assets amounted to $787 million in 2008. There were no impairments of goodwill in 2008, 2007 or 2006.
Litigation — Abbott accounts for litigation losses in accordance with SFAS No. 5 “Accounting for Contingencies.” Under SFAS No. 5, loss contingency provisions are recorded for probable losses at manage-ment’s best estimate of a loss, or when a best estimate cannot be made, a minimum loss contingency amount is recorded. These esti-mates are often initially developed substantially earlier than the ultimate loss is known, and the estimates are refined each accounting period as additional information becomes known. Accordingly, Abbott is often initially unable to develop a best estimate of loss, and therefore the minimum amount, which could be zero, is recorded. As information becomes known, either the minimum loss amount is increased, result-ing in additional loss provisions, or a best estimate can be made, also resulting in additional loss provisions. Occasionally, a best estimate amount is changed to a lower amount when events result in an expec-tation of a more favorable outcome than previously expected. Except for the cases discussed in footnote 8 for which Abbott is unable to estimate a loss, if any, Abbott estimates the range of possible loss to be from approximately $255 million to $495 million for its legal pro-ceedings and environmental exposures. Reserves of approximately $325 million have been recorded at December 31, 2008 for these proceedings and exposures. These reserves represent management’s best estimate of probable loss, as defined by SFAS No. 5.
Stock Compensation — Abbott records the fair value of stock options in its results of operations. Since there is no market for trading employee stock options, management must use a fair value method. There is no certainty that the results of a fair value method would be the value at which employee stock options would be traded for cash. Fair value methods require management to make several assumptions, the most significant of which are the selection of a fair value model, stock price volatility and the average life of an option. Abbott has readily available grant-by-grant historical activity for several years in its option administration system that it uses in developing some of its assumptions. Abbott uses the Black-Scholes method to value stock
Financial Review

64
Abbott 2008 Annual Report
options. Abbott uses both historical volatility of its stock price and the implied volatility of traded options to develop the volatility assumptions. Abbott uses the historical grant activity, combined with expectations about future exercise activity, to develop the average life assumptions. Abbott has also used the historical grant data to evaluate whether certain holders of stock options exercised their options differently than other holders and has not found any differentiating pattern among holders.
Results of Operations
Sales
The following table details the components of sales growth by reportable segment for the last three years:
Total % Components of Change %
Change Price Volume Exchange
Total Net Sales
2008 vs. 2007 13.9 1.4 9.3 3.2
2007 vs. 2006 15.3 1.2 10.9 3.2
2006 vs. 2005 0.6 0.6 0.2 (0.2)
Total U.S.
2008 vs. 2007 10.1 3.4 6.7 —
2007 vs. 2006 12.0 4.0 8.0 —
2006 vs. 2005 (7.5) 2.4 (9.9) —
Total International
2008 vs. 2007 17.8 (0.5) 12.0 6.3
2007 vs. 2006 18.8 (1.7) 14.0 6.5
2006 vs. 2005 10.9 (1.3) 12.7 (0.5)
Pharmaceutical Products Segment
2008 vs. 2007 14.2 1.9 9.1 3.2
2007 vs. 2006 18.0 2.4 12.3 3.3
2006 vs. 2005 (9.5) 1.8 (11.0) (0.3)
Nutritional Products Segment
2008 vs. 2007 12.2 3.4 6.9 1.9
2007 vs. 2006 1.7 1.4 (1.4) 1.7
2006 vs. 2005 9.6 (0.4) 9.7 0.3
Diagnostic Products Segment
2008 vs. 2007 13.2 1.3 6.8 5.1
2007 vs. 2006 11.1 (0.6) 7.0 4.7
2006 vs. 2005 5.7 (1.1) 7.4 (0.6)
Vascular Products Segment
2008 vs. 2007 34.7 (4.6) 35.8 3.5
2007 vs. 2006 53.8 (4.7) 55.4 3.1
2006 vs. 2005 327.7 (4.6) 333.2 (0.9)
Worldwide 2008 sales growth compared to 2007 reflects unit growth and the positive effect of the relatively weaker U.S. dollar. Worldwide 2007 sales compared to 2006 reflect the acquisitions of Guidant’s vas-cular intervention and endovascular solutions businesses on April 21, 2006 and Kos Pharmaceuticals Inc. in the fourth quarter of 2006. In addition, the Pharmaceutical Products segment had an agreement with Boehringer Ingelheim (BI) to co-promote and distribute three of its prod-ucts in the U.S. In 2005, Abbott and BI amended the agreement and
effective January 1, 2006, Abbott no longer distributed or recorded sales for distribution activities for the BI products although Abbott recorded a small amount of co-promotion revenue in 2006. The increases in sales for 2006 excluding BI products were 11.6 percent for total net sales, 12.3 percent for total U.S. sales and 7.8 percent for Pharmaceutical Products segment sales. Sales growth in 2007 for the Nutritional Products segment reflects the completion of the U.S. co-promotion of Synagis in 2006. Excluding sales of Synagis in 2006, Nutritional Products segment sales increased 11.3 percent.
A comparison of significant product group sales is as follows. Percent changes are versus the prior year and are based on unrounded numbers.
Percent Percent Percent
(dollars in millions) 2008 Change 2007 Change 2006 Change
Pharmaceuticals —
U.S. Specialty $5,211 20 $4,349 24 $3,505 25
U.S. Primary Care 3,102 (1) 3,139 23 2,561 4
International
Pharmaceuticals 7,399 23 6,002 16 5,157 8
Nutritionals —
U.S. Pediatric
Nutritionals 1,268 3 1,233 9 1,128 3
International
Pediatric Nutritionals 1,374 26 1,093 22 899 29
U.S. Adult Nutritionals 1,162 8 1,077 2 1,057 1
International
Adult Nutritionals 1,070 13 947 15 824 11
Diagnostics —
Immunochemistry 2,843 13 2,517 11 2,272 4
Increased sales of HUMIRA and the addition of Lupron sales in 2008 accounted for the majority of the sales increase for U.S. Specialty products in 2008. Increased sales of HUMIRA and Depakote accounted for the majority of the sales increases for U.S. Specialty products in 2007 and 2006. U.S. sales of HUMIRA were $2.2 billion, $1.6 billion and $1.2 billion in 2008, 2007 and 2006, respectively. U.S. Primary Care sales in 2008 were impacted by a significant decrease in sales of Omnicef due to generic competition, partially offset by increased sales of Niaspan and the TriCor/Trilipix franchise. U.S. Primary Care sales in 2007 were favorably impacted by sales of Niaspan, a new product from the acquisition of Kos Pharmaceuticals Inc. in the fourth quarter of 2006. In addition, increased sales of TriCor in 2007 and 2006 favorably impacted U.S. Primary Care sales. These increases were partially offset by lower sales of Omnicef in 2008 and 2007 and lower U.S. sales of Biaxin in all three years due primarily to the introduction of generic competition. U.S. sales of Omnicef were $25 million, $235 million and $637 million in 2008, 2007 and 2006, respectively, and U.S. sales of Biaxin were $14 million, $36 million and $151 million in 2008, 2007 and 2006, respectively. Increased sales volume of HUMIRA in all three years favorably impacted International Pharmaceuticals sales, partially offset by decreased sales volume in 2008 and 2006 due to generic competition for clarithromycin. International sales of HUMIRA were $2.3 billion, $1.4 billion and $868 million in 2008, 2007 and 2006, respectively. International Pediatric Nutritionals sales increases were due primarily to volume growth in
Financial Review

65
Abbott 2008 Annual Report
developing countries. International sales in 2008 and 2007 were also favorably impacted by the effect of the relatively weaker U.S. dollar. Abbott has periodically sold product rights to non-strategic products and has recorded the related gains in net sales in accordance with Abbott’s revenue recognition policies as discussed in footnote 1 to the consolidated financial statements. Related net sales were $111 million, $184 million and $199 million in 2008, 2007 and 2006, respectively.
The expiration of licenses, patent protection and generic competition can affect the future revenues and operating income of Abbott. Significant ongoing generic activities and significant patent and license expirations in the next three years are as follows. The U.S. composi-tion of matter patent for Depakote expired in 2008. Abbott has seen generic competition begin in the second half of 2008 for Depakote, which had U.S. sales of $1.3 billion in 2008.
Operating Earnings
Gross profit margins were 57.3 percent of net sales in 2008, 55.9 per-cent in 2007 and 56.3 percent in 2006. The increase in the gross profit margin in 2008 was due, in part, to favorable product mix and the favorable impact of foreign exchange. The decrease in the gross profit margin in 2007 was due, in part, to the unfavorable impact in 2007 of the completion of the U.S. co-promotion of Synagis in 2006 as well as generic competition for Omnicef and Biaxin sales in 2007. The increase in the gross profit margin in 2006 was due to favorable product mix, primarily as a result of decreased sales of Boehringer Ingelheim products that had lower margins than other products in the Pharmaceutical Products segment. Restructuring charges, discussed below, reduced the gross profit margins in 2008, 2007 and 2006 by 0.4 percentage points, 0.7 percentage points and 1.1 percentage points, respectively. Gross profit margins in all years were also affected by productivity improvements, higher commodity costs, higher project expenses for new products, higher manufacturing capacity costs for anticipated unit growth and the effects of inflation.
In the U.S., states receive price rebates from manufacturers of infant formula under the federally subsidized Special Supplemental Nutrition Program for Women, Infants, and Children. There are also rebate programs for pharmaceutical products. These rebate programs continue to have a negative effect on the gross profit margins of the Nutritional and Pharmaceutical Products segments. Higher commodity costs unfavorably impacted the gross profit margins for the Nutritional Products segment in 2008 and 2007 and pricing pressures unfavor-ably impacted the gross profit margin in 2006.
Research and development expense, excluding acquired in-process and collaborations research and development, was $2.7 billion in 2008, $2.5 billion in 2007 and $2.3 billion in 2006 and represented increases of 7.3 percent in 2008, 11.1 percent in 2007 and 23.8 per-cent in 2006. The effect of recording compensation expense relating to share-based awards in 2006 and additional costs associated with Abbott’s decision to discontinue the commercial development of the ZoMaxx drug-eluting stent increased research and development expenses by 6.3 percentage points over 2005. The increases in 2007 and 2006 were also affected by the acquisitions of Guidant’s vascular intervention and endovascular solutions businesses in April 2006 and Kos Pharmaceuticals Inc. in the fourth quarter of 2006. These increases also reflect increased spending to support pipeline pro-grams, including new indications for HUMIRA, and Trilipix, Trilipix/
Crestor fixed-dose combination, ABT-874 (a biologic for psoriasis and Crohn’s disease), pain relief medication and Xience V, as well as sev-eral Phase I and Phase II clinical programs in neuroscience, oncology and Hepatitis C. The majority of research and development expendi-tures are concentrated on pharmaceutical products.
Selling, general and administrative expenses increased 13.9 percent in 2008 compared to increases of 16.7 percent in 2007 and 15.5 per-cent in 2006. The 2008 increase reflects the settlement of litigation relating to TriCor, which increased selling, general and administration expenses by 3.1 percentage points. The 2007 increase reflects the acquisitions of Guidant’s vascular intervention and endovascular solu-tions businesses and Kos Pharmaceuticals Inc. The 2006 increase reflects recording compensation expense relating to share-based awards, a philanthropic contribution to the Abbott Fund and the acqui-sition of Guidant’s vascular intervention and endovascular solutions businesses. These items increased selling, general and administrative expenses by 8.6 percentage points over 2005. The remaining increases in selling, general and administrative expenses were due primarily to increased selling and marketing support for new and existing products, including continued spending for HUMIRA and the continuing launch of Xience V, as well as spending on other marketed pharmaceutical products. Increases in all three years also reflect inflation and additional selling and marketing support primarily in the Pharmaceutical Products segment.
Conclusion of TAP Pharmaceutical Products Inc. Joint Venture and Sale of Abbott’s Spine Business
On April 30, 2008, Abbott and Takeda concluded their TAP Pharmaceutical Products Inc. (TAP) joint venture, evenly splitting the value and assets of the joint venture. Abbott exchanged its 50 percent equity interest in TAP for the assets, liabilities and employees related to TAP’s Lupron business. Subsequent to the conclusion of the joint venture, TAP was merged into two Takeda entities. The exchange of Abbott’s investment in TAP for TAP’s Lupron business resulted in a gain at closing of approximately $94 million. The Internal Revenue Service has issued a private letter ruling that the transaction qualifies as tax-free for U.S. income tax purposes.
Beginning on May 1, 2008, Abbott began recording U.S. Lupron net sales and costs in its operating results and no longer records income from the TAP joint venture. TAP’s sales of Lupron were $182 million for the four months ended April 30, 2008 and $645 million and $662 million in 2007 and 2006, respectively. Abbott also receives payments based on specified development, approval and commercial events being achieved with respect to products retained by Takeda and payments from Takeda based on sales of products retained by Takeda, which are recorded by Abbott as Other (income) expense, net as earned. Such payments, which are subject to tax, are expected to approximate $1.4 billion over the five-year period beginning on May 1, 2008.
The exchange transaction was accounted for as a sale of Abbott’s equity interest in TAP and as an acquisition of TAP’s Lupron business under SFAS No. 141 “Business Combinations.” The sale of Abbott’s equity interest in TAP resulted in the recording of net assets related to the Lupron business, primarily cash, receivables, inventory and other assets, net of accounts payable and other accrued liabilities, offset by a credit to Abbott’s investment in TAP in the amount of approximately $280 million.
Financial Review

66
Abbott 2008 Annual Report
For the acquired Lupron business, Abbott recorded intangible assets, primarily Lupron product rights, of approximately $700 million, goodwill of approximately $350 million and deferred tax liabilities related primar-ily to the intangible assets of approximately $260 million. The intangible assets are being amortized over 15 years. Abbott has also agreed to remit cash to Takeda if certain research and development events are not achieved on the development assets retained by Takeda. These amounts were recorded as a liability at closing in the amount of approximately $1.1 billion. Related deferred tax assets of approxi-mately $410 million were also recorded, resulting in an after-tax liability of approximately $700 million. Of the $1.1 billion, Abbott made a tax-deductible payment of $200 million in 2008 and Abbott will make a tax-deductible payment of approximately $120 million in 2009. If the remaining payments are not required, the liability would be reduced and a gain would be recorded.
The 50 percent-owned joint venture was accounted for under the equity method of accounting. Summarized financial information for TAP follows below. The results for 2008 include results through April 30.
(dollars in millions)
Year Ended December 31 2008 2007 2006
Net sales $853 $3,002 $3,363
Cost of sales 229 720 836
Income before taxes 356 1,564 1,524
Net income 238 996 952
In the fourth quarter of 2008, Abbott sold its spine business for approximately $360 million in cash, resulting in an after-tax gain of approximately $147 million which is presented as Gain on sale of discontinued operations, net of taxes, in the accompanying statement of income. The operations and financial position of the spine business are not presented as discontinued operations because the effects would not be significant.
Restructurings
In 2008, Abbott management approved a plan to streamline global manufacturing operations, reduce overall costs, and improve efficien-cies in Abbott’s core diagnostic business. This plan will result in pretax charges of approximately $370 million over the next several years. These charges include employee-related costs of approximately $110 million, accelerated depreciation of approximately $75 million, and other related exit costs of approximately $185 million, mainly related to product transfers. In 2008, Abbott recorded a charge to Cost of products sold of approximately $129 million under the plan. Additional charges of approximately $16 million were recorded in 2008 relating to this restructuring, primarily for accelerated depreciation. The remainder of the charges will occur through 2011 as a result of product re-registration timelines required under manufacturing regula-tions in a number of countries and product transition timelines. The following summarizes the activity for this restructuring:
(dollars in millions) 2008
2008 restructuring charge $129
Payments and other adjustments (19)
Accrued balance at December 31 $110
In 2008, 2007 and 2006, Abbott management approved plans to realign its worldwide pharmaceutical and vascular manufacturing operations and selected domestic and international commercial and research and development operations in order to reduce costs. In 2008, 2007 and 2006, Abbott recorded charges of approximately $36 million, $107 million and $210 million, respectively, reflecting the impairment of manufacturing facilities and other assets, employee severance and other related charges. Approximately $94 million and $181 million in 2007 and 2006, respectively, is classified as cost of products sold, $3 million and $29 million in 2007 and 2006, respec-tively, as research and development and $36 million and $10 million in 2008 and 2007, respectively, as selling, general and administrative. Fair value for the determination of the amount of asset impairments was determined primarily based on a discounted cash flow method. An additional $81 million, $90 million and $70 million were subse-quently recorded in 2008, 2007 and 2006, respectively, relating to these restructurings, primarily for accelerated depreciation. In addition, Abbott implemented facilities restructuring plans in 2007 related to the acquired operations of Kos Pharmaceuticals Inc., which resulted in an increase to goodwill of approximately $52 million. Abbott expects to incur up to an additional $21 million in future periods for these restruc-turing plans, primarily for accelerated depreciation. The following summarizes the activity for these restructurings:
Employee-
Related Asset
(dollars in millions) and Other Impairments Total
Accrued balance at January 1, 2006 $ 155 $ — $ 155
2006 restructuring charges 117 93 210
Payments, impairments
and other adjustments (79) (93) (172)
Accrued balance at December 31, 2006 193 — 193
2007 restructuring charges 121 38 159
Payments, impairments
and other adjustments (120) (38) (158)
Accrued balance at December 31, 2007 194 — 194
2008 restructuring charges 36 — 36
Payments and other adjustments (125) — (125)
Accrued balance at December 31, 2008 $ 105 $ — $ 105
Interest expense and Interest (income)
In 2008, interest expense decreased primarily as a result of lower inter-est rates and interest income increased primarily as the result of higher investment balances. Interest expense increased in 2007 and 2006 due primarily to higher borrowings as a result of the acquisitions of Guidant’s vascular intervention and endovascular solutions businesses and Kos Pharmaceuticals Inc. and Abbott’s investment in the Boston Scientific common stock and note receivable.
Other (income) expense, net
As described above, Abbott recorded a gain of approximately $94 mil-lion in connection with the dissolution of the TAP Pharmaceutical Products Inc. joint venture in 2008, which is included in Other (income) expense, net. Other (income) expense, net for 2008 also includes a gain of approximately $52 million on the sale of an equity investment accounted for as an available-for-sale investment. The remainder of Other (income) expense, net for 2008 relates primarily to contractual payments based on specified development, approval and commercial
Financial Review

67
Abbott 2008 Annual Report
events being achieved with respect to products retained by Takeda and payments from Takeda based on sales of products retained by Takeda. Other (income) expense, net for 2007 includes a $190 million fair market value loss adjustment to Abbott’s investment in Boston Scientific common stock and a realized gain of $37 million on the sales of Boston Scientific common stock. Other (income) expense, net for 2007 and 2006 includes fair value gain adjustments of $28 million and $91 million, respectively, to certain derivative financial instruments included with the investment in Boston Scientific common stock.
Taxes on Earnings
The income tax rates on earnings from continuing operations were 19.2 percent in 2008, 19.3 percent in 2007 and 24.6 percent in 2006. Taxes on earnings from continuing operations in 2006 reflect the effect of the tax rates applied to acquired in-process research and develop-ment and the resolution of prior years’ income tax audits and the effect of other discrete tax items. For 2006, the tax rates applied to acquired in-process and collaborations research and development increased the effective tax rate by 6.6 percentage points and the effect of the income tax audit resolution and other discrete tax items decreased the effective tax rate by 5.5 percentage points. Abbott expects to apply an annual effective rate of between 17.5 percent and 18.0 percent in 2009.
Business Combinations, Technology Acquisitions and Related Transactions
In December 2006, Abbott acquired Kos Pharmaceuticals Inc. for cash of approximately $3.8 billion, net of cash held by Kos Pharmaceuticals Inc., to expand Abbott’s presence in the lipid management market and to provide several on-market and late-stage pipeline products. Kos Pharmaceuticals Inc. was a specialty pharmaceutical company that developed and marketed proprietary medications for the treatment of chronic cardiovascular, metabolic and respiratory diseases. This business was acquired on December 13, 2006 and the financial results of the acquired operations are included in these financial statements beginning on that date. The acquisition was financed primarily with short-term debt. The allocation of the purchase price resulted in a charge of $1.3 billion for acquired in-process research and development, intangible assets of $821 million, goodwill (primar-ily non-deductible) of $1.6 billion and net liabilities, primarily deferred income taxes recorded at acquisition of $331 million. Acquired intangible assets are being amortized over 4 to 15 years. Non-deductible acquired in-process research and development was charged to income in 2006.
In order to expand Abbott’s presence in the growing vascular market, Abbott acquired Guidant’s vascular intervention and endovascular solutions businesses on April 21, 2006 for approximately $4.1 billion, in cash, in connection with Boston Scientific’s acquisition of Guidant. In addition, Abbott agreed to pay to Boston Scientific $250 million each upon government approvals to market the Xience V drug-eluting stent in the U.S. and in Japan. In 2008, the FDA approved the marketing of Xience V and Abbott paid Boston Scientific $250 million, resulting in the recording of additional goodwill. Government approval in Japan is anticipated in late 2009 or early 2010 which will also result
in the recording of additional goodwill. The allocation of the purchase price resulted in a charge of $665 million for acquired in-process research and development, intangible assets of $1.2 billion, goodwill (primarily deductible) of $1.7 billion and tangible net assets of $580 mil-lion. Acquired intangible assets are being amortized over 4 to 15 years. Deductible acquired in-process research and development was charged to income in 2006. The net tangible assets acquired consist primarily of property and equipment of approximately $530 million, trade accounts receivable of approximately $250 million and inventories of approxi-mately $120 million, net of assumed liabilities, primarily trade accounts payable, litigation reserves and other liabilities.
Had the above acquisitions taken place on January 1 of the previous year, consolidated net sales and income would not have been significantly different from reported amounts.
In order to facilitate Boston Scientific’s acquisition of Guidant, Abbott also acquired 64.6 million shares of Boston Scientific common stock directly from Boston Scientific and loaned $900 million to a wholly-owned subsidiary of Boston Scientific. The common stock was valued at $1.3 billion and the note receivable was valued at $829 million at the acquisition date. In connection with the acquisition of the shares, Boston Scientific was entitled to certain after-tax gains upon Abbott’s sale of the shares. In addition, Boston Scientific agreed to reimburse Abbott for certain borrowing costs on debt incurred to acquire the Boston Scientific shares. Abbott recorded a net derivative financial instruments liability of $59 million for the gain-sharing deriva-tive financial instrument liability and the interest derivative financial instrument asset. The effect of recording the shares, the loan to Boston Scientific and the derivative financial instruments at fair value on the date of acquisition resulted in the recording of additional good-will of approximately $204 million. Changes in the fair value of the derivative financial instruments, net were recorded in Other (income) expense, net.
Subsequent Event - Business Combination
In January 2009, Abbott announced an agreement to acquire Advanced Medical Optics, Inc. (AMO), a marketer of ophthalmic surgical technology and devices, as well as eye care solutions, for approximately $2.8 billion, in cash and debt, to take advantage of increasing demand for vision care technologies due to population growth and demographic shifts. The transaction is expected to close in the first quarter of 2009. AMO’s sales are more than $1 billion per year.
Financial ConditionCash Flow
Net cash from operating activities of continuing operations amounted to $7.0 billion, $5.2 billion and $5.3 billion in 2008, 2007 and 2006, respectively. Cash from operating activities of continuing operations in 2008 compared to 2007 is higher due to higher operating earnings, decreased prepaid expenses and other assets, and increased trade accounts payable and other liabilities. Cash from operating activities of continuing operations in 2007 and 2006 compared to 2005 is higher due to higher net earnings adjusted for after-tax non-cash charges for acquired in-process research and development in 2006 and share-based compensation and higher contributions to retirement benefit plans in 2005 compared to 2007 and 2006; partially offset by higher income tax payments in 2006, including tax payments related to the
Financial Review

68
Abbott 2008 Annual Report
2005 remittances of foreign earnings under the American Jobs Creation Act. Abbott funds its domestic pension plans according to IRS funding limitations. In 2008, 2007 and 2006, $200 million was funded to the main domestic pension. Abbott expects pension funding for its main domestic pension plan of $700 million in 2009 and $200 million annually, thereafter. Abbott expects annual cash flow from operating activities to continue to exceed Abbott’s capital expenditures and cash dividends.
Debt and Capital
At December 31, 2008, Abbott’s long-term debt rating was AA by Standard & Poor’s Corporation and A1 by Moody’s Investors Service. Abbott has readily available financial resources, including unused lines of credit of $5.3 billion that support commercial paper borrowing arrangements of which a $2.3 billion facility expires in December 2009 and a $3.0 billion facility expires in 2012. Abbott’s access to short-term financing has not been affected by the recent credit market conditions.
In 2006, the board of directors authorized the purchase of $2.5 billion of Abbott’s common shares from time to time and no shares were pur-chased under this authorization in 2006. In 2008 and 2007, Abbott purchased approximately 19.0 million of its common shares in each period at a cost of approximately $1.1 billion and $1.0 billion, respec-tively under this authorization. Effective in the fourth quarter of 2008, no more purchases of common shares will be made from the 2006 authorization. In October 2008, the board of directors authorized the purchase of up to $5 billion of Abbott’s common shares from time to time and 146,400 shares were purchased under this authorization in 2008 at a cost of approximately $8 million.
Under a registration statement filed with the Securities and Exchange Commission in February 2006, Abbott issued $3.5 billion of long-term debt in 2007 that matures in 2012 through 2037 with interest rates ranging from 5.15 percent to 6.15 percent. Proceeds from this debt were used to pay down short-term borrowings that were incurred to partially fund the acquisition of Kos Pharmaceuticals Inc. Under the same registration statement, Abbott issued $4.0 billion of long-term debt in 2006 that matures in 2009 through 2016 with interest rates ranging from 5.375 percent to 5.875 percent. Proceeds from this debt were used to pay down domestic commercial paper borrowings that were incurred to partially fund the acquisition of Guidant’s vascular intervention and endovascular solutions businesses.
In 2009, the acquisition of Advanced Medical Optics, Inc., the funding of Abbott’s main domestic pension plan and the payment of long-term debt will be financed with operating cash flow and debt.
Working Capital
Working capital was $5.5 billion at December 31, 2008 and $4.9 billion at December 31, 2007. At December 31, 2006, current liabilities exceeded current assets by approximately $669 million as a result of increased short-term borrowings used to acquire Kos Pharmaceuticals Inc. in December 2006.
Capital Expenditures
Capital expenditures of $1.3 billion in 2008, $1.7 billion in 2007 and $1.3 billion in 2006 were principally for upgrading and expanding manufacturing, research and development, investments in information technology and administrative support facilities in all segments, and for laboratory instruments placed with customers.
Contractual Obligations
The following table summarizes Abbott’s estimated contractual obligations as of December 31, 2008:
Financial Review
(dollars in millions) Payment Due By Period
2014 and
Total 2009 2010-2011 2012-2013 Thereafter
Long-term debt, including current maturities and future interest payments $13,512 $1,467 $2,989 $1,896 $7,160
Operating lease obligations 416 74 122 88 132
Capitalized auto lease obligations 93 31 62 — —
Purchase commitments (a) 4,627 4,328 258 32 9
Other long-term liabilities reflected on the consolidated balance sheet—
Benefit plan obligations 3,048 — 714 777 1,557
Other 1,524 — 1,065 198 261
Total $23,220 $5,900 $5,210 $2,991 $9,119
(a) Purchase commitments are for purchases made in the normal course of business to meet operational and capital expenditure requirements.
Contingent Obligations
Abbott has periodically entered into agreements in the ordinary course of business, such as assignment of product rights, with other compa-nies which has resulted in Abbott becoming secondarily liable for obligations that Abbott was previously primarily liable. Since Abbott no longer maintains a business relationship with the other parties, Abbott is unable to develop an estimate of the maximum potential amount of future payments, if any, under these obligations. Based upon past experience, the likelihood of payments under these agreements is remote. In addition, Abbott periodically acquires a business or product
rights in which Abbott agrees to pay contingent consideration based on attaining certain thresholds or based on the occurrence of certain events. In connection with the acquisition of Guidant’s vascular inter-vention and endovascular solutions businesses, Abbott will pay to Boston Scientific $250 million upon government approval to market the Xience V drug-eluting stent in Japan. Government approval is anticipated in late 2009 or early 2010. In addition, Abbott has retained liabilities for taxes on income prior to the spin-off of Hospira and certain potential liabilities, if any, related to alleged improper pricing practices in connection with federal, state and private reimbursement for certain drugs.

69
Abbott 2008 Annual Report
Financial Review
Performance Graph
Recently Issued Accounting Standards
In 2007, the FASB issued SFAS No. 141 (revised 2007) “Business Combinations” and SFAS No. 160 “Noncontrolling Interests in Consolidated Financial Statements - an amendment of ARB No. 51.” Abbott will adopt these standards on January 1, 2009. Statement No. 141 (revised 2007) will impact Abbott primarily in five areas: acquired in-process research and development will be accounted for as an indefinite lived intangible asset until approval or discontinuation rather than as expense; acquisition costs will be expensed rather than added to the cost of an acquisition; restructuring costs in connection with an acquisition will be expensed rather than added to the cost of an acquisition; the fair value of contingent consideration at the date of an acquisition will be included in the cost of an acquisi-tion; and the fair value of contingent liabilities that are more likely than not of occurrence will be recorded at the date of an acquisition. The effect of these changes will be applicable to acquisitions on or after January 1, 2009. Adoption of Statement No. 160 will not have a material effect on Abbott.
The following graph compares the change in Abbott’s cumulative total shareholder return on its common shares with the Standard & Poor’s 500 Index and the Standard & Poor’s 500 Health Care Index.
Legislative Issues
Abbott’s primary markets are highly competitive and subject to substantial government regulation throughout the world. Abbott expects debate to continue over the availability, method of delivery, and payment for health care products and services. Abbott believes that if legislation is enacted, it could change access to health care products and services, or reduce prices or the rate of price increases for health care products and services. It is not possible to predict the extent to which Abbott or the health care industry in general might be adversely affected by these factors in the future. A more complete discussion of these factors is contained in Item 1, Business, and Item 1A, Risk Factors, to the Annual Report on Form 10-K.
Private Securities Litigation Reform Act of 1995 — A Caution Concerning Forward-Looking Statements
Under the safe harbor provisions of the Private Securities Litigation Reform Act of 1995, Abbott cautions investors that any forward-look-ing statements or projections made by Abbott, including those made in this document, are subject to risks and uncertainties that may cause actual results to differ materially from those projected. Economic, com-petitive, governmental, technological and other factors that may affect Abbott’s operations are discussed in 1A, Risk Factors, to the Annual Report on Form 10-K.
2003 20052004 2006 2007 2008
$150
$100
$50 Abbott Laboratories
S&P 500 Index
S&P 500 Health Care
Assuming $100 invested on 12/31/03 with dividends reinvested.

70
Abbott 2008 Annual Report
Year Ended December 31 2008 2007 2006 2005 2004 2003 2002 2001
Summary of Operations:
Net Sales $29,527.6 25,914.2 22,476.3 22,337.8 19,680.0 17,280.3 15,279.5 13,918.5
Cost of products sold $12,612.0 11,422.0 9,815.1 10,641.1 8,884.2 7,774.2 6,820.5 6,107.1
Research and development (a) $ 2,688.1 2,505.6 2,255.3 1,821.2 1,696.8 1,623.8 1,474.5 1,491.8
Selling, general and administrative $ 8,435.6 7,408.0 6,349.7 5,496.1 4,921.8 4,808.1 3,724.9 3,491.0
Operating earnings $ 5,693.8 4,578.5 2,042.2 4,362.3 3,898.3 2,974.0 3,151.9 1,498.2
Interest expense $ 528.5 593.1 416.2 241.4 200.2 188.3 238.9 307.3
Interest income $ (201.2) (136.8) (123.8) (87.7) (51.1) (41.9) (33.5) (71.4)
Other (income), net $ (489.7) (347.5) (526.5) (411.3) (376.4) (559.5) (374.4) (231.3)
Earnings from continuing
operations before taxes $ 5,856.3 4,469.6 2,276.4 4,619.9 4,125.6 3,387.2 3,321.0 1,493.6
Taxes on earnings from
continuing operations $ 1,122.1 863.3 559.6 1,247.9 949.8 882.4 774.0 215.9
Earnings from continuing operations $ 4,734.2 3,606.3 1,716.8 3,372.1 3,175.8 2,504.7 2,547.0 1,277.7
Basic earnings per share
from continuing operations $ 3.06 2.34 1.12 2.17 2.03 1.60 1.63 0.82
Diluted earnings per share
from continuing operations $ 3.03 2.31 1.12 2.16 2.02 1.59 1.62 0.82
Financial Position:
Working capital $ 5,106.8 4,939.5 (669.3) 3,970.5 3,908.8 2,650.9 2,119.6 492.4
Long-term investments $ 1,073.7 1,125.3 1,229.9 134.0 145.8 406.4 250.8 647.2
Net property and equipment $ 7,219.2 7,518.1 6,946.4 6,003.1 6,007.9 6,281.8 5,828.1 5,551.5
Total assets $42,419.2 39,713.9 36,178.2 29,141.2 28,767.5 26,039.3 23,592.7 22,755.5
Long-term debt $ 8,713.3 9,487.8 7,009.7 4,571.5 4,787.9 3,452.3 4,274.0 4,335.5
Shareholders’ investment $17,479.6 17,778.5 14,054.2 14,415.3 14,325.8 13,072.3 10,664.6 9,059.4
Return on shareholders’ investment
from continuing operations % 26.9 22.7 12.1 23.5 23.8 22.6 28.0 15.9
Book value per share $ 11.26 11.47 9.14 9.37 9.18 8.36 6.82 5.83
Other Statistics:
Gross profit margin % 57.3 55.9 56.3 52.4 54.9 55.0 55.4 56.1
Research and development
to net sales % 9.1 9.7 10.0 8.2 8.6 9.4 9.7 10.7
Net cash from operating activities
of continuing operations $ 6,994.6 5,183.8 5,262.1 5,047.4 4,306.0 3,385.2 3,653.5 3,083.7
Capital expenditures $ 1,287.7 1,656.2 1,337.8 1,207.5 1,291.6 1,050.1 1,105.4 963.6
Cash dividends declared
per common share $ 1.44 1.30 1.18 1.10 1.04 0.98 0.94 0.84
Common shares
outstanding (in thousands) 1,552,433 1,549,910 1,537,243 1,539,235 1,560,024 1,564,518 1,563,068 1,554,530
Number of common shareholders 69,733 73,176 77,727 82,237 88,582 91,212 94,687 97,760
Number of employees 68,838 68,697 66,663 59,735 60,617 58,181 57,819 56,426
Sales per employee (in dollars) $ 428,943 377,225 337,163 373,948 324,662 297,010 264,265 246,668
Market price per share – high $ 61.09 59.50 49.87 50.00 47.63 47.15 58.00 57.17
Market price per share – low $ 45.75 48.75 39.18 37.50 38.26 33.75 29.80 42.00
Market price per share – close $ 53.37 56.15 48.71 39.43 46.65 46.60 40.00 55.75
(a) In 2006, 2005, 2004, 2003, 2002 and 2001 Abbott also recorded pretax charges of $2,014, $17, $279, $100, $108 and $1,330, respectively, for acquired in-process research and
development related to business acquisitions.
Summary of Selected Financial Data(dollars in millions, except per share data)
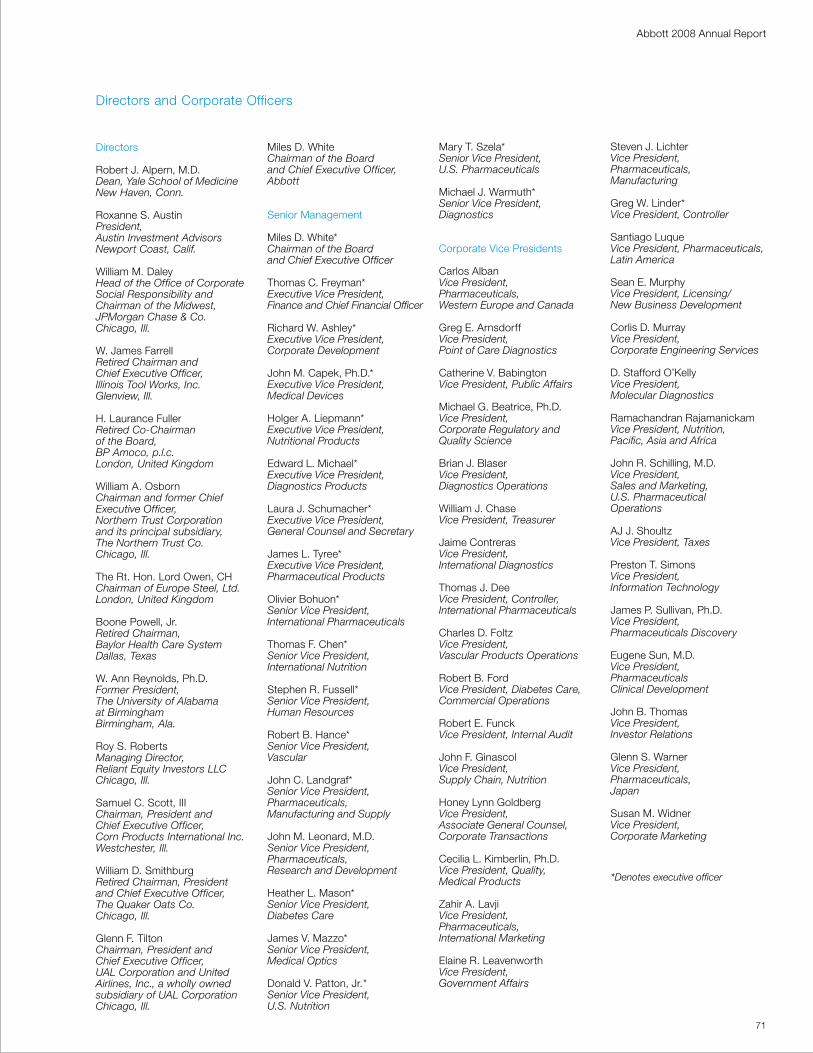
71
Abbott 2008 Annual Report
Directors
Robert J. Alpern, M.D. Dean, Yale School of Medicine New Haven, Conn.
Roxanne S. AustinPresident, Austin Investment AdvisorsNewport Coast, Calif.
William M. DaleyHead of the Office of Corporate Social Responsibility and Chairman of the Midwest, JPMorgan Chase & Co.Chicago, Ill.
W. James Farrell Retired Chairman and Chief Executive Officer, Illinois Tool Works, Inc. Glenview, Ill.
H. Laurance FullerRetired Co-Chairman of the Board, BP Amoco, p.l.c. London, United Kingdom
William A. OsbornChairman and former Chief Executive Officer, Northern Trust Corporation and its principal subsidiary, The Northern Trust Co.Chicago, Ill.
The Rt. Hon. Lord Owen, CHChairman of Europe Steel, Ltd.London, United Kingdom
Boone Powell, Jr.Retired Chairman,Baylor Health Care SystemDallas, Texas
W. Ann Reynolds, Ph.D.Former President, The University of Alabama at BirminghamBirmingham, Ala.
Roy S. RobertsManaging Director, Reliant Equity Investors LLCChicago, Ill.
Samuel C. Scott, IIIChairman, President and Chief Executive Officer, Corn Products International Inc.Westchester, Ill. William D. SmithburgRetired Chairman, President and Chief Executive Officer,The Quaker Oats Co.Chicago, Ill.
Glenn F. TiltonChairman, President and Chief Executive Officer, UAL Corporation and United Airlines, Inc., a wholly owned subsidiary of UAL CorporationChicago, Ill.
Miles D. WhiteChairman of the Boardand Chief Executive Officer,Abbott
Senior Management
Miles D. White* Chairman of the Board and Chief Executive Officer
Thomas C. Freyman*Executive Vice President, Finance and Chief Financial Officer
Richard W. Ashley*Executive Vice President, Corporate Development
John M. Capek, Ph.D.*Executive Vice President, Medical Devices
Holger A. Liepmann*Executive Vice President, Nutritional Products
Edward L. Michael*Executive Vice President, Diagnostics Products
Laura J. Schumacher*Executive Vice President, General Counsel and Secretary
James L. Tyree*Executive Vice President, Pharmaceutical Products
Olivier Bohuon*Senior Vice President, International Pharmaceuticals
Thomas F. Chen*Senior Vice President, International Nutrition
Stephen R. Fussell*Senior Vice President, Human Resources
Robert B. Hance*Senior Vice President, Vascular
John C. Landgraf*Senior Vice President, Pharmaceuticals, Manufacturing and Supply
John M. Leonard, M.D.Senior Vice President, Pharmaceuticals, Research and Development
Heather L. Mason*Senior Vice President, Diabetes Care
James V. Mazzo* Senior Vice President, Medical Optics
Donald V. Patton, Jr. *Senior Vice President, U.S. Nutrition
Mary T. Szela*Senior Vice President, U.S. Pharmaceuticals Michael J. Warmuth*Senior Vice President, Diagnostics
Corporate Vice Presidents
Carlos AlbanVice President, Pharmaceuticals, Western Europe and Canada
Greg E. ArnsdorffVice President, Point of Care Diagnostics
Catherine V. BabingtonVice President, Public Affairs
Michael G. Beatrice, Ph.D.Vice President, Corporate Regulatory and Quality Science
Brian J. Blaser Vice President, Diagnostics Operations
William J. ChaseVice President, Treasurer
Jaime ContrerasVice President, International Diagnostics
Thomas J. DeeVice President, Controller, International Pharmaceuticals
Charles D. FoltzVice President, Vascular Products Operations
Robert B. Ford Vice President, Diabetes Care, Commercial Operations
Robert E. FunckVice President, Internal Audit
John F. Ginascol Vice President,Supply Chain, Nutrition
Honey Lynn Goldberg Vice President, Associate General Counsel, Corporate Transactions
Cecilia L. Kimberlin, Ph.D.Vice President, Quality, Medical Products
Zahir A. LavjiVice President, Pharmaceuticals, International Marketing
Elaine R. LeavenworthVice President, Government Affairs
Steven J. LichterVice President, Pharmaceuticals,Manufacturing
Greg W. Linder*Vice President, Controller
Santiago Luque Vice President, Pharmaceuticals, Latin America
Sean E. MurphyVice President, Licensing/New Business Development
Corlis D. Murray Vice President, Corporate Engineering Services
D. Stafford O’KellyVice President, Molecular Diagnostics
Ramachandran Rajamanickam Vice President, Nutrition, Pacific, Asia and Africa
John R. Schilling, M.D. Vice President, Sales and Marketing, U.S. Pharmaceutical Operations
AJ J. ShoultzVice President, Taxes
Preston T. SimonsVice President, Information Technology
James P. Sullivan, Ph.D. Vice President, Pharmaceuticals Discovery
Eugene Sun, M.D.Vice President, Pharmaceuticals Clinical Development
John B. ThomasVice President, Investor Relations
Glenn S. WarnerVice President, Pharmaceuticals,Japan
Susan M. WidnerVice President, Corporate Marketing
*Denotes executive officer
Directors and Corporate Officers
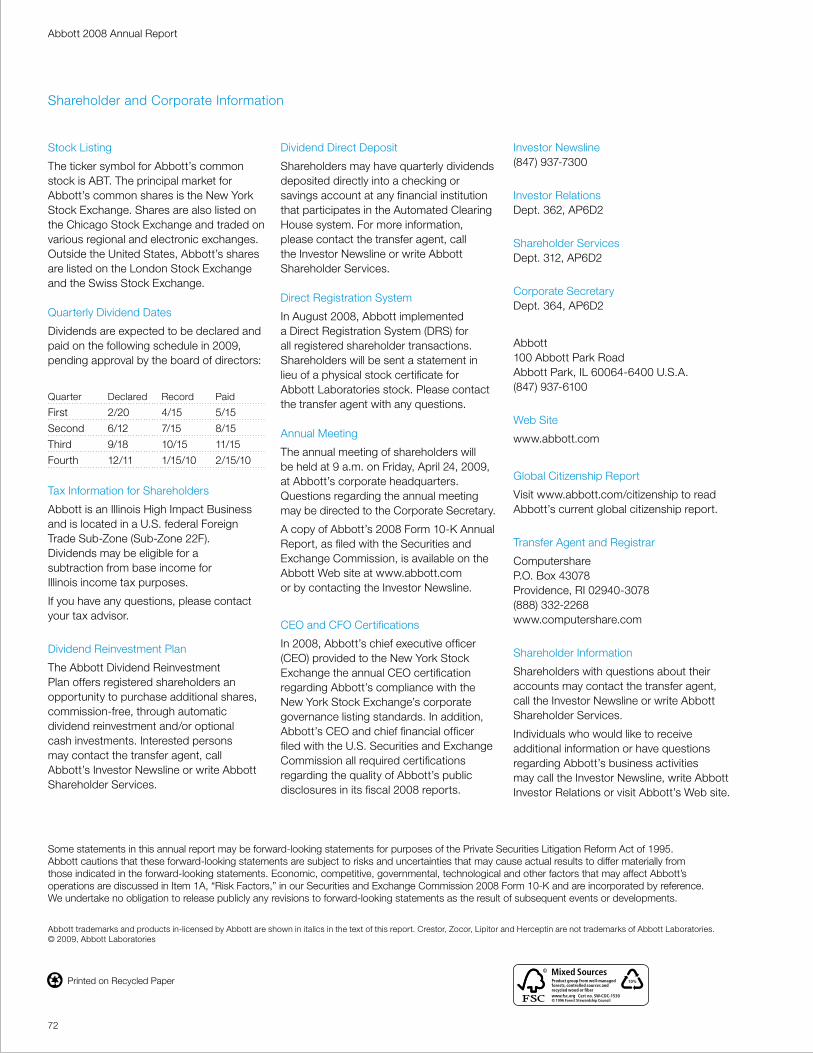
Abbott 2008 Annual Report
72
Shareholder and Corporate Information
Stock Listing
The ticker symbol for Abbott’s common stock is ABT. The principal market for Abbott’s common shares is the New york Stock Exchange. Shares are also listed on the Chicago Stock Exchange and traded on various regional and electronic exchanges. Outside the United States, Abbott’s shares are listed on the London Stock Exchange and the Swiss Stock Exchange.
Quarterly Dividend Dates
Dividends are expected to be declared and paid on the following schedule in 2009, pending approval by the board of directors:
Quarter Declared Record Paid
First 2/20 4/15 5/15
Second 6/12 7/15 8/15
Third 9/18 10/15 11/15
Fourth 12/11 1/15/10 2/15/10
Tax Information for Shareholders
Abbott is an Illinois High Impact Business and is located in a U.S. federal Foreign Trade Sub-Zone (Sub-Zone 22F). Dividends may be eligible for a subtraction from base income for Illinois income tax purposes.
If you have any questions, please contact your tax advisor.
Dividend Reinvestment Plan
The Abbott Dividend Reinvestment Plan offers registered shareholders an opportunity to purchase additional shares, commission-free, through automatic dividend reinvestment and/or optional cash investments. Interested persons may contact the transfer agent, call Abbott’s Investor Newsline or write Abbott Shareholder Services.
Dividend Direct Deposit
Shareholders may have quarterly dividends deposited directly into a checking or savings account at any financial institution that participates in the Automated Clearing House system. For more information, please contact the transfer agent, call the Investor Newsline or write Abbott Shareholder Services.
Direct Registration System
In August 2008, Abbott implemented a Direct Registration System (DRS) for all registered shareholder transactions. Shareholders will be sent a statement in lieu of a physical stock certificate for Abbott Laboratories stock. Please contact the transfer agent with any questions.
Annual Meeting
The annual meeting of shareholders will be held at 9 a.m. on Friday, April 24, 2009, at Abbott’s corporate headquarters. Questions regarding the annual meeting may be directed to the Corporate Secretary.
A copy of Abbott’s 2008 Form 10-K Annual Report, as filed with the Securities and Exchange Commission, is available on the Abbott Web site at www.abbott.com or by contacting the Investor Newsline.
CEO and CFO Certifications
In 2008, Abbott’s chief executive officer (CEO) provided to the New york Stock Exchange the annual CEO certification regarding Abbott’s compliance with the New york Stock Exchange’s corporate governance listing standards. In addition, Abbott’s CEO and chief financial officer filed with the U.S. Securities and Exchange Commission all required certifications regarding the quality of Abbott’s public disclosures in its fiscal 2008 reports.
Investor Newsline(847) 937-7300
Investor RelationsDept. 362, AP6D2
Shareholder ServicesDept. 312, AP6D2
Corporate SecretaryDept. 364, AP6D2
Abbott 100 Abbott Park Road Abbott Park, IL 60064-6400 U.S.A. (847) 937-6100
Web Site
www.abbott.com
Global Citizenship Report
Visit www.abbott.com/citizenship to read Abbott’s current global citizenship report.
Transfer Agent and Registrar
Computershare P.O. Box 43078 Providence, RI 02940-3078 (888) 332-2268 www.computershare.com
Shareholder Information
Shareholders with questions about their accounts may contact the transfer agent, call the Investor Newsline or write Abbott Shareholder Services.
Individuals who would like to receive additional information or have questions regarding Abbott’s business activities may call the Investor Newsline, write Abbott Investor Relations or visit Abbott’s Web site.
Abbott trademarks and products in-licensed by Abbott are shown in italics in the text of this report. Crestor, Zocor, Lipitor and Herceptin are not trademarks of Abbott Laboratories. © 2009, Abbott Laboratories
Printed on Recycled Paper
Some statements in this annual report may be forward-looking statements for purposes of the Private Securities Litigation Reform Act of 1995. Abbott cautions that these forward-looking statements are subject to risks and uncertainties that may cause actual results to differ materially from those indicated in the forward-looking statements. Economic, competitive, governmental, technological and other factors that may affect Abbott’s operations are discussed in Item 1A, “Risk Factors,” in our Securities and Exchange Commission 2008 Form 10-K and are incorporated by reference. We undertake no obligation to release publicly any revisions to forward-looking statements as the result of subsequent events or developments.

74
Abbott 2008 Annual Report
Abbott100 Abbott Park Road, Abbott Park, IL 60064-6400 U.S.A.(847) 937-6100 www.abbott.com