2008 economic impact of i-5 & i-90 highway closures on ... · highway closures on shipping,...
TRANSCRIPT

DATA REPORT 08-016WA-RD 708.3
2008 Economic Impact of I-5 & I-90 Highway Closures on Shipping, Freight,
and Trucking Businesses
A Telephone and Web Survey
Spring 2008
Prepared for
Barbara Ivanov and George Xu Washington State Department of Transportation
Freight Systems Division 310 Maple Park Avenue
Olympia, WA 98504 360-705-7931
Submitted by
.
Danna Moore, Ph.D. Principle Investigator
and Yi Jen Wang, M.A.
Study Director
On behalf of SESRC
SESRCSocial & Economic Sciences Research Center (SESRC)
P.O. Box 644014Washington State University
Pullman, Washington 99164-4014Telephone: (509) 335-1511
Fax: (509) 335-0116
Fr

2008 Economic Impact of I-5 & I-90 Closures SESRC Data Report 08-016 Spring 2008
SESRC Project Profile Title: 2008 Economic Impact of I-5 & I-90 Highway Closures on Shipping,
Freight, and Trucking Businesses Objectives: The purpose of the survey was to obtain information from freight
dependent businesses in Washington state. The survey emphasized costs associated with two weather closures of I-5 and I-90 during December of 2007 and January 2008.
Survey Abstract: In February and March 2008, a sample of 2758 businesses in
Washington State were contacted to help state officials understand the economic impacts of the recent I-5 and I-90 closure. The mix mode survey yielded 1750 completes. Among these completes, 1513 were from the telephone and 237 were from the web.
Survey Method: SESRC contacted 2758 respondents to conduct a 15-minute telephone
interview with the business or transportation manager who was responsible for managing freight shipment decisions at the business location. The sample frame consisted of 2045 companies in trucking businesses and 713 truck licensed registrants in freight dependent sectors. Each case received an average of 9 call attempts over a 4-week period in spring 2008.
Results: Of the 2,758 businesses released into the field, 1513 responded by
telephone and 237 responded by web yielding a 69.6% response rate. The response rate was 69.6% with a sampling error of ± 1.9% at the 95% confidence level for the total sample. The average interview length was 20.5 minutes.
Timeframe: February 2008 to April 2008 Agency Contact: Barbara Ivanov and George Xu
Washington State Department of Transportation Freight Systems Division 310 Maple Park Avenue Olympia, WA 98504 360-705-7931 [email protected]
Contract Number: N/A Funding Source: WSDOT Freight Systems Division Contract Amount: $65,000 Principal Investigator: Danna Moore, Ph.D. Study Director: Yi-Jen Wang, M.A. SESRC Acronym: WAI5 SESRC Number: SC084 Data Report Number: 08-016 OGRD Number: 10246 Deliverables: Data Report, Graphical Summary, SPSS data set, SPSS frequency
listing; an open-ended remarks Excel file, and a copy of the telephone questionnaire and web screenshots.
i

2008 Economic Impact of I-5 & I-90 Closures SESRC Data Report 08-016 Spring 2008
Project Accountability
SESRC is committed to high quality and timely delivery of project results. The following list identifies the SESRC team members responsible for particular elements of this project. 2008 Economic Impact of I-5 & I-90 Closures on Shipping, Freight, and Trucking Businesses
Staff Member Areas of Accountability Elements of Project
Danna Moore Principle Investigator Assurance of survey research
protocol, sample design, project and instruments design, project management and coordination of survey tasks, final report for the contract
Rita Koontz Admn. Services Manager Administration of contract with Washington State University
Yi Jen Wang Study Director Project management and coordination of survey tasks, data report preparation
Marion Schultz Data Collection Manager Supervision of clerical workers, daily reports, assuring quality of interviews
Tony Hernandez Data Collection Supervisors Supervises telephone interviewers, hiring, training, monitoring interviews Jessie Aguilar
Ryan Paulson
Bruce Austin Data Analysis Manager Web programming, data management
Leona Ding Data Analysis Manager CATI programming
ii

2008 Economic Impact of I-5 & I-90 Closures SESRC Data Report 08-016 Spring 2008
SESRC Professional Staff All of the work conducted at the Social & Economic Sciences Research Center is the result of a cooperative effort made by a team of dedicated research professionals. The research in this report could not have been conducted without the efforts of interviewers and part-time personnel not listed. Principal Investigators and Study Directors John Tarnai, Ph.D. Director Don A. Dillman, Ph.D. Deputy Director for Research & Development Danna L. Moore, Ph. D. Associate Director Dave Pavelchek, M.P.A. Sr. Research Manager, Olympia Kyra Kester, Ph.D. Sr. Research Associate, Olympia Paul Stern, M.A. Sr. Research Associate, Vancouver Rose Krebill-Prather, Ph. D. Research Associate Kirby Pitman, MA Research Associate, Vancouver Kent Miller, M.A. Study Director/Mail Survey Manager Thom Allen, B.A. Study Director/Web Programmer Yi Jen Wang, M.A. Study Director Administrative Support Rita Koontz Department Administrative Manager Sandy Johnson Fiscal Specialist II Jessanne Price Fiscal Analyst I Lisa Brooks, B.A. Social Scientific Assistant, Olympia Vanessa Jodway Social Scientific Assistant, Olympia Data Collection and Interviewer Supervision Marion K. Schultz, M.A Data Collection Manager Tony Hernandez, B.A. Research Survey Supervisor Jessie Aguilar Research Survey Supervisor Ryan Paulson Research Survey Supervisor Pat Slinkard Survey Assistant Data Management, Analysis, and Network Support
Nikolay Ponomarev, Ph. D. Sr. Research Programmer/Database Architect Bruce Austin, M.S. Information Systems Coordinator/Data Analyst Leona Ding, M.S. Information Systems Coordinator/Data Analyst Vincent Kok, B.A. Information Systems Coordinator/Network Administrator David Schultz, B.S. Information Systems Coordinator/Data Analyst Dan Vakoch, M.S. Information Systems Coordinator/Data Analyst Jack Ambrose, B.S. Systems Analyst/Programmer Margaret Card, B.S. Research Associate, Olympia Candiya Mann, M.A. Research Associate, Olympia
iv

2008 Economic Impact of I-5 & I-90 Closures SESRC Data Report 08-016 Spring 2008
iv
Table of Contents SESRC Project Profile .......................................................................................... i Project Accountability............................................................................................ii SESRC Professional Staff....................................................................................iii I. SURVEY ADMINISTRATION AND DESIGN Background and Objectives .................................................................... 1 Population and Sample ........................................................................... 1 Questionnaire Design.............................................................................. 2 II. SURVEY IMPLEMENTATION AND PROCEDURES Human Subjects Research Review ......................................................... 2 Pretest ................................................................................................... 3 Interviewer Training................................................................................. 3 Telephone Interviews .............................................................................. 3 Interviewer Monitoring ............................................................................. 4 Data Collection........................................................................................ 4 Web Survey Instrument........................................................................... 5 Data Management................................................................................... 5 III. CASE DISPOSITIONS AND RESPONSE RATES Response Rates...................................................................................... 7 Sampling Error ...................................................................................... 10 IV. DESCRIPTION OF THE DATA Numeric Data File ................................................................................. 11 Open-Ended Comments File ................................................................. 11 V. SURVEY RESULTS Frequency Listing.................................................................................. 12 Crosstabs of Categorical Variables with Imputation .............................. 89 VI. SURVEY DOCUMENTATION Web Survey screenshots .................................................................... 154 CATI Questionnaire Script................................................................... 211 Supporting Interviewer Materials ......................................................... 250 APPENDIX A. Human Subjects Approval Letter ......................................... 253 List of Tables Table Page
1. Total Sample Disposition................................................................... 8 2. File Names and Description .............................................................. 113. Generic Example of the Remarks Data ............................................. 11

2008 Economic Impact of I-5 & I-90 Closures SESRC Data Report 08-016 Spring 2008
1
I. SURVEY ADMINISTRATION AND DESIGN
Background and Objectives
In Spring of 2008 the Social and Economic Sciences Research Center (SESRC) at Washington
State University administered a mixed mode survey of shipping, receiving, and trucking
businesses for the Washington State Department of Transportation (WSDOT). The mixed mode
survey approach involves a combination of telephone survey and Internet survey methods.
The purpose of the survey was to obtain information from companies in the trucking industry and
companies designated as freight dependent sectors who also own commercial trucks with
emphasis of those businesses reliant on Interstate-5 through Southwest Washington and
Interstate-90 transportation which connects Eastern and Western Washington through the
Cascade mountain pass. WSDOT plans to use this information to inform decisions with regard to
highway transportation and alternatives associated with specific highway closure.
The project began in February 2008 and was completed on March 26th, 2008. This report
describes the procedures and results of this study.
Population and Sample The population for the survey consisted of all businesses in trucking industries registered in the
State of Washington and companies in freight dependent sectors designated also as owning and
operating trucks as a business activity in Washington State. The listed survey sample included a
total of 2,758 businesses and was provided by WSDOT to SESRC. Among these, 2,045 were
businesses in trucking industries (NAIC88) and 713 were from businesses in freight dependent
sectors (NAIC 11, 23, 31, 32, 33, 42, 44, and 45) that also own commercial trucks.
The SESRC received the initial listed sample frame of 4,897 businesses on February 4th, 2008
from WSDOT. This sample frame contained random probability samples from 7 industry
classifications overlaid with 7 regions of Washington. After the initial telephone pretest of 100
cases conducted on February 19th, a decision to change the sampling strategy was made due to
a high number of ineligible cases from the pretest results. The new sampling strategy was to
focus the population from area businesses to companies in the trucking industry and companies
in freight dependent sectors who also own commercial trucks. This decision narrowed the initial
sample frame down from 4,897 to 2,758 businesses.

2008 Economic Impact of I-5 & I-90 Closures SESRC Data Report 08-016 Spring 2008
2
Questionnaire Design
The SESRC worked in collaboration with Barbara Ivanov and George Xu at Washington State
Department of Transportation, Freight Systems Division to develop and finalize the questionnaire
used for this survey.
The goal was to design a survey that would comprise a 15 minute interview. The final script
contained 216 questions, of which 92 had open-ended response components. The SESRC then
programmed the script into SESRC’s Computer Assisted Telephone Interviewing (CATI) system.
The CATI program also facilitates the sample administration during the project calling period.
The CATI was tested by SESRC staff members and WSDOT representatives. The final survey
script with revisions was completed on February 25th, 2008. A web survey option was developed
and utilized to give to respondents an option as to how they preferred to complete the survey.
The web option was also used to provide interviewers with a strategy to convert refusals to the
phone survey. The final Internet version contained 119 screens including an introductory screen
and a survey completion screen.
The web survey option was provided to all 2,758 respondents in the sample at the beginning of
the study. The SESRC sent out 440 prior notification letters to businesses in trucking sectors in
the initial sample via first class mail on February 20th, 2008. It asked them to complete the
survey on line. The SESRC also sent out 2,318 prior letters to the businesses (NAIC 11, 23, 31,
32, 33, 42, 44, and 45) in the new sample frame on February 27th, 2008. The prior letter
explained the purpose of the survey and contained the web survey link and a unique access
code. A copy of both the telephone interview script and the web screenshots can be found at the
end of this report.
II. SURVEY IMPLEMENTATION AND PROCEDURES
Human Subjects Review
The SESRC submitted the project design and questionnaire to the Institutional Review Board at
Washington State University (WSU-IRB) for review of human subjects procedures and
compliance with federal regulations. The materials were submitted on February 5th, 2008 and
approved by the WSU-IRB # 10246-001 on February 6th, 2008. An IRB amendment was
submitted on February 25th for the revisions of the sampling frame and the approval was received
on February 27th with the reference as: WSU-IRB # 10246-002.

2008 Economic Impact of I-5 & I-90 Closures SESRC Data Report 08-016 Spring 2008
3
Pretest A pretest interview with 100 respondents from the first sample frame was conducted on February
19th, 2008. Due to an unusually high number of ineligible cases, one question was added asking
if the business was impacted by the I-5 or I-90 closures this winter and clarifications in the
wording of several questions were made as slight modifications in the CATI and web
questionnaires. A second pretest was conducted on February 21st, 2008 targeting the
businesses in trucking sectors most likely impacted by the I-5 and I-90 closures. At the
conclusion of both pretests debriefings were held with interviewers and monitors to summarize
the issues that occurred during the pretests. WSDOT representatives were made aware of the
outcomes and given the opportunity to provide feedback. The pretest result proved that targeting
the businesses in trucking sectors rendered a much better level of cooperation and yielded
respondents knowledgable of closure impacts and costs. Only the data from the 2nd pretest were
included in the final dataset.
Interviewer Training
The project training for full study interviewers was held on February 26th, 2008. All interviewers
received 8 hours of basic interviewing training and then 1 to 2 hours additional project specific
training as practice. The information specific to this project was introduced to the team of 26
experienced interviewers during the project training. The training included background
information and the purpose of the study, definitions, and a review of the questions and content of
the survey. In addition, interviewers practiced a minimum of one hour on the CATI questionnaire
before calling on the actual survey. The SESRC Study Director attended and lead this specific
project training and fielded questions and addressed concerns about study related issues that
arose during the training. At all times during the course of training and project calling, at least
one supervisor was present and available to provide quality control and to respond to
interviewers’ needs and questions.
Telephone Interviews
The full study calling began on February 26th, 2008 and was completed on March 26th, 2008.
Interviewers asked to speak with the person in the company who would know the most about the
impact and costs of the I-5 and I-90 closures for their trucking and business. All cases received
an average of 9 call attempts over the 4-week period in spring 2008. These call attempts
alternated days of the week and time of the day. If an interviewer called at an inconvenient time
for the respondent, the interviewer attempted to schedule a specific time to re-contact the
business for an interview. The average interview length for the survey was 20.5 minutes. The

2008 Economic Impact of I-5 & I-90 Closures SESRC Data Report 08-016 Spring 2008
4
shortest interview was 6 minutes and the longest 50 minutes. By the end of the calling period
interviewers had completed or partial completed interviews with 1513 respondents.
Interviewer Monitoring
To maintain data quality and continuity in the telephone data collection process, interviewer
performance was regularly monitored and measured. SESRC’s current standard is to monitor all
interviewers at least once a week during a day or night shift. One of the main purposes of
monitoring is to minimize interviewer effects. Interviewers are scored on specific factors that
measure proper interviewing techniques. The two principles that guide the training and scoring of
interviews are: (1) respondents should receive information that is delivered by the interviewer in
an unbiased manner; and (2) every respondent should receive the same stimulus from each
interviewer. These principles translate into five basic interviewing rules that are used as factors
by the monitor for scoring an interview:
Rule 1: The reading of each question is exactly as it is written and in the order in which it appears in the questionnaire.
Rule 2: A slow reading pace. Rule 3: Standard neutral feedback phrases such as “Thank you. That’s important
information” or “I see” are given as acceptable responses. Rule 4: Standard neutral cues or probes such as “Could you tell me more about that” or
“Which would be closer to the way you feel?” are given to the respondent to help him/her give more complete answers to questions.
Rule 5: Accurate recording of all responses.
Data Collection
The SESRC employed a dialing protocol that provides a maximum of 10 attempts for every
telephone number in the sample. If the initial attempt results in a no answer, this was noted in the
CATI call-record for that case, and the case was scheduled for a call on the next morning of
interviews. If the second attempt was unsuccessful, then the case was scheduled for a morning
call two days later. If after three attempts, no one has been reached, an afternoon attempt was
scheduled. If that was also unsuccessful, then an evening attempt is scheduled. A similar dialing
protocol was used when appointments were made by interviewers to speak with specific
respondents and the respondent was unavailable when the call was made. The SESRC regularly
monitored records of the disposition of all sample cases in the survey.

2008 Economic Impact of I-5 & I-90 Closures SESRC Data Report 08-016 Spring 2008
5
Web Survey Instrument The online survey instrument and the resulting hosted web site was designed using Macromedia
Dreamweaver MX software. The pages were coded using a combination of standard HTML 4.01,
JavaScript for client-side controls and ASP.Net (Active Server Pages) technology for server side
controls. The instrument was deployed to SESRC’s web server and connected to an SQL Server
database.
The layout of each screen was designed using TDM1 (Tailored Design Method) protocols for
maximizing respondent comprehension and ease of navigation with online forms. All screens
were constructed with HTML tables using proportional widths in order to maintain the visual
aspect of the screen regardless of individual user window sizes. In addition, font size and style
were automatically adjusted using CSS (Cascading Style Sheets) to accommodate differing user
screen resolutions.
Programming began on the survey site on February 8th, 2008 with a first draft available for
testing on February 11th, 2008. Testing of the site with some changes and adjustments were
made with a final version achieved on February 14th, 2008. The first respondents to access the
site began completing surveys on February 19, 2008 and data was continually collected until
March 26th, 2008. A total of 237 respondents from full study sample completed or partially
completed the survey during this survey period.
Data Management
All telephone interviews were conducted from the Public Opinion Laboratory (POL) of SESRC
using a Computer-Assisted Telephone Interviewing (CATI) system from the Voxco Co. The CATI
system displays survey questions on a computer monitor from which the interviewer can read the
question to the respondent and then enter the response directly into the CATI database for
storage on the server computer.
Two separate data validation steps were conducted for the telephone survey. The first data
validation step occurred via the computer software used for conducting telephone interviews.
Data validation during the interview was handled by the computer assisted telephone interview
system (CATI). The system prompted interviewers for a valid response to every question in the
survey. For numeric questions, legitimate ranges of responses were entered into the computer
so that the computer could detect out-of-range values. When these were detected during the
1 Dillman, D.A. (2007). Mail and Internet Surveys: The Tailored Design Method 2007 Update with New Internet, Visual, and Mixed-Mode Guide, New Jersey, Wiley.
2008 Economic Impact of I-5 & I-90 Closures SESRC Data Report 08-016 Spring 2008
6
interview, the computer warned the interviewer that the entered value were out of range and
prompted the interviewer for a legitimate response.
The second validation step took place at the data management step. Data validation at the data
management step consisted primarily of accounting for all cases in the survey, and ensuring that
a data record existed for every completed interview in the sample. Data records were passed
through a statistical (SPSS) program to ensure that all data fields were readable, and that all
fields were read in the format specified for that variable. A separate data-cleaning step was also
undertaken for the open-ended verbatim responses. These responses were reviewed and spell-
checked for readability. Data files were collected at the conclusion of the survey and archived to
a CD and also saved in the project server for permanent storage at SESRC. The telephone interview data and data from the web completes have two different databases.
Intermediate datasets for the web survey were made available to the research team via SESRC’s
project management website. The site is accessible to Internet Explorer or Mozilla Firefox
browsers and a double set of access codes and passwords are needed to gain access to the site.
It allows the project team members to view a real-time report of completed surveys and partially
completed surveys by date. Intermediate datasets could be downloaded from the site at any
time.
2008 Economic Impact of I-5 & I-90 Closures SESRC Data Report 08-016 Spring 2008
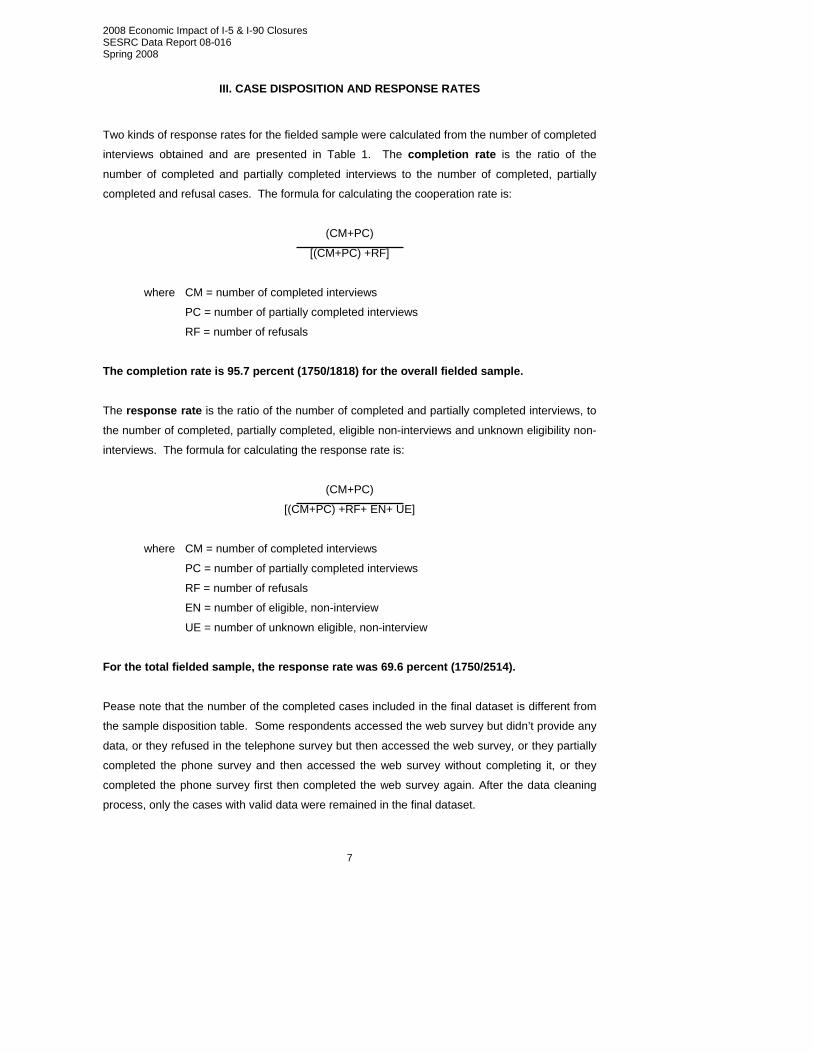
III. CASE DISPOSITION AND RESPONSE RATES Two kinds of response rates for the fielded sample were calculated from the number of completed
interviews obtained and are presented in Table 1. The completion rate is the ratio of the
number of completed and partially completed interviews to the number of completed, partially
completed and refusal cases. The formula for calculating the cooperation rate is:
(CM+PC)
[(CM+PC) +RF]
7
where CM = number of completed interviews
PC = number of partially completed interviews
RF = number of refusals
The completion rate is 95.7 percent (1750/1818) for the overall fielded sample. The response rate is the ratio of the number of completed and partially completed interviews, to
the number of completed, partially completed, eligible non-interviews and unknown eligibility non-
interviews. The formula for calculating the response rate is:
(CM+PC)
[(CM+PC) +RF+ EN+ UE]
where CM = number of completed interviews
PC = number of partially completed interviews
RF = number of refusals
EN = number of eligible, non-interview
UE = number of unknown eligible, non-interview
For the total fielded sample, the response rate was 69.6 percent (1750/2514).
Pease note that the number of the completed cases included in the final dataset is different from
the sample disposition table. Some respondents accessed the web survey but didn’t provide any
data, or they refused in the telephone survey but then accessed the web survey, or they partially
completed the phone survey and then accessed the web survey without completing it, or they
completed the phone survey first then completed the web survey again. After the data cleaning
process, only the cases with valid data were remained in the final dataset.

2008 Economic Impact of I-5 & I-90 Closures SESRC Data Report 08-016 Spring 2008
8
Table 1. Total Sample Disposition Category Total Eligible, Interviewed Completed AND Impacted by I-5 and I-90 closures 272 Partially Completed AND Impacted by closures 18 Web Completes 237 Completed but NOT Impacted by the I-5 or I-90 closures2
999 Duplicate (multiple site cases)3
224 subtotal 1750
Eligible, Non-Interview, Business reached Refusal and break off (includes companies with policy not do surveys) 68 Contacted, but status unresolved (CB, GB, HB, WB) 195 Respondent Never Available 8 Physically or mentally unable /incompetent 0 Language 11 subtotal 282
Unknown eligibility, Non-interview, Business not reached Always busy 4 No answer 57 Telephone answering machine 279 Left answering message 10 Missing phone number 0 Wrong number 66 Electronic devices 32 Call cannot be completed as dialed 32 Blocked call 2 subtotal 482
Known Ineligible, Business reached Disconnected 95 Out of business 17 Other cases 1 Ineligibles (Q1=No)4
131 subtotal 244Total Sample Received 2758
Rate Calculations Completion Rate (Completes + Partial Completes)/(Completes + Partial Completes+ Refusals) 96.3%Response Rate (Completes + Partial Completes)/Completes + Partial Completes + Known Eligible + Unknown Eligible) 69.6%
2 Indicated business was eligible but was not impacted by I-90 or I-5 closures 3 Multiple site businesses answered by HQ person. Weighted by respondent in data provided. 4 Business indicated it was not freight dependent even though initially identified by WSDOT as freight dependent business.
Comment [kent1]: I changed the descriptions of your categories in the Eligible, Interviewed section.

2008 Economic Impact of I-5 & I-90 Closures SESRC Data Report 08-016 Spring 2008
Sampling Error
Sampling error is a measure of the degree to which a randomly selected sample of respondents
represents the population from which it is drawn. Sampling error also is the basis upon which
tests of statistical significance are calculated. One formula for calculating the sample error for a
proportion at the 95% confidence level is presented below, and this can be used to calculate the
sample error for survey results in this report.
SEpq N n
=−⎛ ⎞
n N− ⎝⎜ ⎠⎟21( )
Where: SE= sampling error
p = proportion of “yes” responses for a specific question
q = proportion of “no” responses for a specific question
n = sample size = number of completed interviews for a specific questions
N = population size for the survey
For this survey, completed interviews were obtained from 1750 of 2045 estimated businesses in
trucking industry plus 26905 other freight sectors truck owners, yielding a margin of error of about
± 1.9% at the 95 percent confidence level.
9
5 Source: sample was provided by Washington State Transportation Freight Systems Division. For Washington State the population is 2045. The total number of the freight sectors truck owners (excluding truck owners in trucking industry) registered in Washington State is 2690.

2008 Economic Impact of I-5 & I-90 Closures SESRC Data Report 08-016 Spring 2008
10
IV. DESCRIPTION OF THE DATA
Numeric Data File The numeric data is saved in an SPSS system file named WAI5 Final dataset.sav with labels and
value labels. A frequency listing word file and a file of cross-tabulated tables are included. The
listings were generated using the SPSS program.
Table 2. File names and Descriptions
File DESCRIPTION WAI5 Final Dataset.sav SPSS file WAI5 Open Ends Web and Phone.xls Open-ended comments WAI5 Data Report.doc Data report document WAI5 Web Survey Sceenshot.doc Survey screenshot documents WAI5 Frequency Listing.doc Frequency listing WAI5 Graphical Summary.doc Summary report with graphs documents
Missing values through out the data are indicated by ‘-1’ (Don’t know), ‘-2’ (Refused), and ‘.’
(system missing, indicating automatic branching over a question according to a previous skip
instruction).
Open-Ended Comments The remarks data, named WAI5 Open Ended Comments.xls, corresponding to the open-ended
questions in this survey are sorted by question number and then by identification number. The
WSU identification number is the first number, followed by survey mode and the question
number, and then by the open-ended remarks. An example is shown below:
Table 3. Generic Example of the Remarks Data 99999 Phone Question # This is an example of the open-ended remark text
format that is in the remarks data file
PLEASE NOTE: Only the open-ended comments from the phone completes have been
minimally edited. The files were run through a spell check, and any obvious references to
individuals were deleted. The open-ended comments from the web completes have been
reviewed but have not been edited. The files were not run through a spell check. The goal was
to deliver verbatim on the web survey without any identifying information. However, the data
would remain strictly confidential. The open ended comment data should be treated as
confidential information and printed for release only after careful review and necessary editing.
2008 Economic Impact of I-5 & I-90 Closures SESRC Data Report 08-016 Spring 2008
11
V. SURVEY RESULTS
WAI5 Final Frequency Listing
Contents Page Sample Statistics.......................................................................................................................... 12
19215078828692
111132
Introductory Survey Questions.................................................................................................... I-5 Closure................................................................................................................................... I-90 Closure................................................................................................................................. General Company Demographics ............................................................................................... Variables with Imputations ......................................................................................................... Categorical Variables with Imputations ...................................................................................... Crosstabs of Categorical Variables with Imputations ................................................................. Q21 Series Tables (I-5) ............................................................................................................. Q55 Series Tables (I-90) ...........................................................................................................
2008 Economic Impact of I-5 & I-90 Closures SESRC Data Report 08-016 Spring 2008
12
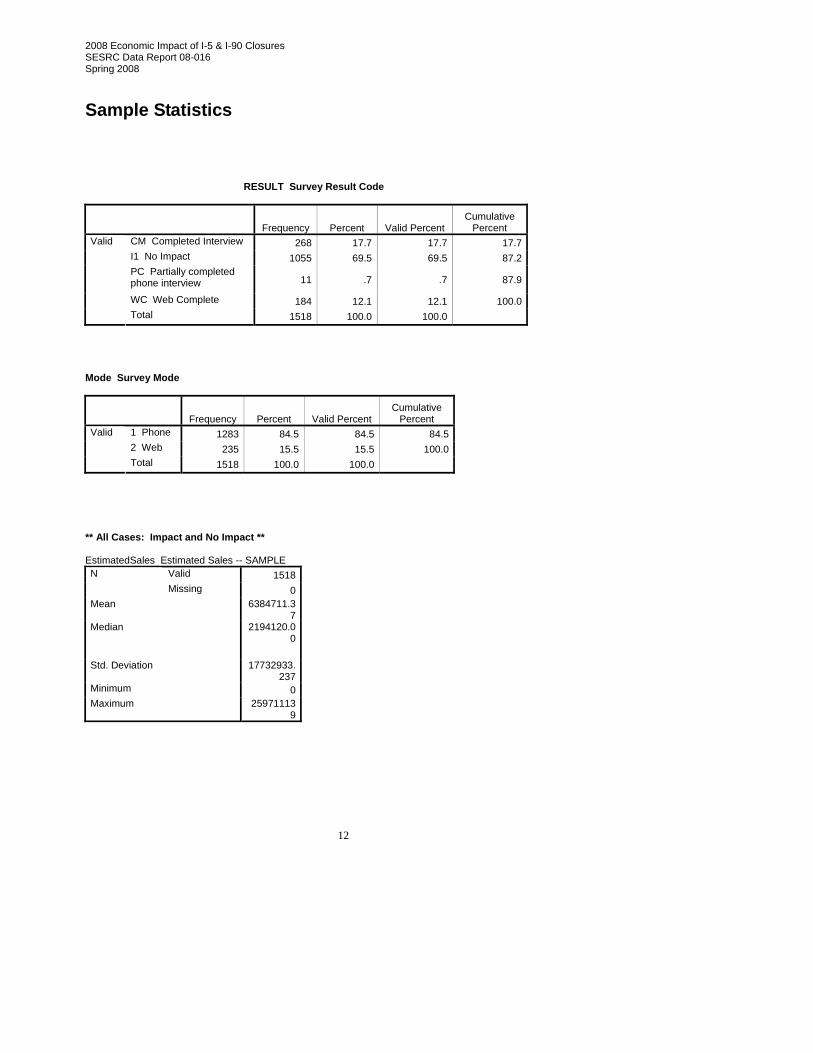
Sample Statistics RESULT Survey Result Code
Frequency Percent Valid Percent Cumulative
Percent CM Completed Interview 268 17.7 17.7 17.7I1 No Impact 1055 69.5 69.5 87.2PC Partially completed phone interview 11 .7 .7 87.9
WC Web Complete 184 12.1 12.1 100.0
Valid
Total 1518 100.0 100.0 Mode Survey Mode
Frequency Percent Valid Percent Cumulative
Percent 1 Phone 1283 84.5 84.5 84.52 Web 235 15.5 15.5 100.0
Valid
Total 1518 100.0 100.0 ** All Cases: Impact and No Impact ** EstimatedSales Estimated Sales -- SAMPLE
Valid 1518 N Missing 0
Mean 6384711.37
Median 2194120.00
Std. Deviation 17732933.
237 Minimum 0 Maximum 25971113
9

2008 Economic Impact of I-5 & I-90 Closures SESRC Data Report 08-016 Spring 2008
13
NAICS First 2 digits of NAICS Code – SAMPLE ** Population **
Frequency Percent Valid Percent Cumulative
Percent 11 29 1.0 1.0 1.023 118 4.1 4.1 5.131 42 1.5 1.5 6.632 56 2.0 2.0 8.633 41 1.4 1.4 10.042 252 8.8 8.8 18.844 255 8.9 8.9 27.745 20 .7 .7 28.448 2045 71.6 71.6 100.0
Valid
Total 2858 100.0 100.0
NAICS First 2 digits of NAICS Code -- SAMPLE ** Fully Completed IMPACT Cases **
Frequency Percent Valid Percent Cumulative
Percent 11 4 .9 .9 .923 3 .6 .6 1.531 14 3.0 3.0 4.532 8 1.7 1.7 6.333 7 1.5 1.5 7.842 46 9.9 9.9 17.744 18 3.9 3.9 21.645 4 .9 .9 22.548 359 77.5 77.5 100.0
Valid
Total 463 100.0 100.0

2008 Economic Impact of I-5 & I-90 Closures SESRC Data Report 08-016 Spring 2008
14
emp_count Categorical Employee Count)
** Population **
Frequency Percent Valid Percent Cumulative
Percent 1 Less than 10 1606 56.2 56.2 56.22 10 - 19 429 15.0 15.0 71.23 20 - 29 220 7.7 7.7 78.94 30 - 39 148 5.2 5.2 84.15 40 - 49 81 2.8 2.8 86.96 50 and Over 374 13.1 13.1 100.0
Valid
Total 2858 100.0 100.0
emp_count Categorical Employee Count) ** Fully Completed IMPACT Cases **
Frequency Percent Valid Percent Cumulative
Percent 1 Less than 10 201 43.4 43.4 43.42 10 - 19 79 17.1 17.1 60.53 20 - 29 71 15.3 15.3 75.84 30 - 39 33 7.1 7.1 82.95 40 - 49 15 3.2 3.2 86.26 50 and Over 64 13.8 13.8 100.0
Valid
Total 463 100.0 100.0

2008 Economic Impact of I-5 & I-90 Closures SESRC Data Report 08-016 Spring 2008
15
sales Categorical Sales Estimate
** Population **
Frequency Percent Valid Percent Cumulative
Percent 1 Less than 1400000 1063 37.2 37.2 37.22 1400000 to < 2800000 599 21.0 21.0 58.23 2800000 to < 6600000 590 20.6 20.7 78.84 6600000 to < 50000000
545 19.1 19.1 97.9
5 50000000 and Over 60 2.1 2.1 100.0
Valid
Total 2857 100.0 100.0 Missing System 1 .0 Total 2858 100.0
sales Categorical Sales Estimate ** Fully Completed IMPACT Cases **
Frequency Percent Valid Percent Cumulative
Percent 1 Less than 1400000 115 24.8 24.8 24.82 1400000 to < 2800000 117 25.3 25.3 50.13 2800000 to < 6600000 119 25.7 25.7 75.84 6600000 to < 50000000
100 21.6 21.6 97.4
5 50000000 and Over 12 2.6 2.6 100.0
Valid
Total 463 100.0 100.0
2008 Economic Impact of I-5 & I-90 Closures SESRC Data Report 08-016 Spring 2008
16
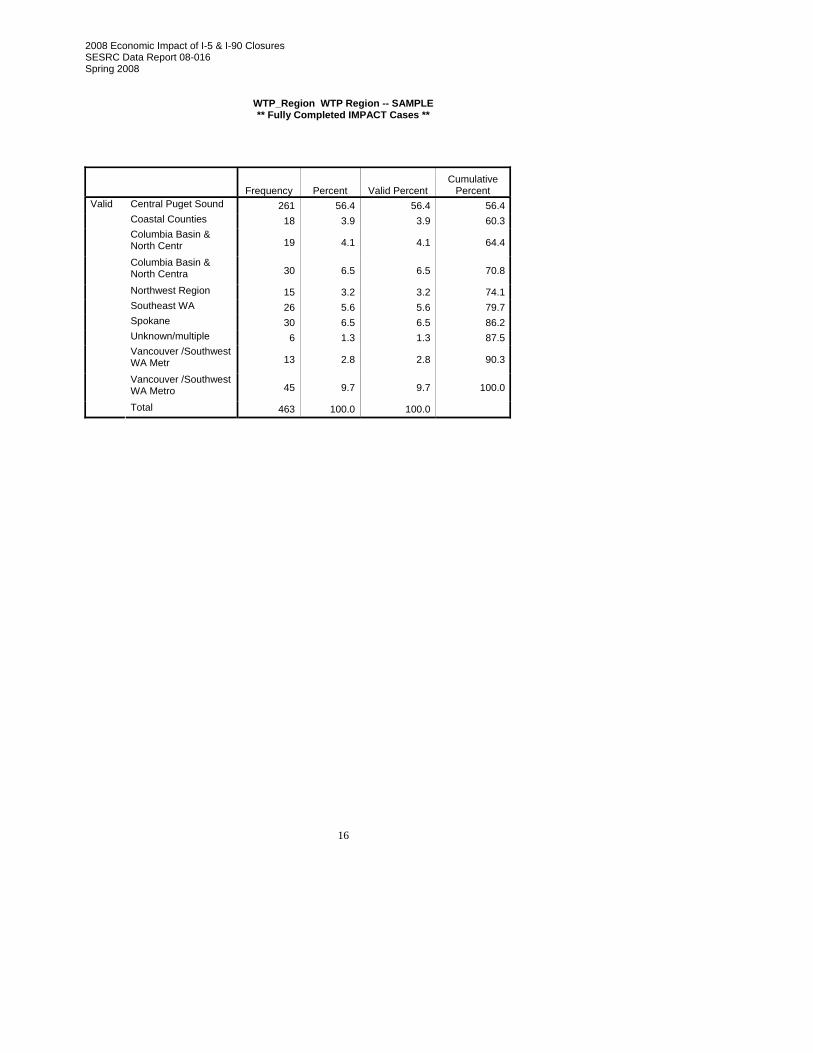
WTP_Region WTP Region -- SAMPLE ** Fully Completed IMPACT Cases **
Frequency Percent Valid Percent Cumulative
Percent Central Puget Sound 261 56.4 56.4 56.4Coastal Counties 18 3.9 3.9 60.3Columbia Basin & North Centr 19 4.1 4.1 64.4
Columbia Basin & North Centra 30 6.5 6.5 70.8
Northwest Region 15 3.2 3.2 74.1Southeast WA 26 5.6 5.6 79.7Spokane 30 6.5 6.5 86.2Unknown/multiple 6 1.3 1.3 87.5Vancouver /Southwest WA Metr 13 2.8 2.8 90.3
Vancouver /Southwest WA Metro 45 9.7 9.7 100.0
Valid
Total 463 100.0 100.0
2008 Economic Impact of I-5 & I-90 Closures SESRC Data Report 08-016 Spring 2008
17
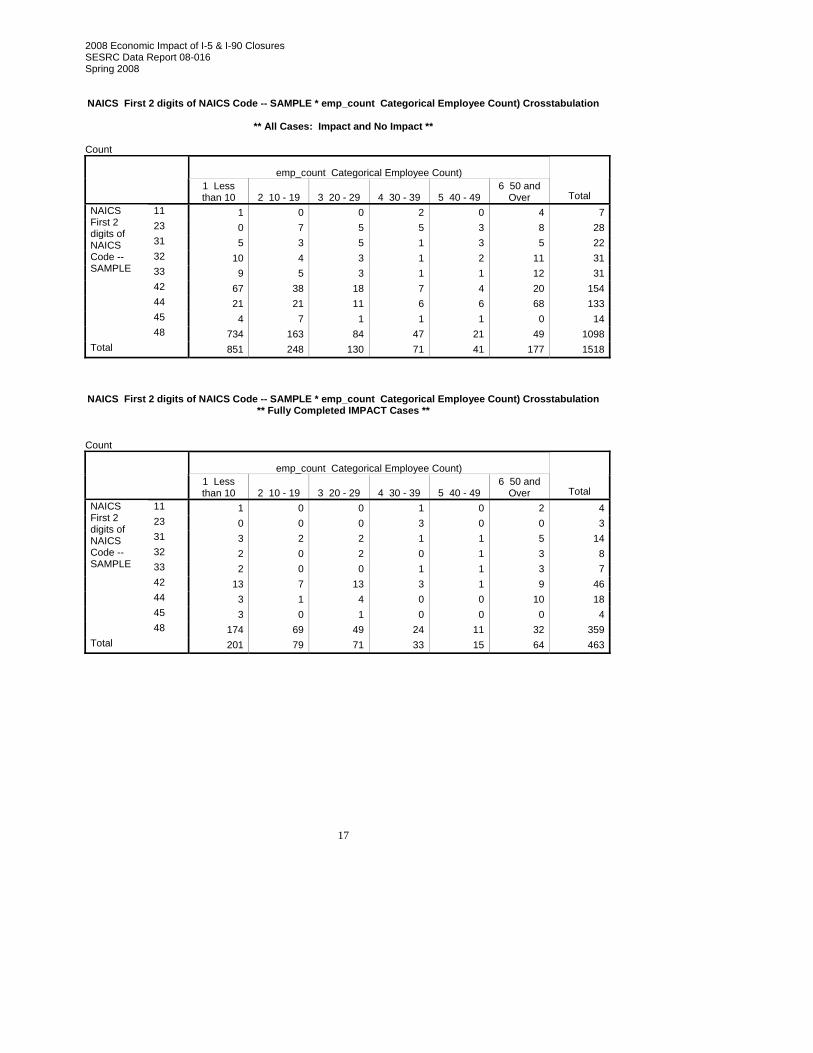
NAICS First 2 digits of NAICS Code -- SAMPLE * emp_count Categorical Employee Count) Crosstabulation
** All Cases: Impact and No Impact **
Count
emp_count Categorical Employee Count)
1 Less than 10 2 10 - 19 3 20 - 29 4 30 - 39 5 40 - 49
6 50 and Over Total
11 1 0 0 2 0 4 7 23 0 7 5 5 3 8 28 31 5 3 5 1 3 5 22 32 10 4 3 1 2 11 31 33 9 5 3 1 1 12 31 42 67 38 18 7 4 20 154 44 21 21 11 6 6 68 133 45 4 7 1 1 1 0 14
NAICS First 2 digits of NAICS Code -- SAMPLE
48 734 163 84 47 21 49 1098 Total 851 248 130 71 41 177 1518
NAICS First 2 digits of NAICS Code -- SAMPLE * emp_count Categorical Employee Count) Crosstabulation
** Fully Completed IMPACT Cases ** Count
emp_count Categorical Employee Count)
1 Less than 10 2 10 - 19 3 20 - 29 4 30 - 39 5 40 - 49
6 50 and Over Total
11 1 0 0 1 0 2 4 23 0 0 0 3 0 0 3 31 3 2 2 1 1 5 14 32 2 0 2 0 1 3 8 33 2 0 0 1 1 3 7 42 13 7 13 3 1 9 46 44 3 1 4 0 0 10 18 45 3 0 1 0 0 0 4
NAICS First 2 digits of NAICS Code -- SAMPLE
48 174 69 49 24 11 32 359 Total 201 79 71 33 15 64 463
2008 Economic Impact of I-5 & I-90 Closures SESRC Data Report 08-016 Spring 2008
18
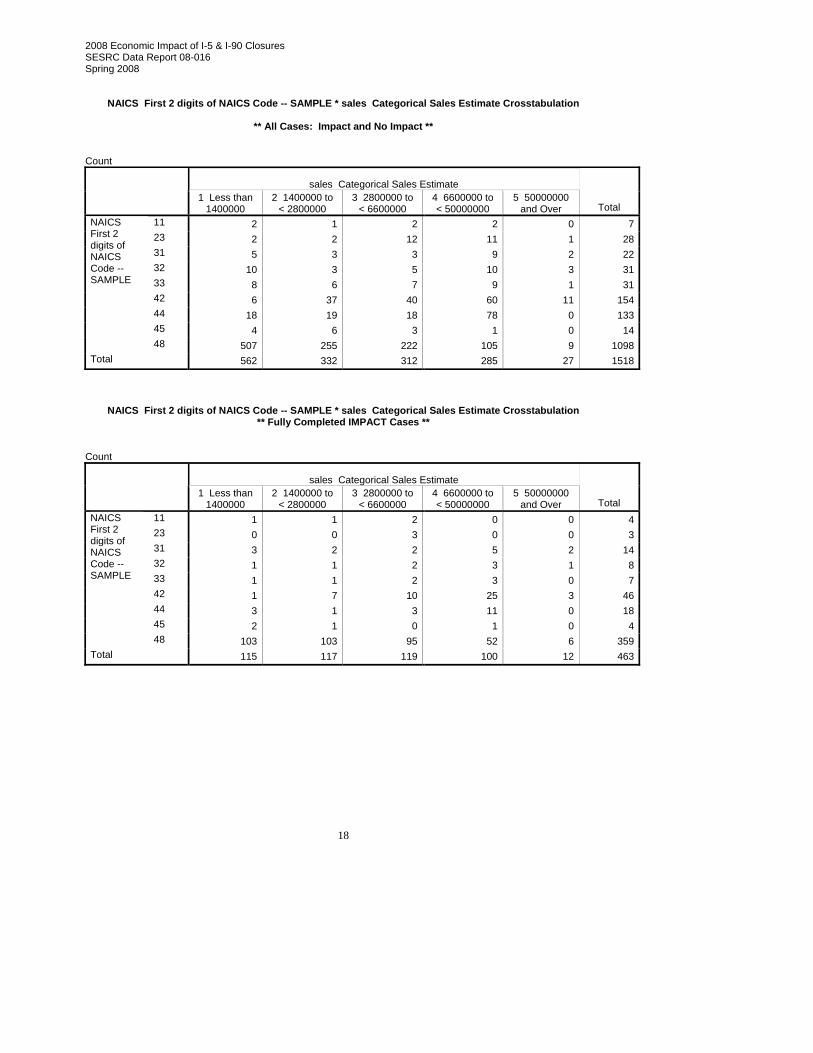
NAICS First 2 digits of NAICS Code -- SAMPLE * sales Categorical Sales Estimate Crosstabulation
** All Cases: Impact and No Impact **
Count
sales Categorical Sales Estimate
1 Less than
1400000 2 1400000 to
< 2800000 3 2800000 to
< 6600000 4 6600000 to < 50000000
5 50000000 and Over Total
11 2 1 2 2 0 7 23 2 2 12 11 1 28 31 5 3 3 9 2 22 32 10 3 5 10 3 31 33 8 6 7 9 1 31 42 6 37 40 60 11 154 44 18 19 18 78 0 133 45 4 6 3 1 0 14
NAICS First 2 digits of NAICS Code -- SAMPLE
48 507 255 222 105 9 1098 Total 562 332 312 285 27 1518
NAICS First 2 digits of NAICS Code -- SAMPLE * sales Categorical Sales Estimate Crosstabulation ** Fully Completed IMPACT Cases **
Count
sales Categorical Sales Estimate
1 Less than
1400000 2 1400000 to
< 2800000 3 2800000 to
< 6600000 4 6600000 to < 50000000
5 50000000 and Over Total
11 1 1 2 0 0 4 23 0 0 3 0 0 3 31 3 2 2 5 2 14 32 1 1 2 3 1 8 33 1 1 2 3 0 7 42 1 7 10 25 3 46 44 3 1 3 11 0 18 45 2 1 0 1 0 4
NAICS First 2 digits of NAICS Code -- SAMPLE
48 103 103 95 52 6 359 Total 115 117 119 100 12 463
2008 Economic Impact of I-5 & I-90 Closures SESRC Data Report 08-016 Spring 2008
19
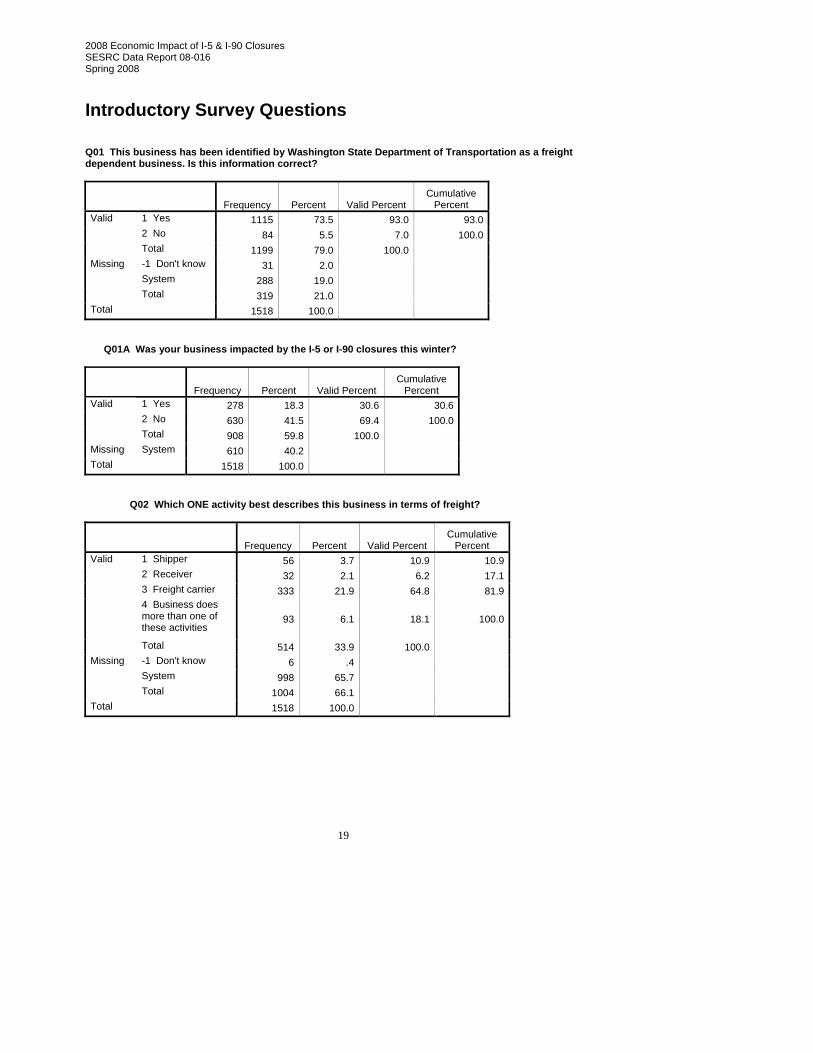
Introductory Survey Questions Q01 This business has been identified by Washington State Department of Transportation as a freight dependent business. Is this information correct?
Frequency Percent Valid Percent Cumulative
Percent 1 Yes 1115 73.5 93.0 93.02 No 84 5.5 7.0 100.0
Valid
Total 1199 79.0 100.0 -1 Don't know 31 2.0 System 288 19.0
Missing
Total 319 21.0 Total 1518 100.0
Q01A Was your business impacted by the I-5 or I-90 closures this winter?
Frequency Percent Valid Percent Cumulative
Percent 1 Yes 278 18.3 30.6 30.62 No 630 41.5 69.4 100.0
Valid
Total 908 59.8 100.0 Missing System 610 40.2 Total 1518 100.0
Q02 Which ONE activity best describes this business in terms of freight?
Frequency Percent Valid Percent Cumulative
Percent 1 Shipper 56 3.7 10.9 10.92 Receiver 32 2.1 6.2 17.13 Freight carrier 333 21.9 64.8 81.94 Business does more than one of these activities
93 6.1 18.1 100.0
Valid
Total 514 33.9 100.0 -1 Don't know 6 .4 System 998 65.7
Missing
Total 1004 66.1 Total 1518 100.0

2008 Economic Impact of I-5 & I-90 Closures SESRC Data Report 08-016 Spring 2008
20
Statistics Q04 On average, how many shipments by truck are made per week <FQ041> your facility?
Valid 474 N Missing 1044
Mean 243.3354 Median 30.0000 Std. Deviation 801.30856 Minimum .00 Maximum 9500.00
Q05 Do you routinely ship or receive any perishable products?
Frequency Percent Valid Percent Cumulative
Percent 1 Yes 149 9.8 29.6 29.62 No 354 23.3 70.4 100.0
Valid
Total 503 33.1 100.0 -1 Don't know 7 .5 System 1008 66.4
Missing
Total 1015 66.9 Total 1518 100.0
Q06 Were your trucks (and/or shipments) scheduled to transit or use I-5 only, I-90 only, or both I-5 and I-90?
Frequency Percent Valid Percent Cumulative
Percent 1 I-5 only 112 7.4 23.0 23.02 I-90 only 95 6.3 19.5 42.43 Both 281 18.5 57.6 100.0
Valid
Total 488 32.1 100.0 -1 Don't know 13 .9 System 1017 67.0
Missing
Total 1030 67.9 Total 1518 100.0
2008 Economic Impact of I-5 & I-90 Closures SESRC Data Report 08-016 Spring 2008
21
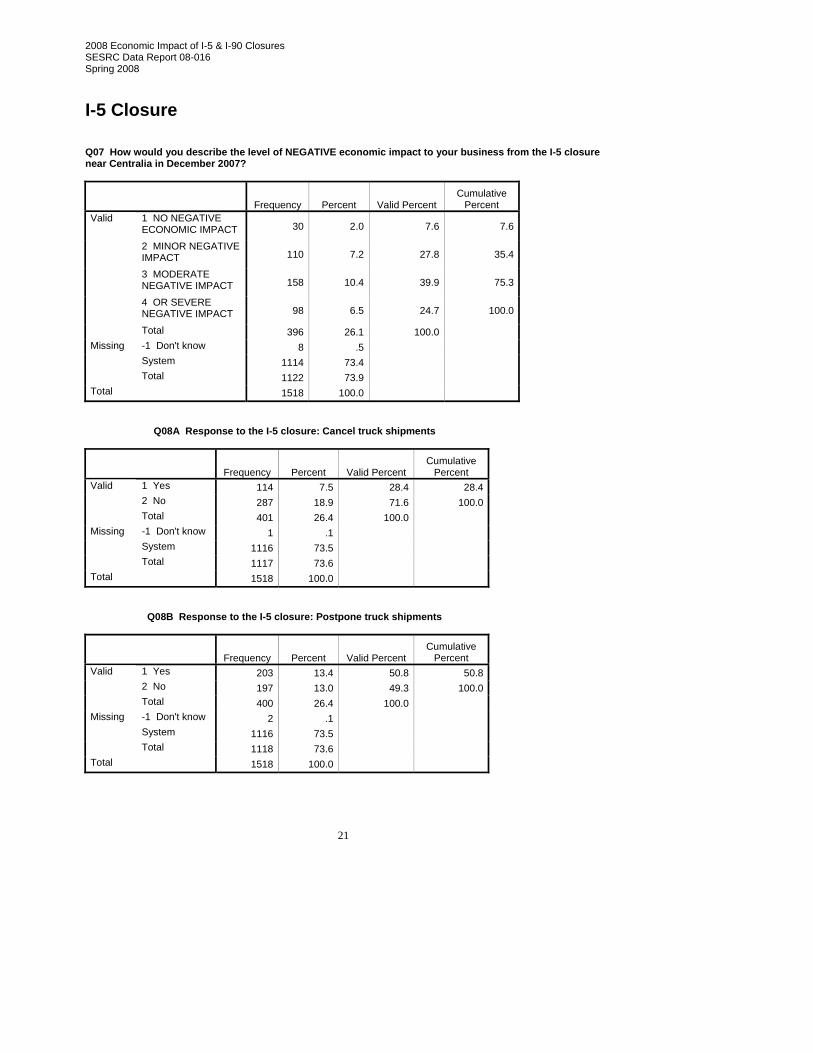
I-5 Closure Q07 How would you describe the level of NEGATIVE economic impact to your business from the I-5 closure near Centralia in December 2007?
Frequency Percent Valid Percent Cumulative
Percent 1 NO NEGATIVE ECONOMIC IMPACT 30 2.0 7.6 7.6
2 MINOR NEGATIVE IMPACT 110 7.2 27.8 35.4
3 MODERATE NEGATIVE IMPACT 158 10.4 39.9 75.3
4 OR SEVERE NEGATIVE IMPACT 98 6.5 24.7 100.0
Valid
Total 396 26.1 100.0 -1 Don't know 8 .5 System 1114 73.4
Missing
Total 1122 73.9 Total 1518 100.0
Q08A Response to the I-5 closure: Cancel truck shipments
Frequency Percent Valid Percent Cumulative
Percent 1 Yes 114 7.5 28.4 28.42 No 287 18.9 71.6 100.0
Valid
Total 401 26.4 100.0 -1 Don't know 1 .1 System 1116 73.5
Missing
Total 1117 73.6 Total 1518 100.0
Q08B Response to the I-5 closure: Postpone truck shipments
Frequency Percent Valid Percent Cumulative
Percent 1 Yes 203 13.4 50.8 50.82 No 197 13.0 49.3 100.0
Valid
Total 400 26.4 100.0 -1 Don't know 2 .1 System 1116 73.5
Missing
Total 1118 73.6 Total 1518 100.0

2008 Economic Impact of I-5 & I-90 Closures SESRC Data Report 08-016 Spring 2008
22
Q08C Response to the I-5 closure: Reroute truck shipments
Frequency Percent Valid Percent Cumulative
Percent 1 Yes 256 16.9 64.2 64.22 No 143 9.4 35.8 100.0
Valid
Total 399 26.3 100.0 -1 Don't know 3 .2 System 1116 73.5
Missing
Total 1119 73.7 Total 1518 100.0
Q08D Response to the I-5 closure: Other response (please specify)
Frequency Percent Valid Percent Cumulative
Percent 1 Yes 33 2.2 8.3 8.32 No 367 24.2 91.8 100.0
Valid
Total 400 26.4 100.0 -1 Don't know 2 .1 System 1116 73.5
Missing
Total 1118 73.6 Total 1518 100.0
Statistics Q09 How many truck shipments for your business were impacted by I-5 closure?
Valid 374 N Missing 1144
Mean 104.51 Median 10.00 Std. Deviation 629.266 Minimum 0 Maximum 10000
Q10A Detour used for I-5 closure: I-84 to Highway 97 to I-901
Frequency Percent Valid Percent Cumulative
Percent 1 Yes 133 8.8 54.5 54.52 No 111 7.3 45.5 100.0
Valid
Total 244 16.1 100.0 -2 Refused 1 .1 -1 Don't know 8 .5 System 1265 83.3
Missing
Total 1274 83.9

2008 Economic Impact of I-5 & I-90 Closures SESRC Data Report 08-016 Spring 2008
23
Total 1518 100.0 Q10B Detour used for I-5 closure: I-84 to I-82 to I-902
Frequency Percent Valid Percent Cumulative
Percent 1 Yes 96 6.3 39.2 39.22 No 149 9.8 60.8 100.0
Valid
Total 245 16.1 100.0 -2 Refused 1 .1 -1 Don't know 7 .5 System 1265 83.3
Missing
Total 1273 83.9 Total 1518 100.0
Q10C Detour used for I-5 closure: Highway 12 to highway 7
Frequency Percent Valid Percent Cumulative
Percent 1 Yes 72 4.7 29.4 29.42 No 173 11.4 70.6 100.0
Valid
Total 245 16.1 100.0 -2 Refused 1 .1 -1 Don't know 7 .5 System 1265 83.3
Missing
Total 1273 83.9 Total 1518 100.0
Q10D Detour used for I-5 closure: Other detour (PLEASE SPECIFY)
Frequency Percent Valid Percent Cumulative
Percent 1 Yes 50 3.3 20.5 20.52 No 194 12.8 79.5 100.0
Valid
Total 244 16.1 100.0 -2 Refused 1 .1 -1 Don't know 8 .5 System 1265 83.3
Missing
Total 1274 83.9 Total 1518 100.0

2008 Economic Impact of I-5 & I-90 Closures SESRC Data Report 08-016 Spring 2008
24
Statistics Q11A During the I-5 closure, how many of your trucks or shipments used this (I-84 to hwy 97 to I-90) detour?
Valid 111 N Missing 1407
Mean 28.4865 Median 6.0000 Std. Deviation 81.95086 Minimum .00 Maximum 800.00
Statistics Q11B By about how many hours (on average) did your shipment transit times increase for each truck when you used this (I-84 to hwy 97 to I-90) detour?
Valid 115 N Missing 1403
Mean 12.6261 Median 6.0000 Std. Deviation 37.80379 Minimum .00 Maximum 400.00
Statistics Q11C What was the total additional direct cost for all trucks or shipments using this (I-84 to hwy 97 to I-90) detour?
Valid 76 N Missing 1442
Mean 13517.6118
Median 2500.0000 Std. Deviation 57390.624
32 Minimum .00 Maximum 500000.00
Statistics Q12A During the I-5 closure, how many of your trucks or shipments used this (I-84 to I-82 to I-90) detour?
Valid 79 N Missing 1439
Mean 22.3291 Median 6.0000 Std. Deviation 51.41877 Minimum .00 Maximum 300.00

2008 Economic Impact of I-5 & I-90 Closures SESRC Data Report 08-016 Spring 2008
25
Statistics Q12B By about how many hours (on average) did your shipment transit times increase for each truck when you used this (I-84 to I-82 to I-90) detour?
Valid 86 N Missing 1432
Mean 7.9651 Median 6.0000 Std. Deviation 7.51539 Minimum .00 Maximum 48.00
Statistics Q12C What was the total additional direct cost for all trucks or shipments using this (I-84 to I-82 to I-90) detour?
Valid 52 N Missing 1466
Mean 5907.2312 Median 1900.0000 Std. Deviation 9318.7277
2 Minimum .00 Maximum 40000.00
Statistics Q13A During I-5 closure, how many of your trucks or shipments used this (hwy 12 to hwy 7) detour?
Valid 62 N Missing 1456
Mean 13.8710 Median 4.5000 Std. Deviation 25.31732 Minimum .00 Maximum 150.00
Statistics Q13B By about how many hours (on average) did your shipment transit times increase for each truck when you used this (hwy 12 to hwy 7) detour?
Valid 61 N Missing 1457
Mean 5.6393 Median 4.0000 Std. Deviation 5.97852 Minimum .00 Maximum 40.00

2008 Economic Impact of I-5 & I-90 Closures SESRC Data Report 08-016 Spring 2008
26
Statistics Q13C What was the total additional direct cost for all trucks or shipments using this (hwy 12 to hwy 7) detour?
Valid 42 N Missing 1476
Mean 3295.6814 Median 1280.0000 Std. Deviation 6194.8685
1 Minimum .00 Maximum 30000.00
Statistics Q14A During I-5 closure, how many of your trucks or shipments used this other detour?
Valid 44 N Missing 1474
Mean 14.9773 Median 3.0000 Std. Deviation 23.92380 Minimum .00 Maximum 100.00
Statistics Q14B By about how many hours (on average) did your shipment transit times increase for each truck when you used this other detour?
Valid 41 N Missing 1477
Mean 6.2683 Median 4.0000 Std. Deviation 8.15483 Minimum .00 Maximum 48.00
Statistics Q14C What was the additional direct cost for all trucks or shipments using this other detour?
Valid 38 N Missing 1480
Mean 4926.0000 Median 800.0000 Std. Deviation 9831.1364
2

2008 Economic Impact of I-5 & I-90 Closures SESRC Data Report 08-016 Spring 2008
27
Minimum .00 Maximum 51000.00
Q15A Reason detour(s) chosen during the I-5 closure: AVAILABLE OPEN HIGHWAY ROUTES WERE USED
Frequency Percent Valid Percent Cumulative
Percent 1 Yes 155 10.2 64.3 64.32 No 86 5.7 35.7 100.0
Valid
Total 241 15.9 100.0 -2 Refused 1 .1 -1 Don't know 4 .3 System 1272 83.8
Missing
Total 1277 84.1 Total 1518 100.0
Q15B Reason detour(s) chosen during the I-5 closure: ROUTE WITH LESS SEVERE WEATHER WERE USED
Frequency Percent Valid Percent Cumulative
Percent 1 Yes 56 3.7 23.2 23.22 No 185 12.2 76.8 100.0
Valid
Total 241 15.9 100.0 -2 Refused 1 .1 -1 Don't know 4 .3 System 1272 83.8
Missing
Total 1277 84.1 Total 1518 100.0
Q15C Reason detour(s) chosen during the I-5 closure: NEAREST ALTERNATIVE OPEN ROUTE WERE USED
Frequency Percent Valid Percent Cumulative
Percent 1 Yes 164 10.8 68.0 68.02 No 77 5.1 32.0 100.0
Valid
Total 241 15.9 100.0 -2 Refused 1 .1 -1 Don't know 4 .3 System 1272 83.8
Missing
Total 1277 84.1 Total 1518 100.0
2008 Economic Impact of I-5 & I-90 Closures SESRC Data Report 08-016 Spring 2008
28
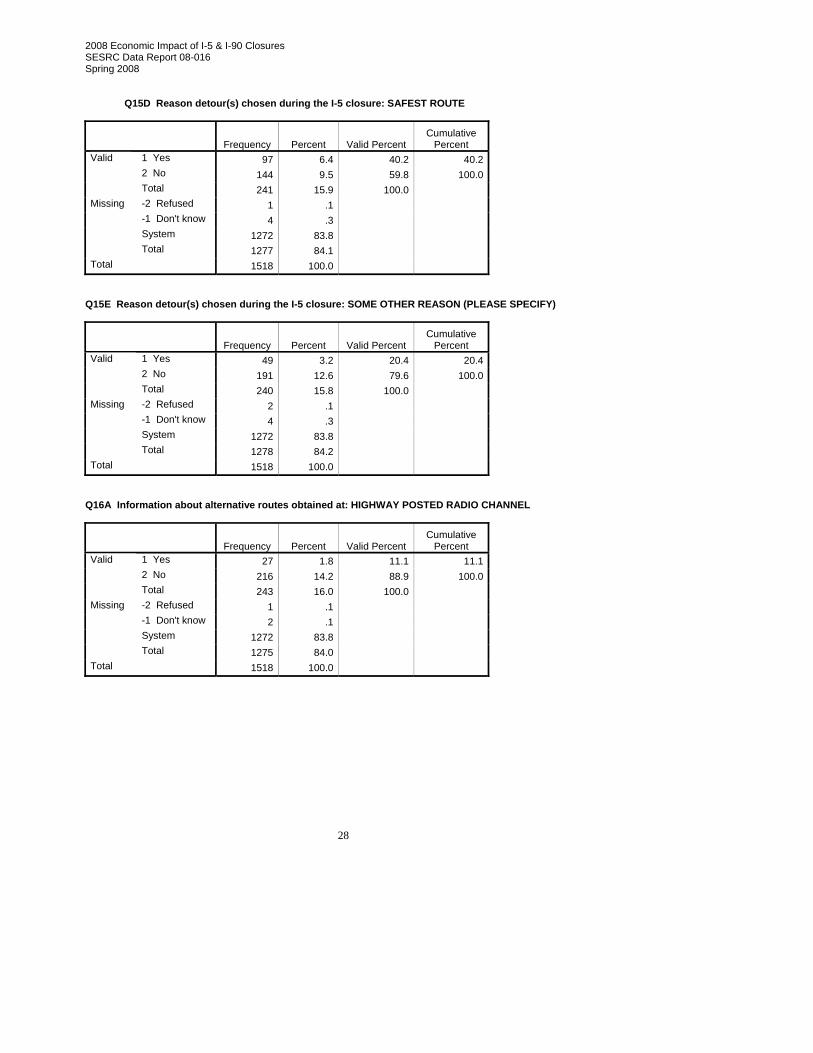
Q15D Reason detour(s) chosen during the I-5 closure: SAFEST ROUTE
Frequency Percent Valid Percent Cumulative
Percent 1 Yes 97 6.4 40.2 40.22 No 144 9.5 59.8 100.0
Valid
Total 241 15.9 100.0 -2 Refused 1 .1 -1 Don't know 4 .3 System 1272 83.8
Missing
Total 1277 84.1 Total 1518 100.0
Q15E Reason detour(s) chosen during the I-5 closure: SOME OTHER REASON (PLEASE SPECIFY)
Frequency Percent Valid Percent Cumulative
Percent 1 Yes 49 3.2 20.4 20.42 No 191 12.6 79.6 100.0
Valid
Total 240 15.8 100.0 -2 Refused 2 .1 -1 Don't know 4 .3 System 1272 83.8
Missing
Total 1278 84.2 Total 1518 100.0
Q16A Information about alternative routes obtained at: HIGHWAY POSTED RADIO CHANNEL
Frequency Percent Valid Percent Cumulative
Percent 1 Yes 27 1.8 11.1 11.12 No 216 14.2 88.9 100.0
Valid
Total 243 16.0 100.0 -2 Refused 1 .1 -1 Don't know 2 .1 System 1272 83.8
Missing
Total 1275 84.0 Total 1518 100.0

2008 Economic Impact of I-5 & I-90 Closures SESRC Data Report 08-016 Spring 2008
29
Q16B Information about alternative routes obtained at: COMPANY DISPATCH OR CONTACT
Frequency Percent Valid Percent Cumulative
Percent 1 Yes 103 6.8 42.2 42.22 No 141 9.3 57.8 100.0
Valid
Total 244 16.1 100.0 -2 Refused 1 .1 -1 Don't know 1 .1 System 1272 83.8
Missing
Total 1274 83.9 Total 1518 100.0
Q16C Information about alternative routes obtained at: TRUCK WEIGH STATION
Frequency Percent Valid Percent Cumulative
Percent 1 Yes 10 .7 4.1 4.12 No 232 15.3 95.9 100.0
Valid
Total 242 15.9 100.0 -2 Refused 1 .1 -1 Don't know 3 .2 System 1272 83.8
Missing
Total 1276 84.1 Total 1518 100.0
Q16D Information about alternative routes obtained at: WSDOT WEBSITE
Frequency Percent Valid Percent Cumulative
Percent 1 Yes 157 10.3 64.3 64.32 No 87 5.7 35.7 100.0
Valid
Total 244 16.1 100.0 -2 Refused 1 .1 -1 Don't know 1 .1 System 1272 83.8
Missing
Total 1274 83.9 Total 1518 100.0

2008 Economic Impact of I-5 & I-90 Closures SESRC Data Report 08-016 Spring 2008
30
Q16E Information about alternative routes obtained at: WSDOT FREIGHT EMAIL LISTSERVE
Frequency Percent Valid Percent Cumulative
Percent 1 Yes 18 1.2 7.5 7.52 No 222 14.6 92.5 100.0
Valid
Total 240 15.8 100.0 -2 Refused 1 .1 -1 Don't know 5 .3 System 1272 83.8
Missing
Total 1278 84.2 Total 1518 100.0
Q16F Information about alternative routes obtained at: MEDIA, INCLUDING TV OR RADIO OR PRINT
Frequency Percent Valid Percent Cumulative
Percent 1 Yes 100 6.6 41.2 41.22 No 143 9.4 58.8 100.0
Valid
Total 243 16.0 100.0 -2 Refused 1 .1 -1 Don't know 2 .1 System 1272 83.8
Missing
Total 1275 84.0 Total 1518 100.0
Q16G Information about alternative routes obtained at: STATE PATROL
Frequency Percent Valid Percent Cumulative
Percent 1 Yes 41 2.7 16.9 16.92 No 202 13.3 83.1 100.0
Valid
Total 243 16.0 100.0 -2 Refused 1 .1 -1 Don't know 2 .1 System 1272 83.8
Missing
Total 1275 84.0 Total 1518 100.0

2008 Economic Impact of I-5 & I-90 Closures SESRC Data Report 08-016 Spring 2008
31
Q16H Information about alternative routes obtained at: SOME OTHER WAY (PLEASE SPECIFY)
Frequency Percent Valid Percent Cumulative
Percent 1 Yes 69 4.5 28.4 28.42 No 174 11.5 71.6 100.0
Valid
Total 243 16.0 100.0 -2 Refused 1 .1 -1 Don't know 2 .1 System 1272 83.8
Missing
Total 1275 84.0 Total 1518 100.0
Statistics Q17 What were your company's total ADDITIONAL costs incurred because of the I-5 closure?
Valid 238 N Missing 1280
Mean 15312.94 Median 1900.00 Std. Deviation 72652.782 Minimum 0 Maximum 1000000
Q17C Q17 Web Don't Know
Frequency Percent Valid Percent Cumulative
Percent 1 Checked 69 4.5 41.8 41.82 Not Checked 96 6.3 58.2 100.0
Valid
Total 165 10.9 100.0 Missing System 1353 89.1 Total 1518 100.0

2008 Economic Impact of I-5 & I-90 Closures SESRC Data Report 08-016 Spring 2008
32
Q17A If Q17 Don't know then: Estimate: less than $10,000, more than $10,000, or right around $10,000 dollars?
Frequency Percent Valid Percent Cumulative
Percent 1 Less than $10,000 81 5.3 65.3 65.32 More than $10,000 27 1.8 21.8 87.13 Right around $10,000 16 1.1 12.9 100.0
Valid
Total 124 8.2 100.0 -2 Refused 1 .1 -1 Don't know 6 .4 System 1387 91.4
Missing
Total 1394 91.8 Total 1518 100.0
Q18A If Q17 Don't know then: Range estimate: <$2,000 - $10,000
Frequency Percent Valid Percent Cumulative
Percent 1 LESS THAN $2,000 26 1.7 33.8 33.82 OVER $2,000 UP TO $4,000 26 1.7 33.8 67.5
3 OVER $4,000 UP TO $6,000 9 .6 11.7 79.2
4 OVER $6,000 UP TO $8,000 6 .4 7.8 87.0
5 OR OVER $8,000 UP TO $10,000 8 .5 10.4 97.4
6 Over $10,000 2 .1 2.6 100.0
Valid
Total 77 5.1 100.0 -1 Don't know 7 .5 System 1434 94.5
Missing
Total 1441 94.9 Total 1518 100.0
Q19 If Q17 Don't know then: Estimate: less than $100,000, more than $100,000, or right around $100,000 dollars?
Frequency Percent Valid Percent Cumulative
Percent 1 Less than $100,000 23 1.5 79.3 79.32 More than $100,000 3 .2 10.3 89.73 Right around $100,000 3 .2 10.3 100.0
Valid
Total 29 1.9 100.0 Missing System 1489 98.1 Total 1518 100.0

2008 Economic Impact of I-5 & I-90 Closures SESRC Data Report 08-016 Spring 2008
33
Q19A If Q17 Don't know then: Range estimate: <$20,000 - $100,000
Frequency Percent Valid Percent Cumulative
Percent 1 LESS THAN $20,000 5 .3 26.3 26.32 OVER $20,000 UP TO $40,000 3 .2 15.8 42.1
3 OVER $40,000 UP TO $60,000 4 .3 21.1 63.2
4 OVER $60,000 UP TO $80,000 6 .4 31.6 94.7
5 OR OVER $80,000 UP TO $100,000 1 .1 5.3 100.0
Valid
Total 19 1.3 100.0 -1 Don't know 4 .3 System 1495 98.5
Missing
Total 1499 98.7 Total 1518 100.0
Q20 If Q17 Don't know then: Estimate: less than $1,000,000, more than $1,000,000, or right around 1,000,000 dollars?
Frequency Percent Valid Percent Cumulative
Percent Valid 1 Less than $1,000,000 3 .2 100.0 100.0Missing System 1515 99.8 Total 1518 100.0
Q20A If Q17 Don't know then: Range estimate: <$200,000 - $1,000,000
Frequency Percent Valid Percent Cumulative
Percent 1 LESS THAN $200,000 2 .1 66.7 66.72 OVER $200,000 UP TO $400,000 1 .1 33.3 100.0
Valid
Total 3 .2 100.0 Missing System 1515 99.8 Total 1518 100.0
Q20B If Q17 Don't know then: Range estimate: <$1,200,000 - $2,000,000 Frequency Percent Missing System 1518 100.0

2008 Economic Impact of I-5 & I-90 Closures SESRC Data Report 08-016 Spring 2008
34
Statistics Q21A I-5 Closure Amount spent for: Overtime hours and other truck drivers' expenses
Valid 223 N Missing 1295
Mean 3173.7920 Median 400.0000 Std. Deviation 8283.5182
9 Minimum .00 Maximum 76000.00
Statistics Q21B I-5 Closure Percentage of additional costs for: Overtime hours and other truck drivers' expenses
Valid 211 N Missing 1307
Mean 25.8684 Median 15.0000 Std. Deviation 30.65671 Minimum .00 Maximum 100.00
Statistics Q21C I-5 Closure Amount spent for: Additional fuel costs
Valid 226 N Missing 1292
Mean 2625.4936 Median 600.0000 Std. Deviation 5627.4667
4 Minimum .00 Maximum 60000.00
Statistics Q21D I-5 Closure Percentage of additional costs for: Additional fuel costs
Valid 207 N Missing 1311
Mean 28.2773 Median 20.0000 Std. Deviation 30.91959 Minimum .00 Maximum 100.00

2008 Economic Impact of I-5 & I-90 Closures SESRC Data Report 08-016 Spring 2008
35
Statistics Q21E I-5 Closure Amount spent for: Acquiring additional equipment
Valid 226 N Missing 1292
Mean 206.1991 Median .0000 Std. Deviation 1164.5712
9 Minimum .00 Maximum 10000.00
Statistics Q21F I-5 Closure Percentage of additional costs for: Acquiring additional equipment
Valid 211 N Missing 1307
Mean 1.1991 Median .0000 Std. Deviation 7.56233 Minimum .00 Maximum 75.00
Statistics Q21G I-5 Closure Amount spent for: Paying a higher rate for expedited and/or guaranteed services
Valid 220 N Missing 1298
Mean 1762.9773 Median .0000 Std. Deviation 15224.045
73 Minimum .00 Maximum 215000.00
Statistics Q21H I-5 Closure Percentage of additional costs for: Paying a higher rate for expedited and/or guaranteed services
Valid 203 N Missing 1315
Mean 5.3054 Median .0000 Std. Deviation 17.46242 Minimum .00 Maximum 100.00

2008 Economic Impact of I-5 & I-90 Closures SESRC Data Report 08-016 Spring 2008
36
Statistics Q21I I-5 Closure Amount spent for: Additional inventory and/or storage costs
Valid 238 N Missing 1280
Mean 796.3445 Median .0000 Std. Deviation 9735.9598
6 Minimum .00 Maximum 150000.00
Statistics Q21J I-5 Closure Percentage of additional costs for: dditional inventory and/or storage costs
Valid 222 N Missing 1296
Mean 2.9977 Median .0000 Std. Deviation 13.54334 Minimum .00 Maximum 100.00
Statistics Q21K I-5 Closure Amount spent for: Damages including perishables or other goods
Valid 240 N Missing 1278
Mean 544.9167 Median .0000 Std. Deviation 4716.8389
7 Minimum .00 Maximum 50000.00
Statistics Q21L I-5 Closure Percentage of additional costs for: Damages including perishables or other goods
Valid 222 N Missing 1296
Mean .5631 Median .0000 Std. Deviation 4.55565 Minimum .00 Maximum 50.00

2008 Economic Impact of I-5 & I-90 Closures SESRC Data Report 08-016 Spring 2008
37

2008 Economic Impact of I-5 & I-90 Closures SESRC Data Report 08-016 Spring 2008
38
Statistics Q21M I-5 Closure Amount spent for: Any other reasons or items of losses
Valid 240 N Missing 1278
Mean 2181.7758 Median .0000 Std. Deviation 14462.935
34 Minimum .00 Maximum 200000.00
Statistics Q21N I-5 Closure Percentage of additional costs for: Any other reasons or items of losses
Valid 220 N Missing 1298
Mean 6.4516 Median .0000 Std. Deviation 17.14168 Minimum .00 Maximum 100.00
Statistics Q22 After I-5 reopened, did your company's transportation-related costs immediately return to the previous level?
Valid 349 N Missing 1169
Q22 After I-5 reopened, did your company's transportation-related costs immediately return to the previous level?
Frequency Percent Valid Percent Cumulative
Percent 1 Yes 306 20.2 87.7 87.72 No 43 2.8 12.3 100.0
Valid
Total 349 23.0 100.0 -1 Don't know 20 1.3 System 1149 75.7
Missing
Total 1169 77.0 Total 1518 100.0

2008 Economic Impact of I-5 & I-90 Closures SESRC Data Report 08-016 Spring 2008
39
Q23 How long were your company's transportation-related costs higher than normal?: Number * Q23A How long were your company's transportation-related costs higher than normal?: Unit (days, weeks, months) Crosstabulation Count
Q23A How long were your company's transportation-related
costs higher than normal?: Unit (days, weeks, months)
1 Days 2 Weeks 3 Months Total 0 2 0 0 21 0 3 5 82 2 6 1 93 1 1 1 34 4 0 1 55 2 1 0 36 0 1 0 110 2 0 0 2
Q23 How long were your company's transportation-related costs higher than normal?: Number
30 1 0 0 1Total 14 12 8 34
Statistics Q24 What was the total amount of additional transportation-related costs paid by your company AFTER I-5 reopened?
Valid 23 N Missing 1495
Mean 6026.09 Median .00 Std. Deviation 11518.294 Minimum 0 Maximum 35000
Q24C Q24 Web Don't Know
Frequency Percent Valid Percent Cumulative
Percent 1 Checked 11 .7 34.4 34.42 Not Checked 21 1.4 65.6 100.0
Valid
Total 32 2.1 100.0 Missing System 1486 97.9 Total 1518 100.0

2008 Economic Impact of I-5 & I-90 Closures SESRC Data Report 08-016 Spring 2008
40
Q24A If Q24 Don't know then: Estimate: less than $10,000, more than $10,000, or right around $10,000 dollars?
Frequency Percent Valid Percent Cumulative
Percent 1 Less than $10,000 10 .7 52.6 52.62 More than $10,000 4 .3 21.1 73.73 Right around $10,000 5 .3 26.3 100.0
Valid
Total 19 1.3 100.0 -1 Don't know 3 .2 System 1496 98.6
Missing
Total 1499 98.7 Total 1518 100.0
Q24B If Q24 Don't know then: Range estimate: <$2,000 - $10,000
Frequency Percent Valid Percent Cumulative
Percent 1 LESS THAN $2,000 2 .1 20.0 20.02 OVER $2,000 UP TO $4,000 3 .2 30.0 50.0
3 OVER $4,000 UP TO $6,000 2 .1 20.0 70.0
5 OR OVER $8,000 UP TO $10,000 3 .2 30.0 100.0
Valid
Total 10 .7 100.0 -1 Don't know 1 .1 System 1507 99.3
Missing
Total 1508 99.3 Total 1518 100.0
Q25 If Q24 Don't know then: Estimate: less than $100,000, more than $100,000, or right around $100,000 dollars?
Frequency Percent Valid Percent Cumulative
Percent 1 Less than $100,000 2 .1 50.0 50.03 Right around $100,000 2 .1 50.0 100.0
Valid
Total 4 .3 100.0 Missing System 1514 99.7 Total 1518 100.0

2008 Economic Impact of I-5 & I-90 Closures SESRC Data Report 08-016 Spring 2008
41
Q25A If Q24 Don't know then: Range estimate: <$20,000 - $100,000
Frequency Percent Valid Percent Cumulative
Percent 2 OVER $20,000 UP TO $40,000 1 .1 50.0 50.0
3 OVER $40,000 UP TO $60,000 1 .1 50.0 100.0
Valid
Total 2 .1 100.0 Missing System 1516 99.9 Total 1518 100.0
Q26 If Q24 Don't know then: Estimate: less than $1,000,000, more than $1,000,000, or right around 1,000,000 dollars? Frequency Percent Missing System 1518 100.0
Q26A If Q24 Don't know then: Range estimate: <$200,000 - $1,000,000 Frequency Percent Missing System 1518 100.0
Q26B If Q24 Don't know then: Range estimate: <$1,200,000 - $2,000,000 Frequency Percent Missing System 1518 100.0
Q27 Did you recover any of the additional transportation-related costs due to the closure?
Frequency Percent Valid Percent Cumulative
Percent 1 Yes 57 3.8 16.8 16.82 No 282 18.6 83.2 100.0
Valid
Total 339 22.3 100.0 -2 Refused 2 .1 -1 Don't know 27 1.8 System 1150 75.8
Missing
Total 1179 77.7 Total 1518 100.0
2008 Economic Impact of I-5 & I-90 Closures SESRC Data Report 08-016 Spring 2008
42
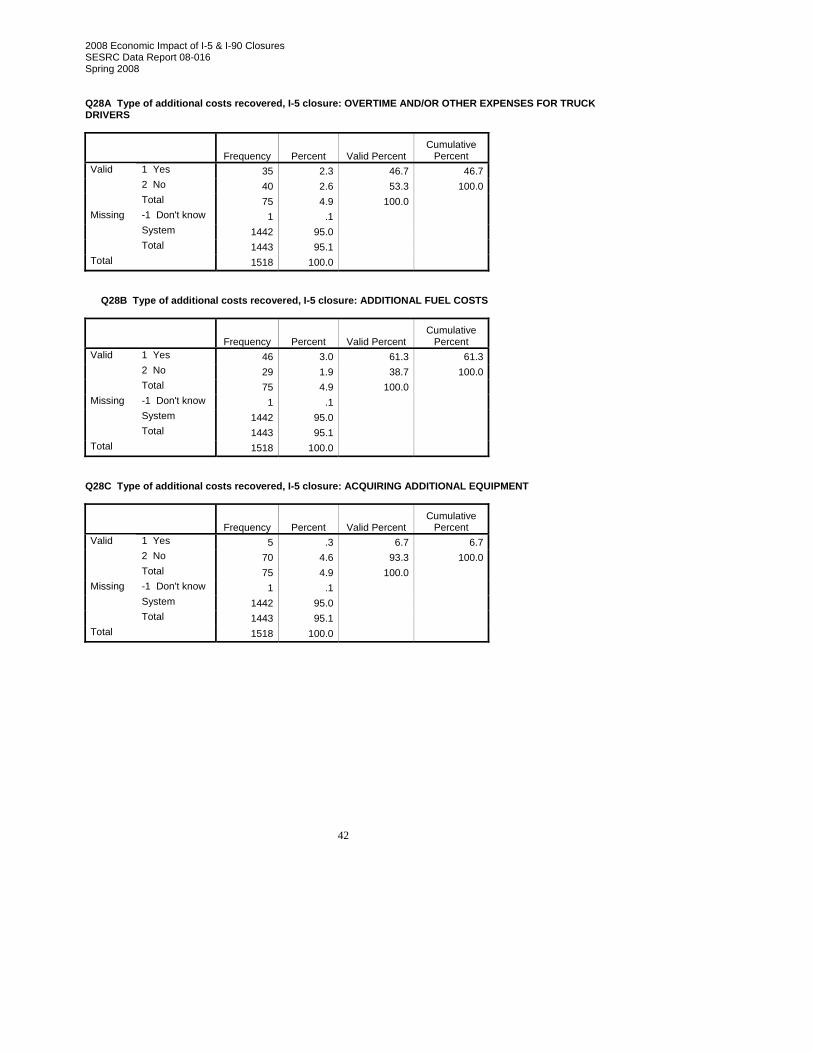
Q28A Type of additional costs recovered, I-5 closure: OVERTIME AND/OR OTHER EXPENSES FOR TRUCK DRIVERS
Frequency Percent Valid Percent Cumulative
Percent 1 Yes 35 2.3 46.7 46.72 No 40 2.6 53.3 100.0
Valid
Total 75 4.9 100.0 -1 Don't know 1 .1 System 1442 95.0
Missing
Total 1443 95.1 Total 1518 100.0
Q28B Type of additional costs recovered, I-5 closure: ADDITIONAL FUEL COSTS
Frequency Percent Valid Percent Cumulative
Percent 1 Yes 46 3.0 61.3 61.32 No 29 1.9 38.7 100.0
Valid
Total 75 4.9 100.0 -1 Don't know 1 .1 System 1442 95.0
Missing
Total 1443 95.1 Total 1518 100.0
Q28C Type of additional costs recovered, I-5 closure: ACQUIRING ADDITIONAL EQUIPMENT
Frequency Percent Valid Percent Cumulative
Percent 1 Yes 5 .3 6.7 6.72 No 70 4.6 93.3 100.0
Valid
Total 75 4.9 100.0 -1 Don't know 1 .1 System 1442 95.0
Missing
Total 1443 95.1 Total 1518 100.0

2008 Economic Impact of I-5 & I-90 Closures SESRC Data Report 08-016 Spring 2008
43
Q28D Type of additional costs recovered, I-5 closure: PAYING A HIGHER RATE FOR EXPEDITED AND/OR GUARANTEED SERVICES
Frequency Percent Valid Percent Cumulative
Percent 1 Yes 12 .8 16.0 16.02 No 63 4.2 84.0 100.0
Valid
Total 75 4.9 100.0 -1 Don't know 1 .1 System 1442 95.0
Missing
Total 1443 95.1 Total 1518 100.0
Q28E Type of additional costs recovered, I-5 closure: ADDITIONAL INVENTORY AND/OR STORAGE COSTS
Frequency Percent Valid Percent Cumulative
Percent 1 Yes 4 .3 5.3 5.32 No 71 4.7 94.7 100.0
Valid
Total 75 4.9 100.0 -1 Don't know 1 .1 System 1442 95.0
Missing
Total 1443 95.1 Total 1518 100.0
Q28F Type of additional costs recovered, I-5 closure: OTHER
Frequency Percent Valid Percent Cumulative
Percent 1 Yes 12 .8 15.8 15.82 No 64 4.2 84.2 100.0
Valid
Total 76 5.0 100.0 Missing System 1442 95.0 Total 1518 100.0
Q29 Will your business make any capital or operating investments in 2008 to prevent future business disruptions due to potential closures on I-5 in South West Washington?
Frequency Percent Valid Percent Cumulative
Percent 1 Yes 13 .9 3.9 3.92 No 322 21.2 96.1 100.0
Valid
Total 335 22.1 100.0 -2 Refused 2 .1 -1 Don't know 29 1.9 System 1152 75.9
Missing
Total 1183 77.9

2008 Economic Impact of I-5 & I-90 Closures SESRC Data Report 08-016 Spring 2008
44
Total 1518 100.0 Statistics Q30 What is the estimated cost associated with this I-5 transportation disruption prevention plan for 2008?
Valid 7 N Missing 1511
Mean 18950.0000
Median 5000.0000 Std. Deviation 28837.345
58 Minimum .00 Maximum 80000.00
Statistics Q31 Please estimate the value of any lost sales your company experienced due to the I-5 closure.
Valid 254 N Missing 1264
Mean 3175306.2323
Median 1000.0000 Std. Deviation 50194973.
45817 Minimum .00 Maximum 80000000
0.00 Q31C Q31 Web Don't Know
Frequency Percent Valid Percent Cumulative
Percent 1 Checked 52 3.4 35.9 35.92 Not Checked 93 6.1 64.1 100.0
Valid
Total 145 9.6 100.0 Missing System 1373 90.4 Total 1518 100.0
2008 Economic Impact of I-5 & I-90 Closures SESRC Data Report 08-016 Spring 2008
45
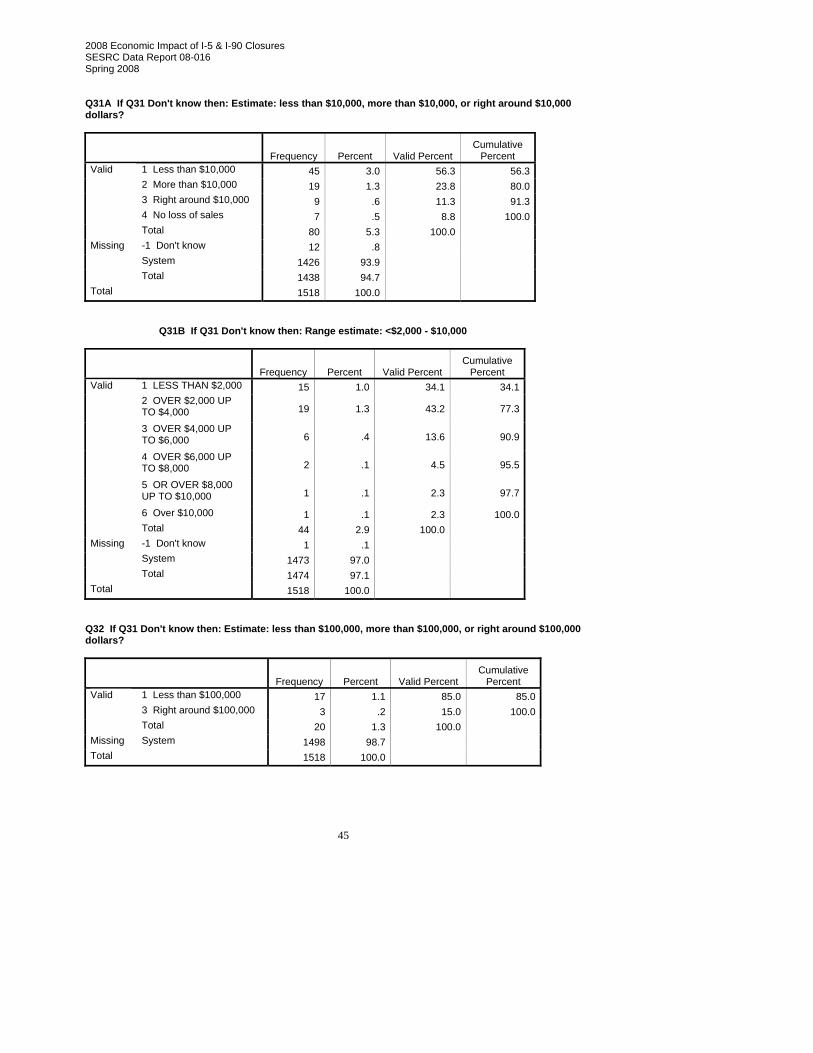
Q31A If Q31 Don't know then: Estimate: less than $10,000, more than $10,000, or right around $10,000 dollars?
Frequency Percent Valid Percent Cumulative
Percent 1 Less than $10,000 45 3.0 56.3 56.32 More than $10,000 19 1.3 23.8 80.03 Right around $10,000 9 .6 11.3 91.34 No loss of sales 7 .5 8.8 100.0
Valid
Total 80 5.3 100.0 -1 Don't know 12 .8 System 1426 93.9
Missing
Total 1438 94.7 Total 1518 100.0
Q31B If Q31 Don't know then: Range estimate: <$2,000 - $10,000
Frequency Percent Valid Percent Cumulative
Percent 1 LESS THAN $2,000 15 1.0 34.1 34.12 OVER $2,000 UP TO $4,000 19 1.3 43.2 77.3
3 OVER $4,000 UP TO $6,000 6 .4 13.6 90.9
4 OVER $6,000 UP TO $8,000 2 .1 4.5 95.5
5 OR OVER $8,000 UP TO $10,000 1 .1 2.3 97.7
6 Over $10,000 1 .1 2.3 100.0
Valid
Total 44 2.9 100.0 -1 Don't know 1 .1 System 1473 97.0
Missing
Total 1474 97.1 Total 1518 100.0
Q32 If Q31 Don't know then: Estimate: less than $100,000, more than $100,000, or right around $100,000 dollars?
Frequency Percent Valid Percent Cumulative
Percent 1 Less than $100,000 17 1.1 85.0 85.03 Right around $100,000 3 .2 15.0 100.0
Valid
Total 20 1.3 100.0 Missing System 1498 98.7 Total 1518 100.0

2008 Economic Impact of I-5 & I-90 Closures SESRC Data Report 08-016 Spring 2008
46
Q32A If Q31 Don't know then: Range estimate: <$20,000 - $100,000
Frequency Percent Valid Percent Cumulative
Percent 1 LESS THAN $20,000 3 .2 17.6 17.62 OVER $20,000 UP TO $40,000 1 .1 5.9 23.5
3 OVER $40,000 UP TO $60,000 11 .7 64.7 88.2
4 OVER $60,000 UP TO $80,000 1 .1 5.9 94.1
5 OR OVER $80,000 UP TO $100,000 1 .1 5.9 100.0
Valid
Total 17 1.1 100.0 Missing System 1501 98.9 Total 1518 100.0
Q33 If Q31 Don't know then: Estimate: less than $1,000,000, more than $1,000,000, or right around 1,000,000 dollars? Frequency Percent Missing System 1518 100.0
Q33A If Q31 Don't know then: Range estimate: <$200,000 - $1,000,000 Frequency Percent Missing System 1518 100.0
Q33B If Q31 Don't know then: Range estimate: <$1,200,000 - $2,000,000 Frequency Percent Missing System 1518 100.0
Q33C I-5 closure: How did you estimate (the value of any lost sales)
Frequency Percent Valid Percent Cumulative
Percent 1 Comments 136 9.0 99.3 99.32 No comments 1 .1 .7 100.0
Valid
Total 137 9.0 100.0 Missing System 1381 91.0 Total 1518 100.0
2008 Economic Impact of I-5 & I-90 Closures SESRC Data Report 08-016 Spring 2008
47
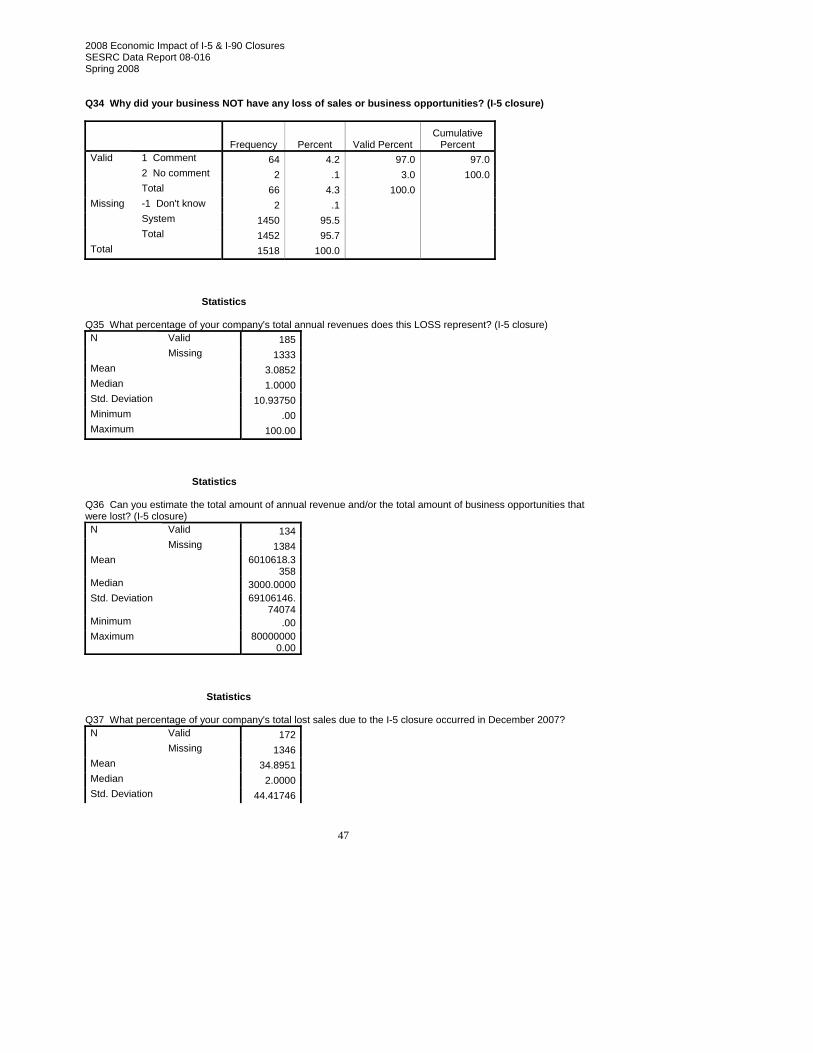
Q34 Why did your business NOT have any loss of sales or business opportunities? (I-5 closure)
Frequency Percent Valid Percent Cumulative
Percent 1 Comment 64 4.2 97.0 97.02 No comment 2 .1 3.0 100.0
Valid
Total 66 4.3 100.0 -1 Don't know 2 .1 System 1450 95.5
Missing
Total 1452 95.7 Total 1518 100.0
Statistics Q35 What percentage of your company's total annual revenues does this LOSS represent? (I-5 closure)
Valid 185 N Missing 1333
Mean 3.0852 Median 1.0000 Std. Deviation 10.93750 Minimum .00 Maximum 100.00
Statistics Q36 Can you estimate the total amount of annual revenue and/or the total amount of business opportunities that were lost? (I-5 closure)
Valid 134 N Missing 1384
Mean 6010618.3358
Median 3000.0000 Std. Deviation 69106146.
74074 Minimum .00 Maximum 80000000
0.00 Statistics Q37 What percentage of your company's total lost sales due to the I-5 closure occurred in December 2007?
Valid 172 N Missing 1346
Mean 34.8951 Median 2.0000 Std. Deviation 44.41746
2008 Economic Impact of I-5 & I-90 Closures SESRC Data Report 08-016 Spring 2008
48
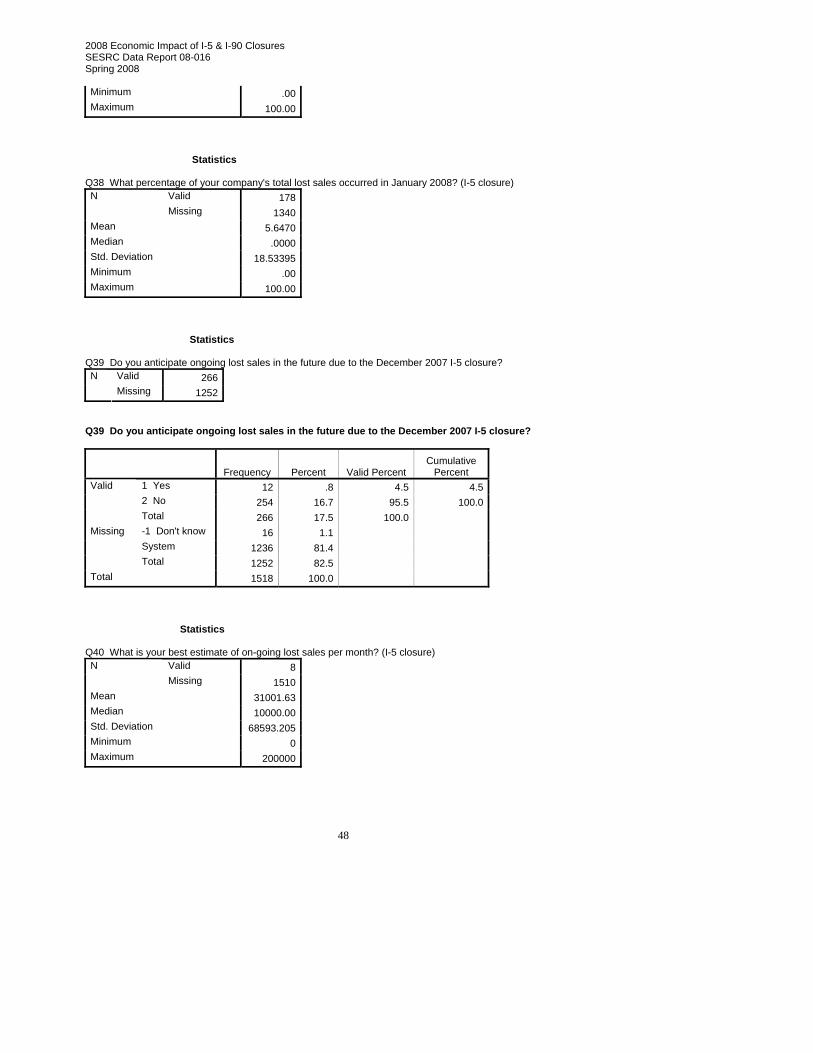
Minimum .00 Maximum 100.00
Statistics Q38 What percentage of your company's total lost sales occurred in January 2008? (I-5 closure)
Valid 178 N Missing 1340
Mean 5.6470 Median .0000 Std. Deviation 18.53395 Minimum .00 Maximum 100.00
Statistics Q39 Do you anticipate ongoing lost sales in the future due to the December 2007 I-5 closure?
Valid 266 N Missing 1252
Q39 Do you anticipate ongoing lost sales in the future due to the December 2007 I-5 closure?
Frequency Percent Valid Percent Cumulative
Percent 1 Yes 12 .8 4.5 4.52 No 254 16.7 95.5 100.0
Valid
Total 266 17.5 100.0 -1 Don't know 16 1.1 System 1236 81.4
Missing
Total 1252 82.5 Total 1518 100.0
Statistics Q40 What is your best estimate of on-going lost sales per month? (I-5 closure)
Valid 8 N Missing 1510
Mean 31001.63 Median 10000.00 Std. Deviation 68593.205 Minimum 0 Maximum 200000
2008 Economic Impact of I-5 & I-90 Closures SESRC Data Report 08-016 Spring 2008
49
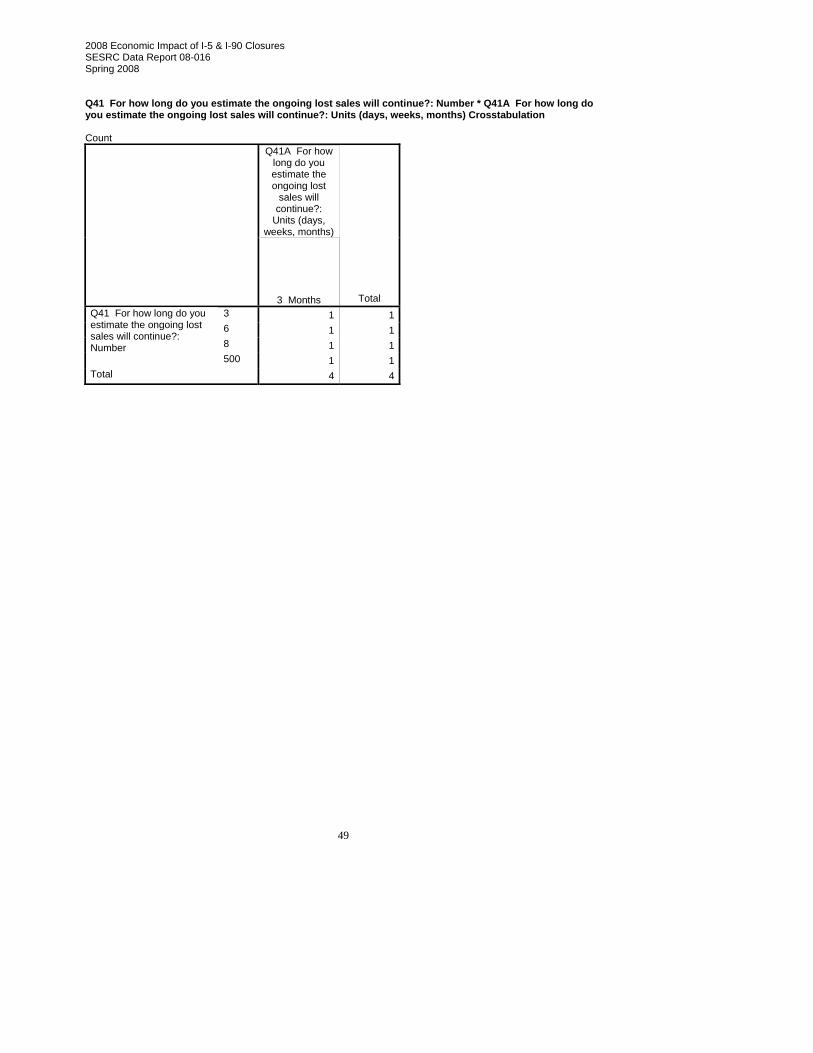
Q41 For how long do you estimate the ongoing lost sales will continue?: Number * Q41A For how long do you estimate the ongoing lost sales will continue?: Units (days, weeks, months) Crosstabulation Count
Q41A For how long do you estimate the ongoing lost
sales will continue?:
Units (days, weeks, months)
3 Months Total 3 1 16 1 18 1 1
Q41 For how long do you estimate the ongoing lost sales will continue?: Number
500 1 1Total 4 4
2008 Economic Impact of I-5 & I-90 Closures SESRC Data Report 08-016 Spring 2008
50
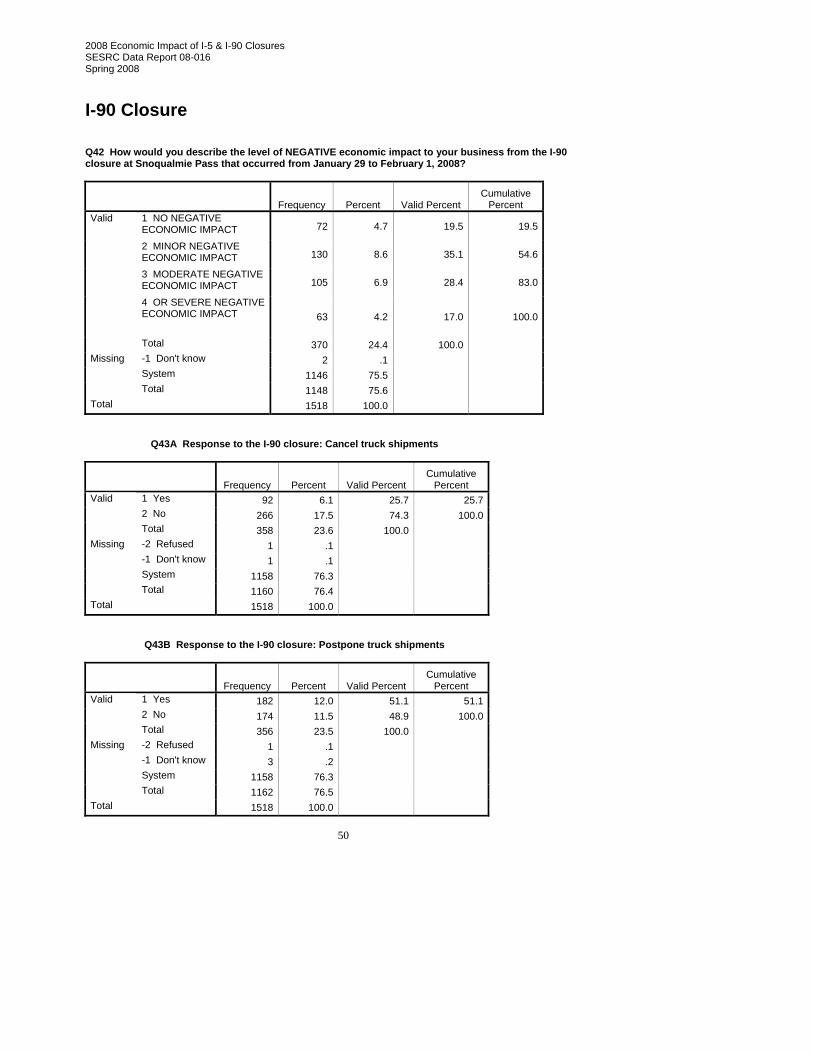
I-90 Closure Q42 How would you describe the level of NEGATIVE economic impact to your business from the I-90 closure at Snoqualmie Pass that occurred from January 29 to February 1, 2008?
Frequency Percent Valid Percent Cumulative
Percent 1 NO NEGATIVE ECONOMIC IMPACT 72 4.7 19.5 19.5
2 MINOR NEGATIVE ECONOMIC IMPACT 130 8.6 35.1 54.6
3 MODERATE NEGATIVE ECONOMIC IMPACT 105 6.9 28.4 83.0
4 OR SEVERE NEGATIVE ECONOMIC IMPACT 63 4.2 17.0 100.0
Valid
Total 370 24.4 100.0 -1 Don't know 2 .1 System 1146 75.5
Missing
Total 1148 75.6 Total 1518 100.0
Q43A Response to the I-90 closure: Cancel truck shipments
Frequency Percent Valid Percent Cumulative
Percent 1 Yes 92 6.1 25.7 25.72 No 266 17.5 74.3 100.0
Valid
Total 358 23.6 100.0 -2 Refused 1 .1 -1 Don't know 1 .1 System 1158 76.3
Missing
Total 1160 76.4 Total 1518 100.0
Q43B Response to the I-90 closure: Postpone truck shipments
Frequency Percent Valid Percent Cumulative
Percent 1 Yes 182 12.0 51.1 51.12 No 174 11.5 48.9 100.0
Valid
Total 356 23.5 100.0 -2 Refused 1 .1 -1 Don't know 3 .2 System 1158 76.3
Missing
Total 1162 76.5 Total 1518 100.0

2008 Economic Impact of I-5 & I-90 Closures SESRC Data Report 08-016 Spring 2008
51
Q43C Response to the I-90 closure: Reroute truck shipments
Frequency Percent Valid Percent Cumulative
Percent 1 Yes 202 13.3 56.7 56.72 No 154 10.1 43.3 100.0
Valid
Total 356 23.5 100.0 -2 Refused 1 .1 -1 Don't know 3 .2 System 1158 76.3
Missing
Total 1162 76.5 Total 1518 100.0
Q43D Response to the I-90 closure: Some Other Response
Frequency Percent Valid Percent Cumulative
Percent 1 Yes 38 2.5 10.6 10.62 No 319 21.0 89.4 100.0
Valid
Total 357 23.5 100.0 -2 Refused 1 .1 -1 Don't know 2 .1 System 1158 76.3
Missing
Total 1161 76.5 Total 1518 100.0
Statistics Q44 How many truck shipments for your business were impacted by I-90 closure?
Valid 344 N Missing 1174
Mean 78.4549 Median 6.0000 Std. Deviation 584.58700 Minimum .00 Maximum 10000.00

2008 Economic Impact of I-5 & I-90 Closures SESRC Data Report 08-016 Spring 2008
52
Q45A Detour used for I-90 closure: Highway 2
Frequency Percent Valid Percent Cumulative
Percent 1 Yes 78 5.1 39.4 39.42 No 120 7.9 60.6 100.0
Valid
Total 198 13.0 100.0 -1 Don't know 7 .5 System 1313 86.5
Missing
Total 1320 87.0 Total 1518 100.0
Q45B Detour used for I-90 closure: Highway 12
Frequency Percent Valid Percent Cumulative
Percent 1 Yes 89 5.9 44.9 44.92 No 109 7.2 55.1 100.0
Valid
Total 198 13.0 100.0 -1 Don't know 7 .5 System 1313 86.5
Missing
Total 1320 87.0 Total 1518 100.0
Q45C Detour used for I-90 closure: Highway 14
Frequency Percent Valid Percent Cumulative
Percent 1 Yes 39 2.6 19.6 19.62 No 160 10.5 80.4 100.0
Valid
Total 199 13.1 100.0 -1 Don't know 6 .4 System 1313 86.5
Missing
Total 1319 86.9 Total 1518 100.0
Q45D Detour used for I-90 closure: I-84
Frequency Percent Valid Percent Cumulative
Percent 1 Yes 116 7.6 58.3 58.32 No 83 5.5 41.7 100.0
Valid
Total 199 13.1 100.0 -1 Don't know 6 .4 System 1313 86.5
Missing
Total 1319 86.9
2008 Economic Impact of I-5 & I-90 Closures SESRC Data Report 08-016 Spring 2008
53
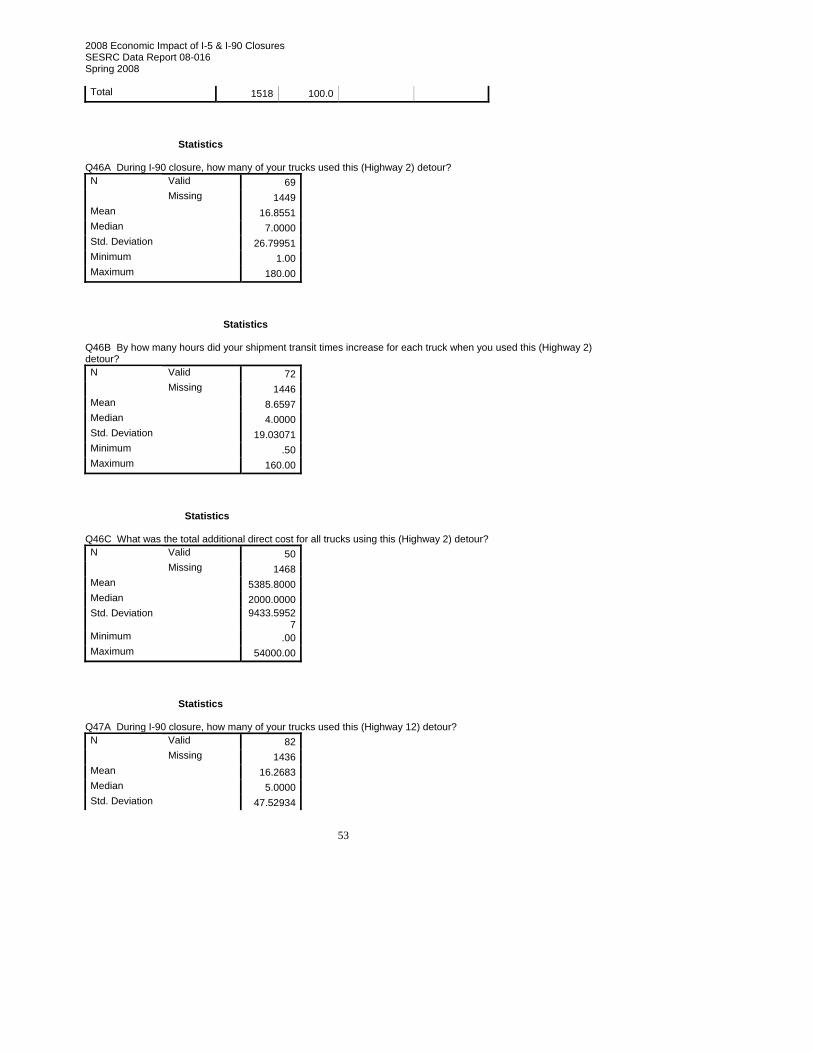
Total 1518 100.0 Statistics Q46A During I-90 closure, how many of your trucks used this (Highway 2) detour?
Valid 69 N Missing 1449
Mean 16.8551 Median 7.0000 Std. Deviation 26.79951 Minimum 1.00 Maximum 180.00
Statistics Q46B By how many hours did your shipment transit times increase for each truck when you used this (Highway 2) detour?
Valid 72 N Missing 1446
Mean 8.6597 Median 4.0000 Std. Deviation 19.03071 Minimum .50 Maximum 160.00
Statistics Q46C What was the total additional direct cost for all trucks using this (Highway 2) detour?
Valid 50 N Missing 1468
Mean 5385.8000 Median 2000.0000 Std. Deviation 9433.5952
7 Minimum .00 Maximum 54000.00
Statistics Q47A During I-90 closure, how many of your trucks used this (Highway 12) detour?
Valid 82 N Missing 1436
Mean 16.2683 Median 5.0000 Std. Deviation 47.52934

2008 Economic Impact of I-5 & I-90 Closures SESRC Data Report 08-016 Spring 2008
54
Minimum .00 Maximum 400.00
Statistics Q47B By how many hours did your shipment transit times increase for each truck when you used this (Highway 12) detour?
Valid 86 N Missing 1432
Mean 8.0349 Median 5.0000 Std. Deviation 15.79683 Minimum .00 Maximum 120.00
Statistics Q47C What was the total additional direct cost for all trucks using this (Highway 12) detour?
Valid 64 N Missing 1454
Mean 3990.5469 Median 1550.0000 Std. Deviation 7323.2426
9 Minimum .00 Maximum 40000.00
Statistics Q48A During I-90 closure, how many of your trucks used this (Highway 14) detour?
Valid 35 N Missing 1483
Mean 6.7714 Median 4.0000 Std. Deviation 8.76855 Minimum .00 Maximum 50.00
Statistics Q48B By how many hours did your shipment transit times increase for each truck when you used this (Highway 14) detour?
Valid 34 N Missing 1484
Mean 11.1912

2008 Economic Impact of I-5 & I-90 Closures SESRC Data Report 08-016 Spring 2008
55
Median 6.5000 Std. Deviation 23.24312 Minimum .00 Maximum 140.00
Statistics Q48C What was the total additional direct cost for all trucks using this (Highway 14) detour?
Valid 30 N Missing 1488
Mean 2060.2333 Median 1450.0000 Std. Deviation 2066.3577
6 Minimum .00 Maximum 10500.00
Statistics Q49A During I-90 closure, how many of your trucks used this (I-84) detour?
Valid 104 N Missing 1414
Mean 16.6923 Median 6.0000 Std. Deviation 28.28086 Minimum .00 Maximum 150.00
Statistics Q49B By how many hours did your shipment transit times increase for each truck when you used this (I-84) detour?
Valid 111 N Missing 1407
Mean 13.7703 Median 6.0000 Std. Deviation 75.47076 Minimum .00 Maximum 800.00
Statistics Q49C What was the total additional direct cost for all trucks using this (I-84) detour?
Valid 84 N Missing 1434
Mean 4977.5690 Median 1600.0000

2008 Economic Impact of I-5 & I-90 Closures SESRC Data Report 08-016 Spring 2008
56
Std. Deviation 8067.68059
Minimum .00 Maximum 35000.00
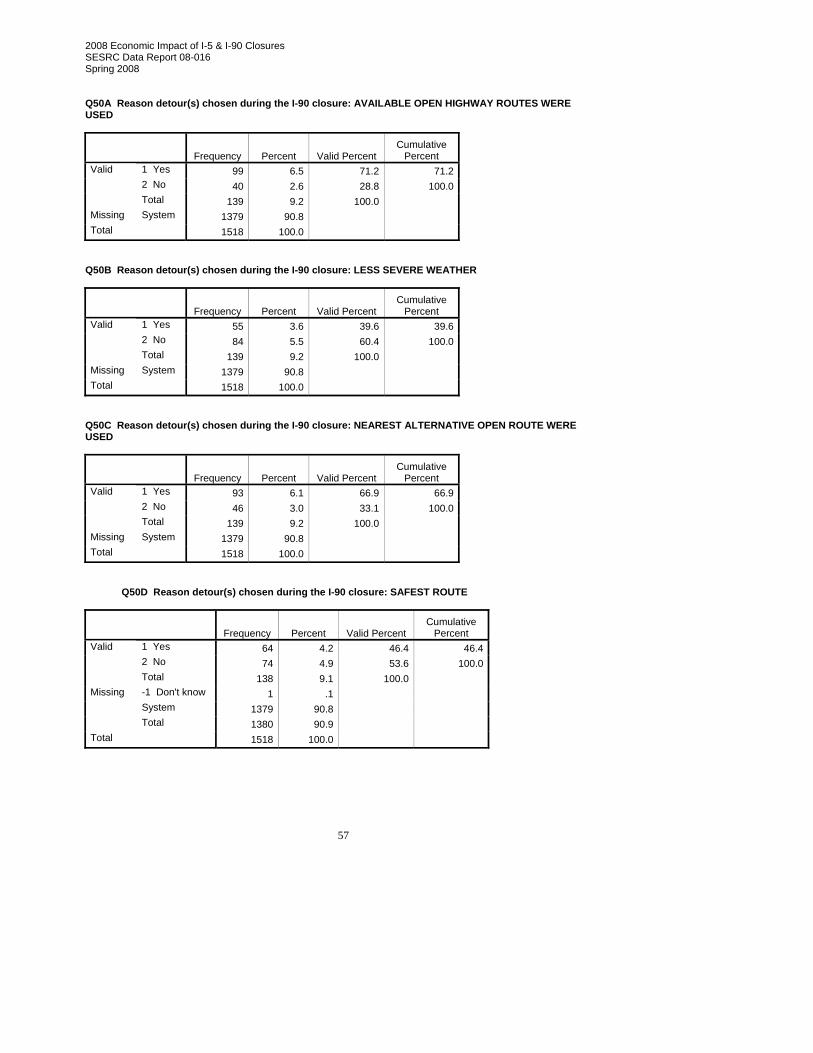
2008 Economic Impact of I-5 & I-90 Closures SESRC Data Report 08-016 Spring 2008
57
Q50A Reason detour(s) chosen during the I-90 closure: AVAILABLE OPEN HIGHWAY ROUTES WERE USED
Frequency Percent Valid Percent Cumulative
Percent 1 Yes 99 6.5 71.2 71.22 No 40 2.6 28.8 100.0
Valid
Total 139 9.2 100.0 Missing System 1379 90.8 Total 1518 100.0
Q50B Reason detour(s) chosen during the I-90 closure: LESS SEVERE WEATHER
Frequency Percent Valid Percent Cumulative
Percent 1 Yes 55 3.6 39.6 39.62 No 84 5.5 60.4 100.0
Valid
Total 139 9.2 100.0 Missing System 1379 90.8 Total 1518 100.0
Q50C Reason detour(s) chosen during the I-90 closure: NEAREST ALTERNATIVE OPEN ROUTE WERE USED
Frequency Percent Valid Percent Cumulative
Percent 1 Yes 93 6.1 66.9 66.92 No 46 3.0 33.1 100.0
Valid
Total 139 9.2 100.0 Missing System 1379 90.8 Total 1518 100.0
Q50D Reason detour(s) chosen during the I-90 closure: SAFEST ROUTE
Frequency Percent Valid Percent Cumulative
Percent 1 Yes 64 4.2 46.4 46.42 No 74 4.9 53.6 100.0
Valid
Total 138 9.1 100.0 -1 Don't know 1 .1 System 1379 90.8
Missing
Total 1380 90.9 Total 1518 100.0

2008 Economic Impact of I-5 & I-90 Closures SESRC Data Report 08-016 Spring 2008
58
Q50E Reason detour(s) chosen during the I-90 closure: SOME OTHER REASON (PLEASE SPECIFY)
Frequency Percent Valid Percent Cumulative
Percent 1 Yes 12 .8 8.6 8.62 No 127 8.4 91.4 100.0
Valid
Total 139 9.2 100.0 Missing System 1379 90.8 Total 1518 100.0
Q51A Information about alternative routes obtained at: HIGHWAY POSTED RADIO CHANNEL
Frequency Percent Valid Percent Cumulative
Percent 1 Yes 39 2.6 10.8 10.82 No 322 21.2 89.2 100.0
Valid
Total 361 23.8 100.0 -2 Refused 1 .1 -1 Don't know 3 .2 System 1153 76.0
Missing
Total 1157 76.2 Total 1518 100.0
Q51B Information about alternative routes obtained at: COMPANY DISPATCH OR CONTACT
Frequency Percent Valid Percent Cumulative
Percent 1 Yes 132 8.7 36.5 36.52 No 230 15.2 63.5 100.0
Valid
Total 362 23.8 100.0 -2 Refused 1 .1 -1 Don't know 2 .1 System 1153 76.0
Missing
Total 1156 76.2 Total 1518 100.0
Q51C Information about alternative routes obtained at: TRUCK WEIGH STATION
Frequency Percent Valid Percent Cumulative
Percent 1 Yes 21 1.4 5.8 5.82 No 341 22.5 94.2 100.0
Valid
Total 362 23.8 100.0 -2 Refused 1 .1 -1 Don't know 2 .1 System 1153 76.0
Missing
Total 1156 76.2

2008 Economic Impact of I-5 & I-90 Closures SESRC Data Report 08-016 Spring 2008
59
Total 1518 100.0 Q51D Information about alternative routes obtained at: WSDOT WEBSITE
Frequency Percent Valid Percent Cumulative
Percent 1 Yes 246 16.2 68.0 68.02 No 116 7.6 32.0 100.0
Valid
Total 362 23.8 100.0 -2 Refused 1 .1 -1 Don't know 2 .1 System 1153 76.0
Missing
Total 1156 76.2 Total 1518 100.0
Q51E Information about alternative routes obtained at: WSDOT FREIGHT EMAIL LISTSERVE
Frequency Percent Valid Percent Cumulative
Percent 1 Yes 25 1.6 6.9 6.92 No 336 22.1 93.1 100.0
Valid
Total 361 23.8 100.0 -2 Refused 1 .1 -1 Don't know 3 .2 System 1153 76.0
Missing
Total 1157 76.2 Total 1518 100.0
Q51F Information about alternative routes obtained at: MEDIA, INCLUDING TV OR RADIO OR PRINT
Frequency Percent Valid Percent Cumulative
Percent 1 Yes 143 9.4 39.5 39.52 No 219 14.4 60.5 100.0
Valid
Total 362 23.8 100.0 -2 Refused 1 .1 -1 Don't know 2 .1 System 1153 76.0
Missing
Total 1156 76.2 Total 1518 100.0

2008 Economic Impact of I-5 & I-90 Closures SESRC Data Report 08-016 Spring 2008
60
Q51G Information about alternative routes obtained at: STATE PATROL
Frequency Percent Valid Percent Cumulative
Percent 1 Yes 43 2.8 11.9 11.92 No 319 21.0 88.1 100.0
Valid
Total 362 23.8 100.0 -2 Refused 1 .1 -1 Don't know 2 .1 System 1153 76.0
Missing
Total 1156 76.2 Total 1518 100.0
Q51H Information about alternative routes obtained at: OTHER (PLEASE SPECIFY)
Frequency Percent Valid Percent Cumulative
Percent 1 Yes 72 4.7 19.9 19.92 No 290 19.1 80.1 100.0
Valid
Total 362 23.8 100.0 -2 Refused 1 .1 -1 Don't know 2 .1 System 1153 76.0
Missing
Total 1156 76.2 Total 1518 100.0
Statistics Q52 What were your company's total ADDITIONAL costs incurred during the I-90 closure at Snoqualmie Pass?
Valid 258 N Missing 1260
Mean 8810.36 Median 1000.00 Std. Deviation 23502.597 Minimum 0 Maximum 200000
Q52C Q52 Web Don't Know
Frequency Percent Valid Percent Cumulative
Percent 1 Checked 36 2.4 23.1 23.12 Not Checked 120 7.9 76.9 100.0
Valid
Total 156 10.3 100.0 Missing System 1362 89.7 Total 1518 100.0

2008 Economic Impact of I-5 & I-90 Closures SESRC Data Report 08-016 Spring 2008
61
Q52A If Q52 Don't know then: Estimate: less than $10,000, more than $10,000, or right around $10,000 dollars?
Frequency Percent Valid Percent Cumulative
Percent 1 Less than $10,000 43 2.8 62.3 62.32 More than $10,000 13 .9 18.8 81.23 Right around $10,000 13 .9 18.8 100.0
Valid
Total 69 4.5 100.0 -1 Don't know 14 .9 System 1435 94.5
Missing
Total 1449 95.5 Total 1518 100.0
Q52B If Q52 Don't know then: Range estimate: <$2,000 - $10,000
Frequency Percent Valid Percent Cumulative
Percent 1 LESS THAN $2,000 26 1.7 60.5 60.52 OVER $2,000 UP TO $4,000 6 .4 14.0 74.4
3 OVER $4,000 UP TO $6,000 7 .5 16.3 90.7
4 OVER $6,000 UP TO $8,000 3 .2 7.0 97.7
5 OR OVER $8,000 UP TO $10,000 1 .1 2.3 100.0
Valid
Total 43 2.8 100.0 -1 Don't know 1 .1 System 1474 97.1
Missing
Total 1475 97.2 Total 1518 100.0
Q53 If Q52 Don't know then: Estimate: less than $100,000, more than $100,000, or right around $100,000 dollars?
Frequency Percent Valid Percent Cumulative
Percent 1 Less than $100,000 8 .5 72.7 72.73 Right around $100,000 3 .2 27.3 100.0
Valid
Total 11 .7 100.0 -1 Don't know 2 .1 System 1505 99.1
Missing
Total 1507 99.3 Total 1518 100.0
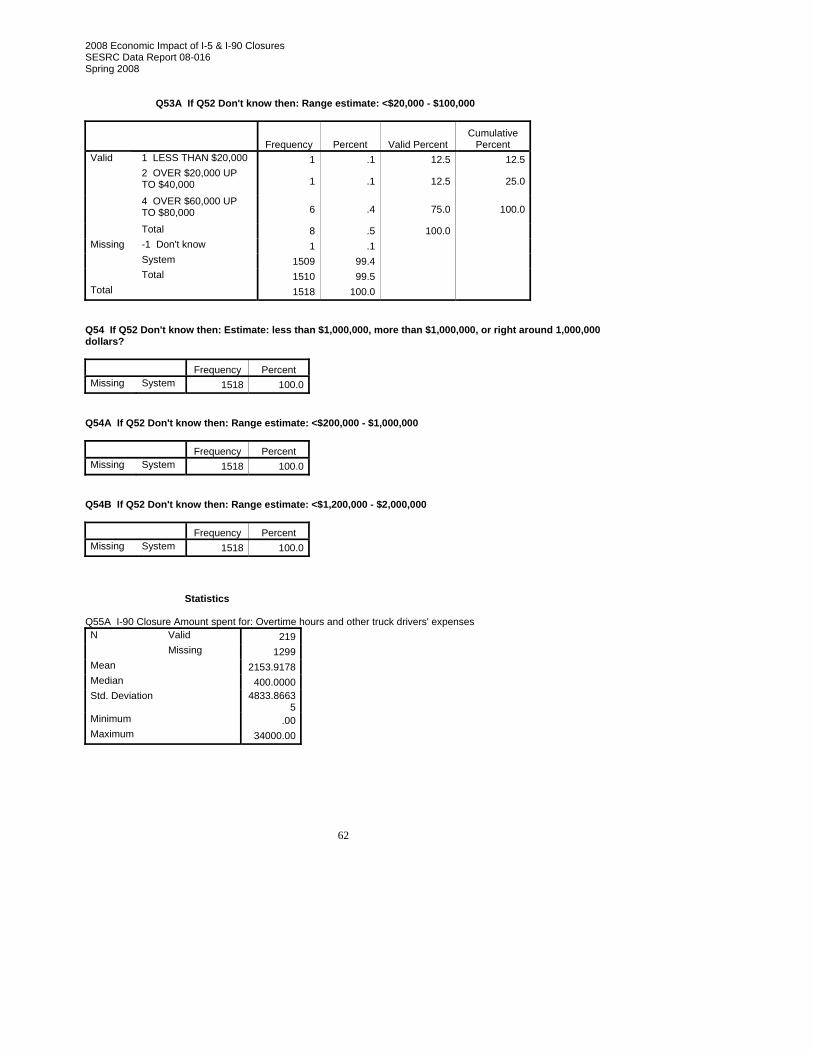
2008 Economic Impact of I-5 & I-90 Closures SESRC Data Report 08-016 Spring 2008
62
Q53A If Q52 Don't know then: Range estimate: <$20,000 - $100,000
Frequency Percent Valid Percent Cumulative
Percent 1 LESS THAN $20,000 1 .1 12.5 12.52 OVER $20,000 UP TO $40,000 1 .1 12.5 25.0
4 OVER $60,000 UP TO $80,000 6 .4 75.0 100.0
Valid
Total 8 .5 100.0 -1 Don't know 1 .1 System 1509 99.4
Missing
Total 1510 99.5 Total 1518 100.0
Q54 If Q52 Don't know then: Estimate: less than $1,000,000, more than $1,000,000, or right around 1,000,000 dollars? Frequency Percent Missing System 1518 100.0
Q54A If Q52 Don't know then: Range estimate: <$200,000 - $1,000,000 Frequency Percent Missing System 1518 100.0
Q54B If Q52 Don't know then: Range estimate: <$1,200,000 - $2,000,000 Frequency Percent Missing System 1518 100.0
Statistics Q55A I-90 Closure Amount spent for: Overtime hours and other truck drivers' expenses
Valid 219 N Missing 1299
Mean 2153.9178 Median 400.0000 Std. Deviation 4833.8663
5 Minimum .00 Maximum 34000.00
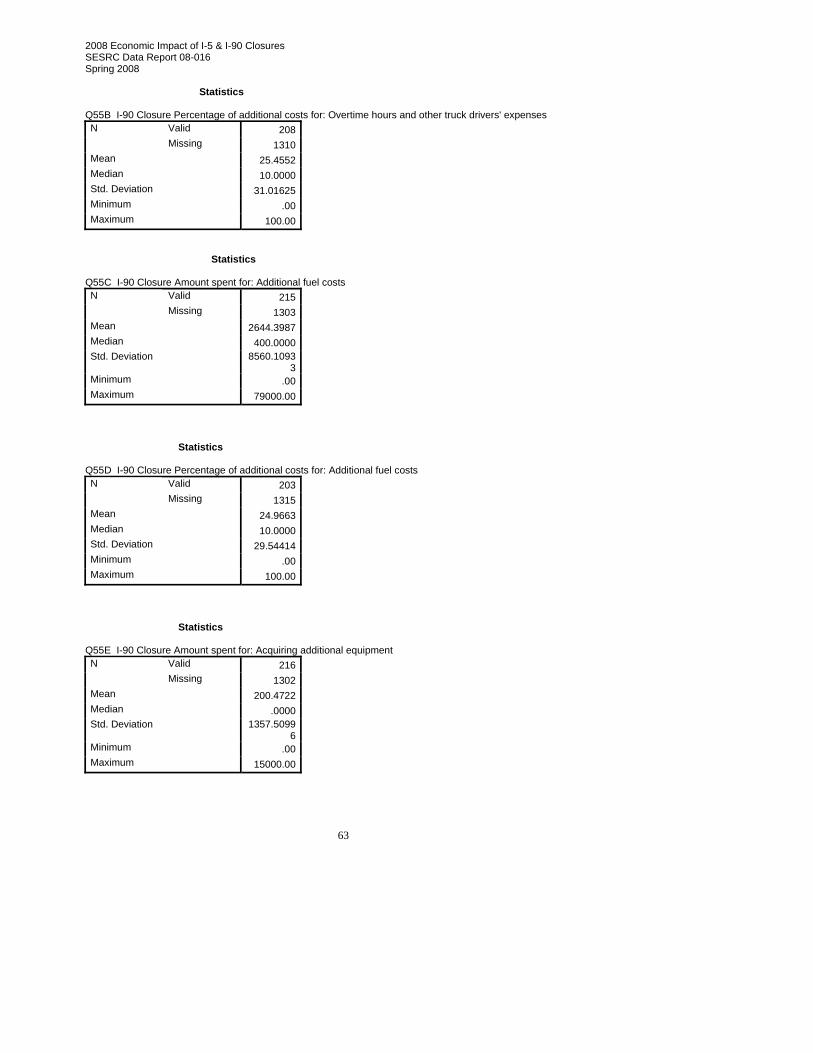
2008 Economic Impact of I-5 & I-90 Closures SESRC Data Report 08-016 Spring 2008
63
Statistics Q55B I-90 Closure Percentage of additional costs for: Overtime hours and other truck drivers' expenses
Valid 208 N Missing 1310
Mean 25.4552 Median 10.0000 Std. Deviation 31.01625 Minimum .00 Maximum 100.00
Statistics Q55C I-90 Closure Amount spent for: Additional fuel costs
Valid 215 N Missing 1303
Mean 2644.3987 Median 400.0000 Std. Deviation 8560.1093
3 Minimum .00 Maximum 79000.00
Statistics Q55D I-90 Closure Percentage of additional costs for: Additional fuel costs
Valid 203 N Missing 1315
Mean 24.9663 Median 10.0000 Std. Deviation 29.54414 Minimum .00 Maximum 100.00
Statistics Q55E I-90 Closure Amount spent for: Acquiring additional equipment
Valid 216 N Missing 1302
Mean 200.4722 Median .0000 Std. Deviation 1357.5099
6 Minimum .00 Maximum 15000.00
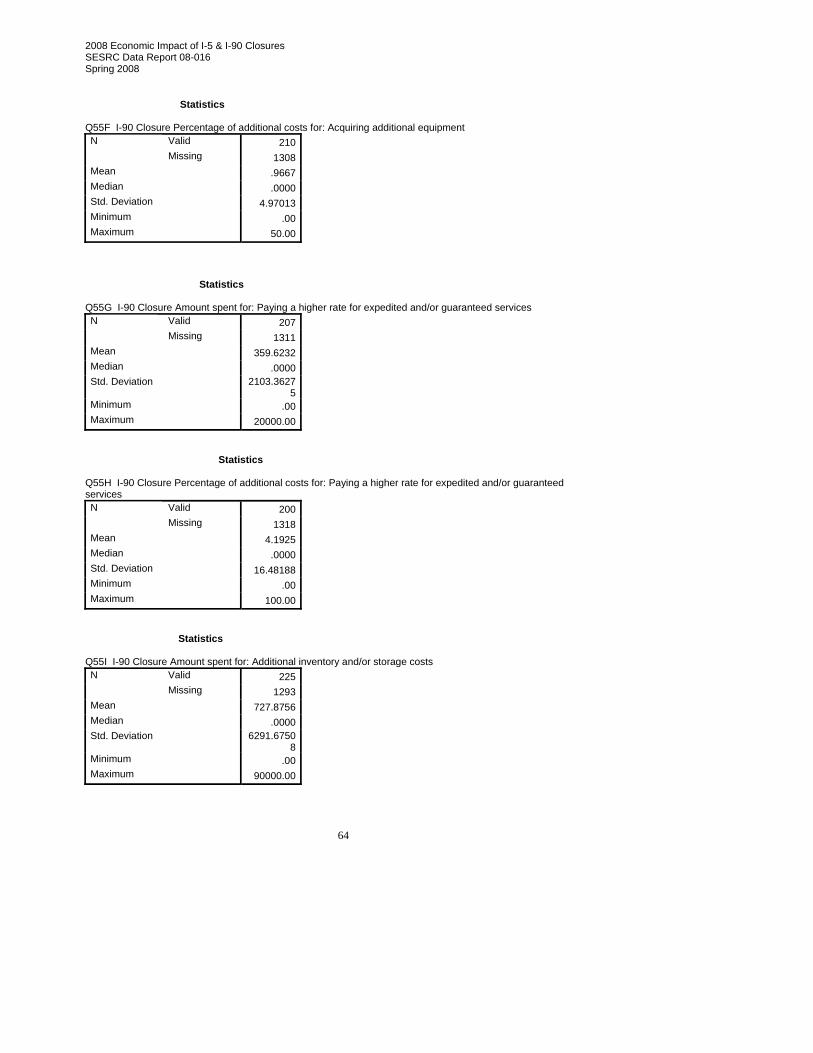
2008 Economic Impact of I-5 & I-90 Closures SESRC Data Report 08-016 Spring 2008
64
Statistics Q55F I-90 Closure Percentage of additional costs for: Acquiring additional equipment
Valid 210 N Missing 1308
Mean .9667 Median .0000 Std. Deviation 4.97013 Minimum .00 Maximum 50.00
Statistics Q55G I-90 Closure Amount spent for: Paying a higher rate for expedited and/or guaranteed services
Valid 207 N Missing 1311
Mean 359.6232 Median .0000 Std. Deviation 2103.3627
5 Minimum .00 Maximum 20000.00
Statistics Q55H I-90 Closure Percentage of additional costs for: Paying a higher rate for expedited and/or guaranteed services
Valid 200 N Missing 1318
Mean 4.1925 Median .0000 Std. Deviation 16.48188 Minimum .00 Maximum 100.00
Statistics Q55I I-90 Closure Amount spent for: Additional inventory and/or storage costs
Valid 225 N Missing 1293
Mean 727.8756 Median .0000 Std. Deviation 6291.6750
8 Minimum .00 Maximum 90000.00
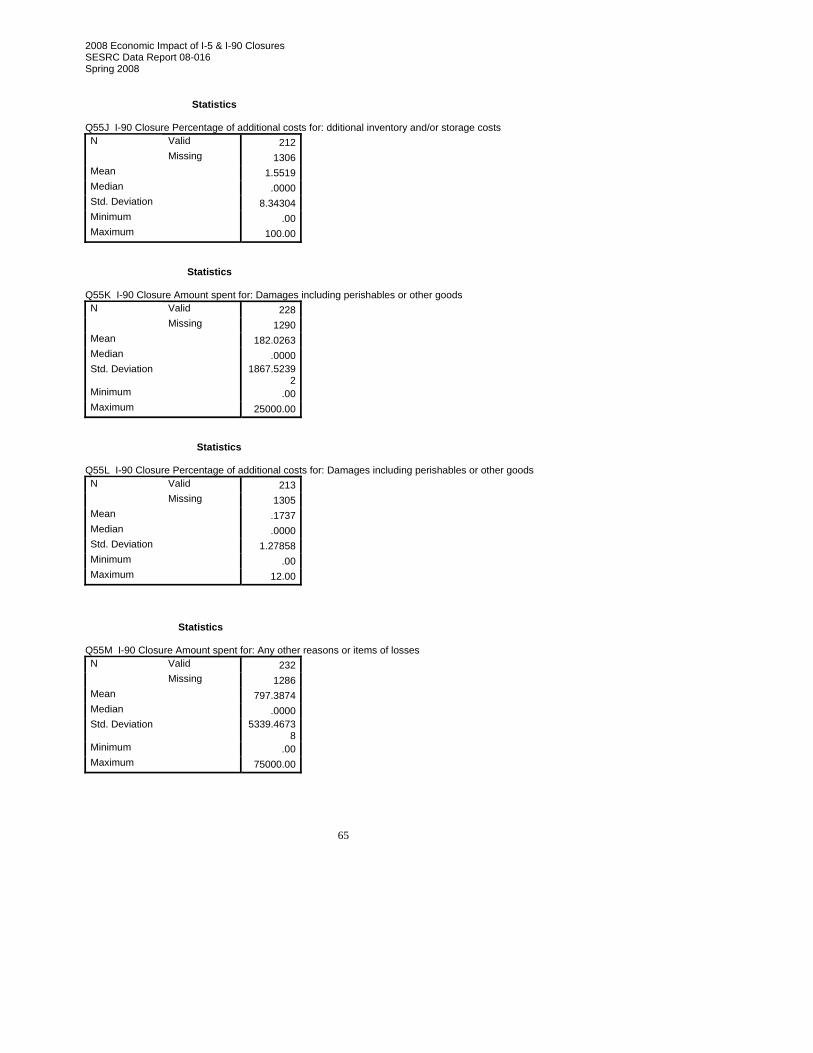
2008 Economic Impact of I-5 & I-90 Closures SESRC Data Report 08-016 Spring 2008
65
Statistics Q55J I-90 Closure Percentage of additional costs for: dditional inventory and/or storage costs
Valid 212 N Missing 1306
Mean 1.5519 Median .0000 Std. Deviation 8.34304 Minimum .00 Maximum 100.00
Statistics Q55K I-90 Closure Amount spent for: Damages including perishables or other goods
Valid 228 N Missing 1290
Mean 182.0263 Median .0000 Std. Deviation 1867.5239
2 Minimum .00 Maximum 25000.00
Statistics Q55L I-90 Closure Percentage of additional costs for: Damages including perishables or other goods
Valid 213 N Missing 1305
Mean .1737 Median .0000 Std. Deviation 1.27858 Minimum .00 Maximum 12.00
Statistics Q55M I-90 Closure Amount spent for: Any other reasons or items of losses
Valid 232 N Missing 1286
Mean 797.3874 Median .0000 Std. Deviation 5339.4673
8 Minimum .00 Maximum 75000.00

2008 Economic Impact of I-5 & I-90 Closures SESRC Data Report 08-016 Spring 2008
66
Statistics Q55N I-90 Closure Percentage of additional costs for: Any other reasons or items of losses
Valid 218 N Missing 1300
Mean 4.6097 Median .0000 Std. Deviation 15.51664 Minimum .00 Maximum 100.00
Statistics Q56 After I-90 reopened, did your company's transportation-related costs immediately return to the previous level?
Valid 333 N Missing 1185
Q56 After I-90 reopened, did your company's transportation-related costs immediately return to the previous level?
Frequency Percent Valid Percent Cumulative
Percent 1 Yes 301 19.8 90.4 90.42 No 32 2.1 9.6 100.0
Valid
Total 333 21.9 100.0 -2 Refused 1 .1 -1 Don't know 30 2.0 System 1154 76.0
Missing
Total 1185 78.1 Total 1518 100.0
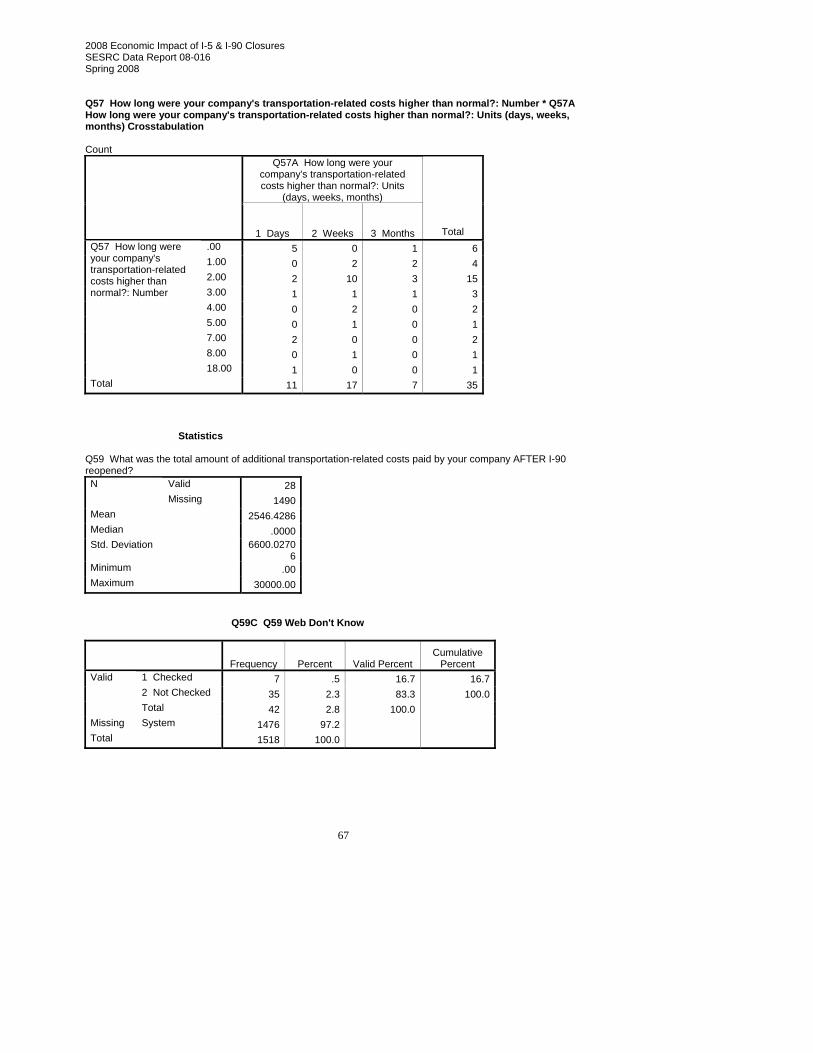
2008 Economic Impact of I-5 & I-90 Closures SESRC Data Report 08-016 Spring 2008
67
Q57 How long were your company's transportation-related costs higher than normal?: Number * Q57A How long were your company's transportation-related costs higher than normal?: Units (days, weeks, months) Crosstabulation Count
Q57A How long were your company's transportation-related costs higher than normal?: Units
(days, weeks, months)
1 Days 2 Weeks 3 Months Total .00 5 0 1 61.00 0 2 2 42.00 2 10 3 153.00 1 1 1 34.00 0 2 0 25.00 0 1 0 17.00 2 0 0 28.00 0 1 0 1
Q57 How long were your company's transportation-related costs higher than normal?: Number
18.00 1 0 0 1Total 11 17 7 35
Statistics Q59 What was the total amount of additional transportation-related costs paid by your company AFTER I-90 reopened?
Valid 28 N Missing 1490
Mean 2546.4286 Median .0000 Std. Deviation 6600.0270
6 Minimum .00 Maximum 30000.00
Q59C Q59 Web Don't Know
Frequency Percent Valid Percent Cumulative
Percent 1 Checked 7 .5 16.7 16.72 Not Checked 35 2.3 83.3 100.0
Valid
Total 42 2.8 100.0 Missing System 1476 97.2 Total 1518 100.0
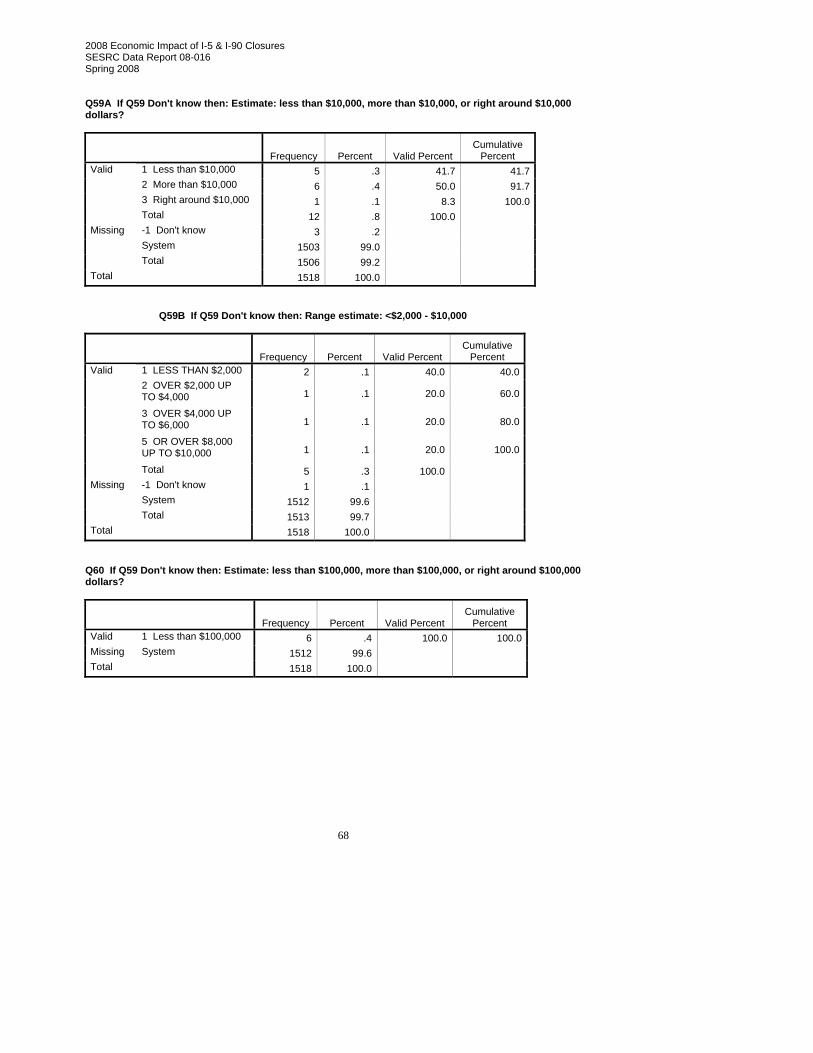
2008 Economic Impact of I-5 & I-90 Closures SESRC Data Report 08-016 Spring 2008
68
Q59A If Q59 Don't know then: Estimate: less than $10,000, more than $10,000, or right around $10,000 dollars?
Frequency Percent Valid Percent Cumulative
Percent 1 Less than $10,000 5 .3 41.7 41.72 More than $10,000 6 .4 50.0 91.73 Right around $10,000 1 .1 8.3 100.0
Valid
Total 12 .8 100.0 -1 Don't know 3 .2 System 1503 99.0
Missing
Total 1506 99.2 Total 1518 100.0
Q59B If Q59 Don't know then: Range estimate: <$2,000 - $10,000
Frequency Percent Valid Percent Cumulative
Percent 1 LESS THAN $2,000 2 .1 40.0 40.02 OVER $2,000 UP TO $4,000 1 .1 20.0 60.0
3 OVER $4,000 UP TO $6,000 1 .1 20.0 80.0
5 OR OVER $8,000 UP TO $10,000 1 .1 20.0 100.0
Valid
Total 5 .3 100.0 -1 Don't know 1 .1 System 1512 99.6
Missing
Total 1513 99.7 Total 1518 100.0
Q60 If Q59 Don't know then: Estimate: less than $100,000, more than $100,000, or right around $100,000 dollars?
Frequency Percent Valid Percent Cumulative
Percent Valid 1 Less than $100,000 6 .4 100.0 100.0Missing System 1512 99.6 Total 1518 100.0

2008 Economic Impact of I-5 & I-90 Closures SESRC Data Report 08-016 Spring 2008
69
Q60A If Q59 Don't know then: Range estimate: <$20,000 - $100,000
Frequency Percent Valid Percent Cumulative
Percent 1 LESS THAN $20,000 2 .1 33.3 33.32 OVER $20,000 UP TO $40,000 1 .1 16.7 50.0
3 OVER $40,000 UP TO $60,000 2 .1 33.3 83.3
4 OVER $60,000 UP TO $80,000 1 .1 16.7 100.0
Valid
Total 6 .4 100.0 Missing System 1512 99.6 Total 1518 100.0
Q61 If Q59 Don't know then: Estimate: less than $1,000,000, more than $1,000,000, or right around 1,000,000 dollars? Frequency Percent Missing System 1518 100.0
Q61A If Q59 Don't know then: Range estimate: <$200,000 - $1,000,000 Frequency Percent Missing System 1518 100.0
Q61B If Q59 Don't know then: Range estimate: <$1,200,000 - $2,000,000 Frequency Percent Missing System 1518 100.0
Q62 Did you recover any of the additional costs due to the closure?
Frequency Percent Valid Percent Cumulative
Percent 1 Yes 49 3.2 15.1 15.12 No 275 18.1 84.9 100.0
Valid
Total 324 21.3 100.0 -2 Refused 2 .1 -1 Don't know 38 2.5 System 1154 76.0
Missing
Total 1194 78.7 Total 1518 100.0

2008 Economic Impact of I-5 & I-90 Closures SESRC Data Report 08-016 Spring 2008
70
Q62A Type of additional costs recovered, I-90 closure: OVERTIME AND/OR OTHER EXPENSES FOR TRUCK DRIVERS
Frequency Percent Valid Percent Cumulative
Percent 1 Yes 22 1.4 28.2 28.22 No 56 3.7 71.8 100.0
Valid
Total 78 5.1 100.0 -1 Don't know 1 .1 System 1439 94.8
Missing
Total 1440 94.9 Total 1518 100.0
Q62B Type of additional costs recovered, I-90 closure: ADDITIONAL FUEL COSTS
Frequency Percent Valid Percent Cumulative
Percent 1 Yes 36 2.4 46.2 46.22 No 42 2.8 53.8 100.0
Valid
Total 78 5.1 100.0 -1 Don't know 1 .1 System 1439 94.8
Missing
Total 1440 94.9 Total 1518 100.0
Q62C Type of additional costs recovered, I-90 closure: ACQUIRING ADDITIONAL EQUIPMENT
Frequency Percent Valid Percent Cumulative
Percent 1 Yes 1 .1 1.3 1.32 No 77 5.1 98.7 100.0
Valid
Total 78 5.1 100.0 -1 Don't know 1 .1 System 1439 94.8
Missing
Total 1440 94.9 Total 1518 100.0
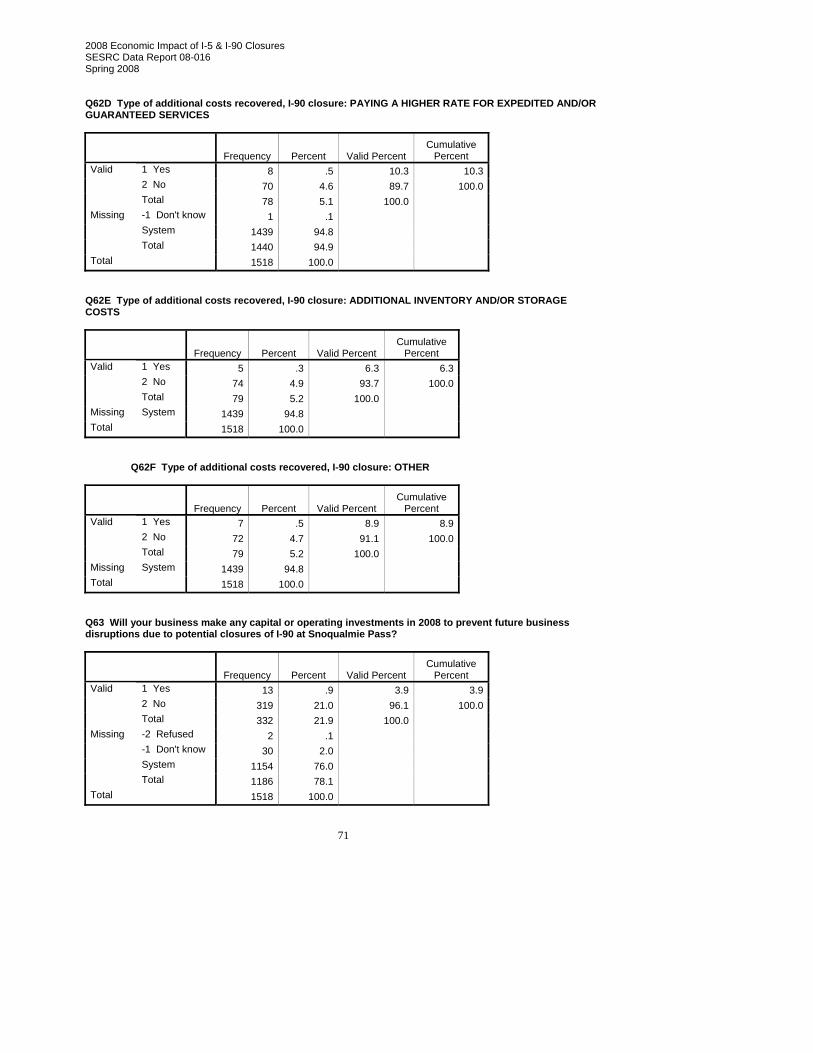
2008 Economic Impact of I-5 & I-90 Closures SESRC Data Report 08-016 Spring 2008
71
Q62D Type of additional costs recovered, I-90 closure: PAYING A HIGHER RATE FOR EXPEDITED AND/OR GUARANTEED SERVICES
Frequency Percent Valid Percent Cumulative
Percent 1 Yes 8 .5 10.3 10.32 No 70 4.6 89.7 100.0
Valid
Total 78 5.1 100.0 -1 Don't know 1 .1 System 1439 94.8
Missing
Total 1440 94.9 Total 1518 100.0
Q62E Type of additional costs recovered, I-90 closure: ADDITIONAL INVENTORY AND/OR STORAGE COSTS
Frequency Percent Valid Percent Cumulative
Percent 1 Yes 5 .3 6.3 6.32 No 74 4.9 93.7 100.0
Valid
Total 79 5.2 100.0 Missing System 1439 94.8 Total 1518 100.0
Q62F Type of additional costs recovered, I-90 closure: OTHER
Frequency Percent Valid Percent Cumulative
Percent 1 Yes 7 .5 8.9 8.92 No 72 4.7 91.1 100.0
Valid
Total 79 5.2 100.0 Missing System 1439 94.8 Total 1518 100.0
Q63 Will your business make any capital or operating investments in 2008 to prevent future business disruptions due to potential closures of I-90 at Snoqualmie Pass?
Frequency Percent Valid Percent Cumulative
Percent 1 Yes 13 .9 3.9 3.92 No 319 21.0 96.1 100.0
Valid
Total 332 21.9 100.0 -2 Refused 2 .1 -1 Don't know 30 2.0 System 1154 76.0
Missing
Total 1186 78.1 Total 1518 100.0

2008 Economic Impact of I-5 & I-90 Closures SESRC Data Report 08-016 Spring 2008
72
Statistics Q63A What is the estimated cost associated with this I-90 transportation disruption prevention plan in 2008?
Valid 8 N Missing 1510
Mean 32087.6250
Median 4600.5000 Std. Deviation 49112.079
65 Minimum .00 Maximum 120000.00
Statistics Q64 Please estimate the value of any lost sales your company experienced due to the I-90 closure.
Valid 261 N Missing 1257
Mean 11852.4521
Median .0000 Std. Deviation 51314.207
44 Minimum .00 Maximum 600000.00
Q64C Q64 Web Don't Know
Frequency Percent Valid Percent Cumulative
Percent 1 Checked 39 2.6 25.0 25.02 Not Checked 117 7.7 75.0 100.0
Valid
Total 156 10.3 100.0 Missing System 1362 89.7 Total 1518 100.0
Q64A If Q64 Don't know then: Estimate: less than $10,000, more than $10,000, or right around $10,000 dollars?
Frequency Percent Valid Percent Cumulative
Percent 1 Less than $10,000 30 2.0 45.5 45.52 More than $10,000 16 1.1 24.2 69.73 Right around $10,000 8 .5 12.1 81.84 no loss of sales 12 .8 18.2 100.0
Valid
Total 66 4.3 100.0 -1 Don't know 17 1.1 Missing System 1435 94.5

2008 Economic Impact of I-5 & I-90 Closures SESRC Data Report 08-016 Spring 2008
73
Total 1452 95.7 Total 1518 100.0
Q64B If Q64 Don't know then: Range estimate: <$2,000 - $10,000
Frequency Percent Valid Percent Cumulative
Percent 1 LESS THAN $2,000 16 1.1 48.5 48.52 OVER $2,000 UP TO $4,000 6 .4 18.2 66.7
3 OVER $4,000 UP TO $6,000 6 .4 18.2 84.8
4 OVER $6,000 UP TO $8,000 4 .3 12.1 97.0
5 OR OVER $8,000 UP TO $10,000 1 .1 3.0 100.0
Valid
Total 33 2.2 100.0 -1 Don't know 1 .1 System 1484 97.8
Missing
Total 1485 97.8 Total 1518 100.0
Q65 If Q64 Don't know then: Estimate: less than $100,000, more than $100,000, or right around $100,000 dollars?
Frequency Percent Valid Percent Cumulative
Percent 1 less than $100,000 11 .7 64.7 64.72 more than $100,000 3 .2 17.6 82.43 right around $100,000 3 .2 17.6 100.0
Valid
Total 17 1.1 100.0 Missing System 1501 98.9 Total 1518 100.0
Q65A If Q64 Don't know then: Range estimate: <$20,000 - $100,000
Frequency Percent Valid Percent Cumulative
Percent 1 LESS THAN $20,000 2 .1 18.2 18.22 OVER $20,000 UP TO $40,000 4 .3 36.4 54.5
3 OVER $40,000 UP TO $60,000 1 .1 9.1 63.6
4 OVER $60,000 UP TO $80,000 2 .1 18.2 81.8
5 OR OVER $80,000 UP TO $100,000 2 .1 18.2 100.0
Valid
Total 11 .7 100.0

2008 Economic Impact of I-5 & I-90 Closures SESRC Data Report 08-016 Spring 2008
74
Missing System 1507 99.3 Total 1518 100.0
Q66 If Q64 Don't know then: Estimate: less than $1,000,000, more than $1,000,000, or right around 1,000,000 dollars?
Frequency Percent Valid Percent Cumulative
Percent Valid 1 Less than $1,000,000 3 .2 100.0 100.0Missing System 1515 99.8 Total 1518 100.0
Q66A If Q64 Don't know then: Range estimate: <$200,000 - $1,000,000
Frequency Percent Valid Percent Cumulative
Percent 1 LESS THAN $200,000 1 .1 50.0 50.03 OVER $400,000 UP TO $600,000 1 .1 50.0 100.0
Valid
Total 2 .1 100.0 -1 Don't know 1 .1 System 1515 99.8
Missing
Total 1516 99.9 Total 1518 100.0
Q66B If Q64 Don't know then: Range estimate: <$1,200,000 - $2,000,000 Frequency Percent Missing System 1518 100.0
Q66C I-90 closure: How did you estimate (the value of any lost sales)
Frequency Percent Valid Percent Cumulative
Percent 0 1 .1 .9 .91 Comments 107 7.0 97.3 98.22 No comments 2 .1 1.8 100.0
Valid
Total 110 7.2 100.0 -2 Refused 4 .3 -1 Don't know 2 .1 System 1402 92.4
Missing
Total 1408 92.8 Total 1518 100.0

2008 Economic Impact of I-5 & I-90 Closures SESRC Data Report 08-016 Spring 2008
75
Q67 Why did your business NOT have any loss of sales or business opportunities? (I-90 closure)
Frequency Percent Valid Percent Cumulative
Percent 1 Comments 73 4.8 97.3 97.32 No comments 2 .1 2.7 100.0
Valid
Total 75 4.9 100.0 -1 Don't know 1 .1 System 1442 95.0
Missing
Total 1443 95.1 Total 1518 100.0
Statistics Q68A What percentage of your company's total annual revenues does this LOSS represent? (I-90 closure)
Valid 179 N Missing 1339
Mean 2.2265 Median .4000 Std. Deviation 6.12249 Minimum .00 Maximum 50.00
Statistics Q68B What percentage of your company's total lost sales due to the I-90 closure occurred in January and February 2008?
Valid 181 N Missing 1337
Mean 25.7109 Median 1.0000 Std. Deviation 41.37142 Minimum .00 Maximum 100.00

2008 Economic Impact of I-5 & I-90 Closures SESRC Data Report 08-016 Spring 2008
76
Statistics Q69A Do you anticipate ongoing lost sales in the future due to the January 29 to February 1 I-90 closure?
Valid 247 N Missing 1271
Q69A Do you anticipate ongoing lost sales in the future due to the January 29 to February 1 I-90 closure?
Frequency Percent Valid Percent Cumulative
Percent 1 Yes 10 .7 4.0 4.02 No 237 15.6 96.0 100.0
Valid
Total 247 16.3 100.0 -2 Refused 3 .2 -1 Don't know 24 1.6 System 1244 81.9
Missing
Total 1271 83.7 Total 1518 100.0
Statistics Q69B What is your best estimate of on-going lost sales per month? (I-90 closure)
Valid 7 N Missing 1511
Mean 7857.8571 Median 2000.0000 Std. Deviation 8609.8644
3 Minimum 5.00 Maximum 20000.00

2008 Economic Impact of I-5 & I-90 Closures SESRC Data Report 08-016 Spring 2008
77
Q70 For how long do you anticipate this ongoing lost sales will continue?: Number * Q70A For how long do you anticipate this ongoing lost sales will continue?: Unit (days, weeks, months) Crosstabulation Count
Q70A For how long do you
anticipate this ongoing lost
sales will continue?: Unit (days, weeks,
months)
3 Months Total 3.00 2 24.00 1 16.00 1 18.00 1 1
Q70 For how long do you anticipate this ongoing lost sales will continue?: Number
9.00 1 1Total 6 6

2008 Economic Impact of I-5 & I-90 Closures SESRC Data Report 08-016 Spring 2008
78
General Company Demographics Statistics Q71 What are the total annual sales (revenue) for your business in Washington State?
Valid 242 N Missing 1276
Mean 30677865.25
Median 2000000.00
Std. Deviation 321843192.526
Minimum 0 Maximum 50000000
00 Q71C Q71 Web Don't Know
Frequency Percent Valid Percent Cumulative
Percent 1 Checked 60 4.0 37.0 37.02 Not Checked 102 6.7 63.0 100.0
Valid
Total 162 10.7 100.0 Missing System 1356 89.3 Total 1518 100.0
Q71A If Q71 Don't know then: Estimate: less than $10,000, more than $10,000, or right around $10,000 dollars?
Frequency Percent Valid Percent Cumulative
Percent 1 Less than $10,000 9 .6 9.2 9.22 More than $10,000 81 5.3 82.7 91.83 Right around $10,000 8 .5 8.2 100.0
Valid
Total 98 6.5 100.0 -2 Refused 3 .2 -1 Don't know 33 2.2 System 1384 91.2
Missing
Total 1420 93.5 Total 1518 100.0
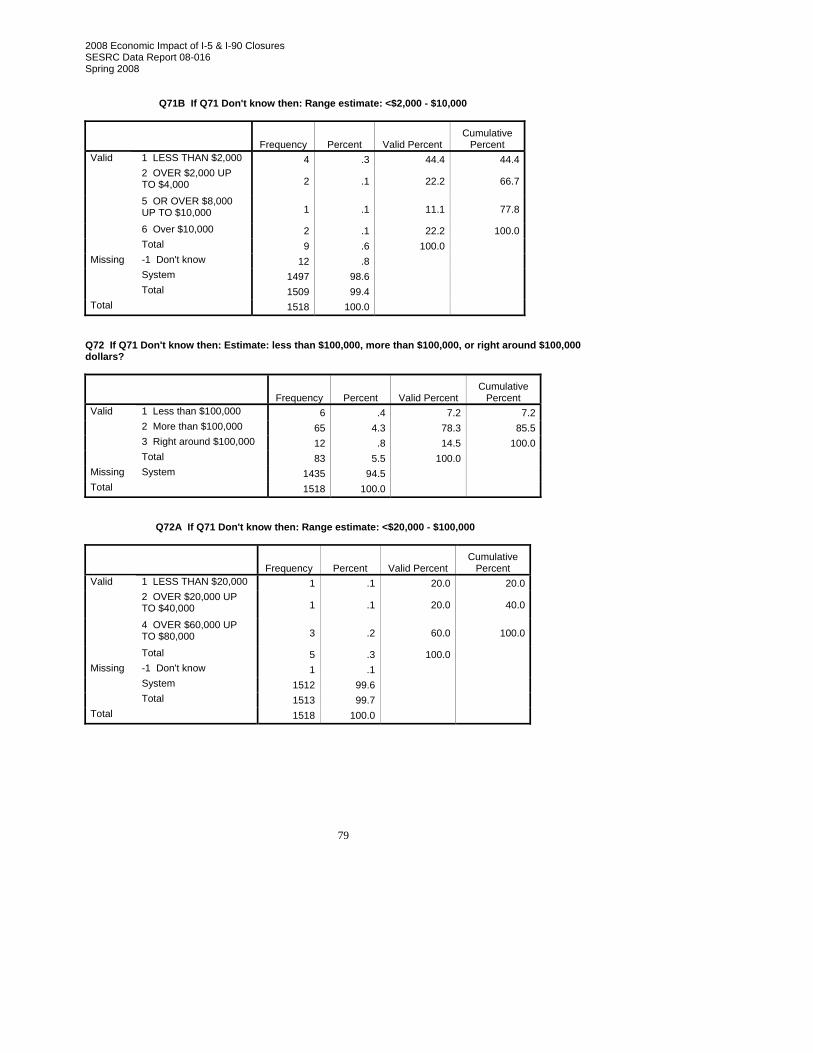
2008 Economic Impact of I-5 & I-90 Closures SESRC Data Report 08-016 Spring 2008
79
Q71B If Q71 Don't know then: Range estimate: <$2,000 - $10,000
Frequency Percent Valid Percent Cumulative
Percent 1 LESS THAN $2,000 4 .3 44.4 44.42 OVER $2,000 UP TO $4,000 2 .1 22.2 66.7
5 OR OVER $8,000 UP TO $10,000 1 .1 11.1 77.8
6 Over $10,000 2 .1 22.2 100.0
Valid
Total 9 .6 100.0 -1 Don't know 12 .8 System 1497 98.6
Missing
Total 1509 99.4 Total 1518 100.0
Q72 If Q71 Don't know then: Estimate: less than $100,000, more than $100,000, or right around $100,000 dollars?
Frequency Percent Valid Percent Cumulative
Percent 1 Less than $100,000 6 .4 7.2 7.22 More than $100,000 65 4.3 78.3 85.53 Right around $100,000 12 .8 14.5 100.0
Valid
Total 83 5.5 100.0 Missing System 1435 94.5 Total 1518 100.0
Q72A If Q71 Don't know then: Range estimate: <$20,000 - $100,000
Frequency Percent Valid Percent Cumulative
Percent 1 LESS THAN $20,000 1 .1 20.0 20.02 OVER $20,000 UP TO $40,000 1 .1 20.0 40.0
4 OVER $60,000 UP TO $80,000 3 .2 60.0 100.0
Valid
Total 5 .3 100.0 -1 Don't know 1 .1 System 1512 99.6
Missing
Total 1513 99.7 Total 1518 100.0

2008 Economic Impact of I-5 & I-90 Closures SESRC Data Report 08-016 Spring 2008
80
Q73 If Q71 Don't know then: Estimate: less than $1,000,000, more than $1,000,000, or right around 1,000,000 dollars?
Frequency Percent Valid Percent Cumulative
Percent 1 Less than $1,000,000 18 1.2 29.0 29.02 More than $1,000,000 36 2.4 58.1 87.13 Right around $1,000,000 8 .5 12.9 100.0
Valid
Total 62 4.1 100.0 -1 Don't know 3 .2 System 1453 95.7
Missing
Total 1456 95.9 Total 1518 100.0
Q73A If Q71 Don't know then: Range estimate: <$200,000 - $1,000,000
Frequency Percent Valid Percent Cumulative
Percent 1 LESS THAN $200,000 2 .1 11.1 11.12 OVER $200,000 UP TO $400,000 5 .3 27.8 38.9
3 OVER $400,000 UP TO $600,000 5 .3 27.8 66.7
4 OVER $600,000 UP TO $800,000 3 .2 16.7 83.3
5 OR OVER $800,000 UP TO $1,000,000 3 .2 16.7 100.0
Valid
Total 18 1.2 100.0 -1 Don't know 1 .1 System 1499 98.7
Missing
Total 1500 98.8 Total 1518 100.0
Q73B If Q71 Don't know then: Range estimate: <$1,200,000 - $2,000,000
Frequency Percent Valid Percent Cumulative
Percent 1 LESS THAN $1,200,000 (12 million) 6 .4 18.2 18.2
2 OVER $1,200,000 UP TO $1,400,000 1 .1 3.0 21.2
5 OVER $1,800,000 UP TO $2,000,000 2 .1 6.1 27.3
6 OR OVER $2,000,000 24 1.6 72.7 100.0
Valid
Total 33 2.2 100.0 -1 Don't know 3 .2 Missing System 1482 97.6

2008 Economic Impact of I-5 & I-90 Closures SESRC Data Report 08-016 Spring 2008
81
Total 1485 97.8 Total 1518 100.0
Q75 If we have any questions and wish to follow up, may we contact you?
Frequency Percent Valid Percent Cumulative
Percent 1 Yes 374 24.6 86.8 86.82 No 57 3.8 13.2 100.0
Valid
Total 431 28.4 100.0 -1 Don't know 3 .2 System 1084 71.4
Missing
Total 1087 71.6 Total 1518 100.0
Q76 Would you like to receive the survey results by e-mail or have them mailed to you?
Frequency Percent Valid Percent Cumulative
Percent 1 Yes, email me the website for the report 187 12.3 43.7 43.7
2 Yes, send me a hard copy 114 7.5 26.6 70.3
3 No 127 8.4 29.7 100.0
Valid
Total 428 28.2 100.0 -1 6 .4 System 1084 71.4
Missing
Total 1090 71.8 Total 1518 100.0
THX Respondent Comments
Frequency Percent Valid Percent Cumulative
Percent 1 Yes, comments 30 2.0 11.0 11.02 No comments 242 15.9 89.0 100.0
Valid
Total 272 17.9 100.0 Missing System 1246 82.1 Total 1518 100.0
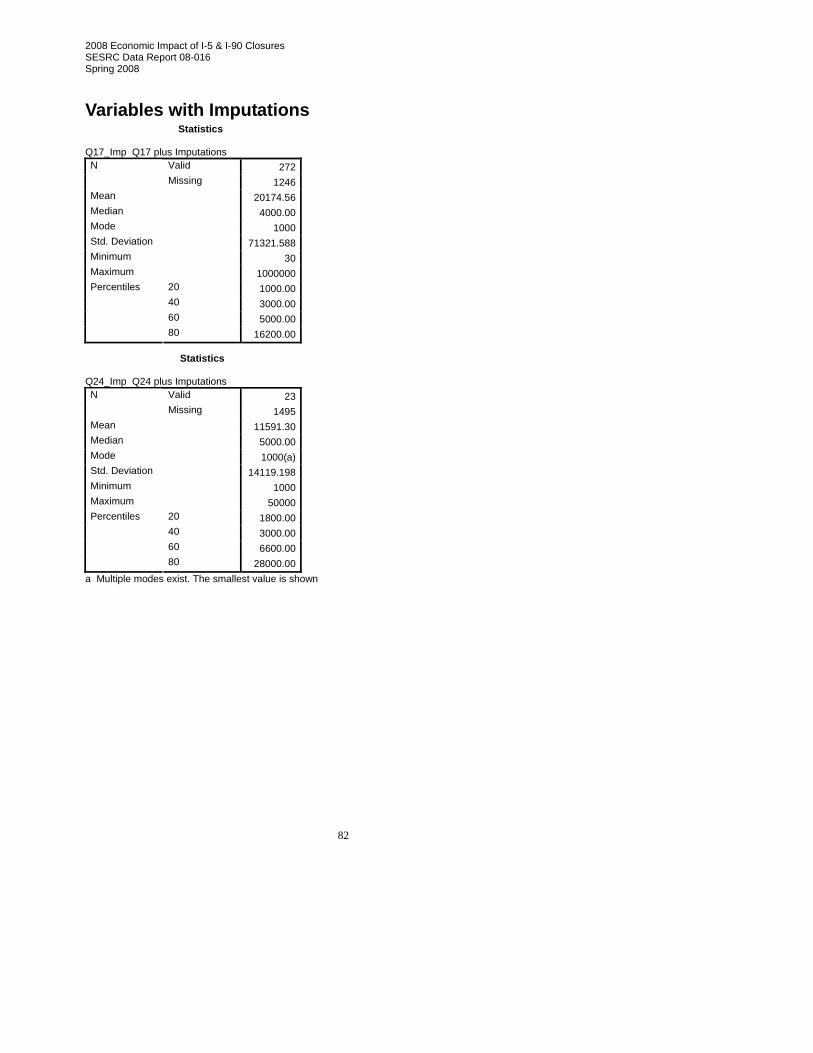
2008 Economic Impact of I-5 & I-90 Closures SESRC Data Report 08-016 Spring 2008
82
Variables with Imputations Statistics Q17_Imp Q17 plus Imputations
Valid 272 N Missing 1246
Mean 20174.56 Median 4000.00 Mode 1000 Std. Deviation 71321.588 Minimum 30 Maximum 1000000
20 1000.00 40 3000.00 60 5000.00
Percentiles
80 16200.00 Statistics Q24_Imp Q24 plus Imputations
Valid 23 N Missing 1495
Mean 11591.30 Median 5000.00 Mode 1000(a) Std. Deviation 14119.198 Minimum 1000 Maximum 50000
20 1800.00 40 3000.00 60 6600.00
Percentiles
80 28000.00 a Multiple modes exist. The smallest value is shown
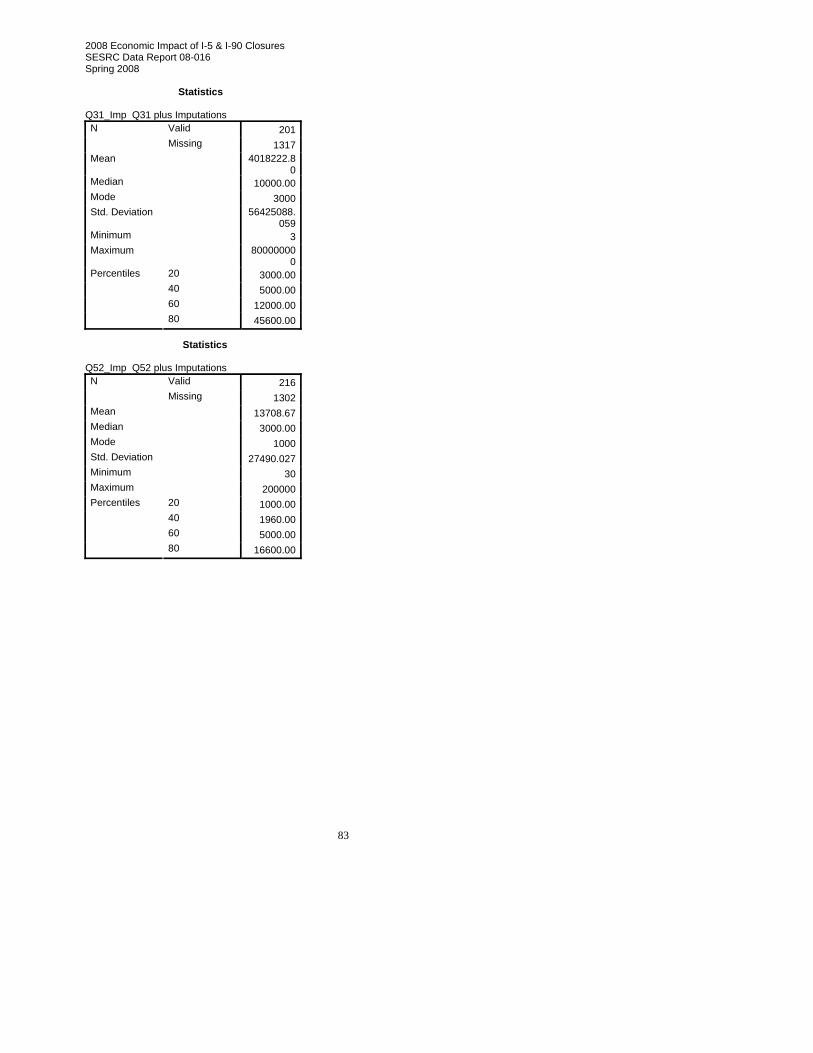
2008 Economic Impact of I-5 & I-90 Closures SESRC Data Report 08-016 Spring 2008
83
Statistics Q31_Imp Q31 plus Imputations
Valid 201 N Missing 1317
Mean 4018222.80
Median 10000.00 Mode 3000 Std. Deviation 56425088.
059 Minimum 3 Maximum 80000000
0 20 3000.00 40 5000.00 60 12000.00
Percentiles
80 45600.00 Statistics Q52_Imp Q52 plus Imputations
Valid 216 N Missing 1302
Mean 13708.67 Median 3000.00 Mode 1000 Std. Deviation 27490.027 Minimum 30 Maximum 200000
20 1000.00 40 1960.00 60 5000.00
Percentiles
80 16600.00

2008 Economic Impact of I-5 & I-90 Closures SESRC Data Report 08-016 Spring 2008
84
Statistics Q59_Imp Q59 plus Imputations
Valid 21 N Missing 1497
Mean 14776.19 Median 5000.00 Mode 1000 Std. Deviation 19861.569 Minimum 500 Maximum 70000
20 1000.00 40 3000.00 60 10000.00
Percentiles
80 30000.00 Statistics Q64_Imp Q64 plus Imputations
Valid 147 N Missing 1371
Mean 29289.05 Median 5000.00 Mode 1000 Std. Deviation 77988.241 Minimum 1 Maximum 600000
20 1000.00 40 4000.00 60 10000.00
Percentiles
80 30000.00

2008 Economic Impact of I-5 & I-90 Closures SESRC Data Report 08-016 Spring 2008
85
Statistics Q71_Imp Q71 plus Imputations
Valid 306 N Missing 1212
Mean 24495200.62
Median 1750000.00
Mode 2000000 Std. Deviation 28634371
1.225 Minimum 1000 Maximum 50000000
00 20 300000.00 40 1000000.0
0 60 2000000.0
0
Percentiles
80 8600000.00

2008 Economic Impact of I-5 & I-90 Closures SESRC Data Report 08-016 Spring 2008
86
Categorical Variables with Imputations Q17_Cat Categorical Q17_Imp
Frequency Percent Valid Percent Cumulative
Percent 1 Under 1000 94 6.2 27.7 27.72 1000 - 2000 50 3.3 14.7 42.53 2000 - 3000 26 1.7 7.7 50.14 3000 - 4000 31 2.0 9.1 59.35 4000 - 5000 8 .5 2.4 61.76 5000 - 6000 25 1.6 7.4 69.07 6000 - 7000 2 .1 .6 69.68 7000 - 8000 7 .5 2.1 71.79 8000 - 9000 3 .2 .9 72.610 9000 - 10000 10 .7 2.9 75.511 10000 - 11000 18 1.2 5.3 80.813 12000 - 20000 13 .9 3.8 84.714 20000 - 40000 21 1.4 6.2 90.915 40000 - 60000 8 .5 2.4 93.216 60000 - 80000 8 .5 2.4 95.617 80000 - 100000 3 .2 .9 96.518 Over 100000 12 .8 3.5 100.0
Valid
Total 339 22.3 100.0 Missing System 1179 77.7 Total 1518 100.0
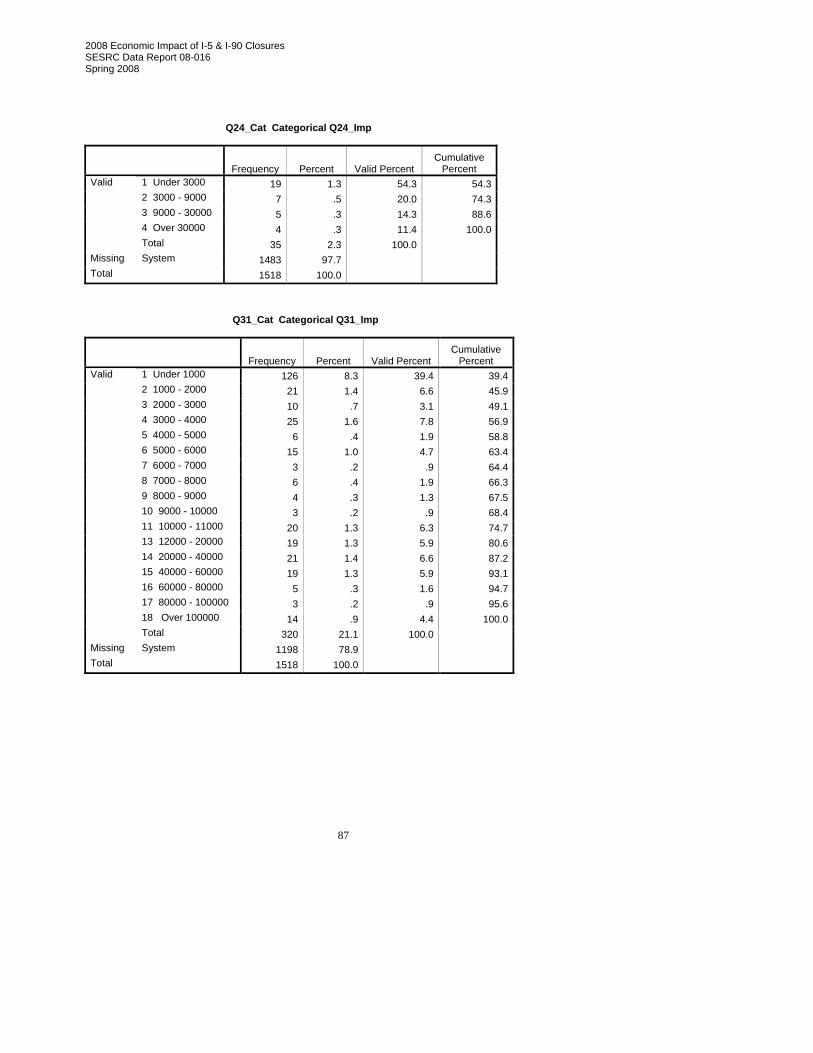
2008 Economic Impact of I-5 & I-90 Closures SESRC Data Report 08-016 Spring 2008
87
Q24_Cat Categorical Q24_Imp
Frequency Percent Valid Percent Cumulative
Percent 1 Under 3000 19 1.3 54.3 54.32 3000 - 9000 7 .5 20.0 74.33 9000 - 30000 5 .3 14.3 88.64 Over 30000 4 .3 11.4 100.0
Valid
Total 35 2.3 100.0 Missing System 1483 97.7 Total 1518 100.0
Q31_Cat Categorical Q31_Imp
Frequency Percent Valid Percent Cumulative
Percent 1 Under 1000 126 8.3 39.4 39.42 1000 - 2000 21 1.4 6.6 45.93 2000 - 3000 10 .7 3.1 49.14 3000 - 4000 25 1.6 7.8 56.95 4000 - 5000 6 .4 1.9 58.86 5000 - 6000 15 1.0 4.7 63.47 6000 - 7000 3 .2 .9 64.48 7000 - 8000 6 .4 1.9 66.39 8000 - 9000 4 .3 1.3 67.510 9000 - 10000 3 .2 .9 68.411 10000 - 11000 20 1.3 6.3 74.713 12000 - 20000 19 1.3 5.9 80.614 20000 - 40000 21 1.4 6.6 87.215 40000 - 60000 19 1.3 5.9 93.116 60000 - 80000 5 .3 1.6 94.717 80000 - 100000 3 .2 .9 95.618 Over 100000 14 .9 4.4 100.0
Valid
Total 320 21.1 100.0 Missing System 1198 78.9 Total 1518 100.0
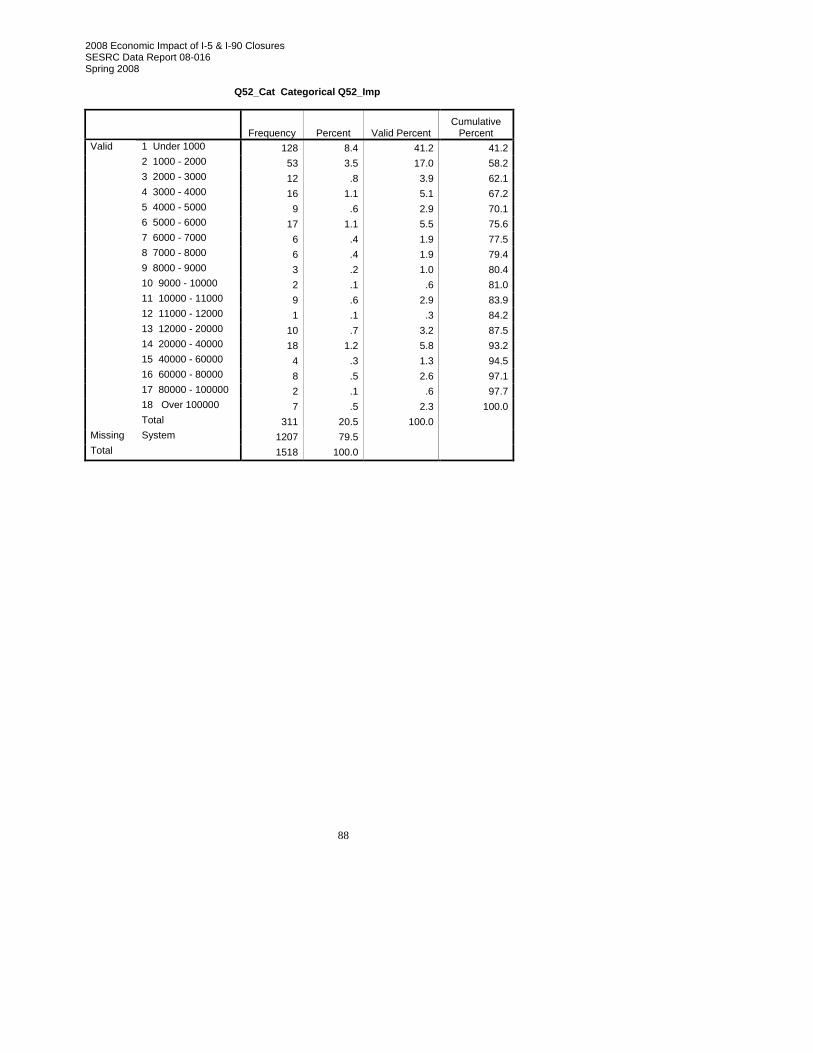
2008 Economic Impact of I-5 & I-90 Closures SESRC Data Report 08-016 Spring 2008
88
Q52_Cat Categorical Q52_Imp
Frequency Percent Valid Percent Cumulative
Percent 1 Under 1000 128 8.4 41.2 41.22 1000 - 2000 53 3.5 17.0 58.23 2000 - 3000 12 .8 3.9 62.14 3000 - 4000 16 1.1 5.1 67.25 4000 - 5000 9 .6 2.9 70.16 5000 - 6000 17 1.1 5.5 75.67 6000 - 7000 6 .4 1.9 77.58 7000 - 8000 6 .4 1.9 79.49 8000 - 9000 3 .2 1.0 80.410 9000 - 10000 2 .1 .6 81.011 10000 - 11000 9 .6 2.9 83.912 11000 - 12000 1 .1 .3 84.213 12000 - 20000 10 .7 3.2 87.514 20000 - 40000 18 1.2 5.8 93.215 40000 - 60000 4 .3 1.3 94.516 60000 - 80000 8 .5 2.6 97.117 80000 - 100000 2 .1 .6 97.718 Over 100000 7 .5 2.3 100.0
Valid
Total 311 20.5 100.0 Missing System 1207 79.5 Total 1518 100.0
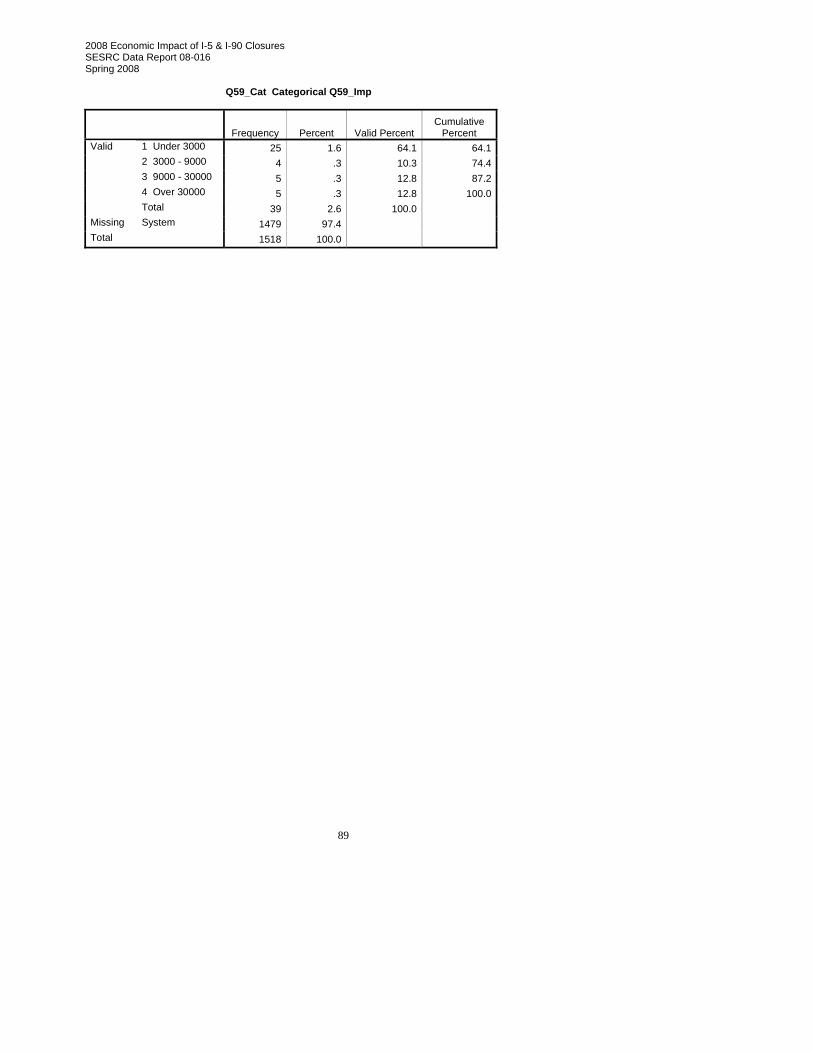
2008 Economic Impact of I-5 & I-90 Closures SESRC Data Report 08-016 Spring 2008
89
Q59_Cat Categorical Q59_Imp
Frequency Percent Valid Percent Cumulative
Percent 1 Under 3000 25 1.6 64.1 64.12 3000 - 9000 4 .3 10.3 74.43 9000 - 30000 5 .3 12.8 87.24 Over 30000 5 .3 12.8 100.0
Valid
Total 39 2.6 100.0 Missing System 1479 97.4 Total 1518 100.0
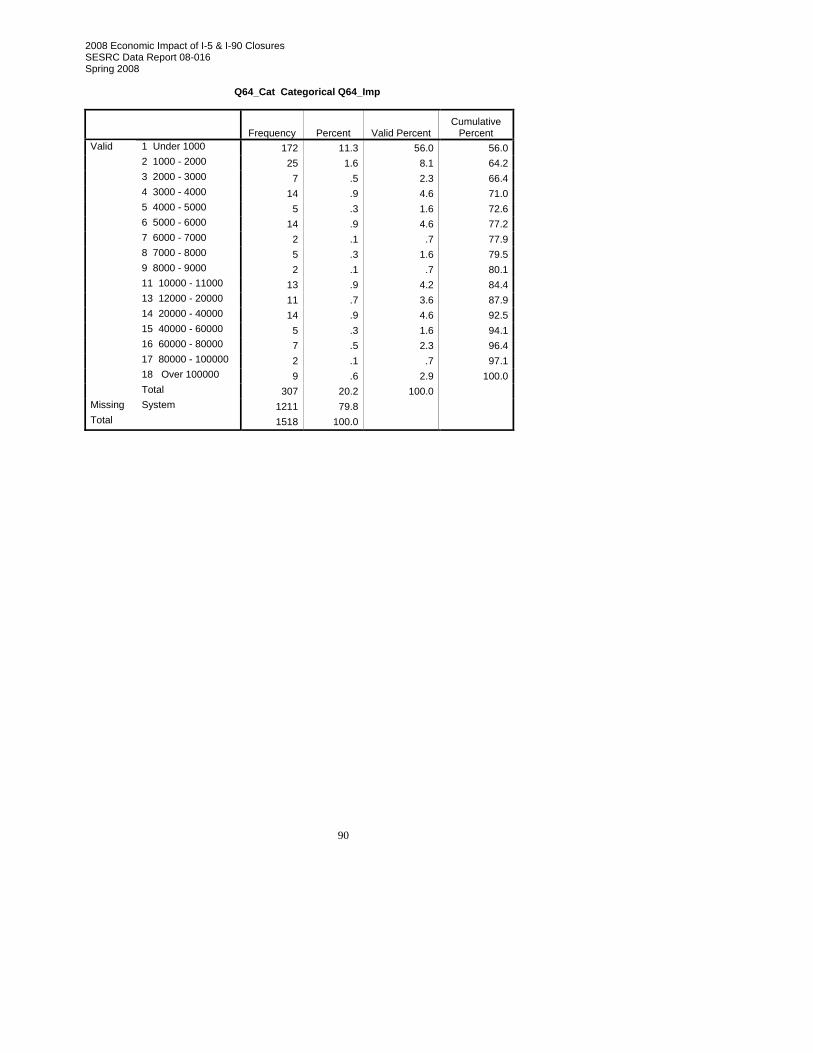
2008 Economic Impact of I-5 & I-90 Closures SESRC Data Report 08-016 Spring 2008
90
Q64_Cat Categorical Q64_Imp
Frequency Percent Valid Percent Cumulative
Percent 1 Under 1000 172 11.3 56.0 56.02 1000 - 2000 25 1.6 8.1 64.23 2000 - 3000 7 .5 2.3 66.44 3000 - 4000 14 .9 4.6 71.05 4000 - 5000 5 .3 1.6 72.66 5000 - 6000 14 .9 4.6 77.27 6000 - 7000 2 .1 .7 77.98 7000 - 8000 5 .3 1.6 79.59 8000 - 9000 2 .1 .7 80.111 10000 - 11000 13 .9 4.2 84.413 12000 - 20000 11 .7 3.6 87.914 20000 - 40000 14 .9 4.6 92.515 40000 - 60000 5 .3 1.6 94.116 60000 - 80000 7 .5 2.3 96.417 80000 - 100000 2 .1 .7 97.118 Over 100000 9 .6 2.9 100.0
Valid
Total 307 20.2 100.0 Missing System 1211 79.8 Total 1518 100.0

2008 ESESpri
conomic Impact of I-5 & I-90 Closures SRC Data Report 08-016 ng 2008
91
Q71_Cat Categorical Q71_Imp
Frequency Percent Valid Percent Cumulative
Percent 1 Under 500000 86 5.7 27.4 27.42 500000 - 1000000 36 2.4 11.5 38.93 1000000 - 1500000 29 1.9 9.2 48.14 1500000 - 2000000 17 1.1 5.4 53.55 2000000 - 2500000 33 2.2 10.5 64.06 2500000 - 3000000 9 .6 2.9 66.97 3000000 - 10000000 46 3.0 14.6 81.58 10000000 - 20000000 27 1.8 8.6 90.19 20000000 - 30000000 11 .7 3.5 93.610 30000000 - 40000000 4 .3 1.3 94.911 Over 40000000 16 1.1 5.1 100.0
Valid
Total 314 20.7 100.0 Missing System 1204 79.3 Total 1518 100.0

2008 Economic Impact of I-5 & I-90 Closures SESRC Data Report 08-016 Spring 2008
92
Crosstabs of Categorical Variables with Imputations Q17_Cat Categorical Q17_Imp * sales Categorical Sales Estimate Crosstabulation Count
sales Categorical Sales Estimate
1 Less than
1400000 2 1400000 to
< 2800000 3 2800000 to
< 6600000 4 6600000 to < 50000000
5 50000000 and Over Total
1 Under 1000 28 25 27 13 1 942 1000 - 2000 14 16 7 12 1 503 2000 - 3000 4 11 6 5 0 264 3000 - 4000 7 6 13 4 1 315 4000 - 5000 2 4 0 2 0 86 5000 - 6000 6 6 8 2 3 257 6000 - 7000 0 0 2 0 0 28 7000 - 8000 4 0 1 2 0 79 8000 - 9000 1 1 1 0 0 310 9000 - 10000 1 2 4 3 0 1011 10000 - 11000 2 3 8 5 0 1813 12000 - 20000 5 0 5 2 1 1314 20000 - 40000 6 4 7 3 1 2115 40000 - 60000 0 3 2 3 0 816 60000 - 80000 1 2 3 2 0 817 80000 - 100000 0 0 1 2 0 3
Q17_Cat Categorical Q17_Imp
18 Over 100000 4 1 3 2 2 12Total 85 84 98 62 10 339

2008 Economic Impact of I-5 & I-90 Closures SESRC Data Report 08-016 Spring 2008
93
Q17_Cat Categorical Q17_Imp * emp_count Categorical Employee Count) Crosstabulation Count
emp_count Categorical Employee Count)
1 Less than 10 2 10 - 19 3 20 - 29 4 30 - 39 5 40 - 49
6 50 and Over Total
1 Under 1000 55 17 12 5 0 5 942 1000 - 2000 18 14 7 6 1 4 503 2000 - 3000 10 6 4 2 3 1 264 3000 - 4000 11 10 5 2 1 2 315 4000 - 5000 5 3 0 0 0 0 86 5000 - 6000 10 4 4 3 0 4 257 6000 - 7000 0 0 0 0 0 2 28 7000 - 8000 4 0 1 0 1 1 79 8000 - 9000 1 1 1 0 0 0 310 9000 - 10000 3 0 2 1 1 3 1011 10000 - 11000 5 5 2 1 1 4 1813 12000 - 20000 7 0 2 1 1 2 1314 20000 - 40000 8 6 1 1 0 5 2115 40000 - 60000 1 1 3 1 0 2 816 60000 - 80000 3 0 2 1 1 1 817 80000 - 100000 0 0 2 0 1 0 3
Q17_Cat Categorical Q17_Imp
18 Over 100000 5 0 2 1 1 3 12Total 146 67 50 25 12 39 339

2008 Economic Impact of I-5 & I-90 Closures SESRC Data Report 08-016 Spring 2008
94
Q17_Cat Categorical Q17_Imp * NAICS First 2 digits of NAICS Code -- SAMPLE Crosstabulation Count
NAICS First 2 digits of NAICS Code -- SAMPLE 11 23 31 32 33 42 44 45 48 Total
1 Under 1000 2 2 1 2 0 7 3 1 76 942 1000 - 2000 1 1 2 1 0 5 1 0 39 503 2000 - 3000 0 0 1 0 2 1 0 0 22 264 3000 - 4000 0 0 0 0 1 2 0 0 28 315 4000 - 5000 0 0 0 0 0 3 0 0 5 86 5000 - 6000 0 0 3 1 0 4 0 1 16 257 6000 - 7000 1 0 0 0 0 0 0 0 1 28 7000 - 8000 0 0 0 0 2 0 1 0 4 79 8000 - 9000 0 0 0 0 0 0 0 0 3 310 9000 - 10000 0 0 1 0 0 0 0 1 8 1011 10000 - 11000 0 0 0 0 0 2 0 0 16 1813 12000 - 20000 0 0 0 0 0 0 0 0 13 1314 20000 - 40000 0 0 1 0 0 0 3 0 17 2115 40000 - 60000 0 0 1 0 0 1 0 0 6 816 60000 - 80000 0 0 2 0 0 2 0 0 4 817 80000 - 100000 0 0 0 0 0 0 0 0 3 3
Q17_Cat Categorical Q17_Imp
18 Over 100000 0 0 1 0 0 0 0 0 11 12Total 4 3 13 4 5 27 8 3 272 339

2008 Economic Impact of I-5 & I-90 Closures SESRC Data Report 08-016 Spring 2008
95
Q24_Cat Categorical Q24_Imp * sales Categorical Sales Estimate Crosstabulation Count
sales Categorical Sales Estimate
1 Less than
1400000 2 1400000 to
< 2800000 3 2800000 to
< 6600000 4 6600000 to < 50000000 Total
1 Under 3000 8 2 6 3 19 2 3000 - 9000 0 3 3 1 7 3 9000 - 30000 2 0 1 2 5
Q24_Cat Categorical Q24_Imp
4 Over 30000 0 1 2 1 4 Total 10 6 12 7 35
Q24_Cat Categorical Q24_Imp * emp_count Categorical Employee Count) Crosstabulation Count
emp_count Categorical Employee Count)
1 Less than 10 2 10 - 19 3 20 - 29 4 30 - 39 5 40 - 49
6 50 and Over Total
1 Under 3000 11 4 3 1 0 0 192 3000 - 9000 4 0 1 1 0 1 73 9000 - 30000 1 2 1 0 1 0 5
Q24_Cat Categorical Q24_Imp
4 Over 30000 2 0 1 0 1 0 4Total 18 6 6 2 2 1 35

2008 Economic Impact of I-5 & I-90 Closures SESRC Data Report 08-016 Spring 2008
96
Q24_Cat Categorical Q24_Imp * NAICS First 2 digits of NAICS Code -- SAMPLE Crosstabulation Count
NAICS First 2 digits of NAICS Code -- SAMPLE 23 31 42 44 48 Total
1 Under 3000 1 0 2 0 16 19 2 3000 - 9000 0 0 1 1 5 7 3 9000 - 30000 0 0 0 0 5 5
Q24_Cat Categorical Q24_Imp
4 Over 30000 0 1 1 0 2 4 Total 1 1 4 1 28 35

2008 Economic Impact of I-5 & I-90 Closures SESRC Data Report 08-016 Spring 2008
97
Q31_Cat Categorical Q31_Imp * sales Categorical Sales Estimate Crosstabulation Count
sales Categorical Sales Estimate
1 Less than
1400000 2 1400000 to
< 2800000 3 2800000 to
< 6600000 4 6600000 to < 50000000
5 50000000 and Over Total
1 Under 1000 33 33 37 20 3 1262 1000 - 2000 3 8 3 6 1 213 2000 - 3000 2 7 0 1 0 104 3000 - 4000 6 4 10 4 1 255 4000 - 5000 1 2 1 2 0 66 5000 - 6000 5 3 3 3 1 157 6000 - 7000 2 0 0 1 0 38 7000 - 8000 1 2 2 1 0 69 8000 - 9000 2 2 0 0 0 410 9000 - 10000 1 1 1 0 0 311 10000 - 11000 2 5 7 6 0 2013 12000 - 20000 7 6 3 2 1 1914 20000 - 40000 5 6 7 3 0 2115 40000 - 60000 0 2 9 7 1 1916 60000 - 80000 2 0 2 1 0 517 80000 - 100000 1 0 2 0 0 3
Q31_Cat Categorical Q31_Imp
18 Over 100000 3 3 5 3 0 14Total 76 84 92 60 8 320

2008 Economic Impact of I-5 & I-90 Closures SESRC Data Report 08-016 Spring 2008
98
Q31_Cat Categorical Q31_Imp * emp_count Categorical Employee Count) Crosstabulation Count
emp_count Categorical Employee Count)
1 Less than 10 2 10 - 19 3 20 - 29 4 30 - 39 5 40 - 49
6 50 and Over Total
1 Under 1000 56 26 22 5 2 15 1262 1000 - 2000 8 7 0 2 1 3 213 2000 - 3000 3 1 4 2 0 0 104 3000 - 4000 10 5 3 4 0 3 255 4000 - 5000 4 1 1 0 0 0 66 5000 - 6000 6 4 1 1 0 3 157 6000 - 7000 3 0 0 0 0 0 38 7000 - 8000 2 3 1 0 0 0 69 8000 - 9000 4 0 0 0 0 0 410 9000 - 10000 1 1 1 0 0 0 311 10000 - 11000 6 4 1 3 3 3 2013 12000 - 20000 12 2 0 2 1 2 1914 20000 - 40000 12 4 3 0 0 2 2115 40000 - 60000 3 2 5 1 3 5 1916 60000 - 80000 2 0 2 0 0 1 517 80000 - 100000 0 0 2 0 0 1 3
Q31_Cat Categorical Q31_Imp
18 Over 100000 5 2 3 2 1 1 14Total 137 62 49 22 11 39 320

2008 Economic Impact of I-5 & I-90 Closures SESRC Data Report 08-016 Spring 2008
99
Q31_Cat Categorical Q31_Imp * NAICS First 2 digits of NAICS Code -- SAMPLE Crosstabulation Count
NAICS First 2 digits of NAICS Code -- SAMPLE 11 23 31 32 33 42 44 45 48 Total
1 Under 1000 3 2 4 3 2 9 2 2 99 1262 1000 - 2000 1 1 1 0 0 2 0 0 16 213 2000 - 3000 0 0 0 0 0 0 0 0 10 104 3000 - 4000 0 0 0 0 0 1 0 0 24 255 4000 - 5000 0 0 0 0 0 0 1 0 5 66 5000 - 6000 0 0 0 1 0 3 0 0 11 157 6000 - 7000 0 0 0 0 0 0 0 1 2 38 7000 - 8000 0 0 0 0 0 0 0 0 6 69 8000 - 9000 0 0 0 0 0 0 0 0 4 410 9000 - 10000 0 0 0 0 0 0 0 0 3 311 10000 - 11000 0 0 2 0 0 1 0 0 17 2013 12000 - 20000 0 0 1 0 1 1 0 0 16 1914 20000 - 40000 0 0 0 0 0 3 2 0 16 2115 40000 - 60000 0 0 3 0 0 5 2 0 9 1916 60000 - 80000 0 0 1 0 0 0 0 0 4 517 80000 - 100000 0 0 0 0 0 0 0 0 3 3
Q31_Cat Categorical Q31_Imp
18 Over 100000 0 0 1 0 0 1 0 0 12 14Total 4 3 13 4 3 26 7 3 257 320
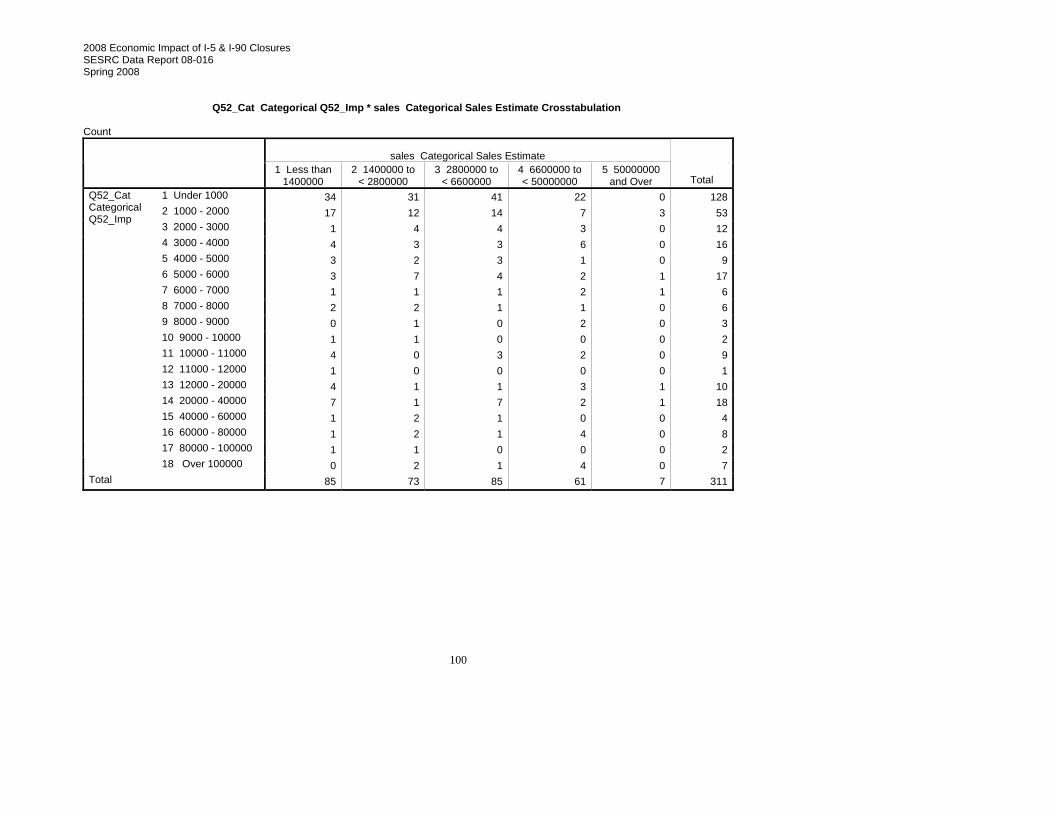
2008 Economic Impact of I-5 & I-90 Closures SESRC Data Report 08-016 Spring 2008
100
Q52_Cat Categorical Q52_Imp * sales Categorical Sales Estimate Crosstabulation Count
sales Categorical Sales Estimate
1 Less than
1400000 2 1400000 to
< 2800000 3 2800000 to
< 6600000 4 6600000 to < 50000000
5 50000000 and Over Total
1 Under 1000 34 31 41 22 0 1282 1000 - 2000 17 12 14 7 3 533 2000 - 3000 1 4 4 3 0 124 3000 - 4000 4 3 3 6 0 165 4000 - 5000 3 2 3 1 0 96 5000 - 6000 3 7 4 2 1 177 6000 - 7000 1 1 1 2 1 68 7000 - 8000 2 2 1 1 0 69 8000 - 9000 0 1 0 2 0 310 9000 - 10000 1 1 0 0 0 211 10000 - 11000 4 0 3 2 0 912 11000 - 12000 1 0 0 0 0 113 12000 - 20000 4 1 1 3 1 1014 20000 - 40000 7 1 7 2 1 1815 40000 - 60000 1 2 1 0 0 416 60000 - 80000 1 2 1 4 0 817 80000 - 100000 1 1 0 0 0 2
Q52_Cat Categorical Q52_Imp
18 Over 100000 0 2 1 4 0 7Total 85 73 85 61 7 311
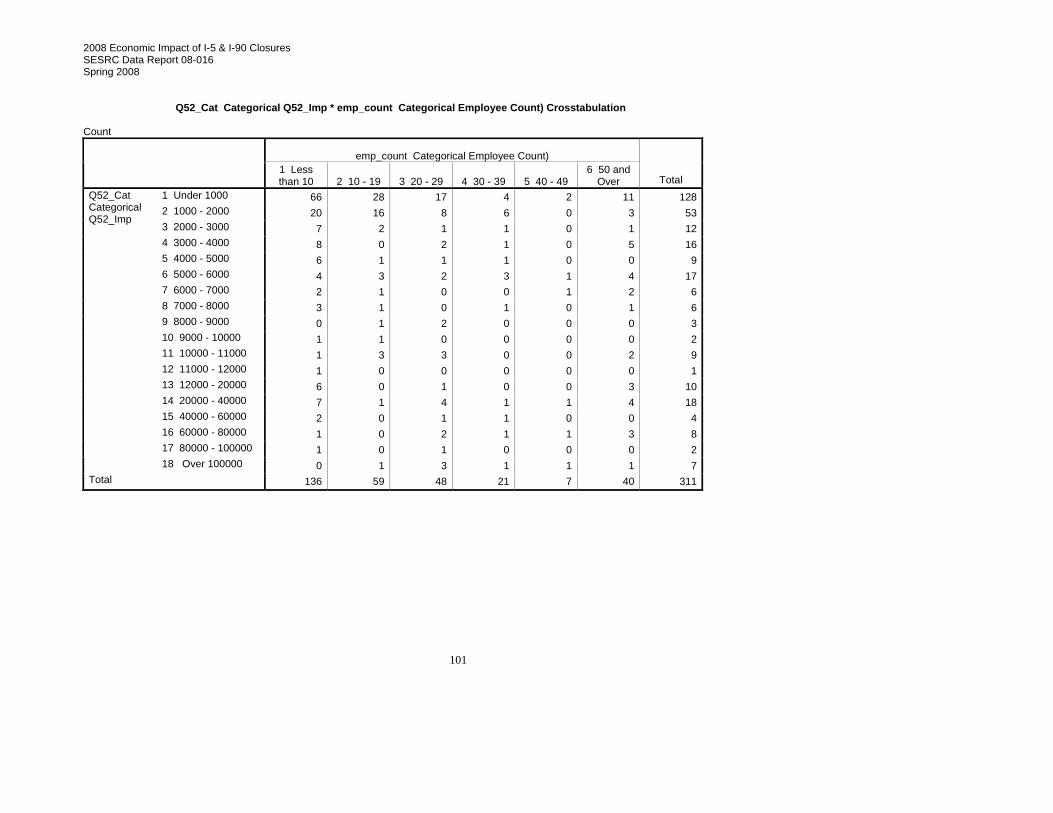
2008 Economic Impact of I-5 & I-90 Closures SESRC Data Report 08-016 Spring 2008
101
Q52_Cat Categorical Q52_Imp * emp_count Categorical Employee Count) Crosstabulation Count
emp_count Categorical Employee Count)
1 Less than 10 2 10 - 19 3 20 - 29 4 30 - 39 5 40 - 49
6 50 and Over Total
1 Under 1000 66 28 17 4 2 11 1282 1000 - 2000 20 16 8 6 0 3 533 2000 - 3000 7 2 1 1 0 1 124 3000 - 4000 8 0 2 1 0 5 165 4000 - 5000 6 1 1 1 0 0 96 5000 - 6000 4 3 2 3 1 4 177 6000 - 7000 2 1 0 0 1 2 68 7000 - 8000 3 1 0 1 0 1 69 8000 - 9000 0 1 2 0 0 0 310 9000 - 10000 1 1 0 0 0 0 211 10000 - 11000 1 3 3 0 0 2 912 11000 - 12000 1 0 0 0 0 0 113 12000 - 20000 6 0 1 0 0 3 1014 20000 - 40000 7 1 4 1 1 4 1815 40000 - 60000 2 0 1 1 0 0 416 60000 - 80000 1 0 2 1 1 3 817 80000 - 100000 1 0 1 0 0 0 2
Q52_Cat Categorical Q52_Imp
18 Over 100000 0 1 3 1 1 1 7Total 136 59 48 21 7 40 311

2008 Economic Impact of I-5 & I-90 Closures SESRC Data Report 08-016 Spring 2008
102
Q52_Cat Categorical Q52_Imp * NAICS First 2 digits of NAICS Code -- SAMPLE Crosstabulation Count
NAICS First 2 digits of NAICS Code -- SAMPLE 11 23 31 32 33 42 44 45 48 Total
1 Under 1000 2 2 1 5 4 16 4 1 93 1282 1000 - 2000 0 0 2 0 0 7 2 1 41 533 2000 - 3000 0 0 0 0 1 0 0 0 11 124 3000 - 4000 0 0 0 0 1 2 0 0 13 165 4000 - 5000 0 0 0 0 0 0 0 0 9 96 5000 - 6000 0 1 0 0 0 1 1 0 14 177 6000 - 7000 0 0 1 1 0 1 0 0 3 68 7000 - 8000 0 0 0 0 0 1 0 0 5 69 8000 - 9000 0 0 0 0 0 1 0 0 2 310 9000 - 10000 0 0 0 0 0 0 0 0 2 211 10000 - 11000 0 0 0 0 0 0 1 0 8 912 11000 - 12000 0 0 0 0 0 0 0 0 1 113 12000 - 20000 0 0 0 0 0 0 1 0 9 1014 20000 - 40000 0 0 1 0 0 2 0 0 15 1815 40000 - 60000 0 0 0 0 0 0 0 0 4 416 60000 - 80000 0 0 1 0 0 0 1 0 6 817 80000 - 100000 0 0 0 0 0 0 1 0 1 2
Q52_Cat Categorical Q52_Imp
18 Over 100000 0 0 0 0 0 1 0 0 6 7Total 2 3 6 6 6 32 11 2 243 311
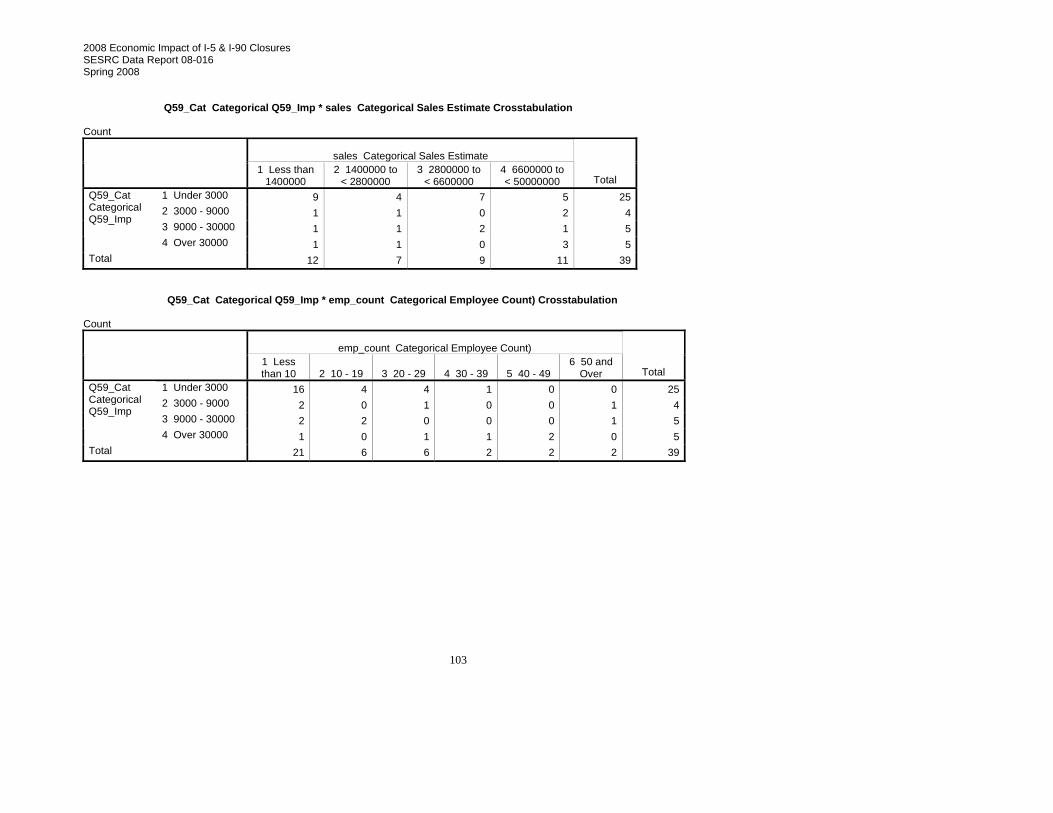
2008 Economic Impact of I-5 & I-90 Closures SESRC Data Report 08-016 Spring 2008
103
Q59_Cat Categorical Q59_Imp * sales Categorical Sales Estimate Crosstabulation Count
sales Categorical Sales Estimate
1 Less than
1400000 2 1400000 to
< 2800000 3 2800000 to
< 6600000 4 6600000 to < 50000000 Total
1 Under 3000 9 4 7 5 25 2 3000 - 9000 1 1 0 2 4 3 9000 - 30000 1 1 2 1 5
Q59_Cat Categorical Q59_Imp
4 Over 30000 1 1 0 3 5 Total 12 7 9 11 39
Q59_Cat Categorical Q59_Imp * emp_count Categorical Employee Count) Crosstabulation Count
emp_count Categorical Employee Count)
1 Less than 10 2 10 - 19 3 20 - 29 4 30 - 39 5 40 - 49
6 50 and Over Total
1 Under 3000 16 4 4 1 0 0 252 3000 - 9000 2 0 1 0 0 1 43 9000 - 30000 2 2 0 0 0 1 5
Q59_Cat Categorical Q59_Imp
4 Over 30000 1 0 1 1 2 0 5Total 21 6 6 2 2 2 39
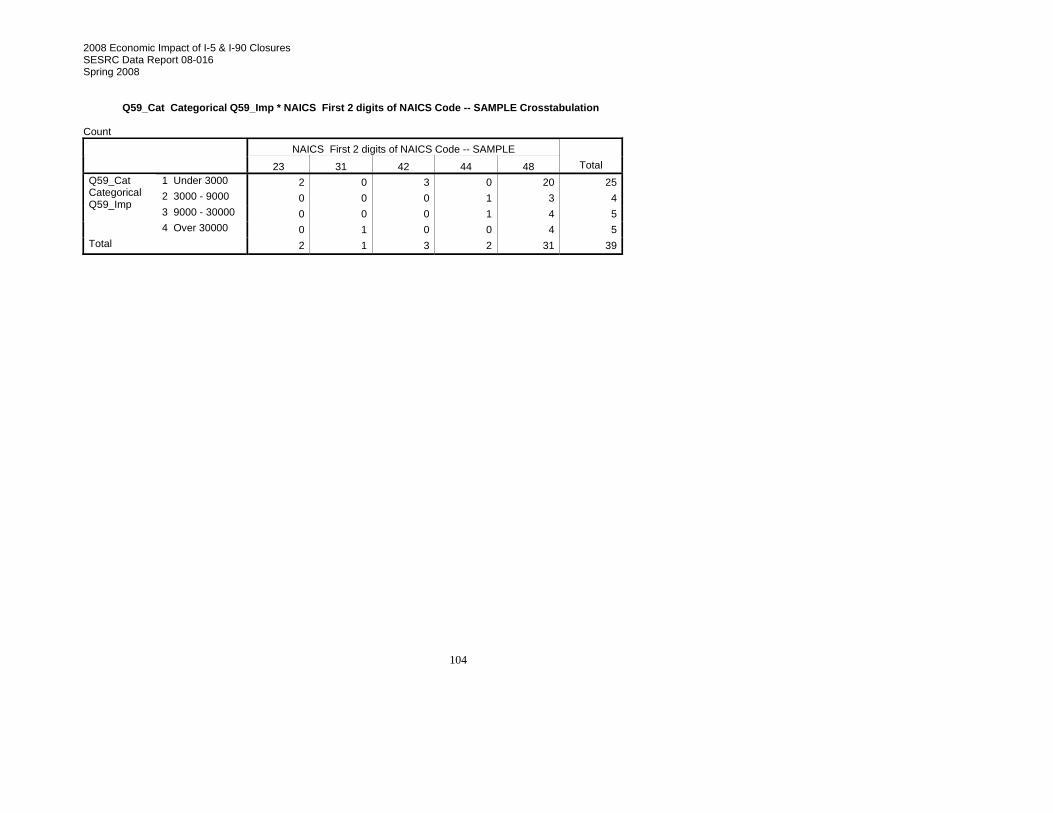
2008 Economic Impact of I-5 & I-90 Closures SESRC Data Report 08-016 Spring 2008
104
Q59_Cat Categorical Q59_Imp * NAICS First 2 digits of NAICS Code -- SAMPLE Crosstabulation Count
NAICS First 2 digits of NAICS Code -- SAMPLE 23 31 42 44 48 Total
1 Under 3000 2 0 3 0 20 25 2 3000 - 9000 0 0 0 1 3 4 3 9000 - 30000 0 0 0 1 4 5
Q59_Cat Categorical Q59_Imp
4 Over 30000 0 1 0 0 4 5 Total 2 1 3 2 31 39

2008 Economic Impact of I-5 & I-90 Closures SESRC Data Report 08-016 Spring 2008
105
Q64_Cat Categorical Q64_Imp * sales Categorical Sales Estimate Crosstabulation Count
sales Categorical Sales Estimate
1 Less than
1400000 2 1400000 to
< 2800000 3 2800000 to
< 6600000 4 6600000 to < 50000000
5 50000000 and Over Total
1 Under 1000 38 45 49 37 3 1722 1000 - 2000 9 4 6 5 1 253 2000 - 3000 1 5 1 0 0 74 3000 - 4000 6 1 4 2 1 145 4000 - 5000 3 0 2 0 0 56 5000 - 6000 4 3 5 1 1 147 6000 - 7000 0 0 1 1 0 28 7000 - 8000 1 2 2 0 0 59 8000 - 9000 1 0 0 1 0 211 10000 - 11000 4 5 2 2 0 1313 12000 - 20000 6 1 3 1 0 1114 20000 - 40000 6 2 4 2 0 1415 40000 - 60000 0 1 1 3 0 516 60000 - 80000 2 2 1 2 0 717 80000 - 100000 0 1 0 1 0 2
Q64_Cat Categorical Q64_Imp
18 Over 100000 1 1 1 5 1 9Total 82 73 82 63 7 307
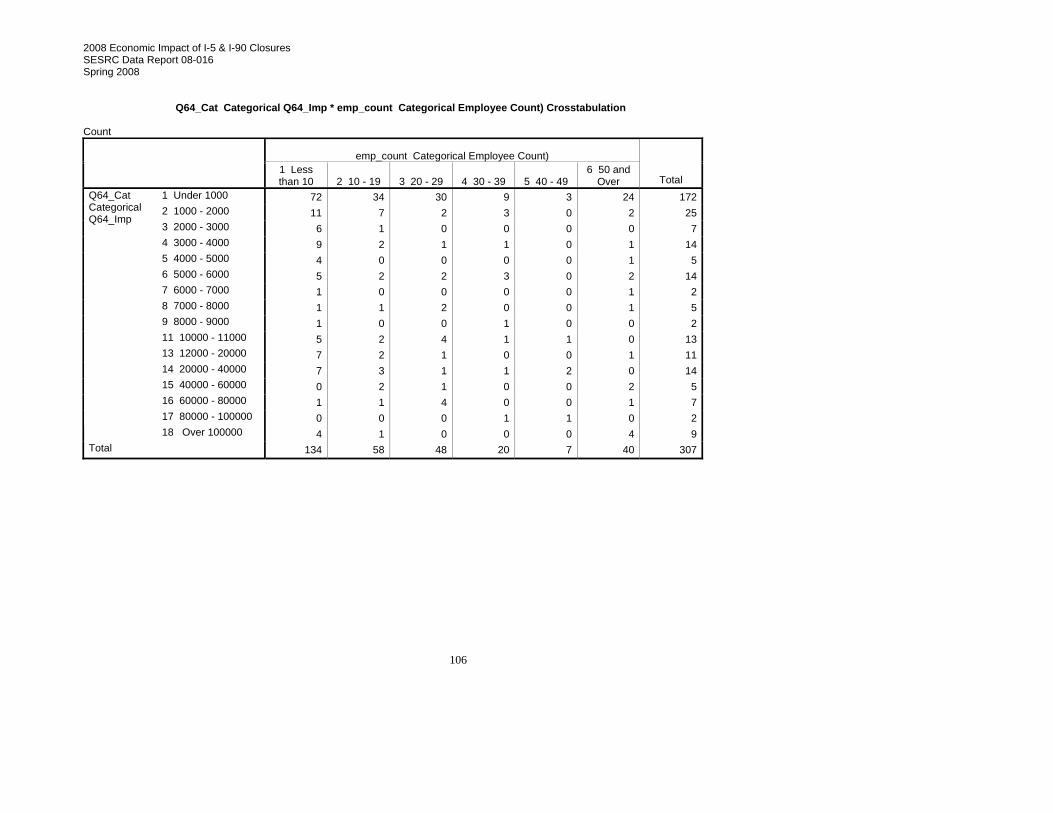
2008 Economic Impact of I-5 & I-90 Closures SESRC Data Report 08-016 Spring 2008
106
Q64_Cat Categorical Q64_Imp * emp_count Categorical Employee Count) Crosstabulation Count
emp_count Categorical Employee Count)
1 Less than 10 2 10 - 19 3 20 - 29 4 30 - 39 5 40 - 49
6 50 and Over Total
1 Under 1000 72 34 30 9 3 24 1722 1000 - 2000 11 7 2 3 0 2 253 2000 - 3000 6 1 0 0 0 0 74 3000 - 4000 9 2 1 1 0 1 145 4000 - 5000 4 0 0 0 0 1 56 5000 - 6000 5 2 2 3 0 2 147 6000 - 7000 1 0 0 0 0 1 28 7000 - 8000 1 1 2 0 0 1 59 8000 - 9000 1 0 0 1 0 0 211 10000 - 11000 5 2 4 1 1 0 1313 12000 - 20000 7 2 1 0 0 1 1114 20000 - 40000 7 3 1 1 2 0 1415 40000 - 60000 0 2 1 0 0 2 516 60000 - 80000 1 1 4 0 0 1 717 80000 - 100000 0 0 0 1 1 0 2
Q64_Cat Categorical Q64_Imp
18 Over 100000 4 1 0 0 0 4 9Total 134 58 48 20 7 40 307

2008 Economic Impact of I-5 & I-90 Closures SESRC Data Report 08-016 Spring 2008
107
Q64_Cat Categorical Q64_Imp * NAICS First 2 digits of NAICS Code -- SAMPLE Crosstabulation Count
NAICS First 2 digits of NAICS Code -- SAMPLE 11 23 31 32 33 42 44 45 48 Total
1 Under 1000 2 2 2 5 3 20 5 1 132 1722 1000 - 2000 0 0 1 0 0 3 0 1 20 253 2000 - 3000 0 0 0 0 0 1 0 0 6 74 3000 - 4000 0 0 0 0 0 3 0 0 11 145 4000 - 5000 0 0 0 0 0 0 0 1 4 56 5000 - 6000 0 1 0 0 0 0 1 0 12 147 6000 - 7000 0 0 1 0 0 1 0 0 0 28 7000 - 8000 0 0 0 0 0 0 0 0 5 59 8000 - 9000 0 0 0 0 0 1 0 0 1 211 10000 - 11000 0 0 1 0 0 0 1 0 11 1313 12000 - 20000 0 0 0 0 0 0 1 0 10 1114 20000 - 40000 0 0 0 0 1 0 1 0 12 1415 40000 - 60000 0 0 0 0 0 1 2 0 2 516 60000 - 80000 0 0 1 0 0 1 0 0 5 717 80000 - 100000 0 0 1 0 0 0 0 0 1 2
Q64_Cat Categorical Q64_Imp
18 Over 100000 0 0 0 1 0 0 2 0 6 9Total 2 3 7 6 4 31 13 3 238 307
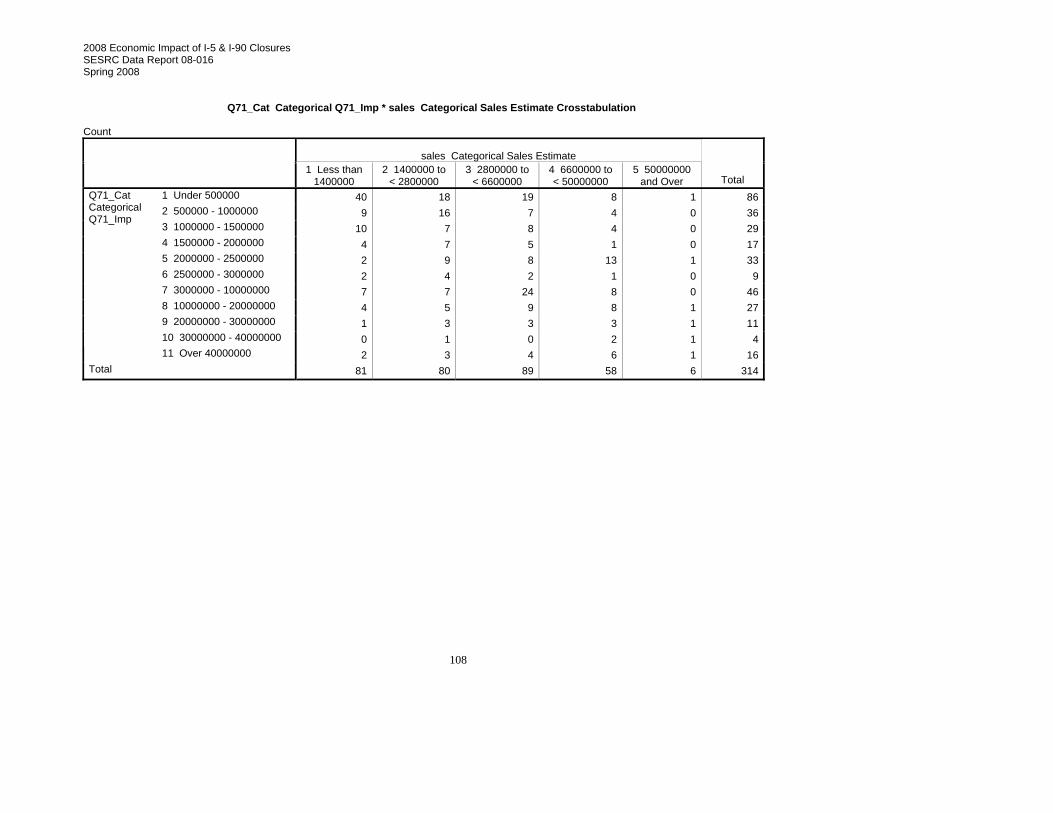
2008 Economic Impact of I-5 & I-90 Closures SESRC Data Report 08-016 Spring 2008
108
Q71_Cat Categorical Q71_Imp * sales Categorical Sales Estimate Crosstabulation Count
sales Categorical Sales Estimate
1 Less than
1400000 2 1400000 to
< 2800000 3 2800000 to
< 6600000 4 6600000 to < 50000000
5 50000000 and Over Total
1 Under 500000 40 18 19 8 1 862 500000 - 1000000 9 16 7 4 0 363 1000000 - 1500000 10 7 8 4 0 294 1500000 - 2000000 4 7 5 1 0 175 2000000 - 2500000 2 9 8 13 1 336 2500000 - 3000000 2 4 2 1 0 97 3000000 - 10000000 7 7 24 8 0 468 10000000 - 20000000 4 5 9 8 1 279 20000000 - 30000000 1 3 3 3 1 1110 30000000 - 40000000 0 1 0 2 1 4
Q71_Cat Categorical Q71_Imp
11 Over 40000000 2 3 4 6 1 16Total 81 80 89 58 6 314
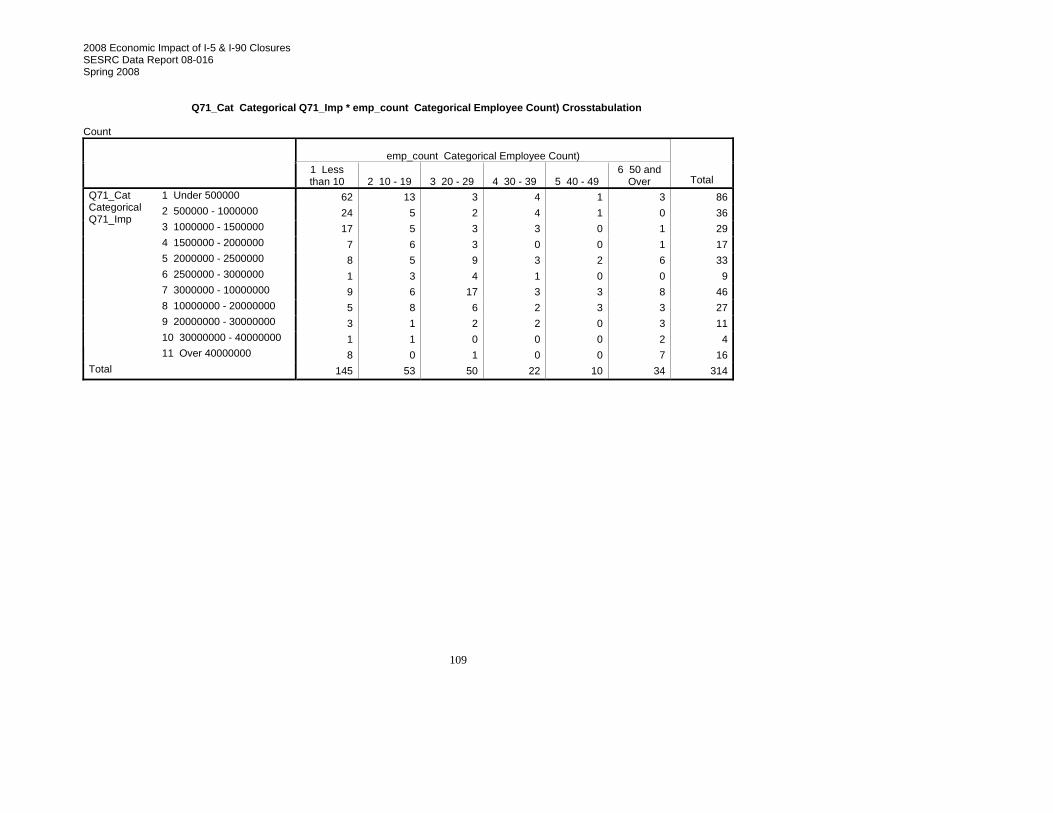
2008 Economic Impact of I-5 & I-90 Closures SESRC Data Report 08-016 Spring 2008
109
Q71_Cat Categorical Q71_Imp * emp_count Categorical Employee Count) Crosstabulation Count
emp_count Categorical Employee Count)
1 Less than 10 2 10 - 19 3 20 - 29 4 30 - 39 5 40 - 49
6 50 and Over Total
1 Under 500000 62 13 3 4 1 3 862 500000 - 1000000 24 5 2 4 1 0 363 1000000 - 1500000 17 5 3 3 0 1 294 1500000 - 2000000 7 6 3 0 0 1 175 2000000 - 2500000 8 5 9 3 2 6 336 2500000 - 3000000 1 3 4 1 0 0 97 3000000 - 10000000 9 6 17 3 3 8 468 10000000 - 20000000 5 8 6 2 3 3 279 20000000 - 30000000 3 1 2 2 0 3 1110 30000000 - 40000000 1 1 0 0 0 2 4
Q71_Cat Categorical Q71_Imp
11 Over 40000000 8 0 1 0 0 7 16Total 145 53 50 22 10 34 314
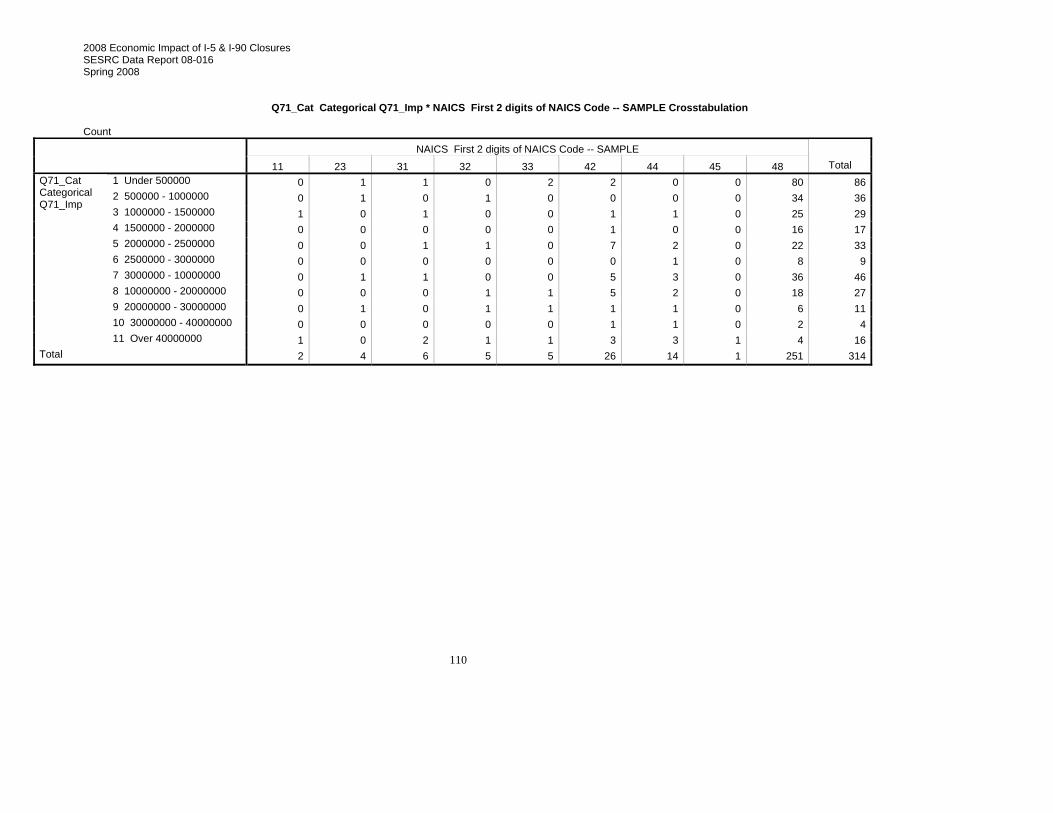
2008 Economic Impact of I-5 & I-90 Closures SESRC Data Report 08-016 Spring 2008
110
Q71_Cat Categorical Q71_Imp * NAICS First 2 digits of NAICS Code -- SAMPLE Crosstabulation Count
NAICS First 2 digits of NAICS Code -- SAMPLE 11 23 31 32 33 42 44 45 48 Total
1 Under 500000 0 1 1 0 2 2 0 0 80 862 500000 - 1000000 0 1 0 1 0 0 0 0 34 363 1000000 - 1500000 1 0 1 0 0 1 1 0 25 294 1500000 - 2000000 0 0 0 0 0 1 0 0 16 175 2000000 - 2500000 0 0 1 1 0 7 2 0 22 336 2500000 - 3000000 0 0 0 0 0 0 1 0 8 97 3000000 - 10000000 0 1 1 0 0 5 3 0 36 468 10000000 - 20000000 0 0 0 1 1 5 2 0 18 279 20000000 - 30000000 0 1 0 1 1 1 1 0 6 1110 30000000 - 40000000 0 0 0 0 0 1 1 0 2 4
Q71_Cat Categorical Q71_Imp
11 Over 40000000 1 0 2 1 1 3 3 1 4 16Total 2 4 6 5 5 26 14 1 251 314
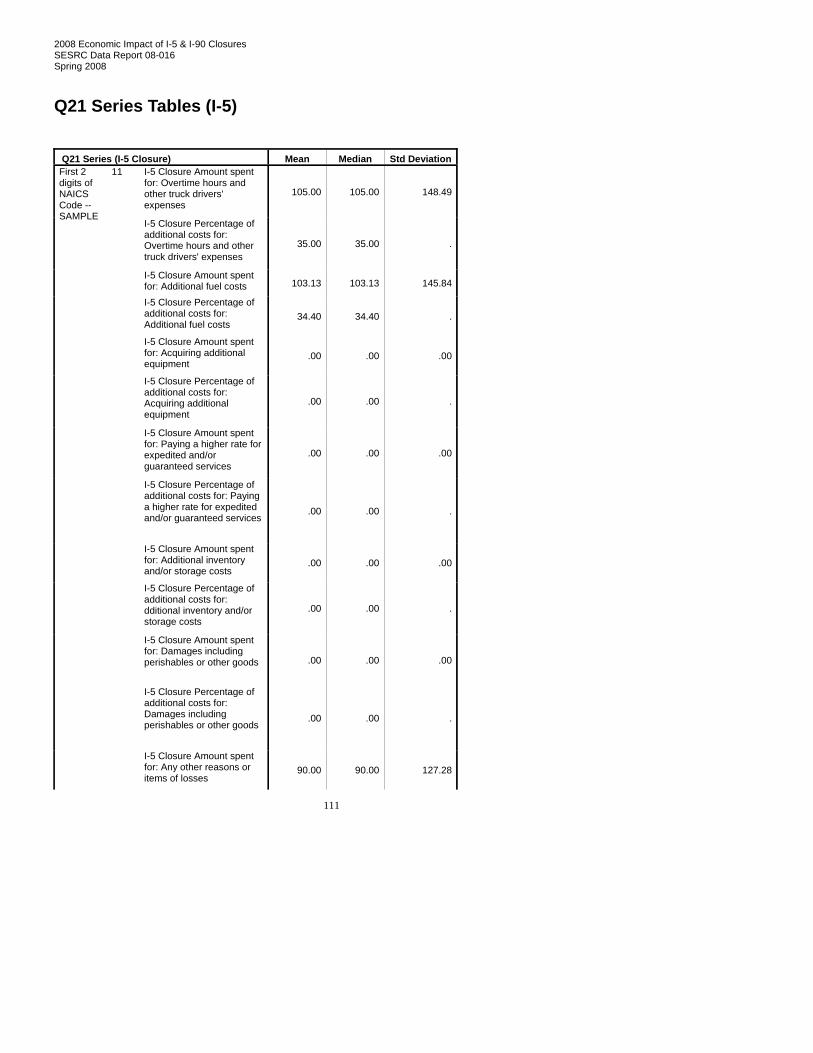
2008 Economic Impact of I-5 & I-90 Closures SESRC Data Report 08-016 Spring 2008
111
Q21 Series Tables (I-5)
Q21 Series (I-5 Closure) Mean Median Std DeviationI-5 Closure Amount spent for: Overtime hours and other truck drivers' expenses
105.00 105.00 148.49
I-5 Closure Percentage of additional costs for: Overtime hours and other truck drivers' expenses
35.00 35.00 .
I-5 Closure Amount spent for: Additional fuel costs 103.13 103.13 145.84
I-5 Closure Percentage of additional costs for: Additional fuel costs
34.40 34.40 .
I-5 Closure Amount spent for: Acquiring additional equipment
.00 .00 .00
I-5 Closure Percentage of additional costs for: Acquiring additional equipment
.00 .00 .
I-5 Closure Amount spent for: Paying a higher rate for expedited and/or guaranteed services
.00 .00 .00
I-5 Closure Percentage of additional costs for: Paying a higher rate for expedited and/or guaranteed services
.00 .00 .
I-5 Closure Amount spent for: Additional inventory and/or storage costs
.00 .00 .00
I-5 Closure Percentage of additional costs for: dditional inventory and/or storage costs
.00 .00 .
I-5 Closure Amount spent for: Damages including perishables or other goods .00 .00 .00
I-5 Closure Percentage of additional costs for: Damages including perishables or other goods
.00 .00 .
First 2 digits of NAICS Code -- SAMPLE
11
I-5 Closure Amount spent for: Any other reasons or items of losses
90.00 90.00 127.28

2008 Economic Impact of I-5 & I-90 Closures SESRC Data Report 08-016 Spring 2008
112
Q21 Series (I-5 Closure) Mean Median Std DeviationI-5 Closure Percentage of additional costs for: Any other reasons or items of losses
30.00 30.00 .
I-5 Closure Amount spent for: Overtime hours and other truck drivers' expenses
.00 .00 .00
I-5 Closure Percentage of additional costs for: Overtime hours and other truck drivers' expenses
.00 .00 .00
I-5 Closure Amount spent for: Additional fuel costs .00 .00 .00
I-5 Closure Percentage of additional costs for: Additional fuel costs
.00 .00 .00
I-5 Closure Amount spent for: Acquiring additional equipment
.00 .00 .00
I-5 Closure Percentage of additional costs for: Acquiring additional equipment
.00 .00 .00
I-5 Closure Amount spent for: Paying a higher rate for expedited and/or guaranteed services
.00 .00 .00
I-5 Closure Percentage of additional costs for: Paying a higher rate for expedited and/or guaranteed services
.00 .00 .00
I-5 Closure Amount spent for: Additional inventory and/or storage costs
.00 .00 .00
I-5 Closure Percentage of additional costs for: dditional inventory and/or storage costs
.00 .00 .00
I-5 Closure Amount spent for: Damages including perishables or other goods 366.67 .00 635.09
I-5 Closure Percentage of additional costs for: Damages including perishables or other goods
.00 .00 .00
23
I-5 Closure Amount spent for: Any other reasons or items of losses
.00 .00 .00

2008 Economic Impact of I-5 & I-90 Closures SESRC Data Report 08-016 Spring 2008
113
Q21 Series (I-5 Closure) Mean Median Std DeviationI-5 Closure Percentage of additional costs for: Any other reasons or items of losses
.00 .00 .00
I-5 Closure Amount spent for: Overtime hours and other truck drivers' expenses
6775.00 5000.00 5594.47
I-5 Closure Percentage of additional costs for: Overtime hours and other truck drivers' expenses
36.20 25.00 40.65
I-5 Closure Amount spent for: Additional fuel costs 6800.00 6100.00 7833.26
I-5 Closure Percentage of additional costs for: Additional fuel costs
11.00 8.00 12.77
I-5 Closure Amount spent for: Acquiring additional equipment
909.09 .00 3015.11
I-5 Closure Percentage of additional costs for: Acquiring additional equipment
.00 .00 .00
I-5 Closure Amount spent for: Paying a higher rate for expedited and/or guaranteed services
5727.27 .00 18995.21
I-5 Closure Percentage of additional costs for: Paying a higher rate for expedited and/or guaranteed services
4.40 .00 13.91
I-5 Closure Amount spent for: Additional inventory and/or storage costs
363.64 .00 809.04
I-5 Closure Percentage of additional costs for: dditional inventory and/or storage costs
10.00 .00 31.62
I-5 Closure Amount spent for: Damages including perishables or other goods 4454.55 .00 14774.06
I-5 Closure Percentage of additional costs for: Damages including perishables or other goods
3.40 .00 10.75
31
I-5 Closure Amount spent for: Any other reasons or items of losses
2730.00 .00 7845.46
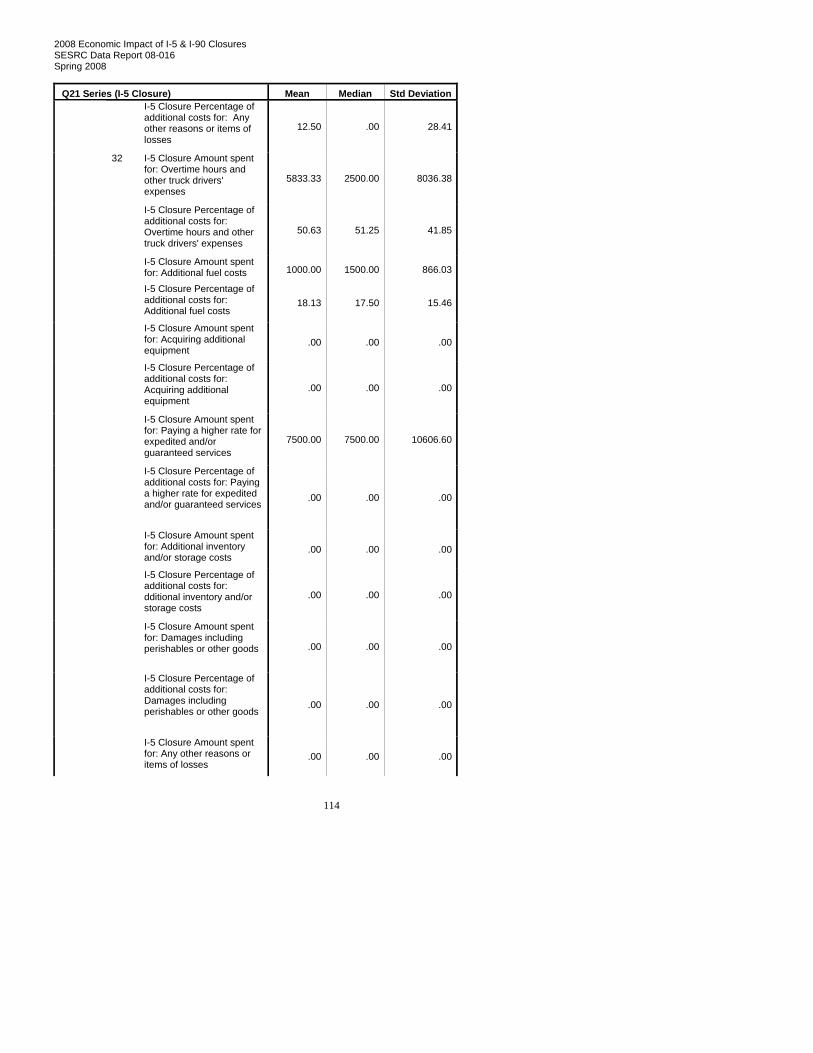
2008 Economic Impact of I-5 & I-90 Closures SESRC Data Report 08-016 Spring 2008
114
Q21 Series (I-5 Closure) Mean Median Std DeviationI-5 Closure Percentage of additional costs for: Any other reasons or items of losses
12.50 .00 28.41
I-5 Closure Amount spent for: Overtime hours and other truck drivers' expenses
5833.33 2500.00 8036.38
I-5 Closure Percentage of additional costs for: Overtime hours and other truck drivers' expenses
50.63 51.25 41.85
I-5 Closure Amount spent for: Additional fuel costs 1000.00 1500.00 866.03
I-5 Closure Percentage of additional costs for: Additional fuel costs
18.13 17.50 15.46
I-5 Closure Amount spent for: Acquiring additional equipment
.00 .00 .00
I-5 Closure Percentage of additional costs for: Acquiring additional equipment
.00 .00 .00
I-5 Closure Amount spent for: Paying a higher rate for expedited and/or guaranteed services
7500.00 7500.00 10606.60
I-5 Closure Percentage of additional costs for: Paying a higher rate for expedited and/or guaranteed services
.00 .00 .00
I-5 Closure Amount spent for: Additional inventory and/or storage costs
.00 .00 .00
I-5 Closure Percentage of additional costs for: dditional inventory and/or storage costs
.00 .00 .00
I-5 Closure Amount spent for: Damages including perishables or other goods .00 .00 .00
I-5 Closure Percentage of additional costs for: Damages including perishables or other goods
.00 .00 .00
32
I-5 Closure Amount spent for: Any other reasons or items of losses
.00 .00 .00
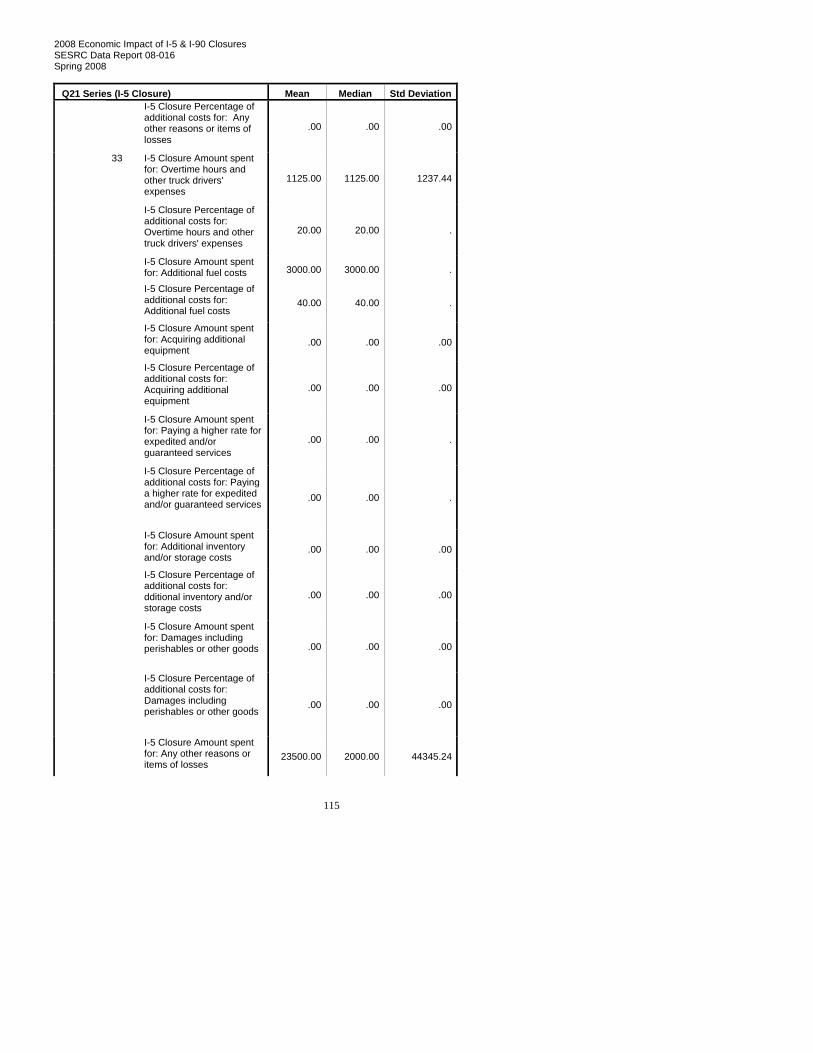
2008 Economic Impact of I-5 & I-90 Closures SESRC Data Report 08-016 Spring 2008
115
Q21 Series (I-5 Closure) Mean Median Std DeviationI-5 Closure Percentage of additional costs for: Any other reasons or items of losses
.00 .00 .00
I-5 Closure Amount spent for: Overtime hours and other truck drivers' expenses
1125.00 1125.00 1237.44
I-5 Closure Percentage of additional costs for: Overtime hours and other truck drivers' expenses
20.00 20.00 .
I-5 Closure Amount spent for: Additional fuel costs 3000.00 3000.00 .
I-5 Closure Percentage of additional costs for: Additional fuel costs
40.00 40.00 .
I-5 Closure Amount spent for: Acquiring additional equipment
.00 .00 .00
I-5 Closure Percentage of additional costs for: Acquiring additional equipment
.00 .00 .00
I-5 Closure Amount spent for: Paying a higher rate for expedited and/or guaranteed services
.00 .00 .
I-5 Closure Percentage of additional costs for: Paying a higher rate for expedited and/or guaranteed services
.00 .00 .
I-5 Closure Amount spent for: Additional inventory and/or storage costs
.00 .00 .00
I-5 Closure Percentage of additional costs for: dditional inventory and/or storage costs
.00 .00 .00
I-5 Closure Amount spent for: Damages including perishables or other goods .00 .00 .00
I-5 Closure Percentage of additional costs for: Damages including perishables or other goods
.00 .00 .00
33
I-5 Closure Amount spent for: Any other reasons or items of losses
23500.00 2000.00 44345.24

2008 Economic Impact of I-5 & I-90 Closures SESRC Data Report 08-016 Spring 2008
116
Q21 Series (I-5 Closure) Mean Median Std DeviationI-5 Closure Percentage of additional costs for: Any other reasons or items of losses
43.33 30.00 51.32
I-5 Closure Amount spent for: Overtime hours and other truck drivers' expenses
2260.29 100.00 6031.91
I-5 Closure Percentage of additional costs for: Overtime hours and other truck drivers' expenses
22.93 5.50 32.05
I-5 Closure Amount spent for: Additional fuel costs 467.06 .00 775.83
I-5 Closure Percentage of additional costs for: Additional fuel costs
17.50 2.50 29.20
I-5 Closure Amount spent for: Acquiring additional equipment
.00 .00 .00
I-5 Closure Percentage of additional costs for: Acquiring additional equipment
.00 .00 .00
I-5 Closure Amount spent for: Paying a higher rate for expedited and/or guaranteed services
526.88 .00 1351.62
I-5 Closure Percentage of additional costs for: Paying a higher rate for expedited and/or guaranteed services
16.31 .00 37.21
I-5 Closure Amount spent for: Additional inventory and/or storage costs
.00 .00 .00
I-5 Closure Percentage of additional costs for: dditional inventory and/or storage costs
.00 .00 .00
I-5 Closure Amount spent for: Damages including perishables or other goods .00 .00 .00
I-5 Closure Percentage of additional costs for: Damages including perishables or other goods
.00 .00 .00
42
I-5 Closure Amount spent for: Any other reasons or items of losses
71.05 .00 309.71

2008 Economic Impact of I-5 & I-90 Closures SESRC Data Report 08-016 Spring 2008
117
Q21 Series (I-5 Closure) Mean Median Std DeviationI-5 Closure Percentage of additional costs for: Any other reasons or items of losses
.00 .00 .00
I-5 Closure Amount spent for: Overtime hours and other truck drivers' expenses
3333.33 4000.00 1154.70
I-5 Closure Percentage of additional costs for: Overtime hours and other truck drivers' expenses
26.75 18.50 23.14
I-5 Closure Amount spent for: Additional fuel costs 4000.00 3000.00 4582.58
I-5 Closure Percentage of additional costs for: Additional fuel costs
20.00 25.00 18.03
I-5 Closure Amount spent for: Acquiring additional equipment
.00 .00 .00
I-5 Closure Percentage of additional costs for: Acquiring additional equipment
.00 .00 .00
I-5 Closure Amount spent for: Paying a higher rate for expedited and/or guaranteed services
1000.00 .00 2449.49
I-5 Closure Percentage of additional costs for: Paying a higher rate for expedited and/or guaranteed services
3.00 .00 7.35
I-5 Closure Amount spent for: Additional inventory and/or storage costs
285.71 .00 755.93
I-5 Closure Percentage of additional costs for: dditional inventory and/or storage costs
.86 .00 2.27
I-5 Closure Amount spent for: Damages including perishables or other goods .00 .00 .00
I-5 Closure Percentage of additional costs for: Damages including perishables or other goods
.00 .00 .00
44
I-5 Closure Amount spent for: Any other reasons or items of losses
3000.00 500.00 5513.62

2008 Economic Impact of I-5 & I-90 Closures SESRC Data Report 08-016 Spring 2008
118
Q21 Series (I-5 Closure) Mean Median Std DeviationI-5 Closure Percentage of additional costs for: Any other reasons or items of losses
14.00 2.50 19.85
I-5 Closure Amount spent for: Overtime hours and other truck drivers' expenses
75.00 75.00 106.07
I-5 Closure Percentage of additional costs for: Overtime hours and other truck drivers' expenses
1.00 1.00 1.41
I-5 Closure Amount spent for: Additional fuel costs .00 .00 .
I-5 Closure Percentage of additional costs for: Additional fuel costs
.00 .00 .
I-5 Closure Amount spent for: Acquiring additional equipment
.00 .00 .00
I-5 Closure Percentage of additional costs for: Acquiring additional equipment
.00 .00 .00
I-5 Closure Amount spent for: Paying a higher rate for expedited and/or guaranteed services
833.33 .00 1443.38
I-5 Closure Percentage of additional costs for: Paying a higher rate for expedited and/or guaranteed services
.00 .00 .00
I-5 Closure Amount spent for: Additional inventory and/or storage costs
.00 .00 .00
I-5 Closure Percentage of additional costs for: dditional inventory and/or storage costs
.00 .00 .00
I-5 Closure Amount spent for: Damages including perishables or other goods .00 .00 .00
I-5 Closure Percentage of additional costs for: Damages including perishables or other goods
.00 .00 .00
45
I-5 Closure Amount spent for: Any other reasons or items of losses
.00 .00 .00
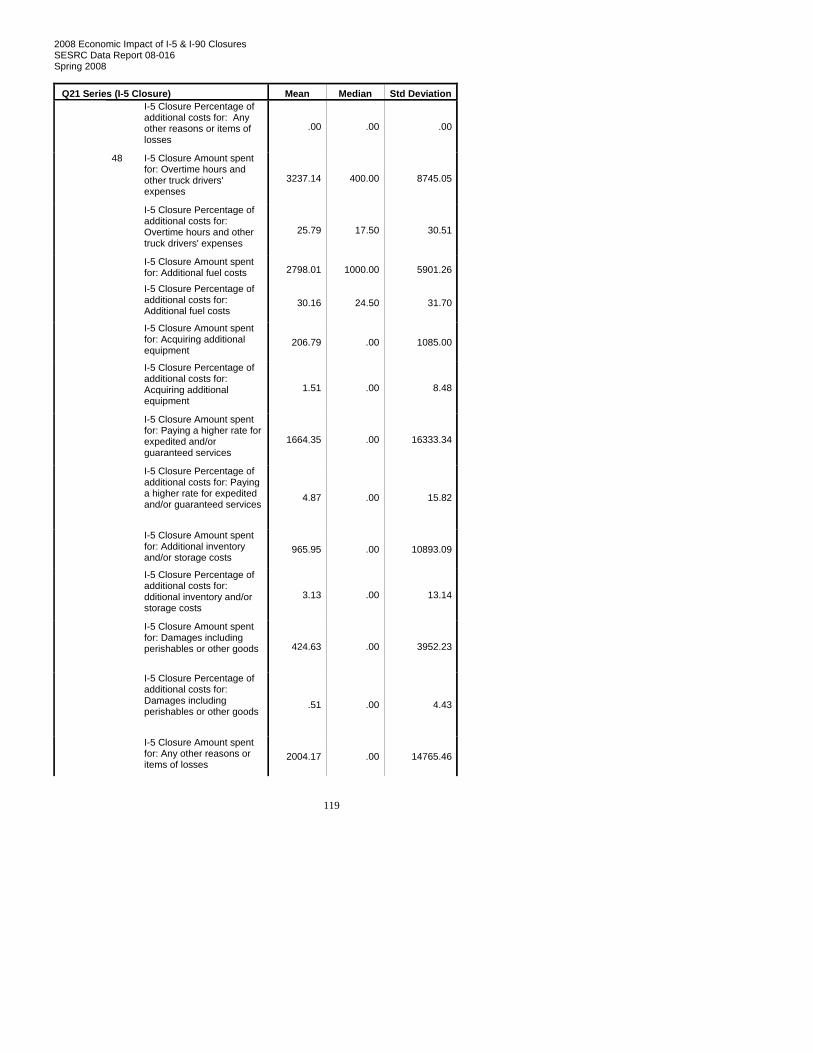
2008 Economic Impact of I-5 & I-90 Closures SESRC Data Report 08-016 Spring 2008
119
Q21 Series (I-5 Closure) Mean Median Std DeviationI-5 Closure Percentage of additional costs for: Any other reasons or items of losses
.00 .00 .00
I-5 Closure Amount spent for: Overtime hours and other truck drivers' expenses
3237.14 400.00 8745.05
I-5 Closure Percentage of additional costs for: Overtime hours and other truck drivers' expenses
25.79 17.50 30.51
I-5 Closure Amount spent for: Additional fuel costs 2798.01 1000.00 5901.26
I-5 Closure Percentage of additional costs for: Additional fuel costs
30.16 24.50 31.70
I-5 Closure Amount spent for: Acquiring additional equipment
206.79 .00 1085.00
I-5 Closure Percentage of additional costs for: Acquiring additional equipment
1.51 .00 8.48
I-5 Closure Amount spent for: Paying a higher rate for expedited and/or guaranteed services
1664.35 .00 16333.34
I-5 Closure Percentage of additional costs for: Paying a higher rate for expedited and/or guaranteed services
4.87 .00 15.82
I-5 Closure Amount spent for: Additional inventory and/or storage costs
965.95 .00 10893.09
I-5 Closure Percentage of additional costs for: dditional inventory and/or storage costs
3.13 .00 13.14
I-5 Closure Amount spent for: Damages including perishables or other goods 424.63 .00 3952.23
I-5 Closure Percentage of additional costs for: Damages including perishables or other goods
.51 .00 4.43
48
I-5 Closure Amount spent for: Any other reasons or items of losses
2004.17 .00 14765.46

2008 Economic Impact of I-5 & I-90 Closures SESRC Data Report 08-016 Spring 2008
120
Q21 Series (I-5 Closure) Mean Median Std DeviationI-5 Closure Percentage of additional costs for: Any other reasons or items of losses
5.93 .00 15.72
Q21 Series (I-5 Closure) Mean Median Std Deviation I-5 Closure Amount spent for: Overtime hours and other truck drivers' expenses
2563.19 150.00 7296.65
I-5 Closure Percentage of additional costs for: Overtime hours and other truck drivers' expenses
21.92 2.00 31.95
I-5 Closure Amount spent for: Additional fuel costs 2105.51 400.00 6324.50
I-5 Closure Percentage of additional costs for: Additional fuel costs
26.38 15.00 32.19
I-5 Closure Amount spent for: Acquiring additional equipment
110.39 .00 744.24
I-5 Closure Percentage of additional costs for: Acquiring additional equipment
1.23 .00 8.19
I-5 Closure Amount spent for: Paying a higher rate for expedited and/or guaranteed services
655.29 .00 3117.03
I-5 Closure Percentage of additional costs for: Paying a higher rate for expedited and/or guaranteed services
5.81 .00 19.14
I-5 Closure Amount spent for: Additional inventory and/or storage costs
163.10 .00 743.80
I-5 Closure Percentage of additional costs for: dditional inventory and/or storage costs
3.24 .00 15.57
I-5 Closure Amount spent for: Damages including perishables or other goods 444.56 .00 4682.80
Categorical Employee Count)
1 Less than 10
I-5 Closure Percentage of additional costs for: Damages including perishables or other goods
.29 .00 2.90

2008 Economic Impact of I-5 & I-90 Closures SESRC Data Report 08-016 Spring 2008
121
Q21 Series (I-5 Closure) Mean Median Std Deviation I-5 Closure Amount spent for: Any other reasons or items of losses
703.84 .00 2705.75
I-5 Closure Percentage of additional costs for: Any other reasons or items of losses
5.00 .00 14.31
I-5 Closure Amount spent for: Overtime hours and other truck drivers' expenses
2847.12 1000.00 4800.71
I-5 Closure Percentage of additional costs for: Overtime hours and other truck drivers' expenses
27.68 25.00 29.73
I-5 Closure Amount spent for: Additional fuel costs 1973.95 1250.00 2260.32
I-5 Closure Percentage of additional costs for: Additional fuel costs
26.80 21.00 29.67
I-5 Closure Amount spent for: Acquiring additional equipment
100.00 .00 455.73
I-5 Closure Percentage of additional costs for: Acquiring additional equipment
.16 .00 .83
I-5 Closure Amount spent for: Paying a higher rate for expedited and/or guaranteed services
529.49 .00 1311.87
I-5 Closure Percentage of additional costs for: Paying a higher rate for expedited and/or guaranteed services
2.44 .00 7.31
I-5 Closure Amount spent for: Additional inventory and/or storage costs
182.56 .00 576.10
I-5 Closure Percentage of additional costs for: dditional inventory and/or storage costs
1.62 .00 4.72
I-5 Closure Amount spent for: Damages including perishables or other goods 142.86 .00 925.82
2 10 - 19
I-5 Closure Percentage of additional costs for: Damages including perishables or other goods
1.32 .00 8.11

2008 Economic Impact of I-5 & I-90 Closures SESRC Data Report 08-016 Spring 2008
122
Q21 Series (I-5 Closure) Mean Median Std Deviation I-5 Closure Amount spent for: Any other reasons or items of losses
823.68 .00 2288.06
I-5 Closure Percentage of additional costs for: Any other reasons or items of losses
5.74 .00 19.21
I-5 Closure Amount spent for: Overtime hours and other truck drivers' expenses
5194.13 675.00 15020.84
I-5 Closure Percentage of additional costs for: Overtime hours and other truck drivers' expenses
31.59 25.00 29.93
I-5 Closure Amount spent for: Additional fuel costs 3257.21 1000.00 5712.27
I-5 Closure Percentage of additional costs for: Additional fuel costs
33.26 25.00 32.42
I-5 Closure Amount spent for: Acquiring additional equipment
311.43 .00 1692.68
I-5 Closure Percentage of additional costs for: Acquiring additional equipment
2.65 .00 12.38
I-5 Closure Amount spent for: Paying a higher rate for expedited and/or guaranteed services
425.91 .00 1798.80
I-5 Closure Percentage of additional costs for: Paying a higher rate for expedited and/or guaranteed services
7.52 .00 19.65
I-5 Closure Amount spent for: Additional inventory and/or storage costs
4485.71 .00 25331.18
I-5 Closure Percentage of additional costs for: dditional inventory and/or storage costs
6.86 .00 19.82
I-5 Closure Amount spent for: Damages including perishables or other goods 600.00 .00 3549.65
3 20 - 29
I-5 Closure Percentage of additional costs for: Damages including perishables or other goods
.00 .00 .00

2008 Economic Impact of I-5 & I-90 Closures SESRC Data Report 08-016 Spring 2008
123
Q21 Series (I-5 Closure) Mean Median Std Deviation I-5 Closure Amount spent for: Any other reasons or items of losses
7279.36 .00 33448.59
I-5 Closure Percentage of additional costs for: Any other reasons or items of losses
10.81 .00 22.53
I-5 Closure Amount spent for: Overtime hours and other truck drivers' expenses
2863.20 1000.00 6444.55
I-5 Closure Percentage of additional costs for: Overtime hours and other truck drivers' expenses
23.07 25.00 15.58
I-5 Closure Amount spent for: Additional fuel costs 2776.91 1000.00 5198.77
I-5 Closure Percentage of additional costs for: Additional fuel costs
26.68 19.80 27.16
I-5 Closure Amount spent for: Acquiring additional equipment
.00 .00 .00
I-5 Closure Percentage of additional costs for: Acquiring additional equipment
.00 .00 .00
I-5 Closure Amount spent for: Paying a higher rate for expedited and/or guaranteed services
11447.37 .00 49295.85
I-5 Closure Percentage of additional costs for: Paying a higher rate for expedited and/or guaranteed services
1.39 .00 5.89
I-5 Closure Amount spent for: Additional inventory and/or storage costs
65.79 .00 286.77
I-5 Closure Percentage of additional costs for: dditional inventory and/or storage costs
.66 .00 2.87
I-5 Closure Amount spent for: Damages including perishables or other goods 57.89 .00 252.36
4 30 - 39
I-5 Closure Percentage of additional costs for: Damages including perishables or other goods
.00 .00 .00
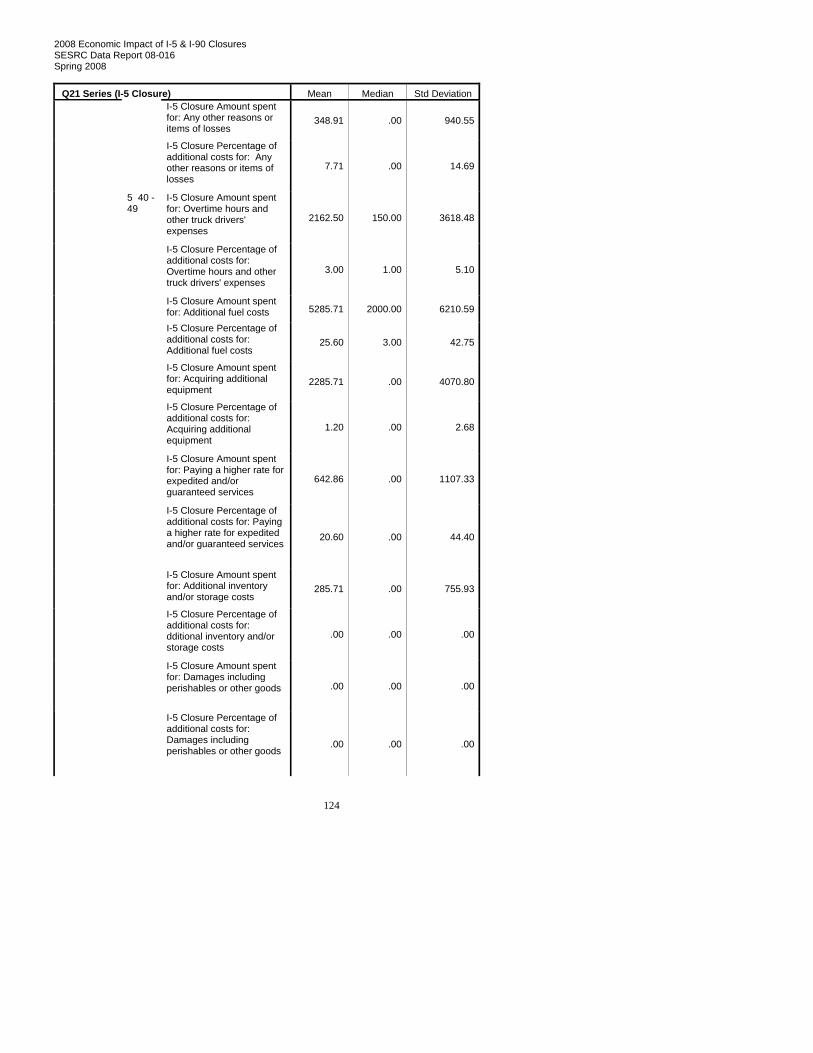
2008 Economic Impact of I-5 & I-90 Closures SESRC Data Report 08-016 Spring 2008
124
Q21 Series (I-5 Closure) Mean Median Std Deviation I-5 Closure Amount spent for: Any other reasons or items of losses
348.91 .00 940.55
I-5 Closure Percentage of additional costs for: Any other reasons or items of losses
7.71 .00 14.69
I-5 Closure Amount spent for: Overtime hours and other truck drivers' expenses
2162.50 150.00 3618.48
I-5 Closure Percentage of additional costs for: Overtime hours and other truck drivers' expenses
3.00 1.00 5.10
I-5 Closure Amount spent for: Additional fuel costs 5285.71 2000.00 6210.59
I-5 Closure Percentage of additional costs for: Additional fuel costs
25.60 3.00 42.75
I-5 Closure Amount spent for: Acquiring additional equipment
2285.71 .00 4070.80
I-5 Closure Percentage of additional costs for: Acquiring additional equipment
1.20 .00 2.68
I-5 Closure Amount spent for: Paying a higher rate for expedited and/or guaranteed services
642.86 .00 1107.33
I-5 Closure Percentage of additional costs for: Paying a higher rate for expedited and/or guaranteed services
20.60 .00 44.40
I-5 Closure Amount spent for: Additional inventory and/or storage costs
285.71 .00 755.93
I-5 Closure Percentage of additional costs for: dditional inventory and/or storage costs
.00 .00 .00
I-5 Closure Amount spent for: Damages including perishables or other goods .00 .00 .00
5 40 - 49
I-5 Closure Percentage of additional costs for: Damages including perishables or other goods
.00 .00 .00

2008 Economic Impact of I-5 & I-90 Closures SESRC Data Report 08-016 Spring 2008
125
Q21 Series (I-5 Closure) Mean Median Std Deviation I-5 Closure Amount spent for: Any other reasons or items of losses
1642.86 .00 3727.31
I-5 Closure Percentage of additional costs for: Any other reasons or items of losses
2.40 .00 5.37
I-5 Closure Amount spent for: Overtime hours and other truck drivers' expenses
4575.24 2500.00 6933.53
I-5 Closure Percentage of additional costs for: Overtime hours and other truck drivers' expenses
40.55 40.00 33.06
I-5 Closure Amount spent for: Additional fuel costs 4412.30 1428.50 6278.04
I-5 Closure Percentage of additional costs for: Additional fuel costs
32.98 30.00 25.39
I-5 Closure Amount spent for: Acquiring additional equipment
181.82 .00 664.50
I-5 Closure Percentage of additional costs for: Acquiring additional equipment
1.50 .00 3.66
I-5 Closure Amount spent for: Paying a higher rate for expedited and/or guaranteed services
3500.00 .00 14849.24
I-5 Closure Percentage of additional costs for: Paying a higher rate for expedited and/or guaranteed services
3.38 .00 11.12
I-5 Closure Amount spent for: Additional inventory and/or storage costs
142.86 .00 654.65
I-5 Closure Percentage of additional costs for: dditional inventory and/or storage costs
.53 .00 2.29
I-5 Closure Amount spent for: Damages including perishables or other goods 2260.87 .00 10207.92
6 50 and Over
I-5 Closure Percentage of additional costs for: Damages including perishables or other goods
2.10 .00 7.63
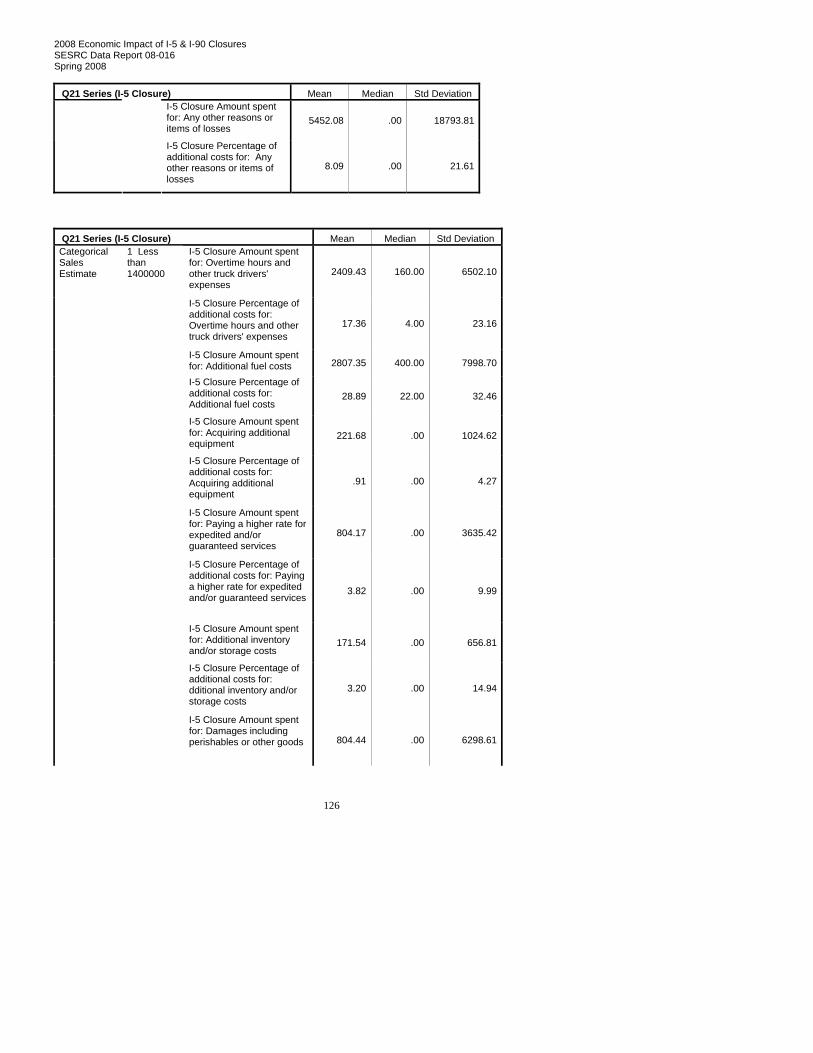
2008 Economic Impact of I-5 & I-90 Closures SESRC Data Report 08-016 Spring 2008
126
Q21 Series (I-5 Closure) Mean Median Std Deviation I-5 Closure Amount spent for: Any other reasons or items of losses
5452.08 .00 18793.81
I-5 Closure Percentage of additional costs for: Any other reasons or items of losses
8.09 .00 21.61
Q21 Series (I-5 Closure) Mean Median Std Deviation I-5 Closure Amount spent for: Overtime hours and other truck drivers' expenses
2409.43 160.00 6502.10
I-5 Closure Percentage of additional costs for: Overtime hours and other truck drivers' expenses
17.36 4.00 23.16
I-5 Closure Amount spent for: Additional fuel costs 2807.35 400.00 7998.70
I-5 Closure Percentage of additional costs for: Additional fuel costs
28.89 22.00 32.46
I-5 Closure Amount spent for: Acquiring additional equipment
221.68 .00 1024.62
I-5 Closure Percentage of additional costs for: Acquiring additional equipment
.91 .00 4.27
I-5 Closure Amount spent for: Paying a higher rate for expedited and/or guaranteed services
804.17 .00 3635.42
I-5 Closure Percentage of additional costs for: Paying a higher rate for expedited and/or guaranteed services
3.82 .00 9.99
I-5 Closure Amount spent for: Additional inventory and/or storage costs
171.54 .00 656.81
I-5 Closure Percentage of additional costs for: dditional inventory and/or storage costs
3.20 .00 14.94
Categorical Sales Estimate
1 Less than 1400000
I-5 Closure Amount spent for: Damages including perishables or other goods 804.44 .00 6298.61
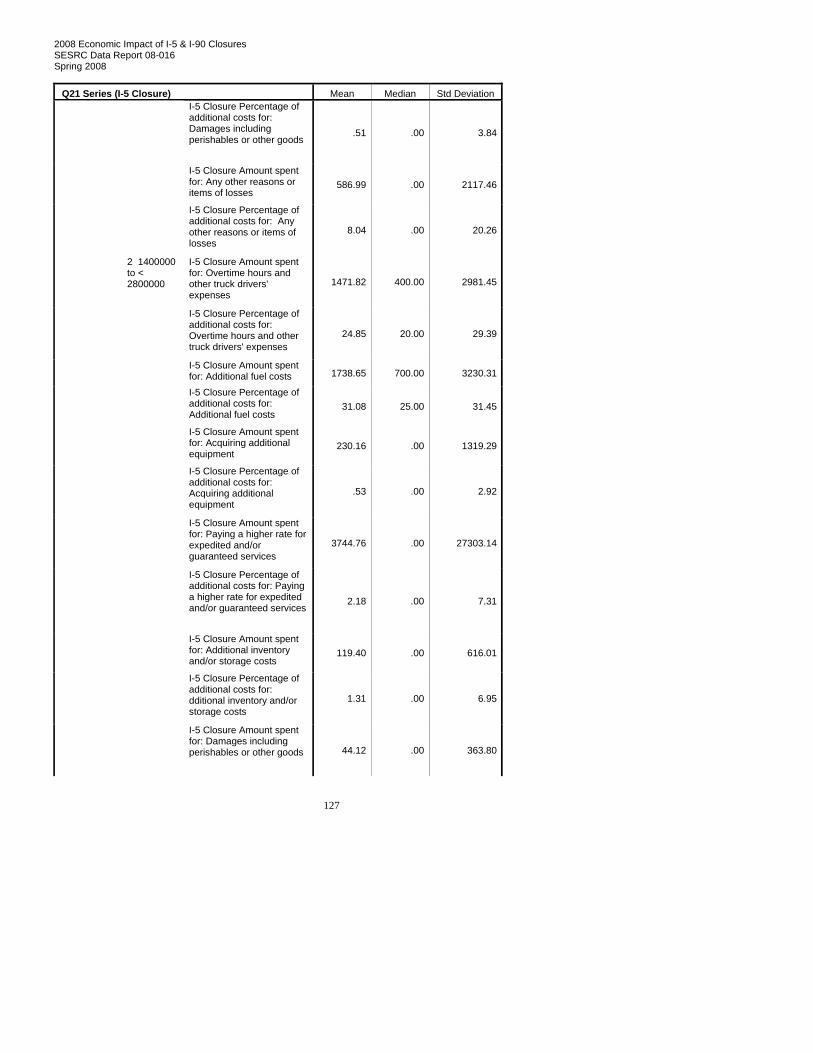
2008 Economic Impact of I-5 & I-90 Closures SESRC Data Report 08-016 Spring 2008
127
Q21 Series (I-5 Closure) Mean Median Std Deviation I-5 Closure Percentage of additional costs for: Damages including perishables or other goods
.51 .00 3.84
I-5 Closure Amount spent for: Any other reasons or items of losses
586.99 .00 2117.46
I-5 Closure Percentage of additional costs for: Any other reasons or items of losses
8.04 .00 20.26
I-5 Closure Amount spent for: Overtime hours and other truck drivers' expenses
1471.82 400.00 2981.45
I-5 Closure Percentage of additional costs for: Overtime hours and other truck drivers' expenses
24.85 20.00 29.39
I-5 Closure Amount spent for: Additional fuel costs 1738.65 700.00 3230.31
I-5 Closure Percentage of additional costs for: Additional fuel costs
31.08 25.00 31.45
I-5 Closure Amount spent for: Acquiring additional equipment
230.16 .00 1319.29
I-5 Closure Percentage of additional costs for: Acquiring additional equipment
.53 .00 2.92
I-5 Closure Amount spent for: Paying a higher rate for expedited and/or guaranteed services
3744.76 .00 27303.14
I-5 Closure Percentage of additional costs for: Paying a higher rate for expedited and/or guaranteed services
2.18 .00 7.31
I-5 Closure Amount spent for: Additional inventory and/or storage costs
119.40 .00 616.01
I-5 Closure Percentage of additional costs for: dditional inventory and/or storage costs
1.31 .00 6.95
2 1400000 to < 2800000
I-5 Closure Amount spent for: Damages including perishables or other goods 44.12 .00 363.80

2008 Economic Impact of I-5 & I-90 Closures SESRC Data Report 08-016 Spring 2008
128
Q21 Series (I-5 Closure) Mean Median Std Deviation I-5 Closure Percentage of additional costs for: Damages including perishables or other goods
.16 .00 1.27
I-5 Closure Amount spent for: Any other reasons or items of losses
575.08 .00 1602.64
I-5 Closure Percentage of additional costs for: Any other reasons or items of losses
4.04 .00 11.18
I-5 Closure Amount spent for: Overtime hours and other truck drivers' expenses
4266.02 500.00 9026.70
I-5 Closure Percentage of additional costs for: Overtime hours and other truck drivers' expenses
30.49 25.00 34.45
I-5 Closure Amount spent for: Additional fuel costs 2738.21 1000.00 4212.12
I-5 Closure Percentage of additional costs for: Additional fuel costs
27.79 17.00 32.04
I-5 Closure Amount spent for: Acquiring additional equipment
160.00 .00 830.13
I-5 Closure Percentage of additional costs for: Acquiring additional equipment
1.69 .00 10.29
I-5 Closure Amount spent for: Paying a higher rate for expedited and/or guaranteed services
722.86 .00 2237.21
I-5 Closure Percentage of additional costs for: Paying a higher rate for expedited and/or guaranteed services
9.95 .00 27.08
I-5 Closure Amount spent for: Additional inventory and/or storage costs
2834.14 .00 19682.79
I-5 Closure Percentage of additional costs for: dditional inventory and/or storage costs
5.45 .00 19.29
3 2800000 to < 6600000
I-5 Closure Amount spent for: Damages including perishables or other goods 476.27 .00 2830.95
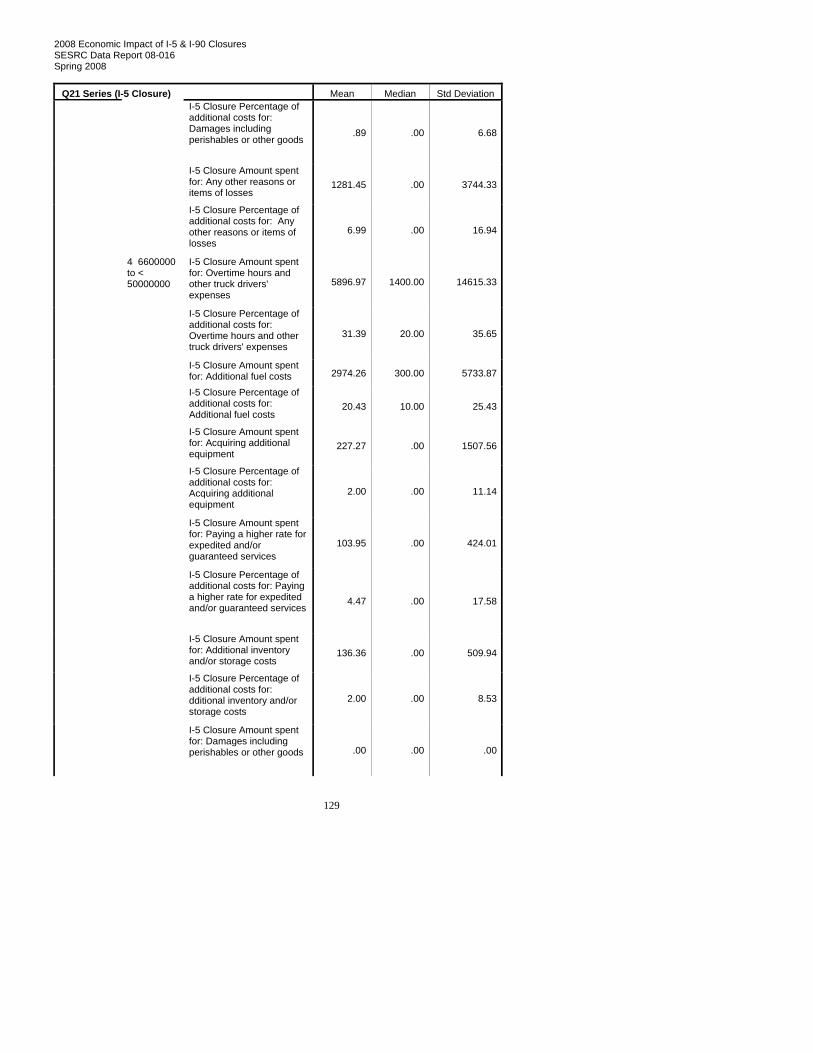
2008 Economic Impact of I-5 & I-90 Closures SESRC Data Report 08-016 Spring 2008
129
Q21 Series (I-5 Closure) Mean Median Std Deviation I-5 Closure Percentage of additional costs for: Damages including perishables or other goods
.89 .00 6.68
I-5 Closure Amount spent for: Any other reasons or items of losses
1281.45 .00 3744.33
I-5 Closure Percentage of additional costs for: Any other reasons or items of losses
6.99 .00 16.94
I-5 Closure Amount spent for: Overtime hours and other truck drivers' expenses
5896.97 1400.00 14615.33
I-5 Closure Percentage of additional costs for: Overtime hours and other truck drivers' expenses
31.39 20.00 35.65
I-5 Closure Amount spent for: Additional fuel costs 2974.26 300.00 5733.87
I-5 Closure Percentage of additional costs for: Additional fuel costs
20.43 10.00 25.43
I-5 Closure Amount spent for: Acquiring additional equipment
227.27 .00 1507.56
I-5 Closure Percentage of additional costs for: Acquiring additional equipment
2.00 .00 11.14
I-5 Closure Amount spent for: Paying a higher rate for expedited and/or guaranteed services
103.95 .00 424.01
I-5 Closure Percentage of additional costs for: Paying a higher rate for expedited and/or guaranteed services
4.47 .00 17.58
I-5 Closure Amount spent for: Additional inventory and/or storage costs
136.36 .00 509.94
I-5 Closure Percentage of additional costs for: dditional inventory and/or storage costs
2.00 .00 8.53
4 6600000 to < 50000000
I-5 Closure Amount spent for: Damages including perishables or other goods .00 .00 .00

2008 Economic Impact of I-5 & I-90 Closures SESRC Data Report 08-016 Spring 2008
130
Q21 Series (I-5 Closure) Mean Median Std Deviation I-5 Closure Percentage of additional costs for: Damages including perishables or other goods
.00 .00 .00
I-5 Closure Amount spent for: Any other reasons or items of losses
7762.50 .00 31583.32
I-5 Closure Percentage of additional costs for: Any other reasons or items of losses
6.87 .00 20.22
I-5 Closure Amount spent for: Overtime hours and other truck drivers' expenses
3240.00 2500.00 3142.38
I-5 Closure Percentage of additional costs for: Overtime hours and other truck drivers' expenses
49.42 54.00 25.12
I-5 Closure Amount spent for: Additional fuel costs 6203.29 2000.00 7501.04
I-5 Closure Percentage of additional costs for: Additional fuel costs
39.21 37.50 25.59
I-5 Closure Amount spent for: Acquiring additional equipment
.00 .00 .00
I-5 Closure Percentage of additional costs for: Acquiring additional equipment
.00 .00 .00
I-5 Closure Amount spent for: Paying a higher rate for expedited and/or guaranteed services
15750.00 .00 31500.00
I-5 Closure Percentage of additional costs for: Paying a higher rate for expedited and/or guaranteed services
14.67 .00 25.40
I-5 Closure Amount spent for: Additional inventory and/or storage costs
.00 .00 .00
I-5 Closure Percentage of additional costs for: dditional inventory and/or storage costs
.00 .00 .00
5 50000000 and Over
I-5 Closure Amount spent for: Damages including perishables or other goods 12250.00 .00 24500.00

2008 Economic Impact of I-5 & I-90 Closures SESRC Data Report 08-016 Spring 2008
131
Q21 Series (I-5 Closure) Mean Median Std Deviation I-5 Closure Percentage of additional costs for: Damages including perishables or other goods
11.33 .00 19.63
I-5 Closure Amount spent for: Any other reasons or items of losses
770.00 .00 1342.39
I-5 Closure Percentage of additional costs for: Any other reasons or items of losses
5.60 .00 7.70

2008 Economic Impact of I-5 & I-90 Closures SESRC Data Report 08-016 Spring 2008
132
Q55 Series Tables (I-90)
Q55 Series (I-90 Closure) Mean Median Std Deviation I-90 Closure Amount spent for: Overtime hours and other truck drivers' expenses
12.50 12.50 17.68
I-90 Closure Percentage of additional costs for: Overtime hours and other truck drivers' expenses
25.00 25.00 35.36
I-90 Closure Amount spent for: Additional fuel costs 12.50 12.50 17.68
I-90 Closure Percentage of additional costs for: Additional fuel costs
25.00 25.00 35.36
I-90 Closure Amount spent for: Acquiring additional equipment
.00 .00 .00
I-90 Closure Percentage of additional costs for: Acquiring additional equipment
.00 .00 .00
I-90 Closure Amount spent for: Paying a higher rate for expedited and/or guaranteed services
.00 .00 .00
I-90 Closure Percentage of additional costs for: Paying a higher rate for expedited and/or guaranteed services
.00 .00 .00
I-90 Closure Amount spent for: Additional inventory and/or storage costs .00 .00 .00
I-90 Closure Percentage of additional costs for: dditional inventory and/or storage costs
.00 .00 .00
I-90 Closure Amount spent for: Damages including perishables or other goods .00 .00 .00
First 2 digits of NAICS Code -- SAMPLE
11
I-90 Closure Percentage of additional costs for: Damages including perishables or other goods
.00 .00 .00

2008 Economic Impact of I-5 & I-90 Closures SESRC Data Report 08-016 Spring 2008
133
Q55 Series (I-90 Closure) Mean Median Std Deviation I-90 Closure Amount spent for: Any other reasons or items of losses .00 .00 .00
I-90 Closure Percentage of additional costs for: Any other reasons or items of losses
.00 .00 .00
I-90 Closure Amount spent for: Overtime hours and other truck drivers' expenses
.00 .00 .
I-90 Closure Percentage of additional costs for: Overtime hours and other truck drivers' expenses
.00 .00 .
I-90 Closure Amount spent for: Additional fuel costs .00 .00 .
I-90 Closure Percentage of additional costs for: Additional fuel costs
.00 .00 .
I-90 Closure Amount spent for: Acquiring additional equipment
.00 .00 .
I-90 Closure Percentage of additional costs for: Acquiring additional equipment
.00 .00 .
I-90 Closure Amount spent for: Paying a higher rate for expedited and/or guaranteed services
.00 .00 .
I-90 Closure Percentage of additional costs for: Paying a higher rate for expedited and/or guaranteed services
.00 .00 .
I-90 Closure Amount spent for: Additional inventory and/or storage costs .00 .00 .
I-90 Closure Percentage of additional costs for: dditional inventory and/or storage costs
.00 .00 .
23
I-90 Closure Amount spent for: Damages including perishables or other goods .00 .00 .

2008 Economic Impact of I-5 & I-90 Closures SESRC Data Report 08-016 Spring 2008
134
Q55 Series (I-90 Closure) Mean Median Std Deviation I-90 Closure Percentage of additional costs for: Damages including perishables or other goods
.00 .00 .
I-90 Closure Amount spent for: Any other reasons or items of losses .00 .00 .
I-90 Closure Percentage of additional costs for: Any other reasons or items of losses
.00 .00 .
I-90 Closure Amount spent for: Overtime hours and other truck drivers' expenses
1933.33 1000.00 2271.27
I-90 Closure Percentage of additional costs for: Overtime hours and other truck drivers' expenses
51.73 53.45 50.61
I-90 Closure Amount spent for: Additional fuel costs 2616.67 1100.00 3878.36
I-90 Closure Percentage of additional costs for: Additional fuel costs
25.31 .63 49.80
I-90 Closure Amount spent for: Acquiring additional equipment
2142.86 .00 5669.47
I-90 Closure Percentage of additional costs for: Acquiring additional equipment
.00 .00 .00
I-90 Closure Amount spent for: Paying a higher rate for expedited and/or guaranteed services
.00 .00 .00
I-90 Closure Percentage of additional costs for: Paying a higher rate for expedited and/or guaranteed services
.00 .00 .00
I-90 Closure Amount spent for: Additional inventory and/or storage costs 2500.00 .00 7071.07
31
I-90 Closure Percentage of additional costs for: dditional inventory and/or storage costs
.00 .00 .00
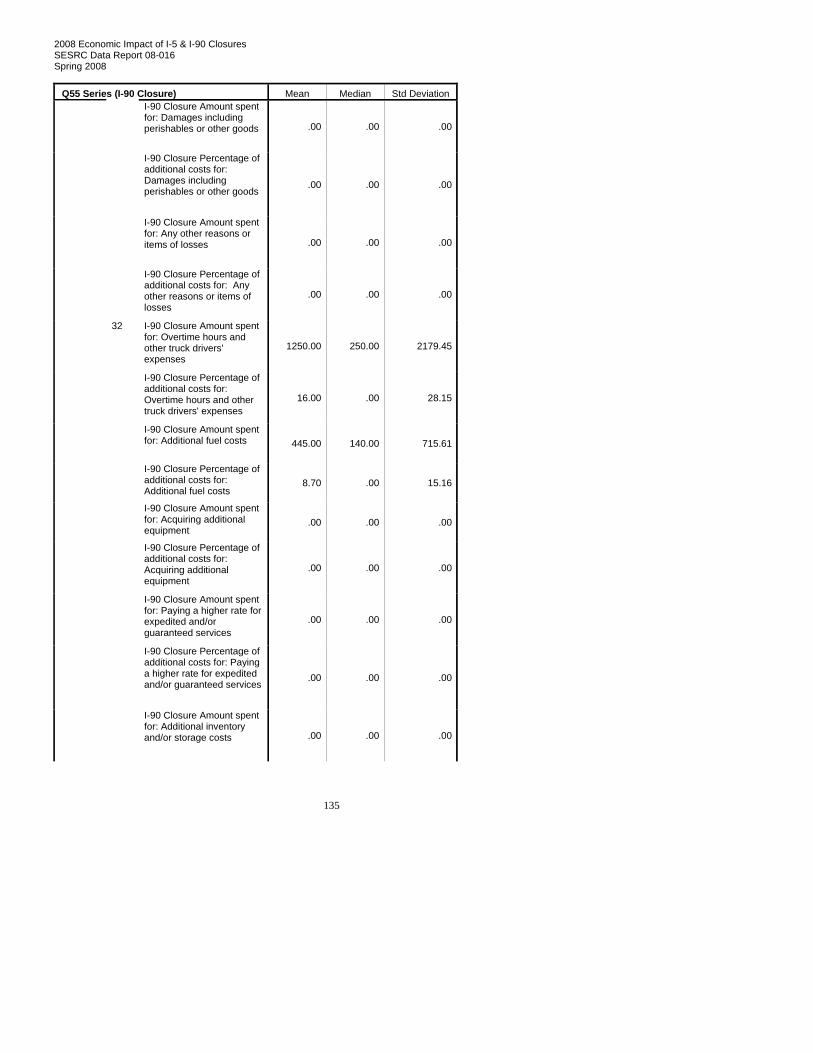
2008 Economic Impact of I-5 & I-90 Closures SESRC Data Report 08-016 Spring 2008
135
Q55 Series (I-90 Closure) Mean Median Std Deviation I-90 Closure Amount spent for: Damages including perishables or other goods .00 .00 .00
I-90 Closure Percentage of additional costs for: Damages including perishables or other goods
.00 .00 .00
I-90 Closure Amount spent for: Any other reasons or items of losses .00 .00 .00
I-90 Closure Percentage of additional costs for: Any other reasons or items of losses
.00 .00 .00
I-90 Closure Amount spent for: Overtime hours and other truck drivers' expenses
1250.00 250.00 2179.45
I-90 Closure Percentage of additional costs for: Overtime hours and other truck drivers' expenses
16.00 .00 28.15
I-90 Closure Amount spent for: Additional fuel costs 445.00 140.00 715.61
I-90 Closure Percentage of additional costs for: Additional fuel costs
8.70 .00 15.16
I-90 Closure Amount spent for: Acquiring additional equipment
.00 .00 .00
I-90 Closure Percentage of additional costs for: Acquiring additional equipment
.00 .00 .00
I-90 Closure Amount spent for: Paying a higher rate for expedited and/or guaranteed services
.00 .00 .00
I-90 Closure Percentage of additional costs for: Paying a higher rate for expedited and/or guaranteed services
.00 .00 .00
32
I-90 Closure Amount spent for: Additional inventory and/or storage costs .00 .00 .00

2008 Economic Impact of I-5 & I-90 Closures SESRC Data Report 08-016 Spring 2008
136
Q55 Series (I-90 Closure) Mean Median Std Deviation I-90 Closure Percentage of additional costs for: dditional inventory and/or storage costs
.00 .00 .00
I-90 Closure Amount spent for: Damages including perishables or other goods .00 .00 .00
I-90 Closure Percentage of additional costs for: Damages including perishables or other goods
.00 .00 .00
I-90 Closure Amount spent for: Any other reasons or items of losses .00 .00 .00
I-90 Closure Percentage of additional costs for: Any other reasons or items of losses
.00 .00 .00
I-90 Closure Amount spent for: Overtime hours and other truck drivers' expenses
162.50 162.50 229.81
I-90 Closure Percentage of additional costs for: Overtime hours and other truck drivers' expenses
25.00 25.00 35.36
I-90 Closure Amount spent for: Additional fuel costs 102.00 102.00 144.25
I-90 Closure Percentage of additional costs for: Additional fuel costs
15.00 15.00 21.21
I-90 Closure Amount spent for: Acquiring additional equipment
.00 .00 .00
I-90 Closure Percentage of additional costs for: Acquiring additional equipment
.00 .00 .00
I-90 Closure Amount spent for: Paying a higher rate for expedited and/or guaranteed services
.00 .00 .00
33
I-90 Closure Percentage of additional costs for: Paying a higher rate for expedited and/or guaranteed services
.00 .00 .00

2008 Economic Impact of I-5 & I-90 Closures SESRC Data Report 08-016 Spring 2008
137
Q55 Series (I-90 Closure) Mean Median Std Deviation I-90 Closure Amount spent for: Additional inventory and/or storage costs .00 .00 .00
I-90 Closure Percentage of additional costs for: dditional inventory and/or storage costs
.00 .00 .00
I-90 Closure Amount spent for: Damages including perishables or other goods .00 .00 .00
I-90 Closure Percentage of additional costs for: Damages including perishables or other goods
.00 .00 .00
I-90 Closure Amount spent for: Any other reasons or items of losses 30.00 .00 60.00
I-90 Closure Percentage of additional costs for: Any other reasons or items of losses
4.25 .00 8.50
I-90 Closure Amount spent for: Overtime hours and other truck drivers' expenses
1365.22 .00 3056.85
I-90 Closure Percentage of additional costs for: Overtime hours and other truck drivers' expenses
30.71 5.00 40.12
I-90 Closure Amount spent for: Additional fuel costs 255.43 .00 572.57
I-90 Closure Percentage of additional costs for: Additional fuel costs
12.35 .00 20.68
I-90 Closure Amount spent for: Acquiring additional equipment
.00 .00 .00
I-90 Closure Percentage of additional costs for: Acquiring additional equipment
1.05 .00 4.59
42
I-90 Closure Amount spent for: Paying a higher rate for expedited and/or guaranteed services
477.27 .00 1248.59
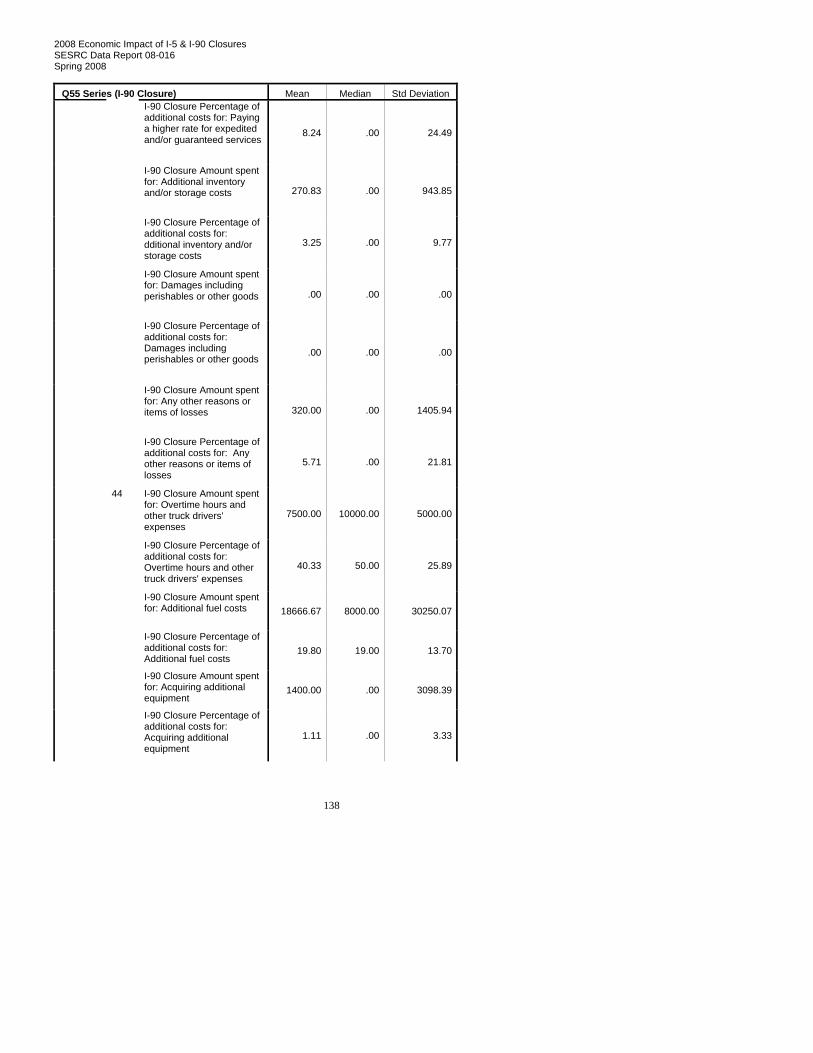
2008 Economic Impact of I-5 & I-90 Closures SESRC Data Report 08-016 Spring 2008
138
Q55 Series (I-90 Closure) Mean Median Std Deviation I-90 Closure Percentage of additional costs for: Paying a higher rate for expedited and/or guaranteed services
8.24 .00 24.49
I-90 Closure Amount spent for: Additional inventory and/or storage costs 270.83 .00 943.85
I-90 Closure Percentage of additional costs for: dditional inventory and/or storage costs
3.25 .00 9.77
I-90 Closure Amount spent for: Damages including perishables or other goods .00 .00 .00
I-90 Closure Percentage of additional costs for: Damages including perishables or other goods
.00 .00 .00
I-90 Closure Amount spent for: Any other reasons or items of losses 320.00 .00 1405.94
I-90 Closure Percentage of additional costs for: Any other reasons or items of losses
5.71 .00 21.81
I-90 Closure Amount spent for: Overtime hours and other truck drivers' expenses
7500.00 10000.00 5000.00
I-90 Closure Percentage of additional costs for: Overtime hours and other truck drivers' expenses
40.33 50.00 25.89
I-90 Closure Amount spent for: Additional fuel costs 18666.67 8000.00 30250.07
I-90 Closure Percentage of additional costs for: Additional fuel costs
19.80 19.00 13.70
I-90 Closure Amount spent for: Acquiring additional equipment
1400.00 .00 3098.39
44
I-90 Closure Percentage of additional costs for: Acquiring additional equipment
1.11 .00 3.33

2008 Economic Impact of I-5 & I-90 Closures SESRC Data Report 08-016 Spring 2008
139
Q55 Series (I-90 Closure) Mean Median Std Deviation I-90 Closure Amount spent for: Paying a higher rate for expedited and/or guaranteed services
3333.33 .00 8164.97
I-90 Closure Percentage of additional costs for: Paying a higher rate for expedited and/or guaranteed services
4.40 .00 9.84
I-90 Closure Amount spent for: Additional inventory and/or storage costs 1272.73 .00 4221.16
I-90 Closure Percentage of additional costs for: dditional inventory and/or storage costs
1.67 .00 5.00
I-90 Closure Amount spent for: Damages including perishables or other goods 2272.73 .00 7537.78
I-90 Closure Percentage of additional costs for: Damages including perishables or other goods
.20 .00 .63
I-90 Closure Amount spent for: Any other reasons or items of losses 1818.36 .00 6030.17
I-90 Closure Percentage of additional costs for: Any other reasons or items of losses
2.50 .00 7.23
I-90 Closure Amount spent for: Overtime hours and other truck drivers' expenses
433.33 .00 750.56
I-90 Closure Percentage of additional costs for: Overtime hours and other truck drivers' expenses
1.67 .00 2.89
I-90 Closure Amount spent for: Additional fuel costs 366.67 100.00 550.76
I-90 Closure Percentage of additional costs for: Additional fuel costs
35.00 5.00 56.35
45
I-90 Closure Amount spent for: Acquiring additional equipment
.00 .00 .00

2008 Economic Impact of I-5 & I-90 Closures SESRC Data Report 08-016 Spring 2008
140
Q55 Series (I-90 Closure) Mean Median Std Deviation I-90 Closure Percentage of additional costs for: Acquiring additional equipment
.00 .00 .00
I-90 Closure Amount spent for: Paying a higher rate for expedited and/or guaranteed services
.00 .00 .00
I-90 Closure Percentage of additional costs for: Paying a higher rate for expedited and/or guaranteed services
.00 .00 .00
I-90 Closure Amount spent for: Additional inventory and/or storage costs .00 .00 .00
I-90 Closure Percentage of additional costs for: dditional inventory and/or storage costs
.00 .00 .00
I-90 Closure Amount spent for: Damages including perishables or other goods .00 .00 .00
I-90 Closure Percentage of additional costs for: Damages including perishables or other goods
.00 .00 .00
I-90 Closure Amount spent for: Any other reasons or items of losses .00 .00 .00
I-90 Closure Percentage of additional costs for: Any other reasons or items of losses
.00 .00 .00
I-90 Closure Amount spent for: Overtime hours and other truck drivers' expenses
2253.21 500.00 5160.72
I-90 Closure Percentage of additional costs for: Overtime hours and other truck drivers' expenses
24.77 15.00 29.59
I-90 Closure Amount spent for: Additional fuel costs 2570.61 500.00 7454.41
48
I-90 Closure Percentage of additional costs for: Additional fuel costs
27.28 20.00 30.04
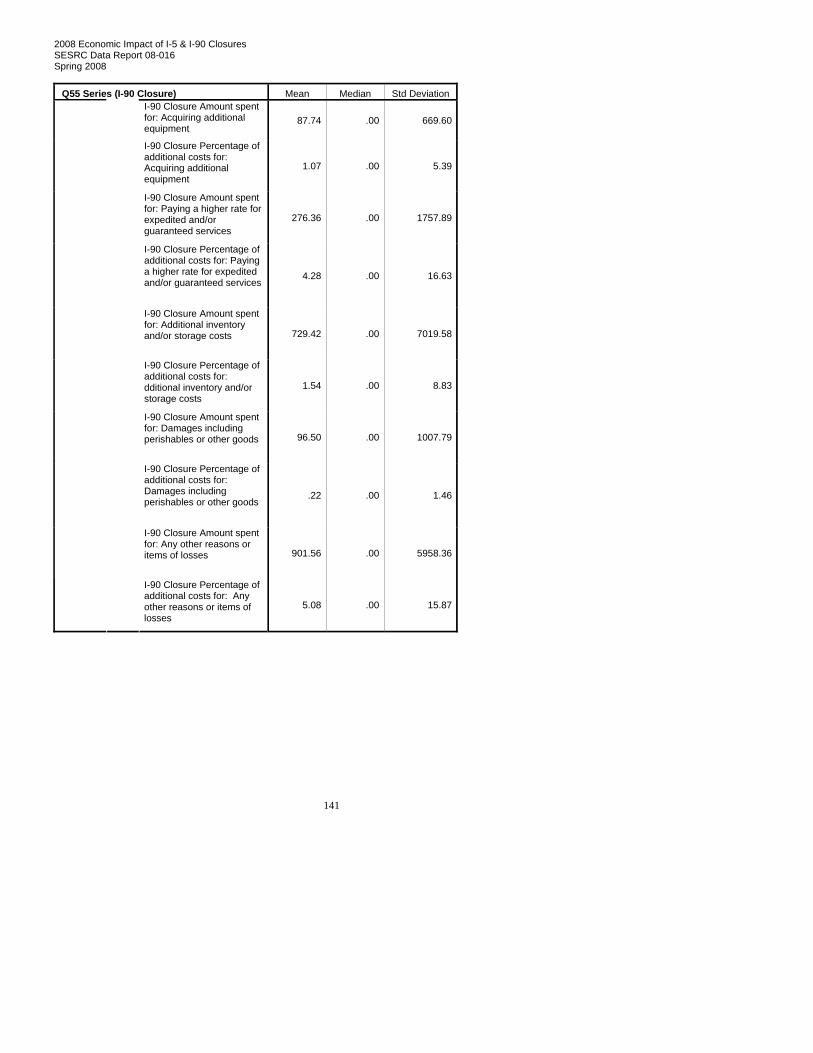
2008 Economic Impact of I-5 & I-90 Closures SESRC Data Report 08-016 Spring 2008
141
Q55 Series (I-90 Closure) Mean Median Std Deviation I-90 Closure Amount spent for: Acquiring additional equipment
87.74 .00 669.60
I-90 Closure Percentage of additional costs for: Acquiring additional equipment
1.07 .00 5.39
I-90 Closure Amount spent for: Paying a higher rate for expedited and/or guaranteed services
276.36 .00 1757.89
I-90 Closure Percentage of additional costs for: Paying a higher rate for expedited and/or guaranteed services
4.28 .00 16.63
I-90 Closure Amount spent for: Additional inventory and/or storage costs 729.42 .00 7019.58
I-90 Closure Percentage of additional costs for: dditional inventory and/or storage costs
1.54 .00 8.83
I-90 Closure Amount spent for: Damages including perishables or other goods 96.50 .00 1007.79
I-90 Closure Percentage of additional costs for: Damages including perishables or other goods
.22 .00 1.46
I-90 Closure Amount spent for: Any other reasons or items of losses 901.56 .00 5958.36
I-90 Closure Percentage of additional costs for: Any other reasons or items of losses
5.08 .00 15.87
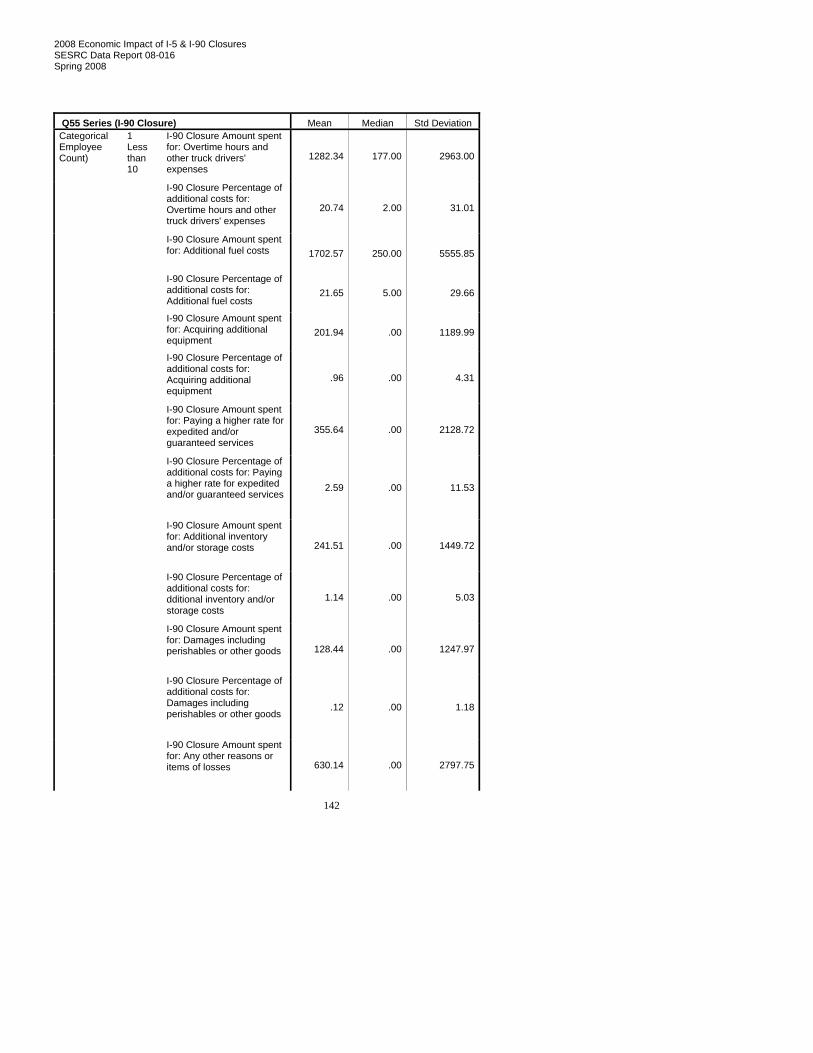
2008 Economic Impact of I-5 & I-90 Closures SESRC Data Report 08-016 Spring 2008
142
Q55 Series (I-90 Closure) Mean Median Std Deviation I-90 Closure Amount spent for: Overtime hours and other truck drivers' expenses
1282.34 177.00 2963.00
I-90 Closure Percentage of additional costs for: Overtime hours and other truck drivers' expenses
20.74 2.00 31.01
I-90 Closure Amount spent for: Additional fuel costs 1702.57 250.00 5555.85
I-90 Closure Percentage of additional costs for: Additional fuel costs
21.65 5.00 29.66
I-90 Closure Amount spent for: Acquiring additional equipment
201.94 .00 1189.99
I-90 Closure Percentage of additional costs for: Acquiring additional equipment
.96 .00 4.31
I-90 Closure Amount spent for: Paying a higher rate for expedited and/or guaranteed services
355.64 .00 2128.72
I-90 Closure Percentage of additional costs for: Paying a higher rate for expedited and/or guaranteed services
2.59 .00 11.53
I-90 Closure Amount spent for: Additional inventory and/or storage costs 241.51 .00 1449.72
I-90 Closure Percentage of additional costs for: dditional inventory and/or storage costs
1.14 .00 5.03
I-90 Closure Amount spent for: Damages including perishables or other goods 128.44 .00 1247.97
I-90 Closure Percentage of additional costs for: Damages including perishables or other goods
.12 .00 1.18
Categorical Employee Count)
1 Less than 10
I-90 Closure Amount spent for: Any other reasons or items of losses 630.14 .00 2797.75
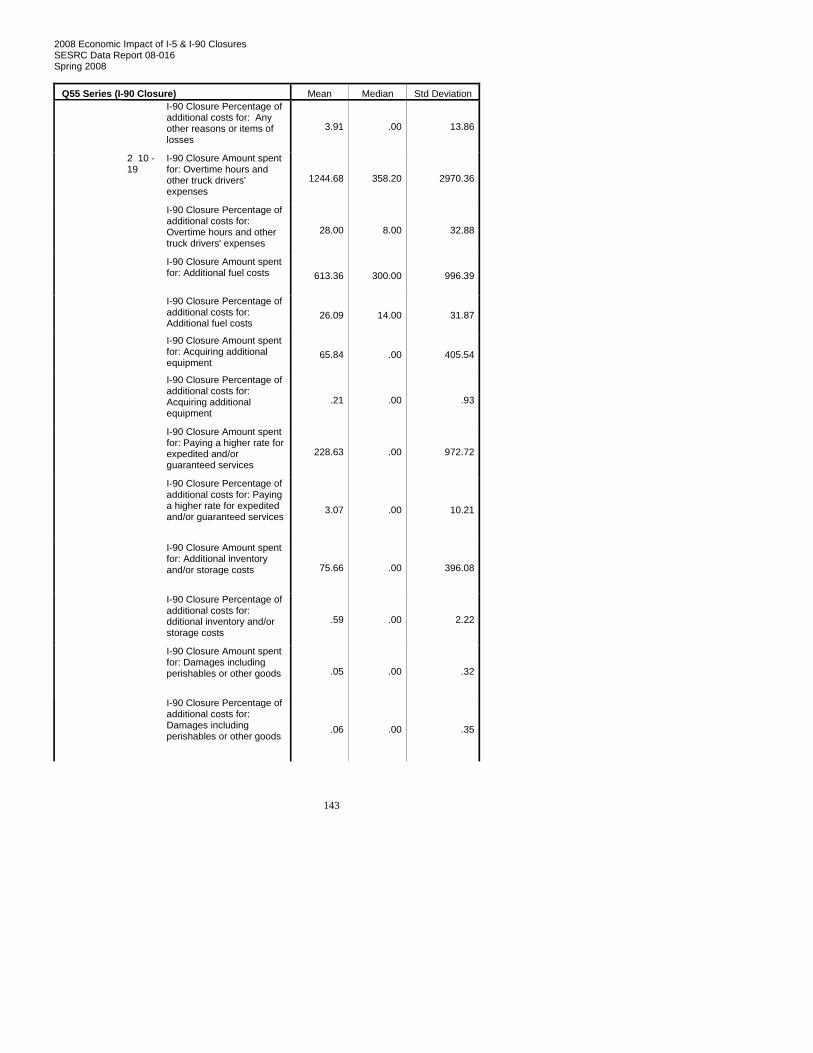
2008 Economic Impact of I-5 & I-90 Closures SESRC Data Report 08-016 Spring 2008
143
Q55 Series (I-90 Closure) Mean Median Std Deviation I-90 Closure Percentage of additional costs for: Any other reasons or items of losses
3.91 .00 13.86
I-90 Closure Amount spent for: Overtime hours and other truck drivers' expenses
1244.68 358.20 2970.36
I-90 Closure Percentage of additional costs for: Overtime hours and other truck drivers' expenses
28.00 8.00 32.88
I-90 Closure Amount spent for: Additional fuel costs 613.36 300.00 996.39
I-90 Closure Percentage of additional costs for: Additional fuel costs
26.09 14.00 31.87
I-90 Closure Amount spent for: Acquiring additional equipment
65.84 .00 405.54
I-90 Closure Percentage of additional costs for: Acquiring additional equipment
.21 .00 .93
I-90 Closure Amount spent for: Paying a higher rate for expedited and/or guaranteed services
228.63 .00 972.72
I-90 Closure Percentage of additional costs for: Paying a higher rate for expedited and/or guaranteed services
3.07 .00 10.21
I-90 Closure Amount spent for: Additional inventory and/or storage costs 75.66 .00 396.08
I-90 Closure Percentage of additional costs for: dditional inventory and/or storage costs
.59 .00 2.22
I-90 Closure Amount spent for: Damages including perishables or other goods .05 .00 .32
2 10 - 19
I-90 Closure Percentage of additional costs for: Damages including perishables or other goods
.06 .00 .35

2008 Economic Impact of I-5 & I-90 Closures SESRC Data Report 08-016 Spring 2008
144
Q55 Series (I-90 Closure) Mean Median Std Deviation I-90 Closure Amount spent for: Any other reasons or items of losses 471.97 .00 1607.02
I-90 Closure Percentage of additional costs for: Any other reasons or items of losses
4.34 .00 18.36
I-90 Closure Amount spent for: Overtime hours and other truck drivers' expenses
3435.86 500.00 7620.71
I-90 Closure Percentage of additional costs for: Overtime hours and other truck drivers' expenses
26.84 20.00 29.81
I-90 Closure Amount spent for: Additional fuel costs 2069.82 450.00 3568.25
I-90 Closure Percentage of additional costs for: Additional fuel costs
30.34 30.00 30.73
I-90 Closure Amount spent for: Acquiring additional equipment
.00 .00 .00
I-90 Closure Percentage of additional costs for: Acquiring additional equipment
1.52 .00 8.70
I-90 Closure Amount spent for: Paying a higher rate for expedited and/or guaranteed services
738.45 .00 3707.81
I-90 Closure Percentage of additional costs for: Paying a higher rate for expedited and/or guaranteed services
10.76 .00 28.78
I-90 Closure Amount spent for: Additional inventory and/or storage costs 3590.97 .00 16274.07
I-90 Closure Percentage of additional costs for: dditional inventory and/or storage costs
4.86 .00 18.84
3 20 - 29
I-90 Closure Amount spent for: Damages including perishables or other goods 78.13 .00 361.66
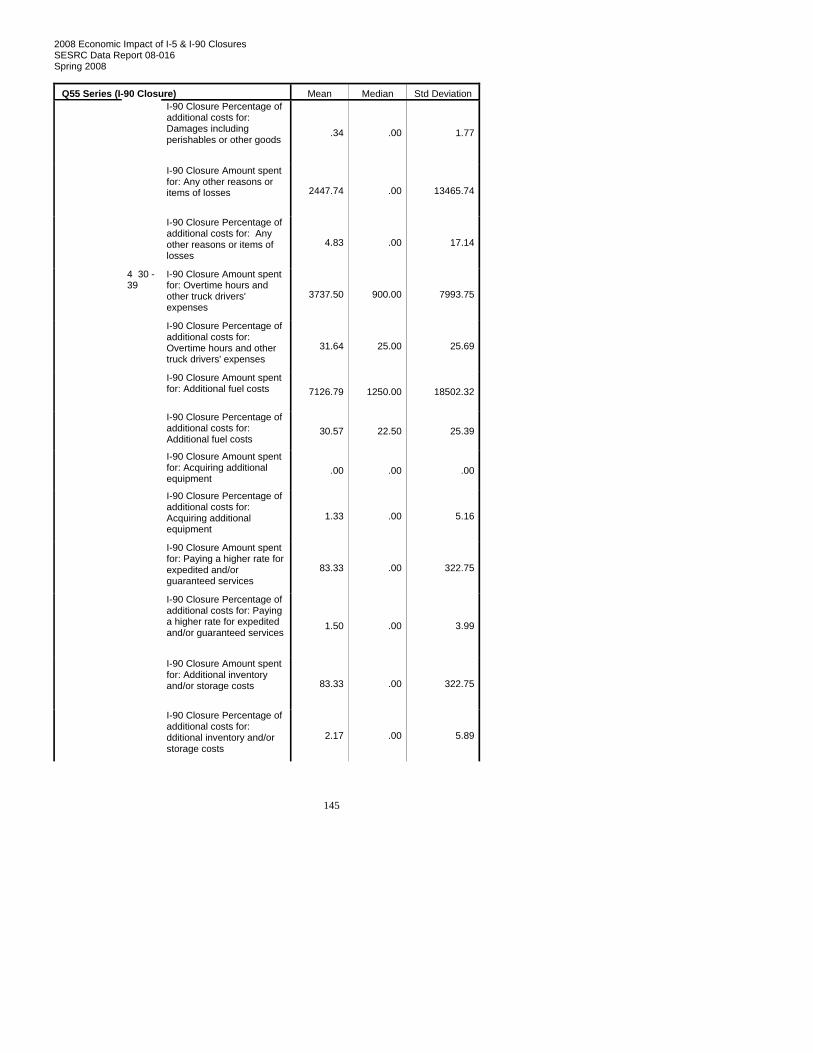
2008 Economic Impact of I-5 & I-90 Closures SESRC Data Report 08-016 Spring 2008
145
Q55 Series (I-90 Closure) Mean Median Std Deviation I-90 Closure Percentage of additional costs for: Damages including perishables or other goods
.34 .00 1.77
I-90 Closure Amount spent for: Any other reasons or items of losses 2447.74 .00 13465.74
I-90 Closure Percentage of additional costs for: Any other reasons or items of losses
4.83 .00 17.14
I-90 Closure Amount spent for: Overtime hours and other truck drivers' expenses
3737.50 900.00 7993.75
I-90 Closure Percentage of additional costs for: Overtime hours and other truck drivers' expenses
31.64 25.00 25.69
I-90 Closure Amount spent for: Additional fuel costs 7126.79 1250.00 18502.32
I-90 Closure Percentage of additional costs for: Additional fuel costs
30.57 22.50 25.39
I-90 Closure Amount spent for: Acquiring additional equipment
.00 .00 .00
I-90 Closure Percentage of additional costs for: Acquiring additional equipment
1.33 .00 5.16
I-90 Closure Amount spent for: Paying a higher rate for expedited and/or guaranteed services
83.33 .00 322.75
I-90 Closure Percentage of additional costs for: Paying a higher rate for expedited and/or guaranteed services
1.50 .00 3.99
I-90 Closure Amount spent for: Additional inventory and/or storage costs 83.33 .00 322.75
4 30 - 39
I-90 Closure Percentage of additional costs for: dditional inventory and/or storage costs
2.17 .00 5.89

2008 Economic Impact of I-5 & I-90 Closures SESRC Data Report 08-016 Spring 2008
146
Q55 Series (I-90 Closure) Mean Median Std Deviation I-90 Closure Amount spent for: Damages including perishables or other goods .00 .00 .00
I-90 Closure Percentage of additional costs for: Damages including perishables or other goods
.00 .00 .00
I-90 Closure Amount spent for: Any other reasons or items of losses 220.00 .00 647.19
I-90 Closure Percentage of additional costs for: Any other reasons or items of losses
12.81 .00 26.53
I-90 Closure Amount spent for: Overtime hours and other truck drivers' expenses
5650.00 850.00 8414.21
I-90 Closure Percentage of additional costs for: Overtime hours and other truck drivers' expenses
9.50 9.00 9.98
I-90 Closure Amount spent for: Additional fuel costs 3466.67 2750.00 3955.59
I-90 Closure Percentage of additional costs for: Additional fuel costs
3.50 3.00 3.70
I-90 Closure Amount spent for: Acquiring additional equipment
2500.00 .00 6123.72
I-90 Closure Percentage of additional costs for: Acquiring additional equipment
.00 .00 .00
I-90 Closure Amount spent for: Paying a higher rate for expedited and/or guaranteed services
833.33 .00 2041.24
I-90 Closure Percentage of additional costs for: Paying a higher rate for expedited and/or guaranteed services
20.00 .00 44.72
5 40 - 49
I-90 Closure Amount spent for: Additional inventory and/or storage costs 3333.33 .00 8164.97

2008 Economic Impact of I-5 & I-90 Closures SESRC Data Report 08-016 Spring 2008
147
Q55 Series (I-90 Closure) Mean Median Std Deviation I-90 Closure Percentage of additional costs for: dditional inventory and/or storage costs
.00 .00 .00
I-90 Closure Amount spent for: Damages including perishables or other goods .00 .00 .00
I-90 Closure Percentage of additional costs for: Damages including perishables or other goods
.00 .00 .00
I-90 Closure Amount spent for: Any other reasons or items of losses 666.67 .00 1211.06
I-90 Closure Percentage of additional costs for: Any other reasons or items of losses
3.80 .00 6.94
I-90 Closure Amount spent for: Overtime hours and other truck drivers' expenses
3846.74 2000.00 5185.01
I-90 Closure Percentage of additional costs for: Overtime hours and other truck drivers' expenses
38.50 40.00 31.97
I-90 Closure Amount spent for: Additional fuel costs 6811.74 1000.00 15467.61
I-90 Closure Percentage of additional costs for: Additional fuel costs
29.40 30.00 28.15
I-90 Closure Amount spent for: Acquiring additional equipment
208.33 .00 1020.62
I-90 Closure Percentage of additional costs for: Acquiring additional equipment
1.25 .00 4.48
I-90 Closure Amount spent for: Paying a higher rate for expedited and/or guaranteed services
125.00 .00 559.02
6 50 and Over
I-90 Closure Percentage of additional costs for: Paying a higher rate for expedited and/or guaranteed services
.79 .00 2.51

2008 Economic Impact of I-5 & I-90 Closures SESRC Data Report 08-016 Spring 2008
148
Q55 Series (I-90 Closure) Mean Median Std Deviation I-90 Closure Amount spent for: Additional inventory and/or storage costs 96.15 .00 490.29
I-90 Closure Percentage of additional costs for: dditional inventory and/or storage costs
.21 .00 1.02
I-90 Closure Amount spent for: Damages including perishables or other goods 925.93 .00 4811.25
I-90 Closure Percentage of additional costs for: Damages including perishables or other goods
.48 .00 2.02
I-90 Closure Amount spent for: Any other reasons or items of losses 444.35 .00 1533.41
I-90 Closure Percentage of additional costs for: Any other reasons or items of losses
2.89 .00 6.73

2008 Economic Impact of I-5 & I-90 Closures SESRC Data Report 08-016 Spring 2008
149
Q55 Series (I-90 Closure) Mean Median Std Deviation I-90 Closure Amount spent for: Overtime hours and other truck drivers' expenses
2213.99 500.00 4635.79
I-90 Closure Percentage of additional costs for: Overtime hours and other truck drivers' expenses
21.92 5.00 30.87
I-90 Closure Amount spent for: Additional fuel costs 1737.55 500.00 3428.37
I-90 Closure Percentage of additional costs for: Additional fuel costs
23.61 5.00 32.37
I-90 Closure Amount spent for: Acquiring additional equipment
377.97 .00 1583.65
I-90 Closure Percentage of additional costs for: Acquiring additional equipment
1.40 .00 5.03
I-90 Closure Amount spent for: Paying a higher rate for expedited and/or guaranteed services
784.48 .00 3721.81
I-90 Closure Percentage of additional costs for: Paying a higher rate for expedited and/or guaranteed services
1.22 .00 4.66
I-90 Closure Amount spent for: Additional inventory and/or storage costs 588.71 .00 2615.41
I-90 Closure Percentage of additional costs for: dditional inventory and/or storage costs
.79 .00 3.08
I-90 Closure Amount spent for: Damages including perishables or other goods 23.81 .00 139.95
I-90 Closure Percentage of additional costs for: Damages including perishables or other goods
.00 .00 .00
Categorical Sales Estimate
1 Less than 1400000
I-90 Closure Amount spent for: Any other reasons or items of losses 758.39 .00 3085.52

2008 Economic Impact of I-5 & I-90 Closures SESRC Data Report 08-016 Spring 2008
150
Q55 Series (I-90 Closure) Mean Median Std Deviation I-90 Closure Percentage of additional costs for: Any other reasons or items of losses
7.00 .00 20.63
I-90 Closure Amount spent for: Overtime hours and other truck drivers' expenses
1488.84 225.00 4346.22
I-90 Closure Percentage of additional costs for: Overtime hours and other truck drivers' expenses
21.61 6.50 28.79
I-90 Closure Amount spent for: Additional fuel costs 3312.33 400.00 11323.24
I-90 Closure Percentage of additional costs for: Additional fuel costs
26.19 10.00 31.14
I-90 Closure Amount spent for: Acquiring additional equipment
16.98 .00 130.18
I-90 Closure Percentage of additional costs for: Acquiring additional equipment
.69 .00 3.59
I-90 Closure Amount spent for: Paying a higher rate for expedited and/or guaranteed services
218.83 .00 1039.17
I-90 Closure Percentage of additional costs for: Paying a higher rate for expedited and/or guaranteed services
6.64 .00 22.12
I-90 Closure Amount spent for: Additional inventory and/or storage costs 1667.25 .00 11523.75
I-90 Closure Percentage of additional costs for: dditional inventory and/or storage costs
3.73 .00 14.73
I-90 Closure Amount spent for: Damages including perishables or other goods 213.15 .00 1664.48
2 1400000 to < 2800000
I-90 Closure Percentage of additional costs for: Damages including perishables or other goods
.39 .00 1.99
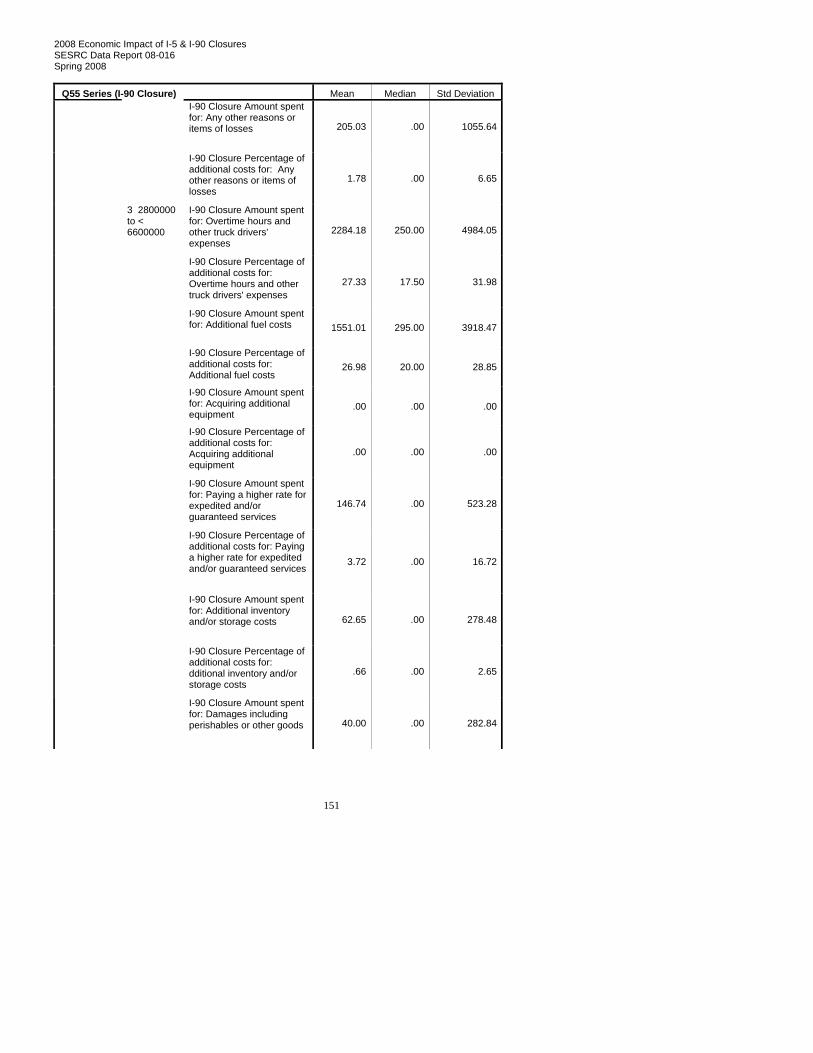
2008 Economic Impact of I-5 & I-90 Closures SESRC Data Report 08-016 Spring 2008
151
Q55 Series (I-90 Closure) Mean Median Std Deviation I-90 Closure Amount spent for: Any other reasons or items of losses 205.03 .00 1055.64
I-90 Closure Percentage of additional costs for: Any other reasons or items of losses
1.78 .00 6.65
I-90 Closure Amount spent for: Overtime hours and other truck drivers' expenses
2284.18 250.00 4984.05
I-90 Closure Percentage of additional costs for: Overtime hours and other truck drivers' expenses
27.33 17.50 31.98
I-90 Closure Amount spent for: Additional fuel costs 1551.01 295.00 3918.47
I-90 Closure Percentage of additional costs for: Additional fuel costs
26.98 20.00 28.85
I-90 Closure Amount spent for: Acquiring additional equipment
.00 .00 .00
I-90 Closure Percentage of additional costs for: Acquiring additional equipment
.00 .00 .00
I-90 Closure Amount spent for: Paying a higher rate for expedited and/or guaranteed services
146.74 .00 523.28
I-90 Closure Percentage of additional costs for: Paying a higher rate for expedited and/or guaranteed services
3.72 .00 16.72
I-90 Closure Amount spent for: Additional inventory and/or storage costs 62.65 .00 278.48
I-90 Closure Percentage of additional costs for: dditional inventory and/or storage costs
.66 .00 2.65
3 2800000 to < 6600000
I-90 Closure Amount spent for: Damages including perishables or other goods 40.00 .00 282.84
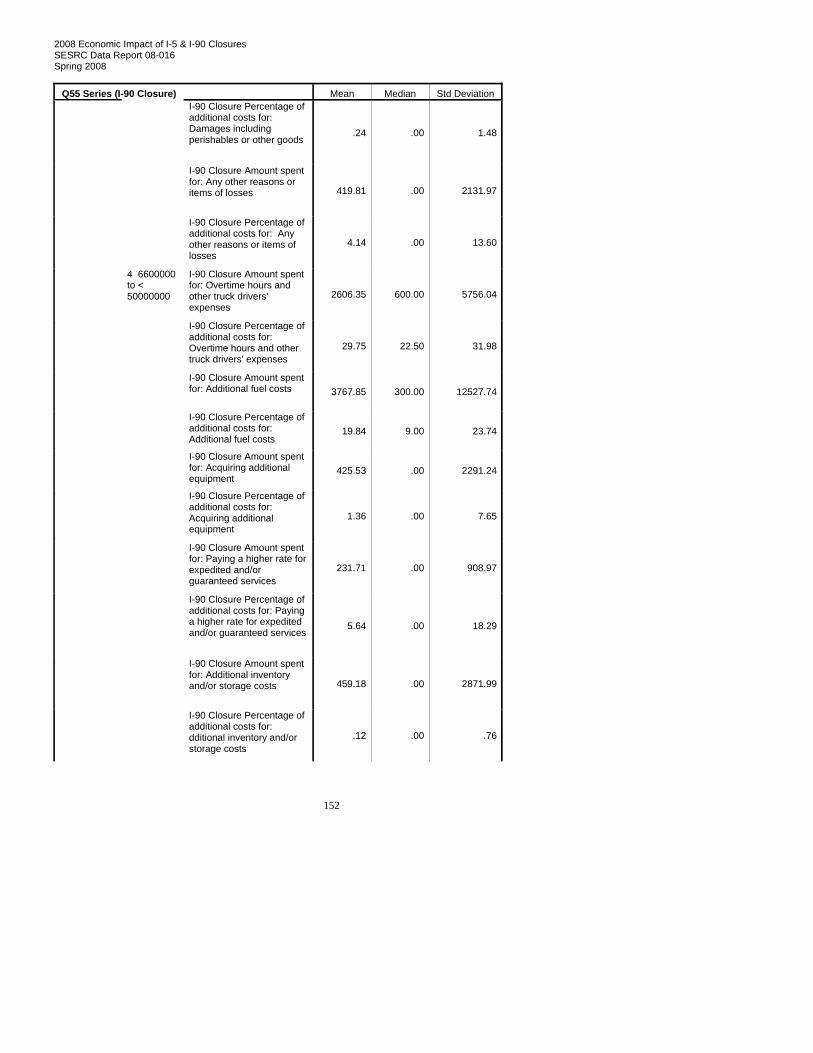
2008 Economic Impact of I-5 & I-90 Closures SESRC Data Report 08-016 Spring 2008
152
Q55 Series (I-90 Closure) Mean Median Std Deviation I-90 Closure Percentage of additional costs for: Damages including perishables or other goods
.24 .00 1.48
I-90 Closure Amount spent for: Any other reasons or items of losses 419.81 .00 2131.97
I-90 Closure Percentage of additional costs for: Any other reasons or items of losses
4.14 .00 13.60
I-90 Closure Amount spent for: Overtime hours and other truck drivers' expenses
2606.35 600.00 5756.04
I-90 Closure Percentage of additional costs for: Overtime hours and other truck drivers' expenses
29.75 22.50 31.98
I-90 Closure Amount spent for: Additional fuel costs 3767.85 300.00 12527.74
I-90 Closure Percentage of additional costs for: Additional fuel costs
19.84 9.00 23.74
I-90 Closure Amount spent for: Acquiring additional equipment
425.53 .00 2291.24
I-90 Closure Percentage of additional costs for: Acquiring additional equipment
1.36 .00 7.65
I-90 Closure Amount spent for: Paying a higher rate for expedited and/or guaranteed services
231.71 .00 908.97
I-90 Closure Percentage of additional costs for: Paying a higher rate for expedited and/or guaranteed services
5.64 .00 18.29
I-90 Closure Amount spent for: Additional inventory and/or storage costs 459.18 .00 2871.99
4 6600000 to < 50000000
I-90 Closure Percentage of additional costs for: dditional inventory and/or storage costs
.12 .00 .76
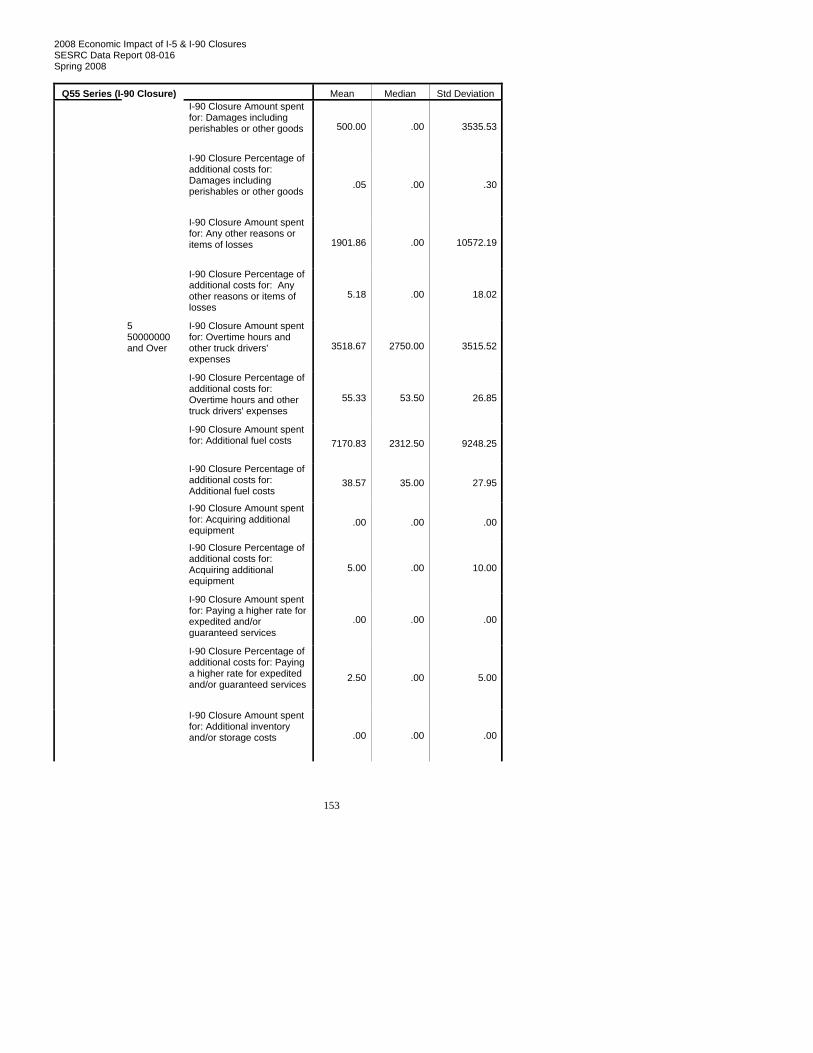
2008 Economic Impact of I-5 & I-90 Closures SESRC Data Report 08-016 Spring 2008
153
Q55 Series (I-90 Closure) Mean Median Std Deviation I-90 Closure Amount spent for: Damages including perishables or other goods 500.00 .00 3535.53
I-90 Closure Percentage of additional costs for: Damages including perishables or other goods
.05 .00 .30
I-90 Closure Amount spent for: Any other reasons or items of losses 1901.86 .00 10572.19
I-90 Closure Percentage of additional costs for: Any other reasons or items of losses
5.18 .00 18.02
I-90 Closure Amount spent for: Overtime hours and other truck drivers' expenses
3518.67 2750.00 3515.52
I-90 Closure Percentage of additional costs for: Overtime hours and other truck drivers' expenses
55.33 53.50 26.85
I-90 Closure Amount spent for: Additional fuel costs 7170.83 2312.50 9248.25
I-90 Closure Percentage of additional costs for: Additional fuel costs
38.57 35.00 27.95
I-90 Closure Amount spent for: Acquiring additional equipment
.00 .00 .00
I-90 Closure Percentage of additional costs for: Acquiring additional equipment
5.00 .00 10.00
I-90 Closure Amount spent for: Paying a higher rate for expedited and/or guaranteed services
.00 .00 .00
I-90 Closure Percentage of additional costs for: Paying a higher rate for expedited and/or guaranteed services
2.50 .00 5.00
5 50000000 and Over
I-90 Closure Amount spent for: Additional inventory and/or storage costs .00 .00 .00

2008 Economic Impact of I-5 & I-90 Closures SESRC Data Report 08-016 Spring 2008
154
Q55 Series (I-90 Closure) Mean Median Std Deviation I-90 Closure Percentage of additional costs for: dditional inventory and/or storage costs
5.00 .00 10.00
I-90 Closure Amount spent for: Damages including perishables or other goods .00 .00 .00
I-90 Closure Percentage of additional costs for: Damages including perishables or other goods
.00 .00 .00
I-90 Closure Amount spent for: Any other reasons or items of losses 1066.00 .00 1478.78
I-90 Closure Percentage of additional costs for: Any other reasons or items of losses
7.17 5.00 8.26

2008 Economic Impact of I-5 & I-90 Closures SESRC Data Report 08-016 Spring 2008
VI. WEB SURVEY SCREENSHOT
155

2008 Economic Impact of I-5 & I-90 Closures SESRC Data Report 08-016 Spring 2008
156
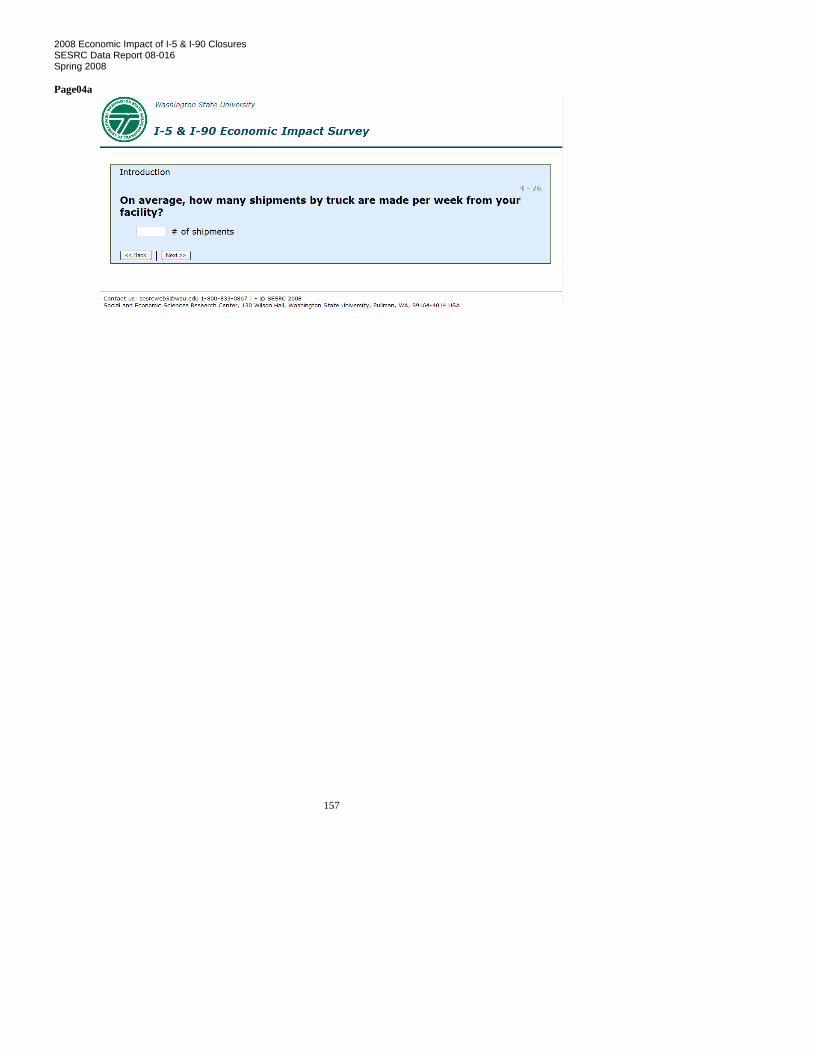
2008 Economic Impact of I-5 & I-90 Closures SESRC Data Report 08-016 Spring 2008 Page04a
157

2008 Economic Impact of I-5 & I-90 Closures SESRC Data Report 08-016 Spring 2008 Page04b
Page04c
158

2008 Economic Impact of I-5 & I-90 Closures SESRC Data Report 08-016 Spring 2008
159
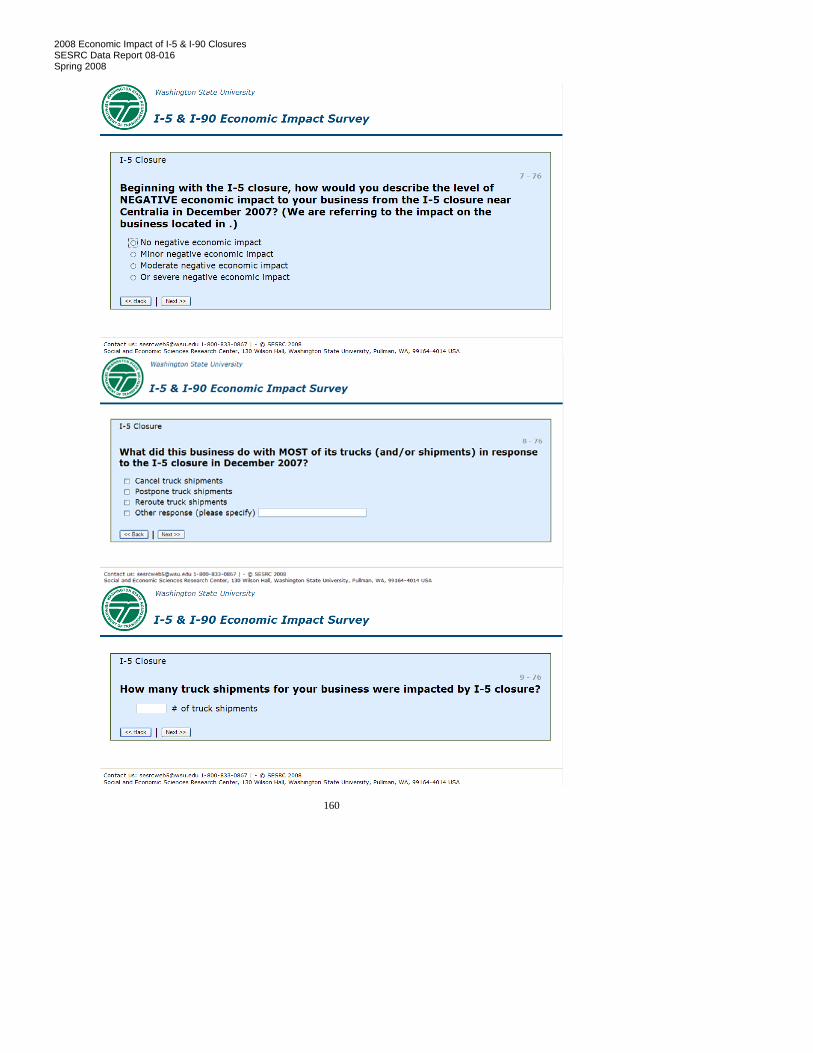
2008 Economic Impact of I-5 & I-90 Closures SESRC Data Report 08-016 Spring 2008
160
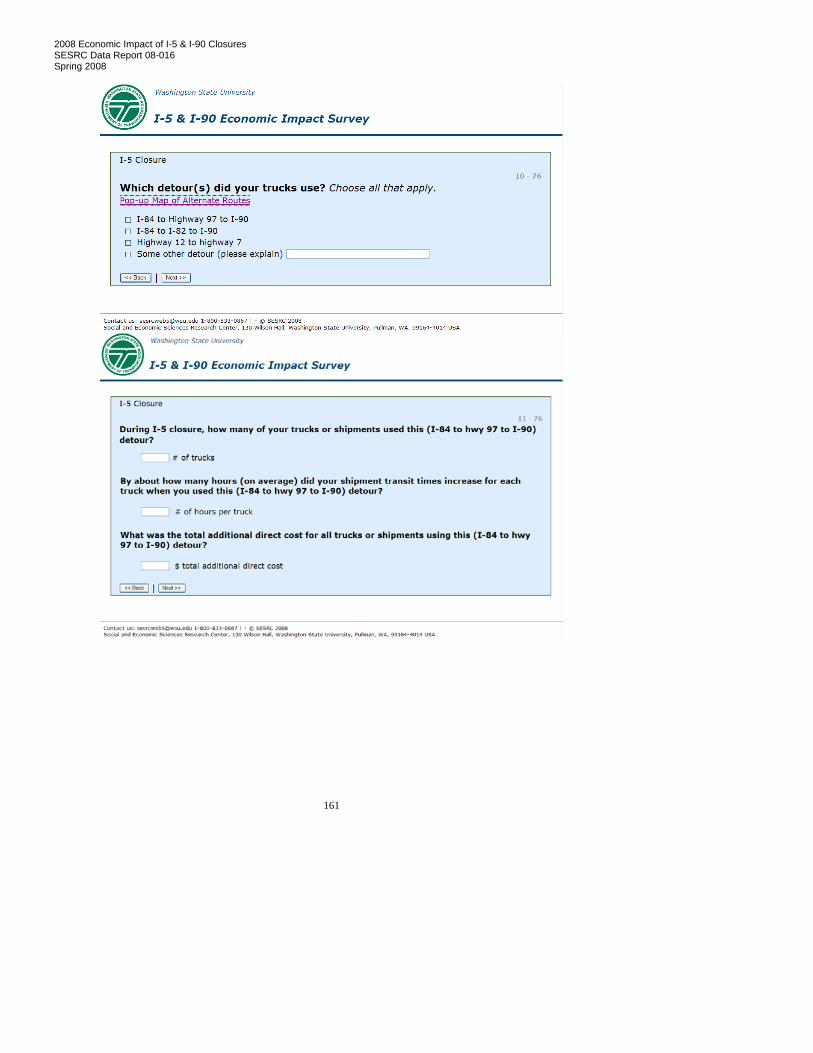
2008 Economic Impact of I-5 & I-90 Closures SESRC Data Report 08-016 Spring 2008
161
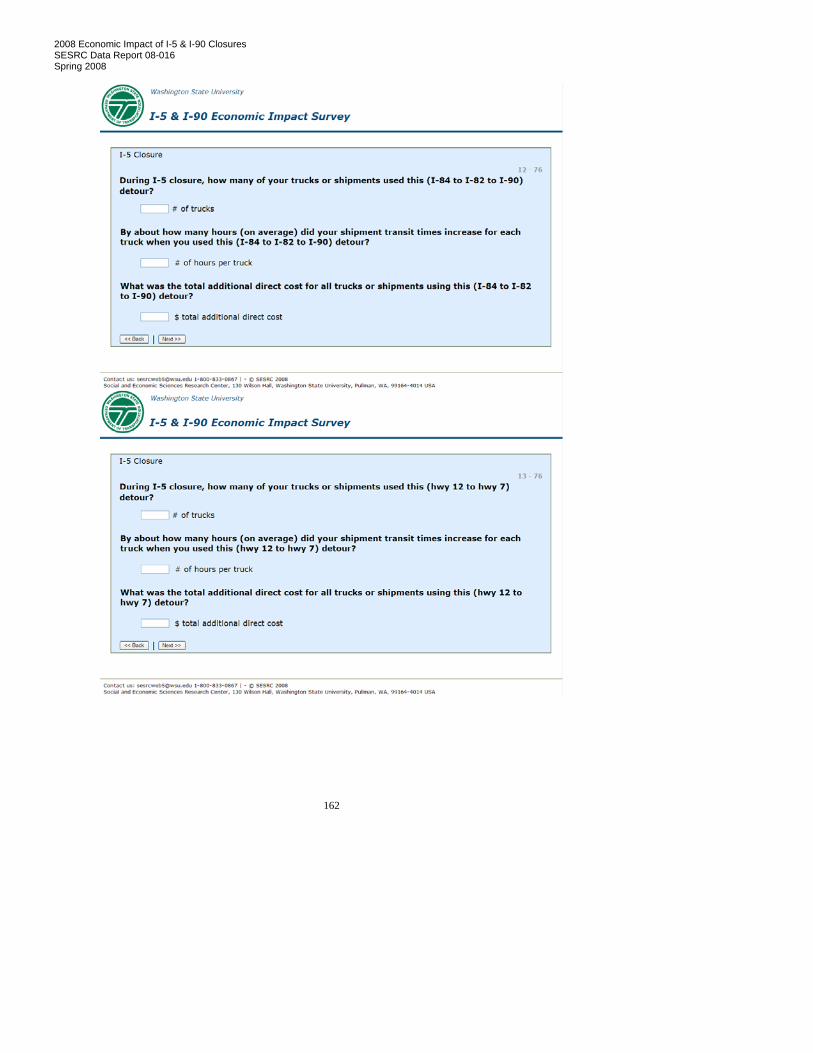
2008 Economic Impact of I-5 & I-90 Closures SESRC Data Report 08-016 Spring 2008
162
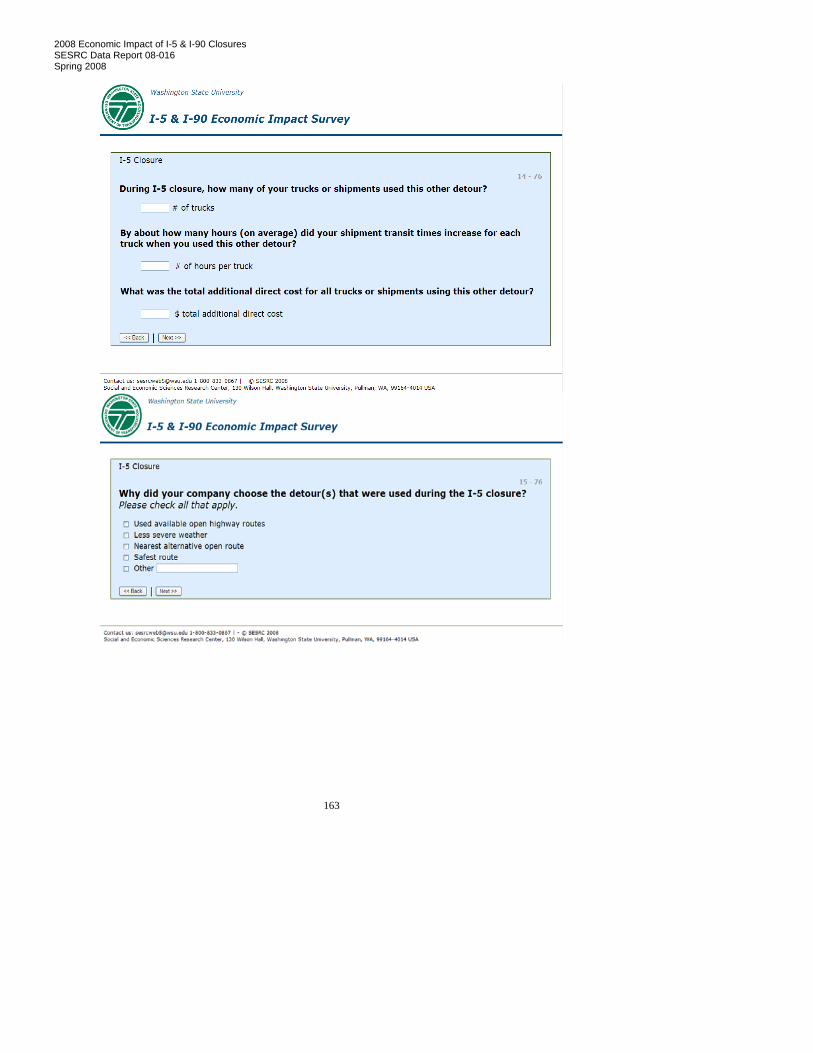
2008 Economic Impact of I-5 & I-90 Closures SESRC Data Report 08-016 Spring 2008
163

2008 Economic Impact of I-5 & I-90 Closures SESRC Data Report 08-016 Spring 2008
164

2008 Economic Impact of I-5 & I-90 Closures SESRC Data Report 08-016 Spring 2008
165

2008 Economic Impact of I-5 & I-90 Closures SESRC Data Report 08-016 Spring 2008
166

2008 Economic Impact of I-5 & I-90 Closures SESRC Data Report 08-016 Spring 2008
167

2008 Economic Impact of I-5 & I-90 Closures SESRC Data Report 08-016 Spring 2008
168

2008 Economic Impact of I-5 & I-90 Closures SESRC Data Report 08-016 Spring 2008
169

2008 Economic Impact of I-5 & I-90 Closures SESRC Data Report 08-016 Spring 2008
170

2008 Economic Impact of I-5 & I-90 Closures SESRC Data Report 08-016 Spring 2008
171

2008 Economic Impact of I-5 & I-90 Closures SESRC Data Report 08-016 Spring 2008
172

2008 Economic Impact of I-5 & I-90 Closures SESRC Data Report 08-016 Spring 2008
173

2008 Economic Impact of I-5 & I-90 Closures SESRC Data Report 08-016 Spring 2008
174

2008 Economic Impact of I-5 & I-90 Closures SESRC Data Report 08-016 Spring 2008
175

2008 Economic Impact of I-5 & I-90 Closures SESRC Data Report 08-016 Spring 2008
176

2008 Economic Impact of I-5 & I-90 Closures SESRC Data Report 08-016 Spring 2008
177

2008 Economic Impact of I-5 & I-90 Closures SESRC Data Report 08-016 Spring 2008
178
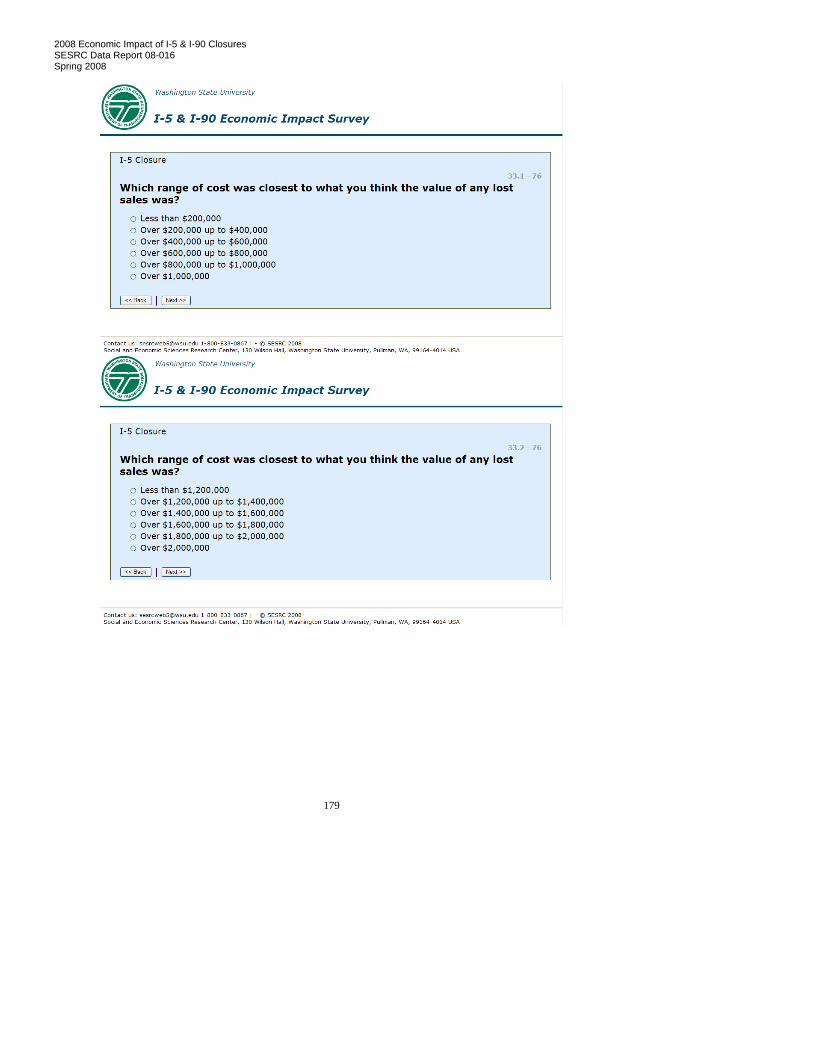
2008 Economic Impact of I-5 & I-90 Closures SESRC Data Report 08-016 Spring 2008
179
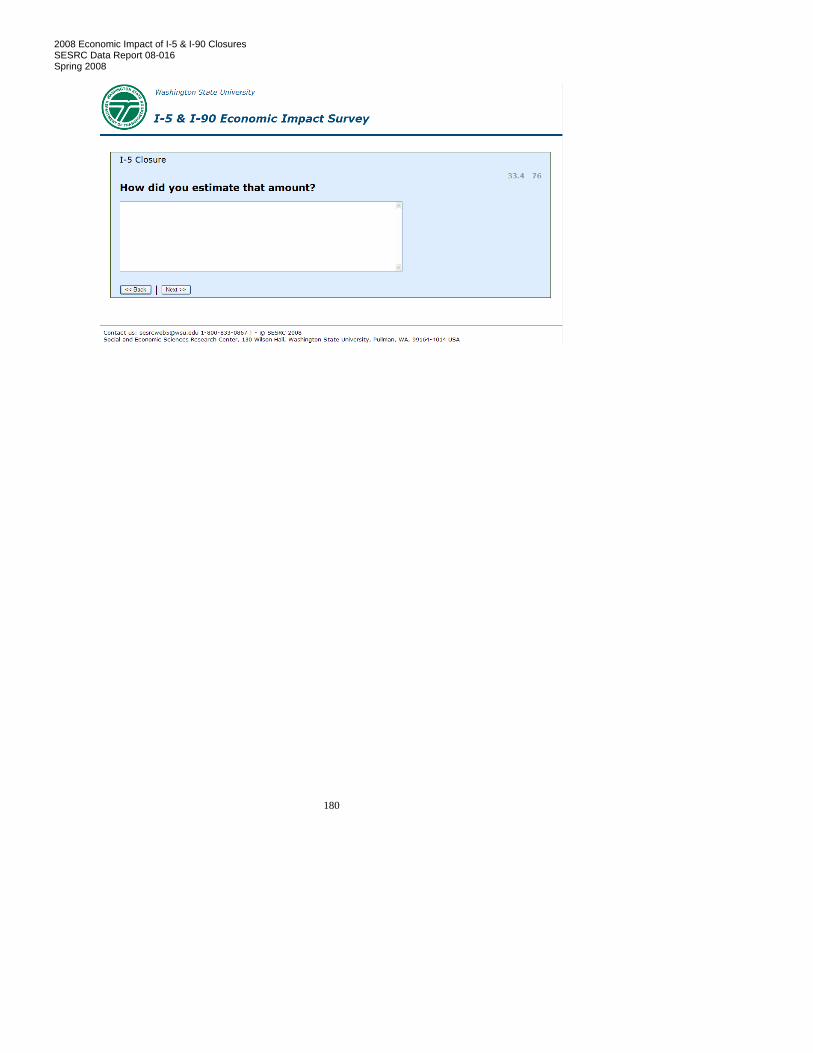
2008 Economic Impact of I-5 & I-90 Closures SESRC Data Report 08-016 Spring 2008
180

2008 Economic Impact of I-5 & I-90 Closures SESRC Data Report 08-016 Spring 2008
181

2008 Economic Impact of I-5 & I-90 Closures SESRC Data Report 08-016 Spring 2008
182

2008 Economic Impact of I-5 & I-90 Closures SESRC Data Report 08-016 Spring 2008
183
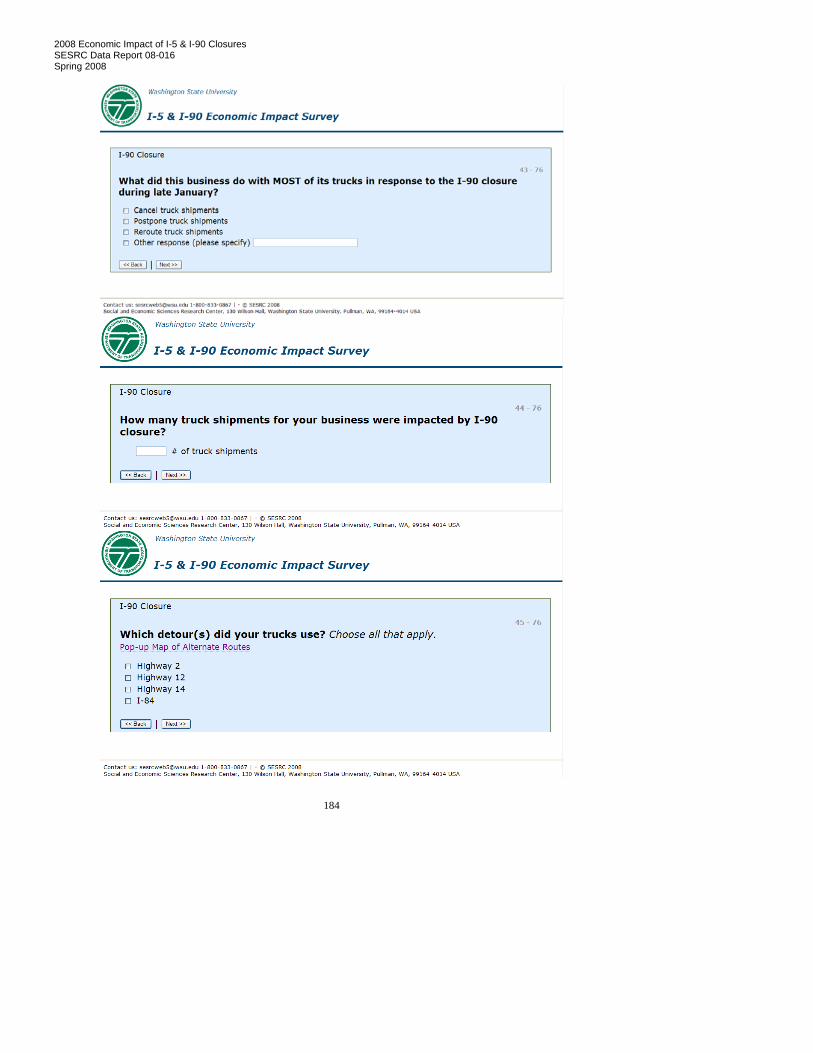
2008 Economic Impact of I-5 & I-90 Closures SESRC Data Report 08-016 Spring 2008
184

2008 Economic Impact of I-5 & I-90 Closures SESRC Data Report 08-016 Spring 2008
185

2008 Economic Impact of I-5 & I-90 Closures SESRC Data Report 08-016 Spring 2008
186

2008 Economic Impact of I-5 & I-90 Closures SESRC Data Report 08-016 Spring 2008
187

2008 Economic Impact of I-5 & I-90 Closures SESRC Data Report 08-016 Spring 2008
188

2008 Economic Impact of I-5 & I-90 Closures SESRC Data Report 08-016 Spring 2008
189
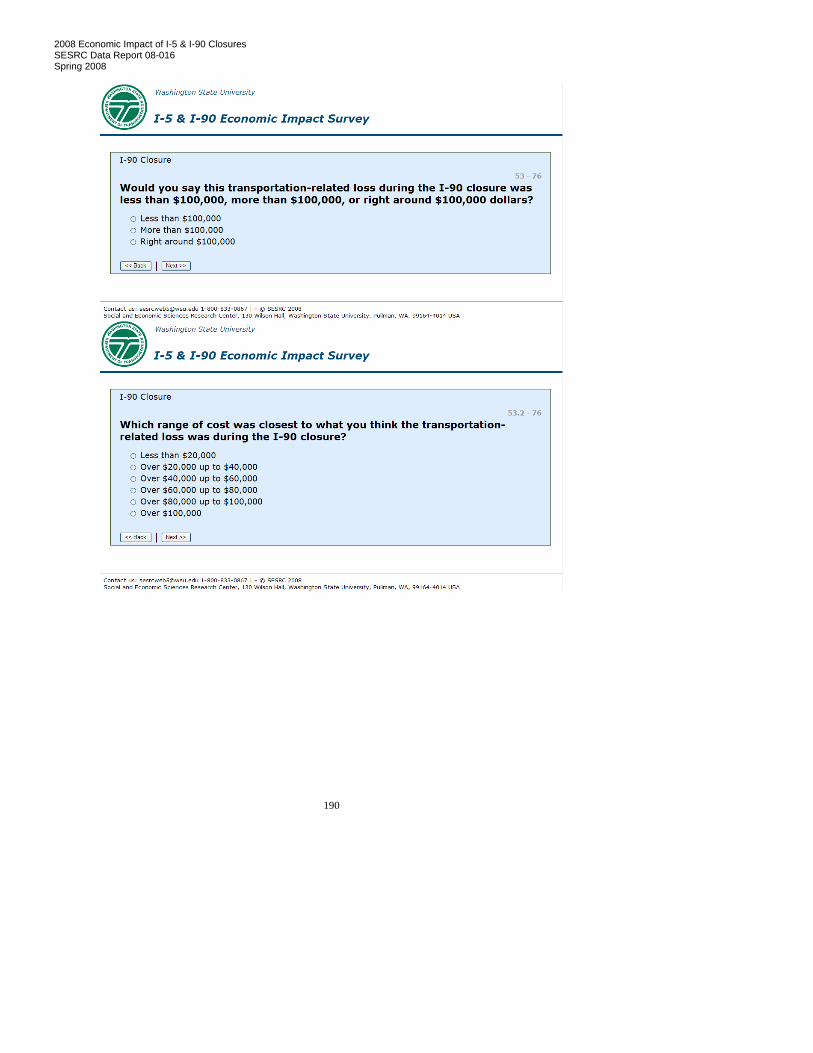
2008 Economic Impact of I-5 & I-90 Closures SESRC Data Report 08-016 Spring 2008
190

2008 Economic Impact of I-5 & I-90 Closures SESRC Data Report 08-016 Spring 2008
191

2008 Economic Impact of I-5 & I-90 Closures SESRC Data Report 08-016 Spring 2008
192

2008 Economic Impact of I-5 & I-90 Closures SESRC Data Report 08-016 Spring 2008
193

2008 Economic Impact of I-5 & I-90 Closures SESRC Data Report 08-016 Spring 2008
194

2008 Economic Impact of I-5 & I-90 Closures SESRC Data Report 08-016 Spring 2008
195

2008 Economic Impact of I-5 & I-90 Closures SESRC Data Report 08-016 Spring 2008
196

2008 Economic Impact of I-5 & I-90 Closures SESRC Data Report 08-016 Spring 2008
197

2008 Economic Impact of I-5 & I-90 Closures SESRC Data Report 08-016 Spring 2008
198

2008 Economic Impact of I-5 & I-90 Closures SESRC Data Report 08-016 Spring 2008
199
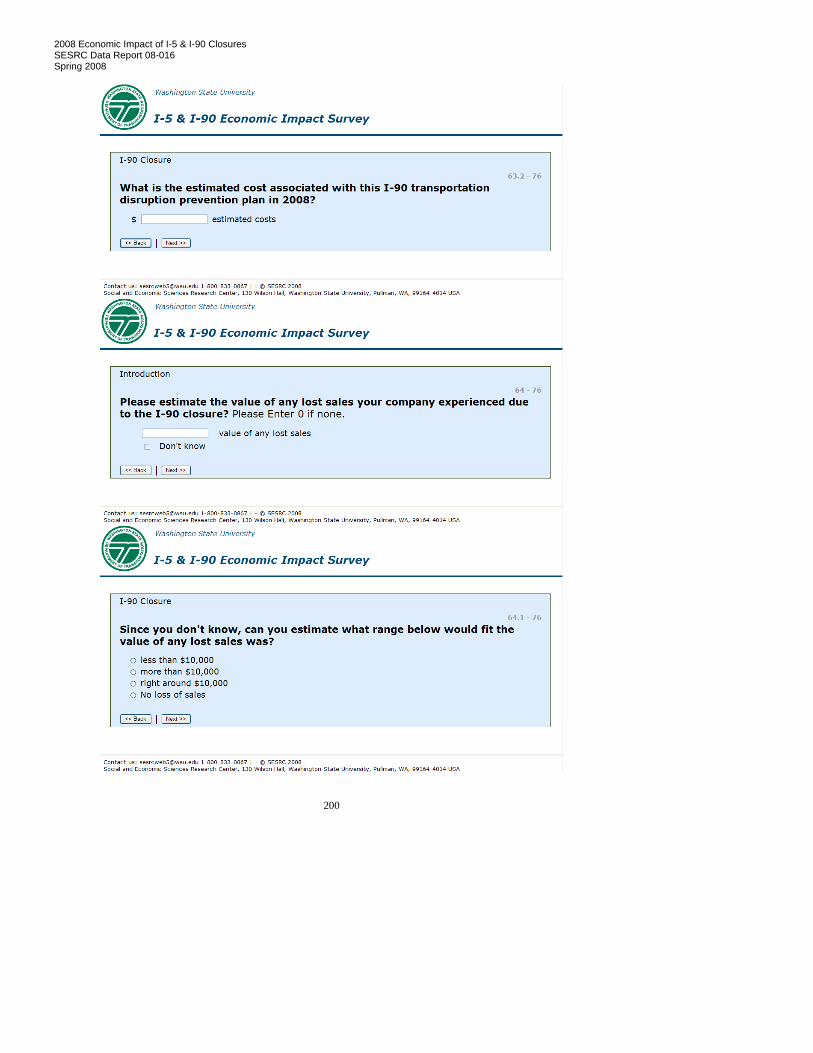
2008 Economic Impact of I-5 & I-90 Closures SESRC Data Report 08-016 Spring 2008
200

2008 Economic Impact of I-5 & I-90 Closures SESRC Data Report 08-016 Spring 2008
201

2008 Economic Impact of I-5 & I-90 Closures SESRC Data Report 08-016 Spring 2008
202

2008 Economic Impact of I-5 & I-90 Closures SESRC Data Report 08-016 Spring 2008
203
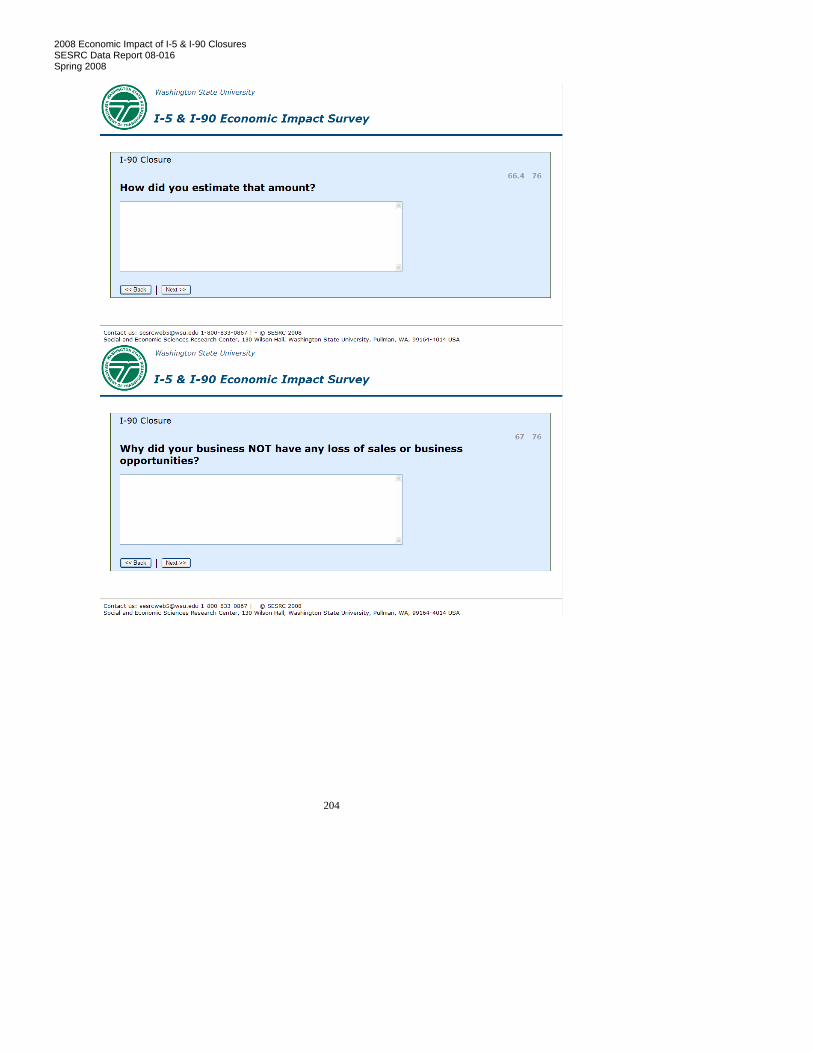
2008 Economic Impact of I-5 & I-90 Closures SESRC Data Report 08-016 Spring 2008
204
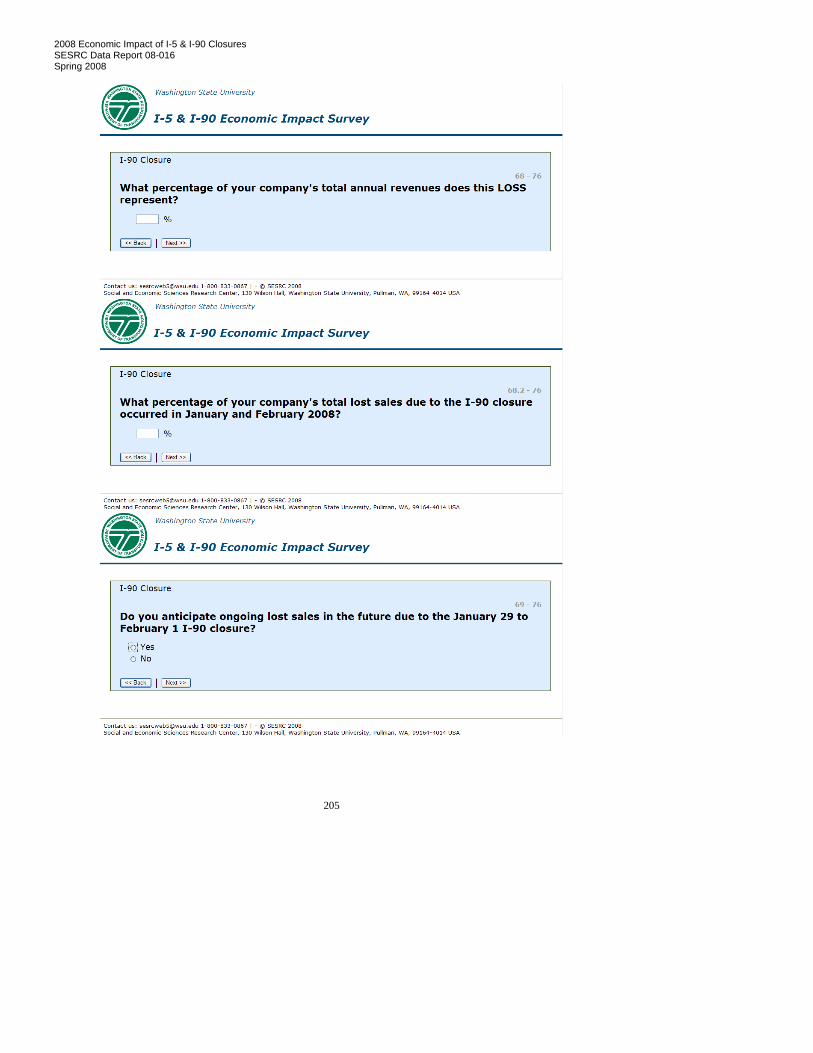
2008 Economic Impact of I-5 & I-90 Closures SESRC Data Report 08-016 Spring 2008
205

2008 Economic Impact of I-5 & I-90 Closures SESRC Data Report 08-016 Spring 2008
206

2008 Economic Impact of I-5 & I-90 Closures SESRC Data Report 08-016 Spring 2008
207
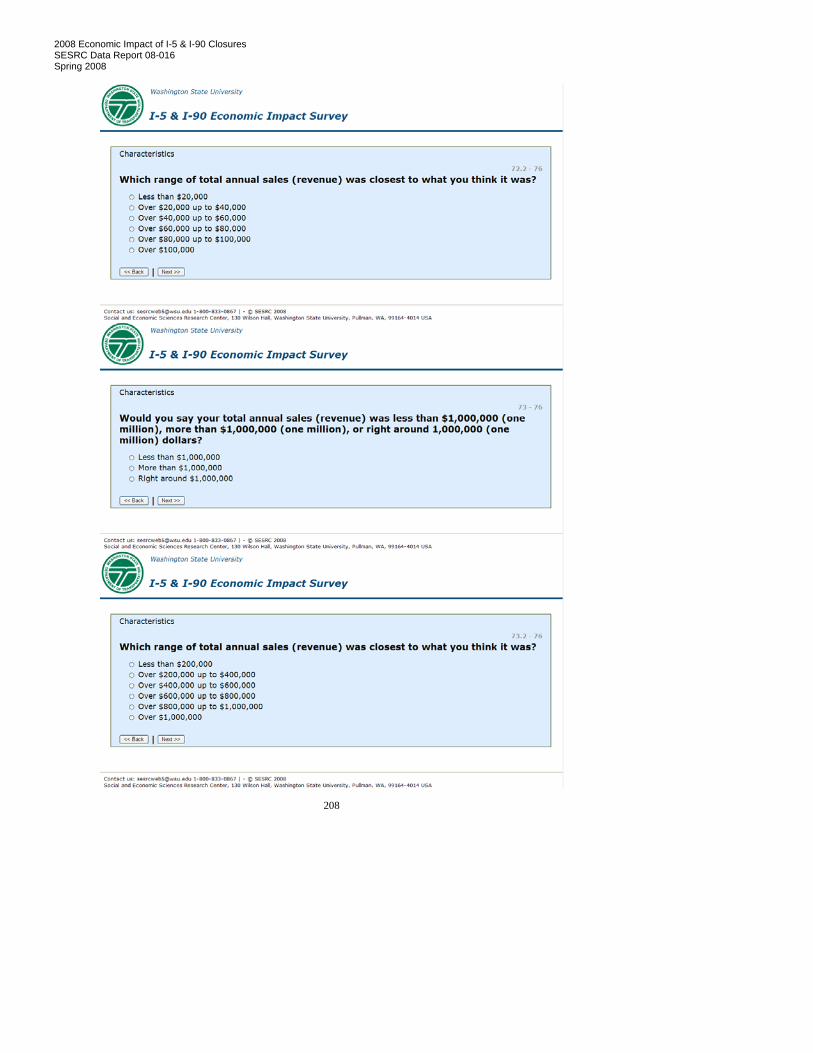
2008 Economic Impact of I-5 & I-90 Closures SESRC Data Report 08-016 Spring 2008
208

2008 Economic Impact of I-5 & I-90 Closures SESRC Data Report 08-016 Spring 2008
209
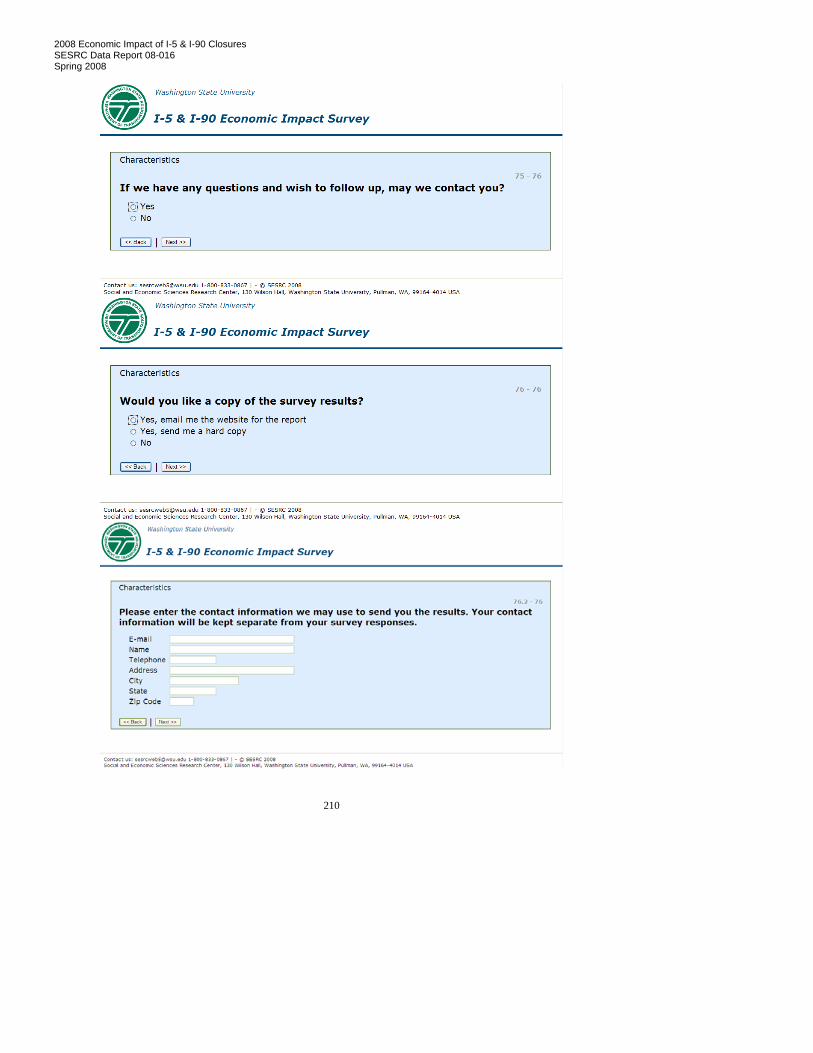
2008 Economic Impact of I-5 & I-90 Closures SESRC Data Report 08-016 Spring 2008
210

2008 Economic Impact of I-5 & I-90 Closures SESRC Data Report 08-016 Spring 2008
211

2008 Economic Impact of I-5 & I-90 Closures SESRC Data Report 08-016 Spring 2008
212
Telephone CATI Script
BEGIN: Hello, my name is (name) I'm calling for the Washington State Department of Transportation. We are calling today to see if your company was impacted by the recent closures on Interstate 5 and Interstate 90. May I speak to the person in your company who would know the most about the impact and costs of the I5 and I90 closures for your business? (Would that be you or someone else?) (The person we need to speak with may be an owner or upper level executive (CEO, Vice President, Transportation Manager or CFO) for this business who is knowledgeable about your costs of doing business and sales revenue in Washington State. We specifically need to talk about the aspects of freight handling on Washington highways.) If you prefer you can complete the survey at www.opinion.wsu.edu/interstate ; your access code is <webID> (IWR: The I-5 closure was from December 3 to December 6, 2007. The I-90 closure was from January 29 to February 1, 2008.) (IWR: If this is a national office or a company with multiple sites then state: "We are referring to <COMPY> located at <CITY>, <STATE>.") Speaking to R ..........................................................................................1 => /Q01 R not available / Set callback (GB, CB, HB) ..........................................2 => /INT01 Non contacts (AM, BC, BZ, ED, NA) ....................................................3 => /INT02 Refusals (R1, R2, R3, RP).......................................................................4 => /F10 Non-working numbers (CC, DS, MP, WN) ............................................5 => /VERFY Communication barrier (DF, HC, LG)....................................................6 => /INT03 Other codes (DD, DP, OT, RN) ..............................................................7 => /INT04 Ineligibles (IE) ........................................................................................8 => /INT05 Special project codes () ...........................................................................9 I => /INT99 Web/Mail codes ....................................................................................10 => /INT98 Company does not do surveys...............................................................11 => /INT06
RBGIN: We anticipate this person may be an owner or upper level executive (CEO, Vice President, Transportation Manager or CFO) for this business and is someone who will be very knowledgeable about your costs of doing business and sales revenue in Washington state. We specifically need to talk about aspects of freight handling on Washington highways. (IWR: Ask to be transferred to this person) Hello, this is (interviewer) and I'm calling from Washington State University. May I speak to the business or transportation manager who is responsible for managing freight shipment decisions at your business? Would that be you or someone else? We are conducting a study for the Washington State Department of Transportation to help state officials understand the economic impacts of the recent I-5 and I-90 closure. Press ENTER to Continue.......................................................................1 D
Q01: This business has been identified by Washington State Department of Transportation as a freight dependent business. Is this information correct? (DEF: Freight dependent business refers to the business relies on freight movement on Washington highways for its business activities.) Yes ..........................................................................................................1 No............................................................................................................2 => /INT05 Don't know .............................................................................................D Refused................................................................................................... R
Q01A: Was your business impacted by the I-5 or I-90 closures this winter? Yes ..........................................................................................................1 No............................................................................................................2 => /INT05 Refused................................................................................................... R => /F10

2008 Economic Impact of I-5 & I-90 Closures SESRC Data Report 08-016 Spring 2008
213
CONFD: While portions of this interview may be monitored by my supervisors, all company-specific information you provide will remain confidential. If I come to any question that you prefer not to answer, just let me know and I will skip over it. This call is for research purposes only, and does not involve sales of any kind, either now or in the future. This interview will take about 15 to 20 minutes to complete. Continue with survey ..............................................................................1 => /Q02 No - Try refusal prevention.....................................................................2 => /F10 Not a good time - Call back later ............................................................3 => /INT01
Q02: Which ONE activity best describes this business in terms of freight? Is it a shipper, a receiver, or a freight carrier? Shipper ....................................................................................................1 Receiver ..................................................................................................2 Freight carrier..........................................................................................3 Business does more than one of these activities......................................4 Don't know .............................................................................................D Refused................................................................................................... R
Q03: What is the PRIMARY commodity or products shipped or received by this business?
FQ041: Fill Q04 => * si PRJ(Q02, 1, 2, 3, 4) from.........................................................................................................1 to .............................................................................................................2 to and from..............................................................................................3 to and from..............................................................................................4
FQ042: Fill Q04 for Q02 = D R => * si IF ((Q02= D R), 1, 0) to and from..............................................................................................1 .................................................................................................................0
Q04: On average, how many shipments by truck are made per week <FQ041> your facility? $E 0 9999 => Q04A si Q02= D R Don't know .............................................................................................D Refused................................................................................................... R
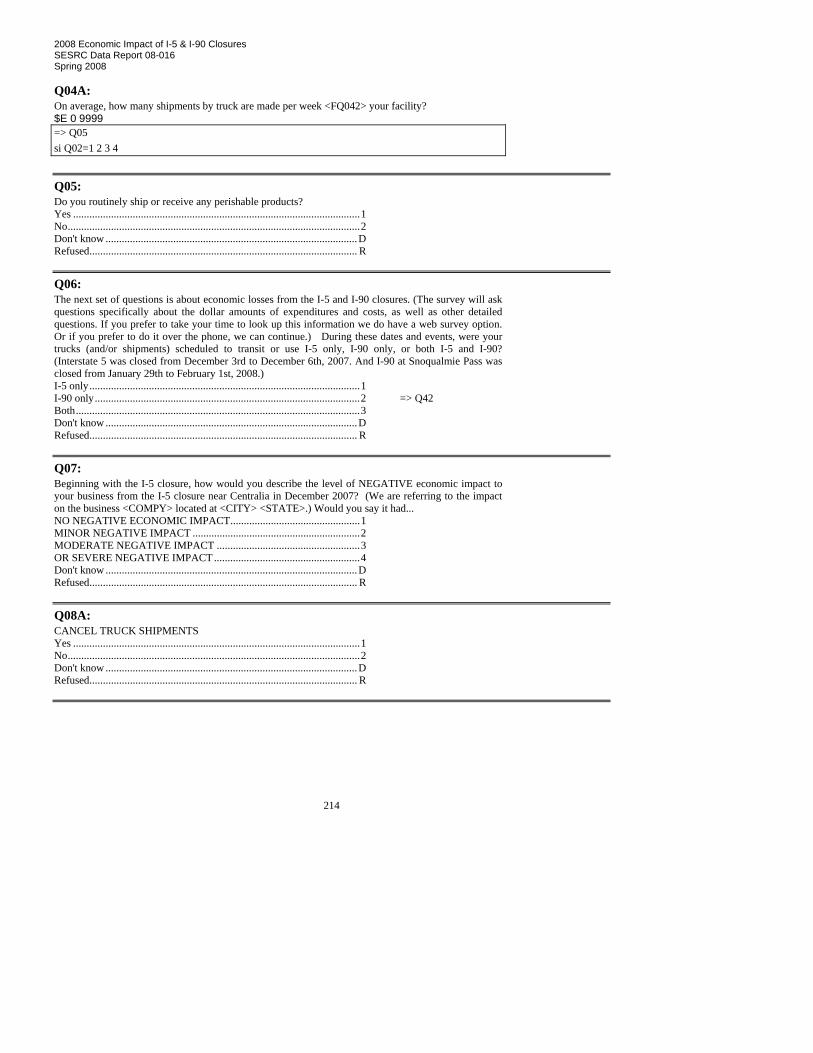
2008 Economic Impact of I-5 & I-90 Closures SESRC Data Report 08-016 Spring 2008
214
Q04A: On average, how many shipments by truck are made per week <FQ042> your facility? $E 0 9999 => Q05 si Q02=1 2 3 4
Q05: Do you routinely ship or receive any perishable products? Yes ..........................................................................................................1 No............................................................................................................2 Don't know .............................................................................................D Refused................................................................................................... R
Q06: The next set of questions is about economic losses from the I-5 and I-90 closures. (The survey will ask questions specifically about the dollar amounts of expenditures and costs, as well as other detailed questions. If you prefer to take your time to look up this information we do have a web survey option. Or if you prefer to do it over the phone, we can continue.) During these dates and events, were your trucks (and/or shipments) scheduled to transit or use I-5 only, I-90 only, or both I-5 and I-90? (Interstate 5 was closed from December 3rd to December 6th, 2007. And I-90 at Snoqualmie Pass was closed from January 29th to February 1st, 2008.) I-5 only....................................................................................................1 I-90 only..................................................................................................2 => Q42 Both.........................................................................................................3 Don't know .............................................................................................D Refused................................................................................................... R
Q07: Beginning with the I-5 closure, how would you describe the level of NEGATIVE economic impact to your business from the I-5 closure near Centralia in December 2007? (We are referring to the impact on the business <COMPY> located at <CITY> <STATE>.) Would you say it had... NO NEGATIVE ECONOMIC IMPACT................................................1 MINOR NEGATIVE IMPACT ..............................................................2 MODERATE NEGATIVE IMPACT .....................................................3 OR SEVERE NEGATIVE IMPACT......................................................4 Don't know .............................................................................................D Refused................................................................................................... R
Q08A: CANCEL TRUCK SHIPMENTS Yes ..........................................................................................................1 No............................................................................................................2 Don't know .............................................................................................D Refused................................................................................................... R

2008 Economic Impact of I-5 & I-90 Closures SESRC Data Report 08-016 Spring 2008
215
Q08B: POSTPONE TRUCK SHIPMENTS Yes ..........................................................................................................1 No............................................................................................................2 Don't know .............................................................................................D Refused................................................................................................... R
Q08C: OR REROUTE TRUCK SHIPMENTS Yes ..........................................................................................................1 No............................................................................................................2 Don't know .............................................................................................D Refused................................................................................................... R
Q08D: Other response (please specify) Yes ..........................................................................................................1 O No............................................................................................................2 Don't know .............................................................................................D Refused................................................................................................... R
Q09: How many truck shipments for your business were impacted by I-5 closure? $E 0 9999 Don't know .............................................................................................D Refused................................................................................................... R
CK10: Check Q10 => Q10A sinon => Q17 si Q08C=1
Q10A: I-84 to Highway 97 to I-901 Yes ..........................................................................................................1 No............................................................................................................2 Don't know .............................................................................................D Refused................................................................................................... R
Q10B: I-84 to I-82 to I-902 Yes ..........................................................................................................1 No............................................................................................................2 Don't know .............................................................................................D Refused................................................................................................... R

2008 Economic Impact of I-5 & I-90 Closures SESRC Data Report 08-016 Spring 2008
216
Q10C: Highway 12 to highway 7 Yes ..........................................................................................................1 No............................................................................................................2 Don't know .............................................................................................D Refused................................................................................................... R
Q10D: Other detour (PLEASE SPECIFY) Yes ..........................................................................................................1 O No............................................................................................................2 Don't know .............................................................................................D Refused................................................................................................... R
CK11: Check Q10 for branching => Q11A sinon => CK12 si Q10A=1
Q11A: During the I-5 closure, how many of your trucks or shipments used this (I-84 to hwy 97 to I-90) detour? $E 0 9999 Don't know .............................................................................................D Refused................................................................................................... R
Q11B: By about how many hours (on average) did your shipment transit times increase for each truck when you used this (I-84 to hwy 97 to I-90) detour? $E 0 99 Don't know .............................................................................................D Refused................................................................................................... R
Q11C: What was the total additional direct cost for all trucks or shipments using this (I-84 to hwy 97 to I-90) detour? $E 0 99999 Don't know .............................................................................................D Refused................................................................................................... R
CK12: Check for Q10 if Q10 = 2 go to Q12A => Q12A sinon => CK13 si Q10B=1
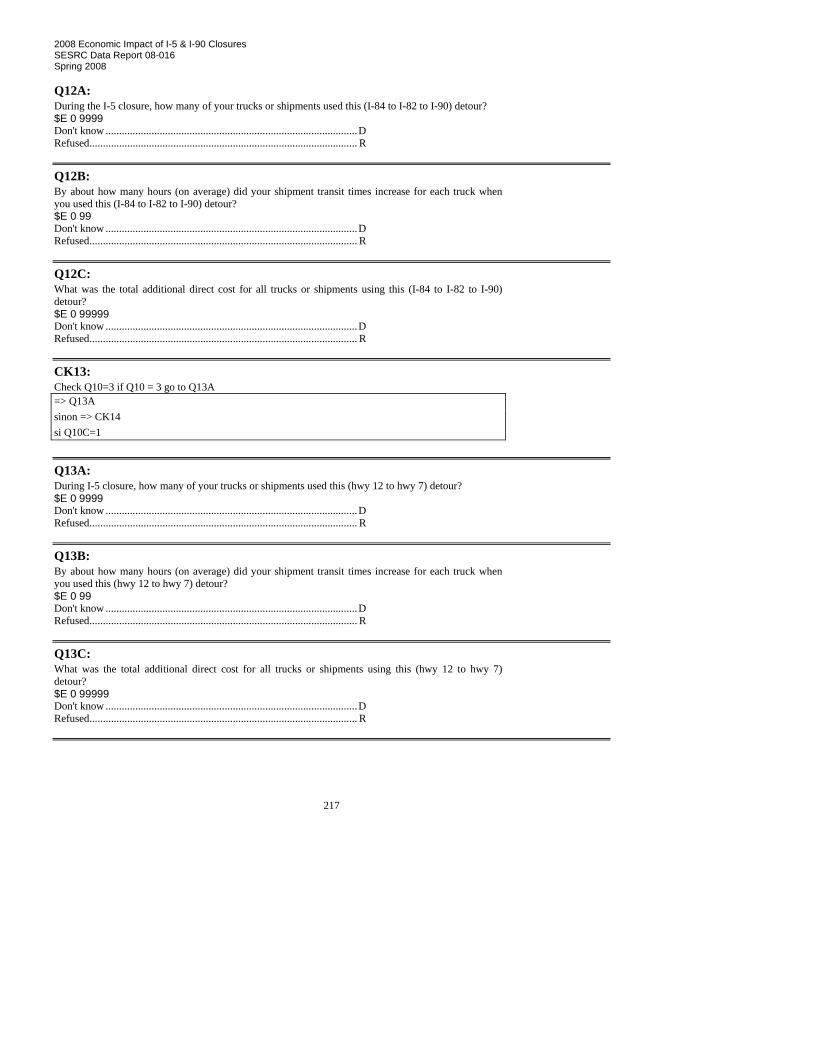
2008 Economic Impact of I-5 & I-90 Closures SESRC Data Report 08-016 Spring 2008
217
Q12A: During the I-5 closure, how many of your trucks or shipments used this (I-84 to I-82 to I-90) detour? $E 0 9999 Don't know .............................................................................................D Refused................................................................................................... R
Q12B: By about how many hours (on average) did your shipment transit times increase for each truck when you used this (I-84 to I-82 to I-90) detour? $E 0 99 Don't know .............................................................................................D Refused................................................................................................... R
Q12C: What was the total additional direct cost for all trucks or shipments using this (I-84 to I-82 to I-90) detour? $E 0 99999 Don't know .............................................................................................D Refused................................................................................................... R
CK13: Check Q10=3 if Q10 = 3 go to Q13A => Q13A sinon => CK14 si Q10C=1
Q13A: During I-5 closure, how many of your trucks or shipments used this (hwy 12 to hwy 7) detour? $E 0 9999 Don't know .............................................................................................D Refused................................................................................................... R
Q13B: By about how many hours (on average) did your shipment transit times increase for each truck when you used this (hwy 12 to hwy 7) detour? $E 0 99 Don't know .............................................................................................D Refused................................................................................................... R
Q13C: What was the total additional direct cost for all trucks or shipments using this (hwy 12 to hwy 7) detour? $E 0 99999 Don't know .............................................................................................D Refused................................................................................................... R

2008 Economic Impact of I-5 & I-90 Closures SESRC Data Report 08-016 Spring 2008
218
CK14: Check Q10 if Q10 = 4 go to Q14A => Q14A sinon => CQ11C si Q10D=1
Q14A: During I-5 closure, how many of your trucks or shipments used this other detour? $E 0 9999 Don't know .............................................................................................D Refused................................................................................................... R
Q14B: By about how many hours (on average) did your shipment transit times increase for each truck when you used this other detour? $E 0 99 Don't know .............................................................................................D Refused................................................................................................... R
Q14C: What was the additional direct cost for all trucks or shipments using this detour? $E 0 99999 Don't know .............................................................................................D Refused................................................................................................... R
CQ11C: Computate of Q11C (Note if Q11C eq D R) $E 0 9999999 => * si IF ((Q11C= D R ), 0, Q11C)
CQ12C: Compute Q12C (Note if Q12C=D or R) $E 0 9999999 => * si IF ((Q12C= D R), 0, Q12C)
CQ13C: Compute Q13C (Note if Q13C=D or R) $E 0 9999999 => * si IF ((Q13C = D R), 0, Q13C)
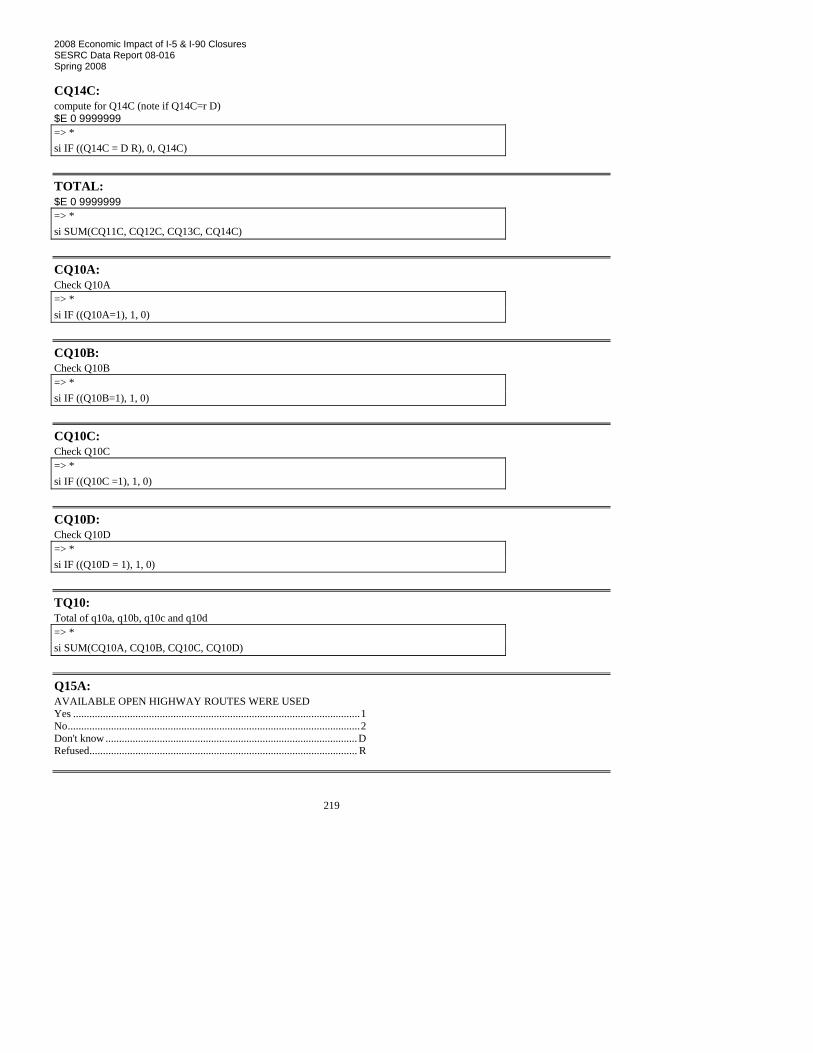
2008 Economic Impact of I-5 & I-90 Closures SESRC Data Report 08-016 Spring 2008
219
CQ14C: compute for Q14C (note if Q14C=r D) $E 0 9999999 => * si IF ((Q14C = D R), 0, Q14C)
TOTAL: $E 0 9999999 => * si SUM(CQ11C, CQ12C, CQ13C, CQ14C)
CQ10A: Check Q10A => * si IF ((Q10A=1), 1, 0)
CQ10B: Check Q10B => * si IF ((Q10B=1), 1, 0)
CQ10C: Check Q10C => * si IF ((Q10C =1), 1, 0)
CQ10D: Check Q10D => * si IF ((Q10D = 1), 1, 0)
TQ10: Total of q10a, q10b, q10c and q10d => * si SUM(CQ10A, CQ10B, CQ10C, CQ10D)
Q15A: AVAILABLE OPEN HIGHWAY ROUTES WERE USED Yes ..........................................................................................................1 No............................................................................................................2 Don't know .............................................................................................D Refused................................................................................................... R

2008 Economic Impact of I-5 & I-90 Closures SESRC Data Report 08-016 Spring 2008
220
Q15B: ROUTE WITH LESS SEVERE WEATHER WERE USED Yes ..........................................................................................................1 No............................................................................................................2 Don't know .............................................................................................D Refused................................................................................................... R
Q15C: NEAREST ALTERNATIVE OPEN ROUTE WERE USED Yes ..........................................................................................................1 No............................................................................................................2 Don't know .............................................................................................D Refused................................................................................................... R
Q15D: SAFEST ROUTE Yes ..........................................................................................................1 No............................................................................................................2 Don't know .............................................................................................D Refused................................................................................................... R
Q15E: OR SOME OTHER REASON (PLEASE SPECIFY) Yes ..........................................................................................................1 O No............................................................................................................2 Don't know .............................................................................................D Refused................................................................................................... R
Q16A: HIGHWAY POSTED RADIO CHANNEL Yes ..........................................................................................................1 No............................................................................................................2 Don't know .............................................................................................D Refused................................................................................................... R
Q16B: COMPANY DISPATCH OR CONTACT Yes ..........................................................................................................1 No............................................................................................................2 Don't know .............................................................................................D Refused................................................................................................... R
Q16C: TRUCK WEIGH STATION Yes ..........................................................................................................1 No............................................................................................................2 Don't know .............................................................................................D Refused................................................................................................... R
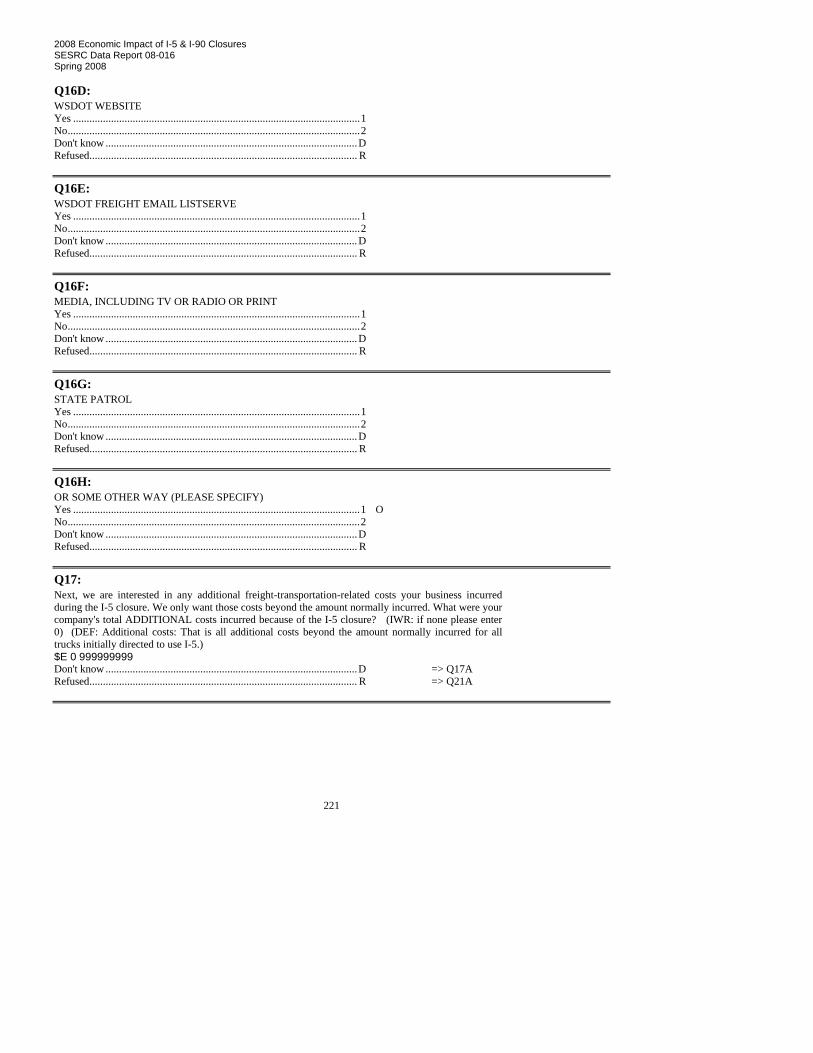
2008 Economic Impact of I-5 & I-90 Closures SESRC Data Report 08-016 Spring 2008
221
Q16D: WSDOT WEBSITE Yes ..........................................................................................................1 No............................................................................................................2 Don't know .............................................................................................D Refused................................................................................................... R
Q16E: WSDOT FREIGHT EMAIL LISTSERVE Yes ..........................................................................................................1 No............................................................................................................2 Don't know .............................................................................................D Refused................................................................................................... R
Q16F: MEDIA, INCLUDING TV OR RADIO OR PRINT Yes ..........................................................................................................1 No............................................................................................................2 Don't know .............................................................................................D Refused................................................................................................... R
Q16G: STATE PATROL Yes ..........................................................................................................1 No............................................................................................................2 Don't know .............................................................................................D Refused................................................................................................... R
Q16H: OR SOME OTHER WAY (PLEASE SPECIFY) Yes ..........................................................................................................1 O No............................................................................................................2 Don't know .............................................................................................D Refused................................................................................................... R
Q17: Next, we are interested in any additional freight-transportation-related costs your business incurred during the I-5 closure. We only want those costs beyond the amount normally incurred. What were your company's total ADDITIONAL costs incurred because of the I-5 closure? (IWR: if none please enter 0) (DEF: Additional costs: That is all additional costs beyond the amount normally incurred for all trucks initially directed to use I-5.) $E 0 999999999 Don't know .............................................................................................D => Q17A Refused................................................................................................... R => Q21A

2008 Economic Impact of I-5 & I-90 Closures SESRC Data Report 08-016 Spring 2008
222
Q17A: Since you don't know, can you estimate what range would fit the additional costs? Would you say this cost was less than $10,000, more than $10,000, or right around $10,000 dollars? => Q21A si Q17>0 OR Q17==0 Less than $10,000....................................................................................1 => Q18A More than $10,000 ..................................................................................2 => Q19 Right around $10,000..............................................................................3 => Q21A Don't know .............................................................................................D => Q21A Refused................................................................................................... R => Q21A
Q18A: Which range of cost was closest to what you think the loss was? Was it... LESS THAN $2,000 ...............................................................................1 => Q21A OVER $2,000 UP TO $4,000..................................................................2 => Q21A OVER $4,000 UP TO $6,000..................................................................3 => Q21A OVER $6,000 UP TO $8,000..................................................................4 => Q21A OR OVER $8,000 UP TO $10,000 .........................................................5 => Q21A Over $10,000...........................................................................................6 => Q19 Don't know .............................................................................................D => Q21A Refused................................................................................................... R => Q21A
Q19: Would you say this loss was less than $100,000, more than $100,000, or right around $100,000 dollars? Less than $100,000..................................................................................1 => Q19A More than $100,000 ................................................................................2 => Q20 Right around $100,000............................................................................3 => Q21A Don't know .............................................................................................D => Q21A Refused................................................................................................... R => Q21A
Q19A: Which range of cost was closest to what you think the loss was? Was it... LESS THAN $20,000 .............................................................................1 => Q21A OVER $20,000 UP TO $40,000..............................................................2 => Q21A OVER $40,000 UP TO $60,000..............................................................3 => Q21A OVER $60,000 UP TO $80,000..............................................................4 => Q21A OR OVER $80,000 UP TO $100,000 .....................................................5 => Q21A Over $100,000.........................................................................................6 => Q20 Don't know .............................................................................................D => Q21A Refused................................................................................................... R => Q21A
Q20: Would you say this loss was less than $1,000,000 (one million), more than $1,000,000 (one million), or right around 1,000,000 (one million) dollars? Less than $1,000,000...............................................................................1 => Q20A More than $1,000,000 .............................................................................2 => Q20B Right around $1,000,000.........................................................................3 => Q21A Don't know .............................................................................................D => Q21A Refused................................................................................................... R => Q21A

2008 Economic Impact of I-5 & I-90 Closures SESRC Data Report 08-016 Spring 2008
223
Q20A: Which range of cost was closest to what you think the loss was? Was it... LESS THAN $200,000 ...........................................................................1 => Q21A OVER $200,000 UP TO $400,000..........................................................2 => Q21A OVER $400,000 UP TO $600,000..........................................................3 => Q21A OVER $600,000 UP TO $800,000..........................................................4 => Q21A OR OVER $800,000 UP TO $1,000,000 ................................................5 => Q21A Over $1,000,000......................................................................................6 => Q21A Don't know .............................................................................................D => Q21A Refused................................................................................................... R => Q21A
Q20B: Which range of cost was closest to what you think the loss was? Was it... LESS THAN $1,200,000 (12 million) ....................................................1 OVER $1,200,000 UP TO $1,400,000....................................................2 OVER $1,400,000 UP TO $1,600,000....................................................3 OVER $1,600,000 UP TO $1,800,000....................................................4 OVER $1,800,000 UP TO $2,000,000....................................................5 OR OVER $2,000,000 ............................................................................6 Don't know .............................................................................................D Refused................................................................................................... R
Q21A: Next, I will read a series of items that might have contributed to your company's additional costs during the I-5 closure. For each item, please first give me the amount spent for all trucks impacted. And, secondly, the percentage that item represents of the total additional costs. The first one is Overtime hours and other truck drivers' expenses. What is the amount spent for all trucks impacted? $E 0 999999999 Don't know .............................................................................................D Refused................................................................................................... R
Q21B: What percentage of additional costs (for all trucks) is this? (IWR: If R said 0 for the amount code percentage as 0 and do not ask this question) $R.2 000.00 100.00 Don't know .............................................................................................D Refused................................................................................................... R
Q21C: The next one is Additional fuel costs. What is the amount spent for all trucks impacted? $E 0 999999999 Don't know .............................................................................................D Refused................................................................................................... R
Q21D: What percentage of additional costs (for all trucks) is this? (IWR: If R said 0 for the amount code percentage as 0 and do not ask this question) $R.2 000.00 100.00 Don't know .............................................................................................D Refused................................................................................................... R
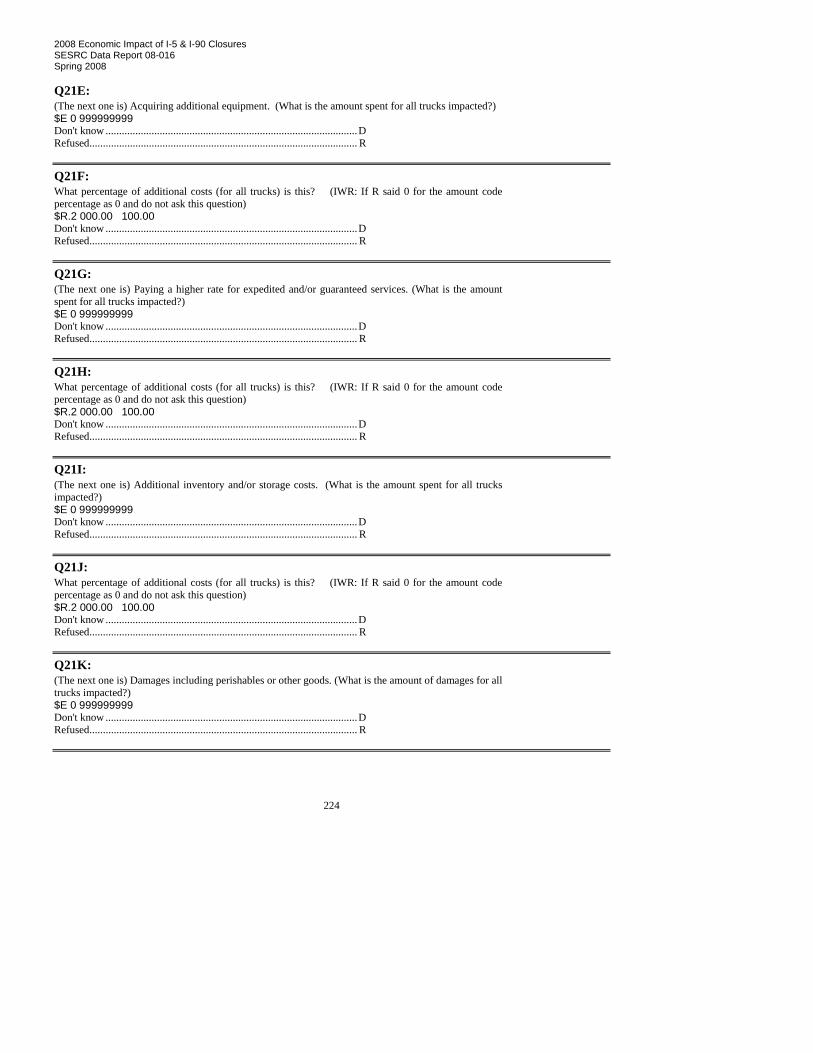
2008 Economic Impact of I-5 & I-90 Closures SESRC Data Report 08-016 Spring 2008
224
Q21E: (The next one is) Acquiring additional equipment. (What is the amount spent for all trucks impacted?) $E 0 999999999 Don't know .............................................................................................D Refused................................................................................................... R
Q21F: What percentage of additional costs (for all trucks) is this? (IWR: If R said 0 for the amount code percentage as 0 and do not ask this question) $R.2 000.00 100.00 Don't know .............................................................................................D Refused................................................................................................... R
Q21G: (The next one is) Paying a higher rate for expedited and/or guaranteed services. (What is the amount spent for all trucks impacted?) $E 0 999999999 Don't know .............................................................................................D Refused................................................................................................... R
Q21H: What percentage of additional costs (for all trucks) is this? (IWR: If R said 0 for the amount code percentage as 0 and do not ask this question) $R.2 000.00 100.00 Don't know .............................................................................................D Refused................................................................................................... R
Q21I: (The next one is) Additional inventory and/or storage costs. (What is the amount spent for all trucks impacted?) $E 0 999999999 Don't know .............................................................................................D Refused................................................................................................... R
Q21J: What percentage of additional costs (for all trucks) is this? (IWR: If R said 0 for the amount code percentage as 0 and do not ask this question) $R.2 000.00 100.00 Don't know .............................................................................................D Refused................................................................................................... R
Q21K: (The next one is) Damages including perishables or other goods. (What is the amount of damages for all trucks impacted?) $E 0 999999999 Don't know .............................................................................................D Refused................................................................................................... R

2008 Economic Impact of I-5 & I-90 Closures SESRC Data Report 08-016 Spring 2008
225
Q21L: What percentage of additional costs (for all trucks) is this? $R.2 000.00 100.00 Don't know .............................................................................................D Refused................................................................................................... R
Q21M: The last one is any other reasons or items of losses (during the I-5 closure) that we have not covered. (What is the amount spent for all trucks impacted?) $E 0 999999999 Don't know .............................................................................................D Refused................................................................................................... R
Q21N: What percentage of additional costs (for all trucks) is this? (IWR: If R said 0 for the amount code percentage as 0 and do not ask this question) $R.2 000.00 100.00 Don't know .............................................................................................D Refused................................................................................................... R
Q22: After I-5 reopened, did your company's transportation-related costs immediately return to the previous level? Yes ..........................................................................................................1 => Q27 No............................................................................................................2 Don't know .............................................................................................D => Q27 Refused................................................................................................... R => Q27
Q23: How long were your company's transportation-related costs higher than normal? (IWR: Units are days, weeks, and months on next question. Please check units on the next question.) $E 0 999 Don't know .............................................................................................D => Q23B Refused................................................................................................... R => Q23B
Q23A: (IWR: check the unit--Number of ...) => Q23B si Q23==0 Days ........................................................................................................1 Weeks......................................................................................................2 Months ....................................................................................................3
Q23B: What were the reasons for the continued costs? Comments ...............................................................................................1 O No comments ..........................................................................................2 Don't know .............................................................................................D Refused................................................................................................... R

2008 Economic Impact of I-5 & I-90 Closures SESRC Data Report 08-016 Spring 2008
226
Q24: What was the total amount of additional transportation-related costs paid by your company AFTER I-5 reopened? (IWR: if none please enter 0) $E 0 999999999 Don't know .............................................................................................D => Q24A Refused................................................................................................... R => Q27
Q24A: Since you don't know, can you estimate what was the total amount of additional transportation-related costs paid by your company AFTER I-5 reopened? Would you say this cost was less than $10,000, more than $10,000, or right around $10,000 dollars? => Q27 si Q24>0 OR Q24==0 Less than $10,000....................................................................................1 => Q24B More than $10,000 ..................................................................................2 => Q25 Right around $10,000..............................................................................3 => Q27 Don't know .............................................................................................D => Q27 Refused................................................................................................... R => Q27
Q24B: Which range of cost was closest to what you think the loss was? Was it... LESS THAN $2,000 ...............................................................................1 => Q27 OVER $2,000 UP TO $4,000..................................................................2 => Q27 OVER $4,000 UP TO $6,000..................................................................3 => Q27 OVER $6,000 UP TO $8,000..................................................................4 => Q27 OR OVER $8,000 UP TO $10,000 .........................................................5 => Q27 Over $10,000...........................................................................................6 => Q25 Don't know .............................................................................................D => Q27 Refused................................................................................................... R => Q27
Q25: Would you say this loss was less than $100,000, more than $100,000, or right around $100,000 dollars? Less than $100,000..................................................................................1 => Q25A More than $100,000 ................................................................................2 => Q26 Right around $100,000............................................................................3 => Q27 Don't know .............................................................................................D => Q27 Refused................................................................................................... R => Q27
Q25A: Which range of cost was closest to what you think the loss was? Was it... LESS THAN $20,000 .............................................................................1 => Q27 OVER $20,000 UP TO $40,000..............................................................2 => Q27 OVER $40,000 UP TO $60,000..............................................................3 => Q27 OVER $60,000 UP TO $80,000..............................................................4 => Q27 OR OVER $80,000 UP TO $100,000 .....................................................5 => Q27 Over $100,000.........................................................................................6 => Q26 Don't know .............................................................................................D => Q27 Refused................................................................................................... R => Q27
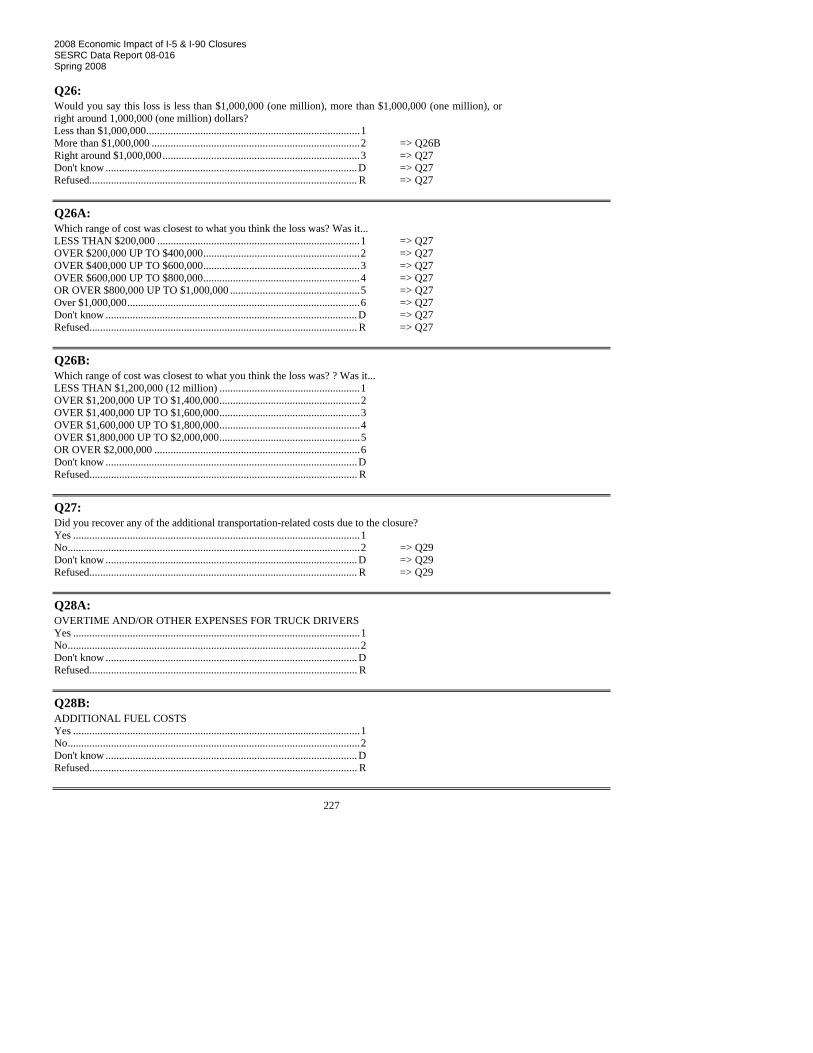
2008 Economic Impact of I-5 & I-90 Closures SESRC Data Report 08-016 Spring 2008
227
Q26: Would you say this loss is less than $1,000,000 (one million), more than $1,000,000 (one million), or right around 1,000,000 (one million) dollars? Less than $1,000,000...............................................................................1 More than $1,000,000 .............................................................................2 => Q26B Right around $1,000,000.........................................................................3 => Q27 Don't know .............................................................................................D => Q27 Refused................................................................................................... R => Q27
Q26A: Which range of cost was closest to what you think the loss was? Was it... LESS THAN $200,000 ...........................................................................1 => Q27 OVER $200,000 UP TO $400,000..........................................................2 => Q27 OVER $400,000 UP TO $600,000..........................................................3 => Q27 OVER $600,000 UP TO $800,000..........................................................4 => Q27 OR OVER $800,000 UP TO $1,000,000 ................................................5 => Q27 Over $1,000,000......................................................................................6 => Q27 Don't know .............................................................................................D => Q27 Refused................................................................................................... R => Q27
Q26B: Which range of cost was closest to what you think the loss was? ? Was it... LESS THAN $1,200,000 (12 million) ....................................................1 OVER $1,200,000 UP TO $1,400,000....................................................2 OVER $1,400,000 UP TO $1,600,000....................................................3 OVER $1,600,000 UP TO $1,800,000....................................................4 OVER $1,800,000 UP TO $2,000,000....................................................5 OR OVER $2,000,000 ............................................................................6 Don't know .............................................................................................D Refused................................................................................................... R
Q27: Did you recover any of the additional transportation-related costs due to the closure? Yes ..........................................................................................................1 No............................................................................................................2 => Q29 Don't know .............................................................................................D => Q29 Refused................................................................................................... R => Q29
Q28A: OVERTIME AND/OR OTHER EXPENSES FOR TRUCK DRIVERS Yes ..........................................................................................................1 No............................................................................................................2 Don't know .............................................................................................D Refused................................................................................................... R
Q28B: ADDITIONAL FUEL COSTS Yes ..........................................................................................................1 No............................................................................................................2 Don't know .............................................................................................D Refused................................................................................................... R
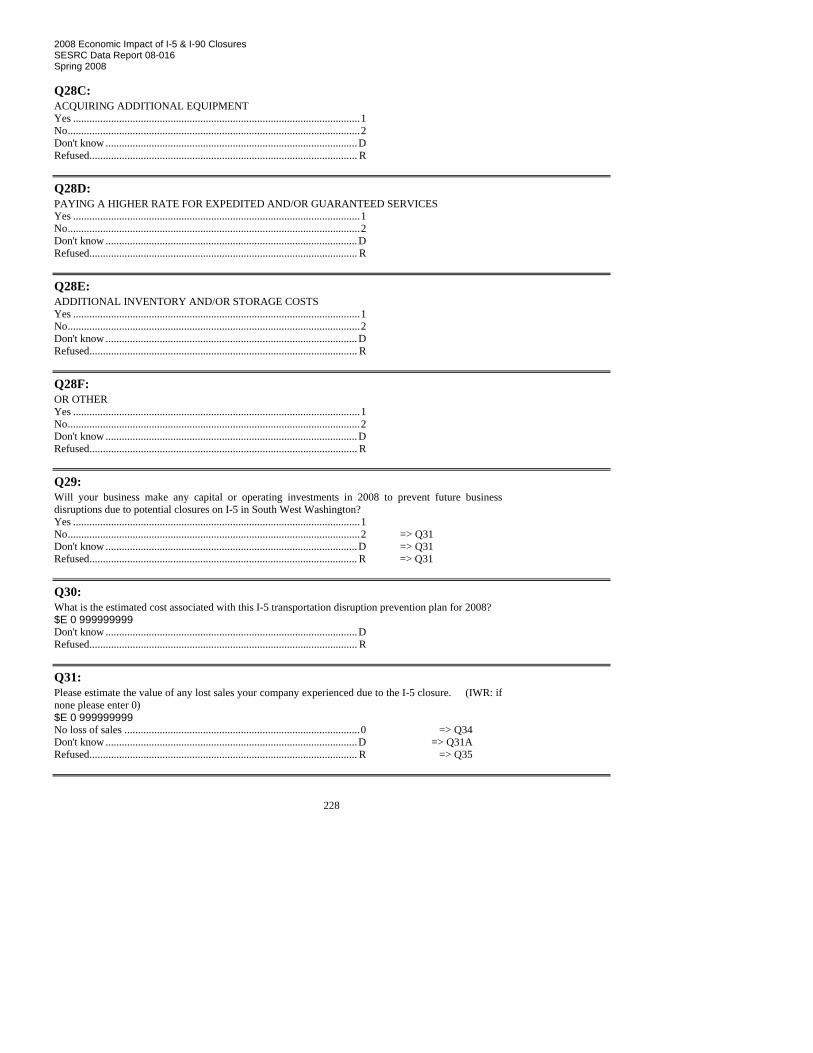
2008 Economic Impact of I-5 & I-90 Closures SESRC Data Report 08-016 Spring 2008
228
Q28C: ACQUIRING ADDITIONAL EQUIPMENT Yes ..........................................................................................................1 No............................................................................................................2 Don't know .............................................................................................D Refused................................................................................................... R
Q28D: PAYING A HIGHER RATE FOR EXPEDITED AND/OR GUARANTEED SERVICES Yes ..........................................................................................................1 No............................................................................................................2 Don't know .............................................................................................D Refused................................................................................................... R
Q28E: ADDITIONAL INVENTORY AND/OR STORAGE COSTS Yes ..........................................................................................................1 No............................................................................................................2 Don't know .............................................................................................D Refused................................................................................................... R
Q28F: OR OTHER Yes ..........................................................................................................1 No............................................................................................................2 Don't know .............................................................................................D Refused................................................................................................... R
Q29: Will your business make any capital or operating investments in 2008 to prevent future business disruptions due to potential closures on I-5 in South West Washington? Yes ..........................................................................................................1 No............................................................................................................2 => Q31 Don't know .............................................................................................D => Q31 Refused................................................................................................... R => Q31
Q30: What is the estimated cost associated with this I-5 transportation disruption prevention plan for 2008? $E 0 999999999 Don't know .............................................................................................D Refused................................................................................................... R
Q31: Please estimate the value of any lost sales your company experienced due to the I-5 closure. (IWR: if none please enter 0) $E 0 999999999 No loss of sales .......................................................................................0 => Q34 Don't know .............................................................................................D => Q31A Refused................................................................................................... R => Q35

2008 Economic Impact of I-5 & I-90 Closures SESRC Data Report 08-016 Spring 2008
229
Q31A: Since you don't know, can you estimate what range would fit the additional costs? Would you say this cost was less than $10,000, more than $10,000, or right around $10,000 dollars? => Q33C si Q31>0 Less than $10,000....................................................................................1 => Q31B More than $10,000 ..................................................................................2 => Q32 Right around $10,000..............................................................................3 => Q33C No loss of sales .......................................................................................4 => Q34 Don't know .............................................................................................D => Q35 Refused................................................................................................... R => Q35
Q31B: Which range of cost was closest to what you think the loss was? Was it... LESS THAN $2,000 ...............................................................................1 => Q33C OVER $2,000 UP TO $4,000..................................................................2 => Q33C OVER $4,000 UP TO $6,000..................................................................3 => Q33C OVER $6,000 UP TO $8,000..................................................................4 => Q33C OR OVER $8,000 UP TO $10,000 .........................................................5 => Q33C Over $10,000...........................................................................................6 => Q32 Don't know .............................................................................................D => Q35 Refused................................................................................................... R => Q35
Q32: Would you say this loss was less than $100,000, more than $100,000, or right around $100,000 dollars? Less than $100,000..................................................................................1 => Q32A More than $100,000 ................................................................................2 => Q33 Right around $100,000............................................................................3 => Q33C Don't know .............................................................................................D => Q35 Refused................................................................................................... R => Q35
Q32A: Which range of cost was closest to what you think the loss was? Was it... LESS THAN $20,000 .............................................................................1 => Q33C OVER $20,000 UP TO $40,000..............................................................2 => Q33C OVER $40,000 UP TO $60,000..............................................................3 => Q33C OVER $60,000 UP TO $80,000..............................................................4 => Q33C OR OVER $80,000 UP TO $100,000 .....................................................5 => Q33C Over $100,000.........................................................................................6 => Q33 Don't know .............................................................................................D => Q35 Refused................................................................................................... R => Q35
Q33: Would you say this loss is less than $1,000,000 (one million), more than $1,000,000 (one million), or right around 1,000,000 (one million) dollars? Less than $1,000,000...............................................................................1 => Q33A More than $1,000,000 .............................................................................2 => Q33B Right around $1,000,000.........................................................................3 => Q33C Don't know .............................................................................................D => Q35 Refused................................................................................................... R => Q35

2008 Economic Impact of I-5 & I-90 Closures SESRC Data Report 08-016 Spring 2008
230
Q33A: Which range of cost was closest to what you think the loss was? Was it... LESS THAN $200,000 ...........................................................................1 => Q33C OVER $200,000 UP TO $400,000..........................................................2 => Q33C OVER $400,000 UP TO $600,000..........................................................3 => Q33C OVER $600,000 UP TO $800,000..........................................................4 => Q33C OR OVER $800,000 UP TO $1,000,000 ................................................5 => Q33C Over $1,000,000......................................................................................6 => Q33C Don't know .............................................................................................D => Q35 Refused................................................................................................... R => Q35
Q33B: Which range of cost was closest to what you think the loss was? ? Was it... LESS THAN $1,200,000 (12 million) ....................................................1 OVER $1,200,000 UP TO $1,400,000....................................................2 OVER $1,400,000 UP TO $1,600,000....................................................3 OVER $1,600,000 UP TO $1,800,000....................................................4 OVER $1,800,000 UP TO $2,000,000....................................................5 OR OVER $2,000,000 ............................................................................6 Don't know .............................................................................................D Refused................................................................................................... R
Q33C: How did you estimate that amount? Comments ...............................................................................................1 O => Q35 No comments ..........................................................................................2 => Q35 Don't know .............................................................................................D => Q35 Refused................................................................................................... R => Q35
Q34: Why did your business NOT have any loss of sales or business opportunities? Comment.................................................................................................1 O => Q42 No comment ............................................................................................2 => Q42 Don't know .............................................................................................D => Q42 Refused................................................................................................... R => Q42
Q35: What percentage of your company's total annual revenues does this LOSS represent? $R.2 000.00 100.00 Don't know .............................................................................................D Refused................................................................................................... R
Q36: Can you estimate the total amount of annual revenue and/or the total amount of business opportunities that were lost? $E 0 999999999 Don't know .............................................................................................D Refused................................................................................................... R

2008 Economic Impact of I-5 & I-90 Closures SESRC Data Report 08-016 Spring 2008
231
Q37: What percentage of your company's total lost sales due to the I-5 closure occurred in December 2007? $R.2 000.00 100.00 Don't know .............................................................................................D Refused................................................................................................... R
Q38: What percentage of your company's total lost sales occurred in January 2008? $R.2 000.00 100.00 Don't know .............................................................................................D Refused................................................................................................... R
Q39: Do you anticipate ongoing lost sales in the future due to the December 2007 I-5 closure? Yes ..........................................................................................................1 No............................................................................................................2 => Q42 Don't know .............................................................................................D => Q42 Refused................................................................................................... R => Q42
Q40: What is your best estimate of on-going lost sales per month? $E 0 999999999 Don't know .............................................................................................D Refused................................................................................................... R
Q41: For how long do you estimate the ongoing lost sales will continue? (IWR: Units are days, weeks, and months on the next question. Please check units on next question.) $E 0 999 Don't know .............................................................................................D => Q42 Refused................................................................................................... R => Q42
Q41A: (IWR: check units--Number of ) => Q42 si Q41==0 Days ........................................................................................................1 Weeks......................................................................................................2 Months ....................................................................................................3
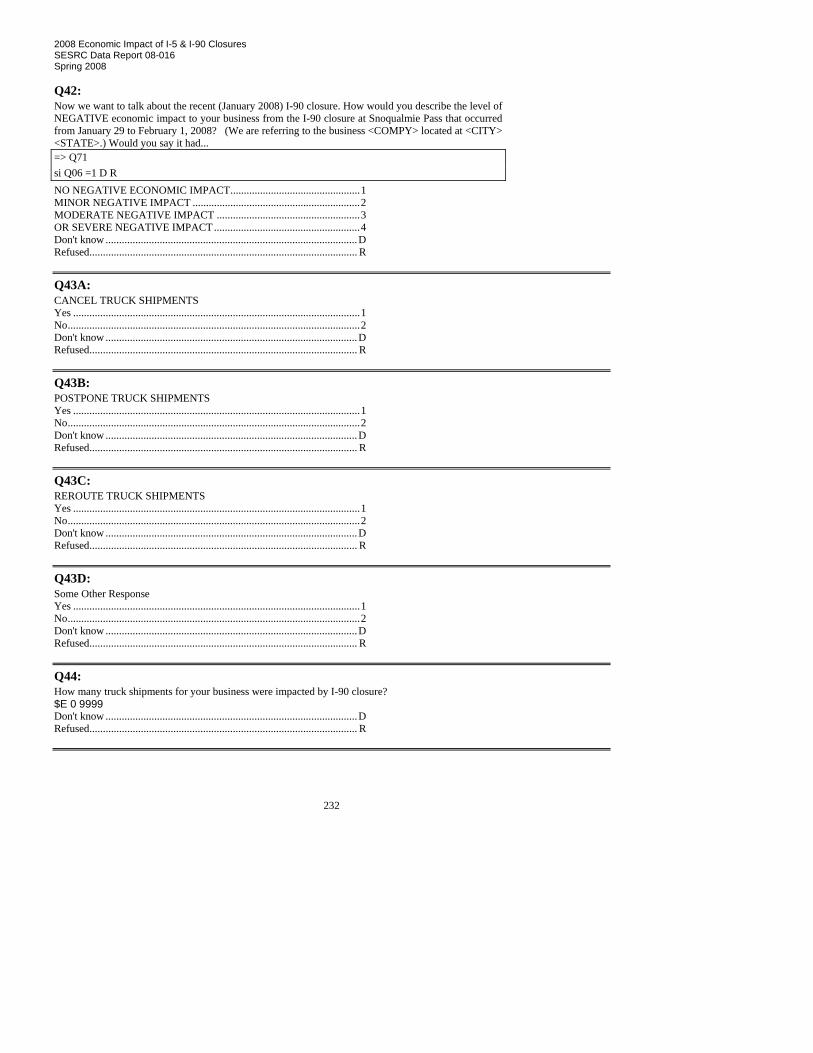
2008 Economic Impact of I-5 & I-90 Closures SESRC Data Report 08-016 Spring 2008
232
Q42: Now we want to talk about the recent (January 2008) I-90 closure. How would you describe the level of NEGATIVE economic impact to your business from the I-90 closure at Snoqualmie Pass that occurred from January 29 to February 1, 2008? (We are referring to the business <COMPY> located at <CITY> <STATE>.) Would you say it had... => Q71 si Q06 =1 D R NO NEGATIVE ECONOMIC IMPACT................................................1 MINOR NEGATIVE IMPACT ..............................................................2 MODERATE NEGATIVE IMPACT .....................................................3 OR SEVERE NEGATIVE IMPACT......................................................4 Don't know .............................................................................................D Refused................................................................................................... R
Q43A: CANCEL TRUCK SHIPMENTS Yes ..........................................................................................................1 No............................................................................................................2 Don't know .............................................................................................D Refused................................................................................................... R
Q43B: POSTPONE TRUCK SHIPMENTS Yes ..........................................................................................................1 No............................................................................................................2 Don't know .............................................................................................D Refused................................................................................................... R
Q43C: REROUTE TRUCK SHIPMENTS Yes ..........................................................................................................1 No............................................................................................................2 Don't know .............................................................................................D Refused................................................................................................... R
Q43D: Some Other Response Yes ..........................................................................................................1 No............................................................................................................2 Don't know .............................................................................................D Refused................................................................................................... R
Q44: How many truck shipments for your business were impacted by I-90 closure? $E 0 9999 Don't know .............................................................................................D Refused................................................................................................... R

2008 Economic Impact of I-5 & I-90 Closures SESRC Data Report 08-016 Spring 2008
233
CHK43: Check Q43 => Q45A sinon => Q51A si Q43C=1
Q45A: Highway 2 Yes ..........................................................................................................1 No............................................................................................................2 Don't know .............................................................................................D Refused................................................................................................... R
Q45B: Highway 12 Yes ..........................................................................................................1 No............................................................................................................2 Don't know .............................................................................................D Refused................................................................................................... R
Q45C: Highway 14 Yes ..........................................................................................................1 No............................................................................................................2 Don't know .............................................................................................D Refused................................................................................................... R
Q45D: I-84 Yes ..........................................................................................................1 No............................................................................................................2 Don't know .............................................................................................D Refused................................................................................................... R
CK46: check Q45A if Q45A = 1 go Q46A => Q46A sinon => CK47 si Q45A=1
Q46A: During I-90 closure, how many of your trucks used this (Highway 2) detour? $E 0 9999 Don't know .............................................................................................D Refused................................................................................................... R
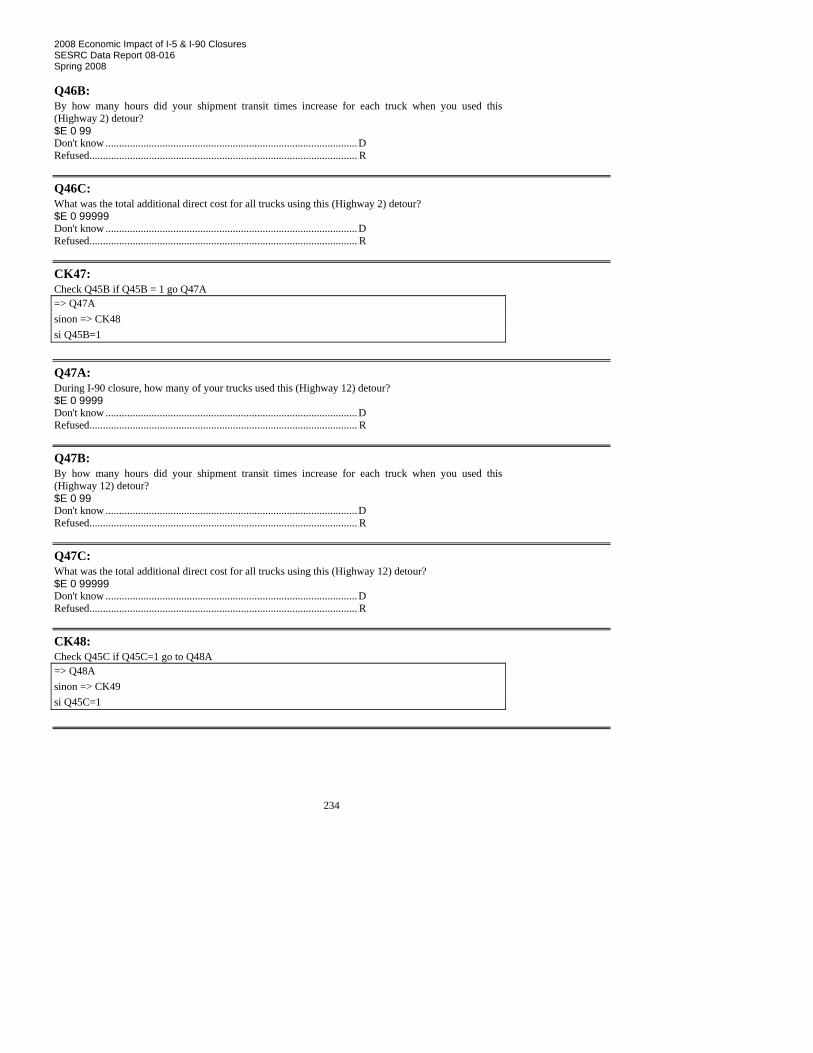
2008 Economic Impact of I-5 & I-90 Closures SESRC Data Report 08-016 Spring 2008
234
Q46B: By how many hours did your shipment transit times increase for each truck when you used this (Highway 2) detour? $E 0 99 Don't know .............................................................................................D Refused................................................................................................... R
Q46C: What was the total additional direct cost for all trucks using this (Highway 2) detour? $E 0 99999 Don't know .............................................................................................D Refused................................................................................................... R
CK47: Check Q45B if Q45B = 1 go Q47A => Q47A sinon => CK48 si Q45B=1
Q47A: During I-90 closure, how many of your trucks used this (Highway 12) detour? $E 0 9999 Don't know .............................................................................................D Refused................................................................................................... R
Q47B: By how many hours did your shipment transit times increase for each truck when you used this (Highway 12) detour? $E 0 99 Don't know .............................................................................................D Refused................................................................................................... R
Q47C: What was the total additional direct cost for all trucks using this (Highway 12) detour? $E 0 99999 Don't know .............................................................................................D Refused................................................................................................... R
CK48: Check Q45C if Q45C=1 go to Q48A => Q48A sinon => CK49 si Q45C=1
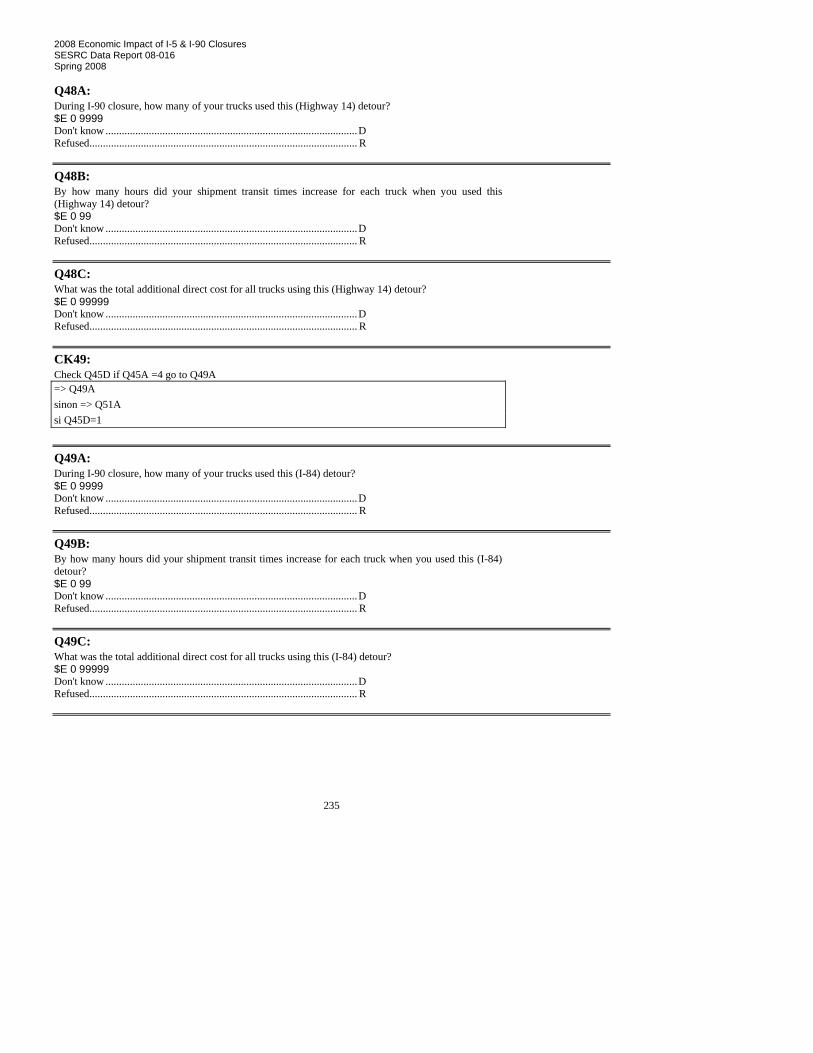
2008 Economic Impact of I-5 & I-90 Closures SESRC Data Report 08-016 Spring 2008
235
Q48A: During I-90 closure, how many of your trucks used this (Highway 14) detour? $E 0 9999 Don't know .............................................................................................D Refused................................................................................................... R
Q48B: By how many hours did your shipment transit times increase for each truck when you used this (Highway 14) detour? $E 0 99 Don't know .............................................................................................D Refused................................................................................................... R
Q48C: What was the total additional direct cost for all trucks using this (Highway 14) detour? $E 0 99999 Don't know .............................................................................................D Refused................................................................................................... R
CK49: Check Q45D if Q45A =4 go to Q49A => Q49A sinon => Q51A si Q45D=1
Q49A: During I-90 closure, how many of your trucks used this (I-84) detour? $E 0 9999 Don't know .............................................................................................D Refused................................................................................................... R
Q49B: By how many hours did your shipment transit times increase for each truck when you used this (I-84) detour? $E 0 99 Don't know .............................................................................................D Refused................................................................................................... R
Q49C: What was the total additional direct cost for all trucks using this (I-84) detour? $E 0 99999 Don't know .............................................................................................D Refused................................................................................................... R
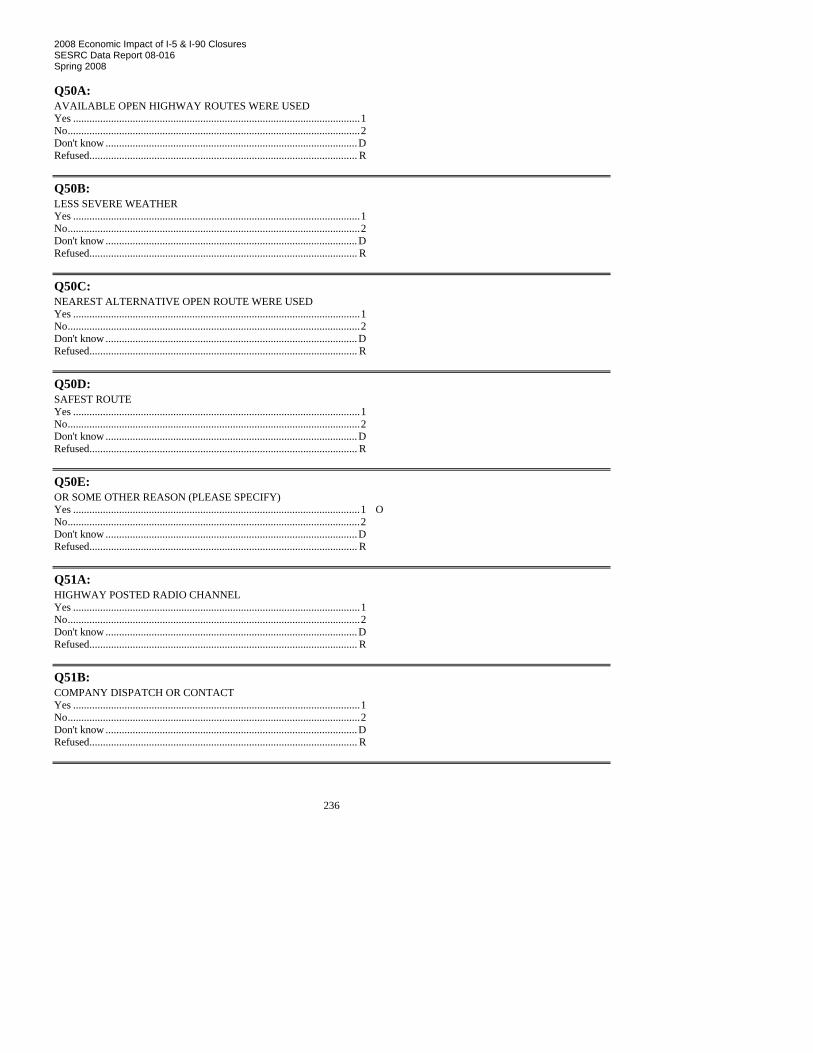
2008 Economic Impact of I-5 & I-90 Closures SESRC Data Report 08-016 Spring 2008
236
Q50A: AVAILABLE OPEN HIGHWAY ROUTES WERE USED Yes ..........................................................................................................1 No............................................................................................................2 Don't know .............................................................................................D Refused................................................................................................... R
Q50B: LESS SEVERE WEATHER Yes ..........................................................................................................1 No............................................................................................................2 Don't know .............................................................................................D Refused................................................................................................... R
Q50C: NEAREST ALTERNATIVE OPEN ROUTE WERE USED Yes ..........................................................................................................1 No............................................................................................................2 Don't know .............................................................................................D Refused................................................................................................... R
Q50D: SAFEST ROUTE Yes ..........................................................................................................1 No............................................................................................................2 Don't know .............................................................................................D Refused................................................................................................... R
Q50E: OR SOME OTHER REASON (PLEASE SPECIFY) Yes ..........................................................................................................1 O No............................................................................................................2 Don't know .............................................................................................D Refused................................................................................................... R
Q51A: HIGHWAY POSTED RADIO CHANNEL Yes ..........................................................................................................1 No............................................................................................................2 Don't know .............................................................................................D Refused................................................................................................... R
Q51B: COMPANY DISPATCH OR CONTACT Yes ..........................................................................................................1 No............................................................................................................2 Don't know .............................................................................................D Refused................................................................................................... R

2008 Economic Impact of I-5 & I-90 Closures SESRC Data Report 08-016 Spring 2008
237
Q51C: TRUCK WEIGH STATION Yes ..........................................................................................................1 No............................................................................................................2 Don't know .............................................................................................D Refused................................................................................................... R
Q51D: WSDOT WEBSITE Yes ..........................................................................................................1 No............................................................................................................2 Don't know .............................................................................................D Refused................................................................................................... R
Q51E: WSDOT FREIGHT EMAIL LISTSERVE Yes ..........................................................................................................1 No............................................................................................................2 Don't know .............................................................................................D Refused................................................................................................... R
Q51F: MEDIA, INCLUDING TV OR RADIO OR PRINT Yes ..........................................................................................................1 No............................................................................................................2 Don't know .............................................................................................D Refused................................................................................................... R
Q51G: STATE PATROL Yes ..........................................................................................................1 No............................................................................................................2 Don't know .............................................................................................D Refused................................................................................................... R
Q51H: OTHER (PLEASE SPECIFY) Yes ..........................................................................................................1 O No............................................................................................................2 Don't know .............................................................................................D Refused................................................................................................... R
Q52: Next, we are interested in the total additional freight-transportation-related costs your business incurred during the I-90 closure. What were your company's total ADDITIONAL costs incurred during the I-90 closure at Snoqualmie Pass? (DEF: Additional costs: That is all additional costs beyond the amount normally incurred for all trucks initially directed to use I-90.) $E 0 999999999 Don't know .............................................................................................D => Q52A Refused................................................................................................... R => Q55A
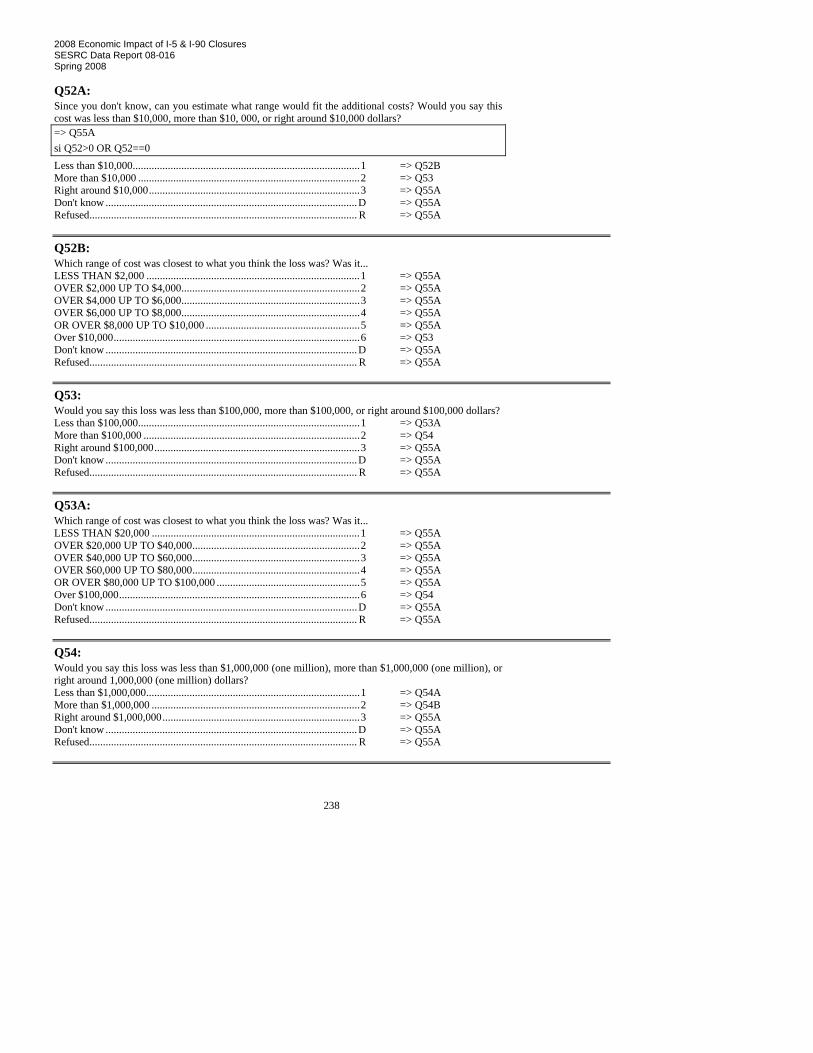
2008 Economic Impact of I-5 & I-90 Closures SESRC Data Report 08-016 Spring 2008
238
Q52A: Since you don't know, can you estimate what range would fit the additional costs? Would you say this cost was less than $10,000, more than $10, 000, or right around $10,000 dollars? => Q55A si Q52>0 OR Q52==0 Less than $10,000....................................................................................1 => Q52B More than $10,000 ..................................................................................2 => Q53 Right around $10,000..............................................................................3 => Q55A Don't know .............................................................................................D => Q55A Refused................................................................................................... R => Q55A
Q52B: Which range of cost was closest to what you think the loss was? Was it... LESS THAN $2,000 ...............................................................................1 => Q55A OVER $2,000 UP TO $4,000..................................................................2 => Q55A OVER $4,000 UP TO $6,000..................................................................3 => Q55A OVER $6,000 UP TO $8,000..................................................................4 => Q55A OR OVER $8,000 UP TO $10,000 .........................................................5 => Q55A Over $10,000...........................................................................................6 => Q53 Don't know .............................................................................................D => Q55A Refused................................................................................................... R => Q55A
Q53: Would you say this loss was less than $100,000, more than $100,000, or right around $100,000 dollars? Less than $100,000..................................................................................1 => Q53A More than $100,000 ................................................................................2 => Q54 Right around $100,000............................................................................3 => Q55A Don't know .............................................................................................D => Q55A Refused................................................................................................... R => Q55A
Q53A: Which range of cost was closest to what you think the loss was? Was it... LESS THAN $20,000 .............................................................................1 => Q55A OVER $20,000 UP TO $40,000..............................................................2 => Q55A OVER $40,000 UP TO $60,000..............................................................3 => Q55A OVER $60,000 UP TO $80,000..............................................................4 => Q55A OR OVER $80,000 UP TO $100,000 .....................................................5 => Q55A Over $100,000.........................................................................................6 => Q54 Don't know .............................................................................................D => Q55A Refused................................................................................................... R => Q55A
Q54: Would you say this loss was less than $1,000,000 (one million), more than $1,000,000 (one million), or right around 1,000,000 (one million) dollars? Less than $1,000,000...............................................................................1 => Q54A More than $1,000,000 .............................................................................2 => Q54B Right around $1,000,000.........................................................................3 => Q55A Don't know .............................................................................................D => Q55A Refused................................................................................................... R => Q55A

2008 Economic Impact of I-5 & I-90 Closures SESRC Data Report 08-016 Spring 2008
239
Q54A: Which range of cost was closest to what you think the loss was? Was it... LESS THAN $200,000 ...........................................................................1 => Q55A OVER $200,000 UP TO $400,000..........................................................2 => Q55A OVER $400,000 UP TO $600,000..........................................................3 => Q55A OVER $600,000 UP TO $800,000..........................................................4 => Q55A OR OVER $800,000 UP TO $1,000,000 ................................................5 => Q55A Over $1,000,000......................................................................................6 => Q55A Don't know .............................................................................................D => Q55A Refused................................................................................................... R => Q55A
Q54B: Which range of cost was closest to what you think the loss was? Was it... LESS THAN $1,200,000 (12 million) ....................................................1 OVER $1,200,000 UP TO $1,400,000....................................................2 OVER $1,400,000 UP TO $1,600,000....................................................3 OVER $1,600,000 UP TO $1,800,000....................................................4 OVER $1,800,000 UP TO $2,000,000....................................................5 OR OVER $2,000,000 ............................................................................6 Don't know .............................................................................................D Refused................................................................................................... R
Q55A: Next, I will read a series of items that might have contributed to your company's additional costs during the I-90 closure. For each item, please first give me the amount spent for all trucks impacted. And, secondly, the percentage that item represents of the total additional costs. The first one is Overtime hours and other truck drivers' expenses. What is the amount spent for all trucks impacted (by I-90 closure)? $E 0 999999999 Don't know .............................................................................................D Refused................................................................................................... R
Q55B: What percentage of additional costs (for all trucks) is this? (IWR: If R said 0 for the amount code percentage as 0 and do not ask this question) $R.2 000.00 100.00 Don't know .............................................................................................D Refused................................................................................................... R
Q55C: The next one is Additional fuel costs (due to I-90 closure). (What is the amount spent for all trucks impacted?) $E 0 999999999 Don't know .............................................................................................D Refused................................................................................................... R
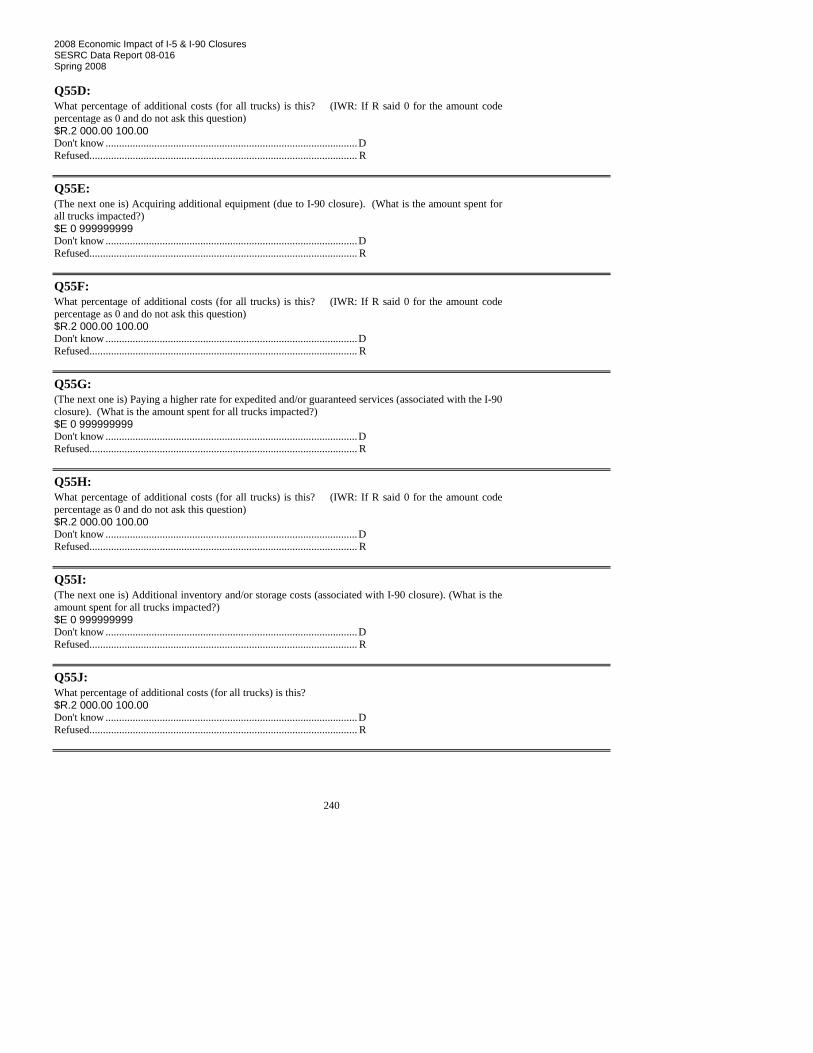
2008 Economic Impact of I-5 & I-90 Closures SESRC Data Report 08-016 Spring 2008
240
Q55D: What percentage of additional costs (for all trucks) is this? (IWR: If R said 0 for the amount code percentage as 0 and do not ask this question) $R.2 000.00 100.00 Don't know .............................................................................................D Refused................................................................................................... R
Q55E: (The next one is) Acquiring additional equipment (due to I-90 closure). (What is the amount spent for all trucks impacted?) $E 0 999999999 Don't know .............................................................................................D Refused................................................................................................... R
Q55F: What percentage of additional costs (for all trucks) is this? (IWR: If R said 0 for the amount code percentage as 0 and do not ask this question) $R.2 000.00 100.00 Don't know .............................................................................................D Refused................................................................................................... R
Q55G: (The next one is) Paying a higher rate for expedited and/or guaranteed services (associated with the I-90 closure). (What is the amount spent for all trucks impacted?) $E 0 999999999 Don't know .............................................................................................D Refused................................................................................................... R
Q55H: What percentage of additional costs (for all trucks) is this? (IWR: If R said 0 for the amount code percentage as 0 and do not ask this question) $R.2 000.00 100.00 Don't know .............................................................................................D Refused................................................................................................... R
Q55I: (The next one is) Additional inventory and/or storage costs (associated with I-90 closure). (What is the amount spent for all trucks impacted?) $E 0 999999999 Don't know .............................................................................................D Refused................................................................................................... R
Q55J: What percentage of additional costs (for all trucks) is this? $R.2 000.00 100.00 Don't know .............................................................................................D Refused................................................................................................... R
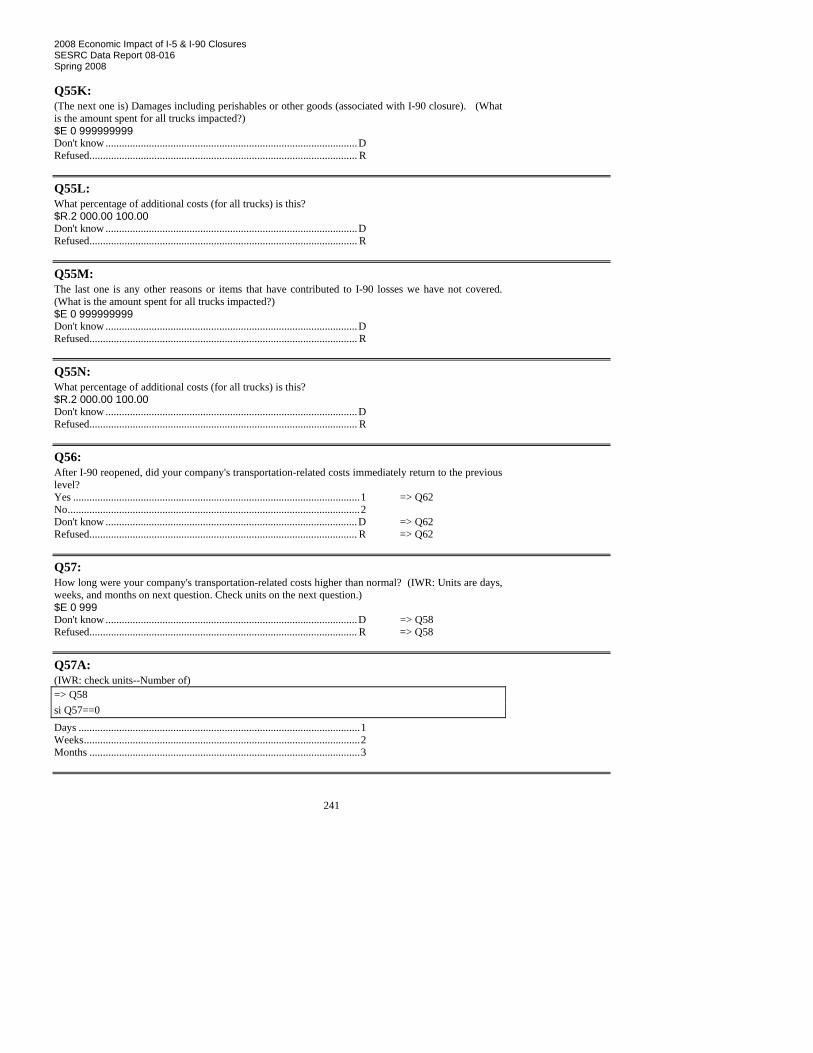
2008 Economic Impact of I-5 & I-90 Closures SESRC Data Report 08-016 Spring 2008
241
Q55K: (The next one is) Damages including perishables or other goods (associated with I-90 closure). (What is the amount spent for all trucks impacted?) $E 0 999999999 Don't know .............................................................................................D Refused................................................................................................... R
Q55L: What percentage of additional costs (for all trucks) is this? $R.2 000.00 100.00 Don't know .............................................................................................D Refused................................................................................................... R
Q55M: The last one is any other reasons or items that have contributed to I-90 losses we have not covered. (What is the amount spent for all trucks impacted?) $E 0 999999999 Don't know .............................................................................................D Refused................................................................................................... R
Q55N: What percentage of additional costs (for all trucks) is this? $R.2 000.00 100.00 Don't know .............................................................................................D Refused................................................................................................... R
Q56: After I-90 reopened, did your company's transportation-related costs immediately return to the previous level? Yes ..........................................................................................................1 => Q62 No............................................................................................................2 Don't know .............................................................................................D => Q62 Refused................................................................................................... R => Q62
Q57: How long were your company's transportation-related costs higher than normal? (IWR: Units are days, weeks, and months on next question. Check units on the next question.) $E 0 999 Don't know .............................................................................................D => Q58 Refused................................................................................................... R => Q58
Q57A: (IWR: check units--Number of) => Q58 si Q57==0 Days ........................................................................................................1 Weeks......................................................................................................2 Months ....................................................................................................3

2008 Economic Impact of I-5 & I-90 Closures SESRC Data Report 08-016 Spring 2008
242
Q58: What were the reasons for the continued costs? Comments ...............................................................................................1 O No comments ..........................................................................................2 Don't know .............................................................................................D Refused................................................................................................... R
Q59: What was the total amount of additional transportation-related costs paid by your company AFTER I-90 reopened? $E 0 999999999 Don't know .............................................................................................D => Q59A Refused................................................................................................... R => Q62
Q59A: Since you don't know, can you estimate what range would fit the additional costs? Would you say this cost was less than $10,000, more than $10,000, or right around $10,000 dollars? => Q62 si Q59>0 OR Q59==0 Less than $10,000....................................................................................1 => Q59B More than $10,000 ..................................................................................2 => Q60 Right around $10,000..............................................................................3 => Q62 Don't know .............................................................................................D => Q62 Refused................................................................................................... R => Q62
Q59B: Which range of cost was closest to what you think the loss was? Was it... LESS THAN $2,000 ...............................................................................1 => Q62 OVER $2,000 UP TO $4,000..................................................................2 => Q62 OVER $4,000 UP TO $6,000..................................................................3 => Q62 OVER $6,000 UP TO $8,000..................................................................4 => Q62 OR OVER $8,000 UP TO $10,000 .........................................................5 => Q62 Over $10,000...........................................................................................6 => Q60 Don't know .............................................................................................D => Q62 Refused................................................................................................... R => Q62
Q60: Would you say this loss was less than $100,000, more than $100,000, or right around $100,000? Less than $100,000..................................................................................1 => Q60A More than $100,000 ................................................................................2 => Q61 Right around $100,000............................................................................3 => Q62 Don't know .............................................................................................D => Q62 Refused................................................................................................... R => Q62

2008 Economic Impact of I-5 & I-90 Closures SESRC Data Report 08-016 Spring 2008
243
Q60A: Which range of cost was closest to what you think the loss was? Was it... LESS THAN $20,000 .............................................................................1 => Q62 OVER $20,000 UP TO $40,000..............................................................2 => Q62 OVER $40,000 UP TO $60,000..............................................................3 => Q62 OVER $60,000 UP TO $80,000..............................................................4 => Q62 OR OVER $80,000 UP TO $100,000 .....................................................5 => Q62 Over $100,000.........................................................................................6 => Q61 Don't know .............................................................................................D => Q62 Refused................................................................................................... R => Q62
Q61: Would you say this loss is less than $1,000,000 (one million), more than $1,000,000 (one million), or right around 1,000,000 (one million)? less than $1,000,000................................................................................1 => Q62 more than $1,000,000..............................................................................2 => Q61A right around $1,000,000 ..........................................................................3 => Q62 Don't know .............................................................................................D => Q62 Refused................................................................................................... R => Q62
Q61A: Which range of cost was closest to what you think the loss was? Was it... LESS THAN $200,000 ...........................................................................1 => Q62 OVER $200,000 UP TO $400,000..........................................................2 => Q62 OVER $400,000 UP TO $600,000..........................................................3 => Q62 OVER $600,000 UP TO $800,000..........................................................4 => Q62 OR OVER $800,000 UP TO $1,000,000 ................................................5 => Q62 Over $1,000,000......................................................................................6 => Q62 Don't know .............................................................................................D => Q62 Refused................................................................................................... R => Q62
Q61B: Which range of cost was closest to what you think the loss was? Was it... LESS THAN $1,200,000 (12 million) ....................................................1 OVER $1,200,000 UP TO $1,400,000....................................................2 OVER $1,400,000 UP TO $1,600,000....................................................3 OVER $1,600,000 UP TO $1,800,000....................................................4 OVER $1,800,000 UP TO $2,000,000....................................................5 OR OVER $2,000,000 ............................................................................6 Don't know .............................................................................................D Refused................................................................................................... R
Q62: Did you recover any of the additional costs due to the closure? Yes ..........................................................................................................1 No............................................................................................................2 => Q63 Don't know .............................................................................................D => Q63 Refused................................................................................................... R => Q63

2008 Economic Impact of I-5 & I-90 Closures SESRC Data Report 08-016 Spring 2008
244
Q62A: OVERTIME AND/OR OTHER EXPENSES FOR TRUCK DRIVERS Yes ..........................................................................................................1 No............................................................................................................2 Don't know .............................................................................................D Refused................................................................................................... R
Q62B: ADDITIONAL FUEL COSTS Yes ..........................................................................................................1 No............................................................................................................2 Don't know .............................................................................................D Refused................................................................................................... R
Q62C: ACQUIRING ADDITIONAL EQUIPMENT Yes ..........................................................................................................1 No............................................................................................................2 Don't know .............................................................................................D Refused................................................................................................... R
Q62D: PAYING A HIGHER RATE FOR EXPEDITED AND/OR GUARANTEED SERVICES Yes ..........................................................................................................1 No............................................................................................................2 Don't know .............................................................................................D Refused................................................................................................... R
Q62E: ADDITIONAL INVENTORY AND/OR STORAGE COSTS Yes ..........................................................................................................1 No............................................................................................................2 Don't know .............................................................................................D Refused................................................................................................... R
Q62F: OR OTHER Yes ..........................................................................................................1 No............................................................................................................2 Don't know .............................................................................................D Refused................................................................................................... R
Q63: Will your business make any capital or operating investments in 2008 to prevent future business disruptions due to potential closures of I-90 at Snoqualmie Pass? Yes ..........................................................................................................1 No............................................................................................................2 => Q64 Don't know .............................................................................................D => Q64 Refused................................................................................................... R => Q64

2008 Economic Impact of I-5 & I-90 Closures SESRC Data Report 08-016 Spring 2008
245
Q63A: What is the estimated cost associated with this I-90 transportation disruption prevention plan in 2008? $E 0 999999999 Don't know .............................................................................................D Refused................................................................................................... R
Q64: Please estimate the value of any lost sales your company experienced due to the I-90 closure. $E 0 999999999 No loss of sales .......................................................................................0 => Q67 Don't know .............................................................................................D => Q64A Refused................................................................................................... R => Q66C
Q64A: Since you don't know, can you estimate what range would fit the additional costs? Would you say this cost was less than $10,000, more than $10,000, or right around $10,000 dollars? => Q66C si Q64>0 Less than $10,000....................................................................................1 => Q64B More than $10,000 ..................................................................................2 => Q65 Right around $10,000..............................................................................3 => Q66C no loss of sales ........................................................................................4 => Q67 Don't know .............................................................................................D => Q68A Refused................................................................................................... R => Q68A
Q64B: Which range of cost was closest to what you think the loss was? Was it... LESS THAN $2,000 ...............................................................................1 => Q66C OVER $2,000 UP TO $4,000..................................................................2 => Q66C OVER $4,000 UP TO $6,000..................................................................3 => Q66C OVER $6,000 UP TO $8,000..................................................................4 => Q66C OR OVER $8,000 UP TO $10,000 .........................................................5 => Q66C Over $10,000...........................................................................................6 => Q65 Don't know .............................................................................................D => Q68A Refused................................................................................................... R => Q68A
Q65: Would you say this loss was less than $100,000, more than $100,000, or right around $100,000 dollars? less than $100,000...................................................................................1 => Q65A more than $100,000.................................................................................2 => Q66 right around $100,000 .............................................................................3 => Q66C Don't know .............................................................................................D => Q68A Refused................................................................................................... R => Q68A

2008 Economic Impact of I-5 & I-90 Closures SESRC Data Report 08-016 Spring 2008
246
Q65A: Which range of cost was closest to what you think the loss was? Was it... LESS THAN $20,000 .............................................................................1 => Q66C OVER $20,000 UP TO $40,000..............................................................2 => Q66C OVER $40,000 UP TO $60,000..............................................................3 => Q66C OVER $60,000 UP TO $80,000..............................................................4 => Q66C OR OVER $80,000 UP TO $100,000 .....................................................5 => Q66C Over $100,000.........................................................................................6 => Q66 Don't know .............................................................................................D => Q68A Refused................................................................................................... R => Q68A
Q66: Would you say this loss was less than $1,000,000 (one million), more than $1,000,000 (one million), or right around 1,000,000 (one million) dollars? Less than $1,000,000...............................................................................1 => Q66A More than $1,000,000 .............................................................................2 => Q66B Right around $1,000,000.........................................................................3 => Q66C Don't know .............................................................................................D => Q68A Refused................................................................................................... R => Q68A
Q66A: Which range of cost was closest to what you think the loss was? Was it... LESS THAN $200,000 ...........................................................................1 => Q66C OVER $200,000 UP TO $400,000..........................................................2 => Q66C OVER $400,000 UP TO $600,000..........................................................3 => Q66C OVER $600,000 UP TO $800,000..........................................................4 => Q66C OR OVER $800,000 UP TO $1,000,000 ................................................5 => Q66C Over $1,000,000......................................................................................6 => Q66C Don't know .............................................................................................D => Q68A Refused................................................................................................... R => Q68A
Q66B: Which range of cost was closest to what you think the loss was? Was it... LESS THAN $1,200,000 (12 million) ....................................................1 OVER $1,200,000 UP TO $1,400,000....................................................2 OVER $1,400,000 UP TO $1,600,000....................................................3 OVER $1,600,000 UP TO $1,800,000....................................................4 OVER $1,800,000 UP TO $2,000,000....................................................5 OR OVER $2,000,000 ............................................................................6 Don't know .............................................................................................D Refused................................................................................................... R
Q66C: How did you estimate that amount? $R.2 000.00 100.00 Comments ...............................................................................................1 O => Q68A No comments ..........................................................................................2 => Q68A Don't know .............................................................................................D => Q68A Refused................................................................................................... R => Q68A

2008 Economic Impact of I-5 & I-90 Closures SESRC Data Report 08-016 Spring 2008
247
Q67: Why did your business NOT have any loss of sales or business opportunities? Comments ...............................................................................................1 O => Q71 No comments ..........................................................................................2 => Q71 Don't know .............................................................................................D => Q71 Refused................................................................................................... R => Q71
Q68A: What percentage of your company's total annual revenues does this LOSS represent? $R.2 000.00 100.00 Don't know .............................................................................................D Refused................................................................................................... R
Q68B: What percentage of your company's total lost sales due to the I-90 closure occurred in January and February 2008? $R.2 000.00 100.00 Don't know .............................................................................................D Refused................................................................................................... R
Q69A: Do you anticipate ongoing lost sales in the future due to the January 29 to February 1 I-90 closure? Yes ..........................................................................................................1 No............................................................................................................2 => Q71 Don't know .............................................................................................D => Q71 Refused................................................................................................... R => Q71
Q69B: What is your best estimate of on-going lost sales per month? $E 0 999999999 Don't know .............................................................................................D Refused................................................................................................... R
Q70: For how long do you anticipate this ongoing lost sales will continue? (IWR: Units are days, weeks, and months on the next question. Please check units on next question.) $E 0 999 Don't know .............................................................................................D => Q71 Refused................................................................................................... R => Q71
Q70A: (IWR: check units--Number of) => Q71 si Q70==0 Days ........................................................................................................1 Weeks......................................................................................................2 Months ....................................................................................................3 Years .......................................................................................................4

2008 Economic Impact of I-5 & I-90 Closures SESRC Data Report 08-016 Spring 2008
248
Q71: We only have a couple questions left. First, what are the total annual sales (revenue) for your business in Washington State? $E 0 999999999 Don't know .............................................................................................D => Q71A Refused................................................................................................... R => Q74
Q71A: Since you don't know, can you estimate what range would fit your company's total annual sales (revenue) ? Would you say it was less than $10,000, more than $10,000, or right around $10,000 dollars? => Q74 si Q71>=0 Less than $10,000....................................................................................1 => Q71B More than $10,000 ..................................................................................2 => Q72 Right around $10,000..............................................................................3 => Q74 Don't know .............................................................................................D => Q74 Refused................................................................................................... R => Q74
Q71B: Which range of total annual sales (revenue) was closest to what you think it was? Was it... LESS THAN $2,000 ...............................................................................1 => Q74 OVER $2,000 UP TO $4,000..................................................................2 => Q74 OVER $4,000 UP TO $6,000..................................................................3 => Q74 OVER $6,000 UP TO $8,000..................................................................4 => Q74 OR OVER $8,000 UP TO $10,000 .........................................................5 => Q74 Over $10,000...........................................................................................6 => Q72 Don't know .............................................................................................D => Q74 Refused................................................................................................... R => Q74
Q72: Would you say your total annual sales (revenue) was less than $100,000, more than $100,000, or right around $100,000 dollars? Less than $100,000..................................................................................1 => Q72A More than $100,000 ................................................................................2 => Q73 Right around $100,000............................................................................3 => Q74 Don't know .............................................................................................D => Q74 Refused................................................................................................... R => Q74
Q72A: Which range of total annual sales (revenue) was closest to what you think it was? Was it... LESS THAN $20,000 .............................................................................1 => Q74 OVER $20,000 UP TO $40,000..............................................................2 => Q74 OVER $40,000 UP TO $60,000..............................................................3 => Q74 OVER $60,000 UP TO $80,000..............................................................4 => Q74 OR OVER $80,000 UP TO $100,000 .....................................................5 => Q74 Over $100,000.........................................................................................6 => Q73 Don't know .............................................................................................D => Q74 Refused................................................................................................... R => Q74
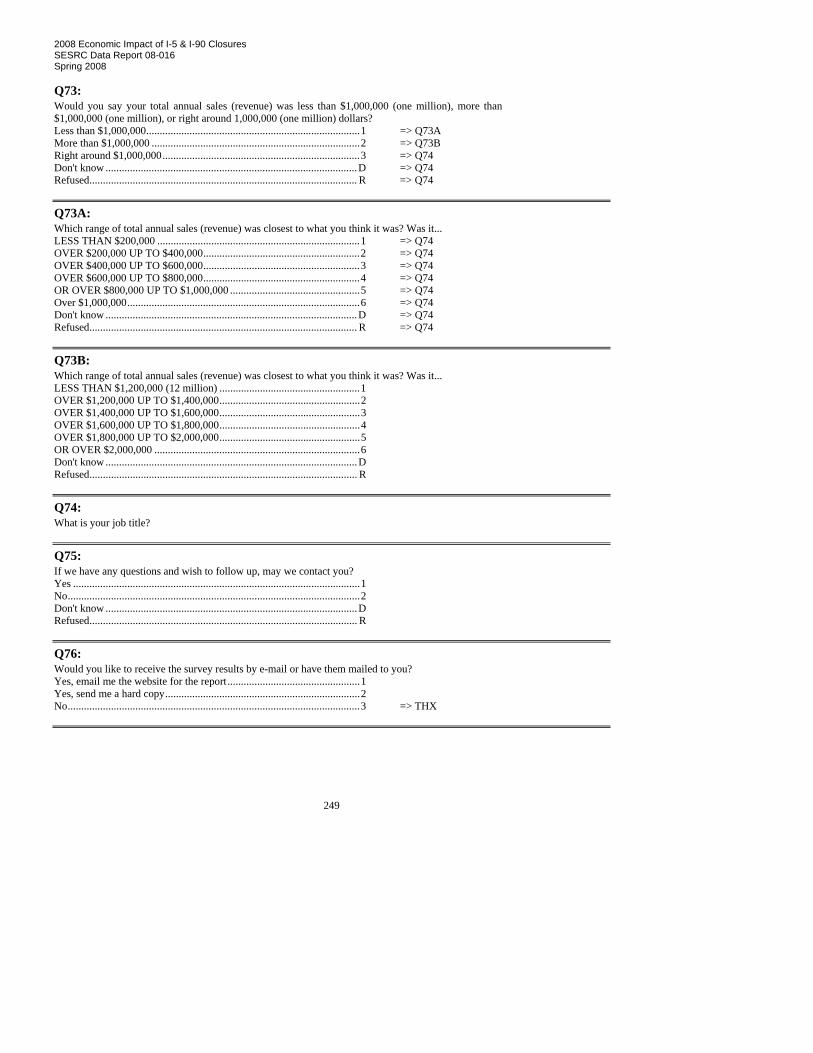
2008 Economic Impact of I-5 & I-90 Closures SESRC Data Report 08-016 Spring 2008
249
Q73: Would you say your total annual sales (revenue) was less than $1,000,000 (one million), more than $1,000,000 (one million), or right around 1,000,000 (one million) dollars? Less than $1,000,000...............................................................................1 => Q73A More than $1,000,000 .............................................................................2 => Q73B Right around $1,000,000.........................................................................3 => Q74 Don't know .............................................................................................D => Q74 Refused................................................................................................... R => Q74
Q73A: Which range of total annual sales (revenue) was closest to what you think it was? Was it... LESS THAN $200,000 ...........................................................................1 => Q74 OVER $200,000 UP TO $400,000..........................................................2 => Q74 OVER $400,000 UP TO $600,000..........................................................3 => Q74 OVER $600,000 UP TO $800,000..........................................................4 => Q74 OR OVER $800,000 UP TO $1,000,000 ................................................5 => Q74 Over $1,000,000......................................................................................6 => Q74 Don't know .............................................................................................D => Q74 Refused................................................................................................... R => Q74
Q73B: Which range of total annual sales (revenue) was closest to what you think it was? Was it... LESS THAN $1,200,000 (12 million) ....................................................1 OVER $1,200,000 UP TO $1,400,000....................................................2 OVER $1,400,000 UP TO $1,600,000....................................................3 OVER $1,600,000 UP TO $1,800,000....................................................4 OVER $1,800,000 UP TO $2,000,000....................................................5 OR OVER $2,000,000 ............................................................................6 Don't know .............................................................................................D Refused................................................................................................... R
Q74: What is your job title?
Q75: If we have any questions and wish to follow up, may we contact you? Yes ..........................................................................................................1 No............................................................................................................2 Don't know .............................................................................................D Refused................................................................................................... R
Q76: Would you like to receive the survey results by e-mail or have them mailed to you? Yes, email me the website for the report.................................................1 Yes, send me a hard copy........................................................................2 No............................................................................................................3 => THX

2008 Economic Impact of I-5 & I-90 Closures SESRC Data Report 08-016 Spring 2008
250
Q76A: Email: => THX si Q76=3
Q76B: Name:
Q76C: Telephone:
Q76D: Address:
Q76E: City
Q76F: State:
Q76G: Zip code:
THX: That's my last question. I really want to thank you for the time you have spent with me today. If you have any additional comments, I can note them now. Yes, comments ........................................................................................1 O No comments ..........................................................................................2
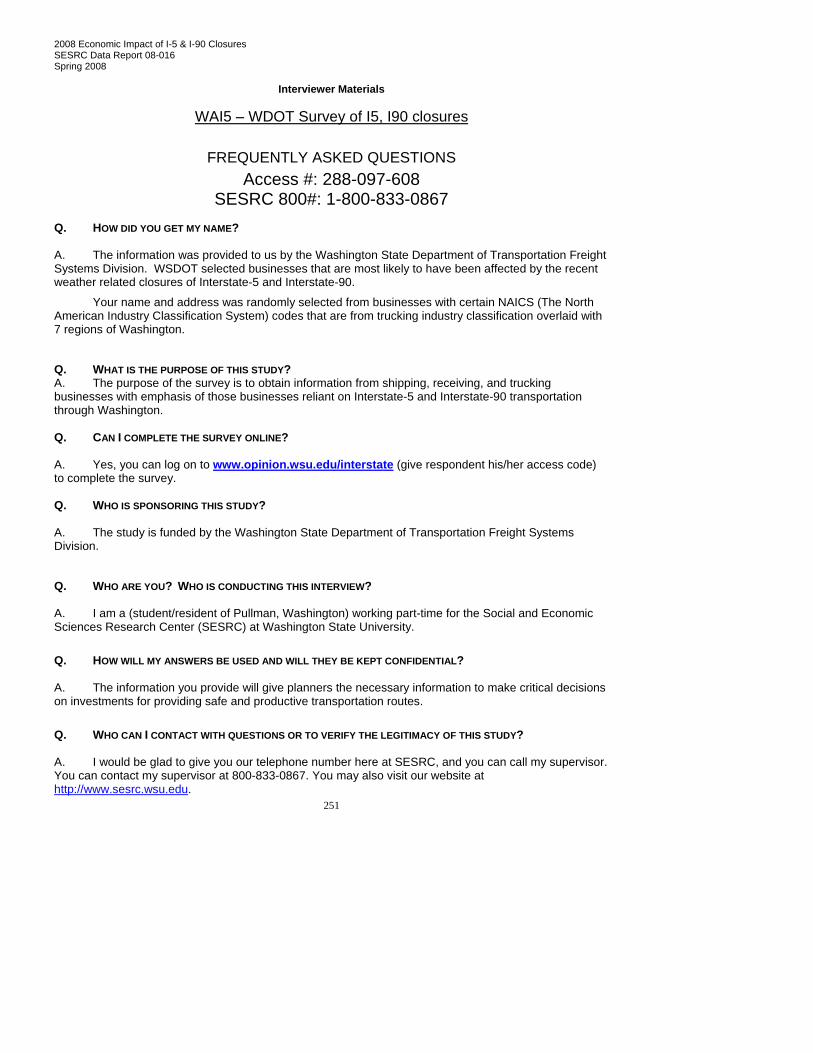
2008 Economic Impact of I-5 & I-90 Closures SESRC Data Report 08-016 Spring 2008
251
Interviewer Materials
WAI5 – WDOT Survey of I5, I90 closures
FREQUENTLY ASKED QUESTIONS Access #: 288-097-608
SESRC 800#: 1-800-833-0867 Q. HOW DID YOU GET MY NAME? A. The information was provided to us by the Washington State Department of Transportation Freight Systems Division. WSDOT selected businesses that are most likely to have been affected by the recent weather related closures of Interstate-5 and Interstate-90.
Your name and address was randomly selected from businesses with certain NAICS (The North American Industry Classification System) codes that are from trucking industry classification overlaid with 7 regions of Washington.
Q. WHAT IS THE PURPOSE OF THIS STUDY? A. The purpose of the survey is to obtain information from shipping, receiving, and trucking businesses with emphasis of those businesses reliant on Interstate-5 and Interstate-90 transportation through Washington. Q. CAN I COMPLETE THE SURVEY ONLINE? A. Yes, you can log on to www.opinion.wsu.edu/interstate (give respondent his/her access code) to complete the survey. Q. WHO IS SPONSORING THIS STUDY? A. The study is funded by the Washington State Department of Transportation Freight Systems Division.
Q. WHO ARE YOU? WHO IS CONDUCTING THIS INTERVIEW? A. I am a (student/resident of Pullman, Washington) working part-time for the Social and Economic Sciences Research Center (SESRC) at Washington State University.
Q. HOW WILL MY ANSWERS BE USED AND WILL THEY BE KEPT CONFIDENTIAL? A. The information you provide will give planners the necessary information to make critical decisions on investments for providing safe and productive transportation routes.
Q. WHO CAN I CONTACT WITH QUESTIONS OR TO VERIFY THE LEGITIMACY OF THIS STUDY? A. I would be glad to give you our telephone number here at SESRC, and you can call my supervisor. You can contact my supervisor at 800-833-0867. You may also visit our website at http://www.sesrc.wsu.edu.

2008 Economic Impact of I-5 & I-90 Closures SESRC Data Report 08-016 Spring 2008
252
IF R ASKS FOR A NAME OF SUPERVISOR
My supervisor’s name is.... (Ryan Paulson, Tony Hernandez, or Jessie Aguilar) The Study Director is Yi Jen Wang and she can be reached at 800-833-0867 or
[email protected]. Barbara Ivanov at the Washington State Department of Transportation Freight Systems Division can be reached at 360-705-7932 or [email protected].
Q. WHO CAN I CONTACT ABOUT MY RIGHTS? A. If you have any questions concerning your rights about participating in this project, please contact
509-335-3668 and ask for the IRB Coordinator or email [email protected]. Please refer to IRB number 10246.
Q. IS THIS CONFIDENTIAL? A. Yes. Your responses for the business will only be reported in aggregate along with other people’s
responses in any reports. Also, because we conduct many surveys maintaining confidentiality is extremely important to the success of our research center. Therefore, we are very careful to protect your privacy.
Q. R IS REGISTERED ON THE DO NOT CALL LIST
A. The Do Not Call list applies to sales or telemarketing calls only. We are not selling anything and our sole purpose for calling is to conduct a survey to gather information and opinions for decision makers. Your opinions are extremely valuable and we would really appreciate your help with this project.
Q. CAN I GET A COPY OF THE RESULTS? A. Yes. I can take your name and address at the end of the interview so we can send you a copy of
the results when they are ready.

2008 Economic Impact of I-5 & I-90 Closures SESRC Data Report 08-016 Spring 2008
253
Procedures when calling on WAI5 Possible duplicate cases: There are some possible duplicates in the sample. Several companies have been selected but for different sites. As we call through the fresh sample and come upon these cases Transferred to a Corporate or National Office: While calling if you are transferred or give the number for a National or Corporate Office you need to note the new number and then call the Corporate office. When you call you need to make sure the person whom you speak to know you are calling about a specific Company located in a specific town or region. If the person is unwilling to give interview for all companies located in different regions, ask for the most impacted region and see if they want to do another survey for another region. Be sure to put in note which region R is doing interview for. Leaving message with secretaries or receptionist When you leave a message with a secretary or receptionist leave an F9 note who you left the message with and then code the case as a WB. Partial Complete with a web intent There is a new code “PW” this is used when someone starts the interview but then decides to complete the survey on-line. F9 notes Make sure you leave detailed F9 notes on current status of case for the next interviewer. This helps the next person (which could be you) be better prepared to complete the survey. Closure dates Periods of closed days in the survey are just used as references to help respondents recall impacts of the events. The impact is beyond the closed days therefore we are asking the impacts overall not just during those closure dates.

2008 Economic Impact of I-5 & I-90 Closures SESRC Data Report 08-016 Spring 2008
Appendix A. Human Subjects Approval
MEMORANDUM TO: DANNA MOORE, FROM: Malathi Jandhyala (for) Kris Miller, Chair, WSU Institutional Review Board (3005) DATE: 2/6/2008 SUBJECT: Certification of Exemption, IRB Number 10246-001 Based on the Exemption Determination Application submitted for the study titled Economic Impact of I-5 Closure on Shipping, Freight, and Trucking Businesses - 2008 (WAI5), and assigned IRB # 10246, the WSU Institutional Review Board has determined that the study satisfies the criteria for Exempt Research contained in 45CFR 46. Exempt certification does not relieve the investigator from the responsibility of providing continuing attention to protection of human subjects participating in the study and adherence to ethical standards for research involving human participants. This certification is valid only for the study protocol as it was submitted to the IRB. Studies certified as Exempt are not subject to annual review. If any changes are made to the study protocol, you must submit the changes to the IRB for determination that the study remains Exempt before implementing the changes. Request for Amendment forms are available online at http://www.irb.wsu.edu/forms.asp. In accordance with federal regulations, this Certification of Exemption and a copy of the study protocol identified by this certification must be kept by the principal investigator for THREE years following completion of the project. It is important to note that certification of exemption is not approval by the IRB. The study materials should not include the statement that the WSU IRB has reviewed and approved the study for human subject participation. Washington State University is covered under Human Subjects Assurance Number FWA00002946 which is on file with the Office for Human Research Protections.
If you have questions, please contact the Institutional Review Board at (509) 335-3668 . Any revised materials
can be mailed to the Office of Research Assurances (Campus Zip 3005), faxed to (509) 335-6410 , or in some cases by electronic mail, to [email protected]. Review Type: New Protocol Review Category: Exempt Date Received: 2/5/2008 Exemption Category: 45 CFR 46.101 (b)(2) OGRD No.: N/A Funding Agency: Barbara Ivanov (Freight Systems Div., WSDOT) You have received this notification as you are referenced on a document within the MyResearch.wsu.edu system. You can change how you receive notifications by visiting https://MyResearch.wsu.edu/MyPreferences.aspx Please Note: This notification will not show other recipients as their notification preferences require separate delivery.
254

2008 Economic Impact of I-5 & I-90 Closures SESRC Data Report 08-016 Spring 2008 MEMORANDUM TO: DANNA MOORE FROM: Patrick Conner (for) Kris Miller, Chair, WSU Institutional Review Board (3005) DATE: 2/27/2008 SUBJECT: Review of Protocol Modification Request,IRB Number #10246-002 Your proposal to amend the protocol titled "Economic Impact of I-5 Closure on Shipping, Freight, and Trucking Businesses - 2008 (WAI5)", IRB Number 10246-002 was reviewed for the protection of the subjects participating in the study. Based on the information received from you, the IRB has approved your amendment request on 2/27/2008. This amendment includes Change of sample population from area businesses to trucking companies and freight-dependent companies that own commercial trucks. Identifying information will also be turned over to the WSDOT. IRB approval indicates that the amendments described to the previously approved study protocol do not alter the exemption status of the previously certified application. This approval does not relieve the investigator from the responsibility of providing continuing attention to ethical considerations involved in the utilization of subjects participating in the study. It is important to note that this approval is for the amended research protocol, and does not alter the existing continuing review schedule. If any more changes are made to the study protocol you must notify the IRB and receive approval before implementation.
If you have questions, please contact the Institutional Review Board at (509) 335-3668 . Any revised materials
can be mailed to Office of Research Assurances (Campus Zip 3005), faxed to (509) 335-6410 , or in some cases by electronic mail, to [email protected]. Review Type: Exempt Review Category: Exempt Date Received: 2/25/2008 OGRD No.: N/A Agency: N/A Thank You, Institutional Review Board Patrick Conner Office of Research Assurances PO Box 643005 Pullman, WA 99164-3005
Phone: (509) 335-7195 Fax:(509) 335-6410 [email protected] You have received this notification as you are referenced on a document within the MyResearch.wsu.edu system. You can change how you receive notifications by visiting https://MyResearch.wsu.edu/MyPreferences.aspx Please Note: This notification will not show other recipients as their notification preferences require separate delivery.
255

2008 Economic Impact of I-5 & I-90 Closures SESRC Data Report 08-016 Spring 2008
Social & Economic Sciences Research Center Washington State University
P.O. Box 644014 Pullman, Washington 99164-4014
Telephone: (509) 335-1511 Fax: (509) 335-0116 http://www.sesrc.wsu.edu