2008 _ harris county _ crosby isd _ 2008 texas school survey of drug and alcohol use _ elementary...
Upload: texas-school-survey-of-drug-and-alcohol-use-elementary-reports
Post on 14-Apr-2018
214 views
TRANSCRIPT

7/30/2019 2008 _ harris county _ crosby isd _ 2008 texas school survey of drug and alcohol use _ elementary report
http://slidepdf.com/reader/full/2008-harris-county-crosby-isd-2008-texas-school-survey-of-drug-and-alcohol 1/40
La Porte
Spring 2008
Table T-1: How recently, if ever, have you used...
Ever
Used
School
Year
Not Past
Year
Never
Used
Any tobacco product
All 9.6% 5.1% 4.5% 90.4%
Grade 4 3.8% 2.3% 1.5% 96.2%
Grade 5 8.2% 3.5% 4.7% 91.8%
Grade 6 14.7% 8.1% 6.6% 85.3%
Cigarettes
All 7.3% 3.8% 3.6% 92.7%
Grade 4 1.9% 1.3% 0.6% 98.1%
Grade 5 5.7% 2.3% 3.5% 94.3%
Grade 6 12.3% 6.6% 5.7% 87.7%
Smokeless tobacco
All 3.7% 2.0% 1.7% 96.3%
Grade 4 2.8% 1.5% 1.3% 97.2%
Grade 5 3.9% 1.9% 2.1% 96.1%Grade 6 4.2% 2.3% 1.8% 95.8%
Table T-2: Average number of times selected tobacco products were used by thosewho reported use of ..
School
Year Lifetime
All 3.6 3.6
Grade 4 3.1 1.5
Grade 5 2.0 2.6Grade 6 4.0 4.1
Elementary Report-Page

7/30/2019 2008 _ harris county _ crosby isd _ 2008 texas school survey of drug and alcohol use _ elementary report
http://slidepdf.com/reader/full/2008-harris-county-crosby-isd-2008-texas-school-survey-of-drug-and-alcohol 2/40
La Porte
Spring 2008
Table T-3: Average age of first use of tobacco:
Grade 4 Grade 5 Grade 6
Cigarettes
8.0 8.7 9.5
Smokeless Tobacco
8.6 9.1 9.3
Any Tobacco
8.3 8.7 9.4
Table T-4: Age of first use of tobacco by family situation:
Never Under 8 8 9 10 11 Over 11
Two Parent Family
All 93.0% 1.5% 0.9% 1.2% 1.4% 1.4% 0.5%
Grade 4 97.6% 1.0% 0.7% 0.7% 0.0% 0.0% 0.0%
Grade 5 93.4% 1.7% 0.3% 1.0% 2.1% 1.4% 0.0%
Grade 6 89.5% 1.8% 1.4% 1.8% 2.0% 2.4% 1.2%
Other Family Situation
All 85.6% 4.4% 1.7% 1.8% 3.8% 1.3% 1.4%
Grade 4 91.5% 3.0% 1.2% 1.2% 3.0% 0.0% 0.0%
Grade 5 90.2% 3.8% 2.2% 1.1% 2.7% 0.0% 0.0%
Grade 6 78.4% 5.7% 1.7% 2.7% 5.1% 3.0% 3.4%
Table T-5: About how many of your close friends use ...
NeverHeard Of None Some Most
Any tobacco product?
All 2.2% 79.2% 17.2% 1.3%
Grade 4 4.3% 85.9% 8.7% 1.1%
Grade 5 2.1% 81.2% 16.3% 0.4%
Grade 6 0.9% 73.2% 23.9% 2.1%
Cigarettes?
All 3.7% 80.1% 15.1% 1.1%
Grade 4 7.7% 84.5% 6.8% 1.1%
Grade 5 2.8% 83.1% 13.9% 0.2%
Grade 6 1.5% 75.0% 21.8% 1.7%
Smokeless tobacco?All 5.1% 87.5% 7.2% 0.2%
Grade 4 11.4% 84.5% 4.1% 0.0%
Grade 5 3.4% 88.6% 7.7% 0.2%
Grade 6 1.9% 88.8% 9.0% 0.4%
Elementary Report-Page

7/30/2019 2008 _ harris county _ crosby isd _ 2008 texas school survey of drug and alcohol use _ elementary report
http://slidepdf.com/reader/full/2008-harris-county-crosby-isd-2008-texas-school-survey-of-drug-and-alcohol 3/40
La Porte
Spring 2008
Table T-6: Have you ever been offered ...
Never
Heard Of Yes No
Any tobacco product?
All 2.6% 19.2% 78.2%
Grade 4 5.9% 10.8% 83.3%
Grade 5 2.5% 17.2% 80.3%
Grade 6 0.4% 26.5% 73.2%
Cigarettes?
All 3.2% 16.7% 80.1%
Grade 4 7.7% 8.3% 84.0%
Grade 5 2.8% 15.0% 82.2%
Grade 6 0.4% 23.6% 76.1%
Smokeless tobacco?
All 5.5% 8.2% 86.4%
Grade 4 12.0% 5.7% 82.3%
Grade 5 3.9% 8.3% 87.8%
Grade 6 2.0% 9.8% 88.2%
Table T-7: How dangerous do you think it is for kids your age to use ...
Never
Heard Of
Very
Dangerous Dangerous
Not at All
Dangerous Do Not Know
Any tobacco product?
All 1.4% 75.7% 18.5% 0.9% 3.4%
Grade 4 3.3% 76.9% 13.9% 0.9% 5.1%
Grade 5 1.2% 79.2% 16.4% 0.2% 2.9%
Grade 6 0.3% 72.4% 23.3% 1.4% 2.7%
Cigarettes?
All 2.3% 66.7% 25.5% 1.3% 4.2%
Grade 4 5.8% 67.2% 19.7% 0.9% 6.4%
Grade 5 1.3% 72.0% 22.5% 0.4% 3.8%
Grade 6 0.6% 62.6% 31.6% 2.2% 2.9%
Smokeless tobacco?
All 3.3% 67.1% 21.8% 1.8% 6.1%
Grade 4 8.0% 66.2% 17.7% 1.6% 6.4%
Grade 5 2.8% 69.2% 21.2% 1.3% 5.5%
Grade 6 0.5% 66.2% 24.9% 2.2% 6.2%
Elementary Report-Page

7/30/2019 2008 _ harris county _ crosby isd _ 2008 texas school survey of drug and alcohol use _ elementary report
http://slidepdf.com/reader/full/2008-harris-county-crosby-isd-2008-texas-school-survey-of-drug-and-alcohol 4/40
La Porte
Spring 2008
Table T-8: How do your parents feel about kids your age smoking cigarettes?
Don't Like Don't Care Think It's OK Don't know
All 86.8% 2.0% 0.4% 10.8%
Grade 4 88.8% 0.9% 0.9% 9.5%
Grade 5 86.6% 2.3% 0.2% 10.9%
Grade 6 85.5% 2.6% 0.3% 11.7%
Elementary Report-Page

7/30/2019 2008 _ harris county _ crosby isd _ 2008 texas school survey of drug and alcohol use _ elementary report
http://slidepdf.com/reader/full/2008-harris-county-crosby-isd-2008-texas-school-survey-of-drug-and-alcohol 5/40
La Porte
Spring 2008
Table A-1: How recently, if ever, have you used..
Ever
Used
School
Year
Not Past
Year
Never
Used
Any alcohol product
All 34.0% 20.6% 13.5% 66.0%
Grade 4 17.9% 10.0% 7.9% 82.1%
Grade 5 35.5% 20.9% 14.5% 64.5%
Grade 6 44.5% 27.8% 16.7% 55.5%
Beer
All 22.6% 12.5% 10.1% 77.4%
Grade 4 12.9% 6.9% 6.0% 87.1%
Grade 5 24.4% 11.6% 12.8% 75.6%
Grade 6 28.2% 17.0% 11.2% 71.8%
Wine coolers
All 15.5% 10.0% 5.5% 84.5%
Grade 4 4.1% 3.0% 1.1% 95.9%
Grade 5 13.7% 9.1% 4.6% 86.3%
Grade 6 24.7% 15.5% 9.2% 75.3%Wine
All 18.9% 9.5% 9.4% 81.1%
Grade 4 9.3% 4.3% 5.0% 90.7%
Grade 5 19.0% 10.6% 8.3% 81.0%
Grade 6 25.7% 12.3% 13.3% 74.3%
Liquor
All 11.1% 6.6% 4.6% 88.9%
Grade 4 3.5% 1.7% 1.7% 96.5%
Grade 5 9.7% 5.0% 4.8% 90.3%
Grade 6 17.4% 11.0% 6.4% 82.6%
Elementary Report-Page

7/30/2019 2008 _ harris county _ crosby isd _ 2008 texas school survey of drug and alcohol use _ elementary report
http://slidepdf.com/reader/full/2008-harris-county-crosby-isd-2008-texas-school-survey-of-drug-and-alcohol 6/40
La Porte
Spring 2008
Table A-2: Average number of times selected alcohol products were used by thosewho reported use of ..
School
Year Lifetime
Beer
All 2.9 3.2
Grade 4 3.2 3.2
Grade 5 2.7 2.8
Grade 6 2.8 3.5
Liquor
All 3.6 3.5
Grade 4 4.5 3.2
Grade 5 2.5 2.3
Grade 6 3.8 4.0
Wine
All 2.6 2.8
Grade 4 2.2 2.6
Grade 5 2.9 3.0Grade 6 2.5 2.7
Elementary Report-Page

7/30/2019 2008 _ harris county _ crosby isd _ 2008 texas school survey of drug and alcohol use _ elementary report
http://slidepdf.com/reader/full/2008-harris-county-crosby-isd-2008-texas-school-survey-of-drug-and-alcohol 7/40
La Porte
Spring 2008
Table A-3: In the past year, how many times have you had two or more drinks at one time of ..
Never 1 Time 2 Times 3+ Times Ever
Beer?
All 83.4% 9.3% 3.4% 3.9% 16.6%
Grade 4 88.2% 7.1% 2.2% 2.4% 11.8%
Grade 5 85.4% 7.8% 3.3% 3.5% 14.6%
Grade 6 78.6% 11.9% 4.3% 5.2% 21.4%
Wine Coolers?
All 89.1% 5.3% 2.9% 2.7% 10.9%
Grade 4 95.8% 1.9% 1.2% 1.2% 4.2%
Grade 5 91.7% 4.9% 1.8% 1.6% 8.3%
Grade 6 82.9% 7.8% 4.7% 4.5% 17.1%
Wine?
All 84.5% 8.4% 3.8% 3.3% 15.5%
Grade 4 89.6% 5.8% 2.3% 2.3% 10.4%
Grade 5 85.8% 7.4% 3.4% 3.4% 14.2%
Grade 6 80.1% 10.9% 5.1% 3.9% 19.9%
Liquor?All 91.3% 4.4% 1.8% 2.4% 8.7%
Grade 4 96.5% 2.1% 1.2% 0.2% 3.5%
Grade 5 93.6% 4.2% 0.7% 1.5% 6.4%
Grade 6 86.2% 6.2% 3.1% 4.5% 13.8%
Elementary Report-Page

7/30/2019 2008 _ harris county _ crosby isd _ 2008 texas school survey of drug and alcohol use _ elementary report
http://slidepdf.com/reader/full/2008-harris-county-crosby-isd-2008-texas-school-survey-of-drug-and-alcohol 8/40
La Porte
Spring 2008
Table A-4: Average age of first use of alcohol:
Grade 4 Grade 5 Grade 6
Beer
8.0 8.6 9.3
Wine Coolers
8.1 9.2 9.8
Wine
8.1 9.2 9.7
Liquor
8.9 9.3 10.2
Any Alcohol
8.0 8.7 9.2
Table A-5: Age of first use of alcohol by family situation:
Never Under 8 8 9 10 11 Over 11
Two Parent Family
All 70.0% 8.7% 3.3% 5.3% 7.0% 5.2% 0.5%
Grade 4 84.3% 8.4% 3.5% 2.8% 1.0% 0.0% 0.0%
Grade 5 69.8% 8.7% 4.2% 5.2% 8.3% 3.8% 0.0%
Grade 6 60.2% 8.9% 2.6% 7.1% 10.3% 9.7% 1.2%
Other Family Situation
All 59.5% 13.7% 6.1% 7.0% 6.3% 6.0% 1.4%
Grade 4 76.5% 11.1% 3.1% 5.6% 3.7% 0.0% 0.0%
Grade 5 58.9% 15.1% 7.6% 5.9% 7.6% 4.3% 0.5%
Grade 6 48.3% 14.5% 7.1% 8.8% 7.1% 11.1% 3.0%
Table A-6 : Lifetime prevalence of use of alcohol by reported conduct problemsthis school year:
No Absences
or Conduct
Problems Cut School
Sent to
Principal Both
26.8% 66.2% 54.9% 73.2%
Elementary Report-Page
7/30/2019 2008 _ harris county _ crosby isd _ 2008 texas school survey of drug and alcohol use _ elementary report
http://slidepdf.com/reader/full/2008-harris-county-crosby-isd-2008-texas-school-survey-of-drug-and-alcohol 9/40
La Porte
Spring 2008
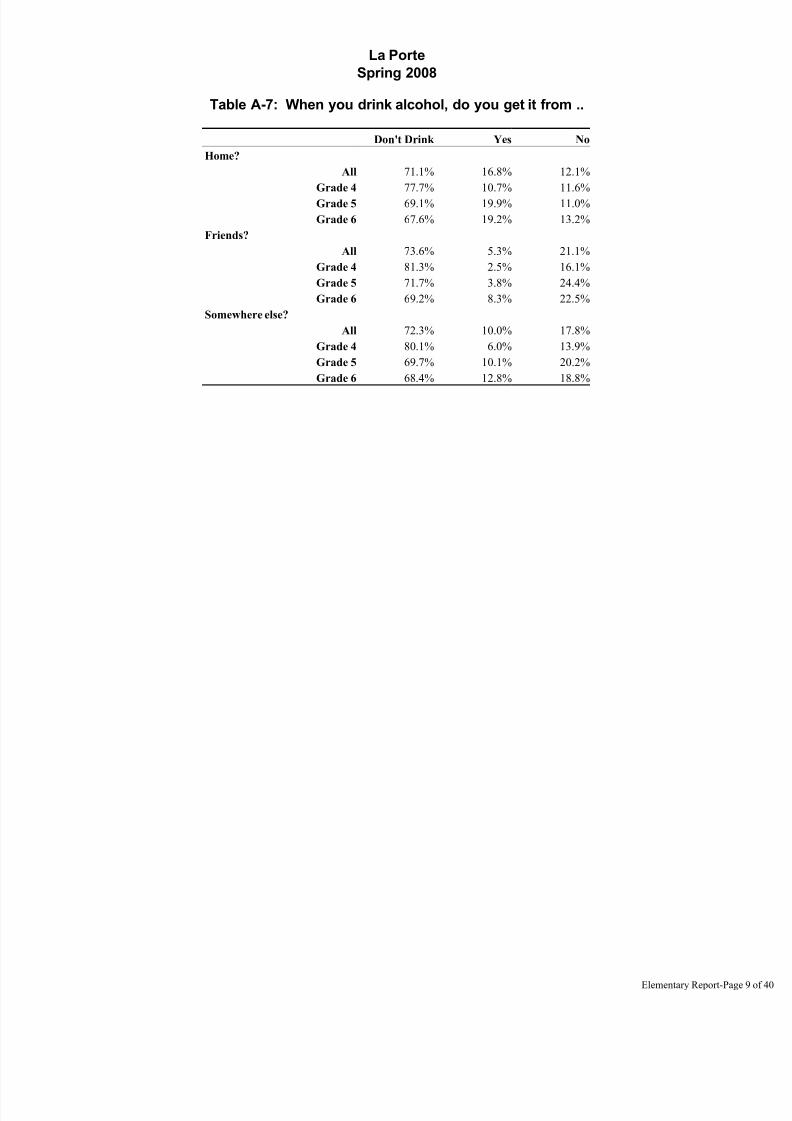
Table A-7: When you drink alcohol, do you get it from ..
Don't Drink Yes No
Home?
All 71.1% 16.8% 12.1%
Grade 4 77.7% 10.7% 11.6%
Grade 5 69.1% 19.9% 11.0%
Grade 6 67.6% 19.2% 13.2%
Friends?
All 73.6% 5.3% 21.1%
Grade 4 81.3% 2.5% 16.1%
Grade 5 71.7% 3.8% 24.4%
Grade 6 69.2% 8.3% 22.5%
Somewhere else?
All 72.3% 10.0% 17.8%
Grade 4 80.1% 6.0% 13.9%
Grade 5 69.7% 10.1% 20.2%
Grade 6 68.4% 12.8% 18.8%
Elementary Report-Page

7/30/2019 2008 _ harris county _ crosby isd _ 2008 texas school survey of drug and alcohol use _ elementary report
http://slidepdf.com/reader/full/2008-harris-county-crosby-isd-2008-texas-school-survey-of-drug-and-alcohol 10/40
La Porte
Spring 2008
Table A-8: About how many of your close friends use ..
Never
Heard Of None Some Most
Any alcohol product?
All 1.7% 67.9% 24.6% 5.9%
Grade 4 2.9% 78.4% 15.6% 3.1%
Grade 5 1.9% 66.3% 27.4% 4.4%
Grade 6 0.7% 61.6% 28.8% 8.8%
Beer?
All 1.8% 74.3% 20.1% 3.8%
Grade 4 3.2% 82.4% 11.8% 2.7%
Grade 5 2.0% 73.1% 22.7% 2.2%
Grade 6 0.6% 69.4% 24.3% 5.6%
Wine coolers?
All 10.9% 75.3% 11.5% 2.3%
Grade 4 18.6% 76.1% 4.5% 0.7%
Grade 5 12.9% 74.2% 11.6% 1.3%
Grade 6 4.3% 75.3% 16.2% 4.2%Wine?
All 2.8% 81.2% 13.4% 2.6%
Grade 4 5.2% 85.5% 8.4% 0.9%
Grade 5 2.9% 79.3% 15.4% 2.4%
Grade 6 1.0% 79.4% 15.6% 3.9%
Liquor?
All 7.1% 81.7% 10.2% 1.0%
Grade 4 15.0% 81.8% 3.2% 0.0%
Grade 5 6.6% 82.2% 11.0% 0.2%
Grade 6 2.1% 81.3% 14.3% 2.3%
Elementary Report-Page

7/30/2019 2008 _ harris county _ crosby isd _ 2008 texas school survey of drug and alcohol use _ elementary report
http://slidepdf.com/reader/full/2008-harris-county-crosby-isd-2008-texas-school-survey-of-drug-and-alcohol 11/40
La Porte
Spring 2008
Table A-9: Have you ever been offered ..
Never
Heard Of Yes No
Any alcohol product?
All 1.6% 33.5% 65.0%
Grade 4 4.0% 22.6% 73.4%
Grade 5 1.3% 32.4% 66.3%
Grade 6 0.1% 41.7% 58.2%
Beer?
All 1.7% 25.5% 72.9%
Grade 4 3.8% 17.4% 78.8%
Grade 5 1.8% 25.5% 72.7%
Grade 6 0.1% 31.0% 68.9%
Wine coolers?
All 10.4% 13.5% 76.1%
Grade 4 18.0% 5.7% 76.3%
Grade 5 12.2% 11.5% 76.3%
Grade 6 4.1% 20.1% 75.8%Wine?
All 2.9% 16.6% 80.5%
Grade 4 6.1% 9.8% 84.1%
Grade 5 2.7% 16.0% 81.3%
Grade 6 0.8% 21.7% 77.6%
Liquor?
All 6.3% 10.6% 83.1%
Grade 4 15.3% 3.7% 81.0%
Grade 5 5.1% 9.1% 85.9%
Grade 6 1.0% 16.3% 82.7%
Elementary Report-Page

7/30/2019 2008 _ harris county _ crosby isd _ 2008 texas school survey of drug and alcohol use _ elementary report
http://slidepdf.com/reader/full/2008-harris-county-crosby-isd-2008-texas-school-survey-of-drug-and-alcohol 12/40
La Porte
Spring 2008
Table A-10: How do your parents feel about kids your age drinking beer?
Don't Like Don't Care Think It's OK Don't know
All 77.7% 4.6% 2.1% 15.5%
Grade 4 81.7% 3.3% 1.5% 13.5%
Grade 5 77.1% 4.4% 1.9% 16.6%
Grade 6 75.3% 5.7% 2.8% 16.2%
Table A-11: How dangerous do you think it is for kids your age to use ..
Never
Heard Of
Very
Dangerous Dangerous
Not at All
Dangerous Do Not Know
Any alcohol product?
All 0.9% 70.3% 21.7% 3.2% 3.9%
Grade 4 2.0% 74.9% 15.6% 2.4% 5.1%
Grade 5 0.6% 70.8% 23.8% 2.1% 2.7%
Grade 6 0.4% 66.6% 24.5% 4.6% 3.9%Beer?
All 0.8% 50.8% 33.5% 7.5% 7.4%
Grade 4 1.8% 55.6% 28.3% 5.9% 8.4%
Grade 5 0.9% 50.9% 34.9% 7.2% 6.1%
Grade 6 0.1% 47.2% 36.1% 8.9% 7.6%
Wine coolers?
All 7.7% 51.4% 25.2% 5.8% 10.0%
Grade 4 12.0% 57.8% 18.9% 2.8% 8.5%
Grade 5 10.5% 48.1% 25.1% 6.0% 10.3%
Grade 6 2.8% 49.2% 29.5% 7.7% 10.8%
Wine?
All 1.3% 48.7% 32.0% 8.4% 9.5%Grade 4 3.0% 57.0% 24.8% 6.1% 9.1%
Grade 5 1.1% 47.5% 32.6% 9.8% 9.0%
Grade 6 0.4% 43.6% 36.8% 9.1% 10.1%
Liquor?
All 4.6% 64.3% 21.4% 2.9% 6.9%
Grade 4 10.2% 66.0% 15.0% 1.4% 7.4%
Grade 5 3.7% 66.7% 21.8% 1.1% 6.8%
Grade 6 1.3% 61.6% 25.4% 5.1% 6.6%
Elementary Report-Page

7/30/2019 2008 _ harris county _ crosby isd _ 2008 texas school survey of drug and alcohol use _ elementary report
http://slidepdf.com/reader/full/2008-harris-county-crosby-isd-2008-texas-school-survey-of-drug-and-alcohol 13/40
La Porte
Spring 2008
Table D-1: How recently, if ever, have you used Marijuana..
Ever
Used
School
Year
Not Past
Year
Never
Used
All 2.6% 1.3% 1.3% 97.4%
Grade 4 1.3% 0.4% 0.9% 98.7%
Grade 5 1.4% 0.4% 1.0% 98.6%
Grade 6 4.3% 2.6% 1.7% 95.7%
Table D-2: Average number of times marijuana was used by those reporting usage:
School
Year Lifetime
All 5.9 4.4
Grade 4 * 3.9
Grade 5 * 2.2
Grade 6 6.3 5.1
Elementary Report-Page

7/30/2019 2008 _ harris county _ crosby isd _ 2008 texas school survey of drug and alcohol use _ elementary report
http://slidepdf.com/reader/full/2008-harris-county-crosby-isd-2008-texas-school-survey-of-drug-and-alcohol 14/40
La Porte
Spring 2008
Table D-3: Average age of first use of marijuana:
Grade 4 Grade 5 Grade 6
9.4 9.8 9.1
Table D-4: Age of first use of marijuana by family situation:
Never Under 8 8 9 10 11 Over 11
Two Parent Family
All 98.2% 0.6% 0.3% 0.1% 0.2% 0.2% 0.3%
Grade 4 99.3% 0.4% 0.0% 0.0% 0.4% 0.0% 0.0%
Grade 5 99.6% 0.0% 0.0% 0.4% 0.0% 0.0% 0.0%
Grade 6 96.6% 1.2% 0.8% 0.0% 0.2% 0.4% 0.8%
Other Family Situation
All 97.3% 0.2% 0.8% 0.3% 0.6% 0.5% 0.3%
Grade 4 98.1% 0.0% 0.6% 0.0% 0.0% 1.3% 0.0%
Grade 5 97.2% 0.6% 0.0% 0.0% 1.1% 0.6% 0.6%
Grade 6 96.9% 0.0% 1.4% 0.7% 0.7% 0.0% 0.3%
Elementary Report-Page

7/30/2019 2008 _ harris county _ crosby isd _ 2008 texas school survey of drug and alcohol use _ elementary report
http://slidepdf.com/reader/full/2008-harris-county-crosby-isd-2008-texas-school-survey-of-drug-and-alcohol 15/40
La Porte
Spring 2008
Table D-5 : Lifetime prevalence of use of marijuana by reported conductproblems this school year:
No Absences
or Conduct
Problems Cut School
Sent to
Principal Both
1.4% 27.0% 6.0% 32.8%
Table D-6: About how many of your close friends use marijuana?
Never
Heard Of None Some Most
All 11.8% 80.1% 7.1% 1.0%
Grade 4 25.3% 72.4% 2.1% 0.2%
Grade 5 12.7% 80.3% 6.1% 0.9%
Grade 6 2.1% 85.2% 11.1% 1.6%
Table D-7: Have you ever been offered marijuana?
Never
Heard Of Yes No
All 11.2% 7.0% 81.8%
Grade 4 25.5% 4.1% 70.4%
Grade 5 11.7% 5.4% 82.8%
Grade 6 1.1% 9.9% 88.9%
Table D-8: How do your parents feel about kids your age smoking marijuana?
Don't Like Don't Care Think It's OK Don't know
All 84.5% 1.2% 0.7% 13.6%
Grade 4 81.4% 0.4% 0.9% 17.3%
Grade 5 82.9% 1.7% 0.0% 15.4%
Grade 6 87.7% 1.5% 1.0% 9.9%
Table D-9: How dangerous do you think it is for kids your age to use marijuana?
Never
Heard Of
Very
Dangerous Dangerous
Not at All
Dangerous Do Not Know
All 9.6% 75.6% 7.8% 1.7% 5.3%
Grade 4 19.8% 64.1% 6.9% 0.7% 8.5%
Grade 5 11.2% 74.9% 8.6% 1.1% 4.3%
Grade 6 1.5% 83.9% 7.9% 2.8% 3.8%
Elementary Report-Page

7/30/2019 2008 _ harris county _ crosby isd _ 2008 texas school survey of drug and alcohol use _ elementary report
http://slidepdf.com/reader/full/2008-harris-county-crosby-isd-2008-texas-school-survey-of-drug-and-alcohol 16/40
La Porte
Spring 2008
Table I-1: How recently, if ever, have you used Inhalants..
Ever
Used
School
Year
Not Past
Year
Never
Used
All 12.1% 8.3% 3.7% 87.9%
Grade 4 8.5% 7.9% 0.7% 91.5%
Grade 5 9.6% 7.1% 2.5% 90.4%
Grade 6 16.3% 9.5% 6.7% 83.7%
Table I-2: Have you ever sniffed any of the following inhalants to get high?
Not Used Used
Correction Fluid/Whiteout
All 96.9% 3.1%
Grade 4 97.9% 2.1%
Grade 5 97.8% 2.2%
Grade 6 95.6% 4.4%Gasoline
All 95.9% 4.1%
Grade 4 95.9% 4.1%
Grade 5 97.1% 2.9%
Grade 6 95.1% 4.9%
Glue
All 95.7% 4.3%
Grade 4 95.6% 4.4%
Grade 5 96.1% 3.9%
Grade 6 95.4% 4.6%
Paint Thinner
All 97.4% 2.6%Grade 4 97.7% 2.3%
Grade 5 97.8% 2.2%
Grade 6 96.9% 3.1%
Spray Paint
All 96.6% 3.4%
Grade 4 97.5% 2.5%
Grade 5 96.6% 3.4%
Grade 6 95.9% 4.1%
Other Inhalants
All 93.8% 6.2%
Grade 4 97.7% 2.3%
Grade 5 95.5% 4.5%
Grade 6 90.1% 9.9%
Elementary Report-Page

7/30/2019 2008 _ harris county _ crosby isd _ 2008 texas school survey of drug and alcohol use _ elementary report
http://slidepdf.com/reader/full/2008-harris-county-crosby-isd-2008-texas-school-survey-of-drug-and-alcohol 17/40

7/30/2019 2008 _ harris county _ crosby isd _ 2008 texas school survey of drug and alcohol use _ elementary report
http://slidepdf.com/reader/full/2008-harris-county-crosby-isd-2008-texas-school-survey-of-drug-and-alcohol 18/40

7/30/2019 2008 _ harris county _ crosby isd _ 2008 texas school survey of drug and alcohol use _ elementary report
http://slidepdf.com/reader/full/2008-harris-county-crosby-isd-2008-texas-school-survey-of-drug-and-alcohol 19/40
La Porte
Spring 2008
Table I-7: Lifetime prevalence of use of inhalants by reported conductproblems this school year:
No Absences
or Conduct
Problems Cut School
Sent to
Principal Both
5.3% 37.1% 16.7% 41.0%
Table I-8: About how many of your close friends use inhalants?
Never
Heard Of None Some Most
All 7.6% 79.8% 9.3% 3.3%
Grade 4 14.3% 79.3% 4.6% 1.8%
Grade 5 7.6% 83.7% 6.3% 2.5%
Grade 6 3.2% 77.6% 14.3% 4.9%
Elementary Report-Page

7/30/2019 2008 _ harris county _ crosby isd _ 2008 texas school survey of drug and alcohol use _ elementary report
http://slidepdf.com/reader/full/2008-harris-county-crosby-isd-2008-texas-school-survey-of-drug-and-alcohol 20/40
La Porte
Spring 2008
Table I-9: Have you ever been offered inhalants?
Never
Heard Of Yes No
All 6.9% 9.4% 83.7%
Grade 4 15.1% 4.4% 80.5%
Grade 5 7.1% 6.2% 86.7%
Grade 6 1.3% 14.8% 84.0%
Table I-10: How dangerous do you think it is for kids your age to use inhalants?
Never
Heard Of
Very
Dangerous Dangerous
Not at All
Dangerous Do Not Know
All 5.4% 64.7% 19.1% 3.3% 7.5%
Grade 4 11.9% 60.7% 15.8% 1.4% 10.2%
Grade 5 4.7% 65.7% 19.1% 3.2% 7.3%
Grade 6 1.5% 66.7% 21.3% 4.7% 5.7%
Elementary Report-Page
7/30/2019 2008 _ harris county _ crosby isd _ 2008 texas school survey of drug and alcohol use _ elementary report
http://slidepdf.com/reader/full/2008-harris-county-crosby-isd-2008-texas-school-survey-of-drug-and-alcohol 21/40
La Porte
Spring 2008
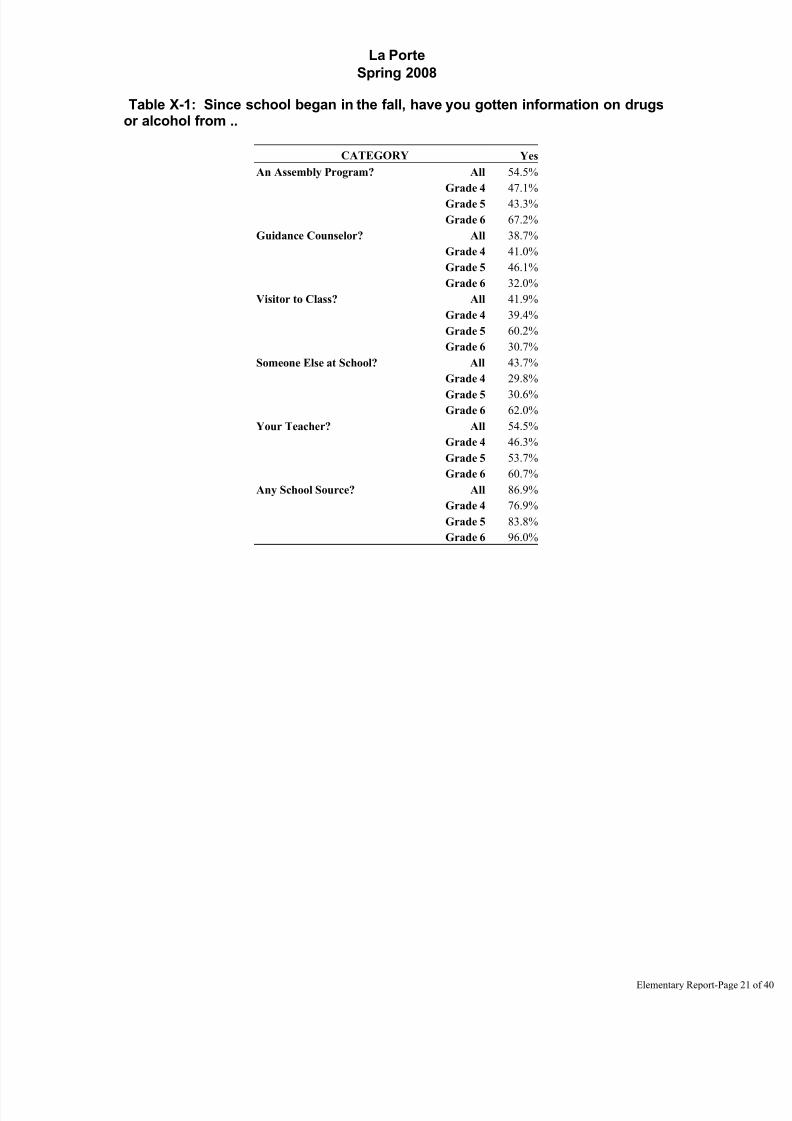
Table X-1: Since school began in the fall, have you gotten information on drugsor alcohol from ..
CATEGORY Yes
An Assembly Program? All 54.5%
Grade 4 47.1%
Grade 5 43.3%
Grade 6 67.2%
Guidance Counselor? All 38.7%
Grade 4 41.0%
Grade 5 46.1%
Grade 6 32.0%
Visitor to Class? All 41.9%
Grade 4 39.4%
Grade 5 60.2%
Grade 6 30.7%
Someone Else at School? All 43.7%
Grade 4 29.8%
Grade 5 30.6%Grade 6 62.0%
Your Teacher? All 54.5%
Grade 4 46.3%
Grade 5 53.7%
Grade 6 60.7%
Any School Source? All 86.9%
Grade 4 76.9%
Grade 5 83.8%
Grade 6 96.0%
Elementary Report-Page

7/30/2019 2008 _ harris county _ crosby isd _ 2008 texas school survey of drug and alcohol use _ elementary report
http://slidepdf.com/reader/full/2008-harris-county-crosby-isd-2008-texas-school-survey-of-drug-and-alcohol 22/40
La Porte
Spring 2008
Table B1: Prevalence and recency of use of selected substances by gradeAll Students
Ever
Used
School
Year
Not Past
Year
Never
Used
Tobacco
All 9.6% 5.1% 4.5% 90.4%
Grade 4 3.8% 2.3% 1.5% 96.2%
Grade 5 8.2% 3.5% 4.7% 91.8%
Grade 6 14.7% 8.1% 6.6% 85.3%
Alcohol
All 34.0% 20.6% 13.5% 66.0%
Grade 4 17.9% 10.0% 7.9% 82.1%
Grade 5 35.5% 20.9% 14.5% 64.5%
Grade 6 44.5% 27.8% 16.7% 55.5%
Inhalants
All 12.1% 8.3% 3.7% 87.9%
Grade 4 8.5% 7.9% 0.7% 91.5%
Grade 5 9.6% 7.1% 2.5% 90.4%Grade 6 16.3% 9.5% 6.7% 83.7%
Marijuana
All 2.6% 1.3% 1.3% 97.4%
Grade 4 1.3% 0.4% 0.9% 98.7%
Grade 5 1.4% 0.4% 1.0% 98.6%
Grade 6 4.3% 2.6% 1.7% 95.7%
Elementary Report-Page

7/30/2019 2008 _ harris county _ crosby isd _ 2008 texas school survey of drug and alcohol use _ elementary report
http://slidepdf.com/reader/full/2008-harris-county-crosby-isd-2008-texas-school-survey-of-drug-and-alcohol 23/40
La Porte
Spring 2008
Table B2: Prevalence and recency of use of selected substances by gradeMale Students
Ever
Used
School
Year
Not Past
Year
Never
Used
Tobacco
All 10.7% 6.2% 4.5% 89.3%
Grade 4 3.9% 2.7% 1.2% 96.1%
Grade 5 9.5% 3.6% 5.9% 90.5%
Grade 6 16.3% 10.3% 6.0% 83.7%
Alcohol
All 37.1% 24.5% 12.7% 62.9%
Grade 4 21.5% 13.9% 7.6% 78.5%
Grade 5 36.9% 21.4% 15.5% 63.1%
Grade 6 48.1% 33.7% 14.4% 51.9%
Inhalants
All 12.0% 8.6% 3.4% 88.0%
Grade 4 8.6% 7.8% 0.8% 91.4%
Grade 5 10.9% 6.9% 4.0% 89.1%Grade 6 14.9% 10.2% 4.8% 85.1%
Marijuana
All 2.7% 1.8% 1.0% 97.3%
Grade 4 1.2% 0.4% 0.8% 98.8%
Grade 5 1.2% 0.0% 1.2% 98.8%
Grade 6 4.7% 3.8% 0.9% 95.3%
Elementary Report-Page
7/30/2019 2008 _ harris county _ crosby isd _ 2008 texas school survey of drug and alcohol use _ elementary report
http://slidepdf.com/reader/full/2008-harris-county-crosby-isd-2008-texas-school-survey-of-drug-and-alcohol 24/40
La Porte
Spring 2008
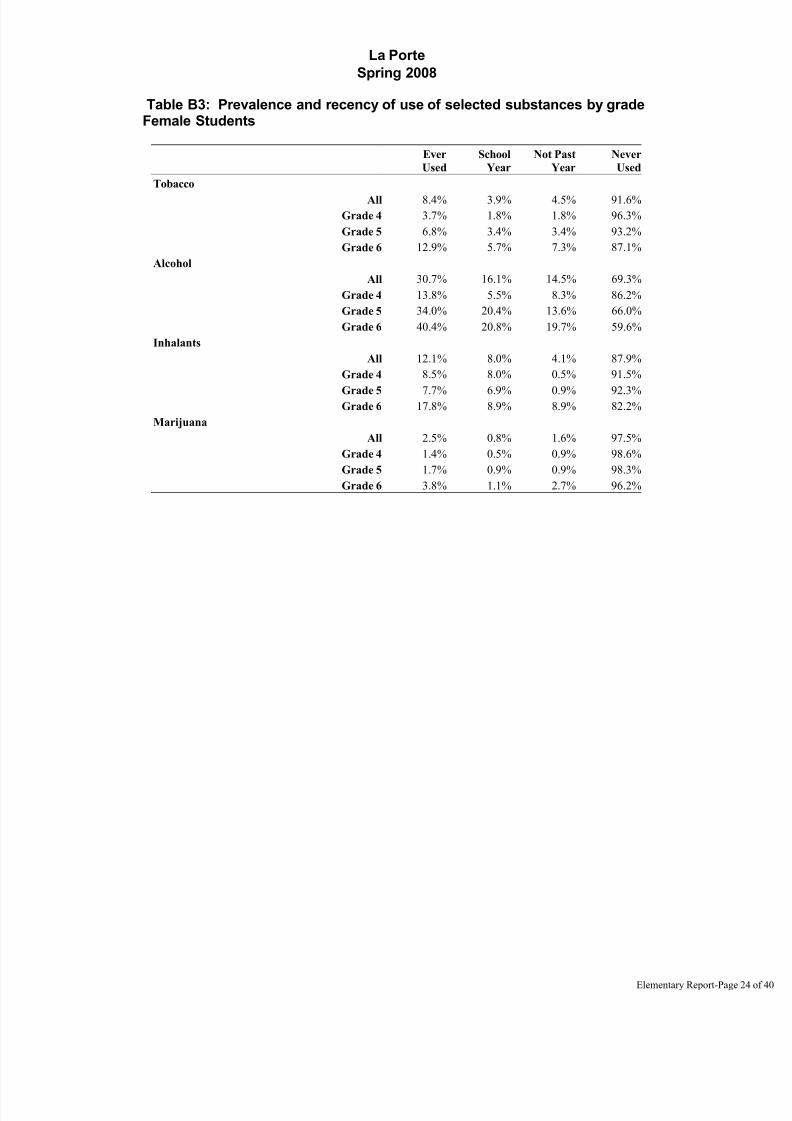
Table B3: Prevalence and recency of use of selected substances by gradeFemale Students
Ever
Used
School
Year
Not Past
Year
Never
Used
Tobacco
All 8.4% 3.9% 4.5% 91.6%
Grade 4 3.7% 1.8% 1.8% 96.3%
Grade 5 6.8% 3.4% 3.4% 93.2%
Grade 6 12.9% 5.7% 7.3% 87.1%
Alcohol
All 30.7% 16.1% 14.5% 69.3%
Grade 4 13.8% 5.5% 8.3% 86.2%
Grade 5 34.0% 20.4% 13.6% 66.0%
Grade 6 40.4% 20.8% 19.7% 59.6%
Inhalants
All 12.1% 8.0% 4.1% 87.9%
Grade 4 8.5% 8.0% 0.5% 91.5%
Grade 5 7.7% 6.9% 0.9% 92.3%Grade 6 17.8% 8.9% 8.9% 82.2%
Marijuana
All 2.5% 0.8% 1.6% 97.5%
Grade 4 1.4% 0.5% 0.9% 98.6%
Grade 5 1.7% 0.9% 0.9% 98.3%
Grade 6 3.8% 1.1% 2.7% 96.2%
Elementary Report-Page

7/30/2019 2008 _ harris county _ crosby isd _ 2008 texas school survey of drug and alcohol use _ elementary report
http://slidepdf.com/reader/full/2008-harris-county-crosby-isd-2008-texas-school-survey-of-drug-and-alcohol 25/40
La Porte
Spring 2008
Table B4: Prevalence and recency of use of selected substances by gradeWhite Students
Ever
Used
School
Year
Not Past
Year
Never
Used
Tobacco
All 10.7% 4.4% 6.3% 89.3%
Grade 4 4.3% 1.4% 2.8% 95.7%
Grade 5 8.1% 3.4% 4.7% 91.9%
Grade 6 17.6% 7.5% 10.1% 82.4%
Alcohol
All 36.9% 21.7% 15.2% 63.1%
Grade 4 18.1% 8.1% 10.0% 81.9%
Grade 5 41.1% 24.6% 16.5% 58.9%
Grade 6 47.7% 29.7% 18.0% 52.3%
Inhalants
All 11.2% 8.1% 3.2% 88.8%
Grade 4 10.2% 8.8% 1.5% 89.8%
Grade 5 7.7% 6.4% 1.3% 92.3%Grade 6 14.7% 8.8% 5.9% 85.3%
Marijuana
All 1.6% 1.0% 0.6% 98.4%
Grade 4 1.0% 0.5% 0.5% 99.0%
Grade 5 0.4% 0.0% 0.4% 99.6%
Grade 6 2.9% 2.1% 0.9% 97.1%
Elementary Report-Page

7/30/2019 2008 _ harris county _ crosby isd _ 2008 texas school survey of drug and alcohol use _ elementary report
http://slidepdf.com/reader/full/2008-harris-county-crosby-isd-2008-texas-school-survey-of-drug-and-alcohol 26/40
La Porte
Spring 2008
Table B5: Prevalence and recency of use of selected substances by gradeAfrican/American Students
Ever
Used
School
Year
Not Past
Year
Never
Used
Tobacco
All 12.0% 8.3% 3.7% 88.0%
Grade 4 3.2% 3.2% 0.0% 96.8%
Grade 5 4.5% 4.5% 0.0% 95.5%
Grade 6 19.2% 12.3% 6.8% 80.8%
Alcohol
All 40.0% 26.8% 13.2% 60.0%
Grade 4 6.1% 6.1% 0.0% 93.9%
Grade 5 31.8% 22.7% 9.1% 68.2%
Grade 6 61.6% 39.7% 21.9% 38.4%
Inhalants
All 9.9% 7.0% 2.9% 90.1%
Grade 4 3.2% 3.2% 0.0% 96.8%
Grade 5 9.1% 9.1% 0.0% 90.9%Grade 6 13.7% 8.2% 5.5% 86.3%
Marijuana
All 9.2% 6.1% 3.1% 90.8%
Grade 4 3.2% 0.0% 3.2% 96.8%
Grade 5 9.1% 9.1% 0.0% 90.9%
Grade 6 12.3% 8.2% 4.1% 87.7%
Elementary Report-Page

7/30/2019 2008 _ harris county _ crosby isd _ 2008 texas school survey of drug and alcohol use _ elementary report
http://slidepdf.com/reader/full/2008-harris-county-crosby-isd-2008-texas-school-survey-of-drug-and-alcohol 27/40
La Porte
Spring 2008
Table B6: Prevalence and recency of use of selected substances by gradeMexican/American Students
Ever
Used
School
Year
Not Past
Year
Never
Used
Tobacco
All 8.5% 5.6% 2.9% 91.5%
Grade 4 2.5% 1.9% 0.6% 97.5%
Grade 5 8.4% 4.2% 4.2% 91.6%
Grade 6 12.3% 8.8% 3.5% 87.7%
Alcohol
All 30.5% 19.0% 11.4% 69.5%
Grade 4 16.5% 12.0% 4.4% 83.5%
Grade 5 31.1% 19.2% 12.0% 68.9%
Grade 6 38.7% 23.3% 15.4% 61.3%
Inhalants
All 15.2% 9.6% 5.5% 84.8%
Grade 4 7.1% 7.1% 0.0% 92.9%
Grade 5 14.9% 9.3% 5.6% 85.1%Grade 6 20.1% 11.3% 8.8% 79.9%
Marijuana
All 3.0% 1.0% 2.0% 97.0%
Grade 4 1.9% 0.6% 1.3% 98.1%
Grade 5 1.8% 0.0% 1.8% 98.2%
Grade 6 4.4% 1.9% 2.5% 95.6%
Elementary Report-Page

7/30/2019 2008 _ harris county _ crosby isd _ 2008 texas school survey of drug and alcohol use _ elementary report
http://slidepdf.com/reader/full/2008-harris-county-crosby-isd-2008-texas-school-survey-of-drug-and-alcohol 28/40

7/30/2019 2008 _ harris county _ crosby isd _ 2008 texas school survey of drug and alcohol use _ elementary report
http://slidepdf.com/reader/full/2008-harris-county-crosby-isd-2008-texas-school-survey-of-drug-and-alcohol 29/40
La Porte
Spring 2008
Table B8: Prevalence and recency of use of selected substances by gradeStudents Reporting grades lower than A
Ever
Used
School
Year
Not Past
Year
Never
Used
Tobacco
All 11.8% 6.7% 5.1% 88.2%
Grade 4 4.0% 2.8% 1.2% 96.0%
Grade 5 10.9% 5.6% 5.3% 89.1%
Grade 6 17.3% 10.0% 7.3% 82.7%
Alcohol
All 37.9% 22.4% 15.4% 62.1%
Grade 4 18.7% 11.4% 7.3% 81.3%
Grade 5 37.7% 21.5% 16.2% 62.3%
Grade 6 49.9% 30.0% 19.9% 50.1%
Inhalants
All 14.4% 10.3% 4.1% 85.6%
Grade 4 9.3% 8.9% 0.4% 90.7%
Grade 5 12.5% 9.3% 3.2% 87.5%Grade 6 18.7% 11.7% 7.0% 81.3%
Marijuana
All 2.9% 1.5% 1.4% 97.1%
Grade 4 2.1% 0.8% 1.2% 97.9%
Grade 5 1.4% 0.7% 0.7% 98.6%
Grade 6 4.3% 2.5% 1.8% 95.7%
Elementary Report-Page

7/30/2019 2008 _ harris county _ crosby isd _ 2008 texas school survey of drug and alcohol use _ elementary report
http://slidepdf.com/reader/full/2008-harris-county-crosby-isd-2008-texas-school-survey-of-drug-and-alcohol 30/40
La Porte
Spring 2008
Table B9: Prevalence and recency of use of selected substances by gradeStudents Living With 2 Parents
Ever
Used
School
Year
Not Past
Year
Never
Used
Tobacco
All 7.5% 4.2% 3.2% 92.5%
Grade 4 2.7% 1.7% 1.0% 97.3%
Grade 5 7.0% 4.3% 2.7% 93.0%
Grade 6 11.2% 6.0% 5.2% 88.8%
Alcohol
All 30.4% 17.9% 12.5% 69.6%
Grade 4 15.6% 8.1% 7.5% 84.4%
Grade 5 31.2% 19.1% 12.1% 68.8%
Grade 6 40.4% 24.0% 16.4% 59.6%
Inhalants
All 12.2% 8.2% 4.1% 87.8%
Grade 4 7.6% 6.9% 0.7% 92.4%
Grade 5 10.9% 7.8% 3.1% 89.1%Grade 6 16.3% 9.2% 7.1% 83.7%
Marijuana
All 2.6% 1.5% 1.1% 97.4%
Grade 4 1.4% 0.3% 1.0% 98.6%
Grade 5 1.0% 0.0% 1.0% 99.0%
Grade 6 4.5% 3.3% 1.2% 95.5%
Elementary Report-Page

7/30/2019 2008 _ harris county _ crosby isd _ 2008 texas school survey of drug and alcohol use _ elementary report
http://slidepdf.com/reader/full/2008-harris-county-crosby-isd-2008-texas-school-survey-of-drug-and-alcohol 31/40
La Porte
Spring 2008
Table B10: Prevalence and recency of use of selected substances by gradeStudents Not Living With 2 Parents
Ever
Used
School
Year
Not Past
Year
Never
Used
Tobacco
All 13.3% 6.5% 6.8% 86.7%
Grade 4 5.2% 2.9% 2.3% 94.8%
Grade 5 10.3% 2.2% 8.1% 89.7%
Grade 6 21.1% 12.1% 9.1% 78.9%
Alcohol
All 40.4% 25.3% 15.1% 59.6%
Grade 4 21.3% 13.0% 8.3% 78.7%
Grade 5 42.7% 24.3% 18.4% 57.3%
Grade 6 52.0% 34.6% 17.4% 48.0%
Inhalants
All 12.1% 8.9% 3.2% 87.9%
Grade 4 10.4% 9.8% 0.6% 89.6%
Grade 5 7.1% 6.0% 1.1% 92.9%Grade 6 16.8% 10.4% 6.4% 83.2%
Marijuana
All 2.7% 1.1% 1.6% 97.3%
Grade 4 1.2% 0.6% 0.6% 98.8%
Grade 5 2.2% 1.1% 1.1% 97.8%
Grade 6 4.0% 1.3% 2.7% 96.0%
Elementary Report-Page

7/30/2019 2008 _ harris county _ crosby isd _ 2008 texas school survey of drug and alcohol use _ elementary report
http://slidepdf.com/reader/full/2008-harris-county-crosby-isd-2008-texas-school-survey-of-drug-and-alcohol 32/40
La Porte
Spring 2008
Table B11: Prevalence and recency of use of selected substances by gradeStudents Living in Town More Than 3 Years
Ever
Used
School
Year
Not Past
Year
Never
Used
Tobacco
All 9.5% 4.7% 4.8% 90.5%
Grade 4 3.6% 2.1% 1.5% 96.4%
Grade 5 8.1% 3.4% 4.8% 91.9%
Grade 6 14.2% 7.2% 7.0% 85.8%
Alcohol
All 35.6% 21.1% 14.5% 64.4%
Grade 4 17.8% 9.8% 8.0% 82.2%
Grade 5 37.7% 22.0% 15.8% 62.3%
Grade 6 45.7% 27.7% 17.9% 54.3%
Inhalants
All 12.6% 8.8% 3.8% 87.4%
Grade 4 8.5% 7.6% 0.9% 91.5%
Grade 5 8.8% 6.6% 2.3% 91.2%Grade 6 17.6% 11.0% 6.6% 82.4%
Marijuana
All 2.4% 1.2% 1.3% 97.6%
Grade 4 0.9% 0.3% 0.6% 99.1%
Grade 5 2.0% 0.6% 1.4% 98.0%
Grade 6 3.7% 2.1% 1.6% 96.3%
Elementary Report-Page

7/30/2019 2008 _ harris county _ crosby isd _ 2008 texas school survey of drug and alcohol use _ elementary report
http://slidepdf.com/reader/full/2008-harris-county-crosby-isd-2008-texas-school-survey-of-drug-and-alcohol 33/40
La Porte
Spring 2008
Table B12: Prevalence and recency of use of selected substances by gradeStudents Living in Town 3 Years or Less
Ever
Used
School
Year
Not Past
Year
Never
Used
Tobacco
All 10.6% 7.3% 3.3% 89.4%
Grade 4 4.3% 1.4% 2.9% 95.7%
Grade 5 6.1% 3.7% 2.4% 93.9%
Grade 6 18.6% 14.4% 4.2% 81.4%
Alcohol
All 38.2% 25.9% 12.3% 61.8%
Grade 4 26.1% 14.5% 11.6% 73.9%
Grade 5 33.3% 22.2% 11.1% 66.7%
Grade 6 50.9% 37.1% 13.8% 49.1%
Inhalants
All 14.1% 9.4% 4.7% 85.9%
Grade 4 12.3% 12.3% 0.0% 87.7%
Grade 5 13.8% 10.0% 3.8% 86.3%Grade 6 15.5% 6.9% 8.6% 84.5%
Marijuana
All 3.3% 1.8% 1.5% 96.7%
Grade 4 3.0% 1.5% 1.5% 97.0%
Grade 5 0.0% 0.0% 0.0% 100.0%
Grade 6 6.0% 3.4% 2.6% 94.0%
Elementary Report-Page

7/30/2019 2008 _ harris county _ crosby isd _ 2008 texas school survey of drug and alcohol use _ elementary report
http://slidepdf.com/reader/full/2008-harris-county-crosby-isd-2008-texas-school-survey-of-drug-and-alcohol 34/40
La Porte
Spring 2008
The FREQ Procedure
GENDER
Q1 Frequency Percent
Female 834 46.43
Male 962 53.57
Frequency Missing = 5.7871797354
GRADE LEVEL
Q2 Frequency Percent
Grade 4 545 30.23
Grade 5 508 28.21
Grade 6 749 41.56
DO YOU LIVE WITH
BOTH PARENTS?
Q3 Frequency Percent
No 657 36.87
Yes 1125 63.13
Frequency Missing = 20.068454447
AGE
Q4 Frequency Percent
9 220 12.31
10 502 28.03
11 611 34.15
12 417 23.33
13 or older 39 2.18
Frequency Missing = 12.303748634
ETHNICITY
Q5 Frequency Percent
African/American 126 7.23
Asian/American 7 0.40
Mexican/American 646 37.11
Native/American 26 1.47
Other 137 7.85
White 800 45.93
Frequency Missing = 59.929479013
WHAT GRADES DO YOU
USUALLY GET
Q6 Frequency Percent
Mostly A's 735 41.71
Mostly B's 825 46.83
Mostly C's 146 8.30
Mostly D's 34 1.95
Mostly F's 21 1.21
Frequency Missing = 40.314529402
LIVED IN THIS TOWN FOR
MORE THAN 3 YEARS
Q7 Frequency Percent
Don't Know 200 11.18
No 270 15.15
Yes 1315 73.67
Frequency Missing = 16.469442201
EITHER PARENT
GRADUATE FROM
COLLEGE
Q8 Frequency Percent
Don't Know 703 39.82
No 338 19.16
Yes 724 41.01
Frequency Missing = 35.808507485
QUALIFY FOR A
FREE/REDUCED PRICE
LUNCH?
Q9 Frequency Percent
Don't Know 683 39.06
No 615 35.14
Yes 451 25.80
Frequency Missing = 52.780186985
PARENTS ATTEND
PTA MEETINGS?
Q10 Frequency Percent
No 1051 61.86
Yes 648 38.14
Frequency Missing = 102.821236
EVER INHALED
GASOLINE TO GET
HIGH?
Q11a Frequency PercentNot Used 1601 95.92
Used 68 4.08
Frequency Missing = 133.005272
EVER INHALED PAINT
THINNER TO GET HIGH?
Q11b Frequency Percent
Not Used 1620 97.39
Used 43 2.61
Frequency Missing = 138.905628
EVER INHALED GLUE TO
GET HIGH?
Q11c Frequency Percent
Not Used 1602 95.66
Used 73 4.34
Frequency Missing = 127.882238
EVER INHALED
WHITEOUT TO GET
HIGH?
Q11d Frequency Percent
Not Used 1615 96.92
Used 51 3.08
Frequency Missing = 135.857586
EVER INHALED SPRAY
PAINT TO GET HIGH?Q11e Frequency Percent
Not Used 1622 96.55
Used 58 3.45
Frequency Missing = 121.884417
The frequencies have been weighted so that the
analysis reflects the distribution of students by grade
level in the district
Page
7/30/2019 2008 _ harris county _ crosby isd _ 2008 texas school survey of drug and alcohol use _ elementary report
http://slidepdf.com/reader/full/2008-harris-county-crosby-isd-2008-texas-school-survey-of-drug-and-alcohol 35/40
La Porte
Spring 2008
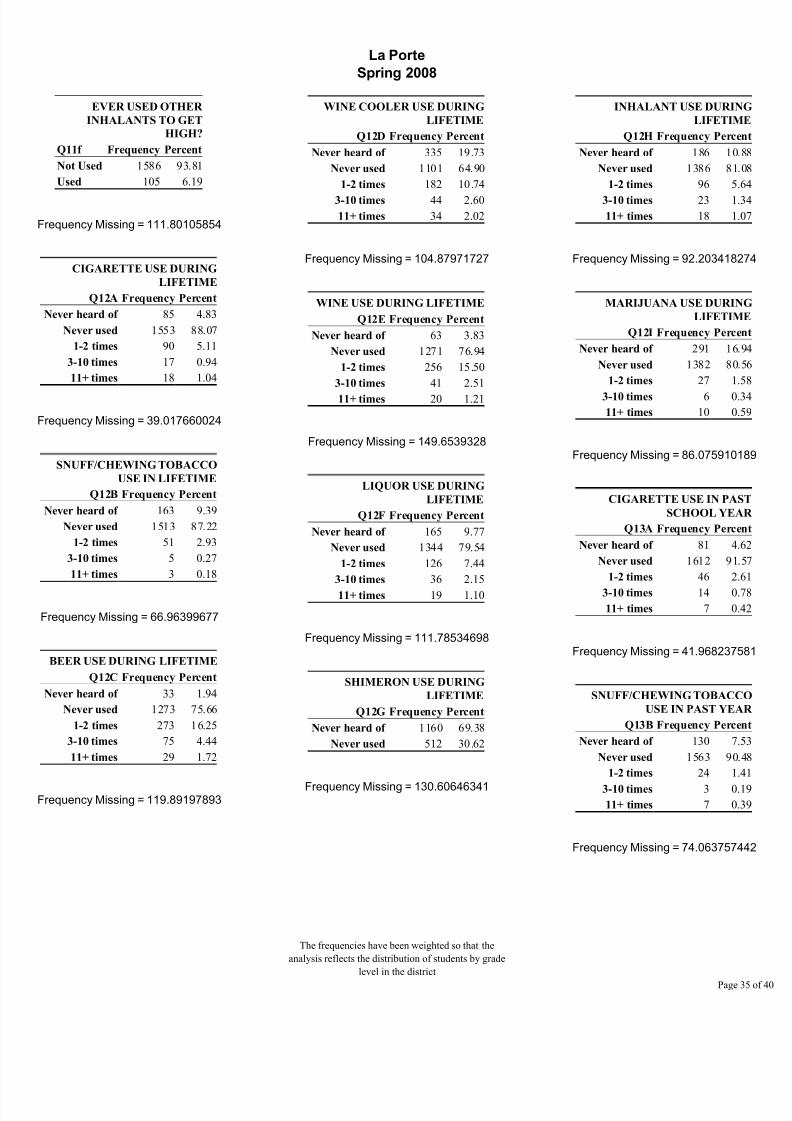
EVER USED OTHER
INHALANTS TO GET
HIGH?
Q11f Frequency Percent
Not Used 1586 93.81
Used 105 6.19
Frequency Missing = 111.80105854
CIGARETTE USE DURING
LIFETIME
Q12A Frequency Percent
Never heard of 85 4.83
Never used 1553 88.07
1-2 times 90 5.11
3-10 times 17 0.94
11+ times 18 1.04
Frequency Missing = 39.017660024
SNUFF/CHEWING TOBACCO
USE IN LIFETIME
Q12B Frequency Percent
Never heard of 163 9.39
Never used 1513 87.22
1-2 times 51 2.93
3-10 times 5 0.27
11+ times 3 0.18
Frequency Missing = 66.96399677
BEER USE DURING LIFETIME
Q12C Frequency Percent
Never heard of 33 1.94
Never used 1273 75.66
1-2 times 273 16.25
3-10 times 75 4.44
11+ times 29 1.72
Frequency Missing = 119.89197893
WINE COOLER USE DURING
LIFETIME
Q12D Frequency Percent
Never heard of 335 19.73
Never used 1101 64.90
1-2 times 182 10.74
3-10 times 44 2.60
11+ times 34 2.02
Frequency Missing = 104.87971727
WINE USE DURING LIFETIME
Q12E Frequency Percent
Never heard of 63 3.83
Never used 1271 76.94
1-2 times 256 15.50
3-10 times 41 2.51
11+ times 20 1.21
Frequency Missing = 149.6539328
LIQUOR USE DURING
LIFETIME
Q12F Frequency Percent
Never heard of 165 9.77
Never used 1344 79.54
1-2 times 126 7.44
3-10 times 36 2.15
11+ times 19 1.10
Frequency Missing = 111.78534698
SHIMERON USE DURING
LIFETIME
Q12G Frequency Percent
Never heard of 1160 69.38
Never used 512 30.62
Frequency Missing = 130.60646341
INHALANT USE DURIN
LIFETIM
Q12H Frequency Perce
Never heard of 186 10.
Never used 1386 81.
1-2 times 96 5.
3-10 times 23 1.
11+ times 18 1.
Frequency Missing = 92.2034182
MARIJUANA USE DURIN
LIFETIM
Q12I Frequency Perce
Never heard of 291 16.
Never used 1382 80.
1-2 times 27 1.
3-10 times 6 0.
11+ times 10 0.
Frequency Missing = 86.0759101
CIGARETTE USE IN PAS
SCHOOL YEA
Q13A Frequency Perce
Never heard of 81 4.
Never used 1612 91.
1-2 times 46 2.
3-10 times 14 0.
11+ times 7 0.
Frequency Missing = 41.9682375
SNUFF/CHEWING TOBACC
USE IN PAST YEA
Q13B Frequency Perce
Never heard of 130 7.
Never used 1563 90.
1-2 times 24 1.
3-10 times 3 0.
11+ times 7 0.
Frequency Missing = 74.0637574
The frequencies have been weighted so that the
analysis reflects the distribution of students by grade
level in the district
Page

7/30/2019 2008 _ harris county _ crosby isd _ 2008 texas school survey of drug and alcohol use _ elementary report
http://slidepdf.com/reader/full/2008-harris-county-crosby-isd-2008-texas-school-survey-of-drug-and-alcohol 36/40
La Porte
Spring 2008
BEER USE IN PAST SCHOOL
YEAR
Q13C Frequency Percent
Never heard of 36 2.13
Never used 1427 84.89
1-2 times 171 10.15
3-10 times 35 2.07
11+ times 13 0.76
Frequency Missing = 121.1558274
WINE COOLER USE IN PAST
SCHOOL YEAR
Q13D Frequency Percent
Never heard of 279 16.26
Never used 1262 73.51
1-2 times 121 7.05
3-10 times 36 2.07
11+ times 19 1.10
Frequency Missing = 84.632843422
WINE USE IN PAST SCHOOL
YEAR
Q13E Frequency Percent
Never heard of 60 3.58
Never used 1459 86.57
1-2 times 139 8.23
3-10 times 19 1.11
11+ times 9 0.51
Frequency Missing = 116.97362338
LIQUOR USE IN PAST SCHOOL
YEAR
Q13F Frequency Percent
Never heard of 158 9.23
Never used 1437 84.01
1-2 times 80 4.67
3-10 times 22 1.27
11+ times 14 0.82
Frequency Missing = 91.97626641
SHIMERON USE IN PAST
SCHOOL YEAR
Q13G Frequency Percent
Never heard of 1032 60.50
Never used 674 39.50
Frequency Missing = 95.851162983
INHALANT USE IN PAST
SCHOOL YEAR
Q13H Frequency Percent
Never heard of 169 9.86
Never used 1444 84.55
1-2 times 58 3.37
3-10 times 27 1.57
11+ times 11 0.64
Frequency Missing = 93.727439516
MARIJUANA USE IN PAST
SCHOOL YEAR
Q13I Frequency Percent
Never heard of 285 16.66
Never used 1405 81.98
1-2 times 11 0.66
3-10 times 3 0.16
11+ times 9 0.54
Frequency Missing = 88.620916481
AGE WHEN FIRST USED
CIGARETTES
Q14A Frequency Percent
7 or younger 34 1.97
8 years old 17 0.97
9 years old 17 0.97
10 years old 33 1.89
11 years old 18 1.01
12 or older 14 0.79
Never heard/used 1600 92.40
Frequency Missing = 70.433322078
AGE WHEN FIRST US
SNUFF/CHEW TOBAC
Q14B Frequency Perc
7 or younger 14 0
8 years old 10 0
9 years old 10 0
10 years old 17 1
11 years old 10 0
12 or older 3 0
Never heard/used 1625 96
Frequency Missing = 113.341590
AGE WHEN FIRST USED BE
Q14C Frequency Perc
7 or younger 127 7
8 years old 55 3
9 years old 62 3
10 years old 88 5
11 years old 54 3
12 or older 18 1
Never heard/used 1275 75
Frequency Missing = 124.640065
AGE WHEN FIRST USED WI
COOLE
Q14D Frequency Perc
7 or younger 35 2
8 years old 32 1
9 years old 47 2
10 years old 55 3
11 years old 65 3
12 or older 16 0
Never heard/used 1438 85
Frequency Missing = 114.460040
AGE WHEN FIRST USED WI
Q14E Frequency Perc
7 or younger 60 3
8 years old 28 1
9 years old 55 3
10 years old 76 4
11 years old 69 4
12 or older 15 0
Never heard/used 1352 8
The frequencies have been weighted so that the
analysis reflects the distribution of students by grade
level in the district
Page

7/30/2019 2008 _ harris county _ crosby isd _ 2008 texas school survey of drug and alcohol use _ elementary report
http://slidepdf.com/reader/full/2008-harris-county-crosby-isd-2008-texas-school-survey-of-drug-and-alcohol 37/40
La Porte
Spring 2008
Frequency Missing = 146.8652642
AGE WHEN FIRST USED LIQUOR
Q14F Frequency Percent7 or younger 17 0.99
8 years old 14 0.82
9 years old 28 1.67
10 years old 35 2.09
11 years old 47 2.81
12 or older 22 1.29
Never heard/used 1520 90.32
Frequency Missing = 118.7231987
AGE WHEN FIRST USEDSHIMERON
Q14G Frequency Percent
Never heard/used 1690 100.00
Frequency Missing = 111.57470557
AGE WHEN FIRST USED
INHALANTS
Q14H Frequency Percent
7 or younger 26 1.52
8 years old 24 1.419 years old 24 1.44
10 years old 24 1.40
11 years old 21 1.25
12 or older 15 0.86
Never heard/used 1563 92.12
Frequency Missing = 105.21924673
AGE WHEN FIRST USED
MARIJUANA
Q14I Frequency Percent
7 or younger 8 0.45
8 years old 8 0.49
9 years old 3 0.17
10 years old 6 0.35
11 years old 5 0.30
12 or older 6 0.33
Never heard/used 1661 97.91
Frequency Missing = 105.41497547
CLOSE FRIENDS USE
CIGARETTES
Q15A Frequency PercentNever heard of 64 3.67
None 1384 80.06
Some 262 15.15
Most 19 1.12
Frequency Missing = 72.848641431
CLOSE FRIENDS USE
SNUFF/CHEWING TOBACCO
Q15B Frequency Percent
Never heard of 86 5.05None 1492 87.52
Some 123 7.21
Most 4 0.22
Frequency Missing = 97.649470767
CLOSE FRIENDS USE BEER
Q15C Frequency Percent
Never heard of 30 1.77
None 1243 74.30
Some 337 20.12Most 64 3.81
Frequency Missing = 129.43928097
CLOSE FRIENDS USE WINE
COOLERS
Q15D Frequency Percent
Never heard of 184 10.91
None 1268 75.26
Some 194 11.48
Most 40 2.35
Frequency Missing = 116.63249614
CLOSE FRIENDS USE WIN
Q15E Frequency Perce
Never heard of 46 2.
None 1360 81.
Some 225 13.
Most 44 2.
Frequency Missing = 126.45648
CLOSE FRIENDS USE LIQUO
Q15F Frequency Perce
Never heard of 119 7.
None 1373 81.
Some 171 10.
Most 17 1.
Frequency Missing = 121.008831
CLOSE FRIENDS US
SHIMERO
Q15G Frequency Perce
Never heard of 836 49.
None 819 48.
Some 20 1.
Frequency Missing = 127.233804
CLOSE FRIENDS US
INHALANT
Q15H Frequency Perce
Never heard of 128 7.
None 1339 79.
Some 156 9.
Most 56 3.
Frequency Missing = 122.824448
CLOSE FRIENDS USMARIJUAN
Q15I Frequency Perce
Never heard of 200 11.
None 1352 80.
Some 119 7.
Most 17 1.
The frequencies have been weighted so that the
analysis reflects the distribution of students by grade
level in the district
Page

7/30/2019 2008 _ harris county _ crosby isd _ 2008 texas school survey of drug and alcohol use _ elementary report
http://slidepdf.com/reader/full/2008-harris-county-crosby-isd-2008-texas-school-survey-of-drug-and-alcohol 38/40
La Porte
Spring 2008
Frequency Missing = 114.33035327
EVER BEEN OFFERED
CIGARETTES
Q16a Frequency Percent
Never heard of 55 3.20No 1387 80.13
Yes 289 16.67
Frequency Missing = 71.162711241
EVER BEEN OFFERED
SNUFF/CHEWING TOBACCO
Q16b Frequency Percent
Never heard of 92 5.47
No 1461 86.37
Yes 138 8.17
Frequency Missing = 109.93750784
EVER BEEN OFFERED BEER
Q16c Frequency Percent
Never heard of 28 1.67
No 1229 72.86
Yes 430 25.47
Frequency Missing = 115.09276334
EVER BEEN OFFERED WINE
COOLERS
Q16d Frequency Percent
Never heard of 175 10.41
No 1282 76.10
Yes 227 13.49
Frequency Missing = 117.62125918
EVER BEEN OFFERED WINE
Q16e Frequency Percent
Never heard of 48 2.87
No 1349 80.53
Yes 278 16.60
Frequency Missing = 126.74807729
EVER BEEN OFFERED
LIQUOR
Q16f Frequency Percent
Never heard of 106 6.33
No 1393 83.09
Yes 178 10.59
Frequency Missing = 125.17532358
EVER BEEN OFFERED
SHIMERON
Q16g Frequency Percent
Never heard of 820 49.20
No 831 49.87
Yes 16 0.94
Frequency Missing = 134.80437898
EVER BEEN OFFERED
INHALANTS
Q16h Frequency Percent
Never heard of 115 6.86
No 1403 83.74
Yes 157 9.40
Frequency Missing = 126.56885899
EVER BEEN OFFERED
MARIJUANA
Q16i Frequency Percent
Never heard of 191 11.25
No 1386 81.80
Yes 118 6.95
Frequency Missing = 107.57092095
IS ALCOHOL OBTAINED
FROM HOME
Q17a Frequency Percent
Do Not Drink 1181 71.06
No 201 12.10
Yes 280 16.85
Frequency Missing = 140.62537852
IS ALCOHOL OBTAINE
FROM FRIEND
Q17b Frequency Percen
Do Not Drink 1188 73.5
No 341 21.1
Yes 85 5.2
Frequency Missing = 187.538230
IS ALCOHOL OBTAINE
SOMEWHERE ELS
Q17c Frequency Percen
Do Not Drink 1172 72.2
No 288 17.7
Yes 162 10.0
Frequency Missing = 180.437670
DANGEROUS FOR KIDS TO U
CIGARETT
Q18A Frequency Perce
Very dangerous 1143 66
Dangerous 437 25
Not at all 22 1
Don't know 72 4
Never heard of 40 2
Frequency Missing = 88.8968008
DANGEROUS TO U
SNUFF/CHEWING TOBACC
Q18B Frequency Perce
Very dangerous 1129 67
Dangerous 366 21
Not at all 29 1
Don't know 102 6
Never heard of 56 3
Frequency Missing = 119.631007
The frequencies have been weighted so that the
analysis reflects the distribution of students by grade
level in the district
Page

7/30/2019 2008 _ harris county _ crosby isd _ 2008 texas school survey of drug and alcohol use _ elementary report
http://slidepdf.com/reader/full/2008-harris-county-crosby-isd-2008-texas-school-survey-of-drug-and-alcohol 39/40
La Porte
Spring 2008
DANGEROUS FOR KIDS TO USE
BEER
Q18C Frequency Percent
Very dangerous 843 50.75
Dangerous 555 33.46
Not at all 125 7.53
Don't know 123 7.41
Never heard of 14 0.84
Frequency Missing = 141.84049453
DANGEROUS FOR KIDS TO USE
WINE COOLERS
Q18D Frequency Percent
Very dangerous 862 51.39
Dangerous 422 25.16
Not at all 97 5.78
Don't know 167 9.98
Never heard of 129 7.69
Frequency Missing = 125.02912619
DANGEROUS FOR KIDS TO USE
WINE
Q18E Frequency Percent
Very dangerous 811 48.69
Dangerous 533 32.03
Not at all 140 8.43
Don't know 158 9.49
Never heard of 22 1.35
Frequency Missing = 136.73397149
DANGEROUS FOR KIDS TO USE
LIQUOR
Q18F Frequency Percent
Very dangerous 1071 64.30
Dangerous 356 21.38
Not at all 48 2.89
Don't know 114 6.86
Never heard of 76 4.56
Frequency Missing = 136.34411179
DANGEROUS FOR KIDS TO USE
SHIMERON
Q18G Frequency Percent
Very dangerous 639 38.37
Dangerous 90 5.40
Not at all 4 0.23
Don't know 130 7.83
Never heard of 802 48.17
Frequency Missing = 136.32840023
DANGEROUS FOR KIDS TO USE
INHALANTS
Q18H Frequency Percent
Very dangerous 1084 64.68
Dangerous 320 19.09
Not at all 56 3.33
Don't know 125 7.48
Never heard of 91 5.41
Frequency Missing = 125.87169184
DANGEROUS FOR KIDS TO USE
MARIJUANA
Q18I Frequency Percent
Very dangerous 1271 75.59
Dangerous 131 7.81
Not at all 29 1.70
Don't know 89 5.32
Never heard of 161 9.58
Frequency Missing = 121.18725052
DRUG/ALCOHOL INFO
FROM TEACHER
Q19a Frequency Percent
No 734 45.53
Yes 878 54.47
Frequency Missing = 190.14688161
DRUG/ALC INFO
FROM VISITOR TO
CLASS
Q19b Frequency Percent
No 925 58.11
Yes 667 41.89
Frequency Missing = 210.296290
DRUG/ALC INFO
FROM ASSEMBLY
PROGRAM
Q19c Frequency Percent
No 724 45.52
Yes 866 54.48
Frequency Missing = 212.046664
DRUG/ALC INFO
FROM GUIDE
COUNSELOR
Q19d Frequency Percent
No 965 61.27
Yes 610 38.73
Frequency Missing = 226.312227
DRUG/ALC INF FROMSOMEONE ELSE AT
SCHOOL
Q19e Frequency Percent
No 901 56.26
Yes 701 43.74
Frequency Missing = 200.196420
BEER, TWO OR MORE
AT ONE TIME
Q20a Frequency PercentNever 1414 83.36
1 time 158 9.35
2 times 58 3.40
3+ times 66 3.90
Frequency Missing = 106.22611
The frequencies have been weighted so that the
analysis reflects the distribution of students by grade
level in the district
Page
7/30/2019 2008 _ harris county _ crosby isd _ 2008 texas school survey of drug and alcohol use _ elementary report
http://slidepdf.com/reader/full/2008-harris-county-crosby-isd-2008-texas-school-survey-of-drug-and-alcohol 40/40
La Porte
Spring 2008
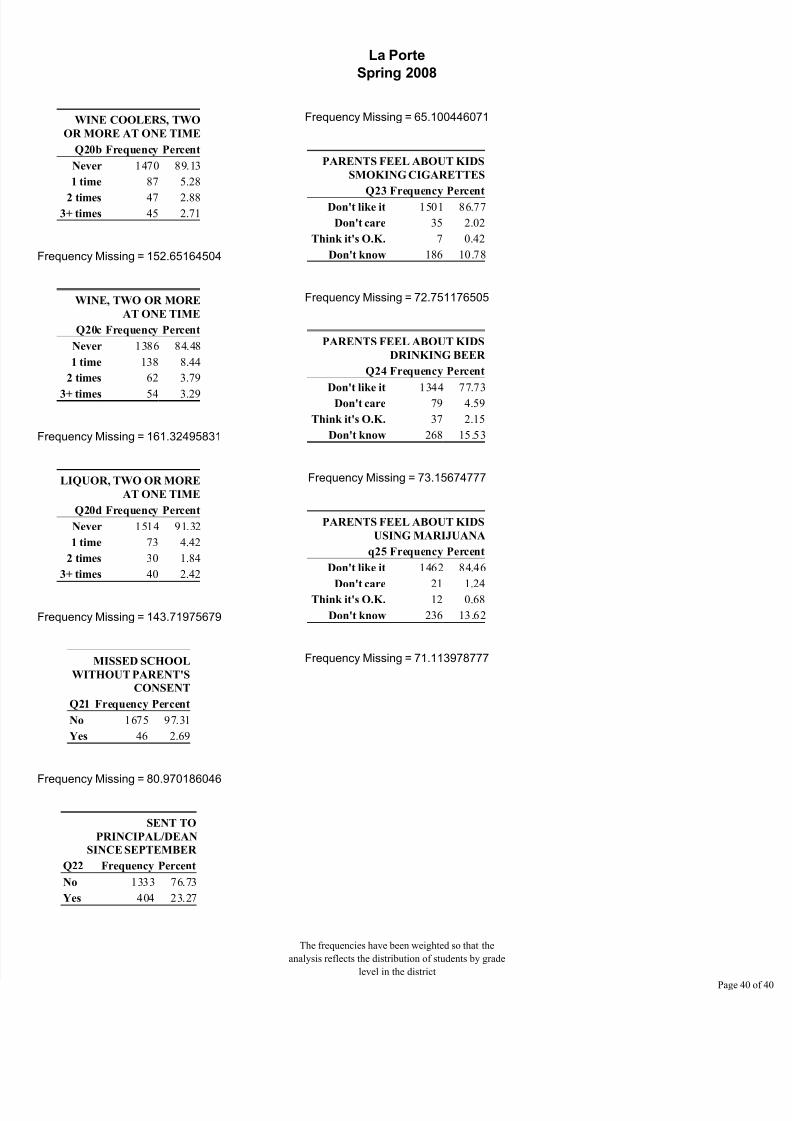
WINE COOLERS, TWO
OR MORE AT ONE TIME
Q20b Frequency Percent
Never 1470 89.13
1 time 87 5.28
2 times 47 2.883+ times 45 2.71
Frequency Missing = 152.65164504
WINE, TWO OR MORE
AT ONE TIME
Q20c Frequency Percent
Never 1386 84.48
1 time 138 8.44
2 times 62 3.79
3+ times 54 3.29
Frequency Missing = 161.32495831
LIQUOR, TWO OR MORE
AT ONE TIME
Q20d Frequency Percent
Never 1514 91.32
1 time 73 4.42
2 times 30 1.84
3+ times 40 2.42
Frequency Missing = 143.71975679
MISSED SCHOOL
WITHOUT PARENT'S
CONSENT
Q21 Frequency Percent
No 1675 97.31
Yes 46 2.69
Frequency Missing = 80.970186046
SENT TO
PRINCIPAL/DEAN
SINCE SEPTEMBER
Q22 Frequency Percent
No 1333 76.73
Y 404 23 27
Frequency Missing = 65.100446071
PARENTS FEEL ABOUT KIDS
SMOKING CIGARETTES
Q23 Frequency PercentDon't like it 1501 86.77
Don't care 35 2.02
Think it's O.K. 7 0.42
Don't know 186 10.78
Frequency Missing = 72.751176505
PARENTS FEEL ABOUT KIDS
DRINKING BEER
Q24 Frequency Percent
Don't like it 1344 77.73Don't care 79 4.59
Think it's O.K. 37 2.15
Don't know 268 15.53
Frequency Missing = 73.15674777
PARENTS FEEL ABOUT KIDS
USING MARIJUANA
q25 Frequency Percent
Don't like it 1462 84.46
Don't care 21 1.24Think it's O.K. 12 0.68
Don't know 236 13.62
Frequency Missing = 71.113978777