2008 interim businessinterim - chinatelecom-h. · pdf filevideo monitoring and iptv vas &...
TRANSCRIPT
Business2008 INTERIM2008 INTERIM
China Telecom Corporation Limited28 August 2008
www.chinatelecom-h.com
R E S U L T SR E S U L T S

2
Certain statements contained in this document may be viewed as “forward-looking statements” within the meaning of Section 27A of the U.S. Securities Act of 1933 (as amended) and Section 21E of the U.S. Securities Exchange Act of 1934 (as amended). Such forward-looking statements are subject to known and unknown risks, uncertainties and other factors, which may cause the actual performance, financial condition or results of operations of China Telecom Corporation Limited (the “Company”) to be materially different from any future performance, financial condition or results of operations implied by such forward-looking statements. In addition, we do not intend to update these forward-looking statements. Further information regarding these risks, uncertainties and other factors is included in the Company’s most recent Annual Report on Form 20-F filed with the U.S. Securities and Exchange Commission (the “SEC”) and in the Company’s other filings with the SEC.
Forward-Looking Statements

3
Executive Vice President & CFOMadam Wu AndiMadam Wu Andi
President & COOMr. Shang BingMr. Shang Bing
Chairman & CEOMr. Wang XiaochuMr. Wang Xiaochu
Management Team

4
Agenda
OverviewOverview
Business ReviewBusiness Review
Financial PerformanceFinancial Performance

Overview

6
Highlights
Commenced CDMA business acquisition
and prepared in advance for
full services offering
Deepened strategic transformation
to optimize revenue mix
Pro-actively managed challenges to
maintain profitable development
Optimized CAPEX structure to enhance
competitive edges
7
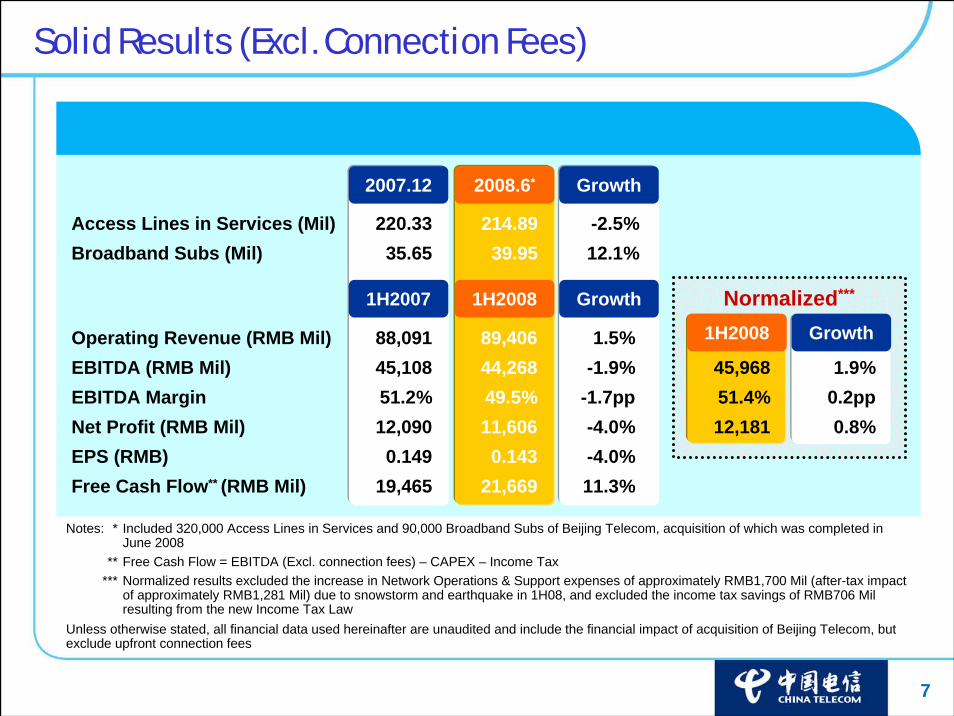
Solid Results (Excl. Connection Fees)
2007.12 2008.6* Growth
Notes: * Included 320,000 Access Lines in Services and 90,000 Broadband Subs of Beijing Telecom, acquisition of which was completed in June 2008
** Free Cash Flow = EBITDA (Excl. connection fees) – CAPEX – Income Tax*** Normalized results excluded the increase in Network Operations & Support expenses of approximately RMB1,700 Mil (after-tax impact
of approximately RMB1,281 Mil) due to snowstorm and earthquake in 1H08, and excluded the income tax savings of RMB706 Mil resulting from the new Income Tax Law
12.1%-2.5%
39.9535.65Broadband Subs (Mil)214.89220.33Access Lines in Services (Mil)
1.9%45,968-1.9%44,26845,108EBITDA (RMB Mil)0.2pp51.4%-1.7pp49.5%51.2%EBITDA Margin
12,181
11.3%-4.0%-4.0%
1.5%
0.8%0.1430.149EPS (RMB)
11,60612,090Net Profit (RMB Mil)
21,66919,465Free Cash Flow** (RMB Mil)
89,40688,091Operating Revenue (RMB Mil)
Unless otherwise stated, all financial data used hereinafter are unaudited and include the financial impact of acquisition of Beijing Telecom, but exclude upfront connection fees
1H2007 1H2008 Growth
1H2008 Growth
Normalized***

8
0.1560.170EPS (RMB)
12,63413,756Net Profit* (RMB Mil)
50.1%52.1%EBITDA Margin
45,29646,774EBITDA (RMB Mil)
90,43489,757Operating Revenue (RMB Mil)
IFRS-based Results (Incl. Connection Fees)
1H2007 1H2008
Note: * Unless otherwise stated, net profit used in this presentation represents profit attributable to equity holders of the Company

9
Snowstorm & Earthquake Impact in 1H2008
SnowstormSnowstorm
EarthquakeEarthquake
Maintenance Cost: RMB200 Mil
Maintenance Cost: RMB130 Mil
EBITDA:RMB1,700 Mil
Net Profit:RMB1,281 Mil
CAPEX plan:RMB2,200 Mil
Asset write-off: RMB370 Mil
Asset write-off: RMB1,000 Mil
1H2008 Impact
CAPEX : RMB960 Mil
CAPEX : RMB1,240 Mil

10
1H2007 1H2008
RMB Mil
1.5% Contribution
Revenue Growth Drivers
+6.0pp-7.7pp +3.3pp -0.1pp
+1.5%
88,091 89,406
-892,880-6,732 5,256
Notes: * Fixed-line Voice Business Revenue includes Monthly Fees, Local Usage Fees, Upfront Installation Fees, DLD/ILD and Interconnection Revenue
** Internet & Data Business includes Internet Access, Managed Data and Leased Line businesses*** VAS & Integrated Information Services includes Fixed-line VAS, Internet VAS, Internet Information Services, Best Tone, Video
Applications and IT Services & Applications
Fixed-line Voice
Business*
OthersInternet & Data
Business**
VAS & Integrated
Information Services***

11
Strategic Transformation Gathering Pace
Voice Revenue
Non-Voice RevenueRMB Mil
1H2007 1H2008
57,24250,510
30,849 38,896
88,091 89,406
-11.8%
+1.5%
+26.1% 1H2007 1H2008
1H2007 1H2008
19,278
24,534+27.3%
21.9%27.4%
As a % of Operating Revenue
9,107
11,987+31.6%
10.3% 13.4%
RMB Mil
RMB Mil
As a % of Operating Revenue1H2008 Voice ARPU: RMB38.7 9.2%
Internet & Data BusinessSteady Aggregate Revenue
VAS & Integrated Information Services

12
Customer-focused Operation to Enhance Value
Government & Enterprise Customer
33.3%
37.1%
46.8%47.3%
+2.9%
+13.5%
1H20081H2007
1H20081H2007
Government & Enterprise
Household
As a % of Total Customer Segment Revenue
As a % of Total Customer Segment Revenue
Revenue Growth
Revenue Growth
Differentiated services for further refined customer segments
Enriching “BizNavigator” brand content and customer perception with convergent services & industry applications
Enhancing customer value & revenue
Enriching “One Home” brand content & value with more content applications, multi-means of access for multi-terminal devices
Promoting targeted marketing in key markets
Further enhancing tariff perception
Household Customer

13
Aligning investment strategies with business development; strictly controlling investment in traditional business to enhance return
Tilting investments toward transformation business to drive revenue
Pro-actively preparing for full services offering
Incremental mobile business CAPEX to be finalized after attaining relevant approval for CDMA business acquisition
CAPEX
RMB Mil
2007 2008E
CAPEX
Extra RMB2,200 Mil CAPEX due to
earthquake & snowstorm
1H CAPEX
Note: Above CAPEX included Beijing Telecom’s CAPEX of RMB785 Mil for 1H2007 and RMB853 Mil for 1H2008
Strictly controlling CAPEX to enhance return; optimizing structure to
promote development
46,345
44,893
20,745 18,783-9.5%
47,0932,200

14
Mobile Preparations• Network transition & optimization
• IT system establishment &enhancement
• Equipment procurement & network construction
• Fixed & mobile services integration
CDMA Business Acquisition• Take-over of CDMA business
• Relatively complete customer service system
• Relatively complete CDMA network with stand-alone operation and continuous service capability
• Solidify customer base (Government & Enterprise, Household and Individual)• Strengthen development of transformation business (broadband, VAS &
integrated information services)• Promote product bundling and integrated service
Near Term Focus
To launch mobile business after attaining relevant approval for CDMA business acquisition
• Distribution channels & international roaming
arrangement
Consolidate Fixed-line Business

15
Integrated Information Services ProviderIntegrated Information Services ProviderEnrich customer experienceRealize significant synergiesEnhance core competitivenessCreate shareholder value
Full Services Offering to Enhance Value
MobileOperations
MobileOperations
Strategic Transformation
Strategic Transformation
Full Services Offering
Full Services Offering
Fixed + Mobile+ +
Media + Data
Fixed + Mobile+ +
Media + Data• Promote customer brand
operation• Strengthen development
of transformation business
• Consolidate voice business
• Focus on mid-to-high end customers
• Offer differentiated services
• Realize profitable scale development
Fixed-lineOperationsFixed-line
Operations

BusinessR E V I E W
17
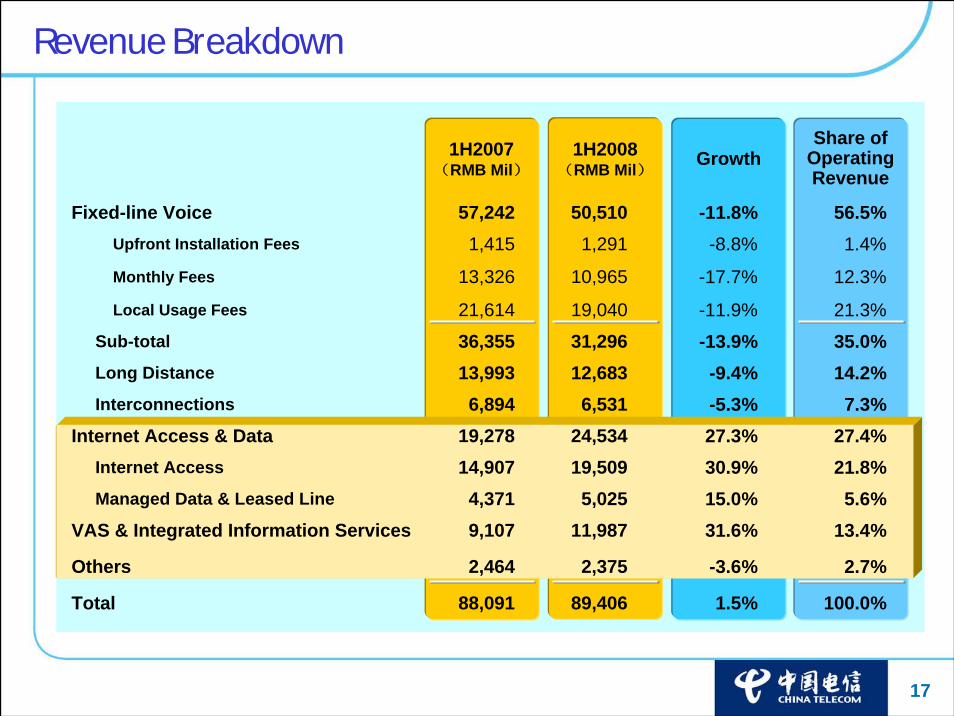
Revenue Breakdown
1H2007(RMB Mil)
Share of Operating Revenue
Growth1H2008(RMB Mil)
21.8%30.9%19,50914,907Internet Access
5.6%15.0%5,0254,371Managed Data & Leased Line
27.4%27.3%24,53419,278Internet Access & Data
35.0%-13.9%31,29636,355Sub-total
100.0%
2.7%
13.4%
7.3%14.2%
21.3%
12.3%
1.4%
56.5%
1.5%89,40688,091Total
-3.6%2,3752,464Others
31.6%11,9879,107VAS & Integrated Information Services
-5.3%6,5316,894Interconnections
-9.4%12,68313,993Long Distance
-11.9%19,04021,614Local Usage Fees
-17.7%10,96513,326Monthly Fees
-8.8%1,2911,415Upfront Installation Fees
-11.8%50,51057,242Fixed-line Voice

18
Local Voice Business
Access Lines in Services
Mil214.9220.3
2007.12 2008.6
Household
Government & Enterprise
Individual
26.4
120.7
52.0
15.8Public Telephone
PAS PAS
Local Voice BusinessVoice Usage Revenue
202,520189,712
-6.3%PulsesMil
RMBMil -13.9%
36,35531,296
35.0%41.3%
1H2007 1H2008
24.8
121.8
58.0
15.7
1H2007 1H2008
Public Telephone
Major Initiatives
As a % of Operating Revenue
Strengthen bundling and integration with non-voice businesses with targeted marketing to Government & Enterprise and Household customers
Emphasize profitable development amid intensifying competition with loss of some low-end PAS subs due to effective control of sales expenses
19
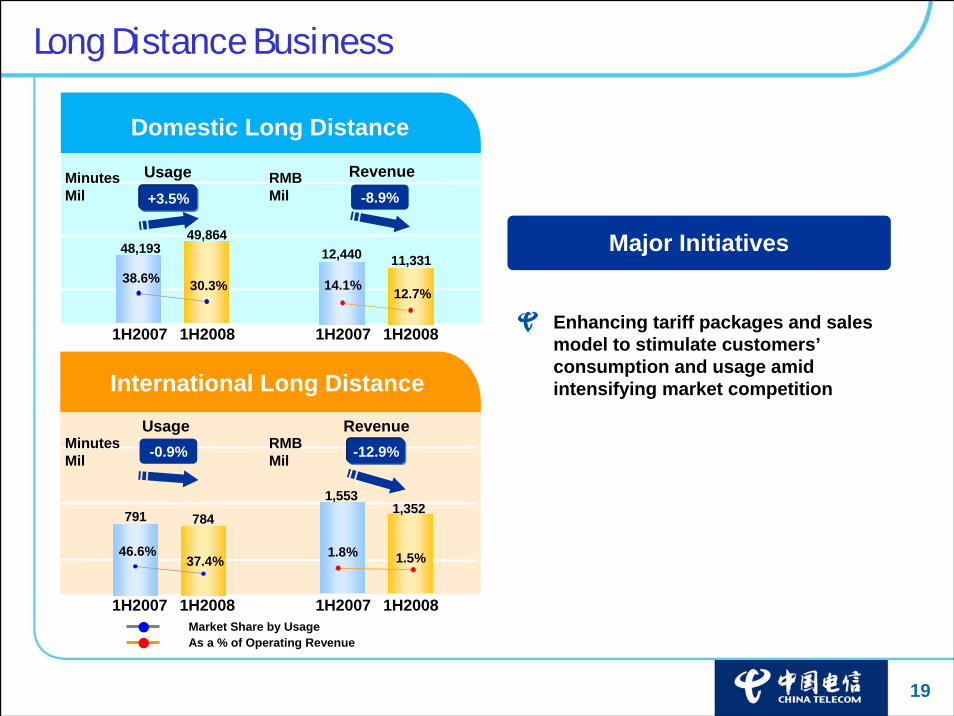
Long Distance Business
Market Share by Usage
Domestic Long Distance
International Long Distance
Usage
48,19349,864
+3.5%MinutesMil
30.3%38.6%
RMBMil
791 784
-0.9%MinutesMil
37.4%46.6%
RMBMil
As a % of Operating Revenue
12,440 11,331
-8.9%
12.7%14.1%
Revenue
-12.9%
1,5531,352
1.5%1.8%
1H2007 1H2008 1H2007 1H2008
1H2007 1H2008 1H2007 1H2008
Usage Revenue
Major Initiatives
Enhancing tariff packages and sales model to stimulate customers’consumption and usage amid intensifying market competition

20
Broadband Access Revenue
Broadband Business
7985
+31.3%
1H2007 1H2008
14,687
19,279
Broadband ARPU (RMB)
RMB Mil
Subscribers
Net Adds in the Period
32.1935.65
3.873.46
4.30
2007.6 2007.12 2008.6
39.95+24.1%
Major Initiatives
Broadband Roaming:
Launching broadband account operation with nationwide WIFI roaming services (>15,000 WIFI hotspots) via “e8-2” package
Promoting to “OneHome” customers one-stop services and applications (communications, treasury management, broadcasting, customer services, information, entertainment…)
Driving Access with Applications:
Mil

21
1H20081H2007
9,10711,987
RMB Mil
Revenue
Revenue Growth & Mix in 1H08
13.4%
As a % of Operating Revenue
10.3%
9.7%
56.7%
93.5%
33.5%
74.6%
131.0%
50.9%
9.2%17.6%
12.9%
5.0%4.4%
Note: * Video Applications include video conferencing, video monitoring and IPTV
VAS & Integrated Information Services
Major Initiatives
Promoting scale & diversified development
Leveraging professional and centralized operation and emphasizing co-operation along value chain to accelerate the development of new services and strengthen core competitiveness of integrated information services
+31.6%
Fixed-line VAS
Best Tone
IT Services& Application
Internet VAS
Internet Information
Video Applications*

22
Fast Growing Businesses
1H20081H2007
1H20081H2007
2,070
1,026
2,106
1,3440.9pp contribution to
overall revenue growth
Best Tone
IT Services & Applications* + Video Applications
RevenueRMB Mil
RevenueRMB Mil
1.2pp contribution to overall revenue growth
Note: * IT Services & Applications Revenue excluded third parties equipment sales
Best Tone
IT Services & Applications* + Video Applications
Enriching information content and enhancing brand awareness
Advancing co-operation to enhance commerce & travel servicing capability
Targeting mid-to-high end Government & Enterprise customers
Leveraging existing customer base and network resources; focusing on profitable business opportunities
Enhancing system integration, outsourcing and consultation services capabilities
+56.7%
+101.8%

23
Leverage mobile resources acquired via CDMA business acquisition and integrate with fixed-line resourcesOptimize network coverage and improve service qualityLower operating expenses via synergiesEstablish full services offering operation system
Leverage mobile resources acquired via CDMA business acquisition and integrate with fixed-line resourcesOptimize network coverage and improve service qualityLower operating expenses via synergiesEstablish full services offering operation system
Focus on mid-to-high end
urban customers
Add-in mobile service
Develop mobile Internet
applications
Establish differentiated
services
Leveraging premier customer brands to promote mobile service penetration and
to enrich customer experience
Leveraging premier customer brands to promote mobile service penetration and
to enrich customer experience
Innovative mobile communications in the Internet era to provide
seamless information experience
Innovative mobile communications in the Internet era to provide
seamless information experience
Customer-focused Differentiated Operation
Individual customer brand
FinancialPerformance

25
1H2007(RMB Mil)
1H2008(RMB Mil) Growth
3.8%71,68269,072Sub-total
-1.9%
-4.0%
-6.8%
2.2%
-0.5%
1.4%
13.2%
1.7%
1.5%
44,268
11,606
17,724
3,508
11,103
13,857
16,670
26,544
89,406
45,108EBITDA
12,090Net Profit
19,019Operating Profit
3,434Interconnection & Others
11,157SG&A
13,667Personnel
14,725Network Operations & Support
26,089Depreciation & Amortization
Operating Expenses
88,091Operating Revenue
Key Financial Information
Note: Figures on this slide included the impact of snowstorm, earthquake and new Income Tax Law
26
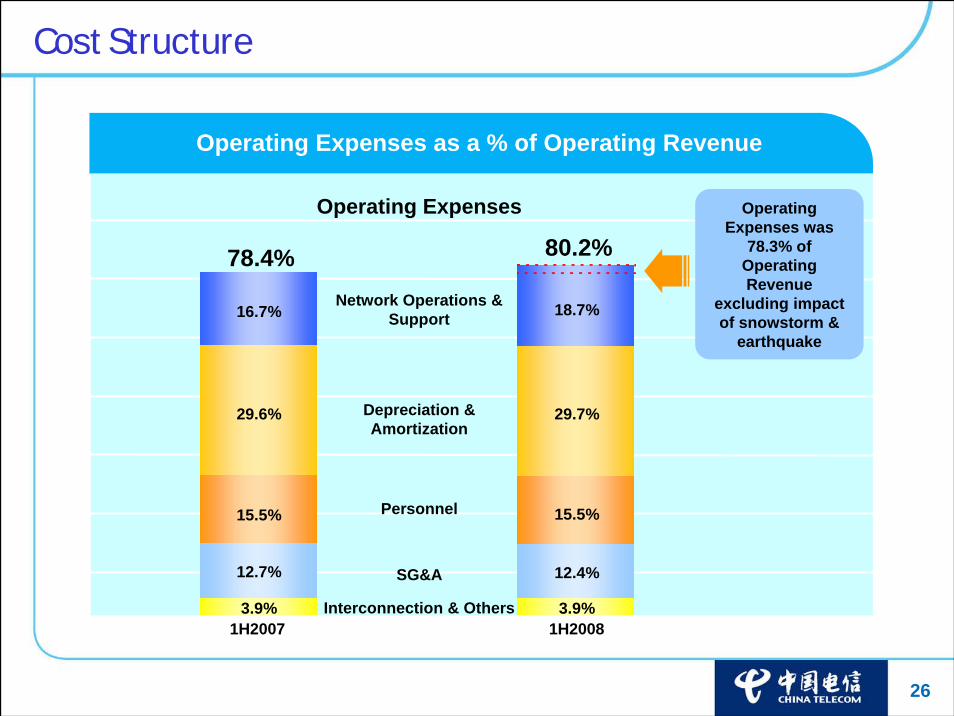
Cost Structure
Operating Expenses as a % of Operating Revenue
Operating Expenses
Depreciation & Amortization
Network Operations & Support
SG&A
Personnel
80.2%
Interconnection & Others
29.7%
18.7%
15.5%
12.4%
3.9%
78.4%
29.6%
16.7%
15.5%
12.7%
3.9%
Operating Expenses was
78.3% of Operating Revenue
excluding impact of snowstorm &
earthquake
1H20081H2007

27
Optimized Resource Allocation to Sustain Development
Note: * Excluded the impact of RMB1,700 Mil due to snowstorm and earthquake
Cost Initiatives 1H2008 Results
Maintained EBITDA margin relatively stable
Maintained EBITDA margin relatively stable
Depreciation &AmortizationStrengthened asset precision management to enhance resourcesutilization
Depreciation &AmortizationStrengthened asset precision management to enhance resourcesutilization
Network Operations & SupportImproved network maintenance quality to support continuous development
Network Operations & SupportImproved network maintenance quality to support continuous development
PersonnelEnhanced employees’ incentivesPersonnelEnhanced employees’ incentives
Depreciation &AmortizationRMB26,544 Mil (maintained stable as a % of operating revenue)
Depreciation &AmortizationRMB26,544 Mil (maintained stable as a % of operating revenue)
Network Operations & Support*RMB14,970 Mil (+1.7% yoy; maintained stable as a % of operating revenue)
Network Operations & Support*RMB14,970 Mil (+1.7% yoy; maintained stable as a % of operating revenue)
PersonnelRMB13,857 Mil (+1.4% yoy; maintained stable as a % of operating revenue)
PersonnelRMB13,857 Mil (+1.4% yoy; maintained stable as a % of operating revenue)
SG&ARMB11,103 Mil (-0.5% yoy; -0.3 pp as a % of operating revenue)
SG&ARMB11,103 Mil (-0.5% yoy; -0.3 pp as a % of operating revenue)
SG&AControlled PAS handset subsidies & tilted investments toward profitable businesses & targeted customer segments
SG&AControlled PAS handset subsidies & tilted investments toward profitable businesses & targeted customer segments

28
CAPEX Structure
Enhanced CAPEX Structure
RMB Mil
20,745 18,783
9.6%
20.2%
39.2%
6.5%
19.1%
55.1%
22.2%
13.8%3.9%
0.5%
4.9%
5.0%
1H2007 1H2008
Internet & Data
IT & Support
Fixed Line Switches
Local Transmission & Access
PAS
Others*
Note: * Others include communication infrastructure and other capital expenditure
Enhanced CAPEX structure to support strategic transformation
Internet & Data 27.3% yoy
IT & Support 7.6% yoy
Fixed Line Switches 38.7% yoy
Local Transmission & Access 43.7% yoy
PAS 88.4% yoy
Others 14.4% yoy
Tilting investment toward transformation business & strictly controlling CAPEX on fixed-voice business & infrastructure facilities
Enhancing network support capability for transformation business
29
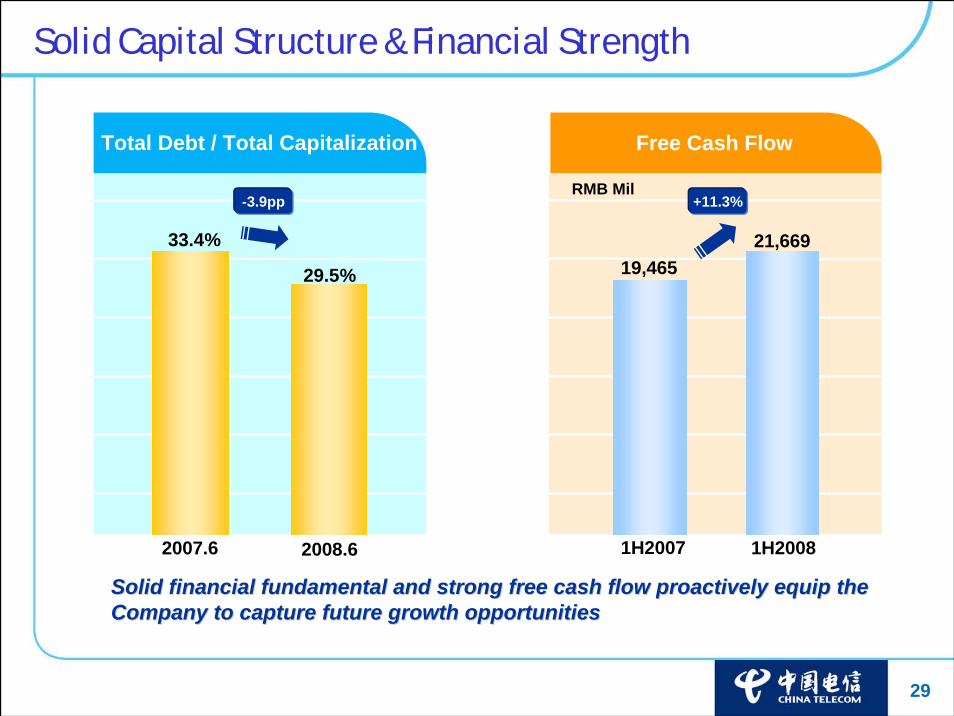
Solid Capital Structure & Financial Strength
RMB Mil
33.4%
2007.6 2008.6
19,46529.5%
21,669
Total Debt / Total Capitalization Free Cash Flow
Solid financial fundamental and strong free cash flow proactivelSolid financial fundamental and strong free cash flow proactively equip the y equip the Company to capture future growth opportunitiesCompany to capture future growth opportunities
-3.9pp +11.3%
1H2007 1H2008

30
Precision resource allocation by tilting resource toward high value customers and key businesses to support transformation
Precision resource allocation by tilting resource toward high value customers and key businesses to support transformation Deepening
value
management
to enhance
shareholders’
value
Deepening
value
management
to enhance
shareholders’
value
Further optimizing CAPEX & cost structure to effectively control financial risksFurther optimizing CAPEX & cost structure to effectively control financial risks
Strengthening centralized financial management leveraging corporate structure reform to improve treasury management and asset utilization
Strengthening centralized financial management leveraging corporate structure reform to improve treasury management and asset utilization
Rational resource allocation to fixed and mobile services leveraging existing resource & capability to drive synergy & promote profitable scale development of mobile business
Rational resource allocation to fixed and mobile services leveraging existing resource & capability to drive synergy & promote profitable scale development of mobile business
Innovative Measures to Support Full Services Offering

31
Thank
www.chinatelecom-h.com
Y O U

32
Unaudited1H2007
(Restated)*
Unaudited1H2008
12,63413,756Equity Holders of the Company
16,49318,681Profit Before Taxation
(71,682)(69,072)Operating Expenses
43
12,677(3,816)
30
(2,289)
1,028
90,434
27Minority Interests
13,783Profit for the Year(4,898)Income Tax
9Investment Loss, Share of Profit from Associates
(2,013)Net Finance Costs
1,666Upfront Connection Fees
89,757Operating Revenue
Extracted from unaudited income statementfor the 6 months ended 30 June 2008 (incl. upfront connection fees)Appendix 1
Note: * Restated to include the financial impact of acquisition of Beijing Telecom
RMB Mil

33
Extracted from unaudited balance sheet as at 30 June 2008(incl. upfront connection fees)
Unaudited31.12.2007 (Restated)*
1,4861,451Minority Interests
185,810187,359Total Liabilities
412,093413,331Total Assets
224,797
226,283
55,790
130,020
358,885
53,208
224,521Equity Attributable to Equity Holders of the Company
225,972Total Equity
47,114Non-current Liabilities
140,245Current Liabilities
369,221Non-current Assets
44,110Current Assets
Unaudited30.6.2008
Appendix 2
RMB Mil
Note: * Restated to include the financial impact of acquisition of Beijing Telecom

34
6,5316,894Interconnections
5,0254,371Managed Data & Leased Line11,9879,107VAS & Integrated Information Services
2,3752,464Others90,43489,757Total
19,04021,614Local Usage fees11,33112,440DLD
31,29636,355Local Voice Business
19,509
1,352
10,9651,291
1,028
14,907Internet Access
1,553ILD
13,326Monthly Fees1,415Upfront Installation Fees
1,666Upfront Connection Fees
Detailed operating revenue breakdownfor the 6 months ended 30 June 2008 (incl. upfront connection fees)
Unaudited1H2007
(Restated)*
Unaudited1H2008
Appendix 3
RMB Mil
Note: * Restated to include the financial impact of acquisition of Beijing Telecom