2008 survey of technology enhanced y learning for …dsc8/documents/2008surveyoftechenhan… ·...
TRANSCRIPT

uci
sa s
urv
ey2008 Survey of Technology Enhanced Learning for higher education in the UK

survey
2008 Survey of Technology Enhanced Learning for higher
education in the UK
by Tom Browne, Roger Hewitt, Martin Jenkins and Richard Walker

Contents
university of Oxford13 Banbury roadOxford OX2 6NN
Tel: +44 (0)1865 283425Fax: +44 (0)1865 283426email: [email protected]
u C I s A T L I g T e L s u r v e y 2 0 0 8
executive summary 2
Acknowledgements 3
Preface 3
Background 3
summary of conclusions 7
section 1: Factors encouraging development of TeL 8
section 2: strategic questions 10
section 3: Technology enhanced Learning currently in use 12
section 4: support for Technology enhanced Learning tools 24
section 5: Looking to the future... 27
Appendix A: Full 2008 data 31
Appendix B: Longitudinal analysis between 2008 and the 2005, 2003 and 2001 surveys 54
Appendix C: Specification of the questions from the 2001, 2003, 2005 and 2008 surveys for which longitudinal analysis was used in this report 60

u C I s A T L I g T e L s u r v e y 2 0 0 8 �
Executive summary
This Report records the results from a national Survey, undertaken by UCISA, with financial support from the JISC, into matters pertaining to Technology enhanced Learning (TeL). It builds upon similar surveys which were conducted in 2001, 2003 and 2005 and for which at each stage a longitudinal analysis was undertaken.
In the Survey TEL was defined as any online facility or system that directly supports learning and teaching. This may include a formal VLE, an institutional intranet that has a learning and teaching component, a system that has been developed in house or a particular suite of specific individual tools.
The main thrust of the report analyses the returns from the 2008 survey but, where appropriate, the longitudinal analysis is continued.
The 2005 Survey took place in the same year as the publication of two highly influential strategy documents on e-learning, by the Higher education Funding Council for england (HeFCe) and the Department for education and skills (Dfes). By this time, e-learning was clearly on the government’s national agenda. since then, other major developments have included the HeA e-learning benchmarking programme and the rise and rise of Web 2.0. E-learning was also ranked 2nd in the 2006/07 uCIsA list of Top Concerns.
A summary of the findings of the Report is as follows. Learning and teaching activities are consolidated longitudinally as the primary drivers for considering using TeL, although meeting student expectations is increasingly close as the next most important driver. The presence of a committed local champion continues to be the strongest influence on the rate at which TeL is developed and processes promoted within an institution. strategies are becoming much more embedded, with the biggest change internally since 2005 being the rise to prominence of e-learning strategies and externally, those from HEFCE and JISC have received increased prominence. Central funding for service support and project funding has assumed an even greater significance as a means of enabling development, with support, ranging from pedagogic to technical being provided from a variety of different types of units. Blackboard continues as the most used enterprise or institutional vLe. However, when also including vLes that are used more locally, e.g. within departments, then Moodle is most used with a rapid rise since 2005. Overall, there is a vastly reduced range of vLes in use since 2005.
The tools that have increased significantly in prominence are those for podcasting, e-portfolios, e-assessment, blogs and wikis. Career enhancement opportunities in TeL development still appear quite limited and lack of time was identified as the main barrier to further developments to promote TEL. Outsourcing is being increasingly evaluated for the hosting of systems, though there is no evidence that it is, as yet, widely employed for major, strategic institutional delivery. regarding new demands that would impact upon the provision of support, streaming media, mobile computing, podcasting and Web 2.0 were discernibly the greatest. staff skills were overwhelmingly noted as the greatest challenge that these new demands would create, with staff development and strategies being seen as the primary remedies. Throughout much of the data, subtle but clearly identifiable differences continue to be discernible between pre-92 and post-92 universities.

u C I s A T L I g T e L s u r v e y 2 0 0 8 �
Acknowledgements
The following have all made invaluable contributions to the preparation, conduct or analysis of the survey. It is customary in such circumstances to acknowledge their advice but to absolve them of blame for any subsequent inadequacies and imperfections. We gladly and appreciatively do both.
JISC, especially Charles Hutchings, Tish Roberts and Heather Williamson
ALT, especially seb schmoller
HeLF, especially Paul Brett
uCIsA–TLIg Committee, especially Paul Buckley
uCIsA Operational support team
The research Partnership, especially Nick smith
Preface
It is fascinating to note how the language has changed for the activities that the surveys attempted to capture between 2001 and 2008. In 2001, the uCIsA survey focused exclusively on asking questions concerning vLes. By 2003 the Survey had a much broader remit. It explored MLEs (Managed Learning Environments), as defined by JISC1 of which vLes (virtual Learning environments) were (merely) regarded as a component. In 2005, the vocabulary had moved away from the poorly understood term MLe to the more widely accepted term e-learning. By 2008, there had been yet another semantic shift towards phraseology that attempted to capture more explicitly the enhancing role of technology upon learning, with the term Technology Enhanced Learning (TeL) gaining increasing currency. TeL is, therefore, the lingua franca used in the 2008 survey.
Background
The 2008 survey is a continuation of those conducted between 2001 and 2005 but it also endeavours to capture contemporary issues that were barely on the horizon, even in 2005. yet although the challenges within the sector are constantly evolving, the rationale for the uCIsA community remains the same. To quote from 2001 (replace VLEs with TEL):
UCISA is aware that a number of issues relating to VLEs are having a significant impact on Computing/Information Services. They also represent cultural challenges for both academic staff and students in how they engage with their learning and teaching. Issues relate to choosing a VLE, its implementation, technical support and a whole range of support, training and pedagogic issues relating to its use.
The primary target, or stakeholder community, i.e. uCIsA, is a very broad constituency, engaging managers, learning technologists, learning theorists, and technical and administrative staff. Institutionally they can be found centrally or devolved in schools and departments. They can be in an IT unit or the Library, in Training and educational Development units, in specialist e-learning units or indeed in any combination of them all!
The reports for the 2001, 2003 and 2005 surveys are available on the uCIsA–TLIg website2. A peer reviewed analysis is also available3.
On each occasion, the community has valued the opportunity to receive an oversight of trends within uK He and to position their own institution in relation to them. However, we continue to caution against anyone attempting to use the statistics as performance indicators. There are different perspectives on where an institution may wish to be located in the spectrum of options. It cannot be assumed that there is a simplistic linear path of uniform development in a single direction.
1 JISC MLE and VLE definitions: www.jisc.ac.uk/index.cfm?name=mle_breifings_12 Previous UCISA Surveys: www. ucisa.ac.uk/groups/tlig/surveys.aspx3 Browne, T, Jenkins, M. and Walker, R. 2006. A Longitudinal Perspective Regarding the Use of VLEs by Higher Education Institutions in the United
Kingdom. Interactive Learning Environments 14(2) 177–192.

u C I s A T L I g T e L s u r v e y 2 0 0 8 �
The HeA e-learning benchmarking programme4, conducted in 2006/7 has done much to place the focus of attention firmly on the institutional agenda. HEIs reflected on the extent to which they had a vision, strategies to fit and appropriate organisational frameworks to implement their e-learning plans. The support community may sometimes feel at the end of this food chain, but the effectiveness of their role is highly dependent upon the cultural environment in which they are asked to perform. The benchmarking programme was fragmented into different communities, pursuing different models though they all noted that technological advances have been very rapid in the last two years, bringing many new educational oportunities and additional support headaches! It is these new challenges which the 2008 survey wished to capture. Also, although many members of uCIsA–TLIg may indeed have some institutional influence in determining strategies, it is the implementation of the infrastructures to sustain those strategies that are of particular importance and relevance to the support community, i.e. the core uCIsA constituency.
We were encouraged by general feedback from the community and from organisations such as HeLF and ALT to conduct the 2008 survey. Both the latter organisations provided extremely helpful feedback on a pilot we conducted in order to hone the questions. A further stimulus was provided by the 2007 uCIsA Top Concerns survey5, which was conducted using the uCIsA Directors’ mailing list. In response to the question Which concern is of most importance for institutions to resolve for strategic success, e-learning (the term used by the survey) came 3rd. It came 2nd in response to the question On which is your institution spending most resource and was also 2nd in the overall rankings based upon a total of four strategic questions. Two years previously, the rankings were 5th, outside the Top 10 and 5th, respectively. so, in the period since the 2005 uCIsA e-learning survey, issues relating to e-learning have become even more prominent.
Since the 2005 Survey, there have been three informal mini email surveys conducted on several JISCmail lists asking the sector questions primarily on what technologies were being used and what sort of organisational support was in place. These enquiries were probably motivated by internal reorganisations and a desire to emulate best practice from within the sector. The responses were invariably low but the mini surveys do demonstrate the desire by practitioners in our community for occasional snapshots of sector activity.
Finally, in early spring 2008, HeFCe embarked on a consultation to review their 2005 e-learning strategy. At the time of writing, its report has not yet been published, though it is anticipated that the emphasis will be on outcomes of using technology within learning and teaching, through normalisation and embedding, and less on the processes of employing the e within e-learning (their term, which it is anticipated they will discontinue).
The focus for the 2008 survey was on what had become know as Section 4 of the 2005 survey. As with all continuing surveys, we faced the challenge of maintaining continuity with previous ones, whilst not collecting merely stagnant data, and also keeping pace with new developments. The core of the questionnaire has been maintained to enable longitudinal analysis, but most of the bean counter questions have been removed as it can now be argued that TeL has become largely institutionally embedded, at least in terms of bulk superficiality of usage. New questions were introduced to capture the prevalence of Web 2.0. By having a much narrower scope to this survey, it was hoped that it would be easier to identify the target audience and we therefore anticipated that fewer people would be needed to be engaged at a given institution in order to complete it. The survey was sent by post to vCs and Principals and details on how to access the Word document were also available on the uCIsA website. The survey was completed in mid-February 2008.
The workersThe Survey was conducted by UCISA, through the work of Tom Browne (Exeter), Martin Jenkins (Gloucestershire) and richard Walker (york), and roger Hewitt (Manchester) who performed the role of Project Manager, all in collaboration with The Research Partnership (an independent survey organisation). JISC generously provided essential funding and valuable guidance.
The real workers were, of course, all those who completed the survey. Anecdotally, we have heard of several cases where the survey was used as an opportunity for colleagues across the spectrum to get together to consider the questions. They found the experience to be highly beneficial, even developmental.
Institutions surveyedIn previous surveys, a wide range of institutions within the HE definition were included, thereby encompassing many specialist colleges and institutions. For 2005, 213 institutions were sent the survey. However, few of the specialised and smaller institutions replied. Therefore, for 2008, only the 164 institutions as defined by the home countries Higher Education Councils were invited to complete the Survey. So, for England this identified 131 institutions, 19 in Scotland, 12 in Wales and 2 in Northern Ireland.
4 HEA Benchmarking programme: www.heacademy.ac.uk/ourwork/learning/elearning/benchmarking5 UCISA Top Concerns: www.ucisa.ac.uk/members/surveys/tc.aspx
u C I s A T L I g T e L s u r v e y 2 0 0 8 �
Presentation of dataThe presentation of the data is broken down into three main parts. The main text will focus on results from the 2008 survey and where appropriate, highlights from that data will be presented in tabular or graphical form. The full tabular data for each question for 2008 is presented in Appendix A. Where longitudinal analysis can be performed, any presentation of that data is in Appendix B. In most instances, it will only be shown for 2003 and 2005 because the removal and modification of questions since 2001 rarely warrants detailed comparison with that first survey. As part of the general narrative, any longitudinal analysis will be in the main text.
The classification of higher education institutions into pre-92, post-92 and HE colleges is that used by the Higher education statistics Agency (HesA)6.
regarding the presentation of percentages, they have been rounded to whole numbers, so a column of values will not necessarily add up to 100%. regarding the data for Northern Ireland, only one institution responded, so its data will not be explicitly shown in any numeric form.
This report focuses primarily on presenting the data in a manner that will enable institutions to position themselves in relation to sector trends. It is not the main purpose of this report to provide detailed interpretation of the data, although some trends will be highlighted.
A draft version of the report was presented to the uCIsA user support Conference7 in July 2008. Valuable feedback was received from the delegates, which has assisted us in producing the final Report.
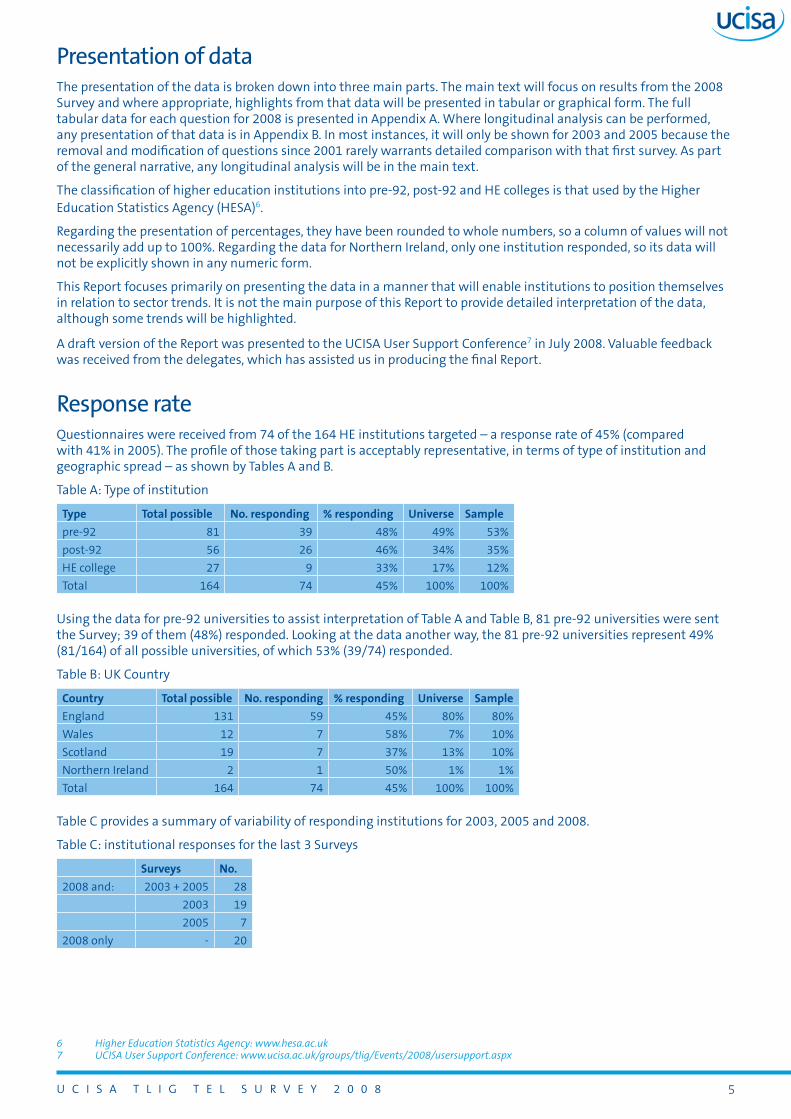
Response rateQuestionnaires were received from 74 of the 164 He institutions targeted – a response rate of 45% (compared with 41% in 2005). The profile of those taking part is acceptably representative, in terms of type of institution and geographic spread – as shown by Tables A and B.
Table A: Type of institution
Type Total possible No. responding % responding universe sample
pre-92 81 39 48% 49% 53%
post-92 56 26 46% 34% 35%
He college 27 9 33% 17% 12%
Total 164 74 45% 100% 100%
using the data for pre-92 universities to assist interpretation of Table A and Table B, 81 pre-92 universities were sent the survey; 39 of them (48%) responded. Looking at the data another way, the 81 pre-92 universities represent 49% (81/164) of all possible universities, of which 53% (39/74) responded.
Table B: uK Country
country Total possible No. responding % responding universe sample
england 131 59 45% 80% 80%
Wales 12 7 58% 7% 10%
scotland 19 7 37% 13% 10%
Northern Ireland 2 1 50% 1% 1%
Total 164 74 45% 100% 100%
Table C provides a summary of variability of responding institutions for 2003, 2005 and 2008.
Table C: institutional responses for the last 3 surveys
surveys No.
2008 and: 2003 + 2005 28
2003 19
2005 7
2008 only - 20
6 Higher Education Statistics Agency: www.hesa.ac.uk7 UCISA User Support Conference: www.ucisa.ac.uk/groups/tlig/Events/2008/usersupport.aspx

u C I s A T L I g T e L s u r v e y 2 0 0 8 �
some institutions have not responded to any of the surveys! Only 28 of the 74 that responded to the 2008 survey also responded to the 2005 and 2003 surveys. Nevertheless, a consistent longitudinal story is evident in the following analysis, suggesting that the responses are not merely an artefact of receiving returns from the same universities.
Response scalesFor previous surveys, a Likert scale of 1–5 was used. However, the middle option, which is invariably construed as being neither important/unimportant was deemed to be uninformative. so, for 2008 this option was removed to, in effect, encourage the respondents to make a more explicit choice. Therefore, a four point scale was used, namely:
1 = Not at all important
2 = Not very important
3 = Fairly important
4 = very important
regarding longitudinal analysis, it is reasonable to compare rankings between surveys, but with different scales being used it would clearly be unwise to compare means between 2008 and the equivalent value from earlier surveys. In some cases, the questions compared do not have exactly the same wording. The wording of the question as recorded for each survey is given in Appendix C.
u C I s A T L I g T e L s u r v e y 2 0 0 8 �
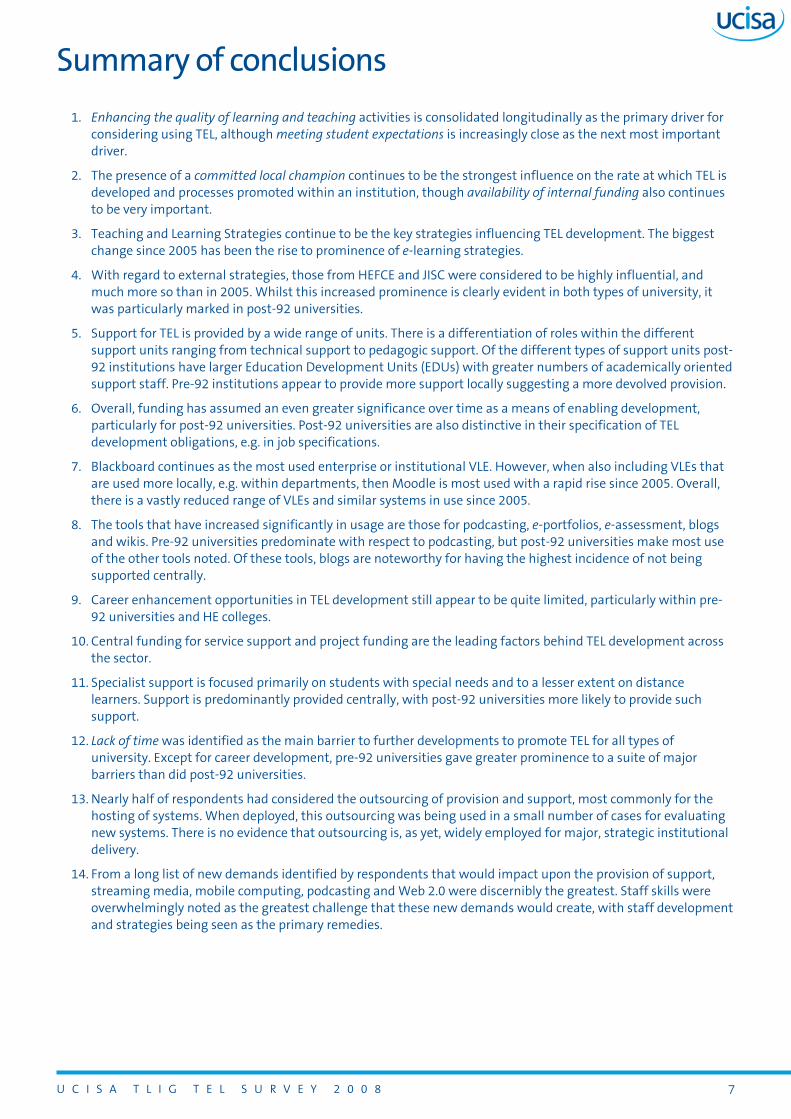
Summary of conclusions
Enhancing the quality of learning and teaching activities is consolidated longitudinally as the primary driver for considering using TeL, although meeting student expectations is increasingly close as the next most important driver.
The presence of a committed local champion continues to be the strongest influence on the rate at which TeL is developed and processes promoted within an institution, though availability of internal funding also continues to be very important.
Teaching and Learning strategies continue to be the key strategies influencing TeL development. The biggest change since 2005 has been the rise to prominence of e-learning strategies.
With regard to external strategies, those from HEFCE and JISC were considered to be highly influential, and much more so than in 2005. Whilst this increased prominence is clearly evident in both types of university, it was particularly marked in post-92 universities.
support for TeL is provided by a wide range of units. There is a differentiation of roles within the different support units ranging from technical support to pedagogic support. Of the different types of support units post-92 institutions have larger education Development units (eDus) with greater numbers of academically oriented support staff. Pre-92 institutions appear to provide more support locally suggesting a more devolved provision.
Overall, funding has assumed an even greater significance over time as a means of enabling development, particularly for post-92 universities. Post-92 universities are also distinctive in their specification of TeL development obligations, e.g. in job specifications.
Blackboard continues as the most used enterprise or institutional vLe. However, when also including vLes that are used more locally, e.g. within departments, then Moodle is most used with a rapid rise since 2005. Overall, there is a vastly reduced range of vLes and similar systems in use since 2005.
The tools that have increased significantly in usage are those for podcasting, e-portfolios, e-assessment, blogs and wikis. Pre-92 universities predominate with respect to podcasting, but post-92 universities make most use of the other tools noted. Of these tools, blogs are noteworthy for having the highest incidence of not being supported centrally.
Career enhancement opportunities in TeL development still appear to be quite limited, particularly within pre-92 universities and He colleges.
Central funding for service support and project funding are the leading factors behind TeL development across the sector.
specialist support is focused primarily on students with special needs and to a lesser extent on distance learners. support is predominantly provided centrally, with post-92 universities more likely to provide such support.
Lack of time was identified as the main barrier to further developments to promote TeL for all types of university. except for career development, pre-92 universities gave greater prominence to a suite of major barriers than did post-92 universities.
Nearly half of respondents had considered the outsourcing of provision and support, most commonly for the hosting of systems. When deployed, this outsourcing was being used in a small number of cases for evaluating new systems. There is no evidence that outsourcing is, as yet, widely employed for major, strategic institutional delivery.
From a long list of new demands identified by respondents that would impact upon the provision of support, streaming media, mobile computing, podcasting and Web 2.0 were discernibly the greatest. staff skills were overwhelmingly noted as the greatest challenge that these new demands would create, with staff development and strategies being seen as the primary remedies.
1.
2.
3.
4.
5.
6.
7.
8.
9.
10.
11.
12.
13.
14.
u C I s A T L I g T e L s u r v e y 2 0 0 8 �
Section 1: Factors encouraging development of TEL
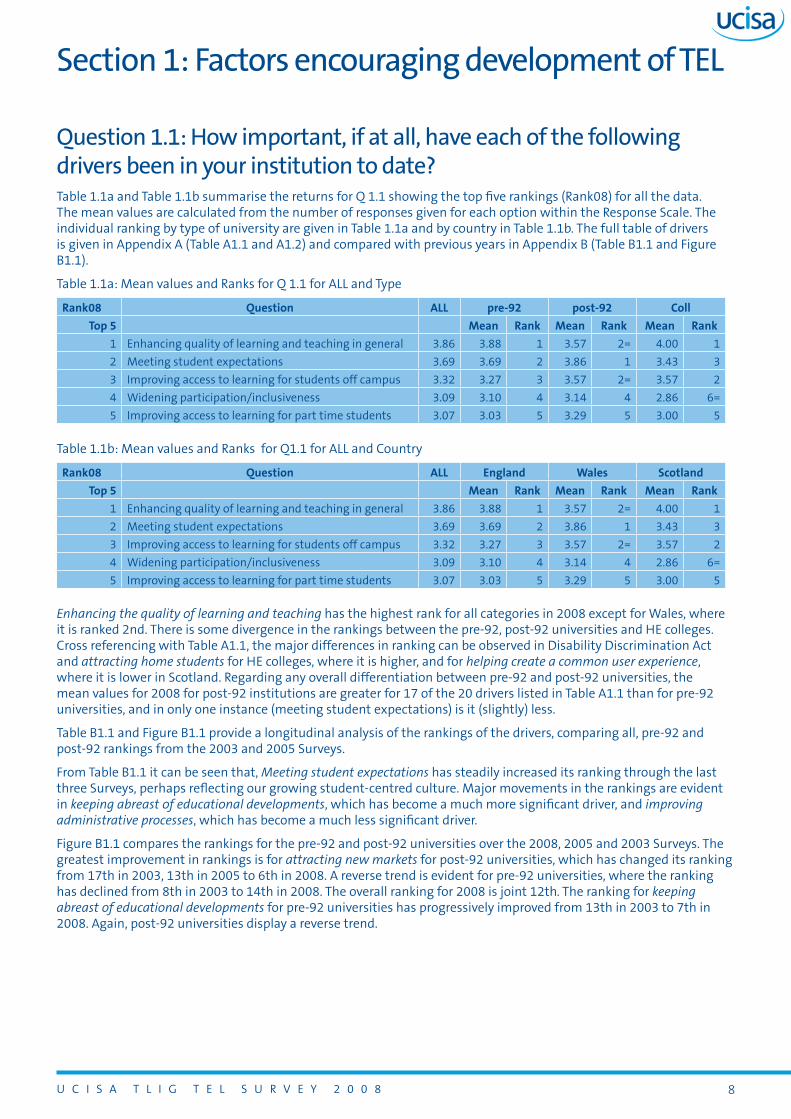
Question 1.1: How important, if at all, have each of the following drivers been in your institution to date?Table 1.1a and Table 1.1b summarise the returns for Q 1.1 showing the top five rankings (Rank08) for all the data. The mean values are calculated from the number of responses given for each option within the response scale. The individual ranking by type of university are given in Table 1.1a and by country in Table 1.1b. The full table of drivers is given in Appendix A (Table A1.1 and A1.2) and compared with previous years in Appendix B (Table B1.1 and Figure B1.1).
Table 1.1a: Mean values and ranks for Q 1.1 for ALL and Type
rank08 Question aLL pre-92 post-92 coll
Top 5 Mean rank Mean rank Mean rank
1 enhancing quality of learning and teaching in general 3.86 3.88 1 3.57 2= 4.00 1
2 Meeting student expectations 3.69 3.69 2 3.86 1 3.43 3
3 Improving access to learning for students off campus 3.32 3.27 3 3.57 2= 3.57 2
4 Widening participation/inclusiveness 3.09 3.10 4 3.14 4 2.86 6=
5 Improving access to learning for part time students 3.07 3.03 5 3.29 5 3.00 5
Table 1.1b: Mean values and ranks for Q1.1 for ALL and Country
rank08 Question aLL england Wales scotland
Top 5 Mean rank Mean rank Mean rank
1 enhancing quality of learning and teaching in general 3.86 3.88 1 3.57 2= 4.00 1
2 Meeting student expectations 3.69 3.69 2 3.86 1 3.43 3
3 Improving access to learning for students off campus 3.32 3.27 3 3.57 2= 3.57 2
4 Widening participation/inclusiveness 3.09 3.10 4 3.14 4 2.86 6=
5 Improving access to learning for part time students 3.07 3.03 5 3.29 5 3.00 5
Enhancing the quality of learning and teaching has the highest rank for all categories in 2008 except for Wales, where it is ranked 2nd. There is some divergence in the rankings between the pre-92, post-92 universities and He colleges. Cross referencing with Table A1.1, the major differences in ranking can be observed in Disability Discrimination Act and attracting home students for He colleges, where it is higher, and for helping create a common user experience, where it is lower in scotland. regarding any overall differentiation between pre-92 and post-92 universities, the mean values for 2008 for post-92 institutions are greater for 17 of the 20 drivers listed in Table A1.1 than for pre-92 universities, and in only one instance (meeting student expectations) is it (slightly) less.
Table B1.1 and Figure B1.1 provide a longitudinal analysis of the rankings of the drivers, comparing all, pre-92 and post-92 rankings from the 2003 and 2005 surveys.
From Table B1.1 it can be seen that, Meeting student expectations has steadily increased its ranking through the last three Surveys, perhaps reflecting our growing student-centred culture. Major movements in the rankings are evident in keeping abreast of educational developments, which has become a much more significant driver, and improving administrative processes, which has become a much less significant driver.
Figure B1.1 compares the rankings for the pre-92 and post-92 universities over the 2008, 2005 and 2003 surveys. The greatest improvement in rankings is for attracting new markets for post-92 universities, which has changed its ranking from 17th in 2003, 13th in 2005 to 6th in 2008. A reverse trend is evident for pre-92 universities, where the ranking has declined from 8th in 2003 to 14th in 2008. The overall ranking for 2008 is joint 12th. The ranking for keeping abreast of educational developments for pre-92 universities has progressively improved from 13th in 2003 to 7th in 2008. Again, post-92 universities display a reverse trend.
u C I s A T L I g T e L s u r v e y 2 0 0 8 �
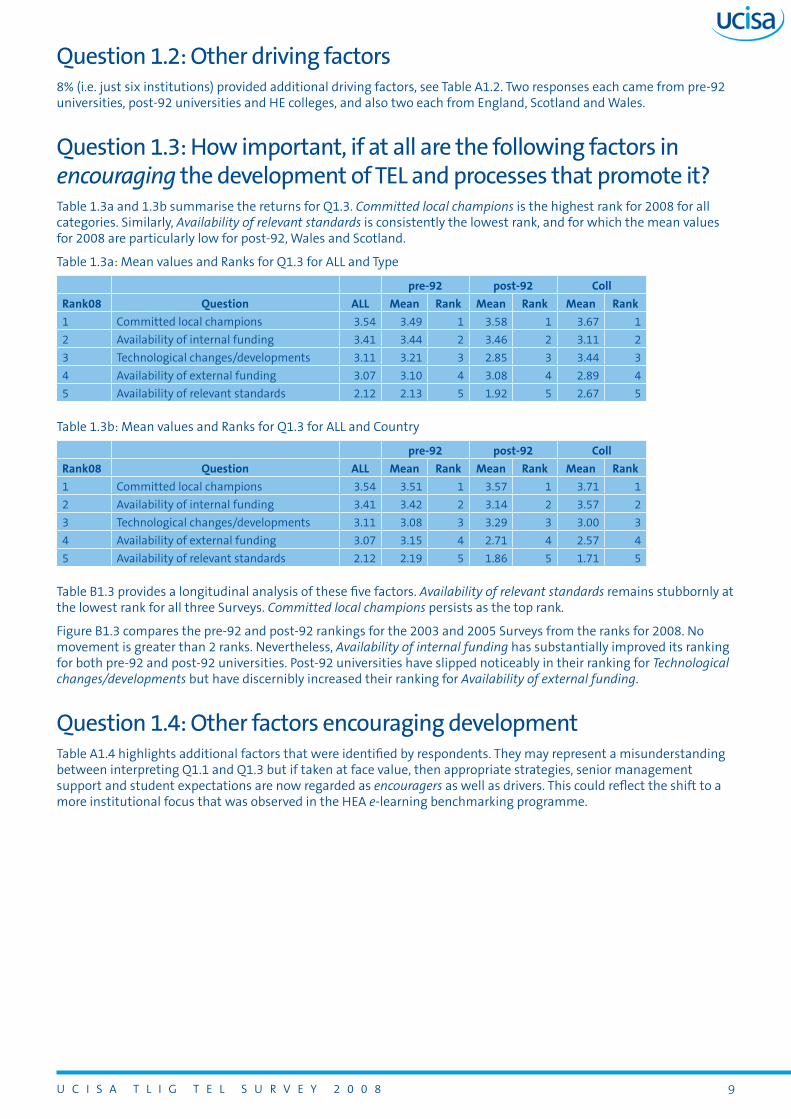
Question 1.2: Other driving factors8% (i.e. just six institutions) provided additional driving factors, see Table A1.2. Two responses each came from pre-92 universities, post-92 universities and He colleges, and also two each from england, scotland and Wales.
Question 1.3: How important, if at all are the following factors in encouraging the development of TEL and processes that promote it?Table 1.3a and 1.3b summarise the returns for Q1.3. Committed local champions is the highest rank for 2008 for all categories. similarly, Availability of relevant standards is consistently the lowest rank, and for which the mean values for 2008 are particularly low for post-92, Wales and scotland.
Table 1.3a: Mean values and ranks for Q1.3 for ALL and Type
pre-92 post-92 coll
rank08 Question aLL Mean rank Mean rank Mean rank
1 Committed local champions 3.54 3.49 1 3.58 1 3.67 1
2 Availability of internal funding 3.41 3.44 2 3.46 2 3.11 2
3 Technological changes/developments 3.11 3.21 3 2.85 3 3.44 3
4 Availability of external funding 3.07 3.10 4 3.08 4 2.89 4
5 Availability of relevant standards 2.12 2.13 5 1.92 5 2.67 5
Table 1.3b: Mean values and ranks for Q1.3 for ALL and Country
pre-92 post-92 coll
rank08 Question aLL Mean rank Mean rank Mean rank
1 Committed local champions 3.54 3.51 1 3.57 1 3.71 1
2 Availability of internal funding 3.41 3.42 2 3.14 2 3.57 2
3 Technological changes/developments 3.11 3.08 3 3.29 3 3.00 3
4 Availability of external funding 3.07 3.15 4 2.71 4 2.57 4
5 Availability of relevant standards 2.12 2.19 5 1.86 5 1.71 5
Table B1.3 provides a longitudinal analysis of these five factors. Availability of relevant standards remains stubbornly at the lowest rank for all three surveys. Committed local champions persists as the top rank.
Figure B1.3 compares the pre-92 and post-92 rankings for the 2003 and 2005 surveys from the ranks for 2008. No movement is greater than 2 ranks. Nevertheless, Availability of internal funding has substantially improved its ranking for both pre-92 and post-92 universities. Post-92 universities have slipped noticeably in their ranking for Technological changes/developments but have discernibly increased their ranking for Availability of external funding.
Question 1.4: Other factors encouraging developmentTable A1.4 highlights additional factors that were identified by respondents. They may represent a misunderstanding between interpreting Q1.1 and Q1.3 but if taken at face value, then appropriate strategies, senior management support and student expectations are now regarded as encouragers as well as drivers. This could reflect the shift to a more institutional focus that was observed in the HeA e-learning benchmarking programme.

u C I s A T L I g T e L s u r v e y 2 0 0 8 10
Section 2: Strategic questions
Section 2 of the Survey looked at the influence of internal and external strategies on the development of TEL within institutions. The questions employed in the 2003 and 2005 surveys were used again in this section. However, the focus of strategic development in the 2008 survey shifted away from e-learning to TeL development. We therefore need to be circumspect when analysing the longitudinal significance of the results.
Question 2.1: Which, if any institutional strategies, inform the development of technology enhanced learning in your institution?Table 2.1: Institutional strategies that have informed TeL development
No. Total pre-92 post-92 coll eng Wal sco
Teaching and Learning 74 100% 100% 100% 100% 100% 100% 100%
Library/learning resources 56 76% 64% 85% 100% 78% 86% 43%
E-learning strategy 56 76% 69% 85% 78% 80% 57% 57%
Corporate 52 70% 56% 89% 78% 73% 43% 71%
estates 43 58% 39% 85% 67% 34% 43% 57%
Quality enhancement 43 58% 39% 85% 67% 56% 57% 71%
Access/widening participation 40 54% 44% 77% 33% 49% 86% 57%
Information and Communication Technology 34 46% 44% 50% 44% 44% 43% 57%
Information 33 45% 28% 69% 44% 48% 43% 29%
Information and Learning Technology 30 41% 33% 54% 33% 36% 86% 43%
Human resources 21 28% 13% 54% 22% 31% 43% 0%
Marketing 20 27% 18% 39% 33% 22% 43% 43%
Communications 11 15% 13% 19% 11% 10% 29% 29%
E-strategy 8 11% 8% 19% 0% 12% 14% 0%
Other 7 10% 10% 7% 11% 7% 43% 0%
The 2008 results indicate a high level of attention to TeL development in institutional strategies. All respondents identified the Teaching and Learning strategy as a key influence on TEL development, reflecting the high level of agreement for e-learning development recorded in the 2005 survey (95% agreement). Library/learning resources strategies were also widely cited by post-92 universities and He colleges. The key development from 2005 is in the rise to prominence of institutional e-learning strategies. returns from 2003 (37%) and 2005 (55%) illustrate the growing importance of dedicated e-learning strategies, and this trend is reinforced by the 2008 returns (76%). In particular, post-92 institutions appear to have developed dedicated strategies in this area (84%). TeL also appears to have a growing presence within corporate strategies (70% in 2008 as opposed to 53% in 2005) – and within institutional quality enhancement strategies on TeL (58% agreement in 2008, as opposed to 41% in 2005). strategies in the areas of communications, marketing and HR appear to offer little for TEL development, a finding consistent with the results from the 2003 and 2005 surveys.
The results suggest that post-92 institutions appear to have made the most progress in embedding TeL within their institutional strategies, as reflected in their Estates strategy (67%), Information strategy (68%) and Accessibility/widening participation strategy (77%). This represents a new trend in comparison with 2005 results, distinguishing them from pre-92 and He colleges.
Question 2.2: Which, if any external strategy documents inform the development of technology enhanced learning in your institution?This was introduced in 2005 as a companion question relating to the influence of external agencies on e-learning developments. Again, the focus has shifted to TeL developments in the 2008 survey. As revealed in Table-2.2, the most common strategy cited was the HeFCe e-learning strategy (80%), which reflected a marked increase in support from the 2005 Survey return (50%). Unsurprisingly, this was picked out by 92% of English institutions as being significant.

u C I s A T L I g T e L s u r v e y 2 0 0 8 11
Table 2.2: external strategy documents that have informed the development of TeL
No. Total pre-92 post-92 coll eng Wal sco
HeFCe e-learning strategy 59 80% 82% 77% 78% 92% 43% 14%
JISC strategies 57 77% 72% 85% 78% 75% 86% 86%
Dfes e-learning strategy 35 47% 44% 54% 44% 54% 14% 14%
strategies from professional bodies or agencies 25 34% 56% 46% 33% 27% 57% 71%
Other HeFCe strategy documents 21 28% 26% 35% 22% 32% 43% 0%
Other external strategy 13 18% 23% 15% 0% 12% 57% 29%
Joint Scottish Funding Councils e-learning report 8 11% 13% 12% 0% 2% 0% 100%
No external strategy 1 1% 0% 0% 11% 2% 0% 0%
The JISC strategies were also widely cited (77%), again reflecting a significant increase in influence from the 2005 survey (24%), and this was shared across national sectors (86% for scotland and Wales).
The Dfes e-strategy attracted less support (47%) across the sector – 54% for english HeIs but minimal support from Scottish/Welsh institutions. Unsurprisingly, the Joint Scottish Funding Council e-learning strategy was cited by all Scottish respondents, and the HEFCW technology enhancement strategy was strongly identified by Welsh institutions. The 2008 returns indicate a noticeable decline in significance for strategies from professional bodies or agencies (34%), which were widely cited in the 2005 survey (73%).

u C I s A T L I g T e L s u r v e y 2 0 0 8 1�
Section 3: Technology enhanced learning currently in use
section 3 of the survey looked at the details of TeL activities within institutions. New questions were introduced for the 2008 survey, focusing on the impact of strategy on TeL implementation plans and the take up of TeL tools by students. The 2008 questions therefore departed from previous surveys in focusing on specific tools and technologies to support learning activities, rather than those embedded within an institutional vLe, in a bid to capture Web 2.0 developments and student owned tools usage.
Question 3.1: To what extent, if at all, do any internal or external strategies on the development of technology enhanced learning influence the implementation of the various tools in practice?This was a new question introduced for the 2008 survey, looking at the impact of strategy on TeL plans. The results, given in Table 3.1 reflect a strong level of agreement (86%) that strategies do influence implementation.
Again, post-92 universities feature strongly, with 58% responding that strategies have a great influence, as opposed to 20% of pre-92 universities and 11% of He colleges.
Table 3.1: The extent to which internal or external strategies on the development of TEL have influenced the implementation of the various tools in practice
No. Total pre-92 post-92 coll eng Wal sco
Strategies have a great influence on implementation 24 32% 21% 58% 11% 34% 43% 100%
Strategies influence implementation 40 54% 62% 39% 67% 53% 43% 71%
Strategies have limited influence on implementation 10 14% 18% 4% 22% 14% 57% 14%
Strategies have no influence on implementation 0 0% 0% 0% 0% 0% 0% 0%
Question 3.2: What policies, if any, link strategy and implementation of technology enhanced learning tools?This was a companion question, asking respondents to give examples of policies which linked strategies to the implementation of TeL tools. A cluster analysis was carried out on the answers and the list below shows the most common responses, indicating the percentage of respondents who highlighted these policies.
Table 3.2: Policies which link strategy and implementation of TeL tools
Policy %
E-learning strategy and policy 23%
Learning and teaching strategy 22%
ICT strategy and policy 12%
Teaching, learning and assessment policy 12%
Corporate strategy and university plan 5%
Information and communications policy 5%
Library development policies 5%
A full list of the results of the cluster analysis is provided in Table A3.2. Dedicated e-learning strategy and policies were mentioned most commonly by respondents and the learning and teaching strategy was also widely cited as being significant. ICT policies and teaching, learning and assessment policies were also identified. Other categories also mentioned included information and communications policy and corporate strategy/the university plan.
u C I s A T L I g T e L s u r v e y 2 0 0 8 1�
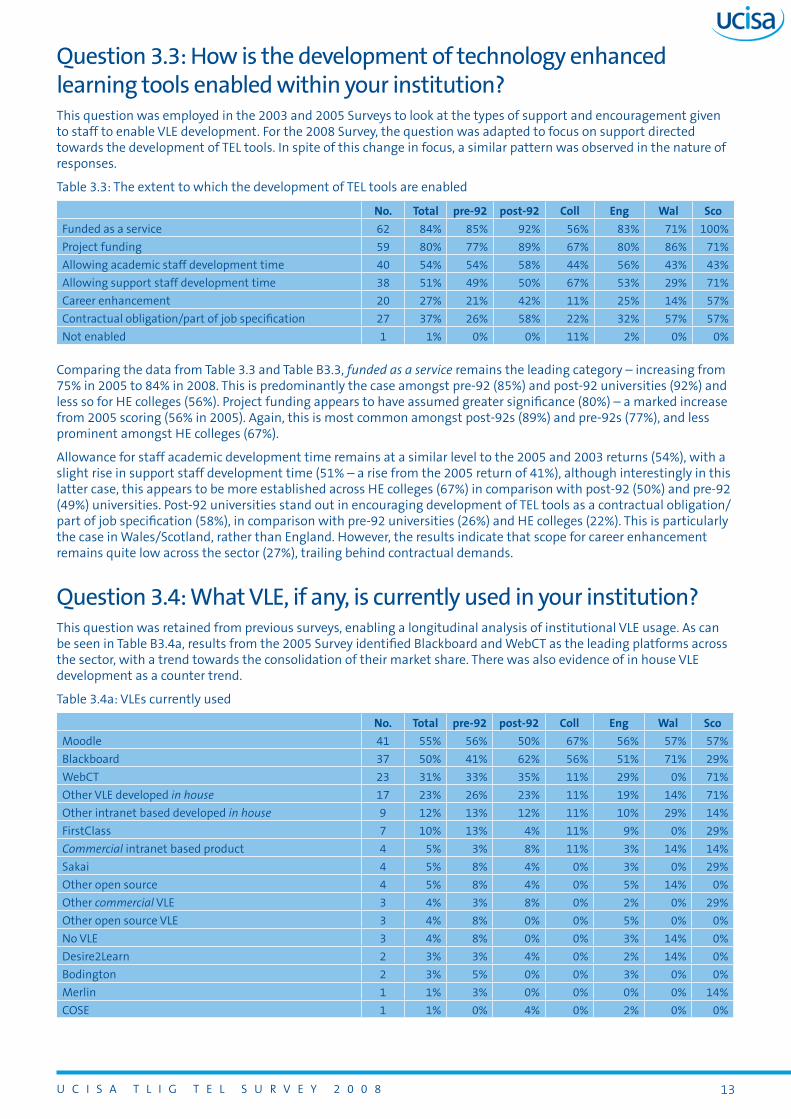
Question 3.3: How is the development of technology enhanced learning tools enabled within your institution?This question was employed in the 2003 and 2005 surveys to look at the types of support and encouragement given to staff to enable vLe development. For the 2008 survey, the question was adapted to focus on support directed towards the development of TeL tools. In spite of this change in focus, a similar pattern was observed in the nature of responses.
Table 3.3: The extent to which the development of TeL tools are enabled
No. Total pre-92 post-92 coll eng Wal sco
Funded as a service 62 84% 85% 92% 56% 83% 71% 100%
Project funding 59 80% 77% 89% 67% 80% 86% 71%
Allowing academic staff development time 40 54% 54% 58% 44% 56% 43% 43%
Allowing support staff development time 38 51% 49% 50% 67% 53% 29% 71%
Career enhancement 20 27% 21% 42% 11% 25% 14% 57%
Contractual obligation/part of job specification 27 37% 26% 58% 22% 32% 57% 57%
Not enabled 1 1% 0% 0% 11% 2% 0% 0%
Comparing the data from Table 3.3 and Table B3.3, funded as a service remains the leading category – increasing from 75% in 2005 to 84% in 2008. This is predominantly the case amongst pre-92 (85%) and post-92 universities (92%) and less so for HE colleges (56%). Project funding appears to have assumed greater significance (80%) – a marked increase from 2005 scoring (56% in 2005). Again, this is most common amongst post-92s (89%) and pre-92s (77%), and less prominent amongst He colleges (67%).
Allowance for staff academic development time remains at a similar level to the 2005 and 2003 returns (54%), with a slight rise in support staff development time (51% – a rise from the 2005 return of 41%), although interestingly in this latter case, this appears to be more established across He colleges (67%) in comparison with post-92 (50%) and pre-92 (49%) universities. Post-92 universities stand out in encouraging development of TeL tools as a contractual obligation/part of job specification (58%), in comparison with pre-92 universities (26%) and HE colleges (22%). This is particularly the case in Wales/scotland, rather than england. However, the results indicate that scope for career enhancement remains quite low across the sector (27%), trailing behind contractual demands.
Question 3.4: What VLE, if any, is currently used in your institution?This question was retained from previous surveys, enabling a longitudinal analysis of institutional vLe usage. As can be seen in Table B3.4a, results from the 2005 Survey identified Blackboard and WebCT as the leading platforms across the sector, with a trend towards the consolidation of their market share. There was also evidence of in house vLe development as a counter trend.
Table 3.4a: vLes currently used
No. Total pre-92 post-92 coll eng Wal sco
Moodle 41 55% 56% 50% 67% 56% 57% 57%
Blackboard 37 50% 41% 62% 56% 51% 71% 29%
WebCT 23 31% 33% 35% 11% 29% 0% 71%
Other vLe developed in house 17 23% 26% 23% 11% 19% 14% 71%
Other intranet based developed in house 9 12% 13% 12% 11% 10% 29% 14%
FirstClass 7 10% 13% 4% 11% 9% 0% 29%
Commercial intranet based product 4 5% 3% 8% 11% 3% 14% 14%
sakai 4 5% 8% 4% 0% 3% 0% 29%
Other open source 4 5% 8% 4% 0% 5% 14% 0%
Other commercial vLe 3 4% 3% 8% 0% 2% 0% 29%
Other open source vLe 3 4% 8% 0% 0% 5% 0% 0%
No vLe 3 4% 8% 0% 0% 3% 14% 0%
Desire2Learn 2 3% 3% 4% 0% 2% 14% 0%
Bodington 2 3% 5% 0% 0% 3% 0% 0%
Merlin 1 1% 3% 0% 0% 0% 0% 14%
COse 1 1% 0% 4% 0% 2% 0% 0%
u C I s A T L I g T e L s u r v e y 2 0 0 8 1�
Three years on and the 2008 survey results reveal a different picture. Moodle emerges as the most commonly used platform within institutions, with 55% of respondents identifying its deployment, representing a marked increase from 2005 (8%). Moodle is particularly prominent amongst He colleges (67%) and pre-92 institutions (56%), although less so amongst post-92 institutions. In contrast, in house vLe and intranet based developments appear much reduced across the sector, with a greater consolidation in the range of platforms in use. SharePoint was identified as the leading institutionally developed platform. Other open source platforms such as Bodington have a much reduced presence.
Of the commercial platforms, Blackboard remains the market leader and is widely used – a rise to 50% from its 43% score in 2005, with 61% of post-92 institutions identifying its use. WebCT features strongly amongst scottish institutions (71%), although its presence across the sector has declined from 37% in 2005 to 31% in 2008. In contrast, commercial platforms such as Top Class, Colloquia, Lotus Domino and Learning space have disappeared from view and others such as FirstClass are much reduced in terms of their presence across the sector. The results point to a growing maturity in the vLe market, with a vastly reduced range of systems supported within He institutions.
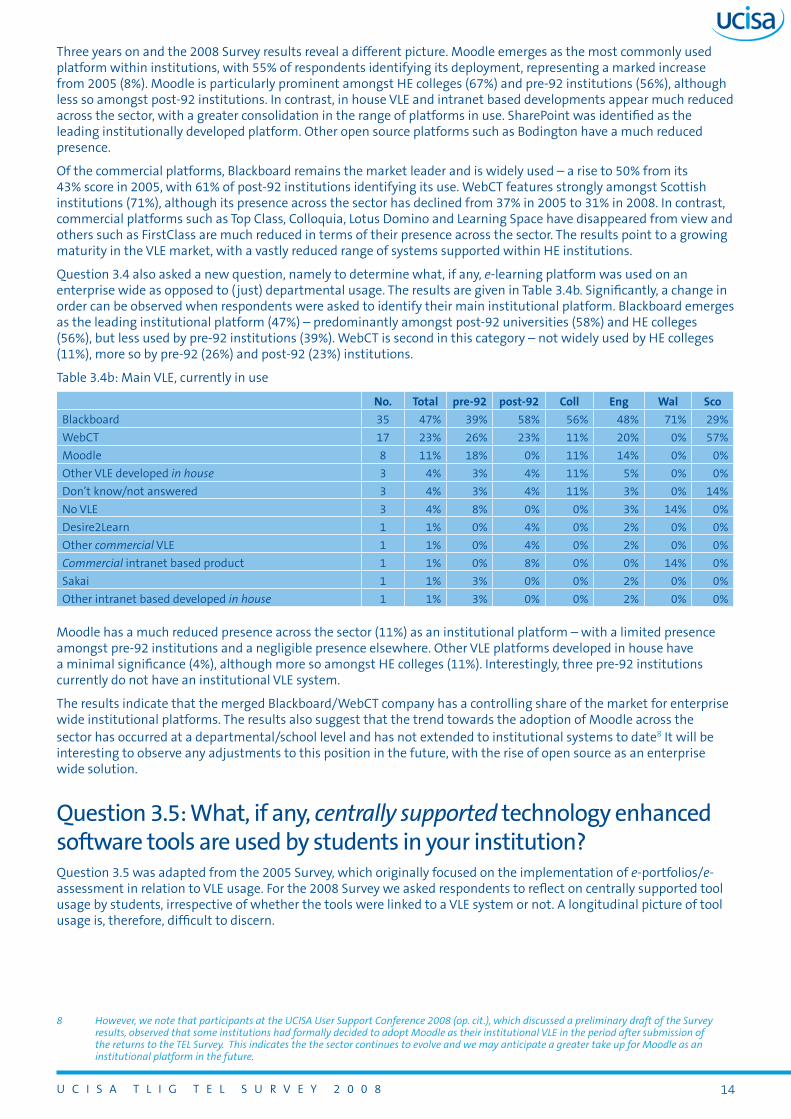
Question 3.4 also asked a new question, namely to determine what, if any, e-learning platform was used on an enterprise wide as opposed to ( just) departmental usage. The results are given in Table 3.4b. Significantly, a change in order can be observed when respondents were asked to identify their main institutional platform. Blackboard emerges as the leading institutional platform (47%) – predominantly amongst post-92 universities (58%) and He colleges (56%), but less used by pre-92 institutions (39%). WebCT is second in this category – not widely used by He colleges (11%), more so by pre-92 (26%) and post-92 (23%) institutions.
Table 3.4b: Main vLe, currently in use
No. Total pre-92 post-92 coll eng Wal sco
Blackboard 35 47% 39% 58% 56% 48% 71% 29%
WebCT 17 23% 26% 23% 11% 20% 0% 57%
Moodle 8 11% 18% 0% 11% 14% 0% 0%
Other vLe developed in house 3 4% 3% 4% 11% 5% 0% 0%
Don’t know/not answered 3 4% 3% 4% 11% 3% 0% 14%
No vLe 3 4% 8% 0% 0% 3% 14% 0%
Desire2Learn 1 1% 0% 4% 0% 2% 0% 0%
Other commercial vLe 1 1% 0% 4% 0% 2% 0% 0%
Commercial intranet based product 1 1% 0% 8% 0% 0% 14% 0%
sakai 1 1% 3% 0% 0% 2% 0% 0%
Other intranet based developed in house 1 1% 3% 0% 0% 2% 0% 0%
Moodle has a much reduced presence across the sector (11%) as an institutional platform – with a limited presence amongst pre-92 institutions and a negligible presence elsewhere. Other vLe platforms developed in house have a minimal significance (4%), although more so amongst HE colleges (11%). Interestingly, three pre-92 institutions currently do not have an institutional vLe system.
The results indicate that the merged Blackboard/WebCT company has a controlling share of the market for enterprise wide institutional platforms. The results also suggest that the trend towards the adoption of Moodle across the sector has occurred at a departmental/school level and has not extended to institutional systems to date8 It will be interesting to observe any adjustments to this position in the future, with the rise of open source as an enterprise wide solution.
Question 3.5: What, if any, centrally supported technology enhanced software tools are used by students in your institution?Question 3.5 was adapted from the 2005 survey, which originally focused on the implementation of e-portfolios/e-assessment in relation to VLE usage. For the 2008 Survey we asked respondents to reflect on centrally supported tool usage by students, irrespective of whether the tools were linked to a vLe system or not. A longitudinal picture of tool usage is, therefore, difficult to discern.
8 However, we note that participants at the UCISA User Support Conference 2008 (op. cit.), which discussed a preliminary draft of the Survey results, observed that some institutions had formally decided to adopt Moodle as their institutional VLE in the period after submission of the returns to the TEL Survey. This indicates the the sector continues to evolve and we may anticipate a greater take up for Moodle as an institutional platform in the future.

u C I s A T L I g T e L s u r v e y 2 0 0 8 1�
Table 3.5: Centrally supported technology enhanced software tools used by students
No. Total pre-92 post-92 coll eng Wal sco
e-assessment 57 77% 72% 92% 56% 75% 71% 100%
Blog 53 72% 69% 81% 56% 73% 71% 71%
Podcasting 51 69% 64% 77% 67% 68% 86% 71%
e-portfolio 50 68% 67% 73% 56% 70% 29% 86%
Wiki 47 64% 59% 73% 56% 64% 71% 57%
social bookmarking 21 28% 31% 35% 0% 29% 294% 29%
Other software tool 9 12% 13% 15% 0% 14% 0% 14%
The 2008 results, shown in Table 3.5 suggest, however, that software tools are widely used across the sector, with e-assessment representing the leading category, with only social bookmarking reflected as an emerging activity. Interestingly the cross tabulation for national institutions reveals that centrally supported e-portfolio tools are not widely used amongst Welsh institutions. However, this does not mean that e-portfolio activities are limited in scope amongst Welsh institutions, as the data in Table 3.10 (below) confirms that extensive activity is taking place.
Tables 3.5a to 3.5g provide highlights to the detailed responses to Question 3.5. Full results are given in Tables A3.5a to A3.5g.
Table 3.5a: Centrally supported e-portfolio tool used by students
Top 4 No. Total pre-92 post-92 coll
Blackboard 18 31% 31% 47% 20%
Questionmark Perception 11 19% 19% 26% 20%
WebCT 7 12% 12% 21% 0%
Moodle 6 10% 19% 5% 0%
The 2005 survey reported that e-portfolio activity was only a minor part of vLe usage9 (27%) across the sector. The 2008 survey focused on tool usage and presents a different picture, with 68% of respondents identifying the use of e-portfolio tools within their institutions. The greatest level of activity appears amongst pre-92 institutions (73%). Blackboard’s hosted tool appears as the leading solution (30%), with PebblePAD also highlighted (19%).
Table 3.5b: Centrally supported e-assessment tool used by students
Top 4 No. Total pre-92 post-92 coll
Blackboard 24 30% 35% 50% 40%
Questionmark Perception 23 28% 45% 42% 0%
WebCT 7 11% 21% 13% 0%
Moodle 5 60% 10% 4% 20%
E-assessment remains an important and growing area of activity across the He sector. This is most noticeable amongst post-92 (92%) and pre-92 (72%) institutions, but less so amongst He colleges (56%). Blackboard’s hosted toolset appears as the leading solution (30%), with Questionmark Perception (28%) and WebCT (11%) also identified by respondents.
Table 3.5c: Centrally supported blog tool used by students
Top 6 No. Total pre-92 post-92 coll
Blackboard 14 19% 20% 27% 40%
Learning Objects 13 18% 33% 14% 0%
Wordpress 7 10% 13% 14% 0%
Moodle 6 8% 13% 5% 20%
WebCT 6 8% 17% 5% 0%
In house developed 5 7% 13% 5% 0%
Blogs are widely used across the sector, particularly amongst post-92 (81%) and pre-92 (69%) institutions. Blackboard is again identified as the leading provider (19%), although this is interesting given that Blackboard does not have a hosted blog tool. This suggests some confusion by respondents between Blackboard and third party tools such as Learning Objects which plug in to the vLe. Notably, Learning Objects features as the second leading solution in use.
9 2005 VLE Survey: Table 8 ‘Uses made of VLE’

u C I s A T L I g T e L s u r v e y 2 0 0 8 1�
Table 3.5d: Centrally supported wiki tool used by students
Top 4 No. Total pre-92 post-92 coll
Learning Objects 12 20% 35% 16% 0%
Blackboard 10 17% 15% 26% 20%
PB Wiki, PM Wiki, Wikimedia 10 17% 31% 42% 0%
Wiki activity appears to be well established amongst post-92 institutions (73%), but less so for pre-92 (59%) and He colleges (56%). Learning Objects appears as the leading solution (20%), along with PBWiki, PMwiki (17%).
Table 3.5e: Centrally supported social bookmarking tool used by students
Top 4 No. Total pre-92 post-92 coll
Del.icio.us 8 27% 33% 36% -
Blackboard 7 23% 50% 9% -
social bookmarking appears as an emerging activity, which is not widely supported (28%) across the sector. Del.icio.us represents the leading supported solution (27%), closely followed by Blackboard’s scholar solution (23%).
Table 3.5f: Centrally supported podcasting tool used by students
Top 4 No. Total pre-92 post-92 coll
Learning Objects 10 16% 31% 10% 0%
Blackboard 9 15% 15% 19% 17%
Podcasting appears to be strongly supported amongst post-92 institutions (77%), but is also evident amongst He colleges (67%) and pre-92s (64%). Learning Objects emerges as the leading delivery solution (16%), followed by Blackboard (15%). A vast range of solutions were cited by respondents, including echo 360, Wimba voice tools and Audacity, which highlights the emerging nature of the market in this area.
Finally, in response to Question 3.5, respondents were invited to identify any other centrally supported software tools used by students at their institution. A cluster analysis was carried out on the responses and the list below shows the most common responses, indicating the percentage of respondents who highlighted these policies.
Table 3.5g: Additional centrally supported software tools used by students
Policy %
Turnitin 11%
In house developed tool 4%
echo 360 3%
Audacity 3%
elluminate 3%
A full list of the results of the cluster analysis is provided in Table A 3.5g. Aggregate responses to this question reveal support for feedback tools, electronic library reading lists, plagiarism detection (Turnitin highlighted), virtual worlds, self/peer assessment, electronic voting systems and conferencing tools.
We may conclude that podcasting, e-assessment, blogging and e-portfolios appear to be established and centrally supported e-learning activities, with wiki usage also significant. Social bookmarking appears as an emerging concern, not yet established as a supported activity across the sector. However, the market for software solutions appears to be quite open. Blackboard is commonly identified as a solution – although it depends on third party tools to support these activities.

u C I s A T L I g T e L s u r v e y 2 0 0 8 1�
Question 3.6: Which, if any, technology enhanced learning tools that are used by students are not centrally supported?Table 3.6: TeL tools used by students that are not centrally supported
No. Total pre-92 post-92 coll eng Wal sco
Blog 34 46% 46% 46% 56% 46% 43% 43%
Wiki 25 34% 33% 39% 22% 31% 43% 43%
Other software tool 24 32% 33% 31% 33% 29% 29% 71%
Podcasting 23 31% 28% 39% 22% 27% 29% 57%
social bookmarking 22 30% 33% 35% 0% 25% 29% 57%
vLe 19 26% 23% 35% 11% 24% 29% 43%
e-assessment 19 26% 26% 31% 11% 20% 43% 57%
e-portfolio 8 11% 8% 19% 0% 9% 0% 43%
This was a new question introduced for the 2008 survey, which focused on department/school based TeL developments as well as student owned tool usage. The results indicate that non-centrally supported tool usage is less developed across the sector, although we may question the degree to which respondents were able to account for student controlled tool usage. Blogs appear as the leading non-centrally supported tool in use across the sector.
The results in Table 3.6 reflect the incidence of usage per institution, whereas the tables below highlight the frequency of software tools employed by students. We have listed the leading solutions in the tables below. A full set of results for each tool is set out in Table A 3.6a to Table A 3.6h.
Table 3.6a: vLe used by students that is not centrally supported
Top 2 No. Total pre-92 post-92 coll
Moodle 13 18% 18% 23% 0%
Homegrown/locally developed 4 5% 5% 8% 0%
Table 3.6b: E-portfolio tool used by students that is not centrally supported
No. Total pre-92 post-92 coll
Homegrown/locally developed 2 3% 5% 0% -
Table 3.6c: E-assessment tool used by students that is not centrally supported
Top 2 No. Total pre-92 post-92 coll
Homegrown/locally developed 6 8% 5% 12% 11%
Blogger 1 1% 3% 0% 0%
Table 3.6d: Blog tool used by students that is not centrally supported
Top 3 No. Total pre-92 post-92 coll
Wordpress 9 12% 10% 12% 22%
Blogger 9 12% 8% 0% 0%
Homegrown/locally developed 3 4% 15% 8% 11%
Table 3.6e: Wiki tool used by students that is not centrally supported
Top 2 No. Total pre-92 post-92 coll
PBWiki, MediaWiki, Wikispace 9 12% 15% 12% 0%
Blogger 2 3% 3% 0% 17%
Table 3.6f: social bookmarking tool used by students that is not centrally supported
Top 3 No. Total pre-92 post-92 coll
Del.icio.us 10 14% 18% 15% -
Furl 3 4% 3% 8% -
Facebook 3 4% 5% 4% -

u C I s A T L I g T e L s u r v e y 2 0 0 8 1�
Table 3.6g: Podcasting tool used by students that is not centrally supported
Top 4 No. Total pre-92 post-92 coll
iTunes 4 5% - - -
Homegrown/locally developed 2 3% - - -
Audacity 2 3% - - -
youtube 2 3% - - -
Table 3.6h: Other software tool used by students that are not centrally supported
Top 4 No. Total pre-92 post-92 coll
Facebook 8 11% 10% 12% 11%
secondlife 5 7% - - -
Question 3.7: Approximately what proportion of all modules or units of study in the technology enhanced learning environment in use in your institution fall into each of the following categories? (Mean scores of % entered by respondents.)Institutions were asked how their technology enhanced environment was being employed for teaching and learning practice. The question employed the same categorisation of usage as used in previous surveys, i.e. the categorisation developed by Bell et al (2002)10 which was designed for vLe usage.
0%
10%
20%
30%
40%
50%
60%
70%
A B (i) B (ii) B (iii) C
Ca te gory
Mean
Per
cent
age
P re-92 P os t-92Coll E ngW alS c o
Figure 3.7: Proportion of all modules or units of study in the TeL environment in use
10 Bell M., Bush D., Nicholson P., O’Brien D. and Tran T. 2002, Universities Online: A survey of online education and services in Australia. Department of Education, Science and Training, Canberra.

u C I s A T L I g T e L s u r v e y 2 0 0 8 1�
Category A – web supplemented, in which online participation is optional for students.
Category B – web dependent, requiring participation by the student for an online component of a face to face course, measured against three subcategories of participation:
(i) interaction with content;
(ii) communication with staff/students;
(iii) interaction with content and communication.
Category C – fully online courses
Figure 3.7 shows that notwithstanding the shift in focus from vLe to TeL supported learning and teaching practice, the 2008 Survey results remain consistent with the findings drawn from earlier Surveys. Web supplemented practice (Category A) remains the leading activity, with fully online courses a minority concern. However, a closer look at the data indicates that the proportion of web supplemented activity is decreasing (from 54% in 2005 to 48%), with a rise in web dependent courses, most noticeably for Category B(i) – interaction with content, with post-92 institutions most prominent in this respect.
Question 3.8: Are there any particular subject areas or departments that make more extensive use of technology enhanced learning tools than your institutional norm?Table 3.8a: subject areas or departments that make more extensive use of technology enhanced learning tools than your institutional norm
Top 6 No. %
Medicine, Nursing, Health 26 35%
Computing 12 16%
Management and Business 10 14%
social sciences 10 14%
Media studies 6 8%
Art and Design 5 7%
This was a new question introduced for the 2008 survey, which invited respondents to identify up to three subject areas or departments making extensive use of TeL tools, above their institutional norm. Medicine, Nursing and Health as one combined category emerges as the leading subject area, with Computing, Management/Business and the social sciences also prominent.
Table 3.8b: reasons for the more extensive use of TeL tools
Top 9 No. %
Dedicated champion drives usage 33 45%
In school/department support and strategy encouraging TeL take up 20 27%
E-assessment 20 27%
Provides off campus support (outreach and placement provision) 18 24%
suitability of curriculum to TeL delivery 17 23%
Courses are distance/full e-learning awards 11 15%
Facilitated through higher ICT literacy of students 8 11%
Nature of market and perceived competition 8 11%
Availability of funding 8 11%
As a companion question, respondents were asked to identify the reasons why there was more extensive TeL activity within specific subject areas. The results underline the role of dedicated champions in driving forward the adoption of tools in teaching and learning activities. Departmental support was also identified as a key factor, realised through dedicated TEL policies and strategies. Consistent with responses to Question 3.5, respondents identified e-assessment as a key activity and driver for TeL adoption within their subject area.

u C I s A T L I g T e L s u r v e y 2 0 0 8 �0
Question 3.9: Are there any particular subject areas or departments that make less extensive use of technology enhanced learning tools than your institutional norm?Table 3.9a: subject areas or departments that make less extensive use of technology enhanced learning tools than your institutional norm
Top 3 No. %
Art, Music, Drama 23 31%
english 8 11%
social sciences 8 11%
This was a new question introduced for the 2008 survey, which invited respondents to identify up to three subject areas or departments making less extensive use of TeL tools, below their institutional norm. Art, Music and Drama as one combined category emerges as the most commonly identified subject area, with English and the Social Sciences also prominent.
Table 3.9b: reasons for the less extensive use of TeL tools
No. %
TeL not relevant to the learning and teaching approach 28 38%
Low level of staff ICT literacy 8 11%
staff unwilling to engage with TeL (research takes preference over teaching) 7 9%
No buy in from department 6 8%
Lack of staff understanding and time 4 5%
No staff TeL champion 3 4%
Lack of technical support (poor links to central support services) 3 4%
Low level of student ICT literacy 2 3%
Few placement/work based students 2 3%
As a companion question, respondents were asked to identify the reasons why there was less extensive TeL activity within specific subject areas. The results indicate that the leading reason is staff failing to see the relevance of TEL for teaching practice in their subject areas, although other listed reasons such as low ICT skills and limited departmental support may well contribute to this way of thinking.
Question 3.10: Approximately, what proportion of courses within your institution use summative e-assessment (as part of course delivery)?Question 3.10 was introduced for the 2008 survey, inviting respondents to identify the level of take up of TeL tools across courses. The breakdown of results per tool is listed below. Across the sector, the data shows a high percentage of courses using tools to support access to course material and to external web based resources. This appears consistent with the results from Question 3.7, which highlighted the high proportion of web supplemented and content focused courses. Assignment submission and use of collaborative working tools also feature quite prominently across the sector.

u C I s A T L I g T e L s u r v e y 2 0 0 8 �1
0%10%20%30%40%50%60%70%80%
100%75% -99%
50% -74%
25% -49%
1% -24%
0%Don’tk now
TotalP re-92P os t-92Coll
Figure 3.10a: Proportion of courses using summative e-assessment
0%10%20%30%40%50%60%70%80%
100%75% -99%
50% -74%
25% -49%
1% -24%
0%Don’tk now
TotalP re-92P os t-92Coll
Figure 3.10b: Proportion of courses using formative e-assessment
0%10%20%30%40%50%60%70%80%
100%75% -99%
50% -74%
25% -49%
1% -24%
0%Don’tk now
TotalP re-92P os t-92Coll
Figure 3.10c: Proportion of courses using e-portfolio/PDP/progress files

u C I s A T L I g T e L s u r v e y 2 0 0 8 ��
0%10%20%30%40%50%60%70%80%
100%75% -99%
50% -74%
25% -49%
1% -24%
0%Don’tk now
TotalP re-92P os t-92Coll
Figure 3.10h: Proportion of courses using assignment submission tools
0%10%20%30%40%50%60%70%80%
100%75% -99%
50% -74%
25% -49%
1% -24%
0%Don’tk now
TotalP re-92P os t-92Coll
Figure 3.10i: Proportion of courses using tools to provide access to course material
0%
10%20%
30%40%
50%
60%70%
80%
100%75% -99%
50% -74%
25% -49%
1% -24%
0%Don’tk now
TotalP re-92P os t-92Coll
Figure 3.10k: Proportion of courses using tools to provide access to external web based resources

u C I s A T L I g T e L s u r v e y 2 0 0 8 ��
Question 3.11: What systems in your institution are linked to your technology enhanced learning (TEL) tools? For example, some institutions link their institutional VLE with Library electronic services, or with their student records system etc.This was introduced as an open question to the 2008 survey, inviting respondents to identify systems linked to their TEL tools. Linkage with the institutional VLE appears as the leading category, and the results also show significant progress towards the joining up of student records with TeL tools across the sector.
Table 3.11: systems that are linked to your TeL tools
No. Total pre-92 post-92 coll
vLe 45 68% 68% 65% 83%
student records/administration system 35 53% 53% 46% 83%
Library (system/catalogue) 13 20% 21% 19% 17%
Portal 2 4% 3% 4% 0%
u C I s A T L I g T e L s u r v e y 2 0 0 8 ��
Section 4: Support for Technology Enhanced Learning Tools
This section of the survey sought information on what support is available for those using TeL tools within institutions, including both centrally provided and local units.
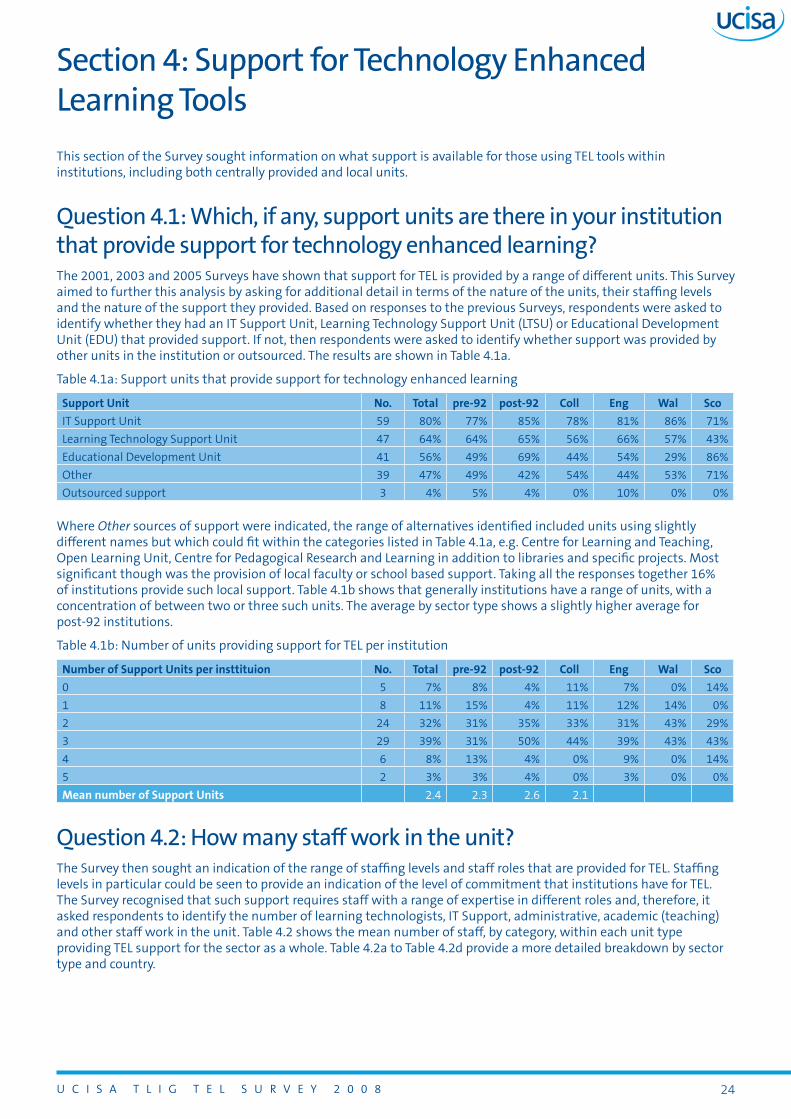
Question 4.1: Which, if any, support units are there in your institution that provide support for technology enhanced learning?The 2001, 2003 and 2005 surveys have shown that support for TeL is provided by a range of different units. This survey aimed to further this analysis by asking for additional detail in terms of the nature of the units, their staffing levels and the nature of the support they provided. Based on responses to the previous surveys, respondents were asked to identify whether they had an IT support unit, Learning Technology support unit (LTsu) or educational Development unit (eDu) that provided support. If not, then respondents were asked to identify whether support was provided by other units in the institution or outsourced. The results are shown in Table 4.1a.
Table 4.1a: support units that provide support for technology enhanced learning
support unit No. Total pre-92 post-92 coll eng Wal sco
IT support unit 59 80% 77% 85% 78% 81% 86% 71%
Learning Technology support unit 47 64% 64% 65% 56% 66% 57% 43%
educational Development unit 41 56% 49% 69% 44% 54% 29% 86%
Other 39 47% 49% 42% 54% 44% 53% 71%
Outsourced support 3 4% 5% 4% 0% 10% 0% 0%
Where Other sources of support were indicated, the range of alternatives identified included units using slightly different names but which could fit within the categories listed in Table 4.1a, e.g. Centre for Learning and Teaching, Open Learning Unit, Centre for Pedagogical Research and Learning in addition to libraries and specific projects. Most significant though was the provision of local faculty or school based support. Taking all the responses together 16% of institutions provide such local support. Table 4.1b shows that generally institutions have a range of units, with a concentration of between two or three such units. The average by sector type shows a slightly higher average for post-92 institutions.
Table 4.1b: Number of units providing support for TeL per institution
Number of support units per insttituion No. Total pre-92 post-92 coll eng Wal sco
0 5 7% 8% 4% 11% 7% 0% 14%
1 8 11% 15% 4% 11% 12% 14% 0%
2 24 32% 31% 35% 33% 31% 43% 29%
3 29 39% 31% 50% 44% 39% 43% 43%
4 6 8% 13% 4% 0% 9% 0% 14%
5 2 3% 3% 4% 0% 3% 0% 0%
Mean number of support units 2.4 2.3 2.6 2.1
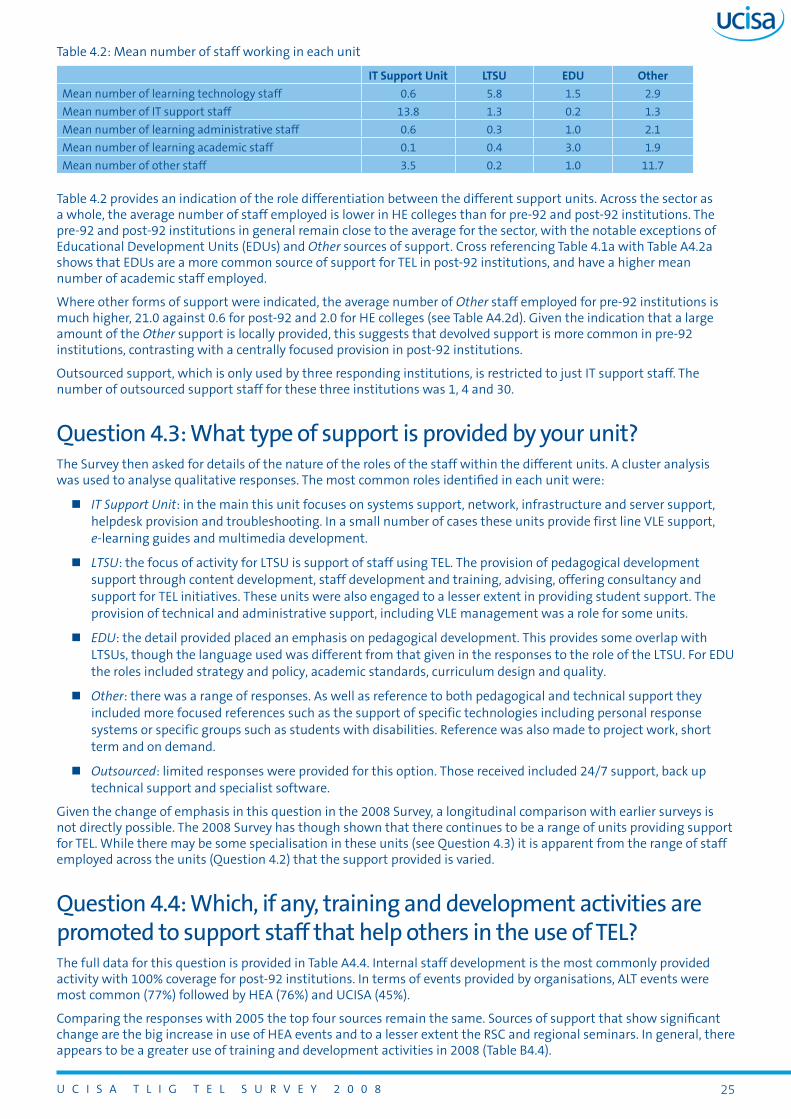
Question 4.2: How many staff work in the unit?The Survey then sought an indication of the range of staffing levels and staff roles that are provided for TEL. Staffing levels in particular could be seen to provide an indication of the level of commitment that institutions have for TeL. The survey recognised that such support requires staff with a range of expertise in different roles and, therefore, it asked respondents to identify the number of learning technologists, IT support, administrative, academic (teaching) and other staff work in the unit. Table 4.2 shows the mean number of staff, by category, within each unit type providing TeL support for the sector as a whole. Table 4.2a to Table 4.2d provide a more detailed breakdown by sector type and country.
u C I s A T L I g T e L s u r v e y 2 0 0 8 ��
Table 4.2: Mean number of staff working in each unit
iT support unit LTsu eDu Other
Mean number of learning technology staff 0.6 5.8 1.5 2.9
Mean number of IT support staff 13.8 1.3 0.2 1.3
Mean number of learning administrative staff 0.6 0.3 1.0 2.1
Mean number of learning academic staff 0.1 0.4 3.0 1.9
Mean number of other staff 3.5 0.2 1.0 11.7
Table 4.2 provides an indication of the role differentiation between the different support units. Across the sector as a whole, the average number of staff employed is lower in He colleges than for pre-92 and post-92 institutions. The pre-92 and post-92 institutions in general remain close to the average for the sector, with the notable exceptions of educational Development units (eDus) and Other sources of support. Cross referencing Table 4.1a with Table A4.2a shows that eDus are a more common source of support for TeL in post-92 institutions, and have a higher mean number of academic staff employed.
Where other forms of support were indicated, the average number of Other staff employed for pre-92 institutions is much higher, 21.0 against 0.6 for post-92 and 2.0 for He colleges (see Table A4.2d). given the indication that a large amount of the Other support is locally provided, this suggests that devolved support is more common in pre-92 institutions, contrasting with a centrally focused provision in post-92 institutions.
Outsourced support, which is only used by three responding institutions, is restricted to just IT support staff. The number of outsourced support staff for these three institutions was 1, 4 and 30.
Question 4.3: What type of support is provided by your unit?The survey then asked for details of the nature of the roles of the staff within the different units. A cluster analysis was used to analyse qualitative responses. The most common roles identified in each unit were:
IT Support Unit: in the main this unit focuses on systems support, network, infrastructure and server support, helpdesk provision and troubleshooting. In a small number of cases these units provide first line vLe support, e-learning guides and multimedia development.
LTSU: the focus of activity for LTsu is support of staff using TeL. The provision of pedagogical development support through content development, staff development and training, advising, offering consultancy and support for TeL initiatives. These units were also engaged to a lesser extent in providing student support. The provision of technical and administrative support, including vLe management was a role for some units.
EDU: the detail provided placed an emphasis on pedagogical development. This provides some overlap with LTsus, though the language used was different from that given in the responses to the role of the LTsu. For eDu the roles included strategy and policy, academic standards, curriculum design and quality.
Other: there was a range of responses. As well as reference to both pedagogical and technical support they included more focused references such as the support of specific technologies including personal response systems or specific groups such as students with disabilities. reference was also made to project work, short term and on demand.
Outsourced: limited responses were provided for this option. Those received included 24/7 support, back up technical support and specialist software.
given the change of emphasis in this question in the 2008 survey, a longitudinal comparison with earlier surveys is not directly possible. The 2008 survey has though shown that there continues to be a range of units providing support for TeL. While there may be some specialisation in these units (see Question 4.3) it is apparent from the range of staff employed across the units (Question 4.2) that the support provided is varied.
Question 4.4: Which, if any, training and development activities are promoted to support staff that help others in the use of TEL?The full data for this question is provided in Table A4.4. Internal staff development is the most commonly provided activity with 100% coverage for post-92 institutions. In terms of events provided by organisations, ALT events were most common (77%) followed by HeA (76%) and uCIsA (45%).
Comparing the responses with 2005 the top four sources remain the same. Sources of support that show significant change are the big increase in use of HeA events and to a lesser extent the rsC and regional seminars. In general, there appears to be a greater use of training and development activities in 2008 (Table B4.4).

u C I s A T L I g T e L s u r v e y 2 0 0 8 ��
Question 4.5: Which, if any, of the following groups of students receive more focused or specialised support and training in the use of TEL tools?respondents were asked if any specialist support was provided for particular groups of students. This revealed that students with special needs in particular are provided with specialist support (62%) and, to a lesser extent, distance learners (39%). Post-92 institutions are more likely to provide this specialist support (Table 4.5).
Table 4.5: Categories of students that are provided with more focused or specialist support and training for technology enhanced learning
No. % pre-92 post-92 coll
students with special needs 46 62% 59% 77% 33%
Distance learners 29 39% 36% 46% 33%
None received more focused training 21 20% 28% 19% 56%
Off campus learners 16 22% 21% 19% 33%
Part time learners 10 14% 8% 19% 22%
Other group 2 3% 5% 0% 0%
Number of respondents 74
The figures for 2008 show a marked increase in provision for students with special needs from 35% in 2005 to 62% (Table B4.5). Figures for specialist support for other categories of students remain consistent with figures from 2005.
Question 4.6: Who provides the more focused or specialised support?respondents were asked to identify who provided this specialist support. The responses show that a range of units provide this level of support and that in many cases provision is available from multiple sources within an institution. For example, it might be provided locally by schools, by a Disability unit or a Learning support unit. The range of titles for units providing such support is varied. Table 4.6 shows the results of a cluster analysis of identified units providing this support.
Table 4.6: Providers of more focused or specialist support
Provider of more focused or specialist support %
Local provision (schools, course teams) 36
Learning Technology support/E-learning units 28
Disability Advisors/unit 21
student services/student support Centres 17
Library/LIs 15
The full cluster analysis is provided in Table A4.6.
It is also worth noting that in some responses support for distance learning students was the responsibility of the course team or distance learning team rather than a specialist unit.
Question 4.7: And is this support centrally or locally provided?Where this support is provided, in institutions that responded to Q4.6, in 93% of cases it is a centrally provided service and in 47% of cases a local provision.
Question 4.8: To what extent is this help and support available across the institution?The results indicate that specialist support is seen as a central responsibility for most institutions. As well as being provided centrally in 93% of cases (Table A4.7), Q 4.8 shows that in 96% of cases the provision is institution wide. Only in 2% of cases was it indicated that it was widely available but not to all the institution and in another 2% only locally available; in both cases these were in pre-92 institutions. Both post-92 and He colleges provided 100% institutional coverage.
u C I s A T L I g T e L s u r v e y 2 0 0 8 ��
Section 5: Looking to the future...
This section of the survey was concerned with identifying new and emerging trends in the use of TeL, inviting views on what these are, what the barriers are and the way that institutions might be responding to these issues.
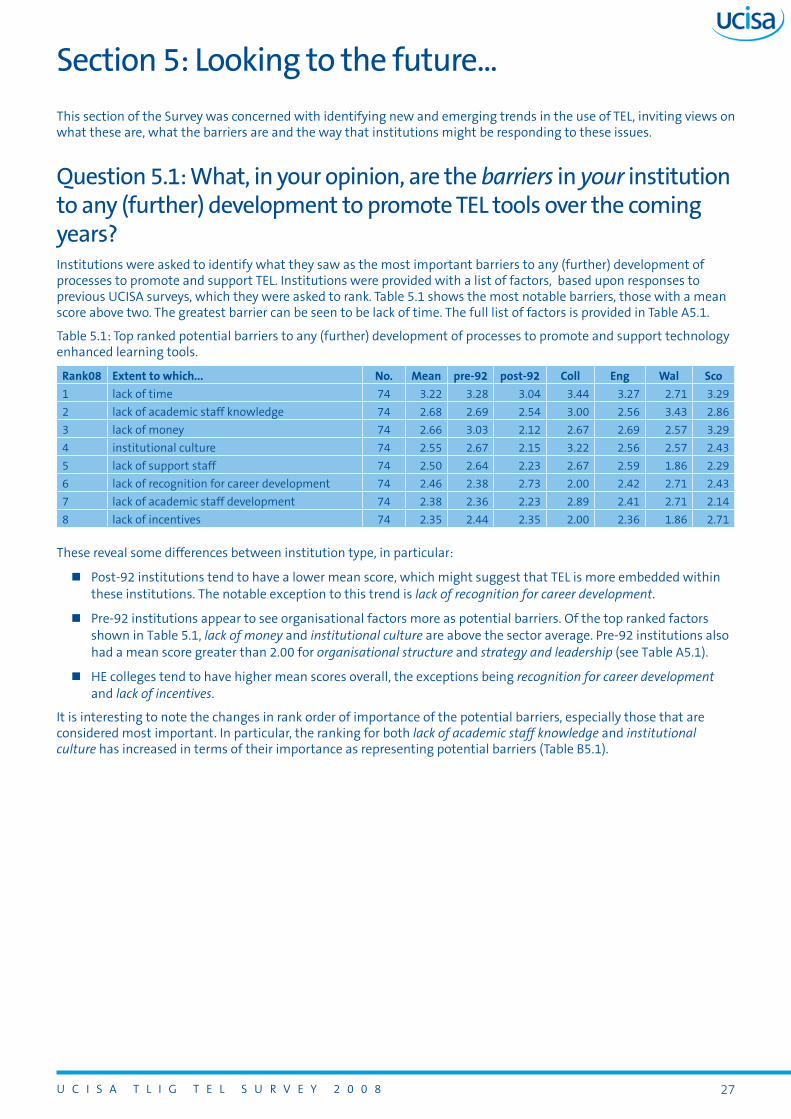
Question 5.1: What, in your opinion, are the barriers in your institution to any (further) development to promote TEL tools over the coming years?Institutions were asked to identify what they saw as the most important barriers to any (further) development of processes to promote and support TeL. Institutions were provided with a list of factors, based upon responses to previous uCIsA surveys, which they were asked to rank. Table 5.1 shows the most notable barriers, those with a mean score above two. The greatest barrier can be seen to be lack of time. The full list of factors is provided in Table A5.1.
Table 5.1: Top ranked potential barriers to any (further) development of processes to promote and support technology enhanced learning tools.
rank08 extent to which... No. Mean pre-92 post-92 coll eng Wal sco
1 lack of time 74 3.22 3.28 3.04 3.44 3.27 2.71 3.29
2 lack of academic staff knowledge 74 2.68 2.69 2.54 3.00 2.56 3.43 2.86
3 lack of money 74 2.66 3.03 2.12 2.67 2.69 2.57 3.29
4 institutional culture 74 2.55 2.67 2.15 3.22 2.56 2.57 2.43
5 lack of support staff 74 2.50 2.64 2.23 2.67 2.59 1.86 2.29
6 lack of recognition for career development 74 2.46 2.38 2.73 2.00 2.42 2.71 2.43
7 lack of academic staff development 74 2.38 2.36 2.23 2.89 2.41 2.71 2.14
8 lack of incentives 74 2.35 2.44 2.35 2.00 2.36 1.86 2.71
These reveal some differences between institution type, in particular:
Post-92 institutions tend to have a lower mean score, which might suggest that TeL is more embedded within these institutions. The notable exception to this trend is lack of recognition for career development.
Pre-92 institutions appear to see organisational factors more as potential barriers. Of the top ranked factors shown in Table 5.1, lack of money and institutional culture are above the sector average. Pre-92 institutions also had a mean score greater than 2.00 for organisational structure and strategy and leadership (see Table A5.1).
He colleges tend to have higher mean scores overall, the exceptions being recognition for career development and lack of incentives.
It is interesting to note the changes in rank order of importance of the potential barriers, especially those that are considered most important. In particular, the ranking for both lack of academic staff knowledge and institutional culture has increased in terms of their importance as representing potential barriers (Table B5.1).

u C I s A T L I g T e L s u r v e y 2 0 0 8 ��
Question 5.2: Has your institution considered the outsourcing of some or all of your provision and support for TEL?Institutions were asked whether they had considered outsourcing of provision and support for TeL, with 47% of institutions indicating that they have. It should be noted that the question asked whether outsourcing had been considered. The results reveal that over 25% have done so, however, the written responses to this question show that in many cases this option has been rejected as too expensive or is still just under consideration. The responses indicate that:
By far the most common area considered for outsourcing was external hosting for vLe, e-portfolio and e-assessment provision. This was identified by 26% of respondents to the survey. In some cases this relates to provision for specific campuses, including overseas provision. A full list of the results of the cluster analysis is provided in Table A5.2.
Other areas of provision indicated as being considered for outsourcing were:
Web 2.0 technologies including second Life
Maintenance and support
Application service Provider
student email
staff development, such as e-moderating
24/7 helpdesk support
Digital repositories
Wimba virtual Classroom
In some cases outsourcing was an option used for evaluation purposes for potential new systems and as a means of providing ad hoc support when demand and workload are high. In these cases outsourcing can be seen as a means of managing workflows and demands on both systems and staff.
Question 5.3: What if any, recent and prospective developments in technology are starting to make new demands upon you in terms of the support required by users?Institutions were asked to identify what new developments in technology are starting to make new demands on the support they are providing to users. Almost universally there was a view that institutions were facing new demands, i.e. 90% of pre-92 and 100% of both post-92 and He colleges. respondents were asked to identify three such recent and prospective developments. A cluster analysis was carried out and Table 5.3 shows the most common responses, indicating the percentage of respondents who highlighted this development. A full list of the results of the cluster analysis is given in Table A5.3.
Table 5.3: recent and prospective developments in technology that are starting to make new demands in terms of the support required by users
Technologies %
Streaming media and large media files 26%
Mobile computing 26%
Podcasting 23%
Web 2.0 23%
Digital repositories 14%
E-assessment 14%
E-portfolios 12%
recording of lectures 11%
Portals 10%
virtual worlds (e.g. second Life) 10%
Copyright 7%

u C I s A T L I g T e L s u r v e y 2 0 0 8 ��
The most common responses reflect in part technologies that Q 3.6 identified as already established, such as podcasting. This potentially reflects that institutions are developing at different rates and the use of TEL is still a very dynamic and changing environment.
Question 5.4: What challenges do you see these developments posing over the next two to three years in terms of support that will be required for staff and students?respondents were then asked to identify three challenges that these developments would present over the next 2–3 years in terms of support required for both staff and students. The list of most common responses is shown in Table 5.4, with the overwhelming response being staff skills. A full list of the results of the cluster analysis is given in Table A5.4.
Table 5.4: Challenges that developments will pose over the next two to three years in terms of the support that will be required for staff and students
challenges %
staff skills 49%
Infrastructure 18%
Cultural change 16%
Teaching and learning changes 15%
Copyright 11%
Availability of support staff 11%
Web 2.0 11%
Increased volume of demand 10%
Policy 10%
sharing of good practice 8%
student expectations 8%
E-assessment 7%
Funding 7%
Horizon scanning 7%
recording of lectures 7%
Question 5.5: In general, how do you see these challenges being overcome?respondents were then asked to identify how they see these challenges being overcome. The suggested solutions were:
Table 5.5: How challenges are overcome
challenges %
staff development 19%
strategy 19%
support for academic staff 15%
Increased resources and funding 14%
research and dissemination 14%
senior management support 12%
Staff skills were identified (Table 5.4) as the most significant challenge that the new demands would pose in terms of support. Yet it is interesting that Table 5.5 shows that staff development was not equally strongly identified as a solution.
The list above has a cut off point of five responses (12%). A full list of the results of the cluster analysis is given in Table A5.5.
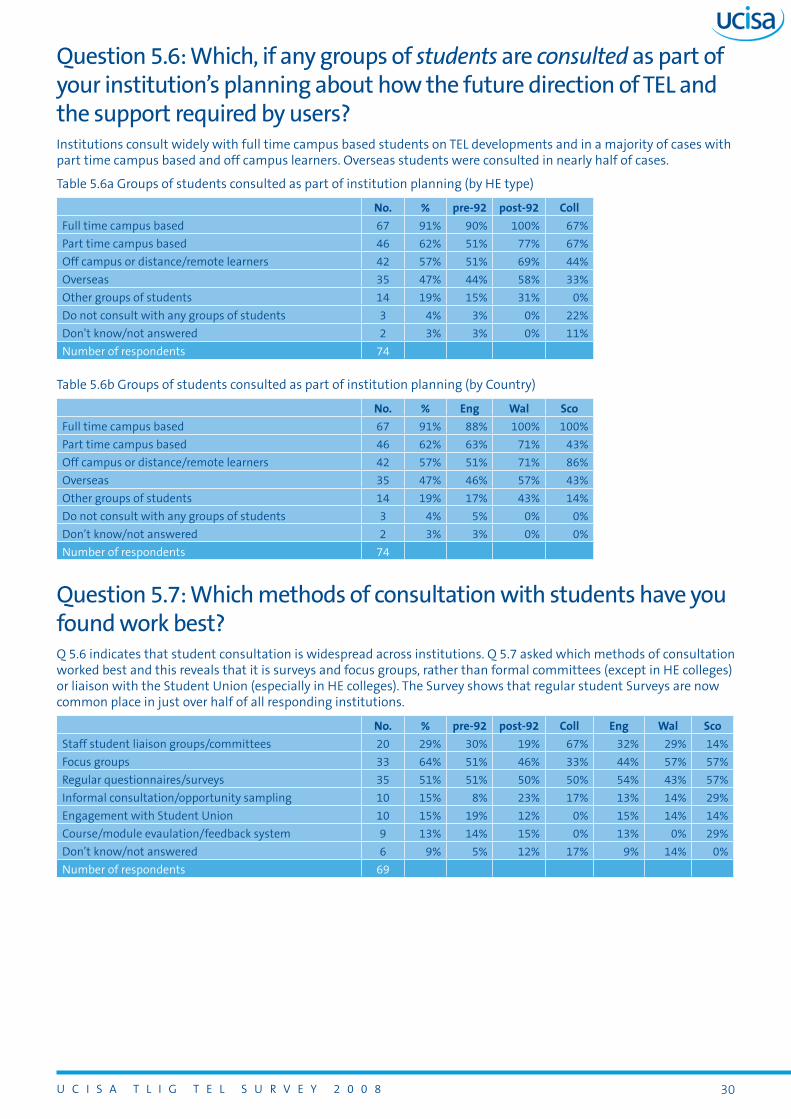
u C I s A T L I g T e L s u r v e y 2 0 0 8 �0
Question 5.6: Which, if any groups of students are consulted as part of your institution’s planning about how the future direction of TEL and the support required by users?Institutions consult widely with full time campus based students on TeL developments and in a majority of cases with part time campus based and off campus learners. Overseas students were consulted in nearly half of cases.
Table 5.6a groups of students consulted as part of institution planning (by He type)
No. % pre-92 post-92 coll
Full time campus based 67 91% 90% 100% 67%
Part time campus based 46 62% 51% 77% 67%
Off campus or distance/remote learners 42 57% 51% 69% 44%
Overseas 35 47% 44% 58% 33%
Other groups of students 14 19% 15% 31% 0%
Do not consult with any groups of students 3 4% 3% 0% 22%
Don’t know/not answered 2 3% 3% 0% 11%
Number of respondents 74
Table 5.6b groups of students consulted as part of institution planning (by Country)
No. % eng Wal sco
Full time campus based 67 91% 88% 100% 100%
Part time campus based 46 62% 63% 71% 43%
Off campus or distance/remote learners 42 57% 51% 71% 86%
Overseas 35 47% 46% 57% 43%
Other groups of students 14 19% 17% 43% 14%
Do not consult with any groups of students 3 4% 5% 0% 0%
Don’t know/not answered 2 3% 3% 0% 0%
Number of respondents 74
Question 5.7: Which methods of consultation with students have you found work best?Q 5.6 indicates that student consultation is widespread across institutions. Q 5.7 asked which methods of consultation worked best and this reveals that it is surveys and focus groups, rather than formal committees (except in He colleges) or liaison with the student union (especially in He colleges). The survey shows that regular student surveys are now common place in just over half of all responding institutions.
No. % pre-92 post-92 coll eng Wal sco
staff student liaison groups/committees 20 29% 30% 19% 67% 32% 29% 14%
Focus groups 33 64% 51% 46% 33% 44% 57% 57%
regular questionnaires/surveys 35 51% 51% 50% 50% 54% 43% 57%
Informal consultation/opportunity sampling 10 15% 8% 23% 17% 13% 14% 29%
engagement with student union 10 15% 19% 12% 0% 15% 14% 14%
Course/module evaulation/feedback system 9 13% 14% 15% 0% 13% 0% 29%
Don’t know/not answered 6 9% 5% 12% 17% 9% 14% 0%
Number of respondents 69

u C I s A T L I g T e L s u r v e y 2 0 0 8 �1
Appendix A: Full 2008 data
For readability, only tabular highlights were presented in the main text of the report. For completeness, Appendix A gives the full tabular data.
Q 1.1: How important, if at all, have each of the following drivers been in your institution to date?Table A1.1: Mean values for Q1.1 for Type and Country
rank08 Question aLL pre-92 post-92 coll eng Wal sco
1 enhancing quality of learning and teaching in general 3.86 3.79 4.00 3.78 3.88 3.57 4.00
2 Meeting student expectations 3.69 3.79 3.69 3.22 3.69 3.86 3.43
3 Improving access to learning for students off campus 3.32 3.05 3.65 3.56 3.27 3.57 3.57
4 Widening participation/inclusiveness 3.09 2.90 3.42 3.00 3.10 3.14 2.86
5 Improving access to learning for part time students 3.07 2.62 3.54 3.67 3.03 3.29 3.00
6 Creating/improving competitive advantage 3.00 3.03 3.08 2.67 2.98 3.00 3.14
7 Keeping abreast of educational developments 2.88 2.79 3.00 2.89 2.88 3.00 2.57
8 Helping create a common user experience 2.86 2.85 2.85 3.00 2.90 3.29 2.14
9 Attracting home students 2.76 2.72 3.04 2.11 2.73 2.71 2.86
=10 Improving administrative processes 2.72 2.59 2.92 2.67 2.75 2.57 2.57
=10 Disability discrimination act (2005) part 4 2.72 2.51 2.88 3.11 2.73 2.43 2.71
12 Attracting international (outside eu) students 2.62 2.56 2.88 2.11 2.56 3.00 2.71
=13 Improving access to learning for overseas students 2.61 2.54 2.81 2.33 2.54 3.14 2.57
=13 Atrracting new markets 2.61 2.38 3.12 2.11 2.51 2.71 3.14
15 Attracting eu students 2.47 2.33 2.88 1.89 2.39 3.00 2.57
16 Developing wider regional/national role for institution 2.38 2.38 2.50 2.00 2.32 2.57 2.43
=17 Assisting institutional regarding learning styles 2.23 2.13 2.27 2.56 2.20 2.57 2.14
=17 supporting joint course developments with other institutions
2.23 2.23 2.23 2.22 2.32 1.86 1.86
19 Formation of partnerships with other institutions 2.19 2.13 2.31 2.11 2.25 2.14 1.57
20 Achieving cost/efficiency savings 2.03 2.03 2.04 2.00 2.05 1.14 2.57
Q 1.2: Other driving factorsTable A1.2: Other driving factors
employer engagement developments
Welsh Assembly government priorities for education
Welsh Assembly commitment to TeL. HeFCe commitment to TeL
Interface with business
Freedom of Information act
Marketing CPD for business education, particularly p/g. research group networking
Q 1.3: How important, if at all are the following factors in encouraging the development of TEL and processes that promote it?Table A1.3: Mean values for Q1.3 for Type and Country
rank08 Factor aLL pre-92 post-92 coll eng Wal sco
1 Committed local champions 3.54 3.49 3.58 3.67 3.51 3.57 3.71
2 Availability of internal funding 3.41 3.44 3.46 3.11 3.42 3.14 3.57
3 Technological changes/developments 3.11 3.21 2.85 3.44 3.08 3.29 3.00
4 Availability of external funding 3.07 3.10 3.08 2.89 3.15 2.71 2.57
5 Availability of relevant standards 2.12 2.13 1.92 2.67 2.19 1.86 1.71

u C I s A T L I g T e L s u r v e y 2 0 0 8 ��
Q 1.4: Other factors encouraging developmentTable A1.4: Other factors encouraging development
aLL pre-92 post-92 coll eng Wal sco
No. % No.
Development of university strategy, linking technology to teaching
12 14 5 5 2 9 1 2
senior management support/commitment 11 13 6 4 1 10 0 1
student expectations 11 13 5 6 0 9 1 1
E-learning/technogical support 7 8 4 3 0 7 0 0
Collaboration/engaging with external partners 4 4 3 1 0 2 0 1
Professional bodies, HeA 1 1 0 1 0 0 0 1
Link to promotion/awards 1 1 1 0 0 1 0 0
Q 2.1: Which, if any institutional strategies, inform the development of technology enhanced learning in your institution?Table 2.1a: Institutional strategies that have informed TeL development
No. Total pre-92 post-92 coll eng Wal sco
Teaching and Learning 74 100% 100% 100% 100% 100% 100% 100%
Library/learning resources 56 76% 64% 85% 100% 78% 86% 43%
E-learning strategy 56 76% 69% 85% 78% 80% 57% 57%
Corporate 52 70% 56% 89% 78% 73% 43% 71%
estates 43 58% 39% 85% 67% 34% 43% 57%
Quality enhancement 43 58% 39% 85% 67% 56% 57% 71%
Access/Widening participation 40 54% 44% 77% 33% 49% 86% 57%
Information and Communication Technology 34 46% 44% 50% 44% 44% 43% 57%
Information 33 45% 28% 69% 44% 48% 43% 29%
Information and Learning Technology 30 41% 33% 54% 33% 36% 86% 43%
Human resources 21 28% 13% 54% 22% 31% 43% 0%
Marketing 20 27% 18% 39% 33% 22% 43% 43%
Communications 11 15% 13% 19% 11% 10% 29% 29%
E-strategy 8 11% 8% 19% 0% 12% 14% 0%
Other 7 10% 10% 7% 11% 7% 43% 0%
Table A2.1b: Other institutional strategies informing TeL development
strategy No. %
eL strategy is a sub-strategy of learning and teaching strategy 1 1%
Learning environment strategy. Assessment strategies 1 1%
International strategy, corporate systems strategy 1 1%
research and scholarship strategy 1 1%
Financial strategy 1 1%
Blended learning strategy. Assessment strategy 1 1%
Internationalisation, student experience 1 1%
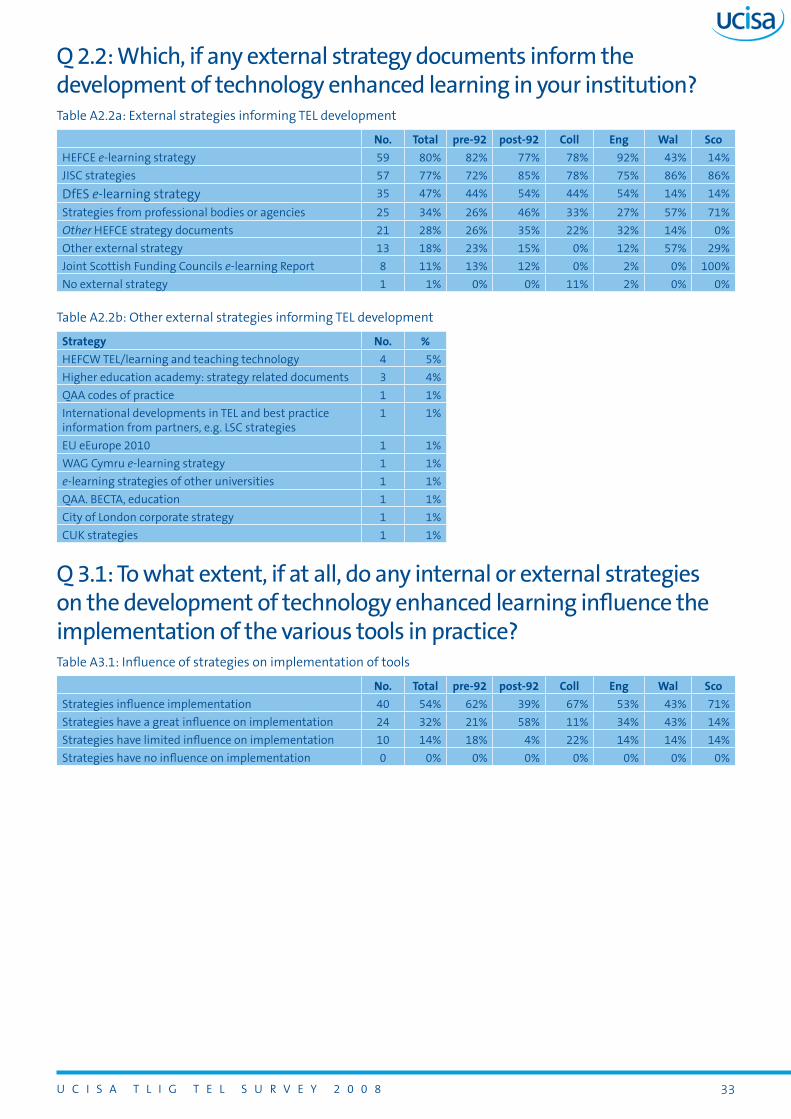
u C I s A T L I g T e L s u r v e y 2 0 0 8 ��
Q 2.2: Which, if any external strategy documents inform the development of technology enhanced learning in your institution?Table A2.2a: external strategies informing TeL development
No. Total pre-92 post-92 coll eng Wal sco
HeFCe e-learning strategy 59 80% 82% 77% 78% 92% 43% 14%
JISC strategies 57 77% 72% 85% 78% 75% 86% 86%
Dfes e-learning strategy 35 47% 44% 54% 44% 54% 14% 14%
strategies from professional bodies or agencies 25 34% 26% 46% 33% 27% 57% 71%
Other HeFCe strategy documents 21 28% 26% 35% 22% 32% 14% 0%
Other external strategy 13 18% 23% 15% 0% 12% 57% 29%
Joint Scottish Funding Councils e-learning report 8 11% 13% 12% 0% 2% 0% 100%
No external strategy 1 1% 0% 0% 11% 2% 0% 0%
Table A2.2b: Other external strategies informing TeL development
strategy No. %
HeFCW TeL/learning and teaching technology 4 5%
Higher education academy: strategy related documents 3 4%
QAA codes of practice 1 1%
International developments in TeL and best practice information from partners, e.g. LsC strategies
1 1%
eu eeurope 2010 1 1%
WAg Cymru e-learning strategy 1 1%
e-learning strategies of other universities 1 1%
QAA. BeCTA, education 1 1%
City of London corporate strategy 1 1%
CuK strategies 1 1%
Q 3.1: To what extent, if at all, do any internal or external strategies on the development of technology enhanced learning influence the implementation of the various tools in practice?Table A3.1: Influence of strategies on implementation of tools
No. Total pre-92 post-92 coll eng Wal sco
Strategies influence implementation 40 54% 62% 39% 67% 53% 43% 71%
Strategies have a great influence on implementation 24 32% 21% 58% 11% 34% 43% 14%
Strategies have limited influence on implementation 10 14% 18% 4% 22% 14% 14% 14%
Strategies have no influence on implementation 0 0% 0% 0% 0% 0% 0% 0%
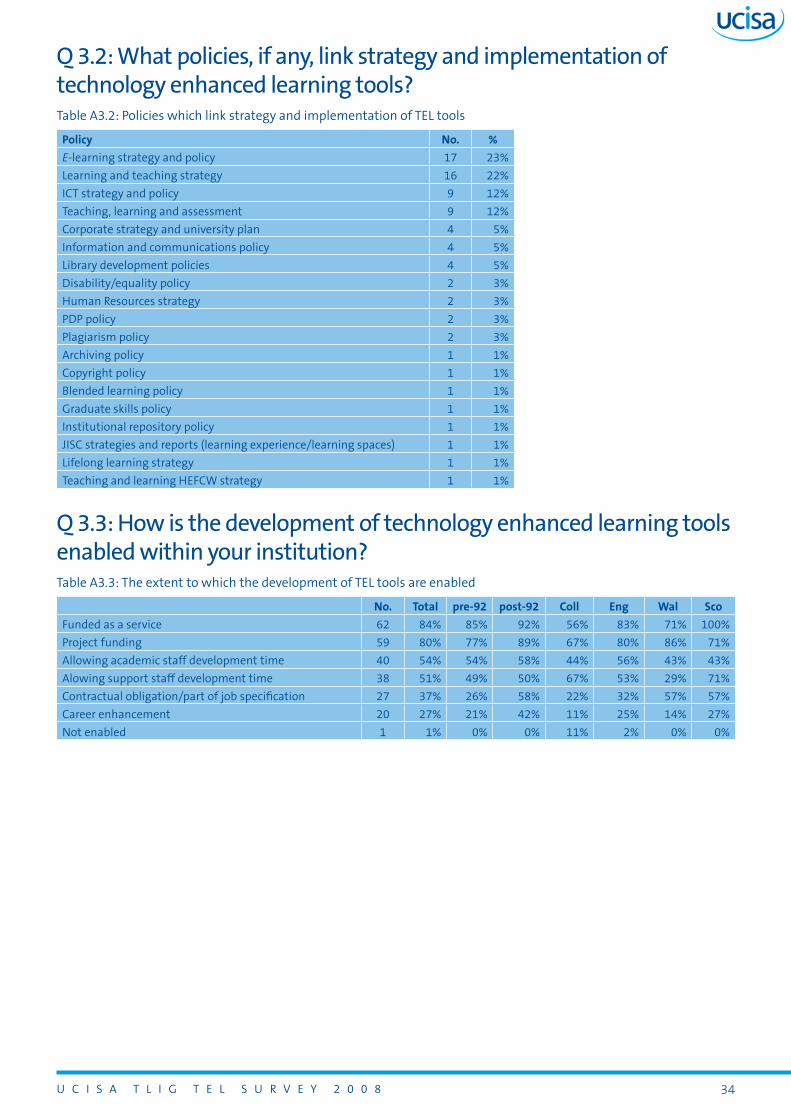
u C I s A T L I g T e L s u r v e y 2 0 0 8 ��
Q 3.2: What policies, if any, link strategy and implementation of technology enhanced learning tools?Table A3.2: Policies which link strategy and implementation of TeL tools
Policy No. %
E-learning strategy and policy 17 23%
Learning and teaching strategy 16 22%
ICT strategy and policy 9 12%
Teaching, learning and assessment 9 12%
Corporate strategy and university plan 4 5%
Information and communications policy 4 5%
Library development policies 4 5%
Disability/equality policy 2 3%
Human resources strategy 2 3%
PDP policy 2 3%
Plagiarism policy 2 3%
Archiving policy 1 1%
Copyright policy 1 1%
Blended learning policy 1 1%
graduate skills policy 1 1%
Institutional repository policy 1 1%
JISC strategies and reports (learning experience/learning spaces) 1 1%
Lifelong learning strategy 1 1%
Teaching and learning HeFCW strategy 1 1%
Q 3.3: How is the development of technology enhanced learning tools enabled within your institution?Table A3.3: The extent to which the development of TeL tools are enabled
No. Total pre-92 post-92 coll eng Wal sco
Funded as a service 62 84% 85% 92% 56% 83% 71% 100%
Project funding 59 80% 77% 89% 67% 80% 86% 71%
Allowing academic staff development time 40 54% 54% 58% 44% 56% 43% 43%
Alowing support staff development time 38 51% 49% 50% 67% 53% 29% 71%
Contractual obligation/part of job specification 27 37% 26% 58% 22% 32% 57% 57%
Career enhancement 20 27% 21% 42% 11% 25% 14% 27%
Not enabled 1 1% 0% 0% 11% 2% 0% 0%

u C I s A T L I g T e L s u r v e y 2 0 0 8 ��
Q 3.4: What VLE, if any, is currently used in your institution?Table A3.4a: vLes currently used
No. Total pre-92 post-92 coll eng Wal sco
Moodle 41 55% 56% 50% 67% 56% 57% 57%
Blackboard 37 50% 41% 62% 56% 51% 71% 29%
WebCT 23 31% 33% 35% 11% 29% 0% 71%
Other vLe developed in house 17 23% 26% 23% 11% 19% 14% 71%
Other intranet based developed in house 9 12% 13% 12% 11% 10% 29% 14%
FirstClass 7 10% 13% 4% 11% 9% 0% 29%
Commercial intranet based product 4 5% 3% 8% 11% 3% 14% 14%
sakai 4 5% 8% 4% 0% 3% 0% 29%
Other open source 4 5% 8% 4% 0% 5% 14% 0%
Other commercial vLe 3 4% 3% 8% 0% 2% 0% 29%
Other open source vLe 3 4% 8% 0% 0% 5% 0% 0%
No vLe 3 4% 8% 0% 0% 3% 14% 0%
Desire2Learn 2 3% 3% 4% 0% 2% 14% 0%
Bodington 2 3% 5% 0% 0% 3% 0% 0%
Merlin 1 1% 3% 0% 0% 0% 0% 14%
COse 1 1% 0% 4% 0% 2% 0% 0%
Table A3.4b: Main vLe, currently in use
No. Total pre-92 post-92 coll eng Wal sco
Blackboard 35 47% 39% 58% 56% 48% 71% 29%
WebCT 17 23% 26% 23% 11% 29% 0% 57%
Moodle 8 11% 18% 0% 11% 14% 0% 0%
Other vLe developed in house 3 4% 3% 4% 11% 5% 0% 0%
Don’t know/not answered 3 4% 3% 4% 11% 3% 0% 14%
No vLe 3 4% 8% 0% 0% 3% 14% 0%
Desire2Learn 1 1% 0% 4% 0% 2% 0% 0%
Other commercial vLe 1 1% 0% 4% 0% 2% 0% 0%
Commercial intranet based product 1 1% 0% 4% 0% 0% 14% 0%
sakai 1 1% 3% 0% 0% 2% 0% 0%
Other intranet based developed in house 1 1% 3% 0% 0% 2% 0% 0%
Table A3.4c: Other vLes in use
strategy No. %
sharePoint 5 7%
Based on Ms exchange 1 1%
PebblePAD 1 1%
reddot/livelink 1 1%
Omnium 1 1%
Minerva curriculum/network learning tools. Medical school 1 1%

u C I s A T L I g T e L s u r v e y 2 0 0 8 ��
Q 3.5: Which, if any, centrally supported technology enhanced learning software tools are used by students in your institution?Table A3.5: Centrally supported TeL software tools used by students
No. Total pre-92 post-92 coll eng Wal sco
e-assessment 57 77% 72% 92% 56% 75% 71% 100%
Blog 53 72% 69% 81% 56% 73% 71% 71%
Podcasting 51 69% 64% 77% 67% 68% 86% 71%
e-portfolio 50 68% 67% 73% 56% 70% 29% 86%
Wiki 47 64% 59% 73% 56% 64% 71% 57%
social bookmarking 21 28% 31% 35% 0% 29% 29% 29%
Other software tool 9 12% 13% 15% 0% 14% 0% 14%
Table A3.5a: Centrally supported e-portfolio tool used by students
No. Total pre-92 post-92 coll
Blackboard 18 31% 31% 47% 20%
PebblePAD 11 19% 19% 26% 20%
In house developed 7 12% 12% 21% 0%
WebCT 6 10% 19% 5% 0%
Moodle 2 3% 4% 0% 20%
Learning Objects 2 3% 8% 0% 0%
eLgg 1 1% 0% 5% 0%
PDs 1 1%
Keynote PDP project 1 1%
sitebuilder 1 1%
1o Portal 1 1%
Confluence 1 1%
Coldfusion development 1 1%
sakai 1 1%
Table A3.5b: Centrally supported e-assessment tool is used by students
No. Total pre-92 post-92 coll
Blackboard 24 30% 35% 50% 40%
Questionmark Perception 23 28% 45% 42% 0%
WebCT 9 11% 21% 13% 0%
Moodle 5 6% 10% 4% 20%
Hot potatoes 3 4%
In house developed 2 3% 7% 0% 0%
Turnitin 2 3% 3% 4% 0%
respondus 2 3%
LAPT 1 1%
Quizbuilder 1 1%
Coursegenie 1 1%
Touchstone 1 1%

u C I s A T L I g T e L s u r v e y 2 0 0 8 ��
Table A3.5c: Centrally supported blog tool used by students
No. Total pre-92 post-92 coll
Blackboard 14 19% 20% 27% 40%
Learning objects 13 18% 33% 14% 0%
Wordpress 7 10% 13% 14% 0%
Moodle 6 8% 13% 5% 20%
WebCT 6 7% 17% 5% 0%
In house developed 5 3% 13% 5% 0%
eLgg 2 3% 0% 9% 0%
Blogger 2 1%
Questionmark Perception 1 1% 0% 5% 0%
sharePoint 1 1%
Warwick blogs 1 1%
Confluence 1 1%
Moveable type 1 1%
sakai 1 1%
Mephisto 1 1%
Plone 1 1%
Table A3.5d: Centrally supported wiki tool used by students
No. Total pre-92 post-92 coll
Learning objects 12 20% 35% 16% 0%
Blackboard 10 17% 15% 26% 20%
PB Wiki, PM Wiki, Wikimedia 10 17% 31% 11% 0%
Confluence 7 12%
Moodle 3 5% 4% 5% 20%
In house developed 2 3% 4% 5% 0%
Questionmark Perception 1 1% 0% 5% 0%
Wordpress 1 1% 0% 5% 0%
eLgg 1 1% 0% 5% 0%
sharePoint 1 1%
sakai 1 1%
Plone 1 1%
Table A3.5e: Centrally supported social bookmarking tool used by students
No. Total pre-92 post-92 coll
Del.icio.us 8 27% 33% 36%
Blackboard 7 23% 50% 9%
WebCT 2 7% 17% 0%
eLgg 2 7% 0% 18%
Facebook 2 7%
Moodle 1 3% 0% 9%
CITe you like 1 3%
Furl 1 3%
rgu virtual campus 1 3%

u C I s A T L I g T e L s u r v e y 2 0 0 8 ��
Table A3.5f: Centrally supported podcasting tool used by students
No. Total pre-92 post-92 coll
Learning Objects 10 16% 31% 10% 0%
Blackboard 9 15% 15% 19% 17%
Wimba 4 6%
echo 360 3 5%
Apple 3 5%
Open source 3 5%
eLgg 2 3% 4% 5% 0%
In house developed 2 3% 4% 5% 0%
Lectopia 1 2%
Wordpress 1 2% 4% 0% 0%
Moodle 1 2% 0% 5% 0%
Questionmark Perception 1 2% 0% 5% 0%
Table A3.5g: Additional centrally supported software tool used by students
Policy No. %
Turbitin 8 11%
In house developed 3 4%
elluminate 2 3%
echo 360 2 3%
Audacity 2 3%
PebblePAD 1 1%
Questionmark Perception 1 1%
LearnBuild Discover 1 1%
safe Assignment 1 1%
Harvest road Hive 1 1%
Human resources strategy 1 1%
virtual Lab 1 1%
virtual Field Trip 1 1%
sPss 1 1%
video streaming 1 1%
Perseus 1 1%
Wimba 1 1%
skype 1 1%
secondlife 1 1%
softchalk 1 1%
Captivate 1 1%
Tallis List 1 1%
sMIrK 1 1%
LusID 1 1%
e-PDP 1 1%

u C I s A T L I g T e L s u r v e y 2 0 0 8 ��
Q 3.6: Which, if any, technology enhanced learning tools that are used by students are not centrally supported?Table A3.6: TeL tools used by students that are not centrally supported
No. Total pre-92 post-92 coll eng Wal sco
Blog 34 46% 46% 46% 44% 46% 43% 43%
Wiki 25 34% 33% 39% 22% 31% 43% 43%
Other software tool 24 32% 33% 31% 33% 29% 29% 71%
Podcasting 23 31% 28% 39% 22% 27% 29% 57%
social bookmarking 22 30% 33% 35% 0% 25% 29% 57%
vLe 19 26% 23% 35% 11% 24% 29% 43%
e-assessment 19 26% 26% 31% 11% 20% 43% 57%
e-portfolio 8 11% 8% 19% 0% 9% 0% 43%
Table A3.6a: vLe used by students that is not centrally supported
No. Total pre-92 post-92 coll
Moodle 13 18% 18% 23% 0%
Homegrown/locally developed 4 5% 5% 8% 0%
FirstClass 2 3%
sakai 1 1%
Bodington 1 1%
Desire2Learn 1 1%
WLe 1 1%
Nexus 1 1%
Merlin 1 1%
PebblePAD 1 1%
sharePoint 1 1%
Table A3.6b: E-portfolio tool used by students that is not centrally supported
No. Total pre-92 post-92 coll
Homegrown/locally developed 2 3% 5% 0% -
PebblePAD 1 1%
NHs education for scotland e-portfolio 1 1%
EPICS, EPET from local JISC consortium 1 1%
Profile 1 1%
Table A3.6c: E-assessment tool used by students that is not centrally supported
No. Total pre-92 post-92 coll
Homegrown/locally developed 6 8% 5% 12% 11%
Perception 3 4%
Hot potatoes 3 4%
Triads 2 3%
Blogger 1 1% 3% 0% 0%
AiM 1 1%
Caspar 1 1%
respondus 1 1%
Touchstone 1 1%
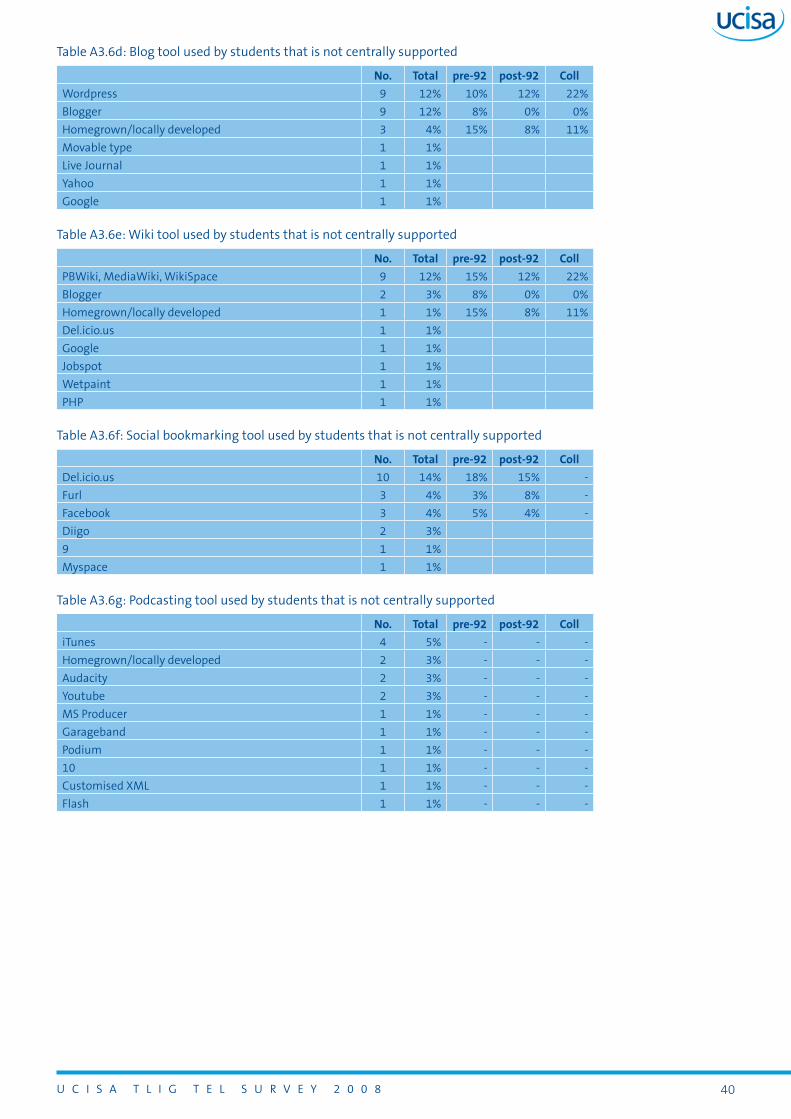
u C I s A T L I g T e L s u r v e y 2 0 0 8 �0
Table A3.6d: Blog tool used by students that is not centrally supported
No. Total pre-92 post-92 coll
Wordpress 9 12% 10% 12% 22%
Blogger 9 12% 8% 0% 0%
Homegrown/locally developed 3 4% 15% 8% 11%
Movable type 1 1%
Live Journal 1 1%
yahoo 1 1%
google 1 1%
Table A3.6e: Wiki tool used by students that is not centrally supported
No. Total pre-92 post-92 coll
PBWiki, MediaWiki, Wikispace 9 12% 15% 12% 22%
Blogger 2 3% 8% 0% 0%
Homegrown/locally developed 1 1% 15% 8% 11%
Del.icio.us 1 1%
google 1 1%
Jobspot 1 1%
Wetpaint 1 1%
PHP 1 1%
Table A3.6f: social bookmarking tool used by students that is not centrally supported
No. Total pre-92 post-92 coll
Del.icio.us 10 14% 18% 15% -
Furl 3 4% 3% 8% -
Facebook 3 4% 5% 4% -
Diigo 2 3%
9 1 1%
Myspace 1 1%
Table A3.6g: Podcasting tool used by students that is not centrally supported
No. Total pre-92 post-92 coll
iTunes 4 5% - - -
Homegrown/locally developed 2 3% - - -
Audacity 2 3% - - -
youtube 2 3% - - -
Ms Producer 1 1% - - -
garageband 1 1% - - -
Podium 1 1% - - -
10 1 1% - - -
Customised XML 1 1% - - -
Flash 1 1% - - -
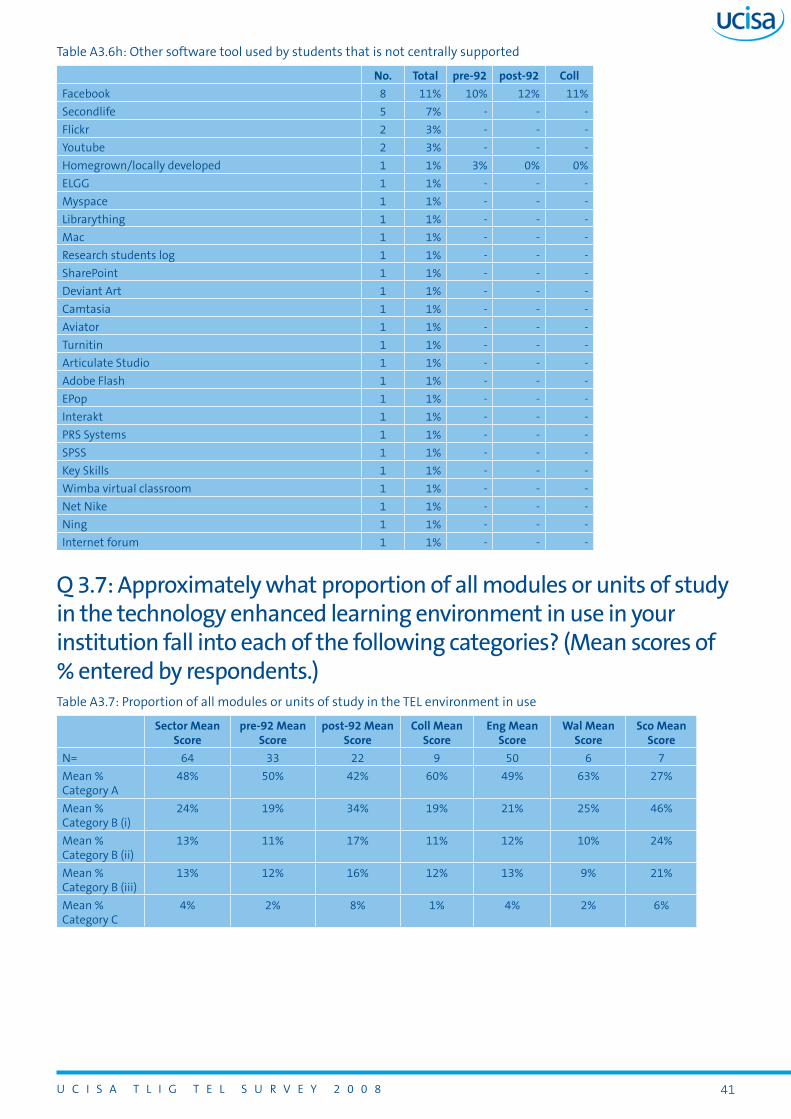
u C I s A T L I g T e L s u r v e y 2 0 0 8 �1
Table A3.6h: Other software tool used by students that is not centrally supported
No. Total pre-92 post-92 coll
Facebook 8 11% 10% 12% 11%
secondlife 5 7% - - -
Flickr 2 3% - - -
youtube 2 3% - - -
Homegrown/locally developed 1 1% 3% 0% 0%
eLgg 1 1% - - -
Myspace 1 1% - - -
Librarything 1 1% - - -
Mac 1 1% - - -
research students log 1 1% - - -
sharePoint 1 1% - - -
Deviant Art 1 1% - - -
Camtasia 1 1% - - -
Aviator 1 1% - - -
Turnitin 1 1% - - -
Articulate studio 1 1% - - -
Adobe Flash 1 1% - - -
ePop 1 1% - - -
Interakt 1 1% - - -
Prs systems 1 1% - - -
sPss 1 1% - - -
Key skills 1 1% - - -
Wimba virtual classroom 1 1% - - -
Net Nike 1 1% - - -
Ning 1 1% - - -
Internet forum 1 1% - - -
Q 3.7: Approximately what proportion of all modules or units of study in the technology enhanced learning environment in use in your institution fall into each of the following categories? (Mean scores of % entered by respondents.)Table A3.7: Proportion of all modules or units of study in the TeL environment in use
sector Mean score
pre-92 Mean score
post-92 Mean score
coll Mean score
eng Mean score
Wal Mean score
sco Mean score
N= 64 33 22 9 50 6 7
Mean % Category A
48% 50% 42% 60% 49% 63% 27%
Mean % Category B (i)
24% 19% 34% 19% 21% 25% 46%
Mean % Category B (ii)
13% 11% 17% 11% 12% 10% 24%
Mean % Category B (iii)
13% 12% 16% 12% 13% 9% 21%
Mean % Category C
4% 2% 8% 1% 4% 2% 6%
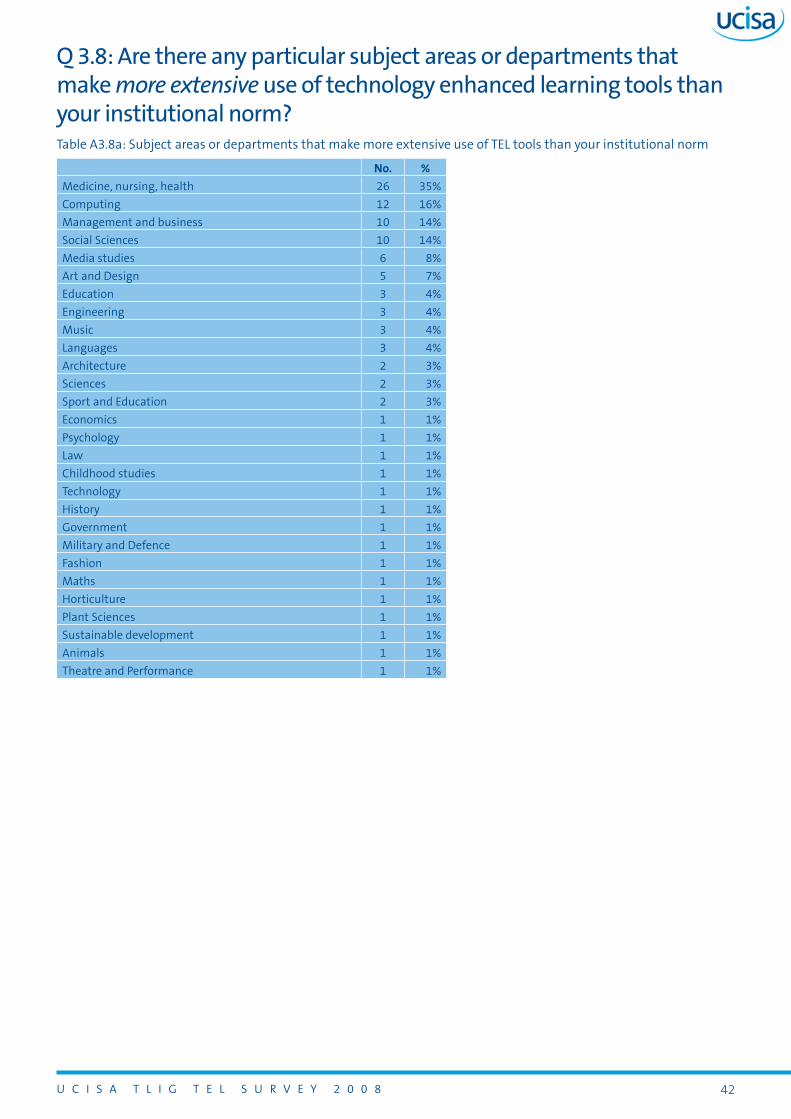
u C I s A T L I g T e L s u r v e y 2 0 0 8 ��
Q 3.8: Are there any particular subject areas or departments that make more extensive use of technology enhanced learning tools than your institutional norm?Table A3.8a: subject areas or departments that make more extensive use of TeL tools than your institutional norm
No. %
Medicine, nursing, health 26 35%
Computing 12 16%
Management and business 10 14%
social sciences 10 14%
Media studies 6 8%
Art and Design 5 7%
education 3 4%
engineering 3 4%
Music 3 4%
Languages 3 4%
Architecture 2 3%
sciences 2 3%
sport and education 2 3%
economics 1 1%
Psychology 1 1%
Law 1 1%
Childhood studies 1 1%
Technology 1 1%
History 1 1%
government 1 1%
Military and Defence 1 1%
Fashion 1 1%
Maths 1 1%
Horticulture 1 1%
Plant sciences 1 1%
sustainable development 1 1%
Animals 1 1%
Theatre and Performance 1 1%

u C I s A T L I g T e L s u r v e y 2 0 0 8 ��
Table A3.8b: reasons for the more extensive use of technology enhanced learning tools
No. %
Dedicated champion drives usage 33 45%
In school/department support and strategy encouraging TeL take up 20 27%
E-assessment 20 27%
Provides off campus support (outreach and placement provision) 18 24%
suitability of curriculum to TeL delivery 17 23
Courses are distance/full e-learning awards 11 15
Facilitated through higher ICT literacy of students 8 11%
Nature of market and perceived competition 8 11%
Availability of funding 8 11%
student expectations 6 8%
external regulatory requirements 6 8%
Nature of student body (diverse) 5 7%
support large numbers of students 5 7%
Facilitate independent learning and peer support 5 7%
reduces course administration 4 5%
E-portfolios 4 5%
Communication to students 4 5%
Keep course delivery at cutting edge 4 5%
Integrated teaching strategy across departments employing TeL 4 5%
TeL usage is a part of CPD for students – supports skills development 4 5%
Plagiarism detection 3 4%
supports overseas franchise and collaboration 2 3%
Addresses lack of contact time with students 2 3%
existing software packages for discipline which can be devlivered online 2 3%
Driven by senior managers 2 3%
Formative assessment 1 1%
recording student activity 1 1%
TeL usage is a part of CPD for staff – supports skills development 1 1%
standardisation of course delivery with common interface 1 1%
Improves student learning experience 1 1%

u C I s A T L I g T e L s u r v e y 2 0 0 8 ��
Q 3.9: Are there any particular subject areas or departments that make less extensive use of technology enhanced learning tools than your institutional norm?Table A3.9a: subject areas or departments that make less extensive use of technology enhanced learning tools than your institutional norm
No. %
Art, music, drama 23 31%
english 8 11%
social sciences 8 11%
Architecture 5 7%
Law 2 3%
Computing 1 1%
Health 1 1%
History 1 1%
Maths 1 1%
religious studies 1 1%
engineering 1 1%
Design 1 1%
Classics 1 1%
Business 1 1%
Interior design 1 1%
Animal/rural/environmental sciences 1 1%
Table A3.9b: reasons for the less extensive use of technology enhanced learning tools
No. %
TeL not relevant to the learning and teaching approach 28 38%
Low level of staff ICT literacy 8 11%
staff unwilling to engage with TeL (research takes preference over teaching) 7 9%
No buy in from department 6 8%
Lack of staff understanding and time 4 5%
No staff TeL champion 3 4%
Lack of technical support (poor links to central support services) 3 4%
Low level of student ICT literacy 2 3%
Few placement/work based students 2 3%
Numbers od part time staff 1 1%
Firewalls (practice based) present access problems 1 1%
Accessibility (dyslexic students and staff) 1 1%
Poor level of learning technology support 1 1%
Lack of focus on student learning experience 1 1%
registration problems for students on elective modules 1 1%
No (HeA) subject centre to promote TeL 1 1%
recording lectures led to decline in lecture attendance 1 1%

u C I s A T L I g T e L s u r v e y 2 0 0 8 ��
Q 3:10: Approximately, what proportion of courses within your institution use summative e-assessment (as part of course delivery)?Table 3.10a: Proportion of courses using summative e-assessment (as part of course delivery)
No. Total pre-92 post-92 coll eng Wal sco
100% 0 0% 0% 0% 0% 0% 0% 0%
75% – 99% 0 0% 0% 0% 0% 0% 0% 0%
50% – 74% 1 1% 3% 0% 0% 2% 0% 0%
25% – 49% 3 4% 0% 8% 11% 3% 14% 0%
1% – 24% 47 64% 59% 73% 56% 66% 43% 71%
0% 12 16% 26% 0% 22% 19% 14% 0%
Don’t know 11 15% 13% 19% 11% 10% 29% 29%
Table A3.10b: Proportion of courses using formative e-assessment
No. Total pre-92 post-92 coll eng Wal sco
100% 0 0% 0% 0% 0% 0% 0% 0%
75% – 99% 3 4% 5% 4% 0% 50% 0% 0%
50% – 74% 5 7% 5% 8% 11% 7% 14% 0%
25% – 49% 18 24% 23% 35% 0% 20% 14% 71%
1% – 24% 31 42% 44% 35% 56% 48% 43% 0%
0% 6 8% 10% 0% 22% 10% 0% 0%
Don’t know 11 15% 13% 19% 11% 10% 29% 29%
Table A3.10c: Proportion of courses using e-portfolio/PDP/progress files
No. Total pre-92 post-92 coll eng Wal sco
100% 0 0% 0% 0% 0% 0% 0% 0%
75% – 99% 5 7% 5% 12% 0% 5% 14% 0%
50% – 74% 4 5% 8% 4% 0% 5% 14% 0%
25% – 49% 12 16% 21% 12% 11% 17% 29% 0%
1% – 24% 35 47% 39% 58% 56% 49% 14% 71%
0% 5 7% 8% 0% 22% 9% 0% 0%
Don’t know 13 18% 21% 15% 11% 15% 29% 29%
Table A3.10d: Proportion of courses using peer support tools
No. Total pre-92 post-92 coll eng Wal sco
100% 0 0% 0% 0% 0% 0% 0% 0%
75% – 99% 1 14% 3% 0% 0% 2% 0% 0%
50% – 74% 4 7% 8% 0% 11% 5% 14% 0%
25% – 49% 18 24% 21% 27% 33% 25% 29% 14%
1% – 24% 29 39% 39% 46% 22% 39% 43% 43%
0% 4 5% 8% 0% 11% 7% 0% 0%
Don’t know 18 24% 23% 27% 22% 22% 14% 43%
Table A3.10e: Proportion of courses using problem based learning tools
No. Total pre-92 post-92 coll eng Wal sco
100% 0 0% 0% 0% 0% 0% 0% 0%
75% – 99% 0 0% 0% 0% 0% 0% 0% 0%
50% – 74% 1 1% 0% 4% 0% 2% 0% 0%
25% – 49% 14 19% 23% 19% 0% 19% 14% 29%
1% – 24% 35 47% 44% 42% 78% 51% 57% 14%
0% 4 5% 10% 0% 0% 7% 0% 0%
Don’t know 20 27% 23% 35% 22% 22% 29% 57%

u C I s A T L I g T e L s u r v e y 2 0 0 8 ��
Table A3.10f: Proportion of courses using collaborative working tools
No. Total pre-92 post-92 coll eng Wal sco
100% 0 0% 0% 0% 0% 0% 0% 0%
75% – 99% 3 4% 0% 4% 22% 3% 14% 0%
50% – 74% 7 10% 10% 12% 0% 10% 0% 14%
25% – 49% 22 30% 28% 35% 22% 29% 43% 29%
1% – 24% 31 42% 49% 31% 44% 46% 29% 29%
0% 3 4% 5% 0% 11% 5% 0% 0%
Don’t know 8 11% 8% 19% 0% 7% 14% 29%
Table A3.10g: Proportion of courses using tools to support online student presentations (individual and group)
No. Total pre-92 post-92 coll eng Wal sco
100% 0 0% 0% 0% 0% 0% 0% 0%
75% – 99% 0 0% 0% 0% 0% 0% 0% 0%
50% – 74% 3 4% 5% 4% 0% 3% 0% 14%
25% – 49% 7 10% 3% 23% 0% 10% 14% 0%
1% – 24% 39 53% 51% 50% 67% 54% 57% 43%
0% 7 10% 13% 4% 11% 12% 0% 0%
Don’t know 18 24% 28% 19% 22% 20% 29% 43%
Table A3.10h: Proportion of courses using assignment submission tools?
No. Total pre-92 post-92 coll eng Wal sco
100% 2 3% 3% 0% 11% 3% 0% 0%
75% – 99% 6 8% 8% 12% 0% 9% 0% 14%
50% – 74% 11 15% 18% 15% 0% 14% 14% 29%
25% – 49% 22 30% 33% 27% 22% 29% 43% 29%
1% – 24% 20 27% 29% 23% 44% 32% 14% 0%
0% 3 4% 3% 4% 11% 3% 14% 0%
Don’t know 10 14% 10% 19% 11% 10% 14% 29%
Table A3.10i: Proportion of courses using tools to provide access to course material
No. Total pre-92 post-92 coll eng Wal sco
100% 5 7% 3% 12% 11% 7% 0% 14%
75% – 99% 39 53% 46% 65% 44% 51% 57% 57%
50% – 74% 11 15% 23% 8% 0% 17% 14% 0%
25% – 49% 10 14% 15% 0% 44% 17% 0% 0%
1% – 24% 3 4% 8% 0% 0% 3% 14% 0%
0% 0 0% 0% 0% 0% 0% 0% 0%
Don’t know 6 8% 5% 15% 0% 75 14% 29%
Table A3.10j: Proportion of courses using tools to provide access to multimedia resources
No. Total pre-92 post-92 coll eng Wal sco
100% 1 1% 3% 0% 0% 2% 0% 0%
75% – 99% 2 3% 3% 0% 11% 3% 0% 0%
50% – 74% 5 7% 8% 8% 0% 7% 14% 0%
25% – 49% 10 14% 13% 15% 11% 14% 14% 14%
1% – 24% 39 53% 54% 54% 44% 58% 28% 43%
0% 4 5% 5% 0% 22% 7% 0% 0%
Don’t know 13 18% 15% 23% 11% 10% 43% 43%

u C I s A T L I g T e L s u r v e y 2 0 0 8 ��
Table A3.10k: Proportion of courses using tools to provide access to external web based resources
No. Total pre-92 post-92 coll eng Wal sco
100% 7 10% 13% 4% 11% 12% 0% 0%
75% – 99% 20 27% 23% 35% 22% 22% 43% 43%
50% – 74% 16 22% 21% 27% 11% 25% 14% 0%
25% – 49% 16 22% 21% 12% 56% 29% 14% 29%
1% – 24% 7 10% 13% 8% 0% 12% 0% 0%
0% 0 0% 0% 0% 0% 0% 0% 0%
Don’t know 8 11% 13% 15% 0% 7% 29% 29%
Q 3.11: What systems in your institution are linked to your technology enhanced learning (TEL) tools? For example, some institutions link their institutional VLE with Library electronic services, or with their student records system etc.Table 3.11A: systems that are linked to your TeL tools
No. Total pre-92 post-92 coll
vLe 45 68% 68% 65% 83%
student records/administration system 35 53% 53% 46% 83%
Library (system/catalogue) 13 20% 21% 19% 17%
Portal 2 4% 3% 4% 0%
Q 4.1: Which, if any, support units are there in your institution that provide support for technology enhanced learning?Table A4.1a: support units that provide support for technology enhanced learning
No. Total pre-92 post-92 coll eng Wal sco
IT support unit 59 80% 77% 85% 78% 81% 86% 71%
Learning Technology support unit 47 67% 64% 65% 56% 66% 57% 43%
educational Development unit 41 56% 49% 69% 44% 54% 29% 86%
Other 39 47% 49% 42% 54% 44% 53% 71%
Outsourced support 3 4% 5% 4% 0% 10% 0% 0%
Table A4.1b: Number of units providing support for TeL per institution
Number of support units per institution No. Total pre-92 post-92 coll eng Wal sco
0 5 7% 8% 4% 11% 7% 0% 14%
1 8 11% 15% 4% 11% 12% 14% 0%
2 24 32% 31% 35% 33% 31% 43% 29%
3 29 39% 31% 50% 44% 39% 43% 43%
4 6 8% 13% 4% 0% 9% 0% 14%
5 2 3% 3% 4% 0% 3% 0% 0%
Mean number of support units 2.4 2.3 2.6 2.1 2.4 2.3 2.4

u C I s A T L I g T e L s u r v e y 2 0 0 8 ��
Q 4.2: How many staff work in the unit?Table A4.2a: Mean number of staff working in IT support units
No. Mean pre-92 post-92 coll eng Wal sco
Number of learning technology staff working in IT support unit
59 0.6 0.7 0.5 0.1 0.6 0.3 0.4
Number of IT support staff working in IT support unit 59 13.8 14.2 16.3 4.9 14 10.2 17.2
Number of learning administrative staff working in IT support unit
59 0.6 0.5 0.8 0.3 0.6 0.7 0.2
Number of learning academic staff working in IT support unit
59 0.1 0.1 0 0 0 0.5 0
Number of other staff working in IT support unit 59 3.5 0.1 9.2 0 4.3 0 0
Table A4.2b: Mean number of staff working in Learning Technology support units
No. Mean pre-92 post-92 coll eng Wal sco
Number of learning technology staff working in LTsu 47 5.8 6.4 5.9 2.4 6.3 1.3 3.3
Number of IT support staff working in LTsu 47 1.3 1.2 1.8 0.2 1.2 1.3 1.3
Number of learning administrative staff working in LTsu 47 0.3 0.4 0.2 0.6 0.2 0.3 1.3
Number of learning academic staff working in LTsu 47 0.4 0.04 0.9 0.6 0.4 1.0 0
Number of other staff working in LTsu 47 0.2 0.1 0.4 0 0.2 0.8 0
Table A4.2c: Mean number of staff working in educational Development units
No. Mean pre-92 post-92 coll eng Wal sco
Number of learning technology staff working in eDu support
41 1.5 2.0 1.1 0.5 1.5 0 2.2
Number of IT support staff working in eDu support 41 0.2 0.1 0.3 0 0.2 0.5 0.3
Number of learning administrative staff working in eDu support
41 1.0 0.3 1.8 0.3 0.8 1.5 1.5
Number of learning academic staff working in eDu support
41 3.0 1.9 4.8 0.8 3.0 1.5 3.8
Number of other staff working in eDu support 41 1.0 1.7 0.2 0.8 1.1 0.5 0.3
Table A4.2d: Mean number of staff working in other units
No. Mean pre-92 post-92 coll eng Wal sco
Number of learning technology staff working in other support
30 2.9 3.6 3.0 0 2.5 1.8 8.0
Number of IT support staff working in other support 30 1.3 0.6 2.6 0.8 1.6 0.3 0.7
Number of learning administrative staff working in other support
30 2.1 2.8 1.7 0.3 2.7 0.3 0
Number of learning academic staff working in other support
30 1.9 0.8 3.6 2.0 2.1 2.0 0
Number of other staff working in other support 30 11.7 21.0 0.6 2.0 15.0 1.3 0
Table A4.4: Training and development activities promoted to support staff that help others in the use of technology enhanced learning tools
No. rank08 % pre-92 post-92 coll eng Wal sco
Internal staff development 67 1 91% 90% 100% 67% 92% 86% 86%
National conferences/seminars 65 2 88% 87% 96% 67% 88% 86% 86%
external training courses 57 3= 77% 77% 81% 67% 78% 57% 86%
Association for learning technology events 57 3= 77% 77% 85% 56% 78% 57% 86%
Higher education academy subject centre events 56 5 76% 72% 89% 56% 75% 86% 71%
regional seminars 54 6 73% 77% 77% 44% 70% 86% 86%
International conferences/seminars 42 7 57% 62% 58% 33% 54% 57% 71%
regional support centre events 40 8 54% 51% 50% 78% 48% 86% 71%
universities and colleges information systems association
33 9 45% 41% 54% 33% 44% 43% 43%
Other training activity 10 10 14% 10% 27% 0% 15% 14% 14%
None are promoted 1 11 1% 0% 0% 11% 2% 0% 0%

u C I s A T L I g T e L s u r v e y 2 0 0 8 ��
Table A4.5: Categories of students that are provided with more focused or specialist support and training for technology enhanced learning
No. Mean pre-92 post-92 coll eng Wal sco
students with special needs 46 62% 59% 77% 33% 59% 71% 71%
Distance learners 29 39% 36% 46% 33% 31% 43% 100%
None receive more focused training 21 28% 28% 19% 56% 32% 29% 0%
Off campus learners 16 22% 21% 19% 33% 15% 29% 71%
Part time learners 10 14% 8% 19% 22% 9% 29% 43%
Other groups 2 3% 5% 0% 0% 3% 0% 0%
Number of respondents 74
Table A4.6: Who provides the more focused or specialised support?
Provider of focused or specialised support %
Local provision (schools, course teams) 36%
Learning Technology support/E-learning units 28%
Disability Advisors/unit 26%
student services/student support Centres 17%
Library/LIs 15%
IT services 13%
educational Development units 9%
Centres for llearning and study skills 8%
Distance learning team 6%
Web based/CD/DvD 4%
external Tutor 2%
CeTL 2%
Drop-in Centre 2%
Not answered 4%
Number of respondents 53
Table A4.7: And is this support centrally or locally provided?
No. % pre-92 post-92 coll eng Wal sco
Centrally provided 49 93% 89% 95% 100% 93% 80% 100%
Locally provided 25 47% 43% 57% 25% 40% 60% 86%
Number of respondents 53
Table A4.8: And to what extent is this help and support available across the institution?
No. % pre-92 post-92 coll eng Wal sco
Available institution wide 51 96% 93% 100% 100% 93% 80% 100%
Available across most, but not all of 1 2% 4% 0% 0% 3% 0% 0%
Only available in very localised parts 1 2% 4% 0% 0% 0% 20% 0%
Number of respondents 53

u C I s A T L I g T e L s u r v e y 2 0 0 8 �0
Q 5.1: What, in your opinion, are the barriers in your institution to any (further) development to promote TEL tools over the coming years?Table A5.1: ranked potential barriers to any (further) development of processes to promote and support technology enhanced learning tools.
extent to which... No. sector rank08
sector Mean
pre-92 post-92 coll eng Wal sco
Lack of time is barrier 74 1 3.22 3.28 3.04 3.44 2.71 3.29
Lack of academic staff knowledge is barrier 74 2 2.68 2.69 2.54 3.00 3.43 2.86
Lack of money is barrier 74 3 2.66 3.03 2.12 2.67 2.57 2.29
Institutional culture is barrier 74 4 2.55 2.67 2.15 3.22 2.57 2.43
Lack of support staff is barrier 74 5 2.50 2.64 2.23 2.67 1.86 2.29
Lack of recognition for career development is barrier
74 6 2.46 2.38 2.73 2.00 2.43 2.71
Lack of academic staff development is barrier 74 7 2.38 2.36 2.23 2.89 2.71 2.14
Lack of incentives is barrier 74 8 2.35 2.44 2.35 2.00 1.86 2.71
Technical problems is barrier 74 9 1.96 1.97 1.81 2.33 1.71 1.29
Organisational structure is barrier 74 10 1.92 2.05 1.58 2.33 2.00 1.43
Changing administrative processes is barrier 74 11 1.70 1.74 1.77 1.33 1.29 1.71
Lack of strategy and leadership is barrier 74 12 1.66 2.05 1.08 1.67 1.00 1.71
Inappropriate policies and procedures is barrier 74 12 1.45 1.46 1.31 1.78 0.71 1.29
Too many diverse standards and guidelines is barrier
74 14 1.27 1.51 1.00 1.00 1.14 1.29
Lack of student engagement is barrier 74 15 1.23 1.18 1.08 1.89 1.43 1.14
Too few standards and guidelines is barrier 74 16 1.22 1.26 1.12 1.33 1.00 1.43
support available across institution 53 17 1.09
Table A5.2: Has your institution considered the outsourcing of some or all of your provision and support for technology enhanced learning?
No. %
external hosting systems 19 26%
Web 2.0 Technologies 5 7%
Maintenance and support 3 4%
AsP service 2 3%
Digital repositories 2 3%
student email 1 1%
staff development, such as e-moderating 1 1%
24/7 helpdesk support 1 1%
Wimba virtual Classroom 1 1%
survey tools 1 1%
Content development 1 1%
google apps for education 1 1%

u C I s A T L I g T e L s u r v e y 2 0 0 8 �1
Table A5.3: recent and prospective developments in technology that are starting to make new demands in terms of the support required by uses
No. %
Streaming media and large media files 19 26%
Mobile computing 19 26%
Podcasting 17 23%
Web 2.0 17 23%
Digital repositories 10 14%
E-assessment 10 14%
E-portfolios 9 12%
recording of lectures 8 11%
Portals 7 10%
virtual Words (e.g. second Life) 7 10%
Copyright 5 7%
Collaboration tools 4 5%
Plagiarism 4 5%
student use of external systems 4 5%
Integration 4 5%
Distance learning 3 4%
Flexible technologies 3 4%
Infrastructure 3 4%
vLe change within the institution 3 4%
Content development 2 3%
staff skills support 2 3%
student centred approaches 2 3%
student expectations 2 3%
student skills support 2 3%
Text messaging 2 3%
Continuing Professional Development (CPD) 1 1%
Diversification of student population 1 1%
e-publishing 1 1%
gaming and simulation 1 1%
Interactive whiteboards 1 1%
Personal response systems 1 1%
Public engagement 1 1%
support for student hardware 1 1%
vista and Windows 2007 1 1%
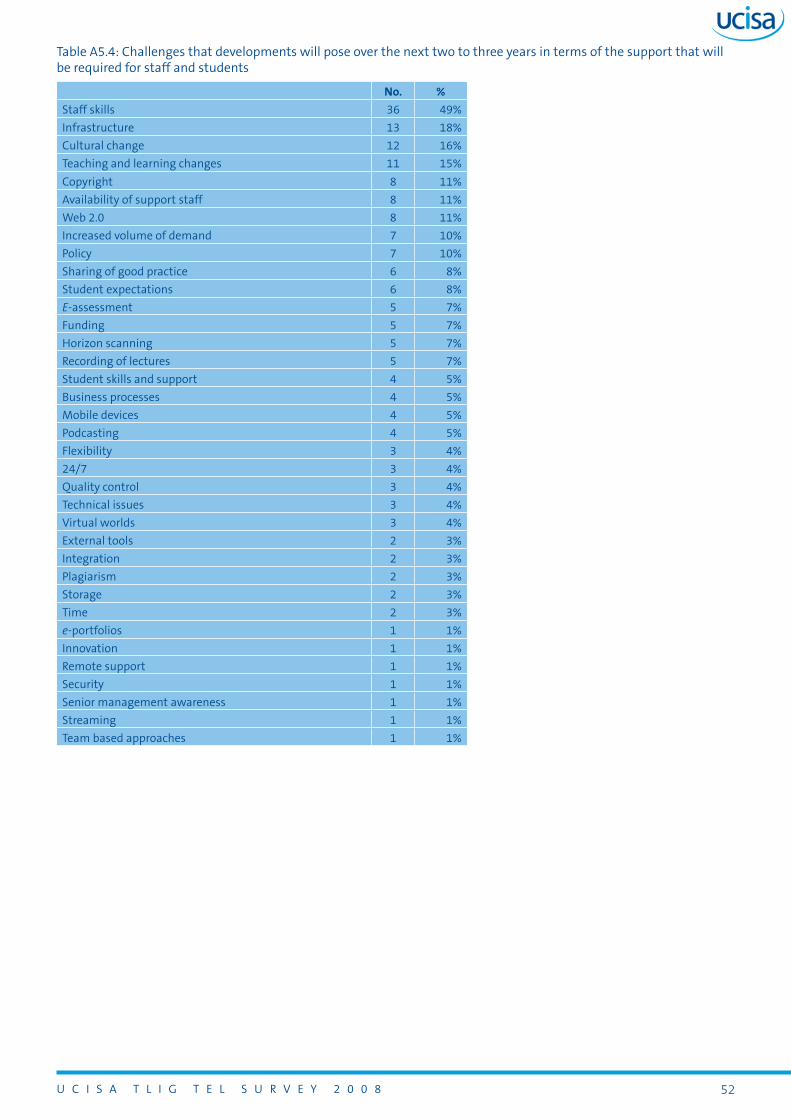
u C I s A T L I g T e L s u r v e y 2 0 0 8 ��
Table A5.4: Challenges that developments will pose over the next two to three years in terms of the support that will be required for staff and students
No. %
staff skills 36 49%
Infrastructure 13 18%
Cultural change 12 16%
Teaching and learning changes 11 15%
Copyright 8 11%
Availability of support staff 8 11%
Web 2.0 8 11%
Increased volume of demand 7 10%
Policy 7 10%
sharing of good practice 6 8%
student expectations 6 8%
E-assessment 5 7%
Funding 5 7%
Horizon scanning 5 7%
recording of lectures 5 7%
student skills and support 4 5%
Business processes 4 5%
Mobile devices 4 5%
Podcasting 4 5%
Flexibility 3 4%
24/7 3 4%
Quality control 3 4%
Technical issues 3 4%
virtual worlds 3 4%
external tools 2 3%
Integration 2 3%
Plagiarism 2 3%
storage 2 3%
Time 2 3%
e-portfolios 1 1%
Innovation 1 1%
remote support 1 1%
security 1 1%
senior management awareness 1 1%
streaming 1 1%
Team based approaches 1 1%

u C I s A T L I g T e L s u r v e y 2 0 0 8 ��
Table A5.5: How challenges are overcome
No. %
staff development 14 19%
strategy 14 19%
support for academic staff 11 15%
Increased resources and funding 10 14%
research and dissemination 10 14%
senior management support 9 12%
Cultural change 4 5%
Specific projects 4 5%
Development time 3 4%
embedding 3 4%
Quality and standards 3 4%
Partnerships 2 3%
Forward planning 1 1%
JISC guidance 1 1%
risk taking 1 1%

u C I s A T L I g T e L s u r v e y 2 0 0 8 ��
Appendix B: Longitudinal analysis between 2008 and the 2005, 2003 and 2001 Surveys
This Appendix presents the data that has been used in the longitudinal analysis undertaken in the main text. Note that this is only provided for Type of university (data was not differentiated by uK countries in previous surveys). The emphasis has been placed on looking at changes over time for the undifferentiated data and comparing over time any differences between pre-92 and post-92 universities.
A necessary note of caution – the questions asked between surveys have not always used identical wording. The exact wording for each question analysed in this Appendix is given in the following Appendix C.
Q 1.1: How important, if at all, have each of the following drivers been in your institution to date?Table B1.1 is a reworking of Table A1.1, with only those questions that were asked in 2008, 2005 and 2003. Therefore, the ranking numbers under the column Rank08 have been recalibrated when compared with those in Table A1.1.
Table B1.1: Comparison of 2008 ranks with those for 2005 and 2003
all
rank08 rank05 rank03 Question
1 1 1 enhancing quality of learning and teaching in general
2 3 5 Meeting student expectations
3 2 2 Improving access to learning for students off campus
4 7 4 Widening participtation/inclusiveness
5 5 3 Improving access to learning for part time students
6 6 6 Creating/improving competitive advantage
7 10 13 Keeping abreast of educational developments
8 9 9 Attracting home students
9= 4 7 Improving administrative processes
9= 12 15 Disability discrimination act (2005) part 4
11 11 10= Attracting international (outside eu) students
12= 13 10= Improving access to learning for overseas stduents
12= 8 8 Attracting new markets
14 14 10= Attracting eu students
15 15= 17 Developing wider regional/national role for institution
16 17 16 Formation of partnerships with other institutions
17 15= 14 Achieving cost/efficiancy savings
The differences in ranking over time between pre-92 and post-92 universities are shown in Figure B1.1.

u C I s A T L I g T e L s u r v e y 2 0 0 8 ��
-12 -10 -8 -6 -4 -2 0 2 4 6 8
Enhanc ing quality of L&T in genera lMeeting s tudent ex pec tations
Improv ing ac c es s to learn ing f or o f f -c ampus s tudentsW idening par tic ipation/inc lus iv enes s
Improv ing ac c es s to learn ing f or par t- time s tudentsCreating/improv ing c ompetetiv e adv antage
Keeping abreas t of educ ational dev elopmentsA ttrac ting home s tudents
Improv ing adminis trativ e proc es s esDis ability d is c r imination ac t (2005) par t 4
attrac ting in ternational (outs ide EU) s tudentsImprov ing ac c es s to learn ing f or ov ers eas s tudents
A ttrac ting new marketsA ttrac ting EU s tudents
Dev eloping w ider regional/national ro le f or ins titu tionFormation of par tners hips w ith other ins titu tions
A c hiev ing c os t/e f f ic ienc y s av ings
Rank d if f erenc es
Pr e-92:05Pr e-92:03Post -92:05Post -92:03
Figure B1.1: Pre-92 and post-92 differences between ranking for 2005 and 2003 compared with 2008.
In Figure B1.1, the length of the bars have been calculated by noting the difference in ranking from that for 2008. For example, the 2008 ranking for pre-92 universities for Keeping abreast of educational developments is 6. The equivalent ranking for 2005 is 10, thereby giving a difference of -4, and for 2003, is 13, thereby giving a difference of -7. A negative value indicates that the ranking has improved between that survey and the 2008 survey.
Q 1.3 How important, if at all are the following factors in encouraging the development of TEL and processes that promote it?Table B1.3: Comparison of 2008 ranks with those for 2005 and 2003
all
rank08 rank05 rank03 Factor
1 2 1 Committed local champions
2 1 3 Availability of internal funding
3 2 3 Technological changes/developments
4 4 4 Availability of external funding
5 5 5 Availability of relevant standards
Figure B1.3: Pre-92 and post-92 differences between ranking for 2005 and 2003 compared with 2008.

u C I s A T L I g T e L s u r v e y 2 0 0 8 ��
Question 2.1: Which, if any institutional strategies, inform the development of technology enhanced learning in your institution?Table B2.1: Institutional strategies that have informed TeL development
He Total 2008
He Total 2005
He Total 2003
Teaching and learning 100% 95% 64%
Library/learning resources 76% 74% 48%
E-learning strategy 76% 55% 37%
Corporate (2008 and 2005 only) 70% 53% -
estates (2008 and 2005 only) 58% 24% -
Quality enhancement (2008 and 2005 only) 58% 41% -
Access/widening participation (2008 and 2005 only) 54% 50% -
Information and communication technology 46% 56% 45%
Information 45% 52% 46%
Information and learning technology 41% 38% 32%
Human resources (2008 and 2005 only) 28% 3% -
Marketing (2008 and 2005 only) 27% 23% -
Communications 15% 8% 14%
E-strategy (2008 and 2005 only) 11% 8% -
Other 10% 6% 16%
Question 2.2: Which, if any external strategy documents inform the development of technology enhanced learning in your institution?Table B2.2: external strategy documents that have informed the development of TeL
He Total 2008
He Total 2005
HeFCe e-learning strategy 80% 50%
JISC strategies 77% 24%
Dfes e-learning strategy 47% 12%
strategies from professional bodies or agencies 34% 73%
Other HeFCe strategy documents 28% 68%
Other external strategy 18% 6%
Joint Scottish Funding Councils e-learning report 11% 27%
No external strategy 1% 0%
Question 3.3: How is the development of technology enhanced learning tools enabled within your institution? Table B3.3: The extent to which the development of TeL tools are enabled
He Total 2008
He Total 2005
He Total 2003
He Total 2001
Funded as a service 84% 75% - -
Project funding 80% 56% 69% 27%
Allowing academic staff development time 54% 49% 55% 48%
Allowing support staff development time 51% 41% 43% -
Contractual obligation/part of job specification 37% 28% - -
Career enhancement 27% 11% 9% -
Not enabled 1% 3% 2% -

u C I s A T L I g T e L s u r v e y 2 0 0 8 ��
0
0 .1
0 .2
0 .3
0 .40 .5
0 .6
0 .7
0 .8
0 .9
Fund
ed as
ase
rvice
Allow
ingac
adem
icsta
ffde
velop
ment
Contr
actua
lob
ligati
on/pa
rtof
jobsp
ecific
ation
.
Not e
nable
d
HE Tota l 2001HE Tota l 2003HE Tota l 2005HE Tota l 2008
Figure B3.3: The extent to which the development of TeL tools are enabled
Question 3.4: What VLE, if any, is currently used in your institution?Table B3.4a: vLes currently used
He Total 2008
He Total 2005
He Total 2003
He Total 2001
Moodle 55% 8% - -
Blackboard 50% 43% 43% 34%
WebCT 31% 37% 34% 60%
Other vLe developed in house 23% 38% 23% 11%
Other intranet based developed in house 12% 17% 26% -
FirstClass 10% 8% 19% 29%
Commercial intranet based product 5 0% 5% -
sakai 5 - - -
Other open source 5 - - -
Other commercial vLe 4 0% - -
Other open source vLe 4 - - -
No vLe 4 - - -
Desire2Learn 3 - - -
Bodington 3 8% 3% -
Merlin 1 1% 1% -
COse 1 - - -

u C I s A T L I g T e L s u r v e y 2 0 0 8 ��
Question 3.7: Approximately what proportion of all modules or units of study in the technology enhanced learning environment in use in your institution fall into each of the following categories? (Mean scores of % entered by respondents.)Table B3.7: Proportion of all modules or units of study in the TeL environment in use
sector Mean score 2008
sector Mean score 2005
sector Mean score 2003
N = 64 69 78
Mean % Category A 48% 54% 57%
Mean % Category B (i) 24% 16% 13%
Mean % Category B (ii) 13% 10% 10%
Mean % Category B (iii) 13% 13% 13%
Mean % Category C 4% 6% 5%
Category A – web supplemented, in which online participation is optional for students.
Category B – web dependent, requiring participation by the student for an online component of a face to face course, measured against three subcategories of participation:
(i) interaction with content;(ii) communication with staff/students;(iii) interaction with content and communication.
Category C – fully online courses
Table B4.4: Training and development activities promoted to support staff that help others in the use of technology enhanced learning tools
% of respondents (2008)
rank08 % 2005 rank05
Internal staff development 91% 1 79% 1
National conferences/seminars 88% 2 75% 2
external training courses 77% 3= 71% 3=
Association for learning technology events 77% 3= 71% 3=
Higher education academy subject centre events 76% 5 32% 8
regional seminars 73% 6 52% 5
International conferences/seminars 57% 7 -
regional support centre events 54% 8 35% 7
universities and colleges information systems association 45% 9 46% 6
Other training activity 14% 10 3%
None are promoted 1% 11 -
Table B4.5: Categories of students that are provided with more focused or specialist support and training for technology enhanced learning
2008 2005 2003 2001
students with special needs 62% 35% 25% 25%
Distance learners 39% 34% 38% 45%
None receive more focused training 28% -
Off campus learners 22% 23%
Part time learners 14% 11%
Other group 3% 2%
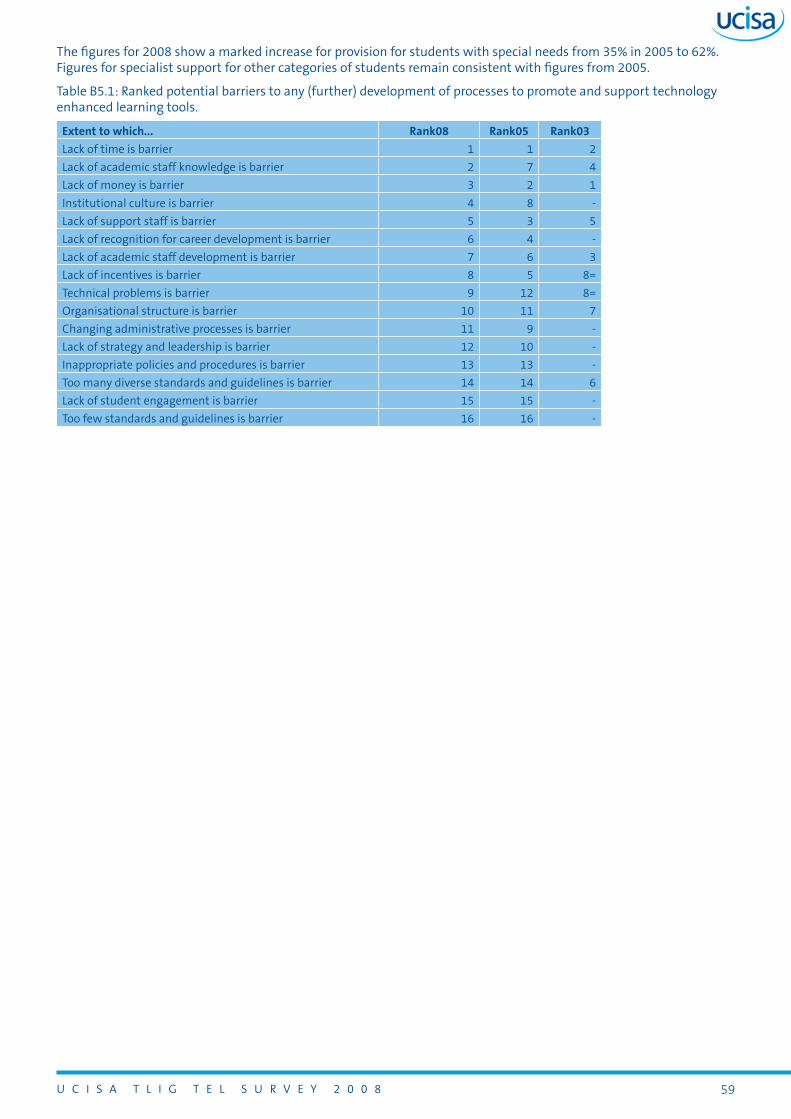
u C I s A T L I g T e L s u r v e y 2 0 0 8 ��
The figures for 2008 show a marked increase for provision for students with special needs from 35% in 2005 to 62%. Figures for specialist support for other categories of students remain consistent with figures from 2005.
Table B5.1: ranked potential barriers to any (further) development of processes to promote and support technology enhanced learning tools.
extent to which... rank08 rank05 rank03
Lack of time is barrier 1 1 2
Lack of academic staff knowledge is barrier 2 7 4
Lack of money is barrier 3 2 1
Institutional culture is barrier 4 8 -
Lack of support staff is barrier 5 3 5
Lack of recognition for career development is barrier 6 4 -
Lack of academic staff development is barrier 7 6 3
Lack of incentives is barrier 8 5 8=
Technical problems is barrier 9 12 8=
Organisational structure is barrier 10 11 7
Changing administrative processes is barrier 11 9 -
Lack of strategy and leadership is barrier 12 10 -
Inappropriate policies and procedures is barrier 13 13 -
Too many diverse standards and guidelines is barrier 14 14 6
Lack of student engagement is barrier 15 15 -
Too few standards and guidelines is barrier 16 16 -

u C I s A T L I g T e L s u r v e y 2 0 0 8 �0
Appendix C: Specification of the questions from the 2001, 2003, 2005 and 2008 Surveys for which longitudinal analysis was used in this report
Table B1.1: How important, if at all, have each of the following drivers been in your institution to date?
2008: Q1.1 How important, if at all, have each of the following drivers been in your institution to date?
2005: Q1.3 Listed below are possible driving factors for MLe development and the environments and processes that support e-learning. Which of those have been important in your institution to date? Please indicate the importance of each of these.
2003: Q1.4 Listed below are possible drivers that can encourage MLe development. Which have driven development of your MLe to date? Please indicate the importance of each of these in your institution.
Table B1.3 How important, if at all are the following factors in encouraging the development of TEL and processes that promote it?
2008: Q1.3 How important, if at all are the following factors in encouraging the development of TeL and processes that promote it?
2005: Q1.4 Listed below are possible supporting factors for MLe development and the environments and processes that support e-learning. Which of those have been important in your institution to date? Please indicate the importance of each of these in your institution.
2003: Q 1.4 Listed below are possible drivers that can encourage MLe development. Which have driven development of your MLe to date? Please indicate the importance of each of these in your institution.
Table B2.1: Which, if any institutional strategies, inform the development of technology enhanced learning in your institution?
2008: Q2.1 Which, if any institutional strategies, inform the development of technology enhanced learning in your institution?
2005: Q3.3 Which institutional strategies inform the development of processes to support e-learning in your institution? Please tick all that apply.
2003: Q3.6 Which institutional strategy documents consider development of your MLe? Please tick all that apply.
Table B2.2: Which, if any external strategy documents inform the development of technology enhanced learning in your institution?
2008: Q2.2 Which, if any external strategy documents inform the development of technology enhanced learning in your institution?
2005: Q3.4 Which external strategy documents inform the development of processes to support e-learning in your institution? Please tick all that apply.

u C I s A T L I g T e L s u r v e y 2 0 0 8 �1
Table B3.3: How is the development of technology enhanced learning tools enabled within your institution?
2008: Q3.3 How is the development of technology enhanced learning tools enabled within your institution?
2005 and 2003: 4.15 How is vLe development supported or encouraged within your institution? Please tick all that apply.
Table B3.4: What VLE(s) are used?2008: Q3.4: What vLe, if any, is currently used in your institution?
2005: Q4.2 What vLe(s) are used in your institution? Please tick all that apply.
2003: Q4.2 What vLes, commercial or in house, are used in your institution? Please tick all that apply.
2001: Q6 What virtual learning environments (vLes) are used at your institution? Please tick all that apply and indicate how long they have been used.
Table B3.7: Approximately what proportion of all modules or units of study in the technology enhanced learning environment in use in your institution fall into each of the following categories? (Mean scores of % entered by respondents.)
2008: Q3.7 Approximately what proportion of all modules or units of study in the technology enhanced learning environment in use in your institution fall into each of the following categories? (Mean scores of % entered by respondents.)
2005: Q4.9 How do all modules or units of study in the vLe(s) in use in your institution divide between the following categories? Please enter a percentage figure in each of the categories below, using an estimate if needed.
2003: Q4.7 How do all the vLe courses or modules in use in your institution divide between the following categories? Please enter a percentage figure in each of the categories below, using an estimate if needed.
Table B4.4: Training and development activities promoted to support staff that help others in the use of technology enhanced learning tools.
2008: Q4.4 Training and development activities promoted to support staff that help others in the use of technology enhanced learning tools.
2005: Q4.18 What training and development activities are offered to support staff who help other staff in the use of vLe(s)? Please tick all that apply.
Table B4.5: Which, if any, of the following groups of students receive more focused or specialised support and training in the use of TEL tools?
2008: Q4.5 Which, if any, of the following groups of students receive more focused or specialised support and training in the use of TeL tools?
2005 and 2003: Q 4.20 Do any of the following groups of students receive more focussed or specialised support and training in the use of vLes? Please tick any that apply and write in details of how the support or training offered is adapted for the group.
2001: Q30 Is any special provision made for students with special needs? If yes, please specify.

u C I s A T L I g T e L s u r v e y 2 0 0 8 ��
Table B5.1: Ranked potential barriers to any (further) development of processes to promote and support technology enhanced learning tools.
2008: Q5.1 What, in your opinion, are the barriers in your institution to any (further) development to promote TeL tools over the coming years?
2005: Q3.5 What, in your opinion, are the barriers to any (further) development of processes to support e-learning in your institution over the coming years?
2003: Q3.7 What, in your opinion, are the barriers to any (further) development of your (or any potential) MLe over the coming years?