2009 fact book - union pacific and food, transported from ... negative impact of the recession, ......
TRANSCRIPT

Union Pacific Corporation2009 ANALYST FACT BOOK

1
Table of Contents
Overview
System Map and Facts . . . . . . . . . . . . . . . . . . . . . . . . . . . . . . . . . . . 2
Company Overview . . . . . . . . . . . . . . . . . . . . . . . . . . . . . . . . . . . . . . 3
The Year in Review
Financial Results . . . . . . . . . . . . . . . . . . . . . . . . . . . . . . . . . . 4
Operations . . . . . . . . . . . . . . . . . . . . . . . . . . . . . . . . . . . . . . . 6
Marketing . . . . . . . . . . . . . . . . . . . . . . . . . . . . . . . . . . . . . . . . 8
Operations & Productivity
Safety and the Environment . . . . . . . . . . . . . . . . . . . . . . . . . . . . . . . 9
Investing in Our Future . . . . . . . . . . . . . . . . . . . . . . . . . . . . . . . . . .11
Track and Terminal Density . . . . . . . . . . . . . . . . . . . . . . . . . . . . . . .13
Markets
Agricultural . . . . . . . . . . . . . . . . . . . . . . . . . . . . . . . . . . . . . . . . . . .14
Automotive . . . . . . . . . . . . . . . . . . . . . . . . . . . . . . . . . . . . . . . . . . . .17
Chemicals. . . . . . . . . . . . . . . . . . . . . . . . . . . . . . . . . . . . . . . . . . . . .20
Energy . . . . . . . . . . . . . . . . . . . . . . . . . . . . . . . . . . . . . . . . . . . . . . . .22
Industrial Products . . . . . . . . . . . . . . . . . . . . . . . . . . . . . . . . . . . . . .25
Intermodal. . . . . . . . . . . . . . . . . . . . . . . . . . . . . . . . . . . . . . . . . . . . .27
Mexico. . . . . . . . . . . . . . . . . . . . . . . . . . . . . . . . . . . . . . . . . . . . . . . .30
Financials
Selected Financial Data . . . . . . . . . . . . . . . . . . . . . . . . . . . . . . . . .32
Consolidated Statements of Income. . . . . . . . . . . . . . . . . . . . . . .33
Consolidated Statements of Financial Position . . . . . . . . . . . . . .34
Consolidated Statements of Cash Flow . . . . . . . . . . . . . . . . . . . .35
Financial and Operating Statistics. . . . . . . . . . . . . . . . . . . . . . . . .36
Non-GAAP Definitions . . . . . . . . . . . . . . . . . . . . . . . . . . . . . . . . . .37
Non-GAAP Reconciliations
Fuel Adjusted Operating Expenses . . . . . . . . . . . . . . . . . . . . .38
Free Cash Flow . . . . . . . . . . . . . . . . . . . . . . . . . . . . . . . . . . . . .39
Return on Invested Capital (ROIC) . . . . . . . . . . . . . . . . . . . . .39
Debt to Capital/Adjusted Debt to Capital . . . . . . . . . . . . . . . .40
2005 Income Tax Adjustment . . . . . . . . . . . . . . . . . . . . . . . . . .41
Cautionary Information . . . . . . . . . . . . . . . . . . . . . . . . . . . . . . . . . .42
Company Vision/Mission Statement
VISIONBuilding AmericaOur vision symbolizes the Union Pacific experience for all the people whose lives we touch. It connects the importance of UP’s rail transportation to America’s economy, honors the generations that preceded us and is the promise for the generations that will follow us.
MISSIONThe Men and Women of Union Pacific Are Dedicated to Serve.Union Pacific works for the good of our customers, our shareholders and one another. Our commitment defines us and drives the economic strength of our company and our country.
VALUESFocus on Performance.Our concentration and determination will drive our safety, customer satisfaction and quality results.
Ensure High Ethical Standards.Our reputation will always be a source of pride for our employees and a bond with our customers, shareholders and community partners.
Work as a Team.We are all part of the same team, and working together to reach our common goals is one of our strengths. Communication and respect are the foundation of great teamwork.
Company Overview
Union Pacifi c Corporation (NYSE:UNP) is one of America’s leading transportation companies. Its principal operating company, Union Pacifi c Railroad, links 23 states in the western two-thirds of the United States.
Investor Inquiries
Union Pacific’s investor relations are coordinated through the Corporate Treasurer. Requests for interviews, investor packages and general information should be directed to:(402) 544-4227 or (877) 547-7261 or [email protected]
Website Information
For immediate receipt of new information as it becomes available, we invite you to regularly visit www.up.com. In the Investors section, you can view on-line or download a variety of informative documents, including SEC filings, annual reports, proxy statements, quarterly earnings, press releases, company presentations and corporate governance information. For automatic updates, please subscribe to the Company’s RSS (Really Simple Syndication) feed which provides links to new headlines and summaries through your news reader.

2
Seattle
Portland
Eastport
Spokane
Hinkle
Eugene Silver Bow
Nampa
Pocatello
Ogden
Salt Lake CityReno
RosevilleOaklandSan
FranciscoLathrop
Fresno
ColtonLos AngelesLong Beach
Calexico
Phoenix
Tucson
NogalesEl Paso
Eagle Pass
SanAntonio
Laredo
Brownsville
Houston
Livonia
New Orleans
Dallas
Ft. Worth
Amarillo
LubbockTexarkana Pine Bluff
Little RockMemphis
Oklahoma City
St. LouisKansas
City
Topeka
Wichita
Marysville
Chicago
Milwaukee
Des Moines
Duluth
Minneapolis/St. Paul
Omaha
Gibbon
North Platte
Shawnee Jct.
Cheyenne
Denver
Single & Double Track
Triple & Quadruple Track
System Map and Facts
2009 Facts
Route Miles (As of 12/31/09) 32,094Other Main Line 6,584Passing Lines and Turnouts 3,040Switching and Classifi cation Yard Lines 9,167 Total Track Miles 50,885 Track Miles of Rail Installed and Replaced * New 639Used 264 Total 903 Track Miles of Continuous Welded Rail 28,161Track Miles Under Centralized Traffi c-Control 22,144Track Miles Ballasted 15,128Ties Installed and Replaced (thousands) * 4,925
Rail Equipment (As of 12/31/09)Road Locomotives 7,735Switching Locomotives 463Other Locomotives 152 Total 8,350
Covered Hoppers 32,788Open Hoppers 17,551Gondolas 13,104Boxcars 8,203Refrigerated Cars 7,114Flat Cars 3,835Other 602 Total 83,197
Average Age of Equipment (Years) Road Locomotives 15.1Switching Locomotives 30.6Other Locomotives 22.4
Covered Hoppers 30.1Open Hoppers 30.2Gondolas 27.3Boxcars 27.1Refrigerated Cars 21.6Flat Cars 32.0
* Represent “all-in” numbers, which include engineering replacement programs, commercial facility and capacity work, and other miscellaneous rail and tie projects.
3
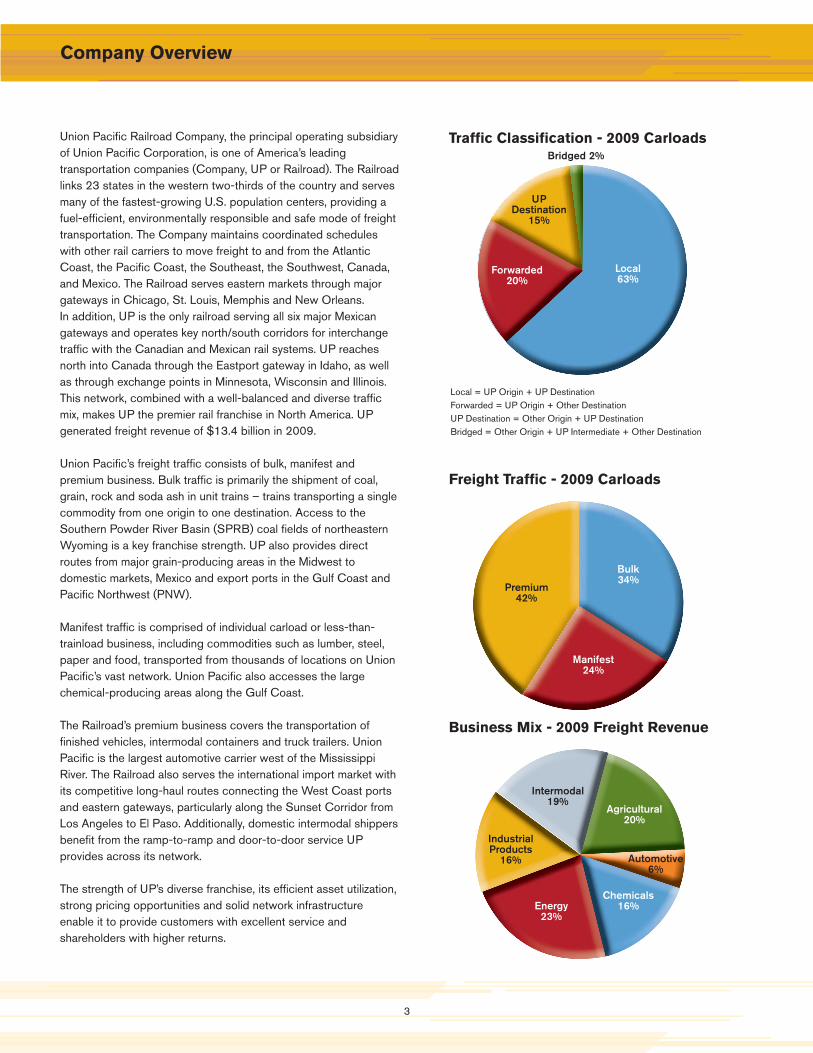
Union Pacifi c Railroad Company, the principal operating subsidiary of Union Pacifi c Corporation, is one of America’s leading transportation companies (Company, UP or Railroad). The Railroad links 23 states in the western two-thirds of the country and serves many of the fastest-growing U.S. population centers, providing a fuel-effi cient, environmentally responsible and safe mode of freight transportation. The Company maintains coordinated schedules with other rail carriers to move freight to and from the Atlantic Coast, the Pacifi c Coast, the Southeast, the Southwest, Canada, and Mexico. The Railroad serves eastern markets through major gateways in Chicago, St. Louis, Memphis and New Orleans. In addition, UP is the only railroad serving all six major Mexican gateways and operates key north/south corridors for interchange traffi c with the Canadian and Mexican rail systems. UP reaches north into Canada through the Eastport gateway in Idaho, as well as through exchange points in Minnesota, Wisconsin and Illinois. This network, combined with a well-balanced and diverse traffi c mix, makes UP the premier rail franchise in North America. UP generated freight revenue of $13.4 billion in 2009.
Union Pacifi c’s freight traffi c consists of bulk, manifest and premium business. Bulk traffi c is primarily the shipment of coal, grain, rock and soda ash in unit trains – trains transporting a single commodity from one origin to one destination. Access to the Southern Powder River Basin (SPRB) coal fi elds of northeastern Wyoming is a key franchise strength. UP also provides direct routes from major grain-producing areas in the Midwest to domestic markets, Mexico and export ports in the Gulf Coast and Pacifi c Northwest (PNW).
Manifest traffi c is comprised of individual carload or less-than-trainload business, including commodities such as lumber, steel, paper and food, transported from thousands of locations on Union Pacifi c’s vast network. Union Pacifi c also accesses the large chemical-producing areas along the Gulf Coast.
The Railroad’s premium business covers the transportation of fi nished vehicles, intermodal containers and truck trailers. Union Pacifi c is the largest automotive carrier west of the Mississippi River. The Railroad also serves the international import market with its competitive long-haul routes connecting the West Coast ports and eastern gateways, particularly along the Sunset Corridor from Los Angeles to El Paso. Additionally, domestic intermodal shippers benefi t from the ramp-to-ramp and door-to-door service UP provides across its network.
The strength of UP’s diverse franchise, its effi cient asset utilization, strong pricing opportunities and solid network infrastructure enable it to provide customers with excellent service and shareholders with higher returns.
Traffi c Classifi cation - 2009 Carloads
Freight Traffi c - 2009 Carloads
Business Mix - 2009 Freight Revenue
Company Overview
Local63%
Forwarded20%
UPDestination
15%
Bridged 2%
Bulk34%
Manifest24%
Premium42%
Agricultural20%
Automotive6%
Chemicals16%Energy
23%
IndustrialProducts
16%
Intermodal19%
Local = UP Origin + UP DestinationForwarded = UP Origin + Other DestinationUP Destination = Other Origin + UP DestinationBridged = Other Origin + UP Intermediate + Other Destination

4
Despite ongoing core price improvements, Union Pacifi c reported
operating revenue of $14.1 billion, a 21 percent decline from 2008
due to signifi cantly lower year-over-year volumes and reduced
fuel surcharge revenue. Net income decreased 19 percent to
$1.9 billion. Earnings per share dropped 17 percent from 2008
to $3.75. Return on invested capital was 2.0 points lower than
in 2008 at 8.2 percent. These fi nancial results demonstrate the
negative impact of the recession, with carloads down 16 percent
for the year. Decreases in auto and overall industrial production,
lower consumer spending and reduced international intermodal
volumes at West Coast ports all contributed to the volume decline.
The Year in Review - Financial Results
However, the combination of signifi cant productivity gains, pricing
and lower fuel prices led to an operating ratio of 76.0 percent, an
improvement of 1.3 points and a post-merger record. Operating
expenses declined 23 percent, including the impact of lower year-
over-year fuel expenses. Union Pacifi c’s average diesel fuel price
for 2009 was $1.75 per gallon, down 44 percent from $3.15 per
gallon in 2008. This price decrease saved the Company over $1.3
billion in fuel expense year-over-year.
Excluding the impact of lower fuel prices, operating expenses
in 2009 decreased approximately 13 percent from 2008, which
translated into an expense variability level of 80 percent for the
year. Lower volumes, strong effi ciency gains and cost management
all combined to create permanent change in the Company’s cost
structure.
Financial Summary
Union Pacifi c Corporation 2009 2008 2007
Operating Revenues (millions) $14,143 $17,970 $16,283
Operating Income (millions) $3,392 $4,075 $3,375
Operating Ratio 76.0% 77.3% 79.3%
Operating Margin 24.0% 22.7% 20.7%
Employees (average) 43,531 48,242 50,089
Average Fuel Price Per Gallon Consumed $1.75 $3.15 $2.27
Cash Capital Expenditures (millions) $2,384 $2,780 $2,496
Long-Term Leases (millions) (a) $100 $353 $516
(a) Represents the net present value of long-term operating and/or capital leases for new equipment.
Operating Ratio Improvement
2006 20082007 2009
81.5%
77.3%
79.3%
76.0%
Carloads(In Thousands)
* Operating expenses are normalized for 2008 fuel price per gallon. See Non-GAAP Reconciliations in Financials section of the 2009 Fact Book.
2008
9,2617,786
2009
-16%13,895
12,099
2008 2009
-13%Fuel PriceAdjusted*
Reported
Operating Expenses($ In Millions)
10,751

5
Q1 Q3Q2 Q4
-7.4%2.7
2.6 2.6Flat+4.0%
2.5
The Year in Review - Financial Results
Q1 Q3Q2 Q4
-2.1%146
157
143
161+9.8%
+2.5%2009 7-Day Carloadings(In Thousands)
2009 Operating Expenses*($ In Billions)
Approximately two-thirds of the expense reduction in 2009
resulted from lower volumes, while one-third came from
productivity and cost control. These costs are not expected to
return on a one-for-one basis with volumes. As illustrated in the
charts below, volumes were very low in the fi rst and second
quarters of 2009, and the Company took steps to reduce costs
and drive effi ciency across the organization. Then, as volumes
improved sequentially in the third and fourth quarters of the year,
operating costs increased, but did so at a lower rate than volumes.
* Operating expenses are normalized for First Quarter 2009 fuel price per gallon. See Non-GAAP Reconciliations in Financials section of the 2009 Fact Book.

6
200920082007
92
84
76
Improving operational effi ciency is vital for the Company to reach
its fi nancial and performance goals, especially in a challenging
economic environment. Simplifying and streamlining rail operations
and using resources effi ciently create the foundation upon which
customer service and shareholder value increase.
In 2009, system velocity increased 16 percent over the prior year.
In addition, the Company’s service delivery index (a composite
metric of all customer commitments), rose 8 points from 2008.
These improvements resulted from the implementation of
enhanced operational processes, advanced technology and
capacity investment. Lower volumes also contributed to these
results during the year.
The Year in Review - Operations
Operations Summary
Union Pacifi c Corporation 2009 2008 2007
Revenue Carloads (thousands) 7,786 9,261 9,733
Revenue Ton-Miles (billions) 479 563 562
Gross Ton-Miles (billions) 846 1,020 1,052
Average Train Speed (miles per hour) (a) 27.3 23.5 21.8
Average System Dwell (hours) (a) 24.8 24.9 25.1
Average Rail Car Inventory (a) 283,102 300,692 309,912
Fuel Consumed (millions of gallons) 979 1,229 1,326
GTMs per Employee (millions) 19.44 21.15 21.01
(a) As reported to the Association of American Railroads.
Service Delivery Index (SDI)*
* Includes early deliveries
AAR Train Speed(MPH)
Lower volumes required the Company to idle a signifi cant number
of assets, peaking during the second quarter of 2009 with
approximately 2,100 locomotives stored, 71,000 freight cars
parked and 5,300 employees furloughed. These critical resources
position Union Pacifi c to effi ciently handle volume increases as
freight demand recovers.
Technology enables the Company to continually focus on
improving all aspects of its operations. An example is the use of
distributed power locomotives (DPU), which increased from 26
percent of gross ton-miles (GTMs) in 2007 to 63 percent in 2009.
DPU implementation adds to the effi ciency of locomotive and
crew resources and saves fuel by increasing train length without
jeopardizing performance.
200920082007
27.3
23.5
21.8

7
The Year in Review - Operations
The Company’s Unifi ed Plan creates operational effi ciencies by
generating capacity through better utilization of resources. In
2009, GTMs declined 17 percent versus 2008. However, through
Unifi ed Plan initiatives (such as managing train length), train
starts decreased 20 percent. UP closed or signifi cantly reduced
operations at 30 of its 114 principal rail yards, routing traffi c to
larger, more effi cient yards.
Freight car utilization improved during the year, with cycle time
decreasing to an all-time best of 8.6 days. Faster asset turns
enable the Railroad to transport more freight with fewer assets.
UP is also implementing better locomotive assignment practices
to take advantage of technology and optimize train movements
across the system. These effi ciency improvements all contribute
to a fl uid network, positioning Union Pacifi c to realize strong
productivity gains and produce upside leverage as volumes return.
Distributed Power Percent(% of GTMs moved by DPU)
200920082007
63%
35%26%
Train Operation Illustration
Conventional Train Operations
Distributed Power Train Operations
Coal Train with DPU
88
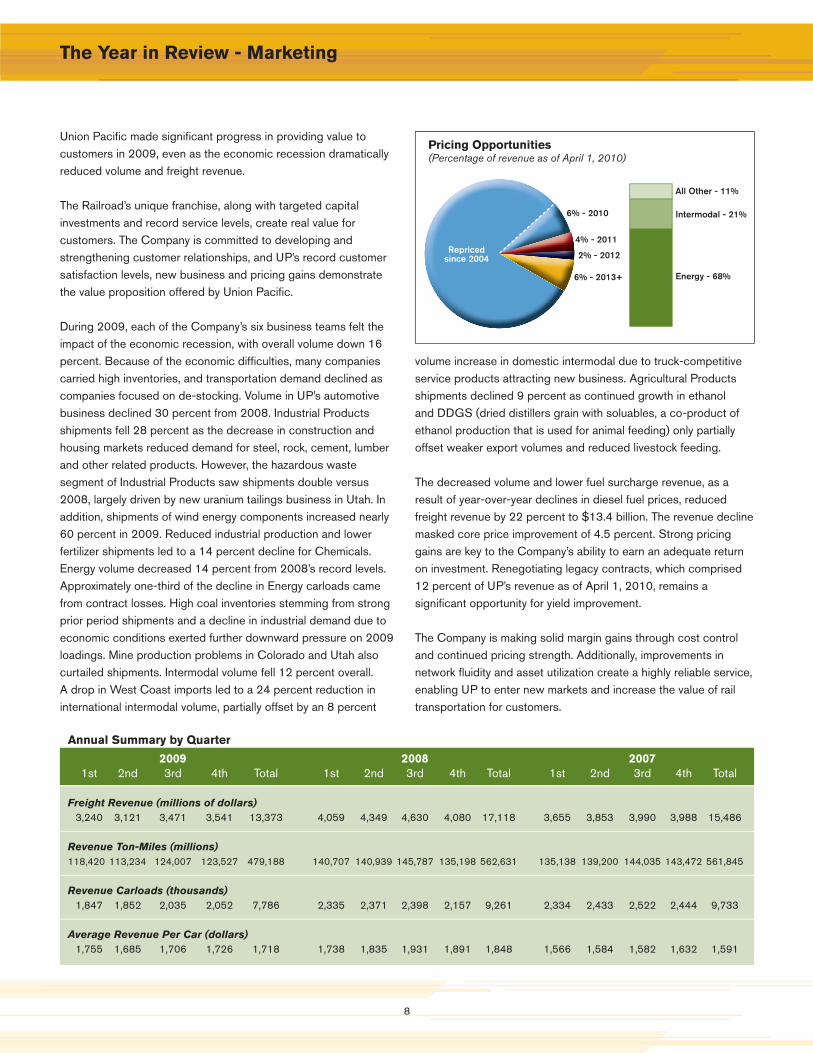
volume increase in domestic intermodal due to truck-competitive service products attracting new business. Agricultural Products shipments declined 9 percent as continued growth in ethanol and DDGS (dried distillers grain with soluables, a co-product of ethanol production that is used for animal feeding) only partially offset weaker export volumes and reduced livestock feeding.
The decreased volume and lower fuel surcharge revenue, as a result of year-over-year declines in diesel fuel prices, reduced freight revenue by 22 percent to $13.4 billion. The revenue decline masked core price improvement of 4.5 percent. Strong pricing gains are key to the Company’s ability to earn an adequate return on investment. Renegotiating legacy contracts, which comprised 12 percent of UP’s revenue as of April 1, 2010, remains a signifi cant opportunity for yield improvement.
The Company is making solid margin gains through cost control and continued pricing strength. Additionally, improvements in network fl uidity and asset utilization create a highly reliable service, enabling UP to enter new markets and increase the value of rail transportation for customers.
Union Pacifi c made signifi cant progress in providing value to customers in 2009, even as the economic recession dramatically reduced volume and freight revenue. The Railroad’s unique franchise, along with targeted capital investments and record service levels, create real value for customers. The Company is committed to developing and strengthening customer relationships, and UP’s record customer satisfaction levels, new business and pricing gains demonstrate the value proposition offered by Union Pacifi c. During 2009, each of the Company’s six business teams felt the impact of the economic recession, with overall volume down 16 percent. Because of the economic diffi culties, many companies carried high inventories, and transportation demand declined as companies focused on de-stocking. Volume in UP’s automotive business declined 30 percent from 2008. Industrial Products shipments fell 28 percent as the decrease in construction and housing markets reduced demand for steel, rock, cement, lumber and other related products. However, the hazardous waste segment of Industrial Products saw shipments double versus 2008, largely driven by new uranium tailings business in Utah. In addition, shipments of wind energy components increased nearly 60 percent in 2009. Reduced industrial production and lower fertilizer shipments led to a 14 percent decline for Chemicals. Energy volume decreased 14 percent from 2008’s record levels. Approximately one-third of the decline in Energy carloads came from contract losses. High coal inventories stemming from strong prior period shipments and a decline in industrial demand due to economic conditions exerted further downward pressure on 2009 loadings. Mine production problems in Colorado and Utah also curtailed shipments. Intermodal volume fell 12 percent overall. A drop in West Coast imports led to a 24 percent reduction in international intermodal volume, partially offset by an 8 percent
The Year in Review - Marketing
Annual Summary by Quarter
2009 2008 2007 1st 2nd 3rd 4th Total 1st 2nd 3rd 4th Total 1st 2nd 3rd 4th Total
Freight Revenue (millions of dollars) 3,240 3,121 3,471 3,541 13,373 4,059 4,349 4,630 4,080 17,118 3,655 3,853 3,990 3,988 15,486
Revenue Ton-Miles (millions) 118,420 113,234 124,007 123,527 479,188 140,707 140,939 145,787 135,198 562,631 135,138 139,200 144,035 143,472 561,845
Revenue Carloads (thousands) 1,847 1,852 2,035 2,052 7,786 2,335 2,371 2,398 2,157 9,261 2,334 2,433 2,522 2,444 9,733
Average Revenue Per Car (dollars) 1,755 1,685 1,706 1,726 1,718 1,738 1,835 1,931 1,891 1,848 1,566 1,584 1,582 1,632 1,591
Pricing Opportunities(Percentage of revenue as of April 1, 2010)
Repricedsince 2004
6% - 2013+
6% - 2010
2% - 2012
4% - 2011
Energy - 68%
Intermodal - 21%
All Other - 11%

9
Safety
Safety is a top priority for Union Pacifi c, as it affects employees,
customers, shareholders and the public. The Railroad strives
for ongoing improvement in this critical area through the use
of communication, engagement, technology, risk assessment,
process improvement, engineering and investment.
Safety continued to improve in all categories during 2009.
Employee injury incident rates dropped 12 percent versus 2008 to
the lowest level ever. In addition, an ongoing focus on derailment
prevention helped drive down the equipment incident rate 10
percent. UP utilizes state-of-the-art technology such as lasers and
ultrasound to identify rail imperfections, and monitors acoustic
vibration on wheels to forecast potential failures before they occur.
Also, track safety experts visually inspect track conditions across
the system.
Public safety measures improved as well, with the rate of grade
crossing incidents decreasing 11 percent versus 2008, to the
lowest number on record. The Railroad closed a total of 353 grade
crossings during the year to reduce exposure to incidents, and
continued installing video cameras in its road locomotives. Over
95 percent of road trains now have camera-equipped locomotives
in the lead position. These video cameras allow Union Pacifi c to
better analyze grade crossing conditions and incidents, increasing
safety for its employees and the public.
In an effort to increase public awareness about rail safety, UP
employees actively participate in Operation Lifesaver, a non-profi t
organization dedicated to educating the public about safety at
railroad crossings and around railroad property. In addition, UP
held 523 Crossing Accident Reduction Enforcement (CARE)
events across the country. During CARE events, law enforcement
offi cers and media ride trains to better understand the importance
of highway-rail crossing and pedestrian safety. Participants also
see fi rst-hand what train crew members experience on a daily
basis.
Safety and the Environment
EmployeePersonal Injury Incidents per 200,000 Man-hours
2006 20082007 2009*
-24%
2006 20082007 2009*
-26%
CustomerIncidents per Million Train Miles
2006 20082007 2009*
-26%
PublicCrossing Accidents per Million Train Miles
* Best ever safety performance
The ongoing implementation of Total Safety Culture (TSC) across
the Company further improves safety results and sustainability.
TSC is a peer-to-peer observation and feedback process,
empowering employees to support safe behavior and correct
at-risk behaviors among co-workers. This program continues to
expand across UP’s 21 service units.
10
Environment
Railroads are the most fuel-effi cient, environmentally friendly mode
of ground freight transportation. Freight trains are almost four
times more fuel-effi cient than trucks. In fact, railroad fuel effi ciency
is up 94 percent since 1980.
At Union Pacifi c, fuel effi ciency continues to improve as
technology and employee involvement combine with operational
enhancements to increase asset utilization and network fl uidity. In
2009, the Company reduced its fuel consumption rate 4 percent,
saving approximately 40 million gallons of fuel versus 2008.
The Company is constantly improving operating practices to
save fuel and reduce emissions. The implementation of fuel
conservation speeds, automatic locomotive shutdown technology
and distributed power all contribute to this effort. In addition,
the Railroad’s employee-driven Fuel Masters Unlimited program
rewards the fuel-saving efforts of locomotive engineers.
Union Pacifi c owns the cleanest locomotive fl eet in North America,
with three-quarters of its road units Environmental Protection
Agency (EPA) emission certifi ed. Over the past nine years, the
Company invested approximately $6 billion to purchase more than
Safety and the Environment
3,400 new EPA-compliant fuel effi cient road locomotives. UP
retired approximately 2,300 older units and rebuilt or overhauled
another 3,200 engines, further enhancing the fl eet’s emission
profi le. The Railroad’s locomotive fl eet also includes more than
180 ultra-low emitting locomotives (ULEL) like the Genset
switchers (which UP helped pioneer), giving it the largest ULEL
fl eet in the industry.
The focus on reducing emissions extends beyond the locomotive
fl eet. With new emission-reduction equipment, the Railroad’s entire
fl eet of mechanical refrigerated boxcars is compliant with California
Air Resources Board standards.
Beyond the traditional rail operations, UP is looking at other ways
to be a better environmental steward. Through the dedicated
involvement of its employees, UP recycled more than 1.1 million
pounds of electronic equipment and more than 3.5 million pounds
of batteries over the past three years.
Union Pacifi c is committed to protecting the environment now
and for future generations. Running a “green” operation demands
vigilance and forward thinking to safeguard the environment. Union
Pacifi c is up to this challenge.
VisionUnion Pacifi c will be recognized as being the
environmentally responsible transportation leader.

11
Investing in Our Future
Each year, Union Pacifi c spends a signifi cant amount of capital
across its vast network to enhance operational safety, improve
network effi ciency and expand capacity to meet the transportation
needs of current and future customers. Capital investments
include the replacement and improvement of track and facilities,
and the acquisition of new locomotives and freight cars as needed.
In 2009, UP’s capital investments totaled $2.5 billion, including
cash spending of $2.4 billion.
The Company’s capital can be broadly classifi ed into two
categories: replacement, and growth and productivity.
Replacement capital is spending required to improve safety
or replace current infrastructure, such as track, facilities and
equipment. Growth and productivity capital supports both volume
expansion and effi ciency for the Company and its customers.
Equipment acquisitions can be included within both of these
capital categories, as new equipment can add capacity to our
network or replace older, less effi cient assets.
Replacement Capital
The Company spent approximately $1.7 billion replacing track and
facilities under its engineering replacement program in 2009. This
program included the installation of approximately 4.7 million ties
and 841 track miles of rail to help provide safe and fl uid operations
and increase network effi ciency. UP also acquired 125 high-
horsepower locomotives, which represented the fi nal tranche of a
three-year purchase contract. In total, approximately $2.0 billion
was spent on replacement capital during the year.
In 2010, Union Pacifi c expects to spend around $1.6 billion
in engineering replacement, installing roughly 4.2 million ties
and approximately 800 track miles of rail. Total replacement
capital is estimated at $1.8 billion, including spending related to
locomotives and other equipment. No new locomotives will be
purchased in 2010.
Investing in Our Future
2009 Capital Investment*(In Millions)
Capacity/Commercial
Facilities$355
Engineering Replacement
$1,655
Technology& Other
$102Locomotives& Equipment
$372Replacement
Growth and Productivity
Growth and Productivity Capital
The Company spent approximately $500 million in 2009 on
growth and productivity initiatives. This amount included
construction of a new intermodal facility in Joliet, IL. The facility will
help support expected, long-term intermodal growth. Spending
on technology totaled approximately $100 million, consisting of
upgrades to telecommunications and mainframe software systems
and a new crew dispatching system.
In 2010, Union Pacifi c expects to spend approximately $500
million in capital for growth and productivity. Included in this
amount is nearly $150 million for the Joliet intermodal facility,
with completion of the initial phase scheduled for August 2010.
Spending on a variety of network effi ciency projects (such as
mainline double-tracking and siding extensions) throughout the
system will improve fl uidity and enhance service to our customers.
Additionally, in response to a legislative mandate to implement
Positive Train Control (PTC) by the end of 2015, approximately
$200 million is allocated for 2010, primarily for signal-related
work.
* Includes cash capital and leases
12
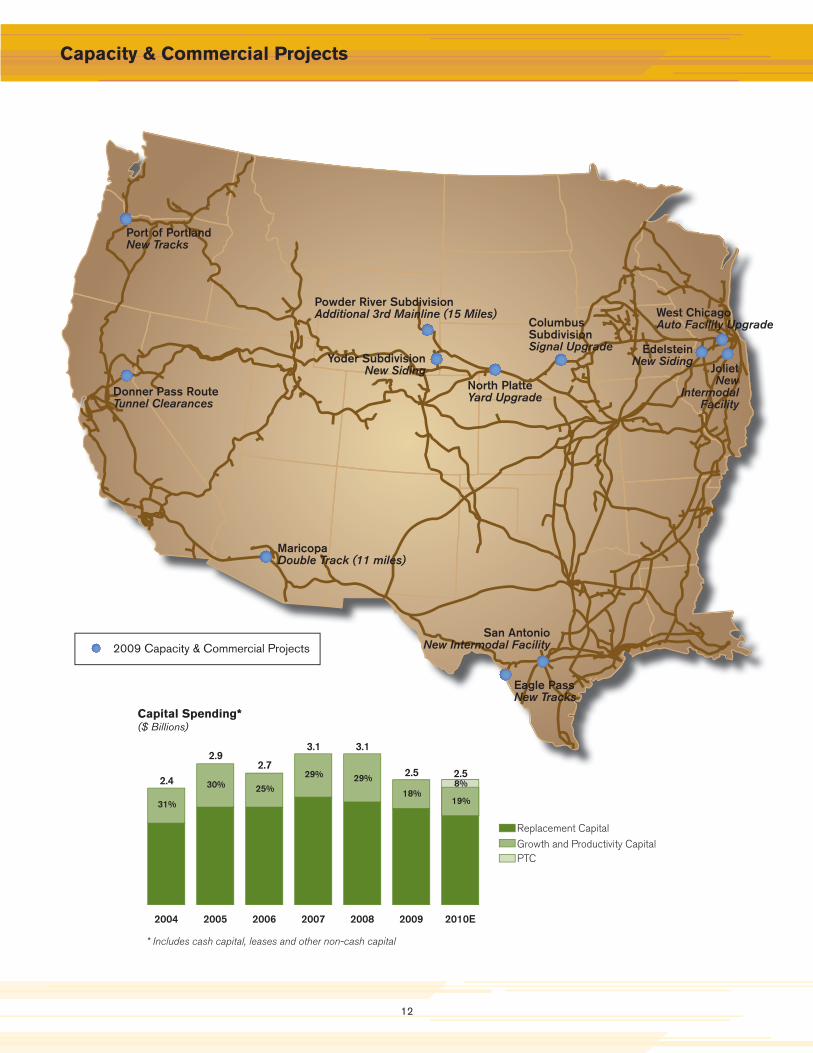
Port of PortlandNew Tracks
Donner Pass RouteTunnel Clearances
West ChicagoAuto Facility Upgrade
San AntonioNew Intermodal Facility
JolietNew
Intermodal Facility
North PlatteYard Upgrade
2009 Capacity & Commercial Projects
Capacity & Commercial Projects
3.1 3.1
Capital Spending*($ Billions)
2004
2.4
2005
2.9
2006
2.7
2007 2008 2009
2.5
2010E
2.5
Replacement Capital
Growth and Productivity Capital
31%
30% 25%
29% 29%
18%
PTC
19%
8%
MaricopaDouble Track (11 miles)
Yoder SubdivisionNew Siding
ColumbusSubdivisionSignal Upgrade
Eagle PassNew Tracks
EdelsteinNew Siding
Powder River SubdivisionAdditional 3rd Mainline (15 Miles)
* Includes cash capital, leases and other non-cash capital

13
Track and Terminal Density
2009 Terminal Volumes
Major Classifi cation Yards Average Daily Car Volumes
North Platte, Nebraska 2,100
North Little Rock, Arkansas 1,300
Englewood (Houston), Texas 1,300
Proviso (Chicago), Illinois 1,200
Fort Worth, Texas 1,100
Roseville, California 1,100
Livonia, Louisiana 1,100
West Colton, California 1,000
Pine Bluff, Arkansas 1,000
Neff (Kansas City), Missouri 900
Major Intermodal Terminals Annual Lifts
ICTF (Los Angeles), California 453,000
East Los Angeles, California 372,000
Global I (Chicago), Illinois 306,000
Global II (Chicago), Illinois 284,000
Marion (Memphis), Tennessee 265,000
City of Industry (Los Angeles), California 254,000
Lathrop (Stockton), California 250,000
Dallas, Texas 233,000
Oakland, California 202,000
Yard Center (Chicago), Illinois 199,000
Lane density based on carloadingsLine thickness depicts traffi c density
14
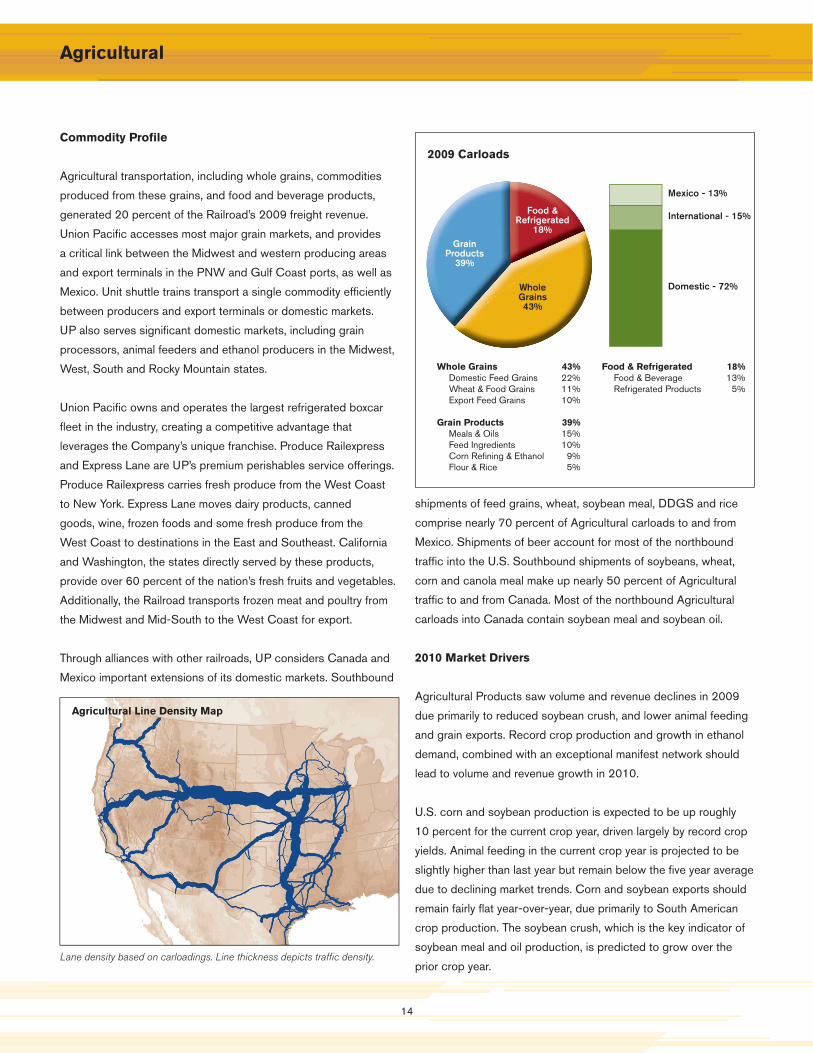
GrainProducts
39%
Food &Refrigerated
18%
WholeGrains43%
Domestic - 72%
Mexico - 13%
International - 15%
Commodity Profi le
Agricultural transportation, including whole grains, commodities
produced from these grains, and food and beverage products,
generated 20 percent of the Railroad’s 2009 freight revenue.
Union Pacifi c accesses most major grain markets, and provides
a critical link between the Midwest and western producing areas
and export terminals in the PNW and Gulf Coast ports, as well as
Mexico. Unit shuttle trains transport a single commodity effi ciently
between producers and export terminals or domestic markets.
UP also serves signifi cant domestic markets, including grain
processors, animal feeders and ethanol producers in the Midwest,
West, South and Rocky Mountain states.
Union Pacifi c owns and operates the largest refrigerated boxcar
fl eet in the industry, creating a competitive advantage that
leverages the Company’s unique franchise. Produce Railexpress
and Express Lane are UP’s premium perishables service offerings.
Produce Railexpress carries fresh produce from the West Coast
to New York. Express Lane moves dairy products, canned
goods, wine, frozen foods and some fresh produce from the
West Coast to destinations in the East and Southeast. California
and Washington, the states directly served by these products,
provide over 60 percent of the nation’s fresh fruits and vegetables.
Additionally, the Railroad transports frozen meat and poultry from
the Midwest and Mid-South to the West Coast for export.
Through alliances with other railroads, UP considers Canada and
Mexico important extensions of its domestic markets. Southbound
Agricultural
shipments of feed grains, wheat, soybean meal, DDGS and rice
comprise nearly 70 percent of Agricultural carloads to and from
Mexico. Shipments of beer account for most of the northbound
traffi c into the U.S. Southbound shipments of soybeans, wheat,
corn and canola meal make up nearly 50 percent of Agricultural
traffi c to and from Canada. Most of the northbound Agricultural
carloads into Canada contain soybean meal and soybean oil.
2010 Market Drivers
Agricultural Products saw volume and revenue declines in 2009
due primarily to reduced soybean crush, and lower animal feeding
and grain exports. Record crop production and growth in ethanol
demand, combined with an exceptional manifest network should
lead to volume and revenue growth in 2010.
U.S. corn and soybean production is expected to be up roughly
10 percent for the current crop year, driven largely by record crop
yields. Animal feeding in the current crop year is projected to be
slightly higher than last year but remain below the fi ve year average
due to declining market trends. Corn and soybean exports should
remain fairly fl at year-over-year, due primarily to South American
crop production. The soybean crush, which is the key indicator of
soybean meal and oil production, is predicted to grow over the
prior crop year.
Agricultural Line Density Map
Lane density based on carloadings. Line thickness depicts traffi c density.
2009 Carloads
Whole Grains 43% Domestic Feed Grains 22% Wheat & Food Grains 11% Export Feed Grains 10%
Grain Products 39% Meals & Oils 15% Feed Ingredients 10% Corn Refi ning & Ethanol 9% Flour & Rice 5%
Food & Refrigerated 18% Food & Beverage 13% Refrigerated Products 5%

15
Agricultural
Ethanol is expected to deliver continued volume growth in 2010.
Production will grow from 10.5 to 12 billion gallons in 2010, as
mandated by The Energy Independence and Security Act of 2007
(EISA). California and Texas are viewed as the largest growth
areas for this product. California recently increased its ethanol
blend from 5.7 percent to 10 percent. Growth in Central Texas is
also forecast to continue as a result of ethanol blending conversion
in late 2009. New unit train terminals in both Central Texas and
California will aid distribution to these areas. Corn shipments
to forward ethanol plants (production facilities located closer to
ethanol consumptive areas) are also forecast to grow in 2010, to
help producers meet higher demand.
Union Pacifi c leveraged the truck-like service offered by the
Produce Railexpress, moving nearly 5,500 refrigerated boxcars
of produce from the West Coast to the East Coast in 2009. This
volume represented a 65 percent increase versus 2008 with
added service out of California. This business is expected to grow
in 2010 as faster and more reliable rail transit times enable further
truck market penetration.
More than half of the business in the Agricultural Products group
moves via Union Pacifi c’s manifest network. The value-added
service provided to customers through this network allows the
Railroad to effectively compete for food and grain products
business. In addition, adding cars to existing manifest trains as
volumes increase generates strong operating leverage.
Paul Hammes,VP & GM Agricultural
How did your team work with customers in the recessionary freight environment to reduce costs while enhancing service?
Through Produce Railexpress and Express Lane, we provided truck-competitive service for perishable products at lower costs, which reduced our customer’s supply chain costs. Additionally, this service removes less fuel effi cient trucks from the road, benefi tting the environment and reducing congestion on U.S. roadways.
We worked jointly with our customers and the UP operating team to modify the route taken by loaded wheat unit trains out of Kansas. The new route increased velocity and reduced unit train cycle times, allowing Union Pacifi c and our customers to remain competitive in the Gulf export market.
Union Pacifi c also engaged our customers in developing unit train strategies for soybean meal, ethanol and DDGS. Transportation in unit trains offers cost advantages to both Union Pacifi c and our customers. Competitive rates provide an incentive for customers to invest in unit train facilities on Union Pacifi c’s network.
What opportunities do you see for your business group over the next couple of years?
The forecasted increase in planted acres, along with improving trends in corn and bean yields, are expected to create more domestic, export and processing opportunities for U.S. agriculture.
Ethanol should continue to offer growth opportunities. Annual corn-based ethanol production is mandated to grow from 12 to 15 billion gallons by 2015. In addition to corn-based ethanol, cellulosic ethanol (derived from crop residue and other plant waste) is expected to grow steadily over the next 10 years. The EPA revised the Renewable Fuel Standard program (RFS) as required by the EISA, mandating that cellulosic ethanol production increase from 100 million gallons per year in 2010 to 16 billion gallons per year in 2022. As this technology emerges, production should develop near existing ethanol facilities. Union Pacifi c’s network is positioned to take full advantage of this opportunity.
Increased corn-based ethanol production also brings additional demand into the market. As supply continues to grow, export opportunities are beginning to emerge. Growth into export markets is expected to be greater than domestic markets.
Union Pacifi c serves a large portion of the food producing states along the West Coast, and with these products moving to the large population centers in the East and Midwest, we are in an ideal situation to offer a long haul, low cost rail solution.

166
Ethanol Traffi c Flows
Annual Summary by Quarter - Agricultural
2009 2008 2007
1st 2nd 3rd 4th Total 1st 2nd 3rd 4th Total 1st 2nd 3rd 4th Total
Freight Revenue (millions of dollars)
661 618 649 738 2,666 756 778 848 792 3,174 611 605 670 719 2,605
Revenue Ton-Miles (millions)
20,067 18,854 19,563 22,723 81,207 22,485 22,111 22,431 21,560 88,588 19,249 18,935 20,613 21,735 80,532
Revenue Carloads (thousands)
212 203 215 235 865 240 236 243 228 947 219 212 232 239 902
Average Revenue Per Car (dollars)
3,116 3,045 3,026 3,129 3,080 3,151 3,301 3,486 3,472 3,352 2,793 2,855 2,888 3,006 2,888
EthanolDDGSForward CornReceiving MarketsMajor Ethanol Producing Region
EthaDDG
RecM j
ForwRecForw

17
Automotive Materials
44%
AssembledAutos56%
Domestic - 39%
Mexico - 48%
International - 13%
Commodity Profi le
Shipments of fi nished vehicles and automotive parts and materials
generated 6 percent of Union Pacifi c’s 2009 freight revenue.
Finished vehicles accounted for 76 percent of this revenue, with
the balance coming from the movement of automotive parts and
materials.
Union Pacifi c’s unique franchise provides excellent accessibility
to all major markets west of the Mississippi River for delivery of
fi nished vehicles to the manufacturers’ dealer networks. UP is the
largest automotive carrier in the U.S., directly serving six vehicle
assembly plants and providing service to 38 automotive distribution
facilities directly or through short line railroads. Additionally, the
Railroad distributes imported vehicles from six West Coast ports
and the Port of Houston. Union Pacifi c also receives and delivers
a signifi cant number of vehicles and automotive parts through
interchange with railroads in Mexico, Canada and the U.S.
New light vehicle sales in the U.S. declined to 10.3 million vehicles
in 2009, down 22 percent from 2008 levels. North American light
vehicle production was down 34 percent for the year, to 5.6 million
units. UP’s revenue from fi nished vehicle shipments declined 38
percent, as carloads were off nearly 35 percent in 2009. Revenue
from auto parts and materials decreased 33 percent, with volumes
down 24 percent from 2008. The declines in freight revenue due
to lower volume and reduced fuel surcharge revenue were only
partially offset by pricing improvements.
Automotive
The economic recession led to lower vehicle sales and reduced
vehicle production. Production levels were also affected by the
bankruptcy of two major domestic automotive manufacturers in the
second quarter of 2009. The 2009 federal Car Allowance Rebate
System (the “cash for clunkers” program) helped stimulate vehicle
sales and shipments in the third quarter, although the benefi ts of
this program could not completely offset the impact of production
cuts, bankruptcies, and weak demand overall.
Union Pacifi c handled more than 75 percent of the automotive
carload business in the western U.S. in each of the last three
years. Changing dynamics among manufacturers in the industry
are expected to affect fi nished vehicle shipments as the
manufacturers work to keep or gain market share. The Detroit
Big Three incurred a market share loss during 2009, collectively
holding about 45 percent of the new light vehicle market
share in the U.S., down from 48 percent in 2008. Non-Detroit
manufacturers have domestic manufacturing capabilities and
import a signifi cant number of vehicles via West Coast ports.
Union Pacifi c faces competition from trucks for the fi nished
vehicles imported through these ports and destined for western
automotive dealerships.
Approximately 48 percent of UP’s automotive shipments move
either to or from Mexico, and include fi nished vehicles as well as
parts and materials moving in intermodal or boxcar service. Union
Pacifi c handles more than 90 percent of all automotive rail traffi c
into and out of Mexico. Consistent with the overall automotive
Automotive Line Density Map
Lane density based on carloadings. Line thickness depicts traffi c density.
2009 Carloads

18
Julie Krehbiel,VP & GM Automotive
How did your team work with customers in the recessionary freight environment to reduce costs while enhancing service?
In a weak economic environment, it is very important to strengthen the automotive service network by improving transit times, ensuring consistency, and incorporating transportation effi ciencies into the delivered product. In 2009, we changed gateways and shifted some service to more strategically located auto distribution facilities. In addition, we incorporated network modeling software to increase effi ciency while balancing velocity and density. We also leveraged our intermodal network to maintain customer service despite lower volumes, and achieved record service levels in several lanes.
We looked for innovative ways to speed the product to market while further penetrating the truck market. Co-load capabilities were expanded to transport vehicles from multiple shippers on a single railcar and also to combine new and used vehicles. These approaches reduce vehicle dwell time at the load and unload facilities and give the customer more fl exibility.
What is the biggest opportunity in your business group over the next 2 to 3 years?
Union Pacifi c’s opportunities consist primarily in growing the existing traffi c base by leveraging our 38 automotive distribution facilities that are located in some of the fastest growing U.S. states. Opportunities also exist to capitalize on UP’s strong interline carrier alliances to convert parts shipments from over-the-road to intermodal and boxcar rail service. Additionally, in 2009 we strategically placed additional sales resources to focus on non-traditional markets such as service parts, mini-cars and European manufacturers. Further, the co-load capability launched in 2008 is expected to expand our reach into the used car market through collaboration with SCN. Longer term, we continue to see signifi cant opportunities from new vehicle production in China and India.
Automotive
industry downturn, Mexico parts and materials shipments
decreased 22 percent while fi nished vehicle moves declined 27
percent in 2009.
UP’s subsidiary Insight Network Logistics launched ShipCarsNow
(SCN) in 2006 to offer a suite of transportation services for the
used car market. SCN provides online buy-and-sell opportunities
for fl eet managers and auto remarketers, and leverages UP’s
network by integrating rail and truck transportation. SCN opened
an e-store in August 2009 and will incorporate enhanced
functionalities over the next couple of years to enable further
penetration into the used car market. SCN expects to manage
approximately 90,000 vehicles in 2010, more than double the
2009 volume.
2010 Market Drivers
Improving economic conditions are expected to drive a 15 percent
increase in U.S. light vehicle sales and a 27 percent increase
in U.S. light vehicle production during 2010. Traffi c to and
from Mexico is also expected to improve as the global economy
recovers. Union Pacifi c transports fi nished vehicles primarily
to destination locations (rather than from origin facilities) and
has a broad customer base that includes import and transplant
manufacturers. This diverse business mix helps the Company
mitigate the effects of production and consumer preference
changes in the automotive industry.
Union Pacifi c continues to expand import auto business destined
for West Coast ports. The Railroad is engaged in the development
of distribution plans for imports from China and India. In March
2009, the Company established a sales offi ce in Shanghai, China
to further cultivate relationships with Chinese automotive original
equipment manufacturers (OEMs) and suppliers in anticipation of
increasing import parts and vehicle volume.
Union Pacifi c’s strategic infrastructure improvements across its
system enhance current operations and ensure the Company
effi ciently handles profi table traffi c as volumes return. Ongoing
improvements at Benicia, CA to support automotive business
position UP for growth opportunities and create operational
effi ciencies. In addition, the continued implementation of UP’s
vehicle inventory dwell system helps to increase inventory
accuracy and improve asset utilization.
Additional growth opportunities exist with the Railroad
subsidiaries: Insight Network Logistics, Insight Network
Transportation (SCN) and Union Pacifi c Distribution Services
(UPDS). These companies offer supply chain logistic services
for major automotive manufacturers. SCN is making inroads into
the used car remarketing area by providing management and
coordination services for vehicle auction companies and rental car
fi rms. Marketed jointly with UP’s rail services, these subsidiaries
can assist manufacturers in meeting customers’ changing
inventory needs and provide continued growth opportunities.
Extending UP’s reach beyond the Railroad’s physical boundaries
to customers that are not rail-served promotes vertical integration
and new market development.

199
Automotive Facilities and Assembly Centers
Annual Summary by Quarter - Automotive
2009 2008 2007
1st 2nd 3rd 4th Total 1st 2nd 3rd 4th Total 1st 2nd 3rd 4th Total
Freight Revenue (millions of dollars)
162 163 227 302 854 363 352 324 305 1,344 354 387 348 369 1,458
Revenue Ton-Miles (millions)
1,952 1,995 2,619 3,174 9,740 3,890 3,646 3,278 3,169 13,983 4,330 4,685 4,250 4,217 17,482
Revenue Carloads (thousands)
97 93 124 151 465 188 176 153 150 667 201 221 201 203 826
Average Revenue Per Car (dollars)
1,675 1,755 1,827 2,004 1,838 1,930 2,005 2,114 2,040 2,017 1,759 1,754 1,729 1,823 1,766
West ChicagoChicago Heights
Centreville
Gavin
Reisor
Port Allen
Westfi eld
Mesquite
Kirby
Santa Rosa
Phoenix
Mira Loma
Valley
Roper
Silver Bow
Spokane
Kent
Barnes
BeniciaMilpitas
St. Paul
Council Bluffs
Rolla
Amarillo
Candleridge
Port of Houston
Midlothian
Muncie
Janesville
Belvidere
Tacoma
St. John’s
Port Hueneme
WilmingtonLong Beach
Brownsville
Laredo
El Paso
Eagle Pass
Nogales
Calexico
SanAntonio
Shreveport
Fairfax
Fremont
Distribution Centers, Union Pacifi c-Owned/LeasedDistribution Centers and/or Ports, Privately-OwnedAssembly CentersGateways to Mexico
Oklahoma City
Arlington

20
Domestic - 74%
Mexico - 5%
International - 21%
Plastics26%
Industrial Chemicals
25%Fertilizer
19%
Petroleum& Other
17%
Commodity Profi le
The transportation of chemicals generated 16 percent of Union
Pacifi c’s freight revenue in 2009. UP’s franchise serves the large
chemical megaplex along the Gulf Coast, and roughly two-thirds of
the Company’s chemical business originates, terminates or travels
through this area. The Railroad’s chemical franchise also accesses
chemical producers in the Rocky Mountains and on the West
Coast. The Company’s chemical shipments can be classifi ed into
three broad categories: Petrochemicals, Fertilizer and Soda Ash.
Petrochemicals includes industrial chemicals, plastics, petroleum
products and liquid petroleum gases, and constitutes 68 percent
of UP’s chemical business. These products move primarily to and
from the Gulf Coast region. Barges, pipelines, and to a lesser
extent trucks, provide transportation alternatives for some of these
commodities.
The industrial chemicals market consists of several dozen
segments of basic, intermediate and specialty chemicals produced
by, and shipped to, both large and small customers. Strong
demand from industrial manufacturers is key to this market
segment. Plastics shipments support many vital sectors of the
U.S. economy, including the automotive, housing, and durable and
disposable consumer goods markets. UP is an important link in
the plastics supply-chain through its ownership and operation of
storage-in-transit (SIT) facilities. Plastics customers utilize railroad
SIT yards for intermediate storage of plastic resins, and UP’s SIT
capacity exceeds that of any other railroad.
Chemicals
The economic recession reduced UP’s petrochemicals volume 11
percent year-over-year and contributed to a 14 percent decline in
revenue. Average revenue per car decreased 3 percent in 2009,
driven by product mix changes (including an increase in shipments
of short haul export plastics) and lower fuel surcharge revenue,
partially offset by price improvements. The recession affected
this group more signifi cantly during the fi rst half of 2009, as key
markets showed signs of stability in the second half of the year
against a lower 2008 hurricane-impacted comparison.
Fertilizer movements originate in the Gulf Coast region, the
western part of the U.S. and Canada. Shipments are bound for
major agricultural users in the Midwest, western U.S. and abroad.
Fertilizer accounted for 19 percent of the Railroad’s chemical
business in 2009. High inventories, delayed purchases and a late
harvest combined to reduce fertilizer shipments 22 percent. Price
improvements and a favorable change in business mix more than
offset lower fuel surcharge revenue, yielding a 7 percent increase
in average revenue per car.
Soda ash represented 13 percent of chemical business in 2009.
Shipments of this product originate in southwestern Wyoming
and California, destined for chemical and glass producing markets
in North America and abroad. UP directly serves the world’s
largest natural soda ash reserve and production region at Green
River, Wyoming. During 2009, soda ash revenue declined 19
percent driven by a 16 percent decrease in volume and lower fuel
surcharge revenue. Volume declined in all business segments,
Chemicals Line Density Map
Lane density based on carloadings. Line thickness depicts traffi c density.
2009 Carloads
SodaAsh13%
21
Diane Duren,VP & GM Chemicals
How did your team work with customers in the recessionary freight environment to reduce costs while enhancing service?
Throughout 2009, we focused on providing consistent, reliable service to our customers and adapting to a changing business environment. As volumes fl uctuated, we worked closely with our Operating department to evaluate potential service changes and communicate them to our customers prior to implementation. This effort led to a number of terminal consolidations, particularly in the Gulf Coast, enabling us to manage traffi c fl ows more effi ciently. Improvements in network velocity, train performance and resource availability demonstrated our ability to adjust the transportation plan and maintain consistent performance.
Improvements in network velocity, coupled with our intensifi ed effort to reduce car dwell time, reduced the fl eet requirements for many of our customers. We worked closely with them to identify opportunities to reduce the quantity of freight cars required to support their business. Smaller car fl eets not only lower customers’ operating costs, they also help maintain network fl uidity, allowing UP to provide a more reliable service product. Right-sizing equipment levels is clearly a win-win for UP and our customers.
What opportunities do you see for your business group over the next couple of years?
We expect North American chemical production to further rationalize and consolidate, particularly into the Gulf Coast region, and international import and export markets to continue developing over the next several years. Through investments in Union Pacifi c’s chemical franchise, the Company is positioned to capitalize on new business opportunities created by these changes.
Beyond investments, our service offerings address existing and emerging markets. Union Pacifi c can effi ciently handle our customers’ volumes as markets recover, as well as support their long term global competitiveness through supply chain effi ciencies.
Chemicals
both export and domestic. The U.S. recession negatively impacted
the glass industry, decreasing domestic demand, and the weak
world economy and increased competition from China reduced
export demand.
2010 Market Drivers
The ongoing North American and global economic diffi culties
continue to challenge the chemical industry in general, although
some areas show signs of recovery. It is anticipated that a
gradual economic recovery should generate increased demand
due to inventory replenishment and modest growth in industrial
production and fertilizer markets. Demand will likely be affected
by a continued focus on tighter inventories and cost management,
although some benefi t is expected from government stimulus
spending. The degree to which the housing, automotive and
consumer products segments of the U.S. economy recover
will impact the rebound of the plastics and industrial chemicals
markets. New sources of world polyethylene and polypropylene
production are anticipated to ramp up, which will likely challenge
year-over-year export demand growth. Shipments of domestic
soda ash are driven by demand in the construction and automotive
markets, and export soda ash demand is dependent upon the
global economy and rational global production.
Fertilizer demand is expected to increase in 2010, as projected
strong plantings and the need to replenish nutrients to support
crop yields should drive carload growth.
Annual Summary by Quarter - Chemicals
2009 2008 2007
1st 2nd 3rd 4th Total 1st 2nd 3rd 4th Total 1st 2nd 3rd 4th Total
Freight Revenue (millions of dollars)
513 499 551 539 2,102 603 654 659 578 2,494 544 574 586 583 2,287
Revenue Ton-Miles (millions)
11,999 11,481 12,544 12,031 48,055 13,939 14,559 13,668 12,641 54,807 14,044 14,406 14,107 13,964 56,521
Revenue Carloads (thousands)
180 188 202 191 761 225 241 224 195 885 224 239 238 227 928
Average Revenue Per Car (dollars)
2,843 2,659 2,730 2,815 2,761 2,676 2,714 2,951 2,957 2,818 2,430 2,395 2,469 2,564 2,464

22
Commodity Profi le
Coal and petroleum coke transportation accounted for 23 percent
of Union Pacifi c’s freight revenue in 2009, the largest share of
revenue among UP’s six business teams for the third consecutive
year. The Railroad’s franchise supports the transportation of coal
and coke to utilities, industrial facilities, interchange points and
water terminals. The water terminals support domestic shipments
to eastern utilities and industrial facilities via the Mississippi and
Ohio Rivers, as well as the Great Lakes. Union Pacifi c also utilizes
the river network to support European export coal moving to the
Gulf, while the West Coast ports facilitate export coal to Asia.
SPRB coal traffi c represents the largest segment of UP’s energy
business, comprising 74 percent of 2009 volume. Surface-mined
SPRB coal is attractive to utilities due to reliable production, low
mining costs, and low sulfur content relative to coal mined in other
parts of the U.S. The second largest source of UP coal loadings
is the Uinta Basin located in Colorado and Utah. This sub-surface
coal is relatively high in BTUs (British Thermal Unit) and has low
sulfur content. In 2009, coal from Colorado and Utah represented
14 percent of UP coal volume. The remaining volume consists
of coke shipments and coal traffi c originating from southern
Wyoming’s Hanna Basin and southern Illinois mines, as well as
coal forwarded to UP markets from other producing regions
and carriers. A signifi cant portion of the coal forwarded to UP
originates from the Powder River Basin (PRB).
Energy
Overall coal volume declined 14 percent in 2009 as the dramatic
drop in U.S. industrial production and low natural gas prices
decreased demand for coal-fi red electricity generation. As a result,
record high coal inventories accumulated at utility plants, further
reducing coal demand. SPRB shipments slipped 14 percent for
the year, including the loss of three accounts, which accounted for
nearly 30 percent of the overall decline.
During 2009, average train size out of the SPRB increased 1.3
percent to a record 15,687 tons per train. A record 132.3 cars
per train, coupled with a record 118.6 tons per car drove this
improvement. UP ran longer coal trains due to improved yard
operations in North Platte and expanded train handling facilities at
various customer locations.
Colorado and Utah shipments fell 25 percent versus 2008,
resulting from lower demand, coal quality issues, and mine
production problems such as high methane gas levels, signifi cant
geological shifts, and production delays caused by regulatory
safety concerns. Many of these same challenges occurred in
2008. In spite of these diffi culties, UP still achieved train size
productivity records with 11,094 tons per train, up 1 percent from
2008. A record 111.9 tons per car, offset by a slight reduction in
cars per train, drove this productivity improvement.
Petroleum coke, a by-product of the oil refi ning process, is a
source of high sulfur fuel for electricity generation and is used
by industrial customers in the production of aluminum, steel and
Energy Line Density Map
2009 Carloads
Lane density based on carloadings. Line thickness depicts traffi c density.
South - 39%
North - 27%
East - 19%
West - 10%Industrial - 5%
Colorado/Utah14%
Other12%
Southern Powder River
Basin74%
23
Doug Glass,VP & GM Energy
How did your team work with customers in the recessionary freight environment to reduce costs while enhancing service?
We emphasized productivity, train size, unloading and service. As a result, our velocity increased 28 percent over the past two years. Productivity, defi ned as tons per train, increased 2.4 percent for SPRB trains between 2007 and 2009. These performance improvements benefi t our customers through more consistent and expedited transit times and the potential opportunity to move more coal with fewer assets.
What opportunities do you see for your business group over the next couple of years?
The most signifi cant revenue opportunity for the Energy team is the ability to reprice legacy contracts expiring over the next couple of years at levels that support reinvestment in the Railroad’s energy business. Contracts on approximately 28 percent of the railroad’s coal business will expire by the end of 2012.
We are also developing new business. Five new coal plants served by UP will be completed before the end of 2012, representing more than 12 million tons of incremental annual coal volume. Additionally, a new coal-fi red plant is expected to break ground in Texas during the second half of this year, with completion scheduled for 2014. This plant will employ carbon capture and sequestration technology, which allows more than 90 percent of the CO2 to be captured and used in secondary oil recovery or eventually sequestered in safe, underground caverns. Union Pacifi c is also working with customers to haul chemicals used to make coal-fi red power plants even cleaner than those built years ago. Further, the Railroad may someday haul the CO2 outbound in specially designed unit trains for industrial use or safe storage in other parts of the country.
We will also continue to focus on our base business, as the economic recovery should yield greater demand for electricity generation and more demand for coal. Resources that are currently idled will be returned to the coal network at the appropriate pace to maintain fl uidity as volumes improve. The continuing decline of eastern coal sources in Central Appalachia likely will make western coal a more attractive fuel alternative.
Current global demand supports some level of western bituminous coal exports. While the greatest opportunity is in Asia, Europe could represent a smaller secondary outlet for western bituminous and SPRB coal. Although these opportunities are small compared to our domestic business, they represent a growth opportunity in a profi table niche market.
Energy
cement. In 2009, petroleum coke shipments decreased 17
percent versus 2008, driven by a decline in oil refi ning as well as
reduced aluminum, steel, and cement production. Petroleum coke
traffi c originates mainly on the Gulf Coast, although other key
areas include Oklahoma, Kansas, Wyoming and California. The
primary destination for petroleum coke is Texas, but shipments also
move to the Midwest, California and Louisiana.
Other energy business segments increased versus 2008, as
Hanna Basin volume grew 19 percent and southern Illinois
carloads increased 11 percent. The Hanna Basin improvement
related to utilities backfi lling lower than expected production from
Colorado and Utah mines. Southern Illinois benefi tted from eastern
coal customers shifting coal sources.
2010 Market Drivers
Overall coal volume is expected to grow in 2010 versus low
2009 levels, as industrial production slowly recovers and coal
inventory levels continue to decline. SPRB traffi c should increase,
as improving economic conditions drive up electricity demand.
Reduced production at one Colorado mine due to the relocation
of mining equipment to other coal deposits is expected to offset
slightly higher demand for Colorado and Utah coal. Export demand
also appears to be showing signs of life, with Japanese and
Korean thermal coal markets seeking alternatives to Australian and
South African sources. Other energy business segments should
benefi t from additional carloads of eastern coal through Chicago
to the Midwest and a projected year-over-year increase in coke
shipments.

24
UP Coal Destination Locations
Annual Summary by Quarter - Energy
2009 2008 2007
1st 2nd 3rd 4th Total 1st 2nd 3rd 4th Total 1st 2nd 3rd 4th Total
Freight Revenue (millions of dollars)
807 715 831 765 3,118 857 919 1,051 983 3,810 731 761 824 818 3,134
Revenue Ton-Miles (millions)
56,003 50,740 57,391 54,093 218,227 63,334 61,748 67,887 65,393 258,362 60,005 60,657 65,133 65,613 251,408
Revenue Carloads (thousands)
521 470 531 499 2,021 582 561 615 590 2,348 551 551 600 597 2,299
Average Revenue Per Car (dollars)
1,550 1,520 1,564 1,536 1,543 1,473 1,639 1,709 1,664 1,622 1,326 1,381 1,374 1,368 1,363
PRB Coal Utility PlantCO/UT Coal Utility PlantPRB & CO/UT Utility PlantWater PortPlants Under Construction • 12+ million annual tons • Completed by end of 2012Coal Deposits
25
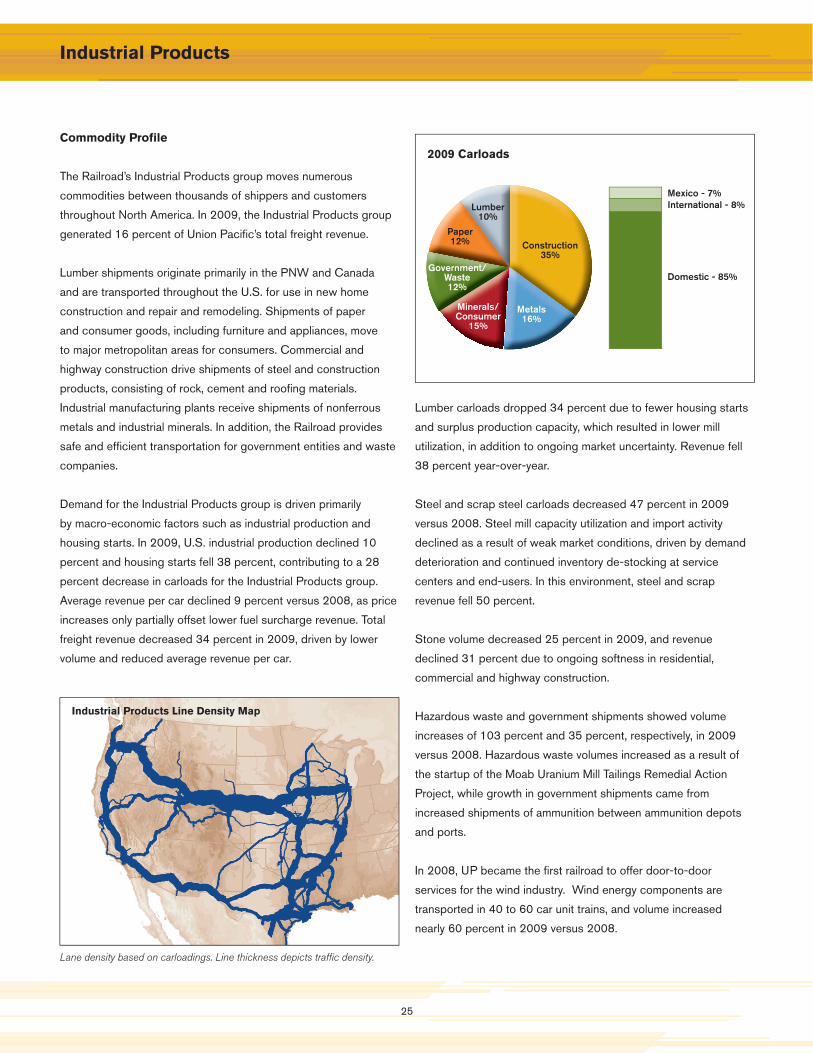
Domestic - 85%
Mexico - 7%International - 8%
Construction35%
Metals16%
Minerals/Consumer
15%
Lumber10%
Paper12%
Government/Waste12%
Commodity Profi le
The Railroad’s Industrial Products group moves numerous
commodities between thousands of shippers and customers
throughout North America. In 2009, the Industrial Products group
generated 16 percent of Union Pacifi c’s total freight revenue.
Lumber shipments originate primarily in the PNW and Canada
and are transported throughout the U.S. for use in new home
construction and repair and remodeling. Shipments of paper
and consumer goods, including furniture and appliances, move
to major metropolitan areas for consumers. Commercial and
highway construction drive shipments of steel and construction
products, consisting of rock, cement and roofi ng materials.
Industrial manufacturing plants receive shipments of nonferrous
metals and industrial minerals. In addition, the Railroad provides
safe and effi cient transportation for government entities and waste
companies.
Demand for the Industrial Products group is driven primarily
by macro-economic factors such as industrial production and
housing starts. In 2009, U.S. industrial production declined 10
percent and housing starts fell 38 percent, contributing to a 28
percent decrease in carloads for the Industrial Products group.
Average revenue per car declined 9 percent versus 2008, as price
increases only partially offset lower fuel surcharge revenue. Total
freight revenue decreased 34 percent in 2009, driven by lower
volume and reduced average revenue per car.
Industrial Products
Lumber carloads dropped 34 percent due to fewer housing starts
and surplus production capacity, which resulted in lower mill
utilization, in addition to ongoing market uncertainty. Revenue fell
38 percent year-over-year.
Steel and scrap steel carloads decreased 47 percent in 2009
versus 2008. Steel mill capacity utilization and import activity
declined as a result of weak market conditions, driven by demand
deterioration and continued inventory de-stocking at service
centers and end-users. In this environment, steel and scrap
revenue fell 50 percent.
Stone volume decreased 25 percent in 2009, and revenue
declined 31 percent due to ongoing softness in residential,
commercial and highway construction.
Hazardous waste and government shipments showed volume
increases of 103 percent and 35 percent, respectively, in 2009
versus 2008. Hazardous waste volumes increased as a result of
the startup of the Moab Uranium Mill Tailings Remedial Action
Project, while growth in government shipments came from
increased shipments of ammunition between ammunition depots
and ports.
In 2008, UP became the fi rst railroad to offer door-to-door
services for the wind industry. Wind energy components are
transported in 40 to 60 car unit trains, and volume increased
nearly 60 percent in 2009 versus 2008.
Industrial Products Line Density Map
Lane density based on carloadings. Line thickness depicts traffi c density.
2009 Carloads

266
Eric Butler,VP & GM Industrial Products
How did your team work with customers in the recessionary freight environment to reduce costs while enhancing service?
Frequent and open communication was the key. By staying engaged with customers and understanding their transportation needs, we met their needs while redesigning our local transportation plans to match volumes. Network velocity coupled with service reliability enabled customers to match day of week service for departures and arrivals. Cycle times improved as we coordinated with customers to load and unload in a timely manner.
We also successfully staged empty equipment at customer facilities to capture spot business that otherwise would move via truck due to short lead time requirements at destination. And fi nally, with the cooperation of premium operations, service units, and network planning, we successfully designed competitive transportation solutions to further capture truck traffi c.
What opportunities do you see for your business group over the next couple of years?
As the economy recovers, we expect Industrial Products volumes to show improvement from the historically low 2009 volume levels. UP’s strong customer service and the favorable economics of rail are also expected to generate growth opportunities in new and existing markets.
Industrial Products
2010 Market Drivers
A modest increase in housing and construction activity in 2010
should generate some growth for lumber, rock, cement, and steel
shipments. Little incremental business resulted from government
stimulus spending in 2009, although spending still has the
potential to impact carload volumes in 2010.
The short haul movement of uranium tailings for the Department
of Energy under the Moab Uranium Mill Tailings Remedial
Action Project contributed to the year-over-year volume gains in
hazardous waste shipments during 2009. It is anticipated that this
project will drive growth again this year and is expected to take
several years to complete.
Union Pacifi c transports materials used in oil and natural gas
exploration, such as drill pipe, tubings and casings for drill rigs.
UP also ships frac sand, barites and other drilling-related granular
products. Growth opportunities exist in these areas in 2010 with
greater economic activity and higher fuel prices.
Another opportunity for growth is the shipment of wind energy
components, expected to increase another 60 percent in 2010
versus 2009.
Annual Summary by Quarter - Industrial Products
2009 2008 2007
1st 2nd 3rd 4th Total 1st 2nd 3rd 4th Total 1st 2nd 3rd 4th Total
Freight Revenue (millions of dollars)
546 531 557 513 2,147 773 877 906 717 3,273 741 805 789 742 3,077
Revenue Ton-Miles (millions)
13,123 12,842 13,479 12,429 51,873 17,507 19,138 18,648 15,421 70,714 18,516 19,974 18,908 17,711 75,109
Revenue Carloads (thousands)
222 229 235 213 899 304 346 329 270 1,249 318 349 339 319 1,325
Average Revenue Per Car (dollars)
2,459 2,319 2,367 2,412 2,388 2,540 2,537 2,747 2,662 2,620 2,331 2,308 2,327 2,324 2,322

27
Commodity Profi le
UP’s Intermodal business, which includes international and
domestic shipments, generated 19 percent of freight revenue in
2009. International business consists of imported and exported
container traffi c that mainly passes through West Coast ports
served by UP’s extensive terminal network. Domestic business
includes container and trailer traffi c picked up and delivered within
North America for intermodal marketing companies (primarily
shipper agents and logistics companies), as well as truckload
carriers. Less-than-truckload and package carriers with time-
sensitive business requirements are also an important part of
domestic shipments.
International import and export traffi c moves in 20, 40 or 45 foot
shipping containers through ports on the West Coast. The majority
of domestic shipments move in 48 or 53 foot containers or trailers
to and from points within the U.S., Canada and Mexico.
Union Pacifi c’s key east/west intermodal lanes run between the
West Coast and Chicago, Texas, and interchange connections to
the eastern U.S. The Company’s key north/south intermodal lanes
operate between Los Angeles and the Pacifi c Northwest, as well
as Chicago and the upper Midwest and points south in Texas and
Mexico. UP accesses all six Mexican gateways and serves most of
the major metropolitan areas in the western two-thirds of the
U.S. Nearly all routes are competitive with other railroads and are
comparable to shipping distances on the highway network.
Intermodal
Total Intermodal volumes declined 12 percent year-over-year due
to the economic recession and its impact on global shipping.
The weak volumes, combined with lower fuel surcharge revenue,
drove total revenue down 18 percent. International intermodal
revenue fell 27 percent on 24 percent less volume and lower
fuel surcharge revenue. Domestic intermodal revenue declined
5 percent, as an 8 percent increase in volume due to highway
conversions and the shift of a major rail contract was more than
offset by lower fuel surcharge revenue.
Union Pacifi c continues to offer truck-competitive, priority rail
service in key lanes to encourage the conversion of highway
business to intermodal. Shippers increasingly look to rail as a
competitive alternative to trucks.
2010 Market Drivers
The magnitude of economic growth in 2010 remains uncertain.
Key indicators forecast a climb above the lows of 2009 but below
2008 levels. The Railroad expects international volume to show
year-over-year improvement, driven by a projected increase in
import traffi c. On the domestic side, the strength of UP’s value
proposition and conversions from truck are expected to drive
growth. Continued pricing opportunities are anticipated in both
markets.
The Company is moving forward with service initiatives and
capital expenditures to both support current volumes and provide
Intermodal Line Density Map
Lane density based on carloadings. Line thickness depicts traffi c density.
2009 Units
Domestic45%
International55%
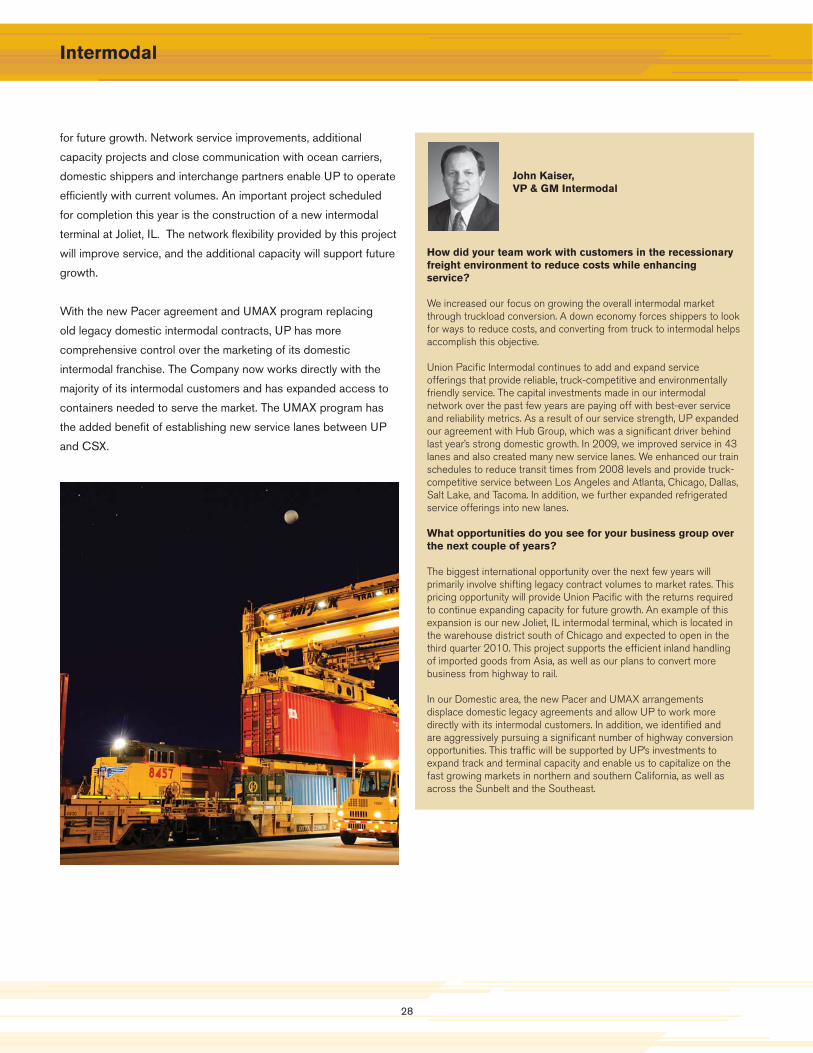
28
John Kaiser,VP & GM Intermodal
How did your team work with customers in the recessionary freight environment to reduce costs while enhancing service?
We increased our focus on growing the overall intermodal market through truckload conversion. A down economy forces shippers to look for ways to reduce costs, and converting from truck to intermodal helps accomplish this objective.
Union Pacifi c Intermodal continues to add and expand service offerings that provide reliable, truck-competitive and environmentally friendly service. The capital investments made in our intermodal network over the past few years are paying off with best-ever service and reliability metrics. As a result of our service strength, UP expanded our agreement with Hub Group, which was a signifi cant driver behind last year’s strong domestic growth. In 2009, we improved service in 43 lanes and also created many new service lanes. We enhanced our train schedules to reduce transit times from 2008 levels and provide truck-competitive service between Los Angeles and Atlanta, Chicago, Dallas, Salt Lake, and Tacoma. In addition, we further expanded refrigerated service offerings into new lanes.
What opportunities do you see for your business group over the next couple of years?
The biggest international opportunity over the next few years will primarily involve shifting legacy contract volumes to market rates. This pricing opportunity will provide Union Pacifi c with the returns required to continue expanding capacity for future growth. An example of this expansion is our new Joliet, IL intermodal terminal, which is located in the warehouse district south of Chicago and expected to open in the third quarter 2010. This project supports the effi cient inland handling of imported goods from Asia, as well as our plans to convert more business from highway to rail.
In our Domestic area, the new Pacer and UMAX arrangements displace domestic legacy agreements and allow UP to work more directly with its intermodal customers. In addition, we identifi ed and are aggressively pursuing a signifi cant number of highway conversion opportunities. This traffi c will be supported by UP’s investments to expand track and terminal capacity and enable us to capitalize on the fast growing markets in northern and southern California, as well as across the Sunbelt and the Southeast.
Intermodal
for future growth. Network service improvements, additional
capacity projects and close communication with ocean carriers,
domestic shippers and interchange partners enable UP to operate
effi ciently with current volumes. An important project scheduled
for completion this year is the construction of a new intermodal
terminal at Joliet, IL. The network fl exibility provided by this project
will improve service, and the additional capacity will support future
growth.
With the new Pacer agreement and UMAX program replacing
old legacy domestic intermodal contracts, UP has more
comprehensive control over the marketing of its domestic
intermodal franchise. The Company now works directly with the
majority of its intermodal customers and has expanded access to
containers needed to serve the market. The UMAX program has
the added benefi t of establishing new service lanes between UP
and CSX.

299
Intermodal Terminals and Traffi c Flows
Annual Summary by Quarter - Intermodal
2009 2008 2007
1st 2nd 3rd 4th Total 1st 2nd 3rd 4th Total 1st 2nd 3rd 4th Total
Freight Revenue (millions of dollars)
551 595 656 684 2,486 707 769 842 705 3,023 674 721 773 757 2,925
Revenue Ton-Miles (millions)
15,276 17,322 18,411 19,077 70,086 19,552 19,737 19,875 17,014 76,178 18,994 20,543 21,024 20,232 80,793
Revenue Carloads (thousands)
615 669 728 763 2,775 796 811 834 724 3,165 821 861 912 859 3,453
Average Revenue Per Car (dollars)
897 889 901 896 896 889 947 1,010 974 955 821 838 846 883 847
y by Quarter - Intermodal
2009 2008
3rd 4th Total 1st 2nd 3rd 4th Total
millions of dollars)
656 684 2,486 707 769 842 705 3,023
Seattle
Portland
LathropOakland
Las Vegas
Los Angeles/Long Beach
TucsonEl Paso
Salt Lake City
Denver
Council Bluffs Chicago
Memphis
Houston
Laredo
San Antonio
Dallas
TacomaTacSim
Sparks
New Orleans
ro
CityCityake CSalt Lakalt Laaaake City
enver
Council BluffsfsBluncil Bluf scil BBluffsCouncil ouncil Bcil BBluffs agohicaCh
TacSimTac
arksarkSpaa
opopop
s VegasLassLaL
DeDDe Kansas City
St. Louis
Intermodal TerminalsIntermodal LanesInt

30
Commodity Profi le
Union Pacifi c’s franchise provides the most effi cient rail route
between markets in Mexico, the U.S. and Canada, serving all
six major gateways to Mexico and connecting directly to the
two largest Mexican railroads. UP exchanges approximately
47 percent of shipments to and from Mexico with Kansas City
Southern de Mexico (KCSM) and the remaining 53 percent with
Ferrocarril Mexicano (Ferromex or FXE). Union Pacifi c has a 26
percent ownership interest in Ferromex. Trucks are the dominant
transportation mode in Mexico’s freight transportation market,
which exceeds $6 billion annually.
The Mexico market includes a broad range of commodities from
raw materials to fi nished goods. Historically, Automotive was the
largest commodity group by both revenue and volume. Although
Automotive is still the largest group by volume, Agricultural
Products generated the most revenue from Mexico traffi c in 2008
and 2009. Union Pacifi c works primarily with FXE and KCSM to
capture opportunities created by the North American Free Trade
Agreement (NAFTA). The Railroad also works with Ferrocarril
del Sureste (Ferrosur or FSRR) and other smaller railroads to
explore new businesses. The Mexican railroads continue making
substantial investments in track structure, equipment and facilities
to improve service, equipment utilization, safety and damage
prevention, which ultimately should enable them to capture
more market share from trucks and capitalize on new business
opportunities.
Mexico
As a result of the economic recession, revenue from shipments to
and from Mexico declined 26 percent from 2008 to $1.2 billion,
while volume declined 19 percent year-over-year. All business
groups reported a decline in revenue versus 2008 except the
Energy group, which reported 2 percent revenue growth and 9
percent volume growth. Agricultural Products revenue decreased
22 percent, as volume declined 16 percent. While DDGS revenue
increased 10 percent with a 16 percent volume increase, corn and
feed grains revenue decreased 44 percent as volume declined
35 percent year-over-year. Revenue for Industrial Products
decreased 37 percent, driven by a 36 percent volume decline in
metallic minerals and steel. Automotive revenue decreased 32
percent from 2008, while volumes declined 24 percent. Chemicals
revenue decreased 15 percent, primarily from soda ash and
fertilizer, and volume declined 12 percent. Intermodal revenue
decreased 15 percent with volume down 8 percent.
Historically, a majority of UP’s business in this market involved
southbound shipments to Mexico. However, over the last four
years northbound shipments grew as a result of increased Mexican
manufacturing. Northbound shipments now make up about 40
percent of revenue from Mexico operations. The largest volume of
commodities shipped from Mexico in 2009 included assembled
autos and auto parts, beer and food products, and intermodal.
These three commodity groups represented more than 75
percent of northbound revenue. Southbound traffi c from the U.S.
to Mexico is much more diversifi ed. Corn, dry feed ingredients,
autos and auto parts, intermodal, meals and oils, steel, plastics,
minerals, coal, soda ash, wheat and newsprint shipments make
up approximately 80 percent of southbound revenue, with the
remainder spread across the Company’s six commodity groups.
Mexico Line Density Map
Lane density based on carloadings. Line thickness depicts traffi c density.
2009 Carloads
Agricultural19%
Automotive37%
Chemicals7%
Energy1%
Industrial Products
11%
Intermodal25%

31
Bernardo Ayala,VP Mexico Markets
How did your team work with customers in the recessionary freight environment to reduce costs while enhancing service?
Our current product offerings and strong focus on service are seen by our customers as competitive advantages that allow them to reduce costs. Through our customer satisfaction processes, we work diligently to meet customer requirements. UP’s experienced sales force is strategically located throughout Mexico and the U.S. In conjunction with our International Customer Service Center, they seek to provide our international customers with unique dedicated services that range from monitoring traffi c across the border to developing tailored product offerings. A newly developed car-unloading program will be implemented during 2010 to help our grain receivers in Mexico reduce costs. In addition, effi ciency improvements in our freight car interchange operations at all six Mexico gateways improved transit times, yielding inventory and other cost reductions for many customers.
What opportunities do you see for your business group over the next couple of years?
Mexico remains a strong target for Foreign Direct Investment. Mexico’s proximity to the U.S. creates a competitive opportunity for several product types, such as those with high volume–to–weight or volume-to-value ratios (such as household appliances), as low logistics costs from Mexico can offset China’s low labor costs. Additionally, Mexico’s population continues to grow along with its demand for grain and foods high in protein. With Mexican railroads’ ongoing effort to improve rail traffi c handling through infrastructure investments, UP can leverage its value proposition and service offering to capture new business in developing markets.
Mexico
2010 Market Drivers
Although uncertainty remains regarding the economy, Union
Pacifi c expects modest growth in Mexico traffi c for all commodities
during 2010. With U.S. auto sales projected to increase 15
percent in 2010, auto production in Mexico is expected to
increase, resulting in a recovery of UP’s fi nished vehicles and auto
parts traffi c. Although Mexican consumption of domestic crops
is forecast to remain at levels similar to 2009, it is anticipated
that southbound shipments of soybeans, DDGS and other by-
products could grow. While U.S. consumption of import beer
decreased 2 percent in 2009, shipments of beer are expected to
grow moderately in 2010. Sugar shipments into the U.S. are also
forecast to be soft, due to an announced 5 percent reduction in
Mexico’s sugar production for the year.
U.S. and Mexican government stimulus programs, combined with
a more stable peso exchange rate and improvements in auto
production and fi nished goods sales, are expected to benefi t
shipments of scrap, steel, plastics, soda ash, paper, minerals,
construction materials, sands, paper, cardboard, household
appliances, and other products. However, U.S. unemployment
remains high, which may restrain consumer spending, a critical
factor for Mexico business.
While existing economic conditions call for a conservative 2010
outlook, UP stands ready for growth. Current strategies focus on
new business development, service and core price improvement.
These strategies, in conjunction with maintaining an effi cient
and fl uid network, support an expectation of retaining current
business and potentially generating growth. Foreign investment in
Mexico is forecast to continue throughout 2010, growing around
3 percent. The current outlook suggests that markets such as the
“maquiladora” industry, food, renewable energy, steel and coal
should trend upwards.
The Mexican government’s ongoing campaign against drugs and
drug-related crimes creates concern about the Mexican political
climate. Nevertheless, rail operations across the border remain
fl uid. Moreover, an expected increase in hours of operation at the
Eagle Pass and El Paso gateways should yield additional growth
in 2010.
Percent of Carloads at Border CrossingsCalexico (2%)
Nogales (12%) El Paso (9%)
Guadalajara
Brownsville (10%)
Laredo (35%)
Monterrey
Eagle Pass (32%)
Mexico City
FXE
FXE Trackage on KCSM
KCSM
KCSM Trackage on FXE
FSRR
Coahuila Durango
Chiapas Mayab
Short Lines
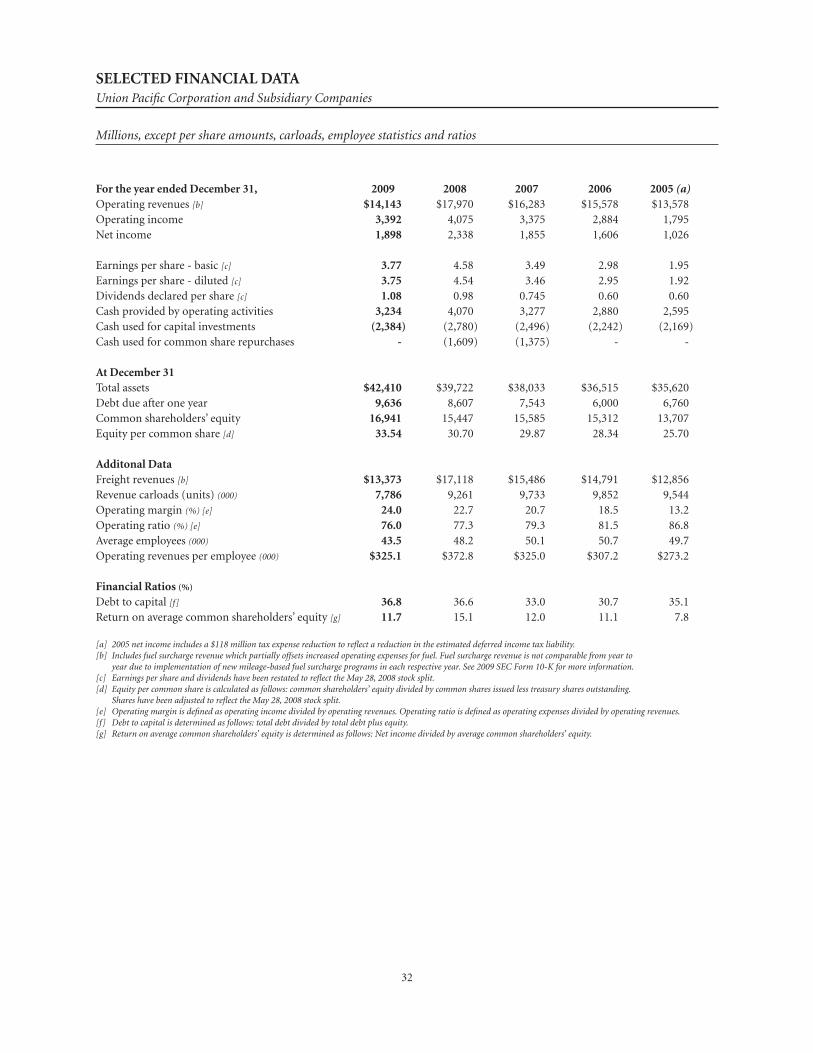
32
SELECTED FINANCIAL DATA Union Pacifi c Corporation and Subsidiary Companies
Millions, except per share amounts, carloads, employee statistics and ratios
For the year ended December 31, 2009 2008 2007 2006 2005 (a) Operating revenues [b] $14,143 $17,970 $16,283 $15,578 $13,578 Operating income 3,392 4,075 3,375 2,884 1,795 Net income 1,898 2,338 1,855 1,606 1,026
Earnings per share - basic [c] 3.77 4.58 3.49 2.98 1.95 Earnings per share - diluted [c] 3.75 4.54 3.46 2.95 1.92 Dividends declared per share [c] 1.08 0.98 0.745 0.60 0.60 Cash provided by operating activities 3,234 4,070 3,277 2,880 2,595Cash used for capital investments (2,384) (2,780) (2,496) (2,242) (2,169)Cash used for common share repurchases - (1,609) (1,375) - -
At December 31 Total assets $42,410 $39,722 $38,033 $36,515 $35,620 Debt due after one year 9,636 8,607 7,543 6,000 6,760 Common shareholders’ equity 16,941 15,447 15,585 15,312 13,707 Equity per common share [d] 33.54 30.70 29.87 28.34 25.70
Additonal Data Freight revenues [b] $13,373 $17,118 $15,486 $14,791 $12,856 Revenue carloads (units) (000) 7,786 9,261 9,733 9,852 9,544 Operating margin (%) [e] 24.0 22.7 20.7 18.5 13.2 Operating ratio (%) [e] 76.0 77.3 79.3 81.5 86.8 Average employees (000) 43.5 48.2 50.1 50.7 49.7 Operating revenues per employee (000) $325.1 $372.8 $325.0 $307.2 $273.2
Financial Ratios (%) Debt to capital [f] 36.8 36.6 33.0 30.7 35.1 Return on average common shareholders’ equity [g] 11.7 15.1 12.0 11.1 7.8
[a] 2005 net income includes a $118 million tax expense reduction to refl ect a reduction in the estimated deferred income tax liability.[b] Includes fuel surcharge revenue which partially offsets increased operating expenses for fuel. Fuel surcharge revenue is not comparable from year to year due to implementation of new mileage-based fuel surcharge programs in each respective year. See 2009 SEC Form 10-K for more information.[c] Earnings per share and dividends have been restated to refl ect the May 28, 2008 stock split.[d] Equity per common share is calculated as follows: common shareholders’ equity divided by common shares issued less treasury shares outstanding. Shares have been adjusted to refl ect the May 28, 2008 stock split.[e] Operating margin is defi ned as operating income divided by operating revenues. Operating ratio is defi ned as operating expenses divided by operating revenues.[f] Debt to capital is determined as follows: total debt divided by total debt plus equity.[g] Return on average common shareholders’ equity is determined as follows: Net income divided by average common shareholders’ equity.

33
CONSOLIDATED STATEMENTS OF INCOME (unaudited)Union Pacifi c Corporation and Subsidiary Companies
2009Millions, except per share amounts and percentages 1st Qtr 2nd Qtr 3rd Qtr 4th Qtr Full YearOperating Revenues Freight revenues $3,240 $3,121 $3,471 $3,541 $13,373 Other revenues 175 182 200 213 770 Total operating revenues 3,415 3,303 3,671 3,754 14,143 Operating Expenses Compensation and benefi ts 1,070 976 999 1,018 4,063 Fuel 386 370 466 541 1,763 Purchased services and materials 399 391 403 421 1,614 Depreciation 345 355 367 377 1,444 Equipment and other rents 317 307 290 266 1,180 Other 226 153 179 129 687 Total operating expenses 2,743 2,552 2,704 2,752 10,751 Operating Income 672 751 967 1,002 3,392 Other income 23 135 14 23 195 Interest expense (141) (150) (156) (153) (600)Income before income taxes 554 736 825 872 2,987Income tax expense (192) (268) (308) (321) (1,089)Net Income $362 $468 $517 $551 $1,898
Share and Per Share Earnings per share - basic $0.72 $0.93 $1.03 $1.09 $3.77 Earnings per share - diluted $0.72 $0.92 $1.02 $1.08 $3.75 Weighted average number of shares - basic 502.7 502.9 503.1 503.5 503.0 Weighted average number of shares - diluted 504.6 505.3 507.0 507.8 505.8 Dividends declared per share $0.27 $0.27 $0.27 $0.27 $1.08
Operating Ratio 80.3% 77.3% 73.7% 73.3% 76.0%Effective Tax Rate 34.7% 36.4% 37.3% 36.8% 36.5%
2008Millions, except per share amounts and percentages 1st Qtr 2nd Qtr 3rd Qtr 4th Qtr Full YearOperating Revenues Freight revenues $4,059 $4,349 $4,630 $4,080 $17,118 Other revenues 211 219 216 206 852 Total operating revenues 4,270 4,568 4,846 4,286 17,970 Operating Expenses Compensation and benefi ts 1,132 1,101 1,123 1,101 4,457 Fuel 957 1,159 1,135 732 3,983 Purchased services and materials 469 494 481 458 1,902 Depreciation 340 346 348 353 1,387 Equipment and other rents 342 338 326 320 1,326 Other 242 199 218 181 840 Total operating expenses 3,482 3,637 3,631 3,145 13,895 Operating Income 788 931 1,215 1,141 4,075 Other income 25 19 23 25 92 Interest expense (126) (128) (130) (127) (511)Income before income taxes 687 822 1,108 1,039 3,656 Income tax expense (244) (291) (405) (378) (1,318)Net Income $443 $531 $703 $661 $2,338
Share and Per Share (a) Earnings per share - basic $0.86 $1.03 $1.39 $1.31 $4.58 Earnings per share - diluted $0.85 $1.02 $1.38 $1.31 $4.54 Weighted average number of shares - basic 518.4 514.3 506.6 503.2 510.6 Weighted average number of shares - diluted 522.8 519.0 511.3 506.5 515.0 Dividends declared per share $0.22 $0.22 $0.27 $0.27 $0.98
Operating Ratio 81.5% 79.6% 74.9% 73.4% 77.3%Effective Tax Rate 35.5% 35.4% 36.6% 36.4% 36.1%
(a) First quarter 2008 earnings per share, shares and dividends have been restated to refl ect the May 28, 2008 stock split. Refer to the Union Pacifi c Corporation 2009 SEC Form 10-K for additional information, including audited fi nancial statements and related footnotes.

34
CONSOLIDATED STATEMENTS OF FINANCIAL POSITIONUnion Pacifi c Corporation and Subsidiary Companies
Millions, as of December 31, 2009 2008
Assets Current assets
Cash and cash equivalents ............................................................................................... $1,850 $1,249
Accounts receivable ......................................................................................................... 666 594
Materials and supplies ..................................................................................................... 475 450
Current deferred income taxes ....................................................................................... 339 276
Other current assets ......................................................................................................... 350 244
Total current assets .................................................................................................................. 3,680 2,813
Investments ............................................................................................................................. 1,036 974
Properties:
Land.................................................................................................................................. 4,891 4,861
Road ................................................................................................................................. 36,009 34,348
Equipment ....................................................................................................................... 8,209 7,300
Other ................................................................................................................................ 1,443 1,406
Accumulated depreciation .............................................................................................. (13,124) (12,214)
Net properties .......................................................................................................................... 37,428 35,701
Other assets ............................................................................................................................. 266 234
Total assets ............................................................................................................................... $42,410 $39,722
Liabilities and Common Shareholders’ Equity
Current liabilities:
Accounts payable ............................................................................................................. $612 $629
Accrued wages and vacation ........................................................................................... 339 367
Accrued casualty costs ..................................................................................................... 379 390
Income and other taxes ................................................................................................... 224 207
Dividends and interest .................................................................................................... 347 328
Equipment rents payable ................................................................................................. 89 93
Other current liabilities ................................................................................................... 480 546
Debt due within one year ................................................................................................ 212 320
Total current liabilities ............................................................................................................ 2,682 2,880
Debt due after one year ........................................................................................................... 9,636 8,607
Deferred income taxes ............................................................................................................ 11,130 10,282
Other long-term liabilities ...................................................................................................... 2,021 2,506
Total liabilities ......................................................................................................................... 25,469 24,275
Common shareholders’ equity:
Common shares ............................................................................................................... 1,384 1,382
Paid-in-surplus ................................................................................................................ 3,968 3,949
Retained earnings ............................................................................................................ 15,167 13,813
Treasury stock .................................................................................................................. (2,924) (2,993)
Accumulated other comprehensive loss ......................................................................... (654) (704)
Total common shareholders’ equity ....................................................................................... 16,941 15,447
Total liabilities and common shareholders’ equity ................................................................ $42,410 $39,722
Refer to the 2009 Union Pacifi c Corporation SEC Form 10-K for additional information.
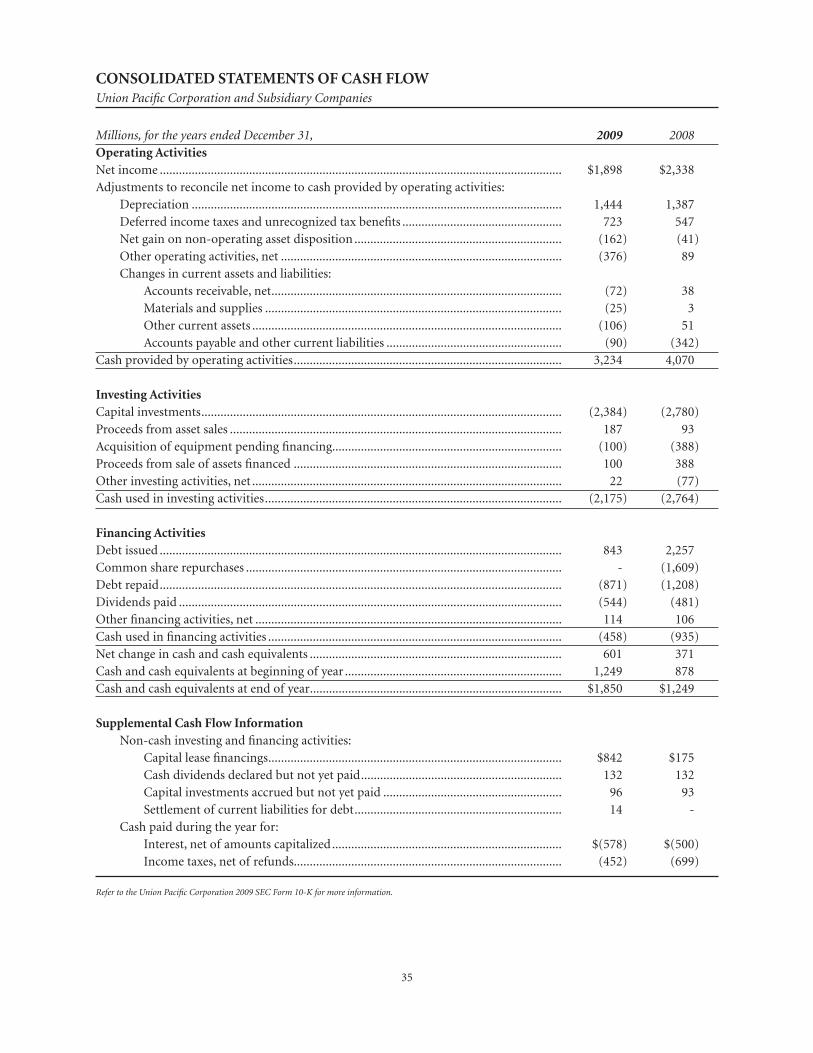
35
CONSOLIDATED STATEMENTS OF CASH FLOWUnion Pacifi c Corporation and Subsidiary Companies
Millions, for the years ended December 31, 2009 2008Operating ActivitiesNet income .............................................................................................................................. $1,898 $2,338 Adjustments to reconcile net income to cash provided by operating activities: Depreciation .................................................................................................................... 1,444 1,387 Deferred income taxes and unrecognized tax benefi ts .................................................. 723 547 Net gain on non-operating asset disposition ................................................................. (162) (41) Other operating activities, net ........................................................................................ (376) 89 Changes in current assets and liabilities: Accounts receivable, net ........................................................................................... (72) 38 Materials and supplies ............................................................................................. (25) 3 Other current assets ................................................................................................. (106) 51 Accounts payable and other current liabilities ....................................................... (90) (342)Cash provided by operating activities .................................................................................... 3,234 4,070
Investing ActivitiesCapital investments ................................................................................................................. (2,384) (2,780)Proceeds from asset sales ........................................................................................................ 187 93 Acquisition of equipment pending fi nancing........................................................................ (100) (388)Proceeds from sale of assets fi nanced .................................................................................... 100 388 Other investing activities, net ................................................................................................. 22 (77)Cash used in investing activities ............................................................................................. (2,175) (2,764)
Financing ActivitiesDebt issued .............................................................................................................................. 843 2,257 Common share repurchases ................................................................................................... - (1,609)Debt repaid .............................................................................................................................. (871) (1,208)Dividends paid ........................................................................................................................ (544) (481)Other fi nancing activities, net ................................................................................................ 114 106 Cash used in fi nancing activities ............................................................................................ (458) (935)Net change in cash and cash equivalents ............................................................................... 601 371 Cash and cash equivalents at beginning of year .................................................................... 1,249 878 Cash and cash equivalents at end of year ............................................................................... $1,850 $1,249
Supplemental Cash Flow Information Non-cash investing and fi nancing activities: Capital lease fi nancings ............................................................................................ $842 $175 Cash dividends declared but not yet paid ............................................................... 132 132 Capital investments accrued but not yet paid ........................................................ 96 93 Settlement of current liabilities for debt ................................................................. 14 - Cash paid during the year for: Interest, net of amounts capitalized ........................................................................ $(578) $(500) Income taxes, net of refunds.................................................................................... (452) (699)
Refer to the Union Pacifi c Corporation 2009 SEC Form 10-K for more information.
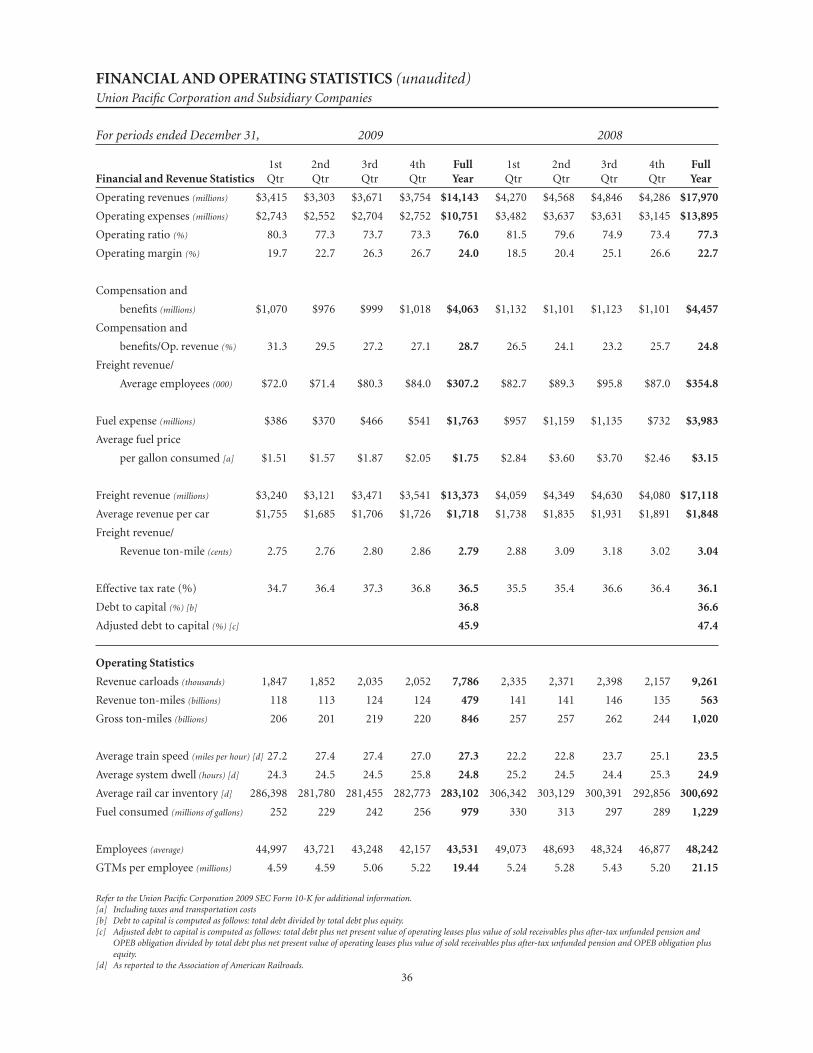
36
FINANCIAL AND OPERATING STATISTICS (unaudited)Union Pacifi c Corporation and Subsidiary Companies
For periods ended December 31, 2009 2008 1st 2nd 3rd 4th Full 1st 2nd 3rd 4th FullFinancial and Revenue Statistics Qtr Qtr Qtr Qtr Year Qtr Qtr Qtr Qtr Year
Operating revenues (millions) $3,415 $3,303 $3,671 $3,754 $14,143 $4,270 $4,568 $4,846 $4,286 $17,970
Operating expenses (millions) $2,743 $2,552 $2,704 $2,752 $10,751 $3,482 $3,637 $3,631 $3,145 $13,895
Operating ratio (%) 80.3 77.3 73.7 73.3 76.0 81.5 79.6 74.9 73.4 77.3
Operating margin (%) 19.7 22.7 26.3 26.7 24.0 18.5 20.4 25.1 26.6 22.7
Compensation and
benefi ts (millions) $1,070 $976 $999 $1,018 $4,063 $1,132 $1,101 $1,123 $1,101 $4,457
Compensation and
benefi ts/Op. revenue (%) 31.3 29.5 27.2 27.1 28.7 26.5 24.1 23.2 25.7 24.8
Freight revenue/
Average employees (000) $72.0 $71.4 $80.3 $84.0 $307.2 $82.7 $89.3 $95.8 $87.0 $354.8
Fuel expense (millions) $386 $370 $466 $541 $1,763 $957 $1,159 $1,135 $732 $3,983
Average fuel price
per gallon consumed [a] $1.51 $1.57 $1.87 $2.05 $1.75 $2.84 $3.60 $3.70 $2.46 $3.15
Freight revenue (millions) $3,240 $3,121 $3,471 $3,541 $13,373 $4,059 $4,349 $4,630 $4,080 $17,118
Average revenue per car $1,755 $1,685 $1,706 $1,726 $1,718 $1,738 $1,835 $1,931 $1,891 $1,848
Freight revenue/
Revenue ton-mile (cents) 2.75 2.76 2.80 2.86 2.79 2.88 3.09 3.18 3.02 3.04
Effective tax rate (%) 34.7 36.4 37.3 36.8 36.5 35.5 35.4 36.6 36.4 36.1
Debt to capital (%) [b] 36.8 36.6
Adjusted debt to capital (%) [c] 45.9 47.4
Operating Statistics
Revenue carloads (thousands) 1,847 1,852 2,035 2,052 7,786 2,335 2,371 2,398 2,157 9,261
Revenue ton-miles (billions) 118 113 124 124 479 141 141 146 135 563
Gross ton-miles (billions) 206 201 219 220 846 257 257 262 244 1,020
Average train speed (miles per hour) [d] 27.2 27.4 27.4 27.0 27.3 22.2 22.8 23.7 25.1 23.5
Average system dwell (hours) [d] 24.3 24.5 24.5 25.8 24.8 25.2 24.5 24.4 25.3 24.9
Average rail car inventory [d] 286,398 281,780 281,455 282,773 283,102 306,342 303,129 300,391 292,856 300,692
Fuel consumed (millions of gallons) 252 229 242 256 979 330 313 297 289 1,229
Employees (average) 44,997 43,721 43,248 42,157 43,531 49,073 48,693 48,324 46,877 48,242
GTMs per employee (millions) 4.59 4.59 5.06 5.22 19.44 5.24 5.28 5.43 5.20 21.15
Refer to the Union Pacifi c Corporation 2009 SEC Form 10-K for additional information. [a] Including taxes and transportation costs[b] Debt to capital is computed as follows: total debt divided by total debt plus equity.[c] Adjusted debt to capital is computed as follows: total debt plus net present value of operating leases plus value of sold receivables plus after-tax unfunded pension and OPEB obligation divided by total debt plus net present value of operating leases plus value of sold receivables plus after-tax unfunded pension and OPEB obligation plus equity.[d] As reported to the Association of American Railroads.

37
NON-GAAP DEFINITIONS
Management believes certain non-GAAP measures provide an alternative presentation of the results that more accurately refl ect
ongoing Company operations. These measures should be considered in addition to, not a substitute for, the reported GAAP
results.
Fuel Price Adjusted Operating Expenses
Reported operating expenses minus the differential between fuel price per gallon consumed multiplied by current period fuel
consumed in gallons. Management believes this is an important measure in evaluating cost changes excluding the change in fuel
price, to allow the illustration of cost performance as it relates to volume changes.
Free Cash Flow
Cash provided by operating activities, less cash used in investing activities and dividends paid. Management believes free cash
fl ow is important in evaluating our fi nancial performance and measures our ability to generate cash without additional external
fi nancings. Free cash fl ow should be considered in addition to, rather than as a substitute for, cash provided by operating
activities.
Return on Invested Capital
Net income plus interest expense, plus sale of receivables fees, plus interest on present value of operating leases, less taxes on
interest and fees divided by average equity plus average debt plus average value of sold receivables plus average present value
of operating leases. Management believes this is an important measure for evaluating the effi ciency and effectiveness of the
Corporation’s long term capital investments, and we currently use ROIC as a performance criteria in determining certain elements
of equity compensation for our executives.
Debt to Capital
Total debt divided by total debt plus equity. Management believes this is an important measure in evaluating our balance sheet
strength and is important in managing our credit ratios and fi nancing relationships.
Adjusted Debt to Capital
Total debt plus net present value of operating leases plus value of sold receivables plus after-tax unfunded pension and OPEB
obligation divided by total debt plus net present value of operating leases plus value of sold receivables plus after-tax unfunded
pension and OPEB obligation plus equity. Operating leases were discounted using 6.3% at December 31, 2009 and 8.0% at
December 31, 2008, respectively. The lower discount rate refl ects changes to interest rates and our current fi nancing costs.
Management believes this is an important measure in evaluating the total amount of leverage in our capital structure including
off-balance sheet obligations.

38
FUEL PRICE ADJUSTED OPERATING EXPENSES Normalized for 2008 Fuel PriceReconciliation to GAAP
(Millions, except for fuel price per gallon)
First Second Third Fourth Quarter Quarter Quarter Quarter Full Year 2009 2009 2009 2009 2009 Reported Operating Expenses $2,743 $2,552 $2,704 $2,752 $10,751 Average Fuel Price per Gallon Consumed - 2009 $1.51 $1.57 $1.87 $2.05 Average Fuel Price per Gallon Consumed - 2008 $2.84 $3.60 $3.70 $2.46 Difference ($1.33) ($2.03) ($1.83) ($0.41) Fuel Consumed in Gallons 252 229 242 256 Adjusted Locomotive Fuel Expense ($335) ($465) ($443) ($105) ($1,348)Fuel Price Adjusted Operating Expenses $3,078 $3,017 $3,147 $2,857 $12,099
FUEL PRICE ADJUSTED OPERATING EXPENSES Normalized for First Quarter 2009 Fuel PriceReconciliation to GAAP
(Millions, except for fuel price per gallon)
First Second Third Fourth Quarter Quarter Quarter Quarter 2009 2009 2009 2009 Reported Operating Expenses $2,743 $2,552 $2,704 $2,752 Average Fuel Price per Gallon Consumed $1.51 $1.57 $1.87 $2.05 Average Fuel Price per Gallon Consumed - First Quarter 2009 $1.51 $1.51 $1.51 Difference $0.06 $0.36 $0.54 Fuel Consumed in Gallons 229 242 256 Adjusted Locomotive Fuel Expense $14 $87 $138 Fuel Price Adjusted Operating Expenses $2,743 $2,538 $2,617 $2,614
Sequential Change -7.5% 3.1% -0.1%

39
FREE CASH FLOW AND CONSOLIDATED STATEMENT OF CASH FLOWSReconciliation to GAAP
(Millions, except for percentages)
2009 2008 2007Cash provided by operating activities $3,234 $4,070 $3,277 Cash used in investing activities (2,175) (2,764) (2,426)Dividends paid (544) (481) (364)Free cash fl ow $515 $825 $437
CONSOLIDATED STATEMENTS OF CASH FLOWS 2009 2008 2007 Operating Activities: Net income $1,898 $2,338 $1,855 Depreciation 1,444 1,387 1,321 Deferred income taxes and unrecognized tax benefi ts 723 547 332 Other operating activities - net (831) (202) (231)Cash provided by operating activities 3,234 4,070 3,277 Investing Activities: Capital investments (2,384) (2,780) (2,496)Other investing activities - net 209 16 70 Cash used in investing activities (2,175) (2,764) (2,426)Financing Activities: Debt issued 843 2,257 1,581 Common share repurchases - (1,609) (1,375)Debt repaid (871) (1,208) (792)Dividends paid (544) (481) (364)Other fi nancing activities - net 114 106 150 Cash used in fi nancing activities (458) (935) (800)Net change in cash and cash equivalents $601 $371 $51
RETURN ON INVESTED CAPITAL (ROIC) 2009 2008 2007 Net income $1,898 $2,338 $1,855 Add: Interest expense 600 511 482 Add: Sale of receivables fees 9 23 35 Add: Interest on present value of operating leases 232 299 292 Less: Taxes on interest and fees (307) (301) (310)Net operating profi t after taxes as adjusted (a) $2,432 $2,870 $2,354 Average equity $16,194 $15,516 $15,448 Add: Average debt 9,388 8,305 7,232 Add: Average value of sold receivables 492 592 600 Add: Average present value of operating leases 3,681 3,737 3,648 Average invested capital as adjusted (b) $29,755 $28,150 $26,928 Return on invested capital as adjusted (a/b) 8.2% 10.2% 8.7%

40
DEBT TO CAPITAL/ADJUSTED DEBT TO CAPITALReconciliation to GAAP
(Millions, except percentages)
2009 2008 2007Debt (a) $9,848 $8,927 $7,682 Equity 16,941 15,447 15,585 Capital (b) $26,789 $24,374 $23,267 Debt to capital (a/b) 36.8% 36.6% 33.0% 2009 2008 2007Debt $9,848 $8,927 $7,682 Net present value of operating leases 3,672 3,690 3,783 Value of sold receivables 400 584 600 Unfunded pension and OPEB 456 733 234 Adjusted debt (a) $14,376 $13,934 $12,299 Equity 16,941 15,447 15,585 Adjusted capital (b) $31,317 $29,381 $27,884 Adjusted debt to capital (a/b) 45.9% 47.4% 44.1%

41
2005 INCOME TAX ADJUSTMENTReconciliation to GAAP
(Millions, except earnings per share)
Management believes certain non-GAAP measures provide an alternative presentation of the results that more accurately refl ect on-going Company operations. The full year 2005 net income of $908 million and earnings per diluted share of $3.41, which excluded the income tax expense reduction item reported in the third quarter of 2005, are non-GAAP measures. Management believes these measures provide an alternative presentation of results that more accurately refl ects on-going Company operations, without the distorting effects of the income tax expense reduction item. These measures should be considered in addition to, not a substitute for, the reported GAAP results.
Full Year 2005 Results As Reported Income Tax Adjustment
Operating Revenues $13,578 $13,578 Operating Expenses 11,783 11,783 Operating Income 1,795 1,795 Operating Margin 13.2% 13.2%Operating Ratio 86.8% 86.8%Other Income - Net 145 145 Interest Expense (504) (504)Income Before Income Taxes 1,436 1,436 Income Tax Expense (410) (528) (a)Net Income $1,026 $908 Diluted Earnings Per Share $3.85 $3.41 Diluted Earnings Per Share - Restated for May 28, 2008 Stock Split $1.92 $1.71
Third Quarter 2005 Results As Reported Income Tax Adjustment
Operating Revenues $3,461 $3,461 Operating Expenses 2,980 2,980 Operating Income 481 481 Operating Margin 13.9% 13.9%Operating Ratio 86.1% 86.1%Other Income - Net 42 42 Interest Expense (124) (124)Income Before Income Taxes 399 399 Income Tax Expense (30) (148) (a)Net Income $369 $251 Diluted Earnings Per Share $1.38 $0.94Diluted Earnings Per Share - Restated for May 28, 2008 Stock Split $0.69 $0.47
(a) Income tax expense reduction of $118 million after-tax taken in third quarter 2005Note: Totals may not foot due to rounding
42
Cautionary Information
The 2009 Analyst “Fact Book” provides additional explanatory
information regarding Union Pacifi c that may not be
available, included or directly derived from information in
the Company’s Annual Report. The information provided is
supplemental in nature and is not, and should not be construed
as, better than that available in the Company’s publicly
available reports fi led with the SEC. Additionally, some of the
information in the Fact Book is derived from the Company’s
audited fi nancial statements, but the Fact Book and its contents
have not been, and should not be considered, audited.
This Fact Book includes statements and information regarding
future expectations or results of the Company that are not
historical facts. These statements and information are, or will
be, forward looking as defi ned by the federal securities laws.
Forward looking statements and information can be identifi ed
by use of forward looking terminology (and derivations
thereof), such as “believes”, “expects”, “may”, “should”, “will”,
“would”, “intends”, “plans”, “estimates”, “anticipates”, “projects”
and other words or phrases of similar intent. Forward looking
statements and information generally include statements
and information included under sections of this Fact Book
entitled “2010 Market Drivers” and information regarding
business opportunities over the next 2 to 3 years, and
specifi cally include statements and information regarding: the
Company’s expectations or forecasts with respect to general
economic conditions in the U.S. and the world; the Company’s
fi nancial and operational performance; increases of the
Company’s earnings; demand for the Company’s rail service;
the continued ability of the Company to increase prices;
improving customer service; enhancing profi tability; volume
and revenue growth; effi ciency improvements and increasing
returns; improving asset utilization; the effectiveness or
growth of new and newer services; management of network
volumes; increasing shareholder value; total amount of
capital investments; completion and effectiveness of capacity
expansion and other capital investments, and other investments
in upgrading or adding signals and facilities; returns on capital
investments; improvements regarding safety of our operations
and equipment; and effectiveness of plans, programs and
initiatives to reduce costs, improve the Company’s Operating
Ratio and other effi ciency improvements.
Forward-looking statements and information should not be
read as a guarantee of future performance or results, and will
not necessarily be accurate indications of the times that, or by
which, such performance or results will be achieved. Forward-
looking statements and information are subject to risks and
uncertainties that could cause actual performance or results to
differ materially from those expressed in the statements.
Forward-looking statements and information refl ect the good
faith consideration by management of currently available
information, and may be based on underlying assumptions
believed to be reasonable under the circumstances. However,
such information and assumptions (and, therefore, such
forward-looking statements and information) are or may
be subject to variables or unknown or unforeseeable events
or circumstances over which management has little or no
infl uence or control. The Risk Factors in Item 1A of the
Company’s Annual Report on Form 10-K, fi led on February
5, 2010, could affect our future results and could cause those
results or other outcomes to differ materially from those
expressed or implied in the forward-looking statements and
information. This Fact Book should be read in consideration
of these Risk Factors. To the extent circumstances require or
the Company deems it otherwise necessary, the Company will
update or amend these Risk Factors in subsequent Annual
Reports, periodic reports on Form 10-Q or current reports on
Form 8-K.
Forward-looking statements speak only as of the date the
statement was made. We assume no obligation to update
forward-looking information to refl ect actual results, changes
in assumptions or changes in other factors affecting forward-
looking information. If we do update one or more forward-
looking statements, no inference should be drawn that we will
make additional updates with respect thereto or with respect to
other forward-looking statements.
The Company’s fi nancial statements are included solely as
a convenience. The fi nancial statements should be read in
conjuction with the notes to the Financial Statements and
Supplementary Data in Item 8 of the Company’s 2009 Annual
Report on Form 10-K.