2009-report injuries - old.iss.itold.iss.it/binary/stra/cont/2009_idb_report.pdf · about this...
TRANSCRIPT

Injuries
Working together to make Europe a safer place
in the European Union
Statistics Summary 2005-2007
2009-Report


2009-Report
Injuries in the European Union Statistics Summary 2005 – 2007
Vienna, November 2009
Supported by the European Commission, Health and Consumers (DG Sanco)
featuring the EU Injury Database (IDB)https://webgate.ec.europa.eu/idb/

ABOUT THIS REPORT
The third edition of “Injuries in the European Union”, based on data from 2005-2007, is an up-to-date summary of the main results of current injury statistics and surveys at the EU level. Recent hospital based data from the EU Injury Database (IDB) is combined with European injury data from international data providers, such as Eurostat and WHO, in order to give a comprehensive overview of injuries in Europe.
The report focuses on the following injury hotspots: children, adolescents, older people, vulnerable road users, sports injuries, product and services related accidents, interpersonal violence and suicide and self-harm. The degree of information on each injury hotspot depends on the availability of data from the respective data sources which, in most cases, is restricted to just age and gender. For more information on the environmental, social and behavioral determinants of injuries, as well as prevention measures, reference is made to prominent “EU Initiatives” for each of the hotspot areas.
The 2005 to 2007 data used in the report mostly concerns a 3 year average and either covers all 27 EU member states as is the case with mortality data, or is assumed representative of the EU-27 as is the case with the IDB data. Exceptions and information about the data sources used are stated in the Annex. The data was extracted in August 2009.
Editorial
Authors: Robert Bauer, Monica Steiner (KfV)
Editorial Board: Wim Rogmans (EuroSafe), Rupert Kisser (KfV)
Contributors of “EU Initiatives” for the chapters on injury hotspots: Joanne Vincenten, Morag McKay, European Child Safety Alliance / EuroSafe (Children); Ursula Löwe, KfV (Adolescents) - Chris Todd, Manchester University (Older people) - Graziella Jost, European Transport Safety Council (Vulnerable Road Users) - Nadia Minicuci, National Research Council at Padua University (Interpersonal Violence) - Ella Arenson, National Suicide Research Foundation at Cork University (Self-harm).
Kuratorium für Verkehrssicherheit (KfV, Austrian Road Safety Board) Schleiergasse 18, 1100 Vienna, Austria; www.kfv.atISBN: 978-3-7070-0096-2 © KfV, 2009
© Photos: EuroSafe, KfV, Helga Allmer (Hotspot Product Safety)
Layout: Rafael Budka (Opinion Leaders Network GmbH)Printed in Austria
Supported by the European Commission, Health and Consumers Directorate-General (DG Sanco)
Please note that despite the harmonisation efforts undertaken by the respective data centers and data providers in the member states, the injury statistics may not always be completely comparable and the differentiation in sections of injury surveillance is not always clear-cut. There are many reasons for this ranging from differences in the organisation of the national health care systems to cultural differences in the reporting of injury causes.

INJURIES IN THE EUROPEAN UNION
CONTENTS
FACTS AS BASIS FOR ACTION 5
THE BIGGER PICTURE 6
HOTSPOT CHILDREN 8
HOTSPOT ADOLESCENTS 10
HOTSPOT OLDER PEOPLE 12
HOTSPOT VULNERABLE ROAD USERS 14
HOTSPOT PRODUCT AND SERVICES RELATED ACCIDENTS 16
HOTSPOT SPORTS INJURIES 18
HOTSPOT INTERPERSONAL VIOLENCE 20
HOTSPOT SUICIDE AND SELF-HARM 22
HEALTH SECTOR: LEADERSHIP IN INJURY SURVEILLANCE 25
ANNEX 1: INJURY MORTALITY AND MORBIDITY IN THE EU-27 MEMBER STATES 26
ANNEX 2: LIST OF FIGURES AND TABLES 31
ANNEX 3: AVAILABILITY OF DATA SOURCES BY YEAR AND COUNTRY 34
REFERENCES 35

5
INJURIES IN THE EUROPEAN UNION
FACTS AS BASIS FOR ACTION Injuries due to accidents or violence1 are a major public health problem, killing more than 250 000 people in the EU-27 each year and disabling many more. Historically, the injury problem has been neglected, largely because injuries were viewed as accidents or random events. Today, however, injuries are known to be preventable. The use of seat belts, car seats for children, designated drivers, fencing around water areas, flame-resistant clothing and smoke detectors, together with early childhood education and counseling to prevent violence or self-harm have all proved to be effective measures for preventing injuries.
Injury data is needed to understand the injury problem and to be able to take measures to tackle the problem based on informed decisions about priority setting and target groups. It is also an essential tool for harnessing public support, stakeholders’ involvement and political will. Accurate data are also required to evaluate the success and cost-effectiveness of injury prevention measures.Injury and violence-related data can be obtained from a wide range of sources, such as police and ambulance reports, national insurance schemes, hospital inpatient registers and emergency department injury records. However, these records provide only a very fragmented picture of the injury problem and are therefore rather incomplete. Existing sources of data often underestimate the extent of injuries. For instance, three-quarters of the violence related injuries treated in emergency departments come from assaults that were never reported to the police. For pedestrian and bicycle accidents it is estimated that about half of all hospital treated injuries are not registered in the police-based statistics.
The health sector has unique access to information on injury victims, in particular in accident and emergency departments at hospitals. These emergency units should therefore play a pivotal role in injury data collection. If the health sector does not increase efforts to collect injury data, violence-related injuries will remain severely underestimated and prevention opportunities will be seriously underutilized.
It is in this perspective, that the EU Council issued a Recommendation that urges member states to develop national injury surveillance and reporting systems (OJ C 164/1, 18.7.2007). The Council also invites the Commission to establish a Community-wide injury surveillance system to make the information contained in the database easily accessible to all stakeholders. Several projects have already been supported by the Commission to develop such an exchange of injury data at the EU level based on data collected in accident and emergency departments at general hospitals. At present, thirteen member states are routinely collecting injury data in a sample of hospitals and delivering these data to the Commission, in line with the so-called IDB-methodology (https://webgate.ec.europa.eu/idb/). With an additional nine member states currently carrying out a pilot test, the IDB is making progress in achieving full EU-coverage.
In this report, recent IDB hospital based data is combined with European injury data made publicly accessible through international data providers, such as Eurostat and WHO, to give a bird’s eye view of injuries in Europe. The report also presents a snapshot focus on eight injury hotspot areas that correlate with the priority areas indicated in the Council Recommendation on Injury Prevention and Safety Promotion. For the first time data on violence and self-harm is also included. The data on the injury hotspots is of great interest for prevention practitioners and other stakeholders in both the public and private domains.
1An injury is usually defined by intention. The main causes of unintentional, i.e. accidental, injuries are motor vehicle accidents, poisoning, drowning, falls and burns. Intentional injuries, i.e. violence can be divided into the categories of: self-directed (as in suicide or self-harm), interpersonal (child, partner, elder, acquaintance or stranger) or collective (in war and by gangs), and other intentional injuries (including deaths due to legal intervention). In addition to intention and cause, injuries can also be addressed according to their settings – such as the home, sports and leisure, work-place or road.
It is our firm belief that we can only successfully address the injury issue, if we possess accurate and timely delivered data on the causes of injuries in member states. This shall enable us to monitor injury risks in the Community as well as in individual member states with a view to allow benchmarking and comparison between member states. Injury data is also indispensable to enable proper assessment of the health burden of injury with respect to different consequences: mortality, morbidity and disability.
Androulla Vassiliou, Commissioner for HealthMeglena Kuneva, Commissioner for Consumer Affairs
Brussels, 28th September 2009

6
Source: WHO MDB, Eurostat HDR, EU IDB AI. See Annex 2 “List of figures and tables” for more details.
The EU injury pyramid – facts and impacts
Fatal injuries 250 000 injury fatalities annually: Injuries kill more children, adolescents and young adults than any other cause of death. When all age groups are combined, injury represents the fourth major cause of death in the EU. Only cardiovascular diseases, cancer and
diseases of the respiratory system claim more lives. There is an enormous difference in the rate of fatal injuries throughout the EU. It is estimated that more than 100 000 lives could be saved
each year if every country in the EU-27 reduced its injury mortality rate to the same level as in the Netherlands that currently has the lowest rate of fatal injuries in the EU (Annex Figure 1).
Non-fatal injuries 60 million people annually, which is more than the whole population of Italy, have to seek medical treatment following an injury (Table 1). 42 million people have to receive hospital treatment for injuries each year of which 7 million have to be admitted for severe injuries - more
than 19 000 people each day (Table 1). Injury patients admitted to hospital receive more than 50 million hospital days of treatment per year (9% of all hospital days), the cost of
which adds up to an estimated total of €15 billion [1]. Additional Euros for costs such as lost work time, insurance and property damage would increase this amount considerably.
Currently, injuries in the EU have left more than 3 million people permanently disabled [2].
Trends The number of fatal home and leisure injuries, mainly attributed to falls among the elderly, is increasing at a faster rate than demographic trends. The incidence of non-fatal injuries is stagnating in the areas of traffic and work-place, but is rising in the area of home and leisure. A growing number of disabled people is expected as a consequence of declining fatalities and stable or increasing non-fatal injuries.
Figure 1: The injury pyramid for the European Union
THE
BIGGER PICTURE
Every two minutes someone dies of an injury. For each EU citizen that dies as a result of an injury, 28 people across Europe are admitted to hospital, 136 are treated as hospital outpatients and another 73 receive medical treatment outside the hospital. This means that each year a staggering 7 million people are admitted to hospital, 35 million people are treated as hospital outpatients and 19 million people receive medical treatment outside the hospital as a result of an accident or violence related injury (see the injury pyramid in Figure 1).
Injuries due to accidents and violence are a major public health problem, killing more than 250 000 people in the EU-27 each year and disabling many more. Injuries are the fourth most common cause of death, after cardiovascular diseases, cancer, and respiratory diseases. While the dimension of the problem is well known, better information about circumstances and causes is needed for the main unintentional and intentional injury domains in order to set up efficient prevention programmes.
Other medical treatment 18 600 000
34 800 000Hospital outpatients
7 200 000Hospital admissions
256 000Fatalities Every
2 minutessomeone dies of an
injury in the EU-27

7
INJURIES IN THE EUROPEAN UNION
HotspotsThis report focuses on eight injury hotspots that correlate with the priority areas indicated in the Council Recommendation on Injury Prevention and Safety Promotion. The hotspots have been selected based on the following criteria: the social impact (number, severity), the evidence of cost-effective interventions, and the feasibility of their successful implementation and evalu-ation in the European context.
1. Children: In this age group, in particular, an injury and its disabling consequences have a tremendous impact on the child, the child’s family and society at large. For children older than 1 year of age injuries are the main cause of death.
2. Adolescents: Considering that adolescents are very much into testing their limits and pushing their boundaries, it is no wonder that injuries climax between the age of 15 and 24 and are the number one killer in this age group.
3. Older people: The highest mortality rates due to injury are found in people aged 60 and above with falls being the major cause of these deaths. In particular, falls account for a high share of hospitalisation and direct medical costs in this age group.
4. Vulnerable road users: Children, the elderly, people with disabilities, cyclists, skaters, and pedestrians are vulnerable road users. These risk groups need to be better represented in current road safety actions.
5. Sports: The promotion of exercise is an essential strategy of health promotion in order to overcome the epidemic of obesity. However a sizable proportion of these health gains are lost due to sport injuries.
6. Product and services related accidents: EU legislation ensures high standards of consumer safety. Nevertheless, there are numerous accidents involving consumer products and services (i.e. in tourism and leisure services).
7. Interpersonal violence: Interpersonal violence is an issue of growing public concern and includes domestic violence, child abuse, elder abuse and youth violence. It undermines the social and economic conditions in society.
8. Self harm: Another important cause of premature death and of hospitalisation is related to acts of self-harm and suicide. The issue of self-harm and suicide is strongly related to mental health and in particular the prevention of depression.
Road traffic Work-place School Sports Home, Leisure
Total of unintentional
injuries
Homicide, assault
Suicide, self-harm
Total of all injuries
Fatalites 50 53020%
6 0802%
122 46048%
179 07070%
5 5402%
58 94023%
255 850100%
Hospital admissions
1 000 00014%
300 0004%
100 0001%
600 0008%
4 500 00063%
6 500 00090%
300 0004%
400 0006%
7 200 000100%
Hospital outpatients
3 300 0009%
3 200 0009%
600 0002%
5 200 00015%
20 800 00060%
33 100 00095%
1 500 0004%
200 0001%
34 800 000100%
All hospital patients
4 300 00010%
3 500 0008%
700 0002%
5 800 00014%
25 300 00060%
39 600 00094%
1 800 0004%
600 0001%
42 000 000100%
Other medical
treatment1 900 000 1 500 000 300 000 2 600 000 11 200 000 17 500 000 800 000 300 000 18 600 000
All medical treatment 6 200 000 5 000 000 1 000 000 8 400 000 36 500 000 57 100 000 2 600 000 900 000 60 600 000
Table 1: Comprehensive view on injuries by responsible prevention domain
EU Key figuresTable 1 depicts the key figures of the main unintentional and intentional injury domains and injury outcomes in which the hotspots have been identified. This “comprehensive view of injuries” provides a common view for the stakeholders of each domain and indicates possible synergies between sectors. Some of the main results of the “comprehensive view of injuries” are listed below:
Unintentional injuries are responsible for about three-quarters of all injury deaths and intentional injuries for about one-quarter.
Suicide and road injuries account for the highest number of fatalities, both in absolute and relative terms (in relation to the number of hospital treated injuries).
About 70% of all injuries in the EU are treated in hospitals making them an important setting for injury surveillance.
With 74% of all hospital treated injuries, home, leisure and sports is by far the biggest domain, but in contrast to road and work-place it provides the lowest insurance cover for its victims [3] .
The EU IDB estimates that road injuries account for 10% of all hospital treated injuries or a total of 4.3 million victims annually. This indicates a significant underreporting of the problem in official road traffic statistics by the police.
Home, leisure and sports
injuries account for
74% of all hospital treated
injuries
Source: WHO MDB, WHO HFA-DB, Eurostat HDR, EU IDB AI. See Annex 2 “List of figures and tables” for more details.

8
Source: WHO MDB, Eurostat COD. See Annex 2 “List of figures and tables” for more details.
Facts & impacts As well as being the number one cause of death in children, injuries and their disabling consequences have, in particular, a tremendous impact on health in this age group.
Fatal injuries More than 5 000 children die from injury each year in the EU leaving a legacy of sorrow and grief to their
parents, relatives and friends. Injury is the leading cause of childhood death in the EU, accounting for 32% of all deaths of children between
1 and 14 years of age (Figure 2). Five well known types of accidents – road traffic, drowning, falls (from height), fires and poisoning - account
for almost 60% of all fatal child injuries up to 14 years (Figure 2). These five main causes are known to be preventable (up to 90%) by appropriate measures, e.g. child restraint
systems, pool fencing, smoke alarms, window guards and child restraint packaging [4]. From the moment of birth, boys are at a higher risk of incurring a fatal injury than girls. Boys at the age of 14
are almost twice as much at risk of incurring a fatal injury than girls (Annex Figure 3). There are considerable differences in the injury fatality rates of children between EU member states. For
example, injury fatalities in children account for 22% of the total number of child deaths in the United Kingdom and a staggering 57% in Latvia. The important question to analyse is to what extent these national inequalities are attributable to the lack of respective measures, as the ones mentioned above? Conventional wisdom would indicate that the potential for injury reduction in the high range countries would be huge!
More � Annex 1: Injury Mortality and Morbidity in the EU-27 member states
Figure 2: Leading causes of death and causes of fatal injuries in children up to 14 years
HOTSPOT
CHILDREN
Behind the numbersFügen, Austria; August 2009 – „A three-year old girl is lucky to be alive after falling into a swimming pool at a campsite resort in Fügen, in the western part of Austria. The three-year old girl was on holiday with her family from the Netherlands when she fell into a 1.4 meter deep pool and was rescued by another swimmer who dragged her out of the water. The girl was unconscious and no longer breathing. The father managed to resuscitate his daughter and she was then flown immediately to hospital. According to information from the doctors treating the child her condition was “quite good, given the circumstances of the incident and she is recovering well. Judging from her current state of recovery the doctors do not expect any permanent damage to her brain. She should be able to leave the hospital in two or three days. The young Dutch girl had “enormous luck,” the responsible physician reported to the Austrian Press Agency.
33%
12%
5%4%
4%
4%
3%
33%Road traffic injuries
Drowning
Interpersonal violenceFalls
Self-inflicted
Fires
Poisoning
Other causes
Rankorder
Cause of death Children 1-14 years ICD-10 Code
% of all causes
of death
1 External causes of morbidity and mortality (V01-Y89) 32%
2 Malignant neoplasms (C00-C97) 18%
3Congenital malformations, deformations and chromosomal abnormalities (Q00-Q99)
10%
4 Diseases of the nervous system and the sense organs (G00-H95) 10%
5 Diseases of the respiratory system (J00-J99) 6%
1Rank order of injuries
as cause of death in
children in the EU.*
*Children 1-14 years of age
9
INJURIES IN THE EUROPEAN UNION
Figure 15: Hospital treated cases of interpersonal violence by context of assault (a); age (b) and sex of victim (c).
A B
C
Source: EU IDB AI. See Annex 2 “List of figures and tables” for more details.
0%
10%
20%
30%
40%
50%
60%
70%
80%
90%
100%
0-4 5-9 10-14
Other places
Countryside
Recreational area, culturalarea, or public building
School, educational area
Public highway, street or road
Sports and athletics area
Home
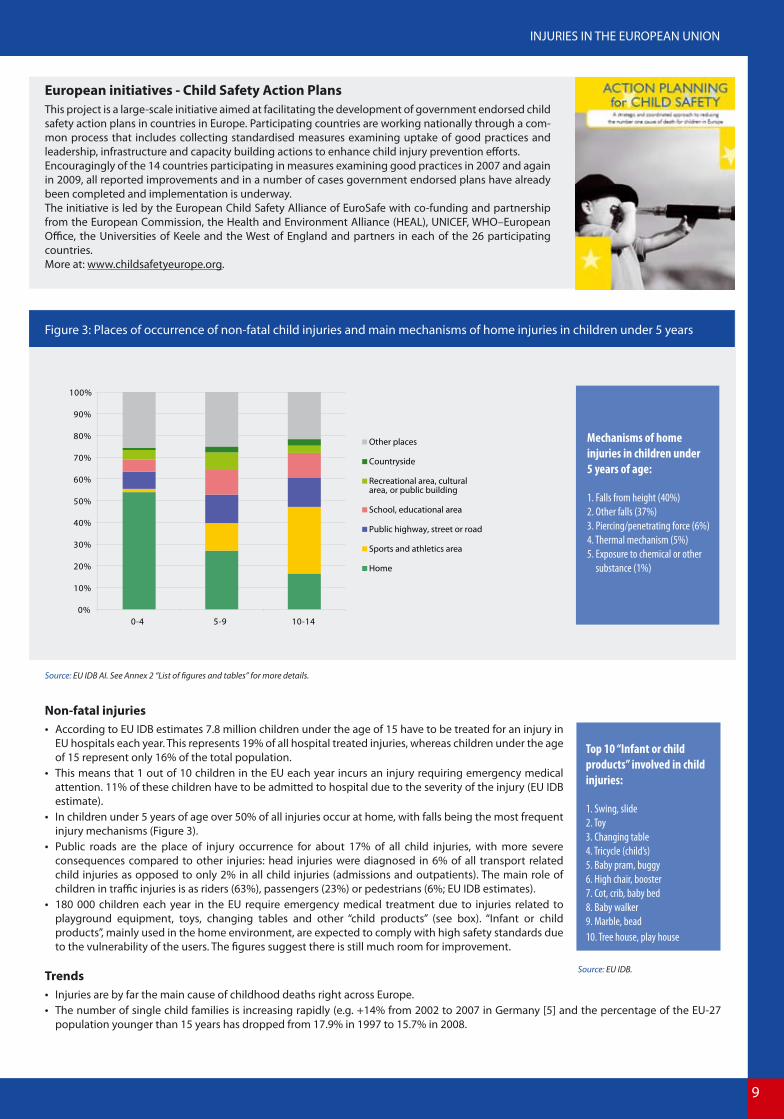
Figure 3: Places of occurrence of non-fatal child injuries and main mechanisms of home injuries in children under 5 years
European initiatives - Child Safety Action PlansThis project is a large-scale initiative aimed at facilitating the development of government endorsed child safety action plans in countries in Europe. Participating countries are working nationally through a com-mon process that includes collecting standardised measures examining uptake of good practices and leadership, infrastructure and capacity building actions to enhance child injury prevention efforts. Encouragingly of the 14 countries participating in measures examining good practices in 2007 and again in 2009, all reported improvements and in a number of cases government endorsed plans have already been completed and implementation is underway. The initiative is led by the European Child Safety Alliance of EuroSafe with co-funding and partnership from the European Commission, the Health and Environment Alliance (HEAL), UNICEF, WHO–European Office, the Universities of Keele and the West of England and partners in each of the 26 participating countries. More at: www.childsafetyeurope.org.
Mechanisms of home
injuries in children under
5 years of age:
1. Falls from height (40%)
2. Other falls (37%)
3. Piercing/penetrating force (6%)
4. Thermal mechanism (5%)
5. Exposure to chemical or other
substance (1%)
Non-fatal injuries According to EU IDB estimates 7.8 million children under the age of 15 have to be treated for an injury in
EU hospitals each year. This represents 19% of all hospital treated injuries, whereas children under the age of 15 represent only 16% of the total population.
This means that 1 out of 10 children in the EU each year incurs an injury requiring emergency medical attention. 11% of these children have to be admitted to hospital due to the severity of the injury (EU IDB estimate).
In children under 5 years of age over 50% of all injuries occur at home, with falls being the most frequent injury mechanisms (Figure 3).
Public roads are the place of injury occurrence for about 17% of all child injuries, with more severe consequences compared to other injuries: head injuries were diagnosed in 6% of all transport related child injuries as opposed to only 2% in all child injuries (admissions and outpatients). The main role of children in traffic injuries is as riders (63%), passengers (23%) or pedestrians (6%; EU IDB estimates).
180 000 children each year in the EU require emergency medical treatment due to injuries related to playground equipment, toys, changing tables and other “child products” (see box). “Infant or child products”, mainly used in the home environment, are expected to comply with high safety standards due to the vulnerability of the users. The figures suggest there is still much room for improvement.
Trends Injuries are by far the main cause of childhood deaths right across Europe. The number of single child families is increasing rapidly (e.g. +14% from 2002 to 2007 in Germany [5] and the percentage of the EU-27
population younger than 15 years has dropped from 17.9% in 1997 to 15.7% in 2008.
Top 10 “Infant or child
products” involved in child
injuries:
1. Swing, slide
2. Toy
3. Changing table
4. Tricycle (child’s)
5. Baby pram, buggy
6. High chair, booster
7. Cot, crib, baby bed
8. Baby walker
9. Marble, bead
10. Tree house, play house
Source: EU IDB.

10
Source: WHO MDB, Eurostat COD. See Annex 2 “List of figures and tables” for more details.
Figure 4: Leading causes of death and causes of fatal injuries in adolescents between 15–24 years
HOTSPOT
ADOLESCENTS
Behind the numbersManchester, England; June 2006. Peter, a 14-year old boy was out skating with his friends at the parking area of the nearby supermarket early one summer evening. As with most of his peers he was looking for-ward to the summer break. After one of the “slides” the kids were practicing, Peter with his skateboard strayed into the road. He was immediately struck by a motorist who was travelling at a significant speed. He suffered a fracture to the front of his skull and a severe brain injury. This resulted in him suffering from the partial loss of use of all of limbs and torso.Luckily, through his parents’ provisions, Peter was eligible for a programme of rehabilitation by special-ist professionals. Today, Peter has re-entered the education system and is preparing to take his Maths certificate, which before the support regime looked like a distant dream. He will remain in education until the age of 19. At this point his care plan will enable him to enter the disabled employment market and to live an independent and fulfilling life.
48%
20%
5%
3%
3%
2%
1%
18%Road traffic injuries
Self-inflicted
Poisoning
Drowning
Interpersonal Falls
Fires
Other causes
violence
Rankorder
Cause of death ICD-10 Code
% of all causes
of death
1 External causes of morbidity and mortality (V01-Y89)
64%
2 Malignant neoplasms (C00-C97) 9%
3 Diseases of the circulatory system (I00-I99) 5%
4 Diseases of the nervous system and the sense organs (G00-H95) 5%
5
Symptoms, signs and abnormal clinical and laboratory findings, not elsewhere classified (R00-R99)
5%
Facts & impacts Just as for children, injuries among adolescents also leave an enormous trail of devastation and disability behind. Due to additional risks emerging in this phase of life, such as active participation in motor vehicle traffic and in the work-place, injury rates climax between the age of 15 and 24 and are by far the number one killer in this age group.
Fatal injuries Annually, the lives of more than 20 000 young people between 15 and 24 years of age are wiped out by
injuries. Statistically, this translates to 50 deaths per 100 000 or 1 death per 2 000 adolescents. These dramatic statistics make injury the leading cause of death among adolescents, accounting for 64% of
all deaths in this age group (relative injury mortality). The risk of a fatal injury skyrockets after the age of 14, especially for boys, and leads to a relative injury
mortality rate of 70% in males between 20 to 24 years of age (Figure Annex 3). Two main causes account for almost 70% of all fatal injuries among adolescents: road injuries (48%) and
suicides (20%; Figure 4). For both causes the rates per 100 000 adolescents are approximately 3 to 4 times higher for boys (road: 28, suicide: 12) than for girls (road: 8, suicide: 3).
Poisoning, mainly through drugs, ranks third on the cause of death list for adolescents. The share of 5%, representing almost 1 000 victims annually, only reflects “accidental poisonings” (in many cases a sober statistical denomination for “drug overdose”), and not the deaths of drug addicts that are often classified under the categories for “mental and behavioral disorders” of the WHO ICD-10 cause of death catalogue [6].
There are considerable differences between countries in the injury fatality rates for adolescents. E.g., injury in young people accounts for 54% of the total number of deaths in the Netherlands in this age group while in Estonia it is the cause of 76% of fatalities in this group.
More � Annex 1: Injury Mortality and Morbidity in the EU-27 member states
70%Percentage of deaths
among adolescent
boys in the EU that are
caused by injuries.*
*Adolescents
between 15 and 24 years of age

11
INJURIES IN THE EUROPEAN UNION
Figure 15: Hospital treated cases of interpersonal violence by context of assault (a); age (b) and sex of victim (c).
A B
C
Source: EU IDB AI. See Annex 2 “List of figures and tables” for more details.
Figure 5: Injury rates of adolescents between 15-24 by injury prevention domain and sex
EU Initiatives – AdRisk: „take a split second“Injury control policies based on legislation and regulations have significantly contributed to reducing the number of injuries of young people in the last decades. However, new approaches are required to address the main determinant of injuries among young people: their risk-taking behaviour. Young people’s interest in exploring new challenges does not have to lead to serious injury. Challenges can still be explored and limits tested without risking life.The EC DG Sanco funded project “European action on adolescents and injury risk” (AdRisk) has developed tools to support young people in improving their risk competencies. E.g. the “Split the Risk” tools and videos are helping young people to become aware of moments of increased risk in their life. The second in which a young person decides whether or not to take a certain risk is at the heart of the AdRisk message “a split second can change your life”.Please find the toolbox with information on how to develop safety promotion projects with adolescents at: www.adrisk.eu.com/.
10
20
30
40
50
60
70
80
Road traffic Paid work School(education)
Sports Home &leisure
Interpersonalviolence
Intentionalself-harm
Hos
pita
l tre
ated
inju
ries
per 1
000
inha
bita
nts Male
Female
Non-fatal injuries According to EU IDB estimates each year 8.4 million adolescents between 15 and 24 years of age have
to be treated for an injury in EU hospitals. This represents 20% of all hospital treated injuries, whereas adolescents only represent 13% of the total EU population.
The rate of hospital treated injuries in young people is highest in the domains of “home & leisure” and sports injuries, with a significantly higher rate for men (Figure 5).
For men, the rates for road injuries, traffic, paid work and assault are all in the range of 15-25 injuries per 1 000. The boxes to the right provide some additional details about road and sport injuries of young people as available in the EU IDB.
For some injuries the significant differences between boys and girls reflect behavioral preferences leading to different exposure patterns. In sports, for instance, this has been confirmed by various opinion polls: there are clearly more European boys than girls practicing sport (63% compared to 37%; [7]).
In traffic injuries, different risk taking behaviors seem be more relevant for explaining sex differences in injury numbers, as the rate of young motor drivers is about the same in young men as in women.
The share of intentional injuries in adolescents is about 10% for both sexes, however, the share of self-harm and assault in young women is almost the same, whereas in young men there are many more injuries through assault than through self-harm (Figure 5).
Trends Since 1997 the percentage of the population between 15 and 24 years has dropped from 13.6% to 12.4%
in 2008. In 2030 Europe will have 18 million less children and young people than today [8].
Mode of transport of
adolescents (15 -24)
involved in road injuries
(% of all road injuries in this
age group):
34% 4W motor vehicle
30% Pedal cycle
26% 2W motor vehicle
5% Pedestrian
Injury ranking of ball team
sports in adolescents
(15- 24; % of all ball team
sports in this age group):
73% Soccer
10% Basketball
6% Volleyball
4% Handball
Source: EU IDB.

12
Source: WHO MDB. See Annex 2 “List of figures and tables” for more details.
0 5 10 15 20 25 30 35
Falls
Self-inflicted
Road traffic
Drowning
Poisoning
Fires
Fatal injuries per 100 000 inhabitants
F emaleMale
Figure 6: Fatal injuries amongst older people (60+) by causes of death and sex
HOTSPOT
OLDER PEOPLE
Behind the numbersParis, France; August 2008. Shirley, 79, broke her hip last August when she tripped on an uneven pave-ment on the way to an exhibition. “It hurt so much that I knew I had fractured something,” said the Paris, Orly, resident. “When I tried to move, it was just overwhelming pain.” Her friend credits her determina-tion as behind her making a full recovery. “It’s all about the positive mental attitude. You have to think that you’re going to walk again and push yourself to walk again,” she said. The hospital stay for her was only one week. At home, only short-term changes in living arrangements had to be made and she almost fully recovered. Not all cases of hip fractures end so well: Many seniors recovering from a broken hip need assistance with activities of daily living. At least 1 in 5 people still need increased care more than a year after the fracture [9]. Reported rates of death after a hip fracture range from 12% to 36% within one year after the incident. We must also not forget the financial burden related to health and social care costs and related expenses which result from such injuries.
29%
16%
11%2%
2%2%
1%
37%
Falls
Self-inflicted
Road traffic injuriesPoisoning
DrowningFires
Interpersonal violence
Other Causes
Facts & impacts The highest mortality rates due to injury relate to people at age 60 and above, falls being a major cause of these deaths. In particular fall-injuries also account for a higher than average hospitalisation rate and an excess share in the direct medical cost due to injuries in this age group. Also, a “senescent” Europe calls for increased efforts in injury prevention for the older people as indicated by the following figures and trends:
Fatal injuries Annually, 120 000 people in the EU aged 60 and above die from the consequences of injuries. Whereas this
statistic only represents 3% of all deaths in this age group, the burden of treatment, rehabilitation and care that is often triggered by an injury is enormous, both for society and the respective families (see section “non-fatal injuries”).
The injury fatality rates (per 100 000) rise sharply after the age of 70 for both women (from 50 to 150 in the age group 80 to 85) and men (from 100 to 250; Figure Annex 3).
Falls are the main causes (29%) of fatal injuries among older people, in particular for women. Suicides (16%) and road traffic (11%) rank second and third (Figure 6).
Also in the senior population differences exist in injury fatality between the EU member states - e. g. the share of injury deaths to all deaths of people above 65 years of age ranges from 1% in Greece to 5% in France).
Non-Fatal injuries According to EU IDB estimates a hospital contact for an injury is required by 70 out of 1 000 people over the age of 59 annually; the rate is
twice as high for women (96 per 1 000) than for men (48) and it increases dramatically for women in their seventies and above. The total of older people (60 plus years of age) that have to be treated for an injury in EU hospitals is estimated to be 7.8 million each year
(EU IDB estimates).More � Annex 1: Injury Mortality and Morbidity in the EU-27 member states
82%The percentage of
victims of fatal fall
injuries that are
60 years and older.
13
INJURIES IN THE EUROPEAN UNION
Figure 15: Hospital treated cases of interpersonal violence by context of assault (a); age (b) and sex of victim (c).
A B
C
Source: EU IDB AI. See Annex 2 “List of figures and tables” for more details.
Home 59%
Transport area: public highway, street or road 20%
Commercial area (non-recreational) 2%
Residential institution 6%
Countryside 3%
Other specified place of of occurence 10%
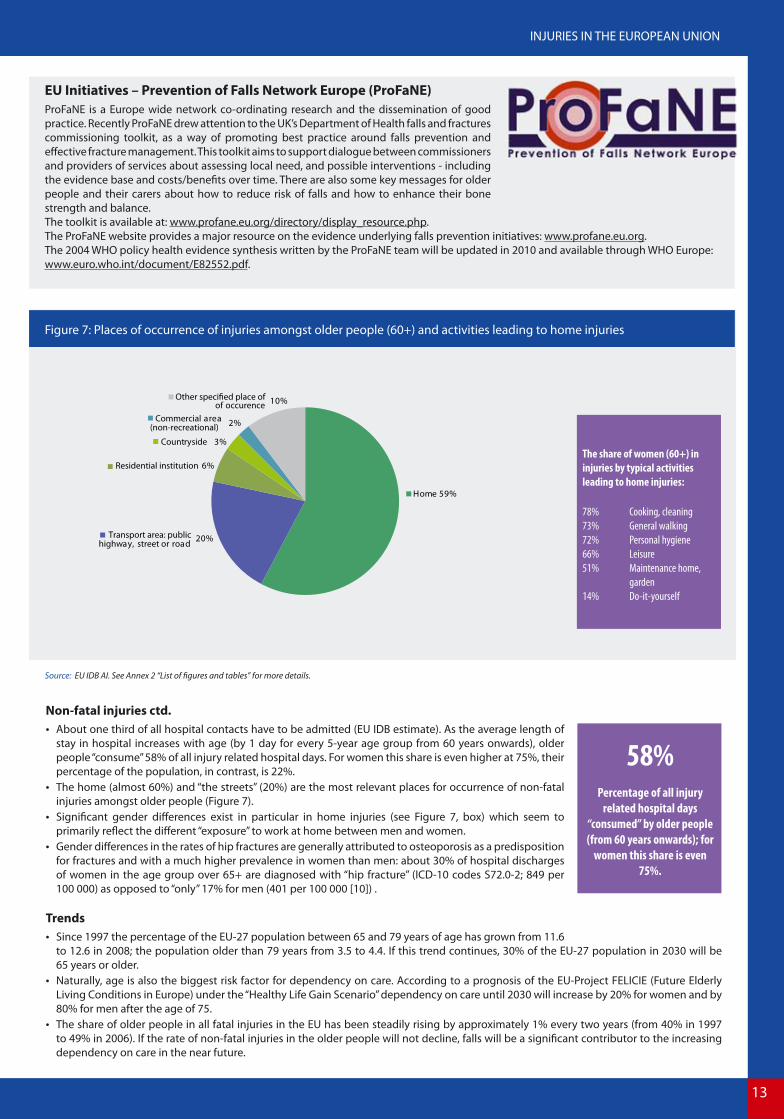
Figure 7: Places of occurrence of injuries amongst older people (60+) and activities leading to home injuries
EU Initiatives – Prevention of Falls Network Europe (ProFaNE)ProFaNE is a Europe wide network co-ordinating research and the dissemination of good practice. Recently ProFaNE drew attention to the UK’s Department of Health falls and fractures commissioning toolkit, as a way of promoting best practice around falls prevention and effective fracture management. This toolkit aims to support dialogue between commissioners and providers of services about assessing local need, and possible interventions - including the evidence base and costs/benefits over time. There are also some key messages for older people and their carers about how to reduce risk of falls and how to enhance their bone strength and balance. The toolkit is available at: www.profane.eu.org/directory/display_resource.php.The ProFaNE website provides a major resource on the evidence underlying falls prevention initiatives: www.profane.eu.org. The 2004 WHO policy health evidence synthesis written by the ProFaNE team will be updated in 2010 and available through WHO Europe: www.euro.who.int/document/E82552.pdf.
The share of women (60+) in
injuries by typical activities
leading to home injuries:
78% Cooking, cleaning
73% General walking
72% Personal hygiene
66% Leisure
51% Maintenance home,
garden
14% Do-it-yourself
Non-fatal injuries ctd. About one third of all hospital contacts have to be admitted (EU IDB estimate). As the average length of
stay in hospital increases with age (by 1 day for every 5-year age group from 60 years onwards), older people “consume” 58% of all injury related hospital days. For women this share is even higher at 75%, their percentage of the population, in contrast, is 22%.
The home (almost 60%) and “the streets” (20%) are the most relevant places for occurrence of non-fatal injuries amongst older people (Figure 7).
Significant gender differences exist in particular in home injuries (see Figure 7, box) which seem to primarily reflect the different “exposure” to work at home between men and women.
Gender differences in the rates of hip fractures are generally attributed to osteoporosis as a predisposition for fractures and with a much higher prevalence in women than men: about 30% of hospital discharges of women in the age group over 65+ are diagnosed with “hip fracture” (ICD-10 codes S72.0-2; 849 per 100 000) as opposed to “only” 17% for men (401 per 100 000 [10]) .
Trends Since 1997 the percentage of the EU-27 population between 65 and 79 years of age has grown from 11.6
to 12.6 in 2008; the population older than 79 years from 3.5 to 4.4. If this trend continues, 30% of the EU-27 population in 2030 will be 65 years or older.
Naturally, age is also the biggest risk factor for dependency on care. According to a prognosis of the EU-Project FELICIE (Future Elderly Living Conditions in Europe) under the “Healthy Life Gain Scenario” dependency on care until 2030 will increase by 20% for women and by 80% for men after the age of 75.
The share of older people in all fatal injuries in the EU has been steadily rising by approximately 1% every two years (from 40% in 1997 to 49% in 2006). If the rate of non-fatal injuries in the older people will not decline, falls will be a significant contributor to the increasing dependency on care in the near future.
58%Percentage of all injury
related hospital days
“consumed” by older people
(from 60 years onwards); for
women this share is even
75%.
14
Source: WHO MDB. See Annex 2 “List of figures and tables” for more details.
19%
6%
9%
66%
Pedestrian
Pedal cycle
Motor cycle
Other roadtransport
0%
5%
10%
15%
20%
25%
30%
35%
40%
Fran
ceCy
prus
Net
herla
nds
Italy
Luxe
mbo
urg
Swed
enFi
nlan
dA
ustr
iaG
erm
any
Rom
ania
Den
mar
kSp
ain
EU-2
7Ire
land
Uni
ted
King
dom
Mal
taCz
ech
Repu
blic
Hun
gary
Pola
ndLi
thua
nia
PedestrianPedal cycleMotor cycle
0% 10% 20% 30% 40% 50% 60% 70% 80% 90% 100%
Motor cycle
Pedal cycle
Pedestrian
0 to 14 15 to 24 25 to 59 60+
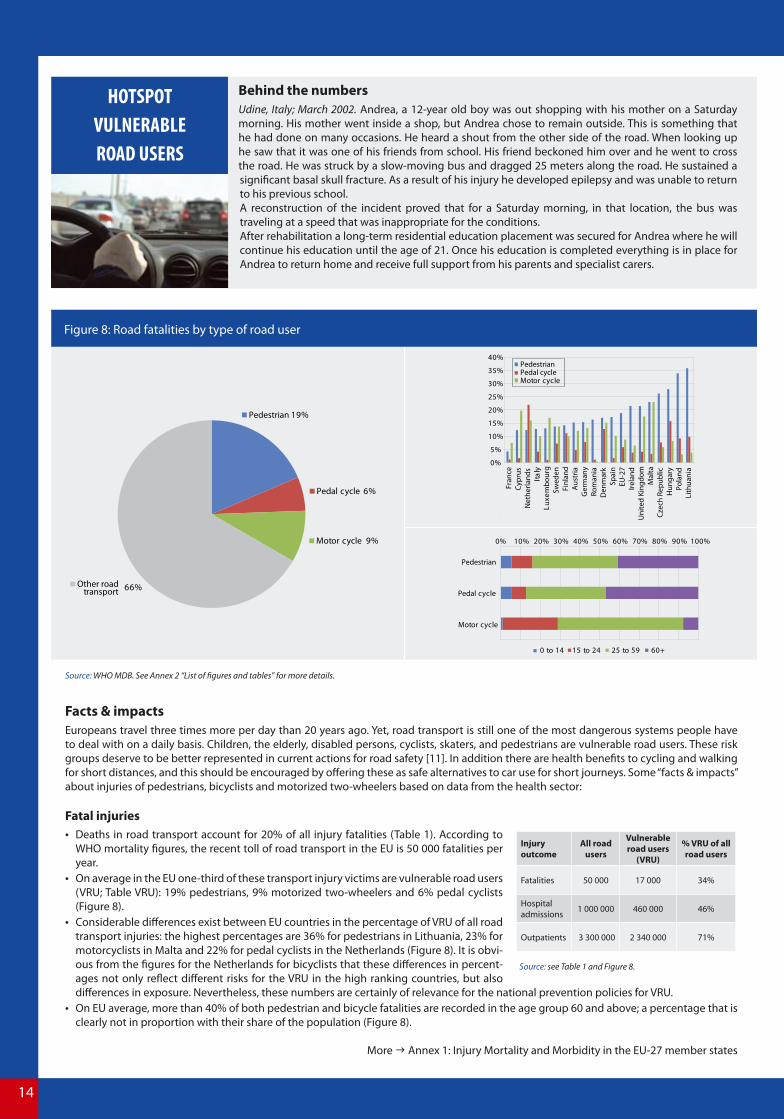
Figure 8: Road fatalities by type of road user
Behind the numbersUdine, Italy; March 2002. Andrea, a 12-year old boy was out shopping with his mother on a Saturday morning. His mother went inside a shop, but Andrea chose to remain outside. This is something that he had done on many occasions. He heard a shout from the other side of the road. When looking up he saw that it was one of his friends from school. His friend beckoned him over and he went to cross the road. He was struck by a slow-moving bus and dragged 25 meters along the road. He sustained a significant basal skull fracture. As a result of his injury he developed epilepsy and was unable to return to his previous school. A reconstruction of the incident proved that for a Saturday morning, in that location, the bus was traveling at a speed that was inappropriate for the conditions. After rehabilitation a long-term residential education placement was secured for Andrea where he will continue his education until the age of 21. Once his education is completed everything is in place for Andrea to return home and receive full support from his parents and specialist carers.
HOTSPOT
VULNERABLE
ROAD USERS
Facts & impacts Europeans travel three times more per day than 20 years ago. Yet, road transport is still one of the most dangerous systems people have to deal with on a daily basis. Children, the elderly, disabled persons, cyclists, skaters, and pedestrians are vulnerable road users. These risk groups deserve to be better represented in current actions for road safety [11]. In addition there are health benefits to cycling and walking for short distances, and this should be encouraged by offering these as safe alternatives to car use for short journeys. Some “facts & impacts” about injuries of pedestrians, bicyclists and motorized two-wheelers based on data from the health sector:
Fatal injuries Deaths in road transport account for 20% of all injury fatalities (Table 1). According to
WHO mortality figures, the recent toll of road transport in the EU is 50 000 fatalities per year.
On average in the EU one-third of these transport injury victims are vulnerable road users (VRU; Table VRU): 19% pedestrians, 9% motorized two-wheelers and 6% pedal cyclists (Figure 8).
Considerable differences exist between EU countries in the percentage of VRU of all road transport injuries: the highest percentages are 36% for pedestrians in Lithuania, 23% for motorcyclists in Malta and 22% for pedal cyclists in the Netherlands (Figure 8). It is obvi-ous from the figures for the Netherlands for bicyclists that these differences in percent-ages not only reflect different risks for the VRU in the high ranking countries, but also differences in exposure. Nevertheless, these numbers are certainly of relevance for the national prevention policies for VRU.
On EU average, more than 40% of both pedestrian and bicycle fatalities are recorded in the age group 60 and above; a percentage that is clearly not in proportion with their share of the population (Figure 8).
More � Annex 1: Injury Mortality and Morbidity in the EU-27 member states
Injury outcome
All road users
Vulnerable road users
(VRU)
% VRU of all road users
Fatalities 50 000 17 000 34%
Hospital admissions 1 000 000 460 000 46%
Outpatients 3 300 000 2 340 000 71%
Source: see Table 1 and Figure 8.

15
INJURIES IN THE EUROPEAN UNION
Figure 15: Hospital treated cases of interpersonal violence by context of assault (a); age (b) and sex of victim (c).
A B
C
Source: EU IDB AI. See Annex 2 “List of figures and tables” for more details.
Pedal cycle 30%
Two-wheeled motor vehicle 16%
Pedestrian 9%
Motor vehicle, four or more wheels 43%
Other modes of transport 2%
Figure 9: Non-fatal road injuries by type of road user and body part injured
EU Initiatives - The Road Safety Performance Index The European Transport Safety Council’s (ETSC) Road Safety Performance Index (PIN) is a new policy instrument to help EU member states in improving road safety. By comparing member states’ performance, it serves to identify and promote Best Practice in Europe and bring about the kind of political leadership that is needed to create a road transport system that offers a maximum of safety. The Index covers all relevant areas of road safety including road user behaviour, infrastructure and vehicles, as as well as road safety policymaking more generally. With particular relevance for vulnerable road users, a Road Safety PIN Flash on serious injuries was published on the 12th November 2009 in conjunction with the World Day of Remembrance for Road Traffic Victims. ETSC is calling governments and EU to include challenging targets for the reduction in serious injuries alongside a target for continued reduction in deaths. Download the Road Safety PIN Flash at: www.etsc.eu/PIN-publications.php.
0% 20% 40% 60% 80% 100%
Pedestrian
Pedal cycle
Two-wheeledmotor vehicle
Motor vehicle,four or more
wheels
Head Neck, throat T runkUpper extremities Lower extremities Multiple Other body part body parts
Non-fatal injuries According to EU IDB estimates 4.3 million road injuries per year have to be treated in EU hospitals (Table 1 and
“Table VRU”). On average in the EU about two-thirds of these road injury victims are vulnerable road users (Table VRU,
hospital admissions and outpatients): 9% pedestrians, 16% motorized two-wheelers, 30% pedal cyclists (Figure 9).
Medical sector based data can serve as a complementary source to police records in particular for an improved assessment of injury severity, e. g. through indicators like the percentage of hospital admissions, the average number of hospital bed days, nature and type of body part injured, and potentially also long term consequences (disabilities [12]).
The indicator “percentage of head injuries” among traffic injury victims admitted to hospital, for example, is highest for pedal cyclists (about 40%; Figure 9).
Trends Despite declining rates of road traffic deaths the percentage of VRU fatalities remains stable in most EU countries (WHO MDB).
40%Percentage of head injuries
among pedal cyclists admitted
to hospital after a traffic
accident.
Underreporting of traffic injuriesAccording to police records about 1.7 million road traffic users are injured in the EU each year, 1.4 million of which are slightly injured and 300 000 seriously injured [13]. However, compared to EU IDB based estimates of more than 4 million road traffic injuries, 1 000 000 of which have to be admitted to hospital (see Table 1), this seems to be a very conservative count, indicating a considerable under-reporting of road traffic injuries in police records. In particular, under-reporting in police records has been shown to be relatively high for pedestrians (by a factor of 1.35 for serious injuries up to 2.4 for slight injuries) and cyclists without any counterpart involved (by a factor of 3.75 up to 8 for serious and slight injuries, respectively [14]).

16
Source: WHO MDB. See Annex 2 “List of figures and tables” for more details.
35%
6%
5%
4%4%3%
43%
Fire, smoke
Electric current
Objects, machinery, tools
Choking, ingestions of objectsSuffocation, strangulation in bedHot water, fuids , objects
Other causes, home
Figure 10: Product and non-product related causes of fatal home injuries
HOTSPOT
PRODUCT AND SERVICES
RELATED ACCIDENTS
Behind the numbersBudapest, Ferencvaros, September 2008. At about 4 in the morning, a woman was woken by the sound of fire in her home. She went to investigate and noticed smoke coming from beneath the closed door of her mother’s bedroom. She opened the door to find her mother face down on the floor, hitting the floor with her arms which were on fire. Because of the extent of the burns to the arms, the woman was unable to gain a firm hold of her mother and was only able to drag her to the nearby front door.The woman was treated for shock at the scene. Her mother was transported by ambulance to a nearby Medical Centre and later transferred to the Burns Unit at the St. Steven’s Hospital where she died two weeks later as a result of her injuries.Although the fire was largely contained in the bedroom in which it started, the rest of the house was extensively damaged by the smoke, heat and water. The examination of the scene revealed that the fire was started by the electric blanket on the mother’s bed that had overheated and ignited the bedding.
0% 10% 20% 30% 40% 50% 60% 70% 80% 90% 100%
Fire, smoke
Electric current
Objects, machinery,
Choking, ingestion
Suffocation, strangulation in bed
Hot water, fuids,
0 to 14 15 to 24 25 to 59 60+
objects
of objects
tools
Facts & impacts The European Community is ensuring high standards of non-food consumer products by a wide range of sectoral legislation and by the General Product Safety Directive (GPSD [15]). Nevertheless, accidents involving consumer products and services do occur.
Fatal injuriesFatal product related injuries cannot be readily retrieved from the national cause of death statistics. Here, injuries in private homes that are related to fire and other product related causes, like electricity, tools, machines, ingestion of objects or hot substances, have been aggregated and analysed:
Almost 60% of fatal “home injuries” (defined by ICD-10 place of occurrence code) are caused by mechanisms that are relevant for the product safety: e.g. fires, electric current, tools, or hot tap water (Figure 10).
The proportion of product safety relevant causes in “home injuries” translates to an estimate of 5 700 product related fatalities in the EU per year.
Older people (aged 60 and above) are disproportionately affected by injuries related to fires and also by hot water/fluids; small children on the other hand are disproportionately affected by accidental suffocation (Figure 10).
6% of fatalities in home fires are caused by ignition or melting of clothing, or highly flammable material.
Non-Fatal injuries Home and leisure accidents (HLA; including sports) are causing 74% of all hospital treated injuries in the EU (Table 1). According to Figure 11, about 50% of the HLA segment are related to products: e.g. floor tiles (included in category “Building, component,
fitting“), chainsaws (“Tool, machine“), Bunk bed (“Furniture“), or ride-on lawnmower, (“Mobile machinery“). Judging from the place of occurrence categories of the EU IDB (Figure 11), 17% of the “home, leisure and sports” injuries are estimated
to be potentially related to the provision of a service: e.g. injuries in homes for older people (category “Residential institution”), in public swimming pools ( “Sports area”), hotels/restaurant ( “Commercial area”), or amusement park (“Recreational area”).
5 700Number of product
related fatalities in the
EU per year.
Injuries in private homes with
product involvement.

17
INJURIES IN THE EUROPEAN UNION
Figure 15: Hospital treated cases of interpersonal violence by context of assault (a); age (b) and sex of victim (c).
A B
C
Source: EU IDB. See Annex 2 “List of figures and tables” for more details.
6%
6%
3%2%
2%1%
1%<1%
<1%
16%
10%
53%
Building, component, fittingEquipment in sports
Tool, machine, work-relatedFurniture/furnishing
Item mainly for personal use
Utensil or container
Infant or child product
Appliance, used in household
Hot object/substance
Fire, flame, smoke
Mobile machineryOther, less product safety relevant objects
Figure 11: Product an service related home and leisure injuries
EU Initiatives - RAPEX Guidelines for product safety risk assessmentMore than 90% of the risks arising from unsafe consumer products are related to accidents and injuries (as opposed to other health risks like allergies, cancer etc.). The consistent implementation of the EU General Product Safety Directive (GPSD) requires a coherent use of agreed criteria and tools for the as-sessment of the safety of consumer products. Guidance for such assessment is provided by the RAPEX guidelines. The RAPEX guidelines help to categorize and quantify the different steps that lead to an injury (“injury scenarios”), and to obtain risk estimates for certain injury scenarios. Main aspects of the assessment are the seriousness of the hazard that is intrinsic to the product and the probability to which the consumer is in practice injured by this hazard. Amongst other sources, the EU IDB provides valuable evidence for both of these aspects of risk assessment based on actual injury occurrence (see below: “Risk assessment with hospital emergency department data”). Read more at: http://ec.europa.eu/consumers/safety/committees/ra_guidelines_workshop11122007.
Residential institution 1%
Medical service area <1%
Sports and athletics area 11%
Recreational area, public building
Commercial area 3% (non-recreational)
Other places 83% (less service relevant)
2%
Risk assessment with hospital emergency department data According to the U.S. Consumer Product Safety Commission (CPSC) data from an emergency department system have proven to be the single most effective means for fulfilling the product safety data needs [16].
Just like CPSC’s NEISS, the U.S. emergency department based injury surveillance system, also the EU IDB provides the large number of incidents seen in hospital emergency departments needed to measure the number of injuries associated with the thousands of different consumer products in the marketplace. Although there are still deficits in data quality, timeliness and geographical coverage, the EU IDB set up and potential for producty safety is comparable to the U.S. model.
The table to the right gives an example of an injury scenario derived from the EU IDB data elements and narratives. Each of these “accident scenarios” can be further analysed by the demography of the victims and severity of injuries [17].This kind of analysis and EU IDB information can be requested from the Eurosafe Injury Data Services at http://www.eurosafe.eu.com or https://webgate.ec.europa.eu/idb/.
“Child bicycle” accident scenarios derived from EU IDB data %
Falling from bike because of fast, wild driving; sudden breaking 13
Colliding with another (moving) person/object 6
Falling over a bike that is lying somewhere on the floor 4
Falling from bike because of improper ground surfaces 3
Falling from bike because of inappropriate, broken material 2
Colliding with a bike which is driven by another person 2
Injured while cleaning/repairing the bike 2
Lack of practice 1
Total 100

18
Source: WHO MDB. See Annex 2 “List of figures and tables” for more details.
22%
19%
15%
15%
12%
7%
7%
3%Mountaineering, climbing
B icycling - non-traffic
Boating sports
Eqeustrian activities
Aero (non-motored) sports
Ice or snow sports
Ice or snow sports
Individual water sports (diving, jumping)
(avalanche)
0% 10% 20% 30% 40% 50% 60% 70% 80% 90% 100%
Mountaineering, climbing
B icycling - non-traffic
Boating sports
Equestrian activities
Aero (non-motored) sports
Ice or snow sports
Ice or snow sports(avalanche)
Individual water sports(diving, jumping)
0 to 14 15 to 24 25 to 59 60+
Figure 12: Fatal sports injuries by type of sports (excluding swimming) and age group
HOTSPOT
SPORTS INJURIES
Behind the numbersBrezovica, Slovenia; October 2009. A 14-year-old girl was injured on Thursday in a riding accident near Brezovica. She was flown by emergency helicopter to the State Hospital of Ljubljana. An eyewitness reported that the girl rode a warm-up lap at the site of a riding school when the horse suddenly reared throwing the girl from the saddle on to the ground. According to information from the spokesman of the State Hospital on Friday, the right leg of the girl was crushed and there was a risk of amputation that might be necessary as a result of the injury.
A number of celebrities have also suffered severe injuries or have even died as a result of horse-riding accidents. Actor, Christopher Reeve, better known as “Superman”, was paralysed in 1995 from the neck down following a fall from his horse while riding, and Cole Porter, the American composer and song-writer, was left in chronic pain and largely crippled after a horse-riding accident in 1937 in which his legs were crushed.
Facts & impacts The promotion of exercise is an essential strategy of health promotion in order to overcome the epidemic of obesity. However, a sizable proportion of these health gains are lost due to sport injuries, even fatal ones. As safety concerns are a factor in the decision to participate, injury is also a significant barrier to participation in sports. Unfortunately, coverage of sports injuries in official statistics is scarce. The following quotes from the WHO mortality database are meant only as broad estimates about the scope of fatal sports injuries. For non-fatal injuries results from the EU IDB, regarding the frequency and patterns of non-fatal sports injuries, are presented and complemented with results from the Eurobarometer in 2004 about general sports participation in the EU (see box).
Fatal injuries For a conservative estimate, about 6 in 1 000 unintentional fatal injuries can be related to broad categories
of sports, like rock climbing, boating sports, or horse related sports, as shown in Figure 12. These sports categories are derived from WHO ICD mortality codes like “Hang-glider accident” (aero sports), “Fall from cliff” (climbing), or “Fall involving ice-skates, skis” (ice or snow sports). This “lower rate” translates into an approximate estimate of 1 000 sports fatalities per year in the EU-27.
For a more general estimate, when certain types of drowning (in natural water and swimming pools) and non-traffic bicycle accidents are included, about 36 in 1 000 unintentional injuries can be related to recrea-tional and sports activities. This rate translates in to an approximate estimate of 7 000 fatalities per year in the EU-27 (with more than 80% of cases related to swimming and drowning).
Figure 12 illustrates that adolescents between 15 and 24 years of age are over-represented particularly in “Individual water sports” (mainly jumping into water) and “Ice or snow sports”, a fact that should be taken in to consideration for targeting injury prevention among adolescents (see also hotspot “Adolescents”).
The main target group for the prevention of drowning while swimming (in natural water and swimming pools), besides children of course, are people above the age of 60 who account for 30% of all swimming related fatalities (children 0-14: 7%; adolescents 15-24: 11%).
7 000Estimate of annual
fatalities in the EU-27
during sports and
recreational activities
like swimming and
non-traffic bicycle
accidents.

19
INJURIES IN THE EUROPEAN UNION
Figure 15: Hospital treated cases of interpersonal violence by context of assault (a); age (b) and sex of victim (c).
A B
C
Source: EU IDB. See Annex 2 “List of figures and tables” for more details.
0 500 1 000 1 500 2 000 2 500
Team ball sports
Gymnastics withappliances
Team bat or stick sports
Ice or snow sports
Equestrian activities
Wheeled non-motoredsports
Individual water sports
Combative sports
Racquet sports
Individual athletic activities
Estimated number of hospital treated injuries in the EU-27 (x 1 000)
Organized
Not-organized
Figure 13: EU-27 estimates of hospital treated sports injuries by type of sports, participation (organised / not organised) and share of head injuries
EU Initiatives - Safety in SportsRegular physical activity is essential for keeping fit and for staying in good health. How-ever participating in sports also carries a risk of being injured. Fortunately, there are many possibilities to prevent sports injuries, e. g. through making sports infrastructures safer, using protective equipment, or by training and coaching.Given the European dimension of sports, it is important to share EU Initiatives in practicing sports safely. “Safety in Sports”, co-financed by the European Commission, aims to share knowledge on the prevention of acute and overexertion sports injuries and to establish a sustain-able European network of experts from science, sports clubs and sports associations, and others with a keen interest in preventing sports injuries. In an exemplary approach safety management schemes and draft toolkits for injury prevention in handball and basketball will be developed. Read more and subscribe to updates on the latest news on safety in sports at: http://www.safetyinsports.eu/.
Non-fatal injuries Annually, about 4.5 million people aged 15 years and above have to be treated in hospital for a sports
injury as defined by the EU IDB catalogue of sports. Of those 25% of sports injuries affect the 15-24 old category (see also box for figures about “playing sports” for this age group).
When children under the age of 15 are included, the estimate is 5.8 million sports injuries annually (Table 1); thereof about 10% (or 0.6 million cases) have to be admitted for further treatment.
”Team ball sports” account for about 40% of all hospital treated sports injuries (Figure 13); by specific type of ball sports the ranking is: Soccer (74%), Basketball (8%), Volleyball (7%), Handball (3%).
The majority of sports injuries result form participation in non-organised sports according to the EU IDB records (Figure 13).
For most types of sports more men are injured than women (67% overall); notable exceptions are gymnastics (57% women) and horse riding (88% women). This of course reflects gender preferences in the types of sports.
The knowledge of the specific injury patterns for each type of sport is important to know in order to adequately address the issue of personal protection equipment in sports. The insert in Figure 13 ranks the main type of sports by their share of head injuries.
Trends The share of women injured in sports injuries has been steadily increasing in the last 10 years (from
26% in 1998 to 33% in 2007). It would be worthwhile to analyse this trend per individual type of sport in order to create a gender specific approach to sports injury prevention.
Playing sports in the EU
Almost 4 out of 10 Europeans aged 15
years and over participate in sport once
a week (170 out of 420 million).
Health improvement, e.g. against
obesity, is perceived to be the main
benefit of sport (by 8 out of 10 persons)
The main reasons for not participating in
any sport are lack of time (34%) and a
general dislike of sports (25%).
Men exercise more than women: 41% of
men interviewed claim they participate
in sport at least once a week, while the
proportion of women is 6 % less (35%).
While 60% of the 15-24 old category
participate in sport at least once a week,
the proportion decreases to only 28% for
the 55 + category.
Type of sportsShare of head injuries (of all injuries in this
type of sports)
Ice-Hockey 28%
Squash 28%
Swimming 25%
Boxing 21%
Ice skating/dancing 19%
Cycling 16%
Soccer 13%
Horseback riding 13%
Skiing 11%
Basketball 10%
Skateboarding 10%
Source: Eurobarometer.

20
Source: WHO MDB. See Annex 2 “List of figures and tables” for more details.
12%
15%
32%
2%
1%
Sharp object
Firearm discharge
Bodily force
Maltreatment, neglect
Chemical or noxious
Other or unknown means 19%
11% Blunt object
8% Hanging, strangulation, suffocation
substance 0,0
0,5
1,0
1,5
2,0
2,5
3,0
<1
1- 4 5-9
10-
1415
-19
20-2
425
-29
30-3
435
-39
40-4
445
-49
50-5
455
-59
60-6
465
-69
70-7
475
-79
80-8
485
+Inju
ry d
eath
s pe
r 100
000
inha
bita
nts
MaleFemale
0% 10% 20% 30% 40% 50% 60% 70% 80% 90% 100%
Sharp object
Firearm discharge
Bodily force
Blunt object
Hanging, strangulation,suffocation
Maltreatment, neglect
Chemical or noxioussubstance
0 to 14 15 to 24 25 to 59 60+
Figure 14: Fatalities through interpersonal violence by means of assault, sex and age group
HOTSPOT
INTERPERSONAL
VIOLENCE
Behind the numbersDebra grew up in a housing project in London. She saw a lot of violence as a child, but when she married she hoped for a better life. Unfortunately, Debra’s husband was a controlling man who often fought with her. He came home drunk one night and began punching her, striking her head several times. Ultimately Debra divorced her husband and moved to another city. She has tried five times to pass the exam for her GED (high school equivalency) certificate, but has found she has trouble learning and remembering. She has had frequent headaches, difficulty concentrating and solving problems. Like many people with a brain injury, Debra received no treatment following her first assault, and although she went to the emergency room after the second assault, she was never screened for a brain injury. When she finally learned that she had experienced a traumatic brain injury, she understood what was wrong with her. Debra is now part of a multicultural outreach program and plans to take the GED exam again soon, this time hoping for success.
Facts & impacts Interpersonal violence is an issue of growing public concern and includes domestic violence, child abuse, elder abuse and youth violence. Interpersonal violence takes many forms (physical, mental and sexual) and occurs in different environments (in the family, between intimate partners, in the community, in institutions and at work). It undermines the social and economic conditions in society. Addressing violence requires collaboration across all sectors, including health, education, labour, justice, and human rights. One role the public health sector can play is in making data available about violence related injuries from routine data systems.
Fatal injuries About 2% of all fatal injuries in the EU-27, or about 5 500 cases annually, that are recorded in the national
cause of death registers are related to homicide (Table 1; the World Health Organisation defines homicide as fatal injuries inflicted by another person with intent to injure or kill by any means).
The current homicide rate in the EU is highest in the Baltic region (above 8 per 100 000 in all three countries); among the other EU member states the rate ranges from to 2.9 in Bulgaria to 0.4 in the United Kingdom.
The average rate of homicide is 1.5 per 100 000 for males and 0.7 for females (the average for both sexes is 1.1). The peak in this rate for babies (under one year of age) of both sexes indicates the grave problem of fatal child abuse (“maltreatment” in Figure 14).
There is a sharp rise in the homicide rate for males between the age of 15 to 19 and a continuous rise for women at this age; a third peak can be observed in males at a much older age (80+, Figure 14).
The highest proportion of adolescent homicide victims (15 to 24 years) can be found in the categories “sharp objects” and “fire arm discharge” (Figure 14).
To improve the mortality data coverage, it would be useful to conduct queries and develop specific studies on homicides through other complementary data (police, media, etc.), and to better identify and code homi-cides [6].
100fatalities per year due
to abuse and neglect of
children younger than
one year in the EU.
A significant number of
child deaths resulting
from abuse or neglect,
however, may still not
be recorded as such
in the official death
certificates.
21
INJURIES IN THE EUROPEAN UNION
Figure 15: Hospital treated cases of interpersonal violence by context of assault (a); age (b) and sex of victim (c).
A B
C
Source: EU IDB AI. See Annex 2 “List of figures and tables” for more details.
Other criminal activity 1%
Drug-related incient <1%
Violent dispute 85%
Illegal acquisition 12%
Gang-related incident 1%Sexual assault 1%
0% 20% 40% 60% 80% 100%
Violent dispute
Illegal acquisition
Drug-related incident
Sexual assault
Gang-related incident
Other criminal activity
0 to 14 15 to 24 25 to 59 60+
0% 10% 20% 30% 40% 50% 60% 70% 80% 90% 100%
Violent dispute
Illegal acquisition
Gang-related incident
Sexual assault
Other criminal activity
Drug-related incident
Male Female
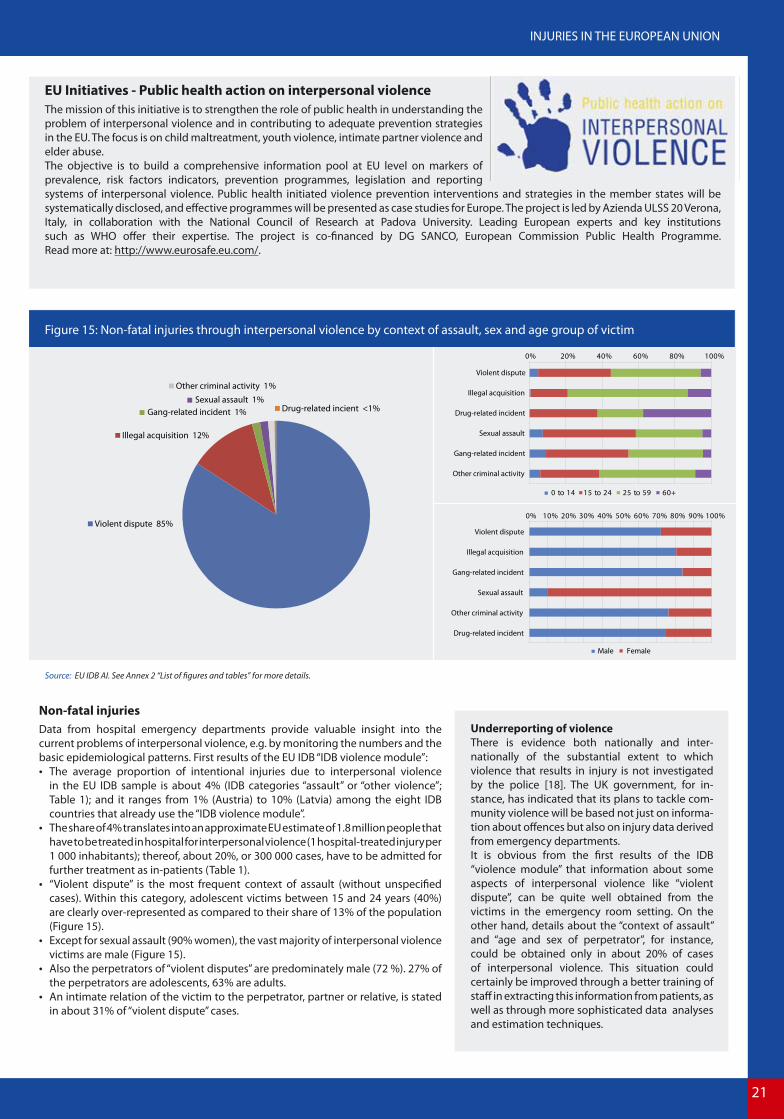
Figure 15: Non-fatal injuries through interpersonal violence by context of assault, sex and age group of victim
EU Initiatives - Public health action on interpersonal violenceThe mission of this initiative is to strengthen the role of public health in understanding the problem of interpersonal violence and in contributing to adequate prevention strategies in the EU. The focus is on child maltreatment, youth violence, intimate partner violence and elder abuse.The objective is to build a comprehensive information pool at EU level on markers of prevalence, risk factors indicators, prevention programmes, legislation and reporting systems of interpersonal violence. Public health initiated violence prevention interventions and strategies in the member states will be systematically disclosed, and effective programmes will be presented as case studies for Europe. The project is led by Azienda ULSS 20 Verona, Italy, in collaboration with the National Council of Research at Padova University. Leading European experts and key institutions such as WHO offer their expertise. The project is co-financed by DG SANCO, European Commission Public Health Programme. Read more at: http://www.eurosafe.eu.com/.
Non-fatal injuries Data from hospital emergency departments provide valuable insight into the current problems of interpersonal violence, e.g. by monitoring the numbers and the basic epidemiological patterns. First results of the EU IDB “IDB violence module”:
The average proportion of intentional injuries due to interpersonal violence in the EU IDB sample is about 4% (IDB categories “assault” or “other violence”; Table 1); and it ranges from 1% (Austria) to 10% (Latvia) among the eight IDB countries that already use the “IDB violence module”.
The share of 4% translates into an approximate EU estimate of 1.8 million people that have to be treated in hospital for interpersonal violence (1 hospital-treated injury per 1 000 inhabitants); thereof, about 20%, or 300 000 cases, have to be admitted for further treatment as in-patients (Table 1).
“Violent dispute” is the most frequent context of assault (without unspecified cases). Within this category, adolescent victims between 15 and 24 years (40%) are clearly over-represented as compared to their share of 13% of the population (Figure 15).
Except for sexual assault (90% women), the vast majority of interpersonal violence victims are male (Figure 15).
Also the perpetrators of “violent disputes” are predominately male (72 %). 27% of the perpetrators are adolescents, 63% are adults.
An intimate relation of the victim to the perpetrator, partner or relative, is stated in about 31% of “violent dispute” cases.
Underreporting of violenceThere is evidence both nationally and inter-nationally of the substantial extent to which violence that results in injury is not investigated by the police [18]. The UK government, for in-stance, has indicated that its plans to tackle com-munity violence will be based not just on informa-tion about offences but also on injury data derived from emergency departments. It is obvious from the first results of the IDB “violence module” that information about some aspects of interpersonal violence like “violent dispute”, can be quite well obtained from the victims in the emergency room setting. On the other hand, details about the “context of assault” and “age and sex of perpetrator”, for instance, could be obtained only in about 20% of cases of interpersonal violence. This situation could certainly be improved through a better training of staff in extracting this information from patients, as well as through more sophisticated data analyses and estimation techniques.

22
Source: WHO MDB. See Annex 2 “List of figures and tables” for more details.
56%
15%
8%
Hanging strangulation and suffocation
Intentionalself-poisoning
Firearm discharge 8%
Jumping from ahigh place
Other and unknown means 4%
Drowning and submersion 4%
Jumping or lying before moving object 3%
Sharp object 2%
0
10
20
30
40
50
60
70
Inju
ry d
eath
s pe
r 100
000
inha
bita
nts
15-1
920
-24
25-2
930
-34
35-3
940
-44
45-4
950
-54
55-5
960
-64
65-6
970
-74
75-7
980
-84
85+
0-4
5-9
10-
14
MaleFemale
0% 20% 40% 60% 80% 100% Hanging, strangulation and
suffocation
Intentional self-poisoning
Firearm discharge
Jumping from a high place
Drowning and submersion
Jumping or lying beforemoving object
Sharp object
Male Female
Figure 16: Suicides by means of self-harm, sex and age group
HOTSPOT
SUICIDE
AND SELF-HARM
Behind the numbers“Anger, and feeling the need to punish myself are the two biggest reasons I self injure. Growing up in my family I was taught that good little girls don’t get angry. I suppressed the anger for years, until I found an outlet with self-harm. When I cut it’s like opening up a valve and releasing the steam before it bursts. It instantly calms me down. If I don’t cut and end up showing my anger, I have to cut to punish myself for letting the anger out.”
Other common explanations self-injurers give for doing it, that may help understand the motivations behind self-injurious behavior, are: “It expresses emotional pain or feelings that I’m unable to put into words. It puts a punctuation mark on what I’m feeling on the inside!”; “It’s a way to have control over my body because I can’t control anything else in my life”; or “It instantly calms me, gives me a very real focus, and lets my mind settle.”Although self-injury as described here not always involves suicidal intent, it must be taken seriously in order to prevent repetition.
Facts & impacts An important cause of premature death and of hospitalisation is related to acts of self-harm and suicide. In the opinion of most suicide experts, more than 90% of suicide cases are the result of an unrecognised and untreated mental disorder such as depression or schizophrenia.
Fatal injuries Suicide in the EU is among the three leading causes of death in the age group 15-44 for both men and women. 23% of all fatal injuries, or almost 60 000 cases annually, recorded in the national cause of death registers in
the EU-27 are related to suicides (Table 1). The average rate of suicides is 19 per 100 000 for males and 6 for females (the average for both sexes
combined is 12 per 100 000; Figure 16) For both sexes the rate of suicides is steadily increasing up to the age of 50 to 54 years. While for women
there is only moderate increase in this rate after that age, for men there is a sharp rise again in suicides after the age of 65 years (Figure 16).
On average, the suicide rate in the EU member states is higher in most of the new member states, while southern EU countries together with the United Kingdom have the lowest suicide rates. The current suicide rate is highest in Lithuania and Slovenia. The lowest suicide rates were registered in Cyprus and Greece.
Marked sex differences exist in the choice of the methods of suicide (Figure 16).
Trends In recent years the average suicide rate in the EU has been steadily declining. However, the ageing of the population and the increased
risk of suicide with age are challenging this positive trend.
More � Annex 1: Injury Mortality and Morbidity in the EU-27 member states
60 000Number of suicides
commited in the
EU-27 every year.

23
INJURIES IN THE EUROPEAN UNION
Figure 15: Hospital treated cases of interpersonal violence by context of assault (a); age (b) and sex of victim (c).
A B
C
Source: EU IDB AI. See Annex 2 “List of figures and tables” for more details.
51%
32%
Psychological/psychiatric
condition
Conflict in relationship with family member,
partner or friend
Other specified proximal risk factor
Physical problem 5%
Legal system encounters 3%
Death of a relative, partner, or friend 1%
Income-related/financial problem 1%
Abuse 1%
6%
0% 10% 20% 30% 40% 50%
Exposure to chemicalsubstance
Piercing/penetrating force
Blunt force
Threat to breathing
Other mechanism
MaleFemale
0-14 15-24 25-59 60+ all ages0%
10%
20%
30%
40%
50%
60%
70%
MaleFemale
Figure 17: Non-fatal injuries through self-harm by risk-factor, sex and age group
EU Initiatives - Developing a state of the art intervention concept for the prevention of suicidalityOSPI-Europe - Optimised Suicide Prevention Programmes and their Implementation in Europe - aims to review and evaluate current strategies for suicide prevention in order to develop an optimised multifaceted suicide prevention intervention. This approach is supported by the European Community’s Seventh Framework Programme and will provide the first controlled cross-nationally comparable evaluation of a suicide prevention intervention in Europe.The multilevel OSPI-Europe concept was first developed by the Nuremburg Alliance Against Depression (NAD) and later expanded to other European countries through the European Alliance Against Depression (EAAD). The outcomes of OSPI-Europe will provide EU countries with clear guidelines, concrete materials and the instruments necessary to implement effective and efficient suicide prevention.For further information please contact the National Suicide Research Foundation in Cork, Ireland, at: http://www.nsrf.ie/.
Non-fatal injuries Data from hospital emergency departments provide additional insights in to the problem of self-injury and suicide attempt. For instance, by monitoring the numbers and the basic epidemiological patterns. First results of the EU IDB “intentional self-harm module”:
The share of intentional self-harm cases of all EU IDB cases is 1.4% (Table 1) and varies from 0.2% in Austria to 1.8% in the Netherlands. This proportion translates in to an approximate EU estimate of 600 000 people that have to be treated in hospital for intentional self-harm (1 hospital-treated injury per 1 000 inhabitants). A relatively high proportion of these cases (67% or 400 000 cases) has to be admitted for further treatment as in-patients.
More than 60% of self-harm victims are female; the respective share among adolescents is even higher than 70% (Figure 17).
According to the EU IDB, especially adolescents between 15 and 24 years of age (26%) are over-represented in the recorded cases as compared to their share of the population of only 13%.
Poisoning accounts for the vast majority of injuries diagnosed after intentional self-harm (60% in men and 70% women); the use of “piercing/penetrating force”, resulting in open wounds, ranks second among the injury. The latter type of injuries (open wounds) are more likely to be cases of “self-harm” rather than a suicidal act, a distinction which is not yet clearly feasible within the EU IDB “intentional self-harm module”.
“Psychological/psychiatric condition” and “conflict in relationships” are stated by the patients as the most recent crisis that led to the self-harm incident (so-called “proximal risk-factor”; Figure 17).
52 in 100 patients reported that there was a already previous episode of intentional self-harm.
The IDB intentional self-harm moduleThe first results of the IDB “intentional self-harm module” indicate the potential of this surveillance tool for obtaining broader evidence about the problem of self-injury and suicide attempt. Still, specific information about the “proximal risk-factor” and also “previous intentional self-harm”, for instance, could be obtained only in about 10% of cases of intentional self-harm. This is due to extreme care, sensitivity, and confidentiality that is required in extracting this information from patients. This situation could be improved if more attention was given to the sensitization and training of the persons who gather and document injury information on this issue.


25
INJURIES IN THE EUROPEAN UNION
HEALTH SECTOR: LEADERSHIP IN INJURY SURVEILLANCE
As evidenced by this third edition of “Injuries in the European Union”, accidents and injuries place a huge burden on societies and individuals within the EU-region. In addition to the enormous human costs in terms of premature death and years of life lived with disability, a substantial proportion of annual health care costs is related to injuries and European growth and prosperity is threatened as a result of lost productivity.
The idea of injury prevention is not new in the sense that all countries have laws and regulations in place that address at least some of the issues associated with injuries. However, in many countries these initiatives are fragmented and therefore often inadequate. For instance, the successes of alcohol policies in reducing road traffic injuries have not yet been transferred to other domains, such as in sports and leisure or at work, and road infrastructures have been primarily designed for increasing safety of motorised transportation while neglecting vulnerable road users such as pedestrians and bicyclists.
The significant differences in accident and injury rates between member states and within their populations also indicate that there is still great potential for reducing the burden of injuries in all countries. Therefore there is much room for improvement. The political responsibility for injury prevention is vested in diverse policy domains such as transport, social affairs, public health, justice and consumer protection. However, the health sector should play a leading role in injury data collection and coordinated injury surveillance. In particular, by reporting data on severe injuries that require medical treatment and on disabilities due to injuries. For making an accurate diagnosis and decision on treatment, it is essential to know the causes and the circumstances of the injury event and the consequent injury. Such information should be recorded in a systematic manner and on a routine basis in all relevant setting where health services are provided to victims of injury, in particular in pre-hospital care (emergency services) and in accident and emergency departments at hospitals.
At present, a number of EU member states are participating in a European exchange on injury data as reported in this report. The data is collected in samples of accident and emergency departments at general hospitals. The challenge today is to harvest the experiences gained over the past years and to work towards an EU-wide coverage of the IDB system. This requires a common set of standards as to case definition, representativeness, minimum level of data set to be collected and injury severity scoring protocol.
Considering the available information infrastructure in the health sector, and in particular in hospitals, it should be feasible to have a common hospital-based surveillance system for injury prevention in all member states by 2015, as part of the European Statistical System and, in particular, the Programme for Community Statistics on Public Health.
More specifically, such an EU-wide injury surveillance should:- cover all member states, including EEA and EU candidate countries (“EU33”) and collect minimum level injury data in all hospitals in
these countries (for admitted patients as well as out-patients);- include in each country reference hospitals for the routine collection of more detailed data on external causes and the
circumstances of the injury event, as well as the long term consequences.
Such a system should serve the needs of the main stakeholders (public health, consumer safety, safety practitioners) at the EU as well at the Member State level and should be mandatory by 2015 in the framework of the Regulation on Community statistics on public health and health and safety at work (OJ L 354/70, 31.12.2008).
The extent of fatal and non-fatal injuries varies from country to country. For every death, there are dozens of hospitalisations and hundreds of emergency department visits. A large proportion of people surviving their injuries incur temporary or permanent disabilities. In the light of this public health calamity, the health sector has a duty to do everything it can to prevent injuries in addition to providing emergency care and support for injury victims. If there is one thing the health sector can do to help tackle the injury calamity it is to comprehensively compile and disseminate injury data. In this respect, the health sector is uniquely positioned to provide evidence as to the magnitude and characteristics of the injury problem.This will then make it easier to advocate multisectoral prevention efforts, set priorities for action and harness political will and public support.
Etienne KrugDirector WHO-programme for Violence and Injury Prevention and Disability
Geneva, 9th November 2009

26
ANNEX 1: INJURY MORTALITY AND MORBIDITY IN THE EU-27
INJURY MORTALITY IN THE EUROPEAN UNION
ANNEX FIGURE 1 FATAL INJURIES IN THE EU-27 BY COUNTRY
ANNEX TABLE 1 FATAL INJURIES BY CAUSES OF DEATH IN THE EU-27: MINIMUM AND MAXIMUM VALUES
ANNEX FIGURE 2 FATAL INJURIES BY CAUSES OF DEATH IN THE EU-27
ANNEX FIGURE 3 FATAL INJURIES AND RELATIVE INJURY MORTALITY IN THE EU-27 BY SEX AND AGE GROUPS
ANNEX FIGURE 4 FATAL INJURY TRENDS IN THE EU-27 BY INJURY PREVENTION DOMAIN
INJURY MORBIDITY IN THE EUROPEAN UNION
ANNEX FIGURE 5 HOSPITAL DISCHARGES DUE TO INJURIES IN THE EU-27 BY COUNTRY
ANNEX FIGURE 6 NON-FATAL INJURIES PER 1 000 BY SEX AND AGE GROUP
ANNEX FIGURE 7 NON-FATAL INJURIES PER 1 000 BY INJURY PREVENTION DOMAIN AND AGE GROUP

27
ANNEX
Annex Figure 1: Fatal injuries in the EU-27 by country
CountryStandardised injury death
rate
Injury deaths in % of all
cases of deathLT 150.9 12.0%LV 126.0 9.4%EE 112.5 9.4%FI 68.8 8.9%
HU 65.1 6.2%SI 64.8 8.3%PL 61.2 6.8%RO 55.9 4.9%BE 54.4 6.2%SK 54.3 5.7%CZ 52.3 5.8%FR 47.9 7.2%LU 44.4 6.4%BG 44.4 3.4%AT 41.6 5.7%CY 41.3 6.6%PT 38.8 4.7%SE 38.5 5.2%DK 38.0 4.6%IT 33.5 4.6%IE 31.2 4.8%
GR 31.1 3.7%ES 29.8 4.3%DE 29.6 3.9%UK 28.4 3.5%MT 26.9 3.9%NL 26.4 3.9%
EU-27 41.4 5.1%
Standardised injury death rate per 100 000 inhabitants
< 5050-100> 100
Percentage of causes of death of fatal injuries - all ages
Self-inflicted Road traffic injuries Accidental falls Accidental
poisoning
Accidental drowning and
submersion
Interpersonal violence
Accidents caused by fire
and flamesOther causes
EU-27 average 23% 20% 17% 5% 3% 2% 2% 29%
Minimum 4.0% (CY) 9.6% (FI) 4.6% (BG) 0.8% (AT) 0.8% (BE) 1.2% (FR) 0.6% (SI) 11.7% (HU)
Maximum 31.7% (SI) 34.9% (CY) 37.5% (MT) 19.8% (FI) 8.5% (RO) 7.2% (EE) 8.1% (EE) 49.5% (BG)
Annex Table 1: Fatal injuries by causes of death in the EU-27: Minimum and maximum values by country
Source: Eurostat - causes of death (Eurostat COD) by region, standardised death rate (per 100 000 inhabitants) and absolute numbers. All causes of death (ICD-10; A00-Y89) and external causes of injury and poisoning (ICD-10; V01-Y89), EU-27, 3 years average of the latest available years according to Annex 3.
Source: WHO Mortality Database (WHO MDB) – causes of death. External causes of injury and poisoning: ICD-10 V01-Y98. Absolute numbers, EU-27, 3 years average of latest available years according to Annex 3.

28
Annex Figure 2: Fatal injuries by causes of death in the EU-27
Annex Figure 3: Fatal injuries and relative injury mortality in the EU-27 by sex and age groups
Self-inflicted injuries 23%
Road traffic injuries 20%
Falls 17%
Poisoning 5%
Drowning 3%
Interpersonal violence
Fires 2%
Other causes 29%
2%
0
100
200
300
400
500
600
Inju
ry d
eath
s p
er 1
00 0
00 in
habi
tant
s
0-4
5-9
10-
14
15-1
9
20-2
4
25-2
9
30-3
4
35-3
9
40-4
4
45-4
9
50-5
4
55-5
9
60-6
4
65-6
9
70-7
4
75-7
9
80-8
4
85+
0%
10%
20%
30%
40%
50%
60%
70%
80%Injury deaths per 100 000 - FemaleInjury deaths per 100 000 - MaleRelative injury mortality - FemaleRelative injury mortality - Male
Source: WHO Mortality Database (WHO MDB) - causes of death, External causes of injury and poisoning (V01-Y98). Absolute numbers, EU-27), 3 years average of latest available years according to Annex 3. Road traffic injuries (V01-V89, V99, Y850); n=50 527. Poisoning (X40-X49); n=12 435. Falls (W00-W19); n=42 861. Fires (X00-X09); n=4 227. Drowning (W65-W74); n=7 097. Self-inflicted (X60-X84, Y870); n=58 943. Interpersonal violence (X85-Y09, X871); n=5 540. Other causes (Other unintentional injuries: V90-V98, W20-W64, W75-W99, X10-X39, X50-X59, Y40-Y86, Y88, Y89; War Y36; Other intentional injuries Y35; undetermined intent and injuries elsewhere classified); n=74 225. All injuries (V01-Y98); n=255 854.
Source: Eurostat - causes of death (Eurostat COD), EU-27, provisional value of 3 years average of the latest available years; 2004-2006. All causes of death (A00-Y89); external cause of injury and poisoning (V01-Y89).Relative injury mortality: Share of injury fatalities of all fatalities.

29
ANNEX
Annex Figure 4: Fatal injury trends in the EU-27 by injury prevention domain
60%
65%
70%
75%
80%
85%
90%
95%
100%
105%
1998 1999 2000 2001 2002 2003 2004 2005 2006 2007
All injuries
Home and leisure
Work
Transport
Suicide
Homicide
Source: WHO - Health for all database (WHO HFA-DB),1998-2007, Index=1998. All injuries; external cause of injury and poisoning, all ages per 100 000; standardised death rate; EU-27, ICD-10 Codes: V00-V99, W00--W99, X00-X99, Y00-Y99. Suicide: suicide and self-inflicted injury, all ages per 100 000; standardised death rate; EU-27, ICD-10 Codes: X60-X84. Homicide: homicide and intentional injury, all ages per 100 000; standardised death rate; EU-27, ICD-10 Codes: X85-X99, Y00-Y09. Transport: transport accidents, all ages per 100 000; standardised death rate; EU-27, V01-V99. Work: deaths due to work-related accidents per 100 000; EU-27. Home and leisure: estimation of the standardised death rate for home and leisure accidents is calculated as the remainder to all external causes of injuries minus the defined injury prevention domains (=All injuries – (Transport + Work + Homicide + Suicide)).
Annex Figure 5: Hospital discharges due to injuries in the EU-27 by country
Hospital discharges due to injury in % of all
< 8%8-10%> 10%
Source: Eurostat – Hospital discharge register (Eurostat HDR). Total number of hospital discharges due to injuries, poisoning and certain other consequences of external causes (S00-T98) in comparision with all hospital discharges A00-Z99. EU-27, 3 years average of latest available years according to Annex 3.
CountryHospital
discharges due to injury
In % of all hospital
discharges
CY 7 011 14 .6%IE 57 975 11 .5%AT 239 166 10 .2%DE 1 668 287 10 .0%LV 49 185 10 .0%BE 169 967 9 .9%GR 151 071 9 .3%SI 30 537 9 .3%
UK 720 862 9 .1%DK 83 911 9 .0%SE 128 667 9 .0%PL 611 762 8 .8%ES 389 979 8 .7%IT 770 366 8 .5%FR 900 336 8 .2%NL 142 524 8 .2%CZ 187 381 8 .1%SK 85 153 8 .0%LT 65 675 7 .8%FI 102 438 7 .5%LU 5 798 7 .4%PT 73 177 7 .3%MT 2 765 6 .9%EE 16 059 6 .5%RO 286 600 6 .1%BG 98 034 5 .9%HU 145 895 5 .9%
EU-27 7 190 583 8 .6%

30
Annex Figure 6: Non-fatal injuries per 1 000 by sex and age group
Annex Figure 7: Non-fatal injuries per 1 000 by injury prevention domain and age group
20
40
60
80
100
120
140
160
180
200
0-4
5-9
10-1
4
15-1
9
20-2
4
25-2
9
30-3
4
35-3
9
40-4
4
45-4
9
50-5
4
55-5
9
60-6
4
65-6
9
70-7
4
75-7
9
80-8
4
85+
Hos
pita
l tre
ated
inju
iries
per
1 0
00 in
habi
tant
s
MaleFemale
-
20
40
60
80
100
120
140
160
0-4
5-9
10-1
4
15-1
9
20-2
4
25-2
9
30-3
4
35-3
9
40-4
4
45-4
9
50-5
4
55-5
9
60-6
4
65-6
9
70-7
4
75-7
9
80-8
4
85+
Hos
pita
l tre
ated
inju
ries
per 1
000
inha
bita
nts Intentional self-harm
Assault & other violence
Home & leisure
Sports
School (education)
Paid work
Road traffic
Source: EU Injury Database (EU IDB AI) - hospital treated patients; n=404 468. Available countries and years according to Annex 3.
Source: EU Injury Database (EU IDB AI) - hospital treated patients. Definition of injury prevention domains according the IDB Coding Manual (IDB AI). Road traffic: “Transport module” plus place “public highway, street or road”; n=404 468. Available countries and years according to Annex 3.

31
ANNEX
ANNEX 2: LIST OF FIGURES AND TABLES
Figure 1: The injury pyramid for the European Union
Fatal injuries: WHO Mortality Database (WHO MDB) – causes of death. External causes of injury and poisoning: ICD-10 V01-Y98. Absolute numbers, EU-27, 3 years average of latest available years according to Annex 3.Hospital Admissions: Eurostat – hospital discharge register (Eurostat HDR). Total number of hospital discharges due to injuries, poisoning and certain other consequences of external causes (S00-T98). EU-27, 3 years average of latest available years according to Annex 3.Hospital Outpatients: EU Injury Database (EU IDB) - hospital treated outpatients. Estimation of absolute numbers for EU-27 by ratio of outpatients and “hospital admissions” (see above); n=404 000. Available countries and years according to Annex 3.Other medical Treatment: Various national health surveys (see: Comprehensive View on European Injury Data (CVI) – Final Report; DG Sanco Public Health / Institut Sicher Leben, Vienna 2003.).
Table 1: Comprehensive view on injuries by responsible prevention domain
Fatal injuries: Total: WHO Mortality Database (WHO MDB) – causes of death. External causes of injury and poisoning: ICD-10 V01-Y98. Absolute numbers, EU-27, 3 years average of latest available years according to Annex 3. Road traffic injuries: WHO Mortality Database (WHO MDB) (V01-V89, V99, Y850). Work Place: WHO, Health for all database (WHO HFA-DB), number of deaths due to work-related accidents, 3 years average of latest available years according to Annex 3. School, Sports, Home, Leisure: remainder of “Total of unintentional injuries”. Assault, homicide: (X85-Y09, X871). Self-harm, suicide (X60-X84, Y870). Total of all Injuries (V01-Y98); n=255 854 (incl. 12 310 cases other intentional and undetermined injuries).Hospital Admissions: Eurostat – hospital discharge register (Eurostat HDR). Total number of hospital discharges due to injuries, poisoning and certain other consequences of external causes (S00-T98). EU-27, 3 years average of latest available years according to Annex 3. Number of admissions by domains based on EU IDB estimates.Hospital Outpatients: EU Injury Database (EU IDB) - hospital treated outpatients. Estimation of absolute numbers for EU-27 by ratio of outpatients and “hospital admissions” (see above); n=404 000. Available countries and years according to Annex 3.All Hospital patients: Sum of Hospital Admissions and Hospital Outpatients. These estimates are based on available countries and years according to Annex 3. Due to the variation in these estimates between countries margins of deviation of +/- 20% (95% CI) have to be considered for the interpretation of these results. Other medical Treatment: Various national health surveys (see: Comprehensive View on European Injury Data (CVI) – Final Report; DG Sanco Public Health / Institut Sicher Leben, Vienna 2003.).
Figure 2: Leading causes of death and causes of fatal injuries in children up to 14 years
Causes of fatal injuriesWHO Mortality Database (WHO MDB) - causes of death, external causes of injury and poisoning (V01-Y98). Absolute numbers, EU-27, 3 years average of latest available years according to Annex 3.Road traffic injuries (V01-V89, V99, Y850); n=1 639. Poisoning (X40-X49); n=165. Falls (W00-W19); n=208. Fires (X00-X09); n=205. Drowning (W65-W74); n=618. Self-inflicted (X60-X84, Y870); n=206. Interpersonal violence (X85-Y09, X871); n=265. Other causes (Other unintentional injuries: V90-V98, W20-W64, W75-W99, X10-X39, X50-X59, Y40-Y86, Y88, Y89; War Y36; Other intentional injuries Y35; undetermined intent and injuries elsewhere classified); n=1 660. All injuries (V01-Y98); n=4 966.
Leading causes of deathEurostat - causes of death (Eurostat COD), EU-27, provisional value of 3 years average of the latest available years; 2004-2006. Absolute numbers, considering the ICD-10 main chapters (A00-Y89; all causes of death; n=12 372).
Figure 3: Places of occurrence of non-fatal child injuries and main mechanisms of home injuries in children under 5 years EU Injury Database (EU IDB AI) - hospital treated patients. Available countries and years according to Annex 3.
Places of occurrence of non-fatal child injuries n=74 834. Main mechanisms of home injuries in children under 5 years n=20 070.

32
Figure 4: Leading causes of death and causes of fatal injuries in adolescents between 15–24 years
Causes of fatal injuriesWHO Mortality Database (WHO MDB) - causes of death, external causes of injury and poisoning (V01-Y98). Absolute numbers, EU-27, 3 years average of latest available years according to Annex 3;Road traffic injuries (V01-V89, V99, Y850); n=10 305. Poisoning (X40-X49); n=968. Falls (W00-W19); n=521. Fires (X00-X09); n=141. Drowning (W65-W74); n=729. Self-inflicted (X60-X84, Y870); n=4 262. Interpersonal violence (X85-Y09, X871); n=602. Other causes (Other unintentional injuries: V90-V98, W20-W64, W75-W99, X10-X39, X50-X59, Y40-Y86, Y88, Y89; War Y36; Other intentional injuries Y35; undetermined intent and injuries elsewhere classified); n=3 929. All injuries (V01-Y98); n=21 455.
Leading causes of deathEurostat - causes of death (Eurostat COD), EU-27, provisional value of 3 years average of the latest available years; 2004-2006. Absolute numbers, considering the ICD-10 main chapters (A00-Y89; all causes of death; n=30 552).
Figure 5: Injury rates of adolescents between 15-24 by injury prevention domain and sexEU Injury Database (EU IDB AI) - hospital treated patients; n=21 455. Available countries and years according to Annex 3.
Figure 6: Fatal injuries amongst older people (60+) by causes of death and sex WHO Mortality Database (WHO MDB) - causes of death, external causes of injury and poisoning (V01-Y98). Absolute numbers, EU-27, 3 years average of latest available years according to Annex 3;Road traffic injuries (V01-V89, V99, Y850); n=13 214. Poisoning (X40-X49); n=2 737. Falls (W00-W19); n=34 946. Fires (X00-X09); n=2 100. Drowning (W65-W74); n=2 312. Self-inflicted (X60-X84, Y870); n=19 474. Interpersonal violence (X85-Y09, X871); n=1 067. Other causes (Other unintentional injuries: V90-V98, W20-W64, W75-W99, X10-X39, X50-X59, Y40-Y86, Y88, Y89; War Y36; Other intentional injuries Y35; undetermined intent and injuries elsewhere classified); n=44 500. All injuries (V01-Y98); n=120 349.
Figure 7: Places of occurrence of injuries amongst older people (60+) and activities leading to home injuriesEU Injury Database (EU IDB AI) - hospital treated patients; n=74 747. Available countries and years according to Annex 3.
Figure 8: Road fatalities by type of road user WHO Mortality Database (WHO MDB) - causes of death ICD-10. Road transport (V01-89, Y85); n=79 829. Available countries and years according to Annex 3.
Figure 9: Non-fatal road injuries by type of road user and body part injuredEU Injury Database (EU IDB AI) - hospital treated patients. IDB AI Transport module and place of occurrence (code 6.n [public road]); n=71 460. Available countries and years according to Annex 3.
Figure 10: Product and non-product related causes of fatal home injuriesWHO Mortality Database (WHO MDB) - causes of death ICD-10. Fire (X00-09) and “other unintentional injuries” (W20-64, W75-49, X10-X19) where fourth digit = 0 (place of occurrence = home); n=20 076. Available countries and years according to Annex 3.
Figure 11: Product an service related home and leisure injuries EU Injury Database (EU IDB HLA and AI) - hospital treated patients. 2005-2007; n=387 232 (IDB AI without modules transport, violene and self-harm; without activity code 1 [paid work]). Available countries and years according to Annex 3.
Figure 12: Fatal sports injuries by type of sports (excluding swimming) and age groupWHO Mortality Database (WHO MDB) - causes of death ICD-10. Selected ICD-10 categories for bicycling (V100-V189 non-traffic), equestrian activities (V800), boating (V904-909, V914-919, V924-929, V934-938, V944-949), ice/snow (W020-029), mountaineering/climbing (W158-159), diving (W168-169), avalanche (X368-369), aero (V951, V960-969, V972); n= 2 433. Excluded ICD-10 categories for swimming (W698-699, W708-709, W738-739, W748-749); n=12 988. Available countries and years according to Annex 3.

33
ANNEX
Figure 13: EU-27 estimates of hospital treated sports injuries by type of sports, participation (organised / not organised) and share of head injuries EU Injury Database (EU IDB HLA and AI) - hospital treated patients. 2005-2007; n=45 045 (IDB HLA activity codes 5.n, IDB AI activity codes 3.1, 4.1, 4.8, 4.9). EU-27 estimates based on Table 1. Available countries and years according to Annex 3.
Figure 14: Fatalities through interpersonal violence by means of assault, sex and age groupWHO Mortality Database (WHO MDB) - causes of death ICD-10. Assault (X85-99, Y00-Y09, Y871); n=11 594. Available countries and years according to Annex 3.
Figure 15: Non-fatal injuries through interpersonal violence by context of assault, sex and age group of victimEU Injury Database (EU IDB AI) - hospital treated patients; n=3 269 (Violence module total; n=17 272). Available countries and years according to Annex 3.
Figure 16: Suicides by means of self-harm, sex and age groupWHO Mortality Database (WHO MDB) - causes of death ICD-10. X60-X84, Y870; n=142 862. Available countries and years according to Annex 3.
Figure 17: Non-fatal injuries through self-harm by risk-factor, sex and age group EU Injury Database (EU IDB AI) - hospital treated patients; n=386 (Self-harm module total; n=5 782). Available countries and years according to Annex 3.

34
Inju
ry d
ata
used
in th
is re
port
AN
NEX
3: A
VA
ILA
BIL
ITY
OF
DA
TA S
OU
RC
ES B
Y Y
EAR
AN
D C
OU
NTR
Y
Eu
rost
atW
HO
Mor
talit
y D
atab
ase
2 (W
HO
MD
B)W
HO
Hea
lth
for A
ll D
atab
ase
(HFA
)EU
Inju
ry D
atab
ase
(IDB)
Coun
try
Nam
eA
bbre
viat
ion
Caus
es o
f dea
th b
y re
gion
- A
bsol
ute
num
bers
1
Stan
dard
ised
dea
th
rate
s pe
r 100
000
in
habi
tant
s1
Hos
pita
l dis
char
ge
data
- A
bsol
ute
num
bers
and
rate
s1Ca
uses
of d
eath
3Ca
uses
of d
eath
on
ly IC
D-1
0
Num
ber o
f dea
ths
due
to w
ork-
rela
ted
acci
dent
s 4
EU ID
B H
LA H
ospi
tal
trea
ted
inju
ries
- H
ome
and
leis
ure
acci
dent
s (H
LA)5
EU ID
B A
I Hos
pita
l tr
eate
d in
juri
es -
All
inju
ries
(AI)5
Belg
ium
BE19
97 -
1999
1997
- 19
9920
04 -
2006
1997
- 19
99–
2004
- 20
06–
–
Bulg
aria
BG20
05 -
2007
2005
- 20
0720
05 -
2007
2002
- 20
04–
2003
- 20
05–
–
Czec
h Re
publ
icCZ
2005
- 20
0720
05 -
2007
2004
- 20
0620
05 -
2007
2005
- 20
0720
05 -
2007
––
Den
mar
kD
K20
04 -
2006
2004
- 20
0620
03 -
2005
2004
- 20
0620
05, 2
006
1999
- 20
0120
05 -
2007
–
Ger
man
yD
E20
05 -
2007
2005
- 20
0720
01, 2
002,
200
620
04 -
2006
2005
, 200
620
04 -
2006
–20
07
Esto
nia
EE20
05 -
2007
2005
- 20
0720
04 -
2006
2003
- 20
05–
2005
- 20
07–
–
Irela
ndIE
2004
- 20
0620
04 -
2006
2005
- 20
0720
05 -
2007
2007
2005
- 20
07–
–
Gre
ece
GR
2005
- 20
0720
05 -
2007
1997
- 19
9920
05 -
2007
–20
01 -
2003
––
Spai
nES
2005
- 20
0720
05 -
2007
2004
- 20
0620
03 -
2005
2005
2004
- 20
06–
–
Fran
ceFR
2004
- 20
0620
04 -
2006
2005
- 20
0720
04 -
2006
2005
, 200
620
02 -
2004
2003
- 20
05
Italy
IT20
01 -
2003
2001
- 20
0320
03 -
2005
2002
, 200
3, 2
006
2006
2005
- 20
07–
–
Cypr
usCY
2005
- 20
0720
05 -
2007
2005
- 20
0720
04, 2
006
–20
05 -
2007
–20
06 -
2007
Latv
iaLV
2005
- 20
0720
05 -
2007
2002
, 200
5, 2
008
2005
- 20
07–
2005
- 20
07–
2005
- 20
07
Lith
uani
aLT
2005
- 20
0720
05 -
2007
2005
- 20
0720
05 -
2007
2005
- 20
0720
05 -
2007
––
Luxe
mbo
urg
LU20
04 -
2006
2004
- 20
0620
04 -
2006
2003
- 20
0520
0520
05 -
2007
––
Hun
gary
HU
2004
- 20
0620
05 -
2007
2000
- 20
0220
03 -
2005
2005
2005
- 20
07–
–
Mal
taM
T20
05 -
2007
2005
- 20
0720
04, 2
005,
200
720
05 -
2007
2005
- 20
0720
05 -
2007
–20
06 -
2007
Net
herla
nds
NL
2005
- 20
0720
05 -
2007
2005
- 20
0720
05 -
2007
2005
- 20
0720
05 -
2007
2005
2006
- 20
07
Aust
riaAT
2005
- 20
0720
05 -
2007
2005
-200
720
05 -
2007
2005
- 20
0720
05 -
2007
2005
, 200
620
07
Pola
ndPL
2005
- 20
0720
05 -
2007
2004
- 20
0620
04 -
2006
2005
, 200
620
05 -
2007
––
Port
ugal
PT20
04 -
2006
2004
- 20
0620
01, 2
002,
200
520
01 -
2003
–20
02 -
2004
2005
- 20
07–
Rom
ania
RO20
05 -
2007
2005
- 20
0720
05 -
2007
2005
- 20
0720
05 -
2007
2004
- 20
06–
–
Slov
enia
SI20
05 -
2007
2005
- 20
0720
05 -
2007
2005
- 20
07–
2005
- 20
0720
0520
06 -
2007
Slov
akia
SK20
05 -
2007
2005
- 20
0720
04 -
2006
2003
- 20
05–
2005
- 20
07–
–
Finl
and
FI20
05 -
2007
2005
- 20
0720
04 -
2006
2005
- 20
0720
05 -
2007
2004
- 20
06–
–
Swed
enSE
2005
- 20
0720
05 -
2007
2004
- 20
0620
04 -
2006
2005
, 200
620
05 -
2007
2005
, 200
620
07
Uni
ted
King
dom
UK
2004
- 20
0620
04 -
2006
2001
- 20
0320
05 -
2007
2005
- 20
0720
03 -
2005
2002
–
EU-2
7EU
-27
calc
ulat
ed fr
om a
vaila
ble
data
of c
ount
ries
calc
ulat
ed fr
om
avai
labl
e da
ta o
f co
untr
ies
calc
ulat
ed fr
om a
vaila
ble
data
of c
ount
ries
calc
ulat
ed fr
om
avai
labl
e da
ta o
f co
untr
ies
estim
ated
from
ava
ilabl
e da
ta o
f cou
ntrie
s
1 htt
p://
epp.
euro
stat
.ec.
euro
pa.e
u/po
rtal
/pag
e/po
rtal
/sta
tistic
s/th
emes
2 WH
O M
DB
dow
nloa
d: M
ay 2
009
htt
p://
ww
w.w
ho.in
t/w
hosi
s/m
ort/
dow
nloa
d/en
/inde
x.ht
ml
3 In
jury
gro
ups
ICD
-9/IC
D-1
0: P
eden
M, M
cGee
K, S
harm
a G
. The
inju
ry c
hart
boo
k: a
gra
phic
al o
verv
iew
of t
he g
loba
l bur
den
of in
jurie
s. G
enev
a, W
orld
H
ealth
Org
anis
atio
n, 2
002,
p. 3
. ht
tp://
ww
w.w
ho.in
t/vi
olen
ce_i
njur
y_pr
even
tion/
publ
icat
ions
/oth
er_i
njur
y/ch
artb
/en/
4 htt
p://
data
.eur
o.w
ho.in
t/hf
adb/
5 ht
tps:
//w
ebga
te.e
c.eu
ropa
.eu/
idb/

35
ANNEX
REFERENCES
1 A surveillance based model to calculate the direct medical costs in Europe – Final Report. DG Sanco Public Health / Consumer Safety Institute, Amsterdam, 2004: http://www.eurosafe.eu.com/csi/eurosafe.nsf/projects.
2 Prevalence of disability and long-standing health problems (unintentional injuries only, population aged 15 to 64). Labour Force Survey. Eurostat, 2002.
3 Assessing disability. Münchener Rückversicherungs-Gesellschaft, 2004. München:
www.munichre.com/publications/302-04093_en.pdf. 4 Child Safety Report Card 2009. EuroSafe/European Child safety Alliance, Amsterdam, 2009: www.childsafetyeurope.org. 5 Statistisches Bundesamt, Wiesbaden, 2009: https://www-genesis.destatis.de/genesis/online.
6 Analysis of injury related mortality in Europe. The ANAMORT project. Final implementation report. DG Sanco Public Health / INVS, Paris, 2008: http://www.dsi.univ-paris5.fr/AcVC/anamort.htm.
7 Young Europeans in 2001. Results of a European opinion poll. Eurobarometer special report 151. European Commission, Directo-
rate–General for Education and Culture, Brussels, 2001: http://ec.europa.eu/public_opinion/archives/ebs/ebs_151_summ_en.pdf. 8 Green Paper on Demographic Change. DG EMPL/E/1. J-27 01/122. European Commission. B-1049 Brussels, 2005:
http://ec.europa.eu/employment_social/news/2005/mar/demog_gp_de.html. 9 Coogler CE, Wolf SL. Falls. In: Hazzard WR, et al., eds. Principles of geriatric medicine and gerontology. 4th ed. New York:
McGraw-Hill, 1999:1535-46. 10 European hospital morbidity database. WHO Regional Office for Europe, Copenhagen, 2009:
http://www.euro.who.int/InformationSources/Data/20061120_1. 11 Vulnerable road user organisations in cooperation across Europe” - A Europe-wide campaign to protect vulnerable road users.
Final Report ETSC, 2008: http://www.etsc.eu/documents/1-VOICE_Final_Report.pdf. 12 Belt E, Polinder S, Lyons R, Lund J, Haagsma. Health-related Quality of Life Assessment and Recovery Patterns after Injury: a Review.
Journal of Trauma (submitted Oct. 2009). 13 PIN Flash 15 - Set targets for serious injury reduction in Europe. ETSC, 2009: http://www.etsc.eu/PIN-publications.php. 14 Injuries to Vulnerable Road Users. Including Falls in Pedestrians in the EU - A Data Report. Final report of DG Sanco project “
Strategies and best practices for the reduction of injuries” (APOLLO). KfV, Vienna, 2009. 15 Directive 2001/95/EC of the European Parliament and of the Council of 3 December 2001 on general product safety.
http://ec.europa.eu/consumers/safety/rapex/docs/RAPEXguidelinesOJL381.pdf. 16 NEISS - The National Electronic Injury Surveillance System. A Tool for Researchers. U.S. Consumer Product Safety Commission, 2000.
http://www.cpsc.gov/neiss/2000d015.pdf. 17 Improving the product and service dimension in the IDB - a feasibility study. Final Report. DG Sanco / Eurosafe. Amsterdam, 2006:
http://ec.europa.eu/consumers/cons_safe/serv_safe/datacollect/rep_idb2006_en.pdf. 18 Shepherd JP, Sivarajasingam V, Rivara FP. Using injury data for violence prevention. Government proposal is an important step
towards safer communities. BMJ. 2000 Dec 16; 321(7275):1481-2.

https://webgate.ec.europa.eu/idb/


This report is the third edition of a series of annual summaries of key figures on injuries in the European Union. It combines available data on mortality and morbidity and those provide health policy makers, researchers and safety practitioners with a comprehensive view about this important public health problem.
Supported by:
European Commission, Health and Consumers Directorate-General(DG Sanco)