2009 rockslide, interstate 40, north carolina refer to the
TRANSCRIPT

2009 Rockslide, Interstate 40, North Carolina
Refer to the accompanying photographs of the October 2009 Haywood County (NC) landslide. Following the landslide, the west-‐bound lanes of Interstate 40 were closed for 6 months, requiring a ~150-‐mile detour. The closure had a significant economic impact on communities along the route, which is a major travel and shipping corridor between the cities of Charllote NC and Knoxvill TN. Here are some excerpts from a news report in the Ashville Citizen-‐Times shortly after the slide occurred (28 October 2009):
State transportation officials warned Tuesday that work clearing Interstate 40 after the most destructive rock slide in more than a decade could take longer than first expected. The slide, about three miles east of the Tennessee line, has shut down I-‐40 from Exit 20 to just inside Tennessee. […] Contractor Phillips & Jordan Inc., of Knoxville, Tenn., may have specialized equipment at the site today. The company worked out the plan with rock stabilization specialists Janod Contractors of Champion, N.Y. Two drilling rigs, called an air track and a crows nest, are designed to drill into vertical surfaces while anchored with cables and pulleys. The third piece is an excavator called a spider with three wheels attached to moon-‐rover-‐like legs. The work is extremely hazardous. “There are bigger slides,” said Jody Kuhne, a highway department engineer, “but none more dangerous.”
Crews cleared rubble from the eastbound lanes Tuesday and used a tractor-‐mounted hammer drill to break up some of the large boulders at the base of the 200-‐foot-‐wide slide. Kuhne said some boulders have tumbled off the top since the slide happened early Sunday morning. Rocks scattered down the slope Tuesday as the day's rain got heavier. Blasting, which is the first step in the plan, could start today. The new plan for clearing the rock slide is different from two ideas floated on Monday that focused on either building a road through the national forest to get equipment to the top of the unstable slide or using a crane or helicopter to haul the drilling rigs up.
Jon Nance, the highway department's chief operations engineer, said the contractors decided it would be easier to construct a ramp on the face of the slide. “This area is 98 percent rock, not dirt,” he said. “To build a road would be complicated, expensive and time-‐consuming.” Nance said the plan is an unusual approach in North Carolina. The highway department typically builds access roads around landslides to get heavy equipment to the top. “They decided they actually might be able to tackle this one differently and go up in the slide area,” he said.
The highway department said the work could cost as much as $10 million. Gov. Bev Perdue is expected to declare an emergency for the slide area, which will enable the state to request funding from the Federal Highway Administration.
Alternate routes to get traffic around the closed interstate were working well, with few backups reported so far, Nance said. The highway department is working to get the word out that most of Western North Carolina is still open to tourists. Businesses in many of the far western counties depend on tourism in October and November.
Another slide shut down I-‐40 for three months in 1997. That one happened two miles to the west and involved more dirt than rock. Nance said highway engineers will take advantage of the closed interstate to check for signs of landslide in other parts of the Pigeon River Gorge. Once the rockslide is cleared, the highway department plans to improve the construction in the spot by grading the mountainside back to a gentler slope. […]
Travelers who normally use the interstate during the Thanksgiving and Christmas holidays should make other plans, he said.
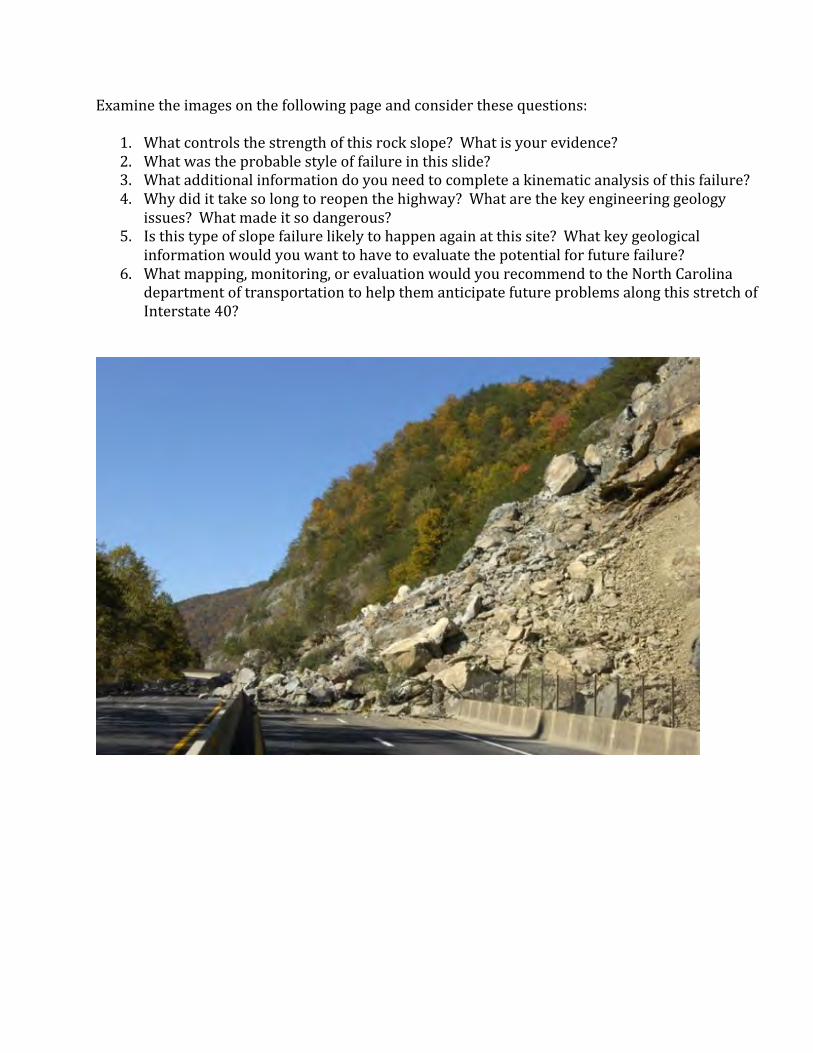
Examine the images on the following page and consider these questions: 1. What controls the strength of this rock slope? What is your evidence? 2. What was the probable style of failure in this slide? 3. What additional information do you need to complete a kinematic analysis of this failure? 4. Why did it take so long to reopen the highway? What are the key engineering geology
issues? What made it so dangerous? 5. Is this type of slope failure likely to happen again at this site? What key geological
information would you want to have to evaluate the potential for future failure? 6. What mapping, monitoring, or evaluation would you recommend to the North Carolina
department of transportation to help them anticipate future problems along this stretch of Interstate 40?


Expert Witness: Hydrogeology Legal Brief:
Plaintiffs allege that the defendants (companies A, B, and C) are jointly responsible for organic solvent groundwater contamination. Sickness and deaths are alleged to have resulted from drinking the contaminated water from a municipal well.
Defendants admit to some prior (now remediated) on-‐site waste leakage but deny the allegation that they are responsible for the contamination at the location of the municipal well. Defendants have different theories to explain why each is not liable.
Company A contends that their leakage problem was too recent and that the contaminant plume from their site did not reach the municipal well prior to discovery of contamination.
Company B notes that the nearby river is contaminated from upstream sources with the same organic solvents that leaked on their site. They contend that the well (near the river) is recharged by the river and is thus contaminated from river water as a result.
Company C states that the leakage problem occurred at a site across the river from the municipal well. Thus, they contend, no waste from their site could possibly have contaminated the well.
Geologic setting:
• Low relief river valley with 100’ of alluvium over bedrock.
• Unconfined shallow aquifer. • Riverbed of peat and silt.
Site map:
river Municipal Well
Company A
Site
Company B
Site
Company C
Site
flow

Your charge:
Science-‐based Analysis
Evaluate the science basis to support or reject the defendant theories. You may request hydrogeology data. Some will be provided; some may not be available. You are to explain how the information provided is placed into a quantitative analysis, but no actual calculations are necessary.
In particular,
1. Is it possible to estimate the plume travel time from site A to the municipal well?
a. What are the limitations in such an estimate?
2. Is it possible to determine whether the pumped water is from groundwater flow from site B or from river recharge?
a. What are the underlying difficulties in this determination?
3. Can contamination from site C reach the municipal well under any circumstances?
a. Why is this a question? b. How can an answer be formulated?
Science ethics:
Discuss some of the difficulties associated with science in the courtroom. No mention is made above concerning which “side” is seeking your expert opinion. How different would your testimony be if employed by plaintiffs or defendants?

Comps Exam Question
New Sewer Line
King County engineers are evaluating the addition of and location of two new sewer lines in East Bellevue at locations shown by the blue lines on Figure 1. Both proposed lines cross the Seattle fault zone, outlined in red on Figure 1, with strands shown on Figure 2. The pipelines would be located as deep as 65 m bgs, depending on topography. Constructions techniques therefore would consist of a combination of excavation at pump stations, cut and cover for shallow segments, and bored tunnel.
What geological hazards would the County face with these routes? What would you do to evaluate the hazards and feasibility of these routes? What geologic materials might be encountered in excavations should the County decide to proceed with these locations? What resources are available to you to evaluate the routes without stepping foot on the ground?
Figure 1. Location map showing Seattle fault zone in red and proposed sewer lines in blue.

Figure 2. Geologic Map of Bellevue. Holocene: Qal=alluvium, Qp=peat, Ql=lacustrine deposits, Qw=wetland deposits, Qmw=mass wastage deposits, Qf=fan deposits. Pleistocene: Qvr=Vashon recessional outwash,
Qvrl=…lacustrine deposits, Qvrlb=…Lake Bretz, Qvt=Vashon till, Qva=Vashon advance outwash, Qpf=Pre-‐Fraser undifferentiated, Qob=Olympia beds, Qpogt=Pre-‐Olympia glacial till, Qpo=Pre-‐Olympia undifferentiated.
Tertiary: Tb=Blakeley Formation,

(over)
Downstream effects of urban development in the Cascade Range foothills
A new urban center has been proposed for development on private timberland in the Cascade Range foothills near Granite Falls. The development is on moderately-‐sloping forested hillsides underlain by till-‐mantled Tertiary volcaniclastic rocks and is drained by several small streams. Downstream, the streams join to form a small river. The upper reaches of this river are confined in a gorge incised into glacio-‐lacustrine and glacio-‐fluvial deposits. In its lower reaches the river flows through the gently-‐sloping glacial till plain of the Puget Lowland and has created a floodplain 20-‐30 times wider than the stream’s width. The stream gradient declines downstream, from about 0.12 in the proposed development area, to <0.01 in its lower reaches.
The developer’s Draft Environmental Impact Statement (DEIS) found the development will have no significant effects on the environment.
However, after reviewing the DEIS, The Tulalip and Stillaguamish Tribes, joined by the Wild Fish Conservancy and several other advocacy groups, claim that the DEIS is “woefully inadequate” in how it treats the potential effects on habitat for populations of endangered bull trout in the river.
As the geomorphologist for the Tulalip Tribes Natural Resources Department, you are tasked with making your own independent analysis, and with spelling out for the developer’s consultant how their analysis should be modified to properly (in your view) account for potential downstream effects.

The hydrologic assessment in the DEIS finds that forest clearing and creation of impervious surfaces associated with the development will increase peak flows by as much as 20% over the size of existing, natural peak flows.
Your own assessment of slope stability also finds that the forest clearance and disruption of natural drainage patterns has the potential to trigger landslides, including at least one very large event.
Bull trout require deep pools and clean spawning gravels. Because the bull trout is endangered, resource managers are particularly interested in preventing “redd failures” in which peak flows scour deeply enough into the spawning gravels as to excavate and destroy the eggs. It is important to know whether the development will increase the frequency of redd-‐scouring events.
As you prepare your plan, consider the following questions:
(1) You decide first to identify the river segments downstream that are more or less sensitive to changes in sediment influx or to peak flows. Prior to your site visit, what approach might you take, using maps or GIS, to initially demarcate segments?
(2) Which of the segments that you identified are likely to be the most sensitive to increased peak flows? To increased sediment influx? In these segments, how is the stream likely to respond?
(3) Once you have formulated some hypotheses about the distribution of bed morphologies you would expect to see along the river, and the characteristics and potential responses of each bed morphological type, what might you do in the field by way of evaluating the river’s current capacity to accommodate more sediment and higher peak flows?
(4) What approach would you take for computing the potential change to the frequency with which the bed material would be transported in response to the increase in peak flow? To make this calculation, what data do you need, and how would you obtain it?
(5) After considering these questions, assemble your thoughts into a succinct plan for the developer’s consultant to follow. Standing back from the details of the assessment that you considered, above, how would you describe to the developer’s consultant the general steps he or she should take in making the assessment?

2005 La Conchita landslide case study Your agency has been tasked with studying the history of slope failure at La Conchita, CA in order to consider whether new buildings/residences should be permitted in this community. During this question, we will likely explore the following concepts: identifying geomorphic features unstable slopes, landslide causes/triggers, mathematical assessment of slope stability, mitigation/decisions relating to slope failures. First consider the following background information (excerpts from Jibson, USGS Open-‐File Report 2005-‐1067) and then tell us succinctly what are the key additional details and/or other data needed to consider this problem. On January 10, 2005, a landslide struck the community of La Conchita in Ventura County, California, destroying or seriously damaging 36 houses and killing 10 people. This was not the first destructive landslide to damage this community.
La Conchita is located on the southern California coastline midway between Ventura and Santa Barbara (see Map below). The 11-‐ha (28-‐acre) community was first established in 1924 when subdivision created about 200 lots that mostly contain single-‐family residences. La Conchita lies on a narrow coastal strip about 250 m (800 ft) wide between the shoreline and a 180-‐m (600-‐ft) high bluff having a slope of about 35 degrees. Above the top of the bluff is a gently rising terrace surface covered by avocado and citrus orchards. The bluff above La Conchita consists of poorly indurated marine sediment of the Monterey and Pico Formations. The upper part of the slope consists of interlayered siliceous shale, siltstone, and sandstone of the Middle to Upper Miocene Monterey Formation. The lower
part of the slope is siltstone, sandstone, and mudstone of the Pliocene Pico Formation. Rock of both formations is very weakly cemented. The two formations are in fault contact along the active Red Mountain Fault, which extends across the slope face. Landslide History The bluff above La Conchita has been unstable and produced a variety of landslides over an extended period of time. Using the overlain LIDAR and false-‐color infrared image of the bluff from 2002 (three years before the most recent big slide of 2005), identify and discuss the evidence for hillslope mass wasting events of various size, type, and age.

Next we will discuss possible causes/triggers of the 2005 landslide and will explore which specific variables should be considered when estimating the stability of a site. If time permits, we will also consider similarities/differences between the 1995 and 2005 La Conchita slides. Finally, you will be asked: So, what’s the verdict? Should new building be permitted in this community? Please discuss why/why not.