2009 san francisco homeless count and...
TRANSCRIPT

2009 SAN FRANCISCO HOMELESS COUNT AND SURVEY
Applied Survey Research Santa Cruz Office P.O. Box 1927, Watsonville, CA 95077 (831) 728‐1356 San Jose Office 991 West Hedding, Suite 102, San Jose, CA 95126 (408) 247‐8319 www.appliedsurveyresearch.org
PREPARED BY: SAN FRANCISCO HUMAN SERVICES AGENCY WITH APPLIED SURVEY RESEARCH
Human Services Agency Housing and Homeless Division Joyce Crum Program Director P.O. Box 7988 San Francisco, CA 94120 (415) 557‐6444


2009 San Francisco Homeless Count and Survey Acknowledgements
© 2009 Applied Survey Research i
Acknowledgements The 2009 San Francisco Homeless Count planning team would like to thank the many individuals and agencies who contributed their considerable talents and efforts to the count. The participation of partner agencies and volunteers is critical to the success of the count, from the initial planning meetings, to the night of the count, and through the final stages of the project. Hundreds of community volunteers and City staff assisted with various aspects of the count, including revising volunteer instructions, media outreach and publicity, coordinating the dispatch centers, enumeration, data entry, and surveying.
The San Francisco Local Homeless Coordinating Board (LHCB), the coordinating body for San Francisco’s Continuum of Care, provided assistance for the 2009 Homeless Count project. We thank the members of the LHCB for their valued input and guidance. Meetings of the LHCB also served as a forum for stakeholder and community input on the project.
We thank Judith Klain of Project Homeless Connect for publicizing the count through their website and e-mail list serves and assisting with volunteer recruitment. We also thank the numerous non-profit agencies and City Departments that mobilized their staff and community volunteers to participate on the night of the Count.
We thank the following City agencies for the work in the planning efforts and implementation of the count: Human Services Agency, Department of Public Health, Mayor’s Office, General Services Administration, Office of City Administrator, Department of Public Works, Recreation and Park Department, and San Francisco Police Department. In particular, we would like to thank the following individuals for their time and effort dedicated to planning the count: Dariush Kayhan, Joyce Crum, Daryl Higashi, John Murray, Sarah Crow, Tasha Spencer, Lt. Mark Solomon, Cpt. Dominic Panina, Rajesh Parekh, Rann Parker, Edwin Lee, Cheryl Koel, and Frank Lee.
We also thank the California Highway Patrol for coordinating the enumeration of homeless persons on highway underpasses and on-ramps.
We thank Centro Latino, St. Ignatius High School, the United Council of Human Services, and the San Francisco Department of Public Health for lending the use of their facilities as dispatch centers on the night of the Count.
We thank Safeway for generously providing refreshments for the volunteers.
We thank Pamela Tebo, Human Services Agency, for assisting with media coordination on the night of the count.
We thank the following agencies for providing data for the sheltered count:
Shelters
St. Joseph’s Family Shelter Central City Hospitality House A Woman’s Place Compass Family Center The Sanctuary Next Door
Hamilton Family Emergency Shelter Hamilton Family Residences Huckleberry House Dolores Street La Casa de Las Madres Lark Inn for Youth
Diamond Youth Shelter Providence Raphael House MSC South 150 Otis St. Bethel AME (Winter) Interfaith (Winter)

Acknowledgements 2009 San Francisco Homeless Count and Survey
ii © 2009 Applied Survey Research
Transitional Housing Programs A Woman’s Place
Clara House
Washburn Hotel
Hamilton Transitional Housing Program
Larkin St. Avenues to Independence
Castro Youth Housing Initiative
The LOFT (Larkin)
LEASE (Larkin)
Harbor House
Brennan House
Transitional Living for Chronic Vets
Transitional Living for Homeless Vets
Jelani House
Harbor Light
Richmond Hills
Walden House Programs
La Casa Mariposa
SafeHouse for Women
Salvation Army Railton Place
Larkin Street After Care
Larkin Street Assisted Care
Jail San Francisco County Jail
Hospitals St. Mary’s
St. Francis
Veterans Administration Hospital
California Pacific Medical Center
Kaiser
SF General Hospital
Respite Center at Next Door
Respite Center at 39 Fell
Treatment Programs Acceptance Place
Joe Healy Detox
Ferguson Place
Baker St. House
Grove St.
Joe Ruffin Place
Robertson Place
San Jose Place
Langley Porter (Psych. Inpatient)
St. Francis (Psych. Inpatient)
SF General Hospital (Psych. Inpatient)
CPMC (Psych. Inpatient)
SF General Hospital ED Case Management (Stabilization rooms)
Jelani House Treatment
Resource Centers 150 Otis St.
Tenderloin Health
Oshun Center for Women
United Council of Human Services
A team of trained currently and formerly homeless survey workers and community volunteers administered surveys on the streets of San Francisco. We thank them for their excellent work.
We thank the staff of the Planning Unit of the Human Services Agency for providing feedback and assistance to the team throughout the project including the design and production of maps for the unsheltered count, project methodology, survey development, data entry coordination, review of this report, and the presentation of findings.
We thank the planning team leads from the Human Services Agency – Daryl Higashi and Ali Schlageter – for all their work on the project.
This report was compiled and written by Applied Survey Research and Ali Schlageter, Liaison to the Local Homeless Coordinating Board.

2009 San Francisco Homeless Count and Survey Table of Contents
© 2009 Applied Survey Research iii
Table of Contents Acknowledgements ...................................................................................................................................................... i
I. Executive Summary .................................................................................................................................................. 1
II. Introduction .............................................................................................................................................................. 5
III. Planning Process .................................................................................................................................................... 7
Community Involvement ......................................................................................................................................... 7
Interagency Coordination ........................................................................................................................................ 7
IV. Methodology ........................................................................................................................................................... 9
Unsheltered Count .................................................................................................................................................. 9 Volunteer Recruitment and Training .............................................................................................................. 10 Dispatch ......................................................................................................................................................... 11 Who Was Counted ......................................................................................................................................... 11 Geographical Areas Covered ........................................................................................................................ 11 Logistics of Counting ..................................................................................................................................... 12 Safety............................................................................................................................................................. 13
Sheltered Count .................................................................................................................................................... 13
Survey ................................................................................................................................................................... 15 Planning and Implementation ........................................................................................................................ 15 Survey Sampling ............................................................................................................................................ 16 Data Collection .............................................................................................................................................. 16 Data Integrity ................................................................................................................................................. 16 Survey Methodological Improvements from 2007 .......................................................................................... 17
V. Data Results ........................................................................................................................................................... 19
Number of Homeless People ................................................................................................................................ 19 Unsheltered Count ......................................................................................................................................... 19 Sheltered Count ............................................................................................................................................. 22
Survey Results ...................................................................................................................................................... 24 Survey Implications ........................................................................................................................................ 41
VI. Limitations ............................................................................................................................................................ 43
Unsheltered Count Limitations .............................................................................................................................. 43
Sheltered Count Limitations .................................................................................................................................. 45
Survey Limitations ................................................................................................................................................. 46
VII. Conclusion ........................................................................................................................................................... 47
Appendix A: Volunteer Instructions ......................................................................................................................... 51
Appendix B: Tally Sheet ............................................................................................................................................ 55
Appendix C: Survey Instrument ............................................................................................................................... 57
Appendix D: Survey Results ..................................................................................................................................... 61
Appendix E: Survey Administration Detail .............................................................................................................. 77
Appendix F: Map of Supervisor Districts and Homeless Count Routes ............................................................... 79

Table of Figures 2009 San Francisco Homeless Count and Survey
iv © 2009 Applied Survey Research
Table of Figures Figure 1: 2009 Homeless Count Results and Comparisons with 2007, 2005, and 2002............................................. 3
Figure 2: 2009 Unsheltered Count Results by Supervisor District: Gender and Race / Ethnicity .............................. 20
Figure 3: 2009 Unsheltered Homeless Count Results by Supervisor District: Family Status, Age, and Estimated Number of Homeless Persons Living in Cars, RVs / Vans, and Structures ............................................... 21
Figure 4: Unsheltered Count Results Comparison 2000-2009 .................................................................................. 22
Figure 5: 2009 Sheltered and Unsheltered Count Results and Comparisons to 2007 and 2005 .............................. 23
Figure 6: Demographic Data: Emergency Shelter and Transitional Housing Residents, January 27, 2009 .............. 24
Figure 7: Race / Ethnicity of Survey Respondents and General Population of San Francisco .................................. 25
Figure 8: Residence When Respondent Became Homeless .................................................................................... 27
Figure 9: Length of Homelessness ............................................................................................................................ 28
Figure 10: In the Last 12 Months, How Many Times Have You Been Homeless, Including this Present Time? ......... 29
Figure 11: In the Last 3 Years, How Many Times Have You Been Homeless, Including this Present Time? ............. 29
Figure 12: Chronically Homeless Survey Respondents .............................................................................................. 30
Figure 13: Where Do You Usually Stay at Night? (Top 5 Responses from Chronically Homeless Persons) .............. 30
Figure 14: Services / Assistance Used by Chronically Homeless Persons (Top 5 Responses) .................................. 31
Figure 15: Where Do You Usually Stay at Night? ....................................................................................................... 32
Figure 16: Nighttime Accommodation – Comparison of Selected Data from 2007 and 2009 ...................................... 33
Figure 17: Primary Event / Condition that Led to Homelessness ................................................................................ 34
Figure 18: What is Keeping You from Getting Permanent Housing? (Top 5 Responses*).......................................... 35
Figure 19: What is Keeping You from Getting Employment? (Top 5 Responses) ....................................................... 36
Figure 20: Reasons for Not Receiving Government Assistance (Top 5 Responses) .................................................. 37
Figure 21: Services / Assistance Currently Being Used by Respondents (Top 5 Responses) .................................... 37
Figure 22: Do You Panhandle, or Ask People for Money or Spare Change? .............................................................. 38
Figure 23: Do You Usually Get Enough to Eat on a Daily Basis? ............................................................................... 41

2009 San Francisco Homeless Count and Survey I. Executive Summary
© 2009 Applied Survey Research 1
I. Executive Summary The 2009 San Francisco Homeless Count was a community-wide effort that took place on the night of January 27, 2009. The count provides information about the homeless population that is critical to program and service planning, helps to inform the allocation of resources for services to help the homeless, and offers a means of measuring the impact of homeless programs and services. In addition, it is required by the Department of Housing and Urban Development (HUD) as part of a national effort to enumerate the homeless population. All jurisdictions receiving federal funding to provide housing and services for the homeless through the McKinney-Vento Homeless Assistance Grant are required to conduct a biennial point-in-time count of unsheltered and sheltered homeless persons sometime during the last ten days of January. This information helps the federal government better understand the nature and extent of homelessness nationwide. The data presented in this report provide an updated point-in-time snapshot of the homeless population in San Francisco. The purpose of this report is to share the results of the count with the community, to provide a discussion of the methodology used, and to offer analysis of the findings.
The McKinney-Vento definition of homelessness was used as the basis for this study:
1. An individual who lacks a fixed, regular, and adequate nighttime residence, and
2. An individual who has a primary nighttime residence that is:
a. A supervised publicly or privately operated shelter designed to provide temporary living accommodations (including welfare hotels, congregate shelters, and transitional housing for the mentally ill); or
b. An institution that provides a temporary residence for individuals intended to be institutionalized; or
c. A public or private place not designated for, or ordinarily used as, a regular sleeping accommodation for human beings.
This definition does not allow for the inclusion of those who are marginally housed, “doubled up,” or “couch surfing.”
As in 2007, the 2009 count once again involved hundreds of community volunteers in a citywide enumeration effort, covering every area of the City to achieve the most accurate count possible of
all individuals living on the streets on the night of the count. Staff from various City departments and the California Highway Patrol assisted with the enumeration of City parks and highway on-ramps and underpasses.
In complement to the unsheltered count, the City conducted a count of sheltered homeless persons in
emergency shelters and transitional housing programs and persons self-identifying as homeless who were staying at other facilities on the night of the count.
The 2009 count involved hundreds
of community volunteers in a
citywide enumeration effort.

I. Executive Summary 2009 San Francisco Homeless Count and Survey
2 © 2009 Applied Survey Research
Finally, a survey of homeless individuals administered primarily in outdoor locations throughout the City was also conducted to gather information about the homeless population’s demographics, family status, causes of homelessness, length and recurrence of homelessness, usual nighttime accommodations, and access to homeless services. The surveys were conducted by a trained team of paid, currently and formerly homeless survey workers and unpaid community volunteers.
While maintaining a consistent methodology in order to generate comparable data, this year’s count included improvements to the survey component. In addition, there were enhancements to the unsheltered and sheltered counts, including an improved methodology for enumerating those living in vehicles and encampments; a substantial increase in the use of trained outreach workers to assist community volunteers in counting unsheltered homeless persons; and the inclusion of additional stabilization room units and one more resource center in the 2009 sheltered count, compared to the 2007 sheltered count.
The total number of homeless persons counted in the City and County of San Francisco on January 27, 2009 was 6,514. This constituted a 25% decrease from 2002. The following chart provides a comparison of the results of the 2009, 2007, 2005, and 2002 counts. It is important to note, however, that the counts prior to 2007 did not employ the citywide enumeration method. Comparing the 2007 and 2009 results, on the surface it appears that there has been minimal or no change in San Francisco’s homeless population over the past two years. However, the lack of change in the overall size of the homeless population obscures the significant progress that has been made in getting individuals into needed treatment programs and transitioning individuals out of homelessness and into stable housing, which has dramatically improved many lives. In the past few years, San Francisco has applied more innovation and resources to ending homelessness than any time in its history. From January 2004 to February 2009, 5,497 single homeless adults were placed in permanent supportive housing through Care Not Cash Housing, Housing First, Direct Access to Housing, Shelter Plus Care, and the Local Operating Subsidy Program. During this time span, another 3,646 homeless individuals left San Francisco to be reunited with friends or
family members in other parts of the country through the City’s Homeward Bound Program. In addition, 705 individuals on public assistance secured housing on their own. From 2004 through February 2009, a total of 9,143 individuals exited homelessness through various initiatives.
San Francisco remains a destination for homeless persons from other areas, inhibiting the City’s progress toward reducing the overall homeless population. Thirty-eight percent (38%) of homeless individuals surveyed reported that they first became homeless outside of San Francisco or were relative
newcomers, having lived in the City for three months or less. The most prevalent primary reason for coming to San Francisco, among those who became homeless outside of the City, was “for a job / seeking work” (24%). The next most common primary reasons for coming to the City among this group were “my family and / or friends are here” and “I visited and decided to stay”
In the past few years, San Francisco
has applied more innovation and
resources to ending homelessness
than any time in its history.

2009 San Francisco Homeless Count and Survey I. Executive Summary
© 2009 Applied Survey Research 3
(15% each). In addition, 12% of these respondents indicated that they came to San Francisco “to access homeless services.”
The 2009 count demonstrated that the City’s continued progress in reducing homelessness since late-2002 has been sustained, through the many programs and efforts discussed. As previously stated, in 2009, homelessness was 25% lower overall than in 2002, and the street homeless population was reduced by 40%.
Figure 1: 2009 Homeless Count Results and Comparisons with 2007, 2005, and 2002
Single Adults
2009
Persons in
Families 2009
Family Status
Unknown 2009
Single Adults
2007
Persons in
Families 2007
Family Status
Unknown 2007
2009 Totals
2007 Totals
2005 Totals
2002 Totals
Street 1,269 25 1,415 1,935 66 770 2,709 2,771 2,655 4,535
Emergency Shelter 1,206 310 0 1,175 322 0 1,516 1,497 1,754 2,308
Transitional Housing & Treatment Centers
1,047 210 0 1,076 190 0 1,257 1,266 1,141 1,365
Resource Centers & Stabilization
540 0 0 321 0 0 540 321 192 331
Jail 394 0 0 400 0 0 394 400 415 Not reported
Hospitals 94 4 0 122 0 0 98 122 91 101
Total 4,550 549 1,415 5,029 578 770 6,514 6,377 6,248 8,640
Source: San Francisco Human Services Agency, 2009 San Francisco Unsheltered Homeless Count, 2009. San Francisco Human Services Agency and Abbott Little Consulting, San Francisco 2007 Homeless Count, 2007.

I. Executive Summary 2009 San Francisco Homeless Count and Survey
4 © 2009 Applied Survey Research

2009 San Francisco Homeless Count and Survey II. Introduction
© 2009 Applied Survey Research 5
II. Introduction The 2009 San Francisco Homeless Count was a community-wide effort that took place on the night of January 27, 2009. The count provides information about the homeless population that is critical to program and service planning, helps to inform the allocation of resources for services to help the homeless, and offers a means of measuring the impact of homeless programs and
services. In addition, it is required by the Department of Housing and Urban Development (HUD) as part of a national effort to enumerate the homeless population.
All jurisdictions receiving federal funding to provide housing and services for the homeless through the McKinney-Vento Homeless Assistance Grant are
required to conduct a biennial point-in-time count of unsheltered and sheltered homeless persons sometime during the last ten days of January. Currently San Francisco receives $19.8 million in Homeless Assistance Grant money. This is a critical source of funding for the City and County budget for homeless services.
Per the guidelines set forth by HUD, the point-in-time count must include all unsheltered homeless persons and sheltered homeless persons staying in emergency shelters and transitional housing programs on the date of the count. Jurisdictions report the findings of their point-in-time count in their annual application to HUD for federal funding to provide housing and services for the homeless. The compilation of data collected through point-in-time counts across the United States helps the federal government to better understand the nature and extent of homelessness nationwide.
Approximately 425 community volunteers canvassed the streets of San Francisco in teams on January 27th between 8 p.m. and midnight to visually count unsheltered homeless individuals living outdoors, in vehicles, in makeshift structures or encampments, and in other structures or areas not intended for human habitation. For the count of sheltered homeless persons, staff of emergency shelters, drop-in centers, transitional housing programs, mental health facilities, treatment centers, the County jail, and City hospitals counted the number of homeless sheltered at their facility on the night of the count. The unsheltered count was scheduled after shelter curfews took effect in order to avoid duplicate counting.
A non-intrusive, point-in-time, visual enumeration method, while HUD approved and academically sound, has some inherent biases and shortcomings, which could result in the undercount of the homeless population, particularly those subsets of the homeless population that stay in places not easily or safely accessible by enumerators, such as private property and abandoned structures. Nonetheless, the count provides a homeless population estimate for San Francisco that is used by City and County staff to plan programs and allocate resources to better serve the homeless population.
While maintaining a consistent methodology in order to generate comparable data, there were enhancements to the 2009 unsheltered and sheltered counts, including an improved methodology for enumerating those living in vehicles and encampments; a substantial increase in the use of
The count provides information
about the homeless population
that is critical to program and
service planning.

II. Introduction 2009 San Francisco Homeless Count and Survey
6 © 2009 Applied Survey Research
trained outreach workers to assist community volunteers in counting unsheltered homeless persons; and the inclusion of additional stabilization room units and one more resource center in the sheltered count. In addition, this year’s count included improvements to the survey component. A trained team of paid, currently and formerly homeless survey workers and unpaid community volunteers administered the survey to self-identifying homeless individuals, primarily in outdoor locations throughout the City. The survey elicited information about the homeless population’s demographics, history of homelessness, living conditions, barriers to overcoming homelessness, and use of homeless services.
This report details the process of planning the count, the methodology, and the findings and limitations of the data. It also provides analysis, conclusions, and a contextualized interpretation of the findings, within the overarching framework of homeless services offered in San Francisco.

2009 San Francisco Homeless Count and Survey III. Planning Process
© 2009 Applied Survey Research 7
III. Planning Process To ensure the success of the count, several City and community agencies collaborated in the areas of community outreach, volunteer recruitment, logistical planning, methodological decision-making, and interagency coordination. Applied Survey Research (ASR), a non-profit social research firm based in Santa Cruz County, provided technical assistance with these aspects of the planning process. ASR has over ten years of experience conducting homeless counts and surveys throughout California and across the nation. Their work is featured as a best practice in HUD’s publication, A Guide to Counting Unsheltered Homeless People.
Community Involvement
Local homeless service providers and advocates have been active and valued partners in the planning and implementation of previous homeless counts. The planning team invited public input on a number of aspects of the count, including the proposed methodology, volunteer orientation, and recruitment and participation of homeless workers in survey administration. The Local Homeless Coordinating Board (LHCB), the lead entity of San Francisco’s Continuum of Care, was invited to comment on the methodology, and subsequently endorsed it. The LHCB was also the primary venue to collect public feedback. The count was discussed at two LHCB meetings, and a separate community meeting was held to gather public input.
Interagency Coordination
In the early stages of the planning process, the planning team – comprised of staff from the Human Services Agency’s Housing and Homeless Division, the Liaison to the Local Homeless Coordinating Board, and private consultants from Applied Survey Research – requested the collaboration, cooperation, and participation of several government agencies that regularly interact with homeless individuals and possess considerable knowledge and expertise relevant to the planning of a comprehensive count. In November 2008, the planning team organized an initial planning meeting including representatives of the San Francisco Police Department, the Department of Public Health, the Recreation and Park Department, the Department of Public Works, the Mayor’s Office, the Office of City Administrator, and the Fully Integrated Recovery Services Team (SF FIRST), formerly the Homeless Outreach Team. The planning team requested the participation and input of these agencies in four key areas related to the unsheltered count: the recruitment and mobilization of volunteers among City staff, the identification of “hotspots” for homelessness throughout the City, the recruitment of staff to enumerate homeless individuals in City parks, and the provision of volunteer safety training and security detail on the night of the count. The planning team convened a series of more detail-focused meetings to coordinate the logistics of the unsheltered count and the park count with agency representatives in the following months. The planning team convened a final meeting of all agency representatives on January 7, 2009, during which the group reviewed and finalized all plans for the count.

III. Planning Process 2009 San Francisco Homeless Count and Survey
8 © 2009 Applied Survey Research

2009 San Francisco Homeless Count and Survey IV. Methodology
© 2009 Applied Survey Research 9
IV. Methodology San Francisco’s 2009 census and survey of its homeless population was comprised of the following components:
1. Unsheltered Count: A visual point-in-time count of unsheltered homeless persons living outdoors, in vehicles, in makeshift structures or encampments, and in other structures or areas not intended for human habitation, conducted over a four-hour time window (8 p.m. to midnight) on the night of January 27, 2009.
2. Sheltered Count: Per HUD requirements, an enumeration of homeless individuals residing in emergency shelters and transitional housing on the date of the count. In addition, San Francisco counted homeless individuals temporarily living in jails, hospitals, and mental health and drug treatment facilities on the night of the count; however, these individuals are not reported to HUD for the point-in-time count, as they fall outside the McKinney-Vento definition of homelessness.
3. Survey: A survey of homeless individuals followed the count, taking place over a three week period in February. A trained team of paid, currently and formerly homeless survey workers and unpaid community volunteers administered a comprehensive survey to self-identifying homeless individuals, primarily in outdoor locations throughout the City. The survey elicited information about the homeless population’s demographics, history of homelessness, living conditions, barriers to overcoming homelessness, and use of homeless services. The survey team employed a random selection process, approaching every third person they considered to be eligible for the survey.1 Overall, 95% of individuals approached agreed to participate in the survey. The survey team successfully completed surveys with 534 individuals encountered across all of San Francisco’s supervisorial districts.
HUD requires the submittal of point-in-time homeless count data with Continuum of Care Homeless Assistance funding applications, typically due in May or June each year.
Unsheltered Count
In devising the methodology for the count, the planning team drew upon recognized best practices as detailed in HUD’s publication, A Guide to Counting Unsheltered Homeless People. Overall, the approach used in the 2009 unsheltered count was consistent with the methodology used in 2007, in order to generate comparable data. However, this year’s count included methodological improvements in the
1 This method of selecting every third person was an attempt to eliminate bias in the selection of survey respondents. Because the exact size and composition of the overall population of homeless persons is unknown, it is possible that not every eligible person was considered in the selection of respondents. However, given the knowledge of the homeless population available to the survey team (the majority of whom were currently or formerly homeless individuals), it was a random respondent selection process. This approach of interviewing every nth person encountered is recommended by HUD in their publication A Guide to Counting Unsheltered Homeless People, revised 2008 (p.37).
In devising the methodology for the
count, the planning team drew
upon recognized best practices as
detailed in HUD’s publication.

IV. Methodology 2009 San Francisco Homeless Count and Survey
10 © 2009 Applied Survey Research
enumeration of persons living in vehicles and encampments and a substantial increase in the use of trained outreach workers to assist community volunteers in counting the street homeless population.
As in 2007, San Francisco employed a “simple street count” methodology, by which teams of volunteers canvassed all areas of the City to directly observe persons in non-shelter, non-service, public locations. Because the same methodology was used, the results from 2009 and 2007 are directly comparable. This is a more comprehensive approach than the 2005 methodology, when the point-in-time count focused enumeration efforts on attaining complete coverage of densely populated and commercial areas, with selected coverage of identified “hotspots” in more sparsely populated and residential areas.
Volunteer Recruitment and Training
Again this year, many individuals who live or work in San Francisco turned out to support the City’s effort to enumerate the local homeless population. Approximately 425 community volunteers participated in the 2009 unsheltered count. The Human Services Agency (HSA) spearheaded the volunteer recruitment effort. Extensive outreach efforts were conducted, targeting local non-profits that serve the homeless and local volunteer programs.
Project Homeless Connect publicized the upcoming count and promoted volunteer participation through an e-mail to its volunteer base and an event posting on its website. The Local Homeless Coordinating Board (LHCB), the Continuum of Care oversight body for San Francisco, also promoted community participation in the count at all general meetings and
subcommittee meetings for several months leading up to the count. The LHCB also posted an announcement and additional information about the count on its website and on the Craigslist website.
The planning committee sent a press release informing the community about the count and making an appeal for volunteer participation to media outlets approximately two weeks before the count. Volunteers registered to participate, and received additional details on the count, via a telephone hotline and dedicated SFGOV email account monitored and staffed by Applied Survey Research (ASR) support staff.
Hundreds of volunteers served as enumerators on the night of the count, canvassing the City in teams to visually count homeless persons in street locations. Volunteers also provided staffing support at the four dispatch centers, greeting volunteers, distributing instructions, maps, and equipment to enumeration teams, collecting data sheets from returning teams, and performing data entry as teams returned with their findings.
In order to participate in the count, all volunteers were required to attend a one-hour training preceding the count on January 27, 2009, from 7 to 8 p.m. In addition to the presentation given by the lead staff at the dispatch center, volunteers received printed instructions detailing how to count unsheltered homeless persons (see Appendix A). San Francisco Police Department officers provided a safety briefing to the volunteers and provided security at the dispatch centers throughout the night. Additional safety measures for the volunteers included the deployment of an experienced SF FIRST outreach worker with teams enumerating high density areas and the
Many individuals who live or work in
San Francisco turned out to support the
City’s effort to enumerate the local
homeless population.

2009 San Francisco Homeless Count and Survey IV. Methodology
© 2009 Applied Survey Research 11
provision of flashlights and fluorescent safety vests to walking enumeration teams. Approximately 35 outreach workers assisted on the night of the count, more than three times the number that participated in 2007.
Dispatch
To achieve complete coverage of the City within the four hour timeframe, the planning team identified four areas for the placement of dispatch centers on the night of the count – the Downtown (Central City), Mission, Sunset, and Bayview Districts. Volunteers selected their dispatch center at the time of registration, based on familiarity with the area or convenience. The planning team divided up the enumeration routes and assigned them to the dispatch center closest or most central to the coverage area, to facilitate the timely deployment of enumeration teams into the field.
Who Was Counted
In the volunteer training presentation and accompanying materials, volunteers were instructed on the criteria for determining whether to count an individual as homeless. The following behaviors and conditions, either alone or in combination, were points for consideration:
Walking or standing “with no purpose” (loitering)
Panhandling (with or without cup / sign)
Carrying bags, backpacks, garbage bags, suitcases, blankets, and / or bedrolls
With shopping cart containing personal belongings
Recycling, especially large numbers of items
Sleeping on the street
Disheveled
Inebriated / passed out on sidewalk
For safety reasons, the trainers instructed volunteers not to enter abandoned buildings, which may be structurally unsound and / or sites of illegal activity. Enumerators received special instructions for counting those living in vehicles, tents, and other makeshift dwellings (see Appendix A). Volunteers tallied the number of such vehicles and dwellings seen, without disturbing the occupant(s). An estimate of the number of individuals living in these vehicles, tents, and other makeshift dwellings was calculated using data on the average number of occupants of such accommodations from the subsequent survey.
Geographical Areas Covered
As in 2007, the 2009 unsheltered count included all areas of the City without exception. In the course of planning the count, the planning team deemed highway on-ramps and selected parks unsafe for nighttime enumeration by volunteers. These areas were not included in the routes canvassed by volunteer teams. To count the parks, the Recreation and Park Department (Rec / Park), the San Francisco Police Department (SFPD), and the Fully Integrated
The unsheltered count included
all areas of the City without
exception.
IV. Methodology 2009 San Francisco Homeless Count and Survey
12 © 2009 Applied Survey Research
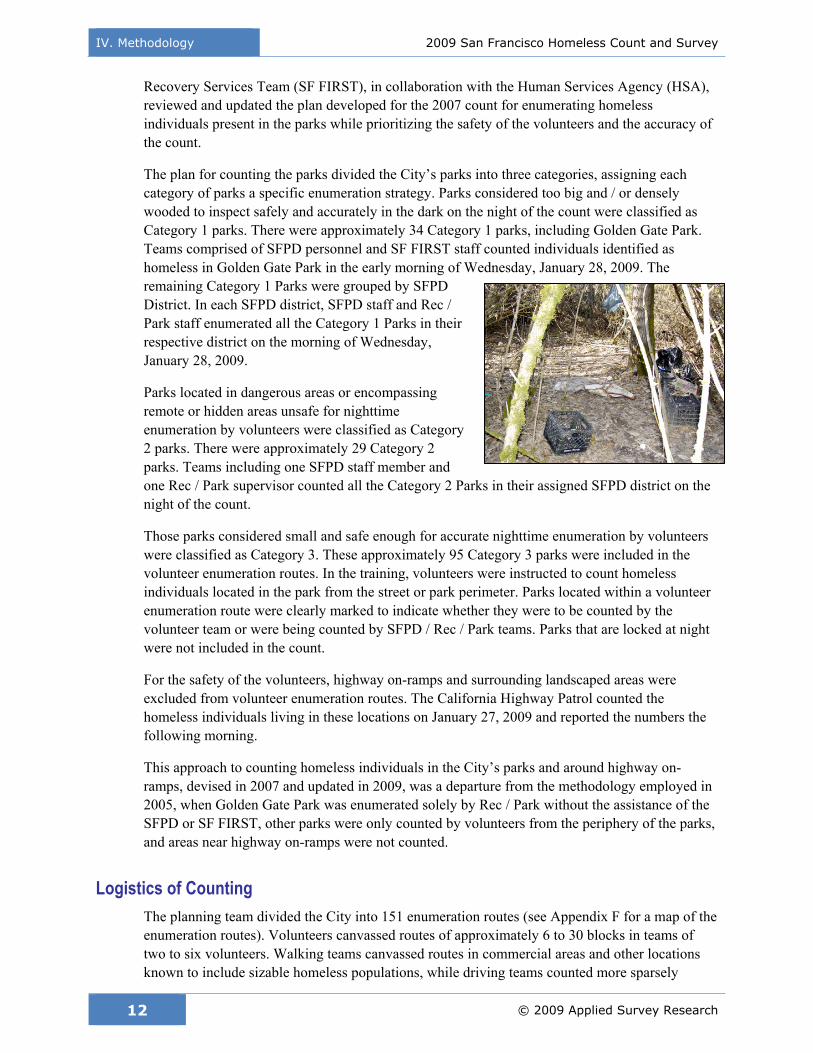
Recovery Services Team (SF FIRST), in collaboration with the Human Services Agency (HSA), reviewed and updated the plan developed for the 2007 count for enumerating homeless individuals present in the parks while prioritizing the safety of the volunteers and the accuracy of the count.
The plan for counting the parks divided the City’s parks into three categories, assigning each category of parks a specific enumeration strategy. Parks considered too big and / or densely wooded to inspect safely and accurately in the dark on the night of the count were classified as Category 1 parks. There were approximately 34 Category 1 parks, including Golden Gate Park. Teams comprised of SFPD personnel and SF FIRST staff counted individuals identified as homeless in Golden Gate Park in the early morning of Wednesday, January 28, 2009. The remaining Category 1 Parks were grouped by SFPD District. In each SFPD district, SFPD staff and Rec / Park staff enumerated all the Category 1 Parks in their respective district on the morning of Wednesday, January 28, 2009.
Parks located in dangerous areas or encompassing remote or hidden areas unsafe for nighttime enumeration by volunteers were classified as Category 2 parks. There were approximately 29 Category 2 parks. Teams including one SFPD staff member and one Rec / Park supervisor counted all the Category 2 Parks in their assigned SFPD district on the night of the count.
Those parks considered small and safe enough for accurate nighttime enumeration by volunteers were classified as Category 3. These approximately 95 Category 3 parks were included in the volunteer enumeration routes. In the training, volunteers were instructed to count homeless individuals located in the park from the street or park perimeter. Parks located within a volunteer enumeration route were clearly marked to indicate whether they were to be counted by the volunteer team or were being counted by SFPD / Rec / Park teams. Parks that are locked at night were not included in the count.
For the safety of the volunteers, highway on-ramps and surrounding landscaped areas were excluded from volunteer enumeration routes. The California Highway Patrol counted the homeless individuals living in these locations on January 27, 2009 and reported the numbers the following morning.
This approach to counting homeless individuals in the City’s parks and around highway on-ramps, devised in 2007 and updated in 2009, was a departure from the methodology employed in 2005, when Golden Gate Park was enumerated solely by Rec / Park without the assistance of the SFPD or SF FIRST, other parks were only counted by volunteers from the periphery of the parks, and areas near highway on-ramps were not counted.
Logistics of Counting
The planning team divided the City into 151 enumeration routes (see Appendix F for a map of the enumeration routes). Volunteers canvassed routes of approximately 6 to 30 blocks in teams of two to six volunteers. Walking teams canvassed routes in commercial areas and other locations known to include sizable homeless populations, while driving teams counted more sparsely
2009 San Francisco Homeless Count and Survey IV. Methodology
© 2009 Applied Survey Research 13
populated and residential areas by a combination of driving and walking. Each team received a map, which demarcated the area to be canvassed and clearly showed the boundaries of the counting area. Two smaller inset maps showed the approximate location of the route within the broader context of the City and pinpointed the location of known hotspots for homelessness. Dispatch center volunteers provided each team with tally sheets to tally homeless persons observed and record basic demographic and location information (see Appendix B: Tally Sheet for more information). Dispatch center volunteers also verified that at least one person on each team had a cell phone available for their use during the count and recorded the number on the volunteer deployment log sheet.
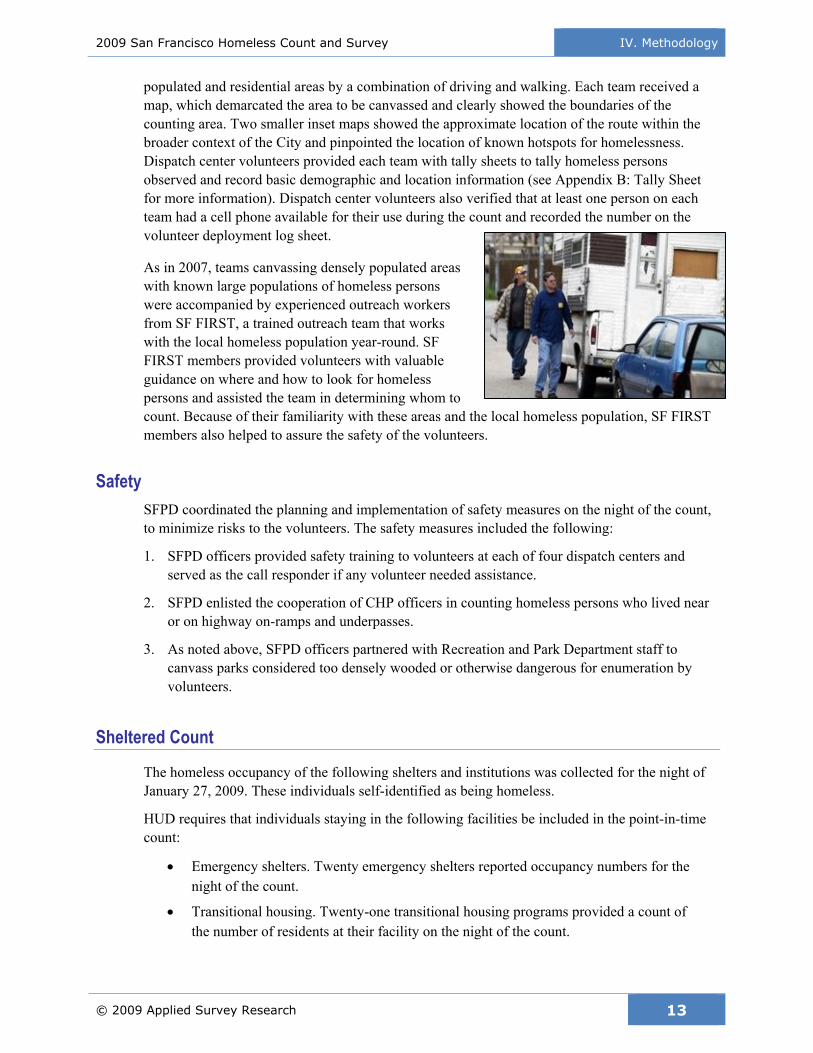
As in 2007, teams canvassing densely populated areas with known large populations of homeless persons were accompanied by experienced outreach workers from SF FIRST, a trained outreach team that works with the local homeless population year-round. SF FIRST members provided volunteers with valuable guidance on where and how to look for homeless persons and assisted the team in determining whom to count. Because of their familiarity with these areas and the local homeless population, SF FIRST members also helped to assure the safety of the volunteers.
Safety
SFPD coordinated the planning and implementation of safety measures on the night of the count, to minimize risks to the volunteers. The safety measures included the following:
1. SFPD officers provided safety training to volunteers at each of four dispatch centers and served as the call responder if any volunteer needed assistance.
2. SFPD enlisted the cooperation of CHP officers in counting homeless persons who lived near or on highway on-ramps and underpasses.
3. As noted above, SFPD officers partnered with Recreation and Park Department staff to canvass parks considered too densely wooded or otherwise dangerous for enumeration by volunteers.
Sheltered Count
The homeless occupancy of the following shelters and institutions was collected for the night of January 27, 2009. These individuals self-identified as being homeless.
HUD requires that individuals staying in the following facilities be included in the point-in-time count:
Emergency shelters. Twenty emergency shelters reported occupancy numbers for the night of the count.
Transitional housing. Twenty-one transitional housing programs provided a count of the number of residents at their facility on the night of the count.

IV. Methodology 2009 San Francisco Homeless Count and Survey
14 © 2009 Applied Survey Research
Resource centers. Four resource centers (drop-in service sites) in operation during the point-in-time count provided information.
Stabilization rooms. SF FIRST provided the number of homeless individuals in stabilization rooms - temporary program rooms in single room occupancy hotels used to provide intensive case management services to the most vulnerable and chronic of the street homeless population. Eligibility for this program, managed by SF FIRST, includes the ability to follow a case management plan to move toward stability. Stabilization rooms were included in the 2007 count, but since then the City’s stock of stabilization rooms has increased by 150 rooms; these additional rooms were also included in the 2009 count.
While HUD does not include counts of the homeless individuals in hospitals, residential rehabilitation facilities, and jails in the reportable numbers for the point-in-time count, these facilities are included in San Francisco’s sheltered count because these individuals meet San Francisco’s local definition of homelessness and the numbers provide important supplemental information for the community and service providers in their service planning efforts.
The following facilities participated in the count:
Mental health facilities and substance abuse treatment centers. The Department of Public Health and local agencies assisted in collecting counts of self-identified homeless persons staying in various facilities on the night of January 27, 2009. These census numbers included inpatient psychiatric services, Acute Diversion Units, medically-assisted and social model detoxification facilities, and residential drug treatment facilities. Ten treatment agencies / programs submitted numbers.
Jail. The San Francisco Sheriff’s Department provided a count of the number of homeless persons in the County jail on the night of January 27, 2009.
Hospitals. The San Francisco Hospital Council assisted with the coordination of obtaining census numbers from the hospitals. Staff from individual hospitals collected the number of persons who were homeless in their facilities on the night of January 27, 2009. The numbers reported for the hospitals did not duplicate the inpatient mental health units. Six local hospitals responded with their numbers, and two respite centers also provided numbers.
A designated staff person provided the census count for each of these facilities; clients were not interviewed. For the emergency shelters, transitional housing programs, resource centers, and stabilization rooms, all persons in the facility on the night of the count were included in the census because these are homeless-specific programs. For the hospitals and treatment centers, social workers or appropriate staff counted patients who identified as homeless. The San Francisco County Jail used an estimation to arrive at their census number, as discussed in the data results section.

2009 San Francisco Homeless Count and Survey IV. Methodology
© 2009 Applied Survey Research 15
Demographic data on the sheltered homeless population staying in emergency shelters and transitional housing were gathered from shelter providers by HSA at the time of the sheltered count, in compliance with HUD requirements. HUD also mandates the collection of subpopulation data in these facilities, including the number of people who are:
Chronically homeless,
Experiencing severe mental illness,
Experiencing substance abuse,
Veterans,
Domestic violence victims, and
Unaccompanied youth.
Clients were identified in one or more categories, as applicable.
Demographic data were not collected on persons counted at the resource centers, stabilization rooms, treatment centers, hospitals, or jail.
Survey
Planning and Implementation
The survey of homeless persons was conducted to gather qualitative data about the homeless community. These data were used in the application for McKinney-Vento Homeless Assistance federal funding. In addition, the qualitative data are important for homeless program development
and planning. The survey elicited information such as demographics, family status, causes of homelessness, length and recurrence of homelessness, usual nighttime accommodations, and access to homeless services through closed-ended and multiple response questions. The survey data bring greater perspective to current issues of homelessness, and the provision and delivery
of services. The collection of survey data provides a benchmark for tracking changes in the living and economic conditions of the local homeless population for future homeless studies.
The survey team included seven currently or formerly homeless individuals, who were referred by local service providers, and two community volunteers. All members of the survey team completed an orientation training session with Applied Survey Research staff, which included project background information and detailed instruction on respondent eligibility, randomized survey sampling, interviewing protocol, and confidentiality. The survey tool was reviewed in detail.
The survey was administered over a three-week period in February. Homeless workers were compensated at a rate of $5.00 per survey completed. Community volunteers conducted surveys on an unpaid basis. All surveys were reviewed by HSA staff to ensure completeness and authenticity. (For additional details on survey administration, see Appendix E.) To promote participation in the survey, HSA provided ten-minute phone cards to be offered as an incentive gift to survey respondents in appreciation for their time and participation.
The survey data bring greater
perspective to current issues of
homelessness, and the provision
and delivery of services.

IV. Methodology 2009 San Francisco Homeless Count and Survey
16 © 2009 Applied Survey Research
Survey Sampling
To survey a broad cross-section of the local homeless population, members of the survey team were instructed to employ a random selection process, in which survey workers identified possible respondents and approached every third person to administer the survey. The survey team documented refusals to take the survey. If an individual refused to take the survey, the survey worker approached the next possible respondent. After completing a survey, the survey worker continued with the “every third person” selection process. Overall, the survey refusal rate was five percent.
The survey team administered surveys across the City (in all supervisorial districts) primarily in outdoor locations such as streets and parks and around services sites. Surveys were completed in both English and Spanish; Spanish-speaking survey workers targeted their efforts in areas with large Spanish-speaking populations, such as the Mission and Downtown districts. Survey interviewers were instructed to screen possible respondents by asking them if they self-identify as homeless, inquiring if they had already taken the survey, and if not, if they were willing to do so, knowing that there was a thank you gift for completing the survey. Interviewers were asked to remain unbiased at all times, to make no prompts or assumptions, and to ask all questions but allow respondents to skip any question they did not feel comfortable answering.
The planning team decided to focus survey efforts on outdoor, street locations. Overall, 27% of those surveyed were sheltered, while the remaining 73% were unsheltered. It should be noted that this street-based approach was a departure from the service-based approach taken in 2007. In 2007, over 40% of survey respondents were sheltered.
Data Collection
Survey interviewers emphasized the anonymity and confidentiality of the survey to encourage respondents to be candid in their responses. Interviewers assured respondents that these responses would be reported only as general findings and would not be traceable to any one individual.
Overall, the interviewers experienced excellent cooperation from the respondents. The currently and formerly homeless individuals on the survey team were especially productive in administering surveys, with a very low refusal rate. This was potentially influenced by the interviewers and respondents sharing a common experience of being homeless in San Francisco. Another reason for interview cooperation may have been the incentive gift, which was given to respondents upon completion of the interview.
Data Integrity
In order to avoid potential duplication of respondents, the survey queried respondents’ initials and date of birth, so that duplication could be avoided without compromising the respondents’ anonymity. Upon completion of the survey effort, an extensive verification process was

2009 San Francisco Homeless Count and Survey IV. Methodology
© 2009 Applied Survey Research 17
conducted to eliminate potential duplicates. This process examined respondents’ date of birth, initials, gender, ethnicity, length of homelessness, and consistencies in patterns of responses to other questions in the survey. It was determined that seven of the surveys were duplicates. Therefore, 534 of the surveys conducted were valid. Based on a point-in-time estimate of approximately 6,514 homeless persons, the valid 534 surveys would represent a confidence interval of +/- 5% with a 95% confidence level, using a random survey process. Because this survey specifically targeted the street homeless population, the sample provided statistically valid information for the unsheltered population, but not for the sheltered population. The sheltered count provided supplementary information on the sheltered population.
Survey Methodological Improvements from 2007
The 2009 homeless survey expanded and improved upon San Francisco’s first homeless survey effort in 2007.
In 2007 a survey was conducted at service site locations throughout San Francisco, over a two-day period following the count. The 2007 survey was of more limited scope and focused on gathering demographic data and an estimate of the number of chronically homeless persons, which is a HUD reporting requirement. Surveys were completed at five local social service agencies. All survey responses were anonymous. Participation was voluntary, and no incentive gift was offered. Trained staff persons were not available to administer surveys at each survey location; as a result, self-administered surveys were also collected. The 2007 survey sample was 292 homeless persons.
This year, the planning team, in consultation with Applied Survey Research, improved the survey methodology by training a dedicated team of survey interviewers to administer each survey; no self-administered surveys were accepted for quality assurance purposes. The planning team
expanded outreach efforts to survey homeless persons by enlisting the participation of currently and formerly homeless individuals as paid survey workers and offering an incentive gift to respondents for participating in the survey. The planning team also expanded the scope of the survey in order to generate additional information, beyond what is required by HUD, for use in local program development and service planning efforts. As mentioned above, the expanded survey sample was
also an improvement, as it was of sufficient size to provide statistically valid information for the unsheltered population. By contrast, in 2007 the survey sample size was not large enough to provide statistically valid information on either the sheltered or unsheltered populations.
See Appendix C for a copy of the 2009 survey instrument.
The planning team expanded the
scope of the survey in order to
generate additional information,
beyond what is required by HUD,
for use in local program
development and service planning.

IV. Methodology 2009 San Francisco Homeless Count and Survey
18 © 2009 Applied Survey Research

2009 San Francisco Homeless Count and Survey V. Data Results
© 2009 Applied Survey Research 19
V. Data Results To accurately enumerate the point-in-time homeless population of San Francisco, the 2009 Homeless Count included:
1. Unsheltered homeless people, including those observed on the streets, in vehicles, and in makeshift structures and encampments;
2. Sheltered homeless people occupying emergency shelters, transitional housing, and stabilization rooms;
3. Persons occupying institutions such as hospitals, residential treatment centers, and jails (although persons in this category are not reportable to HUD).
Number of Homeless People
The point-in-time count was conducted on Tuesday, January 27, 2009, from 8 p.m. to midnight. Enumeration teams canvassed all areas of the City. Local shelters and institutions reported their occupancy for the night of the count.
There were 1,659 persons visually identified on the streets, 111 people in 74 cars, 550 people in 250 vans, campers, or RVs, and 389 people in 160 makeshift structures and encampments in San Francisco during the point-in-time count, totaling 2,709 unsheltered, or “street,” homeless persons. In addition, 3,805 persons were counted in the point-in-time shelter and institution count. The total combined count was 6,514 homeless persons.
Compared to the 2007 count, the overall number of homeless persons enumerated increased slightly (2%), from 6,377 to 6,514. However, the number of homeless persons counted on the street decreased 2% (from 2,771 to 2,709), while the number of sheltered homeless persons increased 6% (from 3,606 to 3,805). The increase in the shelter population may be explained, in part, by the addition of approximately 150 rooms to the stock of stabilization rooms since 2007 and the inclusion of the Oshun Women’s Drop In Center in the 2009 count.
Unsheltered Count
The following tables present the results of the point-in-time unsheltered count, with detailed demographic information, by supervisor district. On the night of the count, the largest population of homeless individuals by supervisor district was in district 6, with 43% of the total (see Appendix F for a map of the supervisor districts). Although volunteers were not able to determine the race or gender of many of the individuals enumerated on the night of the count, available results indicated that the majority of homeless individuals were male and either white or African American.
There were 2,709 unsheltered, or
“street,” homeless persons counted. In
addition, 3,805 persons were counted in
the shelter and institution count.
The total combined point‐in‐time count
was 6,514 homeless persons.

V. Data Results 2009 San Francisco Homeless Count and Survey
20 © 2009 Applied Survey Research
Figure 2: 2009 Unsheltered Count Results by Supervisor District: Gender and Race / Ethnicity
GENDER RACE / ETHNICITY
Supervisor District
Total Male Female Trans-gendered
Unknown Asian Black Latino Other Unknown White
1 120 40 9 0 71 0 18 1 1 67 33
2 60 14 2 0 44 1 7 1 0 45 6
3 189 100 10 0 79 0 23 6 1 97 62
4 74 6 0 0 68 0 3 0 0 68 3
5 115 49 8 3 55 3 13 2 0 56 41
6 1,167 533 115 1 518 20 309 22 4 560 252
7 45 3 3 0 39 2 0 0 0 39 4
8 92 49 6 0 37 0 5 4 0 47 36
9 132 64 7 0 61 1 17 26 0 65 23
10 444 54 8 0 382 1 33 2 0 383 25
11 43 13 1 0 29 1 3 2 0 36 1
Parks & CHP 228 109 36 0 83 2 20 5 0 88 113
Total 2,709 1,034 205 4 1,466 31 451 71 6 1,551 599
Count % in 2009
38.2% 7.6% 0.1% 54.1% 1.1 % 16.6 % 2.6% 0.2% 57.3% 22.1%
Source: San Francisco Human Services Agency, 2009 San Francisco Unsheltered Homeless Count, 2009.
For the purposes of the count, a family was defined as a single person or couple with at least one child under the age of 18, following the definition set forth by HUD. Youth were defined as persons under 18 years. Transition aged youth were defined as 18-24 years. Of the unsheltered persons counted, families and youth were small percentages of the population (0.9% and 0.3%, respectively). The majority of unsheltered homeless persons were adults not accompanied by a child under age 18. It should be noted that, for safety and other reasons, unsheltered families and youth more typically stay in places not visible to enumerators and are thus underrepresented in street counts.
During the course of the unsheltered count, enumerators counted cars, vans, campers, and RVs, and makeshift structures and encampments with what appeared to be sleeping occupants. The definition of makeshift structures and encampments for the purposes of this study was one or more makeshift structures for living, including (but not limited to) tents, tarps, cardboard, or crates actively being occupied by homeless persons. Out of concern for the privacy of the occupants and the safety of the enumerators, counters were instructed not to approach vehicles or encampment areas. Instead, when they could not clearly count the number of occupants, enumerators were asked to note on their tally sheet how many vehicles or structures / encampments they discovered.
To calculate the number of people in those vehicles and structures / encampments, empirical data from the 2009 San Francisco Homeless Survey were used to generate a multiplier. This was done by asking survey respondents who reported staying in these types of living accommodations how many people typically stayed there, producing an average number of people for each of these

2009 San Francisco Homeless Count and Survey V. Data Results
© 2009 Applied Survey Research 21
sleeping locations. The multiplier number for cars was 1.5, for vans / campers / RVs was 2.2, and for makeshift structures / encampments was 2.43. These multipliers were applied to every car, van / camper / RV, and makeshift structure / encampment identified, resulting in the numbers reported here. This method of calculation was new to the 2009 count.2
Figure 3: 2009 Unsheltered Homeless Count Results by Supervisor District: Family Status, Age, and Estimated Number of Homeless Persons Living in Cars, RVs / Vans, and Structures
FAMILY STATUS AGE VEHICLE / STRUCTURE/ ENCAMPMENT
District Total Single Adult
Individual in Family
Unknown Family Status
Adult Unknown Age
Trans-ition
Aged Youth
(18-24)
Youth (under
18)
Individuals in Cars
Individuals in RVs /
Vans
Individuals in Structures /
Encampments
1 120 57 0 63 26 91 3 0 11 27 10
2 60 22 0 38 15 44 1 0 0 22 2
3 189 114 9 66 108 77 1 3 2 4 44
4 74 6 0 68 6 68 0 0 0 46 0
5 115 68 1 46 66 45 3 1 1 11 22
6 1,167 629 13 525 602 543 20 2 12 117 192
7 45 6 0 39 5 39 1 0 3 22 0
8 92 59 0 33 55 36 1 0 3 15 10
9 132 77 0 55 70 57 5 0 1 33 17
10 444 70 2 372 64 376 3 1 42 200 80
11 43 14 0 29 14 29 0 0 6 9 5
Parks & CHP
228 147 0 81 143 85 0 0 30 44 7
Total 2,709 1,269 25 1,415 1,174 1,490 38 7 111 550 389
% of Total 2009
46.8% 0.9% 52.2% 43.3% 55.0% 1.4% 0.3% 4.1% 20.3% 14.4%
Source: San Francisco Human Services Agency, 2009 San Francisco Unsheltered Homeless Count, 2009.
Of the 1,243 unsheltered homeless persons whose gender could be visually identified by enumerators, approximately 83% were male, 16% were female, and less than 1% were transgendered. Due to the limits of observation, more than half (54%) of those counted were identified as unknown gender – this includes those sleeping in vehicles, structures, and encampments.
2 The planning team decided to use this method to improve the accuracy of the multipliers. Prior to 2009, a multiplier of 2 was applied, regardless of the type of vehicle or structure / encampment. Using survey data to derive type-specific multipliers resulted in a multiplier less than 2 for cars and multipliers greater than 2 for vans / RVs and structures / encampments. Accordingly, the number of persons in cars reported here is less than it would have been using the prior methodology, whereas the numbers of persons in vans / RVs and structures / encampments are greater than they would have been using the prior methodology. Taking all three categories together, the total number of people reported here (1,050) is 82 persons more than it would have been using the prior methodology (968). The planning team considers the numbers provided in the table, calculated with type-specific multipliers according to the new methodology, to be more accurate.

V. Data Results 2009 San Francisco Homeless Count and Survey
22 © 2009 Applied Survey Research
Unsheltered Results Comparison: 2000-2009
The following table compares the results of the 2009 unsheltered count and previous unsheltered counts. The point-in-time count of unsheltered homeless persons has remained fairly consistent since 2005, well below the counts tallied in 2001 and 2002.
Figure 4: Unsheltered Count Results Comparison 2000-2009
District 4/27/2000 10/25/2000 10/25/2001 10/29/2002 1/25/2005 Adjusted*2005
1/31/2007 1/27/2009
1 NA 3 69 127 75 75 218 120
2 NA 46 92 96 22 79 81 60
3 NA 80 280 444 166 167 206 189
4 NA 9 161 331 34 97 70 74
5 NA 136 233 569 109 110 114 115
6 NA 1,004 1,158 1,071 1,232 1,233 1,239 1,167
7 NA 9 34 266 10 25 21 45
8 NA 113 108 374 158 159 190 92
9 NA 205 238 249 191 192 200 132
10 NA 412 733 811 483 484 349 444
11 NA 9 50 197 17 34 20 43
Unsure 7
CHP 63
Parks & CHP**
228
Total 1,805 2,033 3,156 4,535 2,497 2,655 2,771 2,709
Source: San Francisco Human Services Agency, 2009 San Francisco Unsheltered Homeless Count, 2009. San Francisco Human Services Agency and Abbott Little Consulting, San Francisco 2007 Homeless Count, 2007.
* 2005 counts were adjusted to reflect areas not covered by counters.
**In 2009, park counts were combined with CHP counts, rather than added into district counts.
Sheltered Count
A point-in-time enumeration of the number of homeless persons occupying emergency shelters, transitional housing, resource centers, stabilization rooms, treatment centers, hospitals, and jails on the night of the count was conducted in conjunction with the unsheltered count. The people counted in residential treatment centers, hospitals, and jails are not reportable to HUD, but they are included within San Francisco’s local definition of homelessness. The largest group of sheltered homeless persons were those who stayed in emergency shelters (1,516 persons), comprising 40% of the total sheltered population. Transitional housing residents (964 persons) represented 25% of the overall sheltered homeless population.

2009 San Francisco Homeless Count and Survey V. Data Results
© 2009 Applied Survey Research 23
Figure 5: 2009 Sheltered and Unsheltered Count Results and Comparisons to 2007 and 2005
Single Adults 2009
Person in Families 2009
Family Status Unknown 2009
2009 Totals
2007 Totals
2005 Totals
Emergency Shelter 1,206 310 0 1,516 1,497 1,754
Transitional Housing 785 179 0 964 1,062 1,141
Treatment Centers 262 31 0 293 204
Resource Centers 233 0 0 233 182 192*
Stabilization Rooms 307 0 0 307 139
Jail 394 0 0 394 400 415
Hospitals 94 4 0 98 122 91**
Sheltered Count Total 3,281 524 0 3,805 3,606 3,593
Street Total 1,269 25 1,415 2,709 2,771 2,655
Unsheltered and Sheltered Total 4,550 549 1,415 6,514 6,377 6,248
Source: San Francisco Human Services Agency, 2009 San Francisco Unsheltered Homeless Count, 2009. San Francisco Human Services Agency, 2009 San Francisco Sheltered Homeless Count, 2009. San Francisco Human Services Agency and Abbott Little Consulting, San Francisco 2007 Homeless Count, 2007.
* Stabilization rooms were not included in the 2005 count.
** The 2005 count included numbers only from San Francisco General Hospital.
An estimate of 394 homeless persons was reported by the County jail for the night of January 27, 2009. On any given day, the Sheriff’s Department estimates that roughly 20% of the jail population is “homeless.” This estimate is based on the number of prisoners whose booking cards indicated no local address or had a “transient” designation and the number of persons who provided addresses of shelters or SROs as their residence. It should be noted, however, that some percent of those with no local address may have an address outside of the City, and some of those who report their status as “transient” may simply be unwilling to provide an address.
The 2009 sheltered count included homeless patients residing in six hospitals. The number of homeless persons enumerated in hospitals decreased by 20% (from 122 to 98) from 2007 to 2009. The number of homeless patients at San Francisco General Hospital declined by a third (from 48 to 32 persons), continuing the trend of decrease observed from 2005 to 2007 (a decline of 47%). This decline is likely attributable to the increase of “stabilization housing” units, medical respite, and other alternatives to hospitalization for the chronically homeless. The previous table illustrates the results of the sheltered count by type of shelter facility and family status. The large majority of sheltered homeless persons enumerated were adults not accompanied by a child under age 18.
Compared to 2007, there was a 6% increase in the sheltered homeless population (an increase of 199 persons). The increase in the shelter population may be explained, in part, by the addition of approximately 150 rooms to the stock of stabilization rooms since 2007 and the inclusion of the Oshun Women’s Drop In Center in the 2009 count.
Sheltered Count Demographics
As discussed in the sheltered count methodology section, HUD requires the collection of certain demographic data on the persons staying in emergency shelters and transitional housing programs. The demographic data collected from the 20 emergency shelters and 21 transitional

V. Data Results 2009 San Francisco Homeless Count and Survey
24 © 2009 Applied Survey Research
housing programs reporting census numbers on January 27, 2009 are presented in the following table. Clients were identified in one or more categories, as applicable.
Figure 6: Demographic Data: Emergency Shelter and Transitional Housing Residents, January 27, 2009
Facility Type Chronically Homeless
Serious Mental Illness
Substance Abuse
Veteran Domestic Violence
Unaccompanied Youth
Emergency Shelter 56.5% 35.4% 43.7% 9.1% 14.6% 0.1%
Transitional Housing 15.6%* 9.6% 17.3% 6.6% 10.6% 0.0%
Source: San Francisco Human Services Agency, 2009 San Francisco Sheltered Homeless Count, 2009.
*Note: These data are gathered for the purpose of local service planning, but are not reportable to HUD, as HUD does not consider individuals in transitional housing to still be chronically homeless.
Demographic data were not collected on persons counted at the resource centers, stabilization rooms, treatment centers, hospitals, or jail.
Survey Results
The following section provides an overview of the results of the 2009 San Francisco Homeless Survey. The survey findings were used to define qualitative characteristics of the overall population. The survey team successfully completed 534 surveys with unduplicated (unique) homeless individuals throughout San Francisco over a three-week period from early to late February. Approximately 8% of these surveys were conducted in Spanish. Missing values have been intentionally omitted from the 2009 survey results. Therefore, the total number of respondents for each question will not necessarily equal the total number of surveys. Please note, however, that missing values were included in tables comparing 2007 and 2009 data, for comparative purposes. A copy of the survey instrument can be found in Appendix C.
As mentioned in the methodology section of this report, the survey expanded upon the survey effort undertaken in 2007. The size of the sample increased to 534 from 292 (an 83% increase).
As also noted in the methodology section, there was a shift from a service-based survey administration method in 2007 to a street-based method in 2009. Fewer sheltered homeless
persons were included in the 2009 survey sample. They comprised 27% of the total sample in 2009, compared to over 40% of the 2007 sample. It is important to consider this change in the proportions of sheltered and unsheltered respondents when comparing survey results from 2007 and 2009.
The survey elicited information such as demographics, family status, causes of homelessness, length and recurrence of homelessness, usual
nighttime accommodations, and access to homeless services through closed-ended and multiple response questions. A complete list of survey questions and responses is included in Appendix D.
The survey findings were used to
define qualitative characteristics of
the overall homeless population.

2009 San Francisco Homeless Count and Survey V. Data Results
© 2009 Applied Survey Research 25
Demographics
In order to measure the diversity of homeless residents in San Francisco, respondents were asked to answer several questions pertaining to their age, gender, ethnicity, and military service.
Age
Approximately 36% of survey respondents were between 41 and 50 years of age.
The second and third largest age segments among respondents were 51 to 60 (24%) and 31
to 40 (21%).
Seniors (more than 60 years old) comprised 4% of survey respondents.
Race / Ethnicity
The two largest racial / ethnic groups among survey respondents were White / Caucasian
(37%) and Black / African American (35%).
15% of survey respondents identified as Hispanic / Latino.
Figure 7: Race / Ethnicity of Survey Respondents and General Population of San Francisco
34.7%
6.7%
37.3%44.7%
14.0%14.9%
0%
20%
40%
60%
80%
100%
Survey Respondents General SF Population*
Per
cent
age
of
Hom
ele
ss P
ers
ons
Black / African American White / Caucasian Hispanic / Latino
San Francisco Homeless Count Survey Respondents N = 531
General San Francisco Population N = 757,604
Source: Applied Survey Research, 2009 San Francisco Homeless Count Survey, 2009. Bay Area Census (2009). San Francisco City and County. Retrieved March 20, 2009, from Bay Area Census website. URL: www.bayareacensus.ca.gov/counties/ SanFranciscoCounty.htm.
*These are 2007 American Community Survey estimates.
Gender
Among survey respondents, the large majority was male (78%).
21% of survey respondents were female.
Transgendered people constituted 1% of survey respondents.

V. Data Results 2009 San Francisco Homeless Count and Survey
26 © 2009 Applied Survey Research
Veteran Status
17% of survey respondents had served in the United States Armed Forces.
Two‐thirds of the veterans surveyed (67%) received an honorable discharge from service.
Family Status
Three‐quarters (75%) of survey respondents indicated they were living alone at the time of
the survey.
Of those who lived with others, 36% lived with friends, 34% lived with a spouse or partner, and 6% lived with child/children.
Of the 15 of respondents who were 21 years old or younger, 7 had previously been in foster care.
Education
40% of survey respondents indicated that they had completed high school or received a GED, as their highest
level of education.
12% of unemployed respondents said that they needed
training, and 9% said they needed education, in order to
secure a job.
All six survey respondents with school‐aged children (6 – 17 years old) living with them
reported that the children were enrolled in school.
Criminal Justice
Approximately 26% of survey respondents reported they had spent one or more nights in
jail or prison in the last 12 months.
12% of those responding to the survey indicated that they had been on probation or parole when they became homeless.
17% of survey respondents
had served in the United
States Armed Forces.
40% of survey respondents
indicated that they had
completed high school or
received a GED, as their highest
level of education.

2009 San Francisco Homeless Count and Survey V. Data Results
© 2009 Applied Survey Research 27
San Francisco Residency
The large majority of survey respondents (78%) reported that they were living in San
Francisco right before they became homeless.
73% of these respondents had lived in San Francisco for one year or more; 43% were San Francisco residents for more than 10 years.
6% of those surveyed had been living in neighboring Bay Area counties (Alameda, Contra
Costa, San Mateo, Marin, and Santa Clara Counties) right before they became homeless.
Of those who came to San Francisco after becoming homeless, the most frequent response
(24%) for the primary reason for coming to San Francisco was that the individual came “for a
job / seeking work.”
The percentage of persons surveyed who reported that they became homeless outside of
San Francisco decreased from 31% in 2007 to 22% in 2009.
Figure 8: Residence When Respondent Became Homeless
Where were you living at the time you most recently became homeless?
2007 2009
Number Percent Number Percent
San Francisco 182 62.3% 418 78.3%
Outside of CA 46 15.8% 46 8.6%
Other County in CA 44 15.1% 70 13.1%
No response 20 6.8% 0 0.0%
Total 292 100.0% 534 100.0%
Source: Applied Survey Research, 2009 San Francisco Homeless Count Survey, 2009. San Francisco Human Services Agency and Abbott Little Consulting, San Francisco 2007 Homeless Count, 2007.
Characteristics of Homelessness
Characteristics of homelessness vary greatly among respondents. While many respondents were experiencing homelessness for the first time, or had been homeless just a few months, others had been homeless repeatedly or for extended periods of time. Characteristics such as usual nighttime sleeping accommodations and causes of homelessness differed across respondents.
Homeless Status
45% of survey respondents were experiencing homelessness for the first time.

V. Data Results 2009 San Francisco Homeless Count and Survey
28 © 2009 Applied Survey Research
Length of Homelessness
73% of respondents had been homeless for 12 months or longer since they last lived in a
permanent housing situation.
46% of respondents reported that they had been homeless for more than 3 years.
10% of those surveyed had been homeless for 3 months or less.
Figure 9: Length of Homelessness
How Long Have You Been Homeless?
2007 2009
Number Percent Number Percent
Less than 1 year 74 25.3% 143 26.8%
1 – 3 years 90 30.8% 147 27.5%
More than 3 years 102 34.9% 243 45.5%
Declined to answer 11 3.8% 1 0.2%
Don’t know 15 5.1% 0 0.0%
Total 292 99.9% 534 100.0%
Source: Applied Survey Research, 2009 San Francisco Homeless Count Survey, 2009. San Francisco Human Services Agency and Abbott Little Consulting, San Francisco 2007 Homeless Count, 2007.
Note: Totals may not equal 100% due to rounding.
Transition Aged Youth (18-24 Years)
Of survey respondents ages 18 to 24, 60% reported being homeless for a year or more. In 2007, 75% of respondents in
this age group had reported being homeless for one year or
more.
Of survey respondents ages 18 to 24, about 28% reported being homeless for three years or more. In 2007, 36% of
respondents in this age group had reported that they had been homeless for three years or
more.
Of survey respondents ages
18 to 24, 60% reported
being homeless for a year
or more.

2009 San Francisco Homeless Count and Survey V. Data Results
© 2009 Applied Survey Research 29
Recurrence of Homelessness
When asked how many times they had been homeless in the past 12 months, two‐thirds of
respondents (67%) indicated that they had been homeless only once (their current period of
homelessness).
17% of respondents had been homeless two or three times in the past twelve months.
14% of respondents had experienced six or more episodes of homelessness within the past
year.
Figure 10: In the Last 12 Months, How Many Times Have You Been Homeless, Including this Present Time?
66.5%
10.9% 5.7% 1.0% 1.7% 1.1%13.0%
0%
20%
40%
60%
80%
100%
One time 2 times 3 times 4 times 5 times 6 times More than6 timesP
erce
ntag
e o
f H
ome
less
Pe
rson
s
N = 523
Source: Applied Survey Research, 2009 San Francisco Homeless Count Survey, 2009.
Figure 11: In the Last 3 Years, How Many Times Have You Been Homeless, Including this Present Time?
57.0%
12.0% 8.8%2.9% 2.1% 1.3%
15.9%
0%
20%
40%
60%
80%
100%
One time 2 times 3 times 4 times 5 times 6 times More than6 timesP
erce
ntag
e o
f H
ome
less
Pe
rson
s
N= 523
Source: Applied Survey Research, 2009 San Francisco Homeless Count Survey, 2009.

V. Data Results 2009 San Francisco Homeless Count and Survey
30 © 2009 Applied Survey Research
The Chronically Homeless
The U.S. Department of Housing and Urban Development (HUD) defines chronic homelessness as:
An unaccompanied individual with a disabling condition who has been:
a. Continually homeless for one year or more; or
b. Has experienced four or more episodes of homelessness within the past 3 years.
Those currently living in transitional housing are not considered by HUD to be chronically homeless.
For the purposes of this study, a “disabling condition” was defined as a physical or mental disability (such as mental illness), alcohol or drug addiction, HIV / AIDS, chronic health conditions, or a developmental disability. Post-traumatic Stress Disorder and depression, which are not always factored into the determination of chronic homelessness, were also included as disabling conditions in this study.
Please note that the chronically homeless numbers discussed below were generated with survey data on self-reported disabling conditions, rather than verified clinical diagnoses or case management file designations. The increase in the percentage of chronically homeless survey respondents may be due, in part, to the change to a street-based surveying approach in 2009.
Of the 534 homeless persons surveyed, approximately 62% (332 persons) can be considered
chronically homeless using the above criteria.
77% of the chronically homeless are unsheltered.
Figure 12: Chronically Homeless Survey Respondents
2007 2009 Number Percent Number Percent
105 (of 292) 36.0% 332 (of 534) 62.2%
Source: Applied Survey Research, 2009 San Francisco Homeless Count Survey, 2009. San Francisco Human Services Agency and Abbott Little Consulting, San Francisco 2007 Homeless Count, 2007.
Figure 13: Where Do You Usually Stay at Night? (Top 5 Responses from Chronically Homeless Persons)
56.9%
20.2%
3.9% 3.6% 3.3%
0%
10%
20%
30%
40%
50%
60%
Outdoors /streets / parks
EmergencyShelter
Motel / Hotel Public facilies(e.g., transit
center)
A place in ahouse not
normally usedfor sleeping
N = 332 Source: Applied Survey Research, 2009 San Francisco Homeless Count Survey, 2009.

2009 San Francisco Homeless Count and Survey V. Data Results
© 2009 Applied Survey Research 31
Figure 14: Services / Assistance Used by Chronically Homeless Persons (Top 5 Responses)
81.8%
48.6% 47.4% 42.2%28.9%
0%
20%
40%
60%
80%
100%
Free meals Shelter day
services / dropin center
Project
HomelessConnect
Emergency
shelter
Health services
Multiple response question with 329 respondents offering 1,055 responses.
Source: Applied Survey Research, 2009 San Francisco Homeless Count Survey, 2009.
Usual Nighttime Accommodation
As in 2007, the survey results indicated that the majority of respondents were staying in an outdoor location or in a local emergency shelter. The survey asked about a variety of living situations that were not included in the unsheltered or sheltered counts: abandoned buildings,
motels / hotels, and locations on private property such as unconverted garages and storage buildings. Individuals staying in motels / hotels and within residences in which the person does not permanently live (often referred to as “doubled-up” or “couch surfing”) are not included in HUD’s definition of homelessness, but are included in San Francisco’s local definition of homelessness.
Half of survey respondents (50%) reported that they usually stay outdoors / on the streets / in parks at night.
24% of survey respondents usually stay in an emergency shelter at night.
5% of survey respondents usually stay at public facilities such as transit stations at night.
5% of those surveyed reported a vehicle (car, van, or camper / RV) as their usual nighttime accommodation.
Survey results indicated that the
majority of respondents were
staying in an outdoor location or in
a local emergency shelter.

V. Data Results 2009 San Francisco Homeless Count and Survey
32 © 2009 Applied Survey Research
Figure 15: Where Do You Usually Stay at Night?
1.9%
0.4%
0.6%
0.6%
0.9%
0.9%
1.3%
1.3%
2.3%
2.5%
3.8%
4.2%
5.1%
23.9%
50.3%
0% 15% 30% 45% 60%
Other
Abandoned building
Transitional housing
Unconverted garage / attic / basement
Camper
Backyard or storage structure
Van
Encampment
Automobile
Other shelter
A place in a house not normally used for sleeping
Motel / hotel
Public facilities (e.g., transit center)
Emergency shelter
Outdoors / streets / parks
N = 527
Source: Applied Survey Research, 2009 San Francisco Homeless Count Survey, 2009.

2009 San Francisco Homeless Count and Survey V. Data Results
© 2009 Applied Survey Research 33
Figure 16: Nighttime Accommodation – Comparison of Selected Data from 2007 and 2009
2007 2009
Emergency shelter 40.0% 23.6%
Outdoors / street / park 26.7% 49.6%
Motel / hotel 5.5% 4.1%
Automobile / van / camper 4.5% 4.5%
Transitional housing 2.4% 0.6%
Abandoned building 1.4% 0.4%
Source: Applied Survey Research, 2009 San Francisco Homeless Count Survey, 2009. San Francisco Human Services Agency and Abbott Little Consulting, San Francisco 2007 Homeless Count, 2007.
Note: Percentages shown here refer to the total survey sample, including those who did not respond to the question (2007 N = 292; 2009 N = 534).
Please note that the increase in the percentage of unsheltered homeless survey respondents shown in the table above may be due, in part, to the change to a street-based surveying approach in 2009 from a service site-based approach in 2007.
Prior Living Situation
Before becoming homeless, 45% of survey respondents were
“renting a home or apartment.”
31% of survey respondents were “living with parents / relatives” or “staying with friends.”
10% responding to the survey had been “living in a home
owned by you or your partner.”
Reasons for Homelessness
In addition to understanding the characteristics of the homeless population, it is important to understand the causes of homelessness. This is an important distinction because of the interrelationships of many of these issues. Homeless survey respondents self-reported a number of reasons for their condition. It should be noted that these are self-defined reasons, which do not necessarily reflect the order of the events leading to their homelessness.
Primary Causes of Homelessness
The loss of a job was the most frequently cited response (25%) for the causation of
homelessness. Unemployment was similarly the most common response in 2007.
15% of survey respondents identified alcohol or drug use as the primary cause of their
homelessness.
5% of survey respondents cited incarceration as the primary event that led to their
homelessness.
3% reported that mental health issues had precipitated their homelessness.
3% of survey respondents indicated that they became homeless due to family / domestic
violence.
Before becoming homeless,
45% of survey respondents
were “renting a home or
apartment.”

V. Data Results 2009 San Francisco Homeless Count and Survey
34 © 2009 Applied Survey Research
Figure 17: Primary Event / Condition that Led to Homelessness
16.0%
0.0%
0.6%
0.6%
0.6%
0.8%
1.1%
1.3%
1.5%
1.7%
1.9%
2.6%
3.4%
3.4%
4.5%
4.9%
5.3%
9.6%
15.2%
25.2%
0% 10% 20% 30%
Other
Asked to leave for beingLGBT*
Other natural disaster / fire/ flood
Hurricane Katrina
Got too old for foster care
Hospitalization / treatmentprogram
Death in the family
Lost my home toforeclosure
Landlord raised rent
Illness or medical problem
Landlord sold / stoppedrenting or re-used property
Don't know / decline tostate
Family / domestic violence
Mental health illness
Incarceration
Divorced or separated
Eviction
Argument / family or friendasked you to leave
Alcohol or drug use
Lost job
N = 532
Source: Applied Survey Research, 2009 San Francisco Homeless Count Survey, 2009.
* Lesbian, Gay, Bisexual, or Transgender.

2009 San Francisco Homeless Count and Survey V. Data Results
© 2009 Applied Survey Research 35
Obstacles to Securing Permanent Housing
The majority of survey respondents (52%) reported that their inability to afford rent was an
obstacle to securing permanent housing.
The second most frequently cited barrier to permanent housing was the lack of job / income
(44%).
6% of respondents indicated that they do not want to get permanent housing.
Figure 18: What is Keeping You from Getting Permanent Housing? (Top 5 Responses*)
51.8%
43.7%
14.9% 13.9%
6.0%
0%
15%
30%
45%
60%
Can't afford rent No job / noincome
No money formoving costs
(security, first /last)
No housingavailable
Don't want to
Multiple response question with 531 respondents offering 826 responses.
Source: Applied Survey Research, 2009 San Francisco Homeless Count Survey, 2009.
*Note: These are the top five responses of choices given. 12.1% responded “other.”
Employment Status
The large majority of survey respondents indicated that they were unemployed at the time
of the survey (92%).
6% of those surveyed reported that they were employed part‐time.
2% of respondents indicated that they had full‐time employment.
Barriers to Employment
More than a quarter of respondents (27%) indicated that
their lack of a permanent address was keeping them from
getting employment.
The second and third most frequently cited barriers were a
need for clothing (16%) and the lack of a phone (15%).
14% of survey respondents reported that a physical disability was keeping them from securing employment.
More than a quarter of
respondents indicated that
their lack of a permanent
address was keeping them
from getting employment.

V. Data Results 2009 San Francisco Homeless Count and Survey
36 © 2009 Applied Survey Research
Figure 19: What is Keeping You from Getting Employment? (Top 5 Responses)
26.6%
15.6% 15.2% 14.3% 13.5%
0%
10%
20%
30%
No permanentaddress
Need clothing No phone Physical disability No showerfacilities
Multiple response question with 488 respondents offering 1,038 responses.
Source: Applied Survey Research, 2009 San Francisco Homeless Count Survey, 2009.
Accessing Services
Receiving government assistance and accessing homeless services may enable homeless individuals to transition out of homelessness. However, many people do not apply for these programs and services or do not feel they qualify for aid.
Government Assistance
38% of survey respondents reported that they receive Food Stamps.
21% of those surveyed received County Adult Assistance Program / GA.
21% of respondents indicated that they receive SSI (Supplemental Security Income) / SSDI.
34% of respondents were not currently receiving government assistance at the time of the
survey.
Reasons for Not Receiving Government Assistance
The most frequent reason reported for not receiving government assistance was that the
individual had never applied (18%).
17% of survey respondents indicated that they did not think they were eligible to receive assistance.
17% of those surveyed responded that they did not need government assistance.

2009 San Francisco Homeless Count and Survey V. Data Results
© 2009 Applied Survey Research 37
Figure 20: Reasons for Not Receiving Government Assistance (Top 5 Responses)
18.4%16.8% 16.8%
14.0%12.8%
0%
5%
10%
15%
20%
25%
Never applied Don't think I'meligible
Don't needgovernmentassistance
Have noidentification
Will apply soon
Multiple response question with 179 respondents offering 237 responses.
Source: Applied Survey Research, 2009 San Francisco Homeless Count Survey, 2009.
Homeless Services and Programs
The type of service most commonly accessed by survey respondents was free meals (78% of
respondents).
Over 40% of respondents indicated that they access each of the following services: emergency shelter (45%), shelter day services / drop‐in center (43%), and Project Homeless
Connect (42%).
27% of respondents reported that they access health services.
Figure 21: Services / Assistance Currently Being Used by Respondents (Top 5 Responses)
77.8%
45.2% 43.3% 42.3%
27.1%
0%
20%
40%
60%
80%
100%
Free meals Emergencyshelter
Shelter dayservices / drop
in center
ProjectHomelessConnect
Health services
Multiple response question with 527 respondents offering 1,615 responses.
Source: Applied Survey Research, 2009 San Francisco Homeless Count Survey, 2009.

V. Data Results 2009 San Francisco Homeless Count and Survey
38 © 2009 Applied Survey Research
Sources of Income
While some respondents were able to earn income from employment, many respondents were receiving income from public assistance, panhandling, or other sources.
Income from Government Sources
47% of survey respondents reported that they do not receive income from government programs.
Over a quarter of respondents (26%) reported receiving between $1 and $500 per month from government programs.
13% of those surveyed received $1 to $100 per month from
government programs.
Income from Private Sources
Over 70% of those surveyed reported that they receive $0 (40%) or $1‐100 (33%) monthly
from non‐government sources.
44% of respondents identified recycling as a source of income.
A third of survey respondents (33%) received funds from family / friends.
Panhandling
Two‐thirds of survey respondents (67%) reported that they do not panhandle (ask people for money or spare change).
Of those who panhandle, 31% reported that they panhandle 1 to 5 days a month.
46% of those who panhandle reported that they receive $50 or less in a typical month.
Figure 22: Do You Panhandle, or Ask People for Money or Spare Change?
No67.0%
Yes33.0%
N = 522
Source: Applied Survey Research, 2009 San Francisco Homeless Count Survey, 2009.
47% of survey
respondents reported
that they do not receive
income from government
programs.

2009 San Francisco Homeless Count and Survey V. Data Results
© 2009 Applied Survey Research 39
Alcohol and Drug Abuse
Substance use (alcohol or drugs) was the second-most cited cause of homelessness among the homeless survey population in San Francisco. Furthermore, many survey respondents reported that they were currently abusing alcohol or drugs.
Alcohol Abuse
32% of survey respondents indicated that they were currently experiencing alcohol abuse.
Drug Abuse
31% of those surveyed said they were currently experiencing drug abuse.
Recovery
Of those currently experiencing substance abuse, 14% reported that they are currently receiving alcohol / drug counseling.
Domestic Violence
9% of survey respondents indicated that they were currently experiencing domestic
violence.
Of the females surveyed, 18% reported that they were currently experiencing domestic
abuse.
Health Status and Medical Care
Access to health care, so vital to general well being, is an area of particular concern among homeless service providers. While many people struggle with the high costs of health care, homeless people are particularly vulnerable to the challenges of accessing adequate care.
Access to Medical Care
In their current period of homelessness, 23% of survey
respondents have needed medical care and been unable to receive it.
The top three responses about where respondents usually receive medical care were:
hospital emergency room (28%), public health clinic (27%), and free clinic / community clinic
(26%).
5% of survey respondents said that they had visited a hospital emergency room more than 5
times in the last 12 months to receive treatment.
41% of those surveyed reported that they had not visited a hospital emergency room for
any treatment in the past 12 months.
23% of survey respondents have
needed medical care and been
unable to receive it.

V. Data Results 2009 San Francisco Homeless Count and Survey
40 © 2009 Applied Survey Research
Mental Illness
30% of survey respondents reported that they were currently experiencing mental illness.
The majority of respondents (55%) said that they were
currently experiencing depression.
73% of those who reported experiencing mental illness and
/ or depression were unsheltered.
85% of survey respondents currently experiencing mental illness and/or depression were
not receiving mental health services.
Post-Traumatic Stress Disorder
29% of survey respondents reported that they were experiencing Post‐traumatic Stress
Disorder (PTSD).
44% of veterans surveyed said they are currently experiencing PTSD.
Physical Disability
Approximately 37% of survey respondents said that they were currently experiencing a
physical disability.
HIV and AIDS
About 4% of survey respondents said that they were currently experiencing HIV / AIDS or related illnesses.
Chronic Health Problems
One in three respondents (34%) reported that they were currently experiencing chronic health problems.
Developmental Disability
12% of survey respondents said that they were currently experiencing a developmental disability (a chronic condition
that significantly limits a person’s ability to speak, hear, see,
walk, learn, or perform fundamental tasks).
According to survey responses, the service most utilized by
those reporting a developmental disability was free meals (71%).
About 7% of those who reported experiencing a developmental disability said that they did
not use any homeless services.
12% of survey respondents
said that they were
currently experiencing a
developmental disability.

2009 San Francisco Homeless Count and Survey V. Data Results
© 2009 Applied Survey Research 41
Nutrition
About 3 in 5 (62%) survey respondents said that they got enough to eat on a daily basis.
Figure 23: Do You Usually Get Enough to Eat on a Daily Basis?
61.5%
19.5% 19.1%
0%
25%
50%
75%
Yes Sometimes No
N = 524
Source: Applied Survey Research, 2009 San Francisco Homeless Count Survey, 2009.
Survey Implications
In comparing the population included in the survey sample with the populations enumerated in the unsheltered and sheltered counts, the demographic composition of the populations differ. Survey results suggest that there may be a larger percentage of Hispanic / Latino homeless persons in the local homeless population. Hispanics / Latinos comprised 15% of the survey sample, but only 3% of the unsheltered count population. This implication is in agreement with the survey findings in 2007. A possible explanation is that homeless Hispanics / Latinos as a group are less likely to stay in outdoor nighttime locations visible to enumerator teams (e.g., streets and other public places).
As discussed in the methodology section of this report, the shift to a street-focused surveying approach resulted in a higher percentage of unsheltered survey respondents compared to 2007 and generated considerable data on the unsheltered homeless population of San Francisco. These data can provide a baseline of information about the unsheltered homeless population. Continued use of such a surveying approach will enable the tracking of trends in key indicators about the unsheltered population, such as chronically homeless status, disability and health status, and service use. This information may prove very useful in providing outreach and services to unsheltered homeless persons, who are often less integrated into support service networks than their sheltered counterparts.
Continued use of such a surveying
approach will enable the tracking
of trends in key indicators about
the unsheltered population.

V. Data Results 2009 San Francisco Homeless Count and Survey
42 © 2009 Applied Survey Research

2009 San Francisco Homeless Count and Survey VI. Limitations
© 2009 Applied Survey Research 43
VI. Limitations There are limitations and constraints to every study. The following shortcomings of the San Francisco Homeless Count and Survey could be addressed in the future, with the investment of additional resources.
Unsheltered Count Limitations
The biennial point-in-time counts are organized around HUD’s definition of homelessness, which is limited to people who are living on the streets, staying in places not intended for human habitation, or residing in emergency shelters or transitional housing facilities. San Francisco has
adopted a broader local definition of homelessness that also includes people who are moving from one acquaintance’s house to another, families staying in units that are inadequate in terms of occupancy standards, and others who are transient but temporarily residing indoors in private residences on the night of the count.
In its efforts to serve the local homeless population, San Francisco targets both outreach and services to those encompassed by the broader definition of homelessness, particularly families, children, and youth, who are in need yet remain ineligible for HUD homeless assistance. However, due to the significant additional financial and human resources that would be required, San Francisco has not adopted a strategy of trying to enumerate all of the people included in the local definition of homelessness because this effort would potentially divert much-needed resources from direct homeless assistance. Thus, the point-in-time count was limited to those who were found in street locations or in designated facilities on January 27, 2009, in accordance with the guidelines set forth by HUD. Point-in-time counts are “snapshots” that quantify the size of the homeless population at a given point during the year. Hence, the count may not be representative of fluctuations and compositional changes in the homeless population seasonally or over time.
There are many challenges in any point-in-time homeless enumeration, especially when implemented in a community as diverse as San Francisco. While homeless populations are typically concentrated around downtown emergency shelters and homeless services facilities, homeless individuals and families can also be found in locations in residential neighborhoods, commercial districts, and outlying areas that are not easily accessible by enumerators. Homeless populations include several difficult-to-enumerate subsets such as:
Chronically homeless persons who never or seldom access social and health services;
Persons living in vehicles who relocate frequently;
Persons who have minor children and stay “under the radar” because of the difficulty of maintaining an intact family on the street;
San Francisco has adopted a
broader local definition of
homelessness than HUD’s.

VI. Limitations 2009 San Francisco Homeless Count and Survey
44 © 2009 Applied Survey Research
Homeless youth who usually tend to keep themselves less visible than homeless adults for safety and other reasons;
Immigrant groups and other subpopulations who live in overcrowded shared residences or rental units above safe occupancy levels; and
Homeless people who sleep in abandoned buildings and other structures unfit for habitation.
Unsheltered Undercount
In this non-intrusive, point-in-time, visual homeless enumeration, it should be noted that the methods employed, while HUD approved, have some inherent biases and shortcomings. Even with the assistance of experienced homeless service providers and outreach workers, the methodology cannot guarantee 100% accuracy. Many factors may have contributed to an unsheltered undercount, for example:
The employed homeless may have been at work or in transit during the count and may not have been identified as being homeless;
Homeless individuals often occupy abandoned buildings and other structures unfit for human habitation, which are unsafe for enumerator teams to enter and inspect;
Homeless youth often “couch surf” from one location to another, making their identification difficult;
Homeless families, and some immigrant populations, are more likely to seek opportunities to “double-up” and “triple-up” in housing with family and friends, rather than sleep on the street, in vehicles, or makeshift shelters, thus making their identification difficult; and
It can be difficult to identify homeless persons who may be sleeping in cars, vans, or campers / recreational vehicles.
Based on the reasons listed above, the homeless census methodology most likely resulted in an undercount of homeless immigrants, some of the working homeless, homeless families, and street youth.
Some community members have expressed particular concern regarding the undercount of homeless families. The San Francisco Unified School District (SFUSD) employs a broader definition of homelessness in its record-keeping.3 SFUSD estimates that there were 1,623 homeless school-aged youth enrolled in the district, from pre-K to 12th grade, in January 2009. In addition to the number provided by the school district, San Francisco also gathers data on homeless families from the Connecting Point family waitlist. Connecting Point is a centralized intake program for families who are seeking emergency shelter in San Francisco. The waitlist, which is updated on a weekly basis, captures the number of families who have come to Connecting Point seeking shelter. On January 27, 2009, there were 176 families on this waitlist. The locations where these families stay while waiting for shelter
3 SFUSD includes children and youth living in shelters, single room occupancy (SRO), transitional housing, the streets, cars, abandoned buildings, and doubled-up and other inadequate accommodations in their estimate.
The homeless census methodology
most likely resulted in an
undercount of homeless
immigrants, some of the working
homeless, homeless families, and
street youth.

2009 San Francisco Homeless Count and Survey VI. Limitations
© 2009 Applied Survey Research 45
varies, including vehicles, hotels, the homes of family or friends, and time-limited transitional recovery or domestic violence programs.
Despite the instructions provided to volunteers, the visual assessment of who is homeless during the unsheltered “public places” count involves subjectivity. Volunteers may not count those homeless individuals who do not manifest any of the characteristics or behaviors described in the volunteer instructions. Conversely, persons involved in behaviors stereotypically associated with the homeless, such as panhandling, may be mistakenly counted as homeless even if they are housed. In addition, counts of individuals in vehicles and makeshift structures are estimates because volunteers were instructed not to approach or enter these types of nighttime accommodations out of concern for the privacy of the homeless population and the safety of volunteers.
HSA has considered other unsheltered count methodologies, in the interest of decreasing the subjectivity involved in the count and attaining a more accurate number. One approach that has been considered is conducting interviews of all persons observed during the street count to determine whether they self-identify as homeless. Covering the entire city using this approach would require significantly more volunteers or a multiple-night count. A multiple-night count is a more expensive approach and would require additional resources. Moreover, a multiple-night
count would require a methodology to eliminate duplicate counting of individuals. In addition, interviewing raises concerns about disturbing the privacy of homeless persons and compromising the safety of volunteer enumerators.
The methodological approach used was necessary in order to prevent duplicate counting and preserve the integrity of the data collected. Although the unsheltered count was most likely an undercount of the homeless population, the methodology employed, coupled with the homeless survey
data, was the most comprehensive approach available, given resource constraints. A possible improvement to be considered for future unsheltered counts is outreach to and inclusion of currently homeless persons of various subpopulations, who could offer strategic assistance in enumerating difficult-to-count populations such as families, youth, and those residing in vehicles.
Sheltered Count Limitations
Program staff, rather than homeless persons, provided the data collected in the sheltered count. There may be some variance in the data that the homeless individuals would have self-reported. In the case of the County jail, the number of homeless individuals occupying the jail on the night of the count was an estimate, not an exact count. The sheltered count, like the unsheltered count, is a point-in-time snapshot of the homeless population, which may not be representative of variations in composition and size seasonally and over the course of the year.
The enumeration of homeless persons in hospital facilities is a challenge in many communities. A possible improvement to be considered for future sheltered counts is more comprehensive
Although the unsheltered count
was most likely an undercount of
the homeless population, the
methodology employed, coupled
with the homeless survey data,
was the most comprehensive
approach available.

VI. Limitations 2009 San Francisco Homeless Count and Survey
46 © 2009 Applied Survey Research
enumeration of homeless persons staying in hospitals on the night of the count. This would require additional outreach to involve these facilities as partners in the homeless enumeration effort.
Survey Limitations
This year, many improvements were made to the survey component of the project including the translation of the survey instrument into Spanish and targeted outreach to Spanish-speaking populations by bilingual survey workers and volunteers. However, the homeless survey does not include an equal representation of all homeless experiences. The administration of the surveys in street locations tends to over-represent the street and emergency sheltered homeless, resulting in under-representation of transitional housing residents and a potentially large population of homeless individuals and families living in unfit or overcrowded housing.
In survey research, there is always an opportunity for misrepresentation or bias. This is noted and acknowledged by HUD in their homeless street count guidelines.4 In the administration of the survey, definitions were not given to respondents by the interviewer. Therefore, all results are based on self-
definitions. It is important to make every effort to elicit the most truthful responses from interviewees. The recruitment and training of paid currently and formerly homeless survey workers was an effort to encourage candor on the part of respondents, as a peer interviewing strategy is believed to allow respondents to be more forthcoming in their answers and to reduce the apprehension of revealing personal information.
Despite these limitations, the survey results provide considerable information about homelessness in San Francisco, of potential use in outreach and service planning, particularly for the unsheltered homeless, as discussed in the methodology section of this report.
Although surveys were administrated across the City, in all supervisorial districts, some neighborhoods were underrepresented in the survey sample, particularly in the Bayview district. A possible improvement to be considered for future survey efforts is a more precise approach to targeting the administration of surveys on the street, to ensure the equal representation of homeless persons in all areas of the City, and a strategy for reaching a greater number of transitional housing residents through their housing program or other venues.
4 U.S. Department of Housing and Urban Development, Office of Community Planning and Development. A Guide to Counting Unsheltered Homeless People, Second Revision. January 2008.
Peer interviewing strategy is
believed to allow respondents to be
more forthcoming in their answers.

2009 San Francisco Homeless Count and Survey VII. Conclusion
© 2009 Applied Survey Research 47
VII. Conclusion The biennial point-in-time count offers an opportunity to assess changes in the size and composition of San Francisco’s homeless population over time. For HSA and other local homeless service providers, it also provides data to track the impact of programs on the overall condition of the homeless population.
Though the 2009 point-in-time count registered a slight increase in the homeless population of San Francisco, this should not detract from the tremendous progress that the City has made in addressing the issue of homelessness through a number of successful programs, which have
positively impacted the lives of thousands of people over the past two years. Indeed, even within the context of the slight increase in the overall homeless population, there was a slight shift in the balance of unsheltered and sheltered persons, with the sheltered population increasing and the street population decreasing.
It is difficult to assess changes in the composition and condition of the local homeless population between 2007 and 2009, due to the change in the survey methodology and instrument. However, this year’s survey provides a baseline of information on the local homeless population
across numerous indicators. The continued use of this survey instrument will generate longitudinal data that will illustrate changes in the homeless population and condition over time of great use in outreach efforts and service planning.
Within a major metropolitan area such as San Francisco, many factors contribute to the size of the local homeless population. The survey found that job prospects and the presence of a support network of family and friends draw sizable numbers of already homeless persons to San Francisco. The availability of homeless services in San Francisco may also attract additional homeless persons and persons on the verge of becoming homeless. As noted in the Executive Summary, 38% of homeless survey respondents reported that they first became homeless outside of San Francisco or were relative newcomers, having lived in the City for three months or less.
The relatively stable size of the local homeless population obscures the fact that many individual lives have been changed for the better through San Francisco’s homeless initiatives. It is important to consider the results of the 2009 count within the context of local efforts to move individuals and families out of homelessness, through the provision of housing and support services. Since 2004, San Francisco has continued several ambitious initiatives to reduce the size of the homeless population, including the Five Year Strategic Plan Toward Ending Homelessness and the Ten Year Plan to End Chronic Homelessness. Approximately 9,143 homeless single adults have left the streets or shelter system for permanent housing since January 2004, with the assistance of the programs outlined below, either by securing permanent housing in the City or by returning home to a city outside of San Francisco. The following is a summary of these initiatives and their impacts to date.
The slight increase in the
homeless population of San
Francisco should not detract from
the tremendous progress that the
City has made in addressing the
issue of homelessness through a
number of successful programs
over the past two years.

VII. Conclusion 2009 San Francisco Homeless Count and Survey
48 © 2009 Applied Survey Research
Care Not Cash: Care Not Cash is a program that offers homeless recipients of County general assistance housing / shelter and support services as a portion of their benefit package. Homeless persons receiving cash assistance from the City’s County Adult Assistance Program (CAAP) were phased into Care Not Cash over a seven-month period (from May through November 2004). CAAP is San Francisco's cash aid program for adults without dependent children. From June 2004 to January 2007, the population of homeless single adults receiving public assistance dropped from over 2,175 individuals to 373. By the end of January 2009, a total of 2,528 homeless CAAP recipients had been placed in permanent housing through the Care Not Cash Program cumulatively, and another 705 had found housing on their own.
Housing First: In addition to the population impacted by Care Not Cash, the Human Services Agency master leasing program, called Housing First, also provides permanent housing for homeless single adults referred by emergency shelters and community-based agencies. The number of individuals placed into housing between January 1, 2004 and January 31, 2009 was 4,616. This number includes both Care Not Cash and non-Care Not Cash, Shelter Plus Care, and Local Operating Subsidy Program (LOSP) sites.
Direct Access to Housing (DAH): The Department of Public Health operates the Direct Access to Housing Program, which provides permanent housing to formerly homeless persons with disabilities referred through the public health care system. The DAH program has housed a total of 1,225 single adults since January 2004.
Fully Integrated Recovery Services Team (SF FIRST): Since the 2005 homeless count, San Francisco has increased outreach efforts to homeless persons living on the street who are not using available services. Services offered include case management, enrollment in food stamps, temporary stabilization housing, primary care, mental health and substance abuse treatment, and referral to permanent housing. From July 2007 to February 2009, SF FIRST has case managed 1,396 clients and engaged 267 in treatment. Since July 2005, they have permanently housed 567 people and linked 788 people to cash assistance programs (e.g., CAAP, Food Stamps, SSI, Veteran’s Benefits, and State Disability). SF FIRST also manages stabilization rooms, temporary program rooms in single room occupancy hotels that are used to provide intensive case management services to the most vulnerable and chronic street homeless people. Case plans to move toward stability and follow through with case management are the key eligibility components of this program.
Homeward Bound: The Homeward Bound Program (HBP) reunites homeless persons living in San Francisco with family and friends living elsewhere. Homeless clients who request to return home through this program must be living in San Francisco, and be medically stable enough to successfully travel to the destination. HBP staff directly contact the client’s family member or friend at the point of destination to

2009 San Francisco Homeless Count and Survey VII. Conclusion
© 2009 Applied Survey Research 49
ensure that the client will have a place to reside and have ample support to assist in establishing stabilized housing and transition from homelessness. A total of 3,646 homeless individuals have been assisted by this program since February 2005.
Rental Subsidies and Rental Assistance for Homeless Families. Since 2007, 111 families have successfully transitioned off of the rental subsidy program. Another 194 families are currently receiving a rental subsidy.
Project Homeless Connect (PHC): Every other month over 1,000 community volunteers partner with city government, nonprofits, and the private sector to provide a one-stop clearinghouse of health and human services for homeless San Franciscans. Services include medical, mental health, substance abuse, housing, dental, benefits, legal, free eyeglasses, California ID, food, clothing, wheelchair repair, and more. The main goal of PHC is to transition the City's homeless off the streets and into permanent, supportive housing. To date, there have been 27 Project Homeless Connect events, including a special PHC for Homeless Veterans and Homeless Families, with between 1,800 and 2,000 clients served at each event.
San Francisco remains committed to providing housing and services through innovative and effective programs, to move individuals and families out of homelessness. The completion of the 2009 count provides HUD-required data for federal funding for San Francisco’s Continuum of Care (CoC), a network of local homeless service providers that collaboratively plan, organize, and deliver housing and services to meet the needs of homeless people as they move toward stable housing and maximum self-sufficiency. These Homeless Assistance Grant funds (currently $19.8 million annually) provide much-needed resources to shelter, house, and serve the local homeless population under study in this report.
San Francisco remains committed
to providing housing and services
through innovative and effective
programs, to move individuals and
families out of homelessness.

VII. Conclusion 2009 San Francisco Homeless Count and Survey
50 © 2009 Applied Survey Research

2009 San Francisco Homeless Count and Survey Appendix A: Volunteer Instructions
© 2009 Applied Survey Research 51
Appendix A: Volunteer Instructions

Appendix A: Volunteer Instructions 2009 San Francisco Homeless Count and Survey
52 © 2009 Applied Survey Research

2009 San Francisco Homeless Count and Survey Appendix A: Volunteer Instructions
© 2009 Applied Survey Research 53

Appendix A: Volunteer Instructions 2009 San Francisco Homeless Count and Survey
54 © 2009 Applied Survey Research

2009 San Francisco Homeless Count and Survey Appendix B: Tally Sheet
© 2009 Applied Survey Research 55
Appendix B: Tally Sheet

Appendix B: Tally Sheet 2009 San Francisco Homeless Count and Survey
56 © 2009 Applied Survey Research

2009 San Francisco Homeless Count and Survey Appendix C: Survey Instrument
© 2009 Applied Survey Research 57
Appendix C: Survey Instrument

Appendix C: Survey Instrument 2009 San Francisco Homeless Count and Survey
58 © 2009 Applied Survey Research

2009 San Francisco Homeless Count and Survey Appendix C: Survey Instrument
© 2009 Applied Survey Research 59

Appendix C: Survey Instrument 2009 San Francisco Homeless Count and Survey
60 © 2009 Applied Survey Research

2009 San Francisco Homeless Count and Survey Appendix D: Survey Results
© 2009 Applied Survey Research 61
Appendix D: Survey Results Please note that missing values (i.e., questions to which the survey respondent did not provide an answer) have been intentionally omitted from these survey results. In addition, some questions were asked only of a subset of the respondents, based on their response to a prior question. Therefore, the total number of respondents for each question may not equal the total number of surveys administered.
1. Age
Response Frequency Percent
13 - 17 years 1 0.2%
18 - 21 years 15 2.8%
22 - 30 years 65 12.2%
31 - 40 years 112 21.1%
41 - 50 years 192 36.2%
51 - 60 years 126 23.7%
More than 60 years 20 3.8%
Total 531 100.0%
2. Which racial / ethnic group do you identify with the most?
Response Frequency Percent
White / Caucasian 198 37.3%
Black / African American 184 34.7%
Hispanic / Latino 79 14.9%
Other / Multi-ethnic 38 7.2%
American Indian / Alaskan Native 20 3.8%
Asian 7 1.3%
Pacific Islander 5 0.9%
Total 531 100.0%
3. How do you identify yourself?
Response Frequency Percent
Male 414 78.4%
Female 108 20.5%
Transgender 6 1.1%
Total 528 100.0%

Appendix D: Survey Results 2009 San Francisco Homeless Count and Survey
62 © 2009 Applied Survey Research
4. Have you ever served in the United States Armed Forces?
Response Frequency Percent
Yes 91 17.2%
No 439 82.8%
Total 530 100.0%
4a. If yes, what is your discharge status?
Response Frequency Percent
Honorable 59 67.0%
General 10 11.4%
Other than Honorable 8 9.1%
Dishonorable 3 3.4%
Other 6 6.8%
Don't know 2 2.3%
Total 88 100.0%
5. Do you live alone without family, partner, or friends?
Response Frequency Percent
Yes 396 75.1%
No 131 24.9%
Total 527 100.0%
5a. If no, do you live with:
Response Frequency Percent
Friend(s) 44 36.1%
Spouse or partner 42 34.4%
Other family member(s) 10 8.2%
Child / children 7 5.7%
Parent or legal guardian 2 1.6%
Other 25 20.5%
Multiple response question with 122 respondents offering 130 responses.

2009 San Francisco Homeless Count and Survey Appendix D: Survey Results
© 2009 Applied Survey Research 63
6. Where do you usually stay at night?
Response Frequency Percent
Outdoors / streets / parks 265 50.3%
Emergency shelter 126 23.9%
Public facilities (train station, bus depot, transit center, etc.)
27 5.1%
Motel / hotel 22 4.2%
A place in a house not normally used for sleeping (kitchen, living room, etc.)
20 3.8%
Other shelter 13 2.5%
Automobile 12 2.3%
Encampment 7 1.3%
Van 7 1.3%
Backyard or storage structure 5 0.9%
Camper 5 0.9%
Unconverted garage / attic / basement 3 0.6%
Transitional housing 3 0.6%
Abandoned building 2 0.4%
Other 10 1.9%
Total 527 100.0%
7. Is this the first time you have been homeless?
Response Frequency Percent
Yes 238 44.6%
No 296 55.4%
Total 534 100.0%
7a. If yes, in the last 12 months how many times have you been homeless, including this present time?
Response Frequency Percent
One time 348 66.5%
2 times 57 10.9%
3 times 30 5.7%
4 times 5 1.0%
5 times 9 1.7%
6 times 6 1.1%
More than 6 times 68 13.0%
Total 523 100.0%

Appendix D: Survey Results 2009 San Francisco Homeless Count and Survey
64 © 2009 Applied Survey Research
7b. If yes, in the last 3 years how many times have you been homeless, including this present time?
Response Frequency Percent
One time 298 57.0%
2 times 63 12.0%
3 times 46 8.8%
4 times 15 2.9%
5 times 11 2.1%
6 times 7 1.3%
More than 6 times 83 15.9%
Total 523 100.0%
8. How long have you been homeless since you last lived in a permanent housing situation?
Response Frequency Percent
7 days or less 5 0.9%
8 - 30 days 8 1.5%
2 months 20 3.8%
3 months 20 3.8%
4 months 13 2.4%
5 months 9 1.7%
6 months 24 4.5%
7 months 8 1.5%
8 months 8 1.5%
9 months 18 3.4%
10 months 5 0.9%
11 months 5 0.9%
12 months 22 4.1%
1 - 2 years 64 12.0%
2 - 3 years 61 11.4%
More than 3 years 243 45.6%
Total 533 100.0%

2009 San Francisco Homeless Count and Survey Appendix D: Survey Results
© 2009 Applied Survey Research 65
9. Where were you living right before you most recently became homeless?
Response Frequency Percent
San Francisco 418 78.3%
Out of state 46 8.6%
Other county in California 37 6.9%
Alameda County 15 2.8%
Contra Costa County 7 1.3%
San Mateo County 7 1.3%
Marin County 3 0.6%
Santa Clara County 1 0.2%
Total 534 100.0%
9a. If you were living in San Francisco, how long had you lived in the City before becoming homeless?
Response Frequency Percent
7 days or less 68 16.6%
8 - 30 days 4 1.0%
1 - 3 months 15 3.7%
4 - 6 months 14 3.4%
7 - 11 months 9 2.2%
1 - 2 years 33 8.1%
3 - 5 years 52 12.7%
6 - 10 years 38 9.3%
More than 10 years 176 43.0%
Total 409 100.0%
9b. What was the primary reason you came to San Francisco?
Response Frequency Percent
For a job / seeking work 38 24.2%
My family and / or friends are here 23 14.6%
I visited and decided to stay 23 14.6%
I was traveling and got stranded 18 11.5%
To access homeless services 18 11.5%
Weather / climate 8 5.1%
I was born or grew up here 7 4.5%
I was forced out of my previous community 3 1.9%
I am just passing through 3 1.9%
To access VA services and / or VA clinic 0 0.0%
Other 16 10.2%
Total 157 100.0%

Appendix D: Survey Results 2009 San Francisco Homeless Count and Survey
66 © 2009 Applied Survey Research
10. Immediately before you became homeless this last time, were you:
Response Frequency Percent
Renting a home or apartment 242 45.4%
Living with parents / relatives 98 18.4%
Staying with friends 68 12.8%
Living in a home owned by you or your partner 53 9.9%
In jail or prison 17 3.2%
Living in subsidized housing 14 2.6%
In a substance abuse treatment program 4 0.8%
In foster care 2 0.4%
In a hospital 0 0.0%
In a mental health facility 0 0.0%
Other 35 6.6%
Total 533 100.0%
11. What do you think is the primary event that led to your homelessness?
Response Frequency Percent
Lost job 134 25.2%
Alcohol or drug use 81 15.2%
Argument / family or friend asked you to leave 51 9.6%
Eviction 28 5.3%
Divorced or separated 26 4.9%
Incarceration 24 4.5%
Mental health issues 18 3.4%
Family / domestic violence 18 3.4%
Don't know / decline to state 14 2.6%
Landlord sold / stopped renting or re-used property 10 1.9%
Illness or medical problem 9 1.7%
Landlord raised rent 8 1.5%
Lost my home to foreclosure 7 1.3%
Death in family 6 1.1%
Hospitalization / treatment program 4 0.8%
Got too old for foster care 3 0.6%
Hurricane Katrina 3 0.6%
Other natural disaster / fire / flood 3 0.6%
Asked to leave for being Lesbian, Gay, Bisexual, or Transgender
0 0.0%
Other 85 16.0%
Total 532 100.0%

2009 San Francisco Homeless Count and Survey Appendix D: Survey Results
© 2009 Applied Survey Research 67
12. What is keeping you from getting permanent housing?
Response Frequency Percent
Can't afford rent 275 51.8%
No job / no income 232 43.7%
No money for moving costs (security deposit, first and / or last month rent)
79 14.9%
No housing available 74 13.9%
Don't want to 32 6.0%
Criminal record 24 4.5%
Eviction record 17 3.2%
Bad credit 10 1.9%
No transportation 9 1.7%
Physical health problem 5 0.9%
AOD (alcohol & other drugs) problems 5 0.9%
Other 64 12.1%
Multiple response question with 531 respondents offering 826 responses.
13. Are you currently using any of the following services / assistance?
Response Frequency Percent
Free meals 410 77.8%
Emergency shelter 238 45.2%
Shelter day services / drop in center 228 43.3%
Project Homeless Connect 223 42.3%
Health services 143 27.1%
Food pantry 73 13.9%
Mental health services 58 11.0%
Bus passes 48 9.1%
Case management / SF FIRST (HOT) Team 47 8.9%
Alcohol / drug counseling 45 8.5%
Not using any services 45 8.5%
Transitional housing 20 3.8%
Legal assistance 20 3.8%
Job training 7 1.3%
Other 10 1.9%
Multiple response question with 527 respondents offering 1,615 responses.

Appendix D: Survey Results 2009 San Francisco Homeless Count and Survey
68 © 2009 Applied Survey Research
14. Are you currently receiving any of the following forms of government assistance?
Response Frequency Percent
Food Stamps 202 37.9%
CAAP / GA 113 21.2%
SSI (Supplemental Security Income) / SSDI 112 21.0%
Medicaid / Medicare / Medi-Cal 39 7.3%
Social Security 35 6.6%
Veteran's benefits 11 2.1%
Other governmental assistance (State disability benefits, workers compensation, unemployment, etc.)
5 0.9%
VA disability compensation 4 0.8%
CalWORKS / TANF 3 0.6%
WIC 2 0.4%
I am not currently receiving any of these 182 34.1%
Multiple response question with 533 respondents offering 708 responses.
14a. If you are not receiving any government assistance, why not?
Response Frequency Percent
Never applied 33 18.4%
Don't think I'm eligible 30 16.8%
Don't need government assistance 30 16.8%
Have no identification 25 14.0%
Will apply soon 23 12.8%
Paper work too difficult 17 9.5%
No permanent address 15 8.4%
Turned down 15 8.4%
Benefits were cut off 13 7.3%
Immigration issues 12 6.7%
I have applied for one or more of these services, and I am currently waiting for approval
11 6.1%
Don't know where to go 6 3.4%
No transportation 1 0.6%
I'm afraid my children will be taken away from me 1 0.6%
Other 5 2.8%
Multiple response question with 179 respondents offering 237 responses.

2009 San Francisco Homeless Count and Survey Appendix D: Survey Results
© 2009 Applied Survey Research 69
15. What is your total (gross) monthly income from all government benefits?
Response Frequency Percent
Zero 243 46.6%
$1 - $100 70 13.4%
$101 - $200 23 4.4%
$201 - $300 5 1.0%
$301 - $400 19 3.6%
$401 - $500 21 4.0%
$501 - $600 8 1.5%
$601 - $700 7 1.3%
$701 - $800 8 1.5%
$801 - $900 26 5.0%
$901 - $1000 69 13.2%
Over $1000 23 4.4%
Total 522 100.0%
16. Are you currently employed?
Response Frequency Percent
No, unemployed 491 92.3%
Yes, part time 30 5.6%
Yes, full time 11 2.1%
Total 532 100.0%

Appendix D: Survey Results 2009 San Francisco Homeless Count and Survey
70 © 2009 Applied Survey Research
16a. If no, what is keeping you from getting employment?
Response Frequency Percent
No permanent address 130 26.6%
Need clothing 76 15.6%
No phone 74 15.2%
Physical disability 70 14.3%
No shower facilities 66 13.5%
No jobs 63 12.9%
Physical health problems 59 12.1%
Alcohol / drug issue 59 12.1%
Mental disability 59 12.1%
Need training 58 11.9%
No photo identification 52 10.7%
Need education 45 9.2%
Mental health problems 42 8.6%
No transportation 39 8.0%
Criminal record 34 7.0%
Don't want to work 27 5.5%
No work permit (No S.S. #) 23 4.7%
No tools for trade 13 2.7%
Retired 11 2.3%
No child care 5 1.0%
Spouse / partner doesn't want me to work 0 0.0%
Other 33 6.8%
Multiple response question with 488 respondents offering 1,038 responses.
17. Do you panhandle or ask people for money or spare change?
Response Frequency Percent
Yes 172 33.0%
No 350 67.0%
Total 522 100.0%
17a. If yes, how many days a month do you panhandle?
Response Frequency Percent
1 - 5 days 52 31.0%
6 - 10 days 28 16.7%
11 - 20 days 37 22.0%
21 - 25 days 7 4.2%
More than 25 days 44 26.2%
Total 168 100.0%

2009 San Francisco Homeless Count and Survey Appendix D: Survey Results
© 2009 Applied Survey Research 71
17b. If yes, in a typical month, how much money do you make from panhandling?
Response Frequency Percent
Less than $20 38 24.2%
$21 - $50 34 21.7%
$51 - $100 36 22.9%
$101 - $200 26 16.6%
$201 - $300 17 10.8%
More than $300 6 3.8%
Total 157 100.0%
18. What are your other sources of income?
Response Frequency Percent
Recycling 117 43.7%
Family / friends 87 32.5%
Selling other found items 59 22.0%
Sex work 18 6.7%
Selling blood / plasma 7 2.6%
Pension 6 2.2%
Child support 3 1.1%
Other 63 23.5%
Multiple response question with 268 respondents offering 360 responses.
19. What is your total (gross) monthly income from all non-government sources?
Response Frequency Percent
Zero 208 40.1%
$1 - $100 169 32.6%
$101 - $200 38 7.3%
$201 - $300 44 8.5%
$301 - $400 18 3.5%
$401 - $500 8 1.5%
$501 - $600 5 1.0%
$601 - $700 5 1.0%
$701 - $800 5 1.0%
$801 - $900 3 0.6%
$901 - $1000 4 0.8%
Over $1000 12 2.3%
Total 519 100.0%

Appendix D: Survey Results 2009 San Francisco Homeless Count and Survey
72 © 2009 Applied Survey Research
20. Do you have any children, living with you or not?
Response Frequency Percent
Yes 158 29.6%
No 376 70.4%
Total 534 100.0%
20a. If yes, do you have any children who are:
Response Frequency Percent
18 or over living with you 10 43.5%
In foster care 6 26.1%
Under 18 living with you 11 47.8%
Multiple response question with 23 respondents offering 27 responses.
20a1. If you have children, how many children 18 or over are living with you?
Response Frequency Percent
One child 5 50.0%
Two children 4 40.0%
Six or more children 1 10.0%
Total 10 100.0%
20a2. If you have children, how many children are in foster care?
Response Frequency Percent
One child 3 50.0%
Two children 2 33.3%
Three children 1 16.7%
Total 6 100.0%
20a3. If you have children, how many children under 18 are living with you?
Response Frequency Percent
One child 5 45.5%
Two children 4 36.4%
Three children 1 9.1%
Five children 1 9.1%
Total 11 100.0%
20b. If your children are under 18 and living with you, are they enrolled in school?
Response Frequency Percent
Yes 6 66.7%
No 0 0.0%
No, my kids are under 6 3 33.3%
Total 9 100.0%

2009 San Francisco Homeless Count and Survey Appendix D: Survey Results
© 2009 Applied Survey Research 73
21. Since you became homeless this last time, have you needed medical care and been unable to receive it?
Response Frequency Percent
Yes 121 23.1%
No 402 76.9%
Total 523 100.0%
22. Where do you usually get medical care?
Response Frequency Percent
Hospital emergency room 147 28.2%
Public health clinic 139 26.7%
Free clinic / community clinic 136 26.1%
Veterans Affairs Clinic 26 5.0%
Urgent care clinic 24 4.6%
Don't ever go 23 4.4%
Private doctor 8 1.5%
Friends / family 0 0.0%
Other 18 3.5%
Total 521 100.0%
22a. How many times in the last 12 months have you used the emergency room for any treatment?
Response Frequency Percent
Never 183 41.3%
1 time 105 23.7%
2 times 75 16.9%
3 times 35 7.9%
4 times 20 4.5%
5 times 3 0.7%
More than 5 times 22 5.0%
Total 443 100.0%
23. How many nights, if any, have you spent in jail or prison during the last 12 months?
Response Frequency Percent
0 nights 373 74.0%
1 - 5 nights 71 14.1%
6 - 10 nights 14 2.8%
11 - 20 nights 9 1.8%
21 - 50 nights 17 3.4%
More than 50 nights 20 4.0%
Total 504 100.0%

Appendix D: Survey Results 2009 San Francisco Homeless Count and Survey
74 © 2009 Applied Survey Research
24. Are you currently on probation or parole?
Response Frequency Percent
Yes 75 14.4%
No 435 83.3%
Declined to state 12 2.3%
Total 522 100.0%
24a. Were you on probation or parole at the time you most recently became homeless?
Response Frequency Percent
Yes 60 11.9%
No 432 85.7%
Declined to state 12 2.4%
Total 504 100.0%
25. Are you currently experiencing any of the following:
Yes No
Declined to state
25a. Physical disability 36.5% 62.7% 0.8%
184 316 4
25b. Mental illness 30.3% 68.5% 1.2%
151 342 6
25c. Depression 54.7% 44.0% 1.3%
286 230 7
25d. Alcohol abuse 32.3% 66.9% 0.8%
163 338 4
25e. Drug abuse 31.1% 67.7% 1.2%
155 338 6
25f. Getting prescription medication 34.3% 65.2% 0.4%
169 321 2
25g. Domestic / partner violence or abuse 9.3% 90.1% 0.6%
47 454 3
25h. Chronic health problems 33.7% 66.1% 0.2%
170 334 1
25i. AIDS / HIV related illness 3.8% 96.0% 0.2%
19 474 1
25j. Post-traumatic stress disorder (PTSD) 29.4% 69.0% 1.6%
147 345 8
25k. Developmental disability (A chronic condition that significantly limits a person’s ability to speak, hear, see, walk, learn, or perform fundamental tasks) 12.4% 86.2% 1.4%
63 439 7

2009 San Francisco Homeless Count and Survey Appendix D: Survey Results
© 2009 Applied Survey Research 75
26. Were you ever in foster care?
Response Frequency Percent
Yes 88 16.9%
No 433 83.1%
Total 521 100.0%
27. What is the highest level of education you have completed?
Response Frequency Percent
Less than high school diploma 135 25.6%
High school diploma / GED 208 39.5%
Some college, no degree 112 21.3%
AA / AS degree 19 3.6%
BA / BS degree 21 4.0%
Technical Certificate 13 2.5%
Less than 6th Grade 9 1.7%
Advanced degree 10 1.9%
Total 527 100.0%
28. Do you usually get enough to eat on a daily basis?
Response Frequency Percent
Yes 322 61.5%
Sometimes 102 19.5%
No 100 19.1%
Total 524 100.0%

Appendix D: Survey Results 2009 San Francisco Homeless Count and Survey
76 © 2009 Applied Survey Research

2009 San Francisco Homeless Count and Survey Appendix E: Survey Administration Detail
© 2009 Applied Survey Research 77
Appendix E: Survey Administration Detail The 2009 San Francisco Homeless Count Survey was administered by the trained
survey team between February 4, 2009 and February 20, 2009.
The refusal rate for participation in the survey, as documented by the survey team, was 5%.
In all, the survey team administered 541 surveys.
Seven surveys were removed from the survey sample, after screening for duplication was conducted by Applied Survey Research.
The sample of valid surveys totaled 534.
Of the 534 valid surveys, 491 (92%) were conducted in English.
Of the 534 valid surveys, 43 (8%) were conducted in Spanish.

Appendix E: Survey Administration Detail 2009 San Francisco Homeless Count and Survey
78 © 2009 Applied Survey Research

2009 San Francisco Homeless Count and Survey Appendix F: Map of Supervisor Districts
and Homeless Count Routes
© 2009 Applied Survey Research 79
Appendix F: Map of Supervisor Districts and Homeless Count Routes