201 7-201 8 - nipissing university process begins in the with a request for submissions from all...
TRANSCRIPT

2 0 1 7 - 2 0 1 8
O P E R A T I N G B U D G E T
P R E S E N T E D T O :
B O A R D O F G O V E R N O R S
J U N E 1 , 2 0 1 7

Table of Contents ______________________________________________ 2017-2018 Budget Highlights 1-4
2017-2018 Budget 5
Revenue 6-11
Expenditures 12-21

2017-2018 BUDGET HIGHLIGHTS
BUDGET PROCESS: The Nipissing University Budget Advisory Group consists of:
• Provost and Vice-President, Academic & Research (Chair) • Vice-President, Finance & Administration • Registrar and Assistant Vice-President, Institutional Planning • Director, Finance • Director, Human Resources
The Budget Advisory Group is responsible for the preparation and development of the annual operating budget of the University. The process begins in the Fall with a request for submissions from all budget holders. At the same time an estimate of projected revenues is prepared, although projected revenues cannot be finalized until later in the year when admissions start to be confirmed and Ministry decisions regarding funding are known. The Advisory Group prepares a budget for the President who approves the documents for submission to the Audit and Finance Committee and ultimately to the Board for final approval. The status of the budget preparation is discussed at all meetings of the Audit and Finance Committee until the final budget proposal is ready for approval. As a result of the recommendations of the Special Governance Commission, a Senate Budget Committee will be established for the 2017-2018 academic year. While the actual mandate of the Senate Budget Committee has yet to be determined, it is anticipated that it would also be briefed on a regular basis on the development of the budget, and provide feedback to the Budget Advisory Group.
1

BACKGROUND AND CONTEXT The background to the 2017-2018 Operating Budget is one of significant financial challenges for the University. The 2013-2014 operating deficit of $5,166,108 was the largest in the University’s history, followed by an operating deficit for 2014-2015 of $4,987,000. The results for 2015-2016 were significantly improved with a deficit of $1,264,605 and the 2016/17 deficit is not expected to surpass $2,500,000. The reduction of the deficit in 2016/17 was due primarily to an end-of-year decision by the Ministry to fund teacher-education programs at the notional level of approved student spaces (i.e., our cap of 929 students) rather than our actual enrolment of approximately 500 students. This resulted in an additional grant from the Ministry of approximately $2 000 000. It is anticipated that this additional funding will be continued for the 2017/18 fiscal year. During fiscal 2017-2018, the University will be negotiating with the Ministry to complete our Strategic Mandate Agreement, which may affect grant revenues for the next three years. HIGHLIGHTS OF THE 2017-2018 BUDGET 1) Total revenues are projected to be $68,346,898 and total expenditures are projected to be $72,221,507 (after the transfers and
from other funds and the anticipated operating savings are deducted) for a projected deficit of $3,874,609. 2) The above numbers include facilities renewal and minor capital projects. Please note that the University receives a dedicated
facilities renewal grant from the Ministry, budgeted at $458,300 for 2017/18. 3) Government grants are projected to be $3M higher than the 2016-2017 budget of $35,578,060. This projected Government
grant total includes a one-time “Sustainability Grant” of $2.5M which is $500,000 higher than the previous year. Note that in order to implement the conditions of this grant, some budgets have had to be increased, notably in Student Development Services and Administration. The Second Entry Nursing Grant has increased approximately $1M due to increased enrolment and the net increase to Education Grants is $1.8 due to the funding of notional students up to our enrolment cap.
2
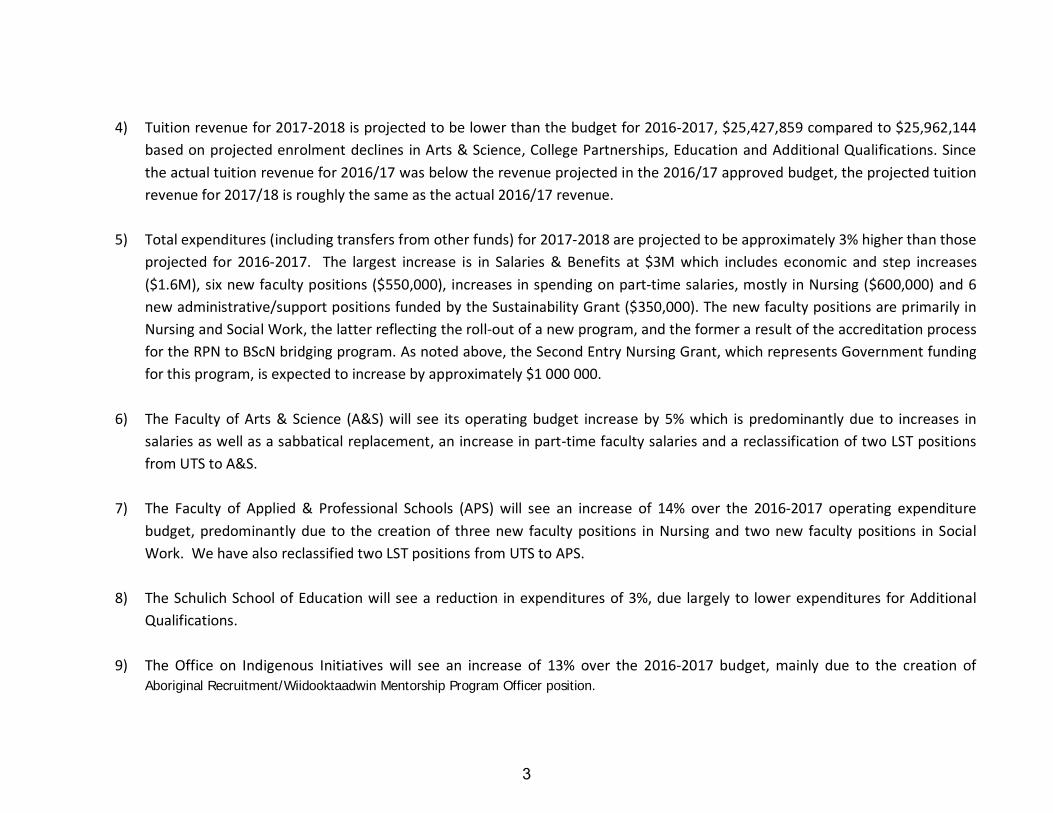
4) Tuition revenue for 2017-2018 is projected to be lower than the budget for 2016-2017, $25,427,859 compared to $25,962,144
based on projected enrolment declines in Arts & Science, College Partnerships, Education and Additional Qualifications. Since the actual tuition revenue for 2016/17 was below the revenue projected in the 2016/17 approved budget, the projected tuition revenue for 2017/18 is roughly the same as the actual 2016/17 revenue.
5) Total expenditures (including transfers from other funds) for 2017-2018 are projected to be approximately 3% higher than those
projected for 2016-2017. The largest increase is in Salaries & Benefits at $3M which includes economic and step increases ($1.6M), six new faculty positions ($550,000), increases in spending on part-time salaries, mostly in Nursing ($600,000) and 6 new administrative/support positions funded by the Sustainability Grant ($350,000). The new faculty positions are primarily in Nursing and Social Work, the latter reflecting the roll-out of a new program, and the former a result of the accreditation process for the RPN to BScN bridging program. As noted above, the Second Entry Nursing Grant, which represents Government funding for this program, is expected to increase by approximately $1 000 000.
6) The Faculty of Arts & Science (A&S) will see its operating budget increase by 5% which is predominantly due to increases in
salaries as well as a sabbatical replacement, an increase in part-time faculty salaries and a reclassification of two LST positions from UTS to A&S.
7) The Faculty of Applied & Professional Schools (APS) will see an increase of 14% over the 2016-2017 operating expenditure
budget, predominantly due to the creation of three new faculty positions in Nursing and two new faculty positions in Social Work. We have also reclassified two LST positions from UTS to APS.
8) The Schulich School of Education will see a reduction in expenditures of 3%, due largely to lower expenditures for Additional
Qualifications. 9) The Office on Indigenous Initiatives will see an increase of 13% over the 2016-2017 budget, mainly due to the creation of
Aboriginal Recruitment/Wiidooktaadwin Mentorship Program Officer position.
3

10) The expenditures in Academic Support and Library are projected to 8% higher than 2016-2017, due to an investment in resources in the Library. Moreover, there are short-term investments in additional positions in the VPAR and Registrar’s office, both funded by the Sustainability Grant.
11) Expenditures for Computer Services and Plant are projected to decrease by 3%. UTS has achieved savings in lease costs and
software purchases as well as several LST positions have been reclassified to other departments. In Plant & Property, expenses related to the annual Facilities Renewal Grant have decreased based on a reduction of that grant from 2016/17.
12) Student Services will see an increase of 5% in its expenditure budget for 2017-2018, mainly due to increased expenditures
related to student retention which are funded by the Sustainability Grant, as well as a 4% increase in Financial Aid. 13) Athletics will see an increase of 2% in its budget, due to increased travel costs for varsity sports this year as teams are required
to travel to Thunder Bay. The travel budget for the subsequent year will be reduced. 14) Direct Administration expenditures are down by 1%. However, in addition to this reduction, the University will see savings of
approximately $1M due to the debt refinancing as well as the anticipated operating savings of $400,000. 15) The overall External Relations expenditures budget has increased by 10% as we begin to invest in both salaries as well as
operating expenses as we gear up to launch our new Campaign. 16) The budget for graduate student assistance has been increased substantially over last year’s budget, a total of $487,500 for
2017/18 compared to $317,000 or 2016/17. This represents the total NU Graduate Scholarships (165,000), CRC matching ($80,000), OGS matching ($70,000) as well as Teaching Assistantships ($172,500). The above represents only funding from NU’s operating budget, and is supplemented by $140 000 in OGS funding from the Province, an increase from $110 000 the year before. Please note that the OGS offers are the responsibility of the University.
4
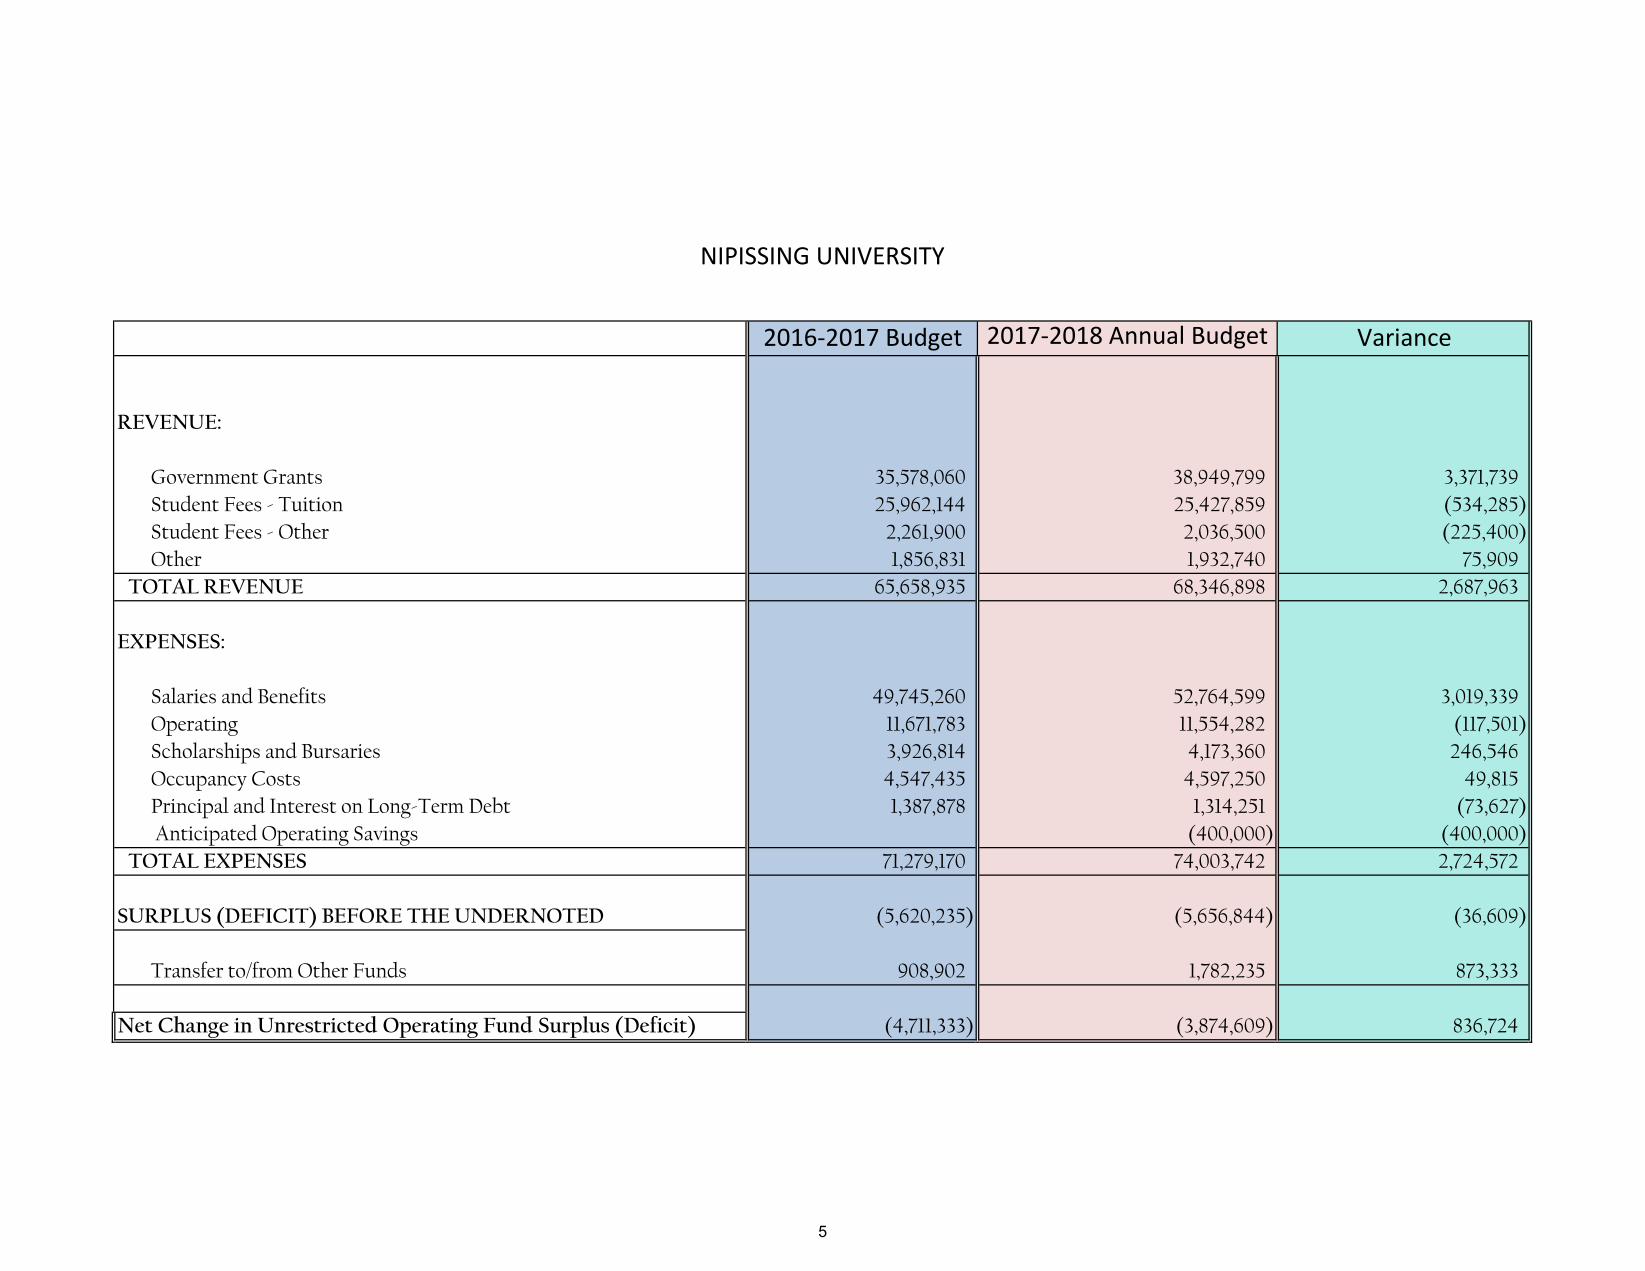
2016-2017 Budget 2017-2018 Annual Budget Variance
REVENUE:
Government Grants 35,578,060 38,949,799 3,371,739 Student Fees - Tuition 25,962,144 25,427,859 (534,285) Student Fees - Other 2,261,900 2,036,500 (225,400) Other 1,856,831 1,932,740 75,909
TOTAL REVENUE 65,658,935 68,346,898 2,687,963
EXPENSES:
Salaries and Benefits 49,745,260 52,764,599 3,019,339 Operating 11,671,783 11,554,282 (117,501) Scholarships and Bursaries 3,926,814 4,173,360 246,546 Occupancy Costs 4,547,435 4,597,250 49,815 Principal and Interest on Long-Term Debt 1,387,878 1,314,251 (73,627) Anticipated Operating Savings (400,000) (400,000)
TOTAL EXPENSES 71,279,170 74,003,742 2,724,572
SURPLUS (DEFICIT) BEFORE THE UNDERNOTED (5,620,235) (5,656,844) (36,609)
Transfer to/from Other Funds 908,902 1,782,235 873,333
Net Change in Unrestricted Operating Fund Surplus (Deficit) (4,711,333) (3,874,609) 836,724
NIPISSING UNIVERSITY
5

REVENUE SOURCES
6

BUDGETED REVENUES 2013 - 2018
7

PROVINCIAL GRANTS Budgeted 2016/17
Budgeted 2017/18 Variance NOTE
Basic Operating GrantsBasic Operating Grant $ 16,196,216 $ 16,196,216 - Less International Student Recovery $ (16,673) $ (23,133) (6,460)
Education Enrolment Based Grant $ 2,750,000 $ 5,276,139 2,526,139
Education Phase-In Grant $ 960,000 $ 253,400 (706,600)
Mission - Related Institutional Specific GrantsDifferentiation Grant $ 535,300 $ 535,300 - Northern Ontario Grant $ 1,871,140 $ 1,871,140 -
Enrolment Based Grants
Enrolment Accessibility Graduate $ 815,417 $ 679,512 (135,905)Second Entry Nursing Grant $ 4,437,461 $ 5,529,892 1,092,431 Second Entry Nursing Grant - to Canadore $ (125,475) $ (125,475) - Collaborative Grant - 50% from Canadore $ 1,495,244 $ 1,666,061 170,817 Clinical Grant - 50% from Canadore $ 47,600 $ 47,600 -
Performance Based GrantsPerformance Funding for KPI $ 300,000 $ 330,800 30,800 General Quality Tied to Multi - Year Accountability $ 1,408,991 $ 1,334,110 (74,881)
Student Bursaries and Other Flow ThroughFundingDisabled Bursary $ 300,000 $ 300,000 - Ontario Graduate Scholarships $ 110,000 $ 140,000 30,000 First Generation Bursary $ 28,272 $ 30,279 2,007
Sub-Total $ 31,113,493 $ 34,041,841 2,928,348
OPERATING AND OTHER GOVERNMENT GRANTS
8

PROVINCIAL GRANTS Budgeted 2016/17
Budgeted 2017/18 Variance NOTE
OPERATING AND OTHER GOVERNMENT GRANTS
Specific Purpose and other GrantsStudent Success Fund - Postsecondary Education Fund for Aboriginal Learners
$ 675,886 $ 675,886 -
Grants for Municipal Taxation $ 254,775 $ 242,700 (12,075)Accessibility for Students with Disabilities $ 292,945 $ 292,945 - Interpreter Fund $ 25,000 $ 34,000 9,000 Graduate Capital Grant $ 109,440 $ 109,440 - Aboriginal Initiatives/Aboriginal PSET BursaryProjects
$ 40,300 $ 40,300 -
Summer Transition Program - Women's Campus Safety $ 15,000 $ 54,812 39,812 Research Overheads Infrastructure Envelope $ 12,553 $ 13,738 1,185 Summer Experience Program - Facilities Renewal Grant $ 642,700 $ 458,300 (184,400)Sustainabilty Grant - One Time $ 2,000,000 $ 2,500,000 500,000 TOTAL PROVINCIAL GRANTS $ 35,182,092 $ 38,463,962 3,281,870
FEDERAL GRANTSIndirect Costs Grant $ 395,968 $ 413,337 17,369 Industry Canada - Labour GrantSSHRC - Grad Funding $ - $ 55,000 55,000 NSERC - Scholarship $ - $ 17,500 17,500
TOTAL FEDERAL GRANTS $ 395,968 $ 485,837 89,869
TOTAL GOVERNMENT GRANTS $ 35,578,060 $ 38,949,799 3,371,739
9

2016-2017 2017-2018 Variance % Variance
Collaborative Nursin : Nursing Collaborative Program 2,301,536 2,280,720 (20,816) -1%
AQ / ABQ/ PQP : Fac of ED - ABQ - HS 735,954 503,161 (232,793) -32%
ATCP : Aboriginal Teacher Cert 138,688 142,848 4,160 3%
Teacher Anish. 2nd L : Aboriginal Teacher Cert 20,803 28,570 7,767 37%
Arts and Science : Administration 9,642,056 9,334,129 (307,927) -3%
Business : Administration 2,574,528 2,651,763 77,235 3%
Bridging/SPP : Administration 3,134,825 3,512,057 377,232 12%
NB ConEd : Administration 552,000 357,120 (194,880) -35%
Masters Programs : Administration 987,008 987,008 - 0%
BPHE : Administration 2,029,745 1,993,643 (36,102) -2%
BEd Consecutive : Administration 2,557,085 2,527,547 (29,538) -1%
College Partnership : Administration 1,309,086 1,214,570 (94,516) -7%
BComm Distance : Administration 624,212 642,870 18,658 3%
PhD : Administration 209,509 209,509 - 0%
Aboriginal Classroom Assistant Program 17,510 53,766 36,256 207%
Brantford : Administration 726,537 536,000 (190,537) -26%
27,561,082 26,975,281 (585,801) -2%
Less:
Canadore Share of Collaborative Nursing 1,238,938 1,215,422 (23,516) -2%
Tuition Exemption 360,000 332,000 (28,000) -8%
Total Tuition 25,962,144 25,427,859 (534,285) -2%
TUITION
10

2017-2018 OTHER REVENUE
11

2017-2018 EXPENDITURES
12

2013-2018 BUDGETED EXPENDITURES
13

DEPARTMENTS 2016-17 2017-18 Variance % Variance
Faculty of Arts & Science 14,309,760$ 15,082,848$ 773,088$ 5%
Faculty of Applied & Professional Schools 11,836,737$ 13,538,707$ 1,701,969$ 14%
Schulich School of Education 10,848,684$ 10,552,957$ (295,727)$ -3%
Office of Indigenous Initiatives 698,472$ 790,884$ 92,412$ 13%
Academic Support & Library 5,891,258$ 6,378,184$ 486,925$ 8%
Administration 4,466,276$ 4,404,444$ (61,832)$ -1%
Loan Savings - Transfer from Ancillary (400,000)$ (1,064,313)$ (664,313)$ 166%
Student Services 6,751,284$ 7,089,380$ 338,096$ 5%
Athletics 2,495,393$ 2,537,343$ 41,950$ 2%
Computer Services/Plant 11,398,921$ 11,027,712$ (371,209)$ -3%
External Relations 2,073,484$ 2,283,362$ 209,878$ 10%
Anticipated Operating Savings (400,000)$ (400,000)$ 100% Total 70,370,269$ 72,221,507$ 1,851,238$ 3%
Transfer to(from) other funds factored in the above cost centres
TOTAL EXPENDITURES
14

2016/17 Budget 2017/18 Budget Variance
Faculty of Arts & Science 13,685,165$ 14,445,403$ 760,238$ 6%
Faculty of Applied & Professional Studies 10,431,067$ 12,037,732$ 1,606,664$ 15%
Schulich School of Education 9,730,623$ 9,644,344$ (86,279)$ -1%
Office of Indigenous Initiatives 506,032$ 602,814$ 96,782$ 19%
Academic Support/Library 3,916,858$ 4,272,137$ 355,279$ 9%
Total Academic 38,269,745$ 41,002,429$ 2,732,685$ 7%
Administration 2,662,122$ 2,949,364$ 287,242$ 11%
Student Services 2,882,047$ 3,054,244$ 172,196$ 6%
Athletics 1,222,120$ 1,179,655$ (42,465)$ -3%
Computer Services/ Plant 3,583,442$ 3,323,045$ (260,397)$ -7%
External Relations 1,125,784$ 1,255,862$ 130,078$ 12%
Total Other 11,475,516$ 11,762,170$ 286,654$ 2%
Grand Total 49,745,261$ 52,764,599$ 3,019,338$ 6%
Transfers from other accounts have been factored in the above figures
DEPARTMENT % Variance
TOTAL SALARIES
15

DEPARTMENT 2016/17 Budget 2017/18 Budget Variance % Variance
Faculty of Arts & Science 624,595 637,445 12,850$ 2%
Faculty of Applied & Professional Studies 1,405,670 1,500,975 95,305$ 7%
Schulich School of Education 1,118,061 908,613 (209,448)$ -19%
Office of Indigenous Initiatives 192,440 188,070 (4,370)$ -2%
Academic Support/Library 1,974,400 2,106,047 131,647$ 7%
Total Academic 5,315,166 5,341,150 25,984$ 0%
Administration 1,804,153 1,455,080 (349,074)$ -19%
Loan Savings - Transfer from Ancillary (400,000) (1,064,313) (664,313)$ 166%
Student Services 3,869,237 4,035,136 165,900$ 4%
Athletics 1,273,273 1,357,688 84,415$ 7%
Computer Services/Plant 7,815,479 7,704,667 (110,812)$ -1%
External Relations 947,700 1,027,500 79,800$ 8%
Anticipated Operating Savings (400,000) (400,000)$ 100%
Total Other 15,309,842 14,115,758 (1,194,084)$ -8%
Grand Total 20,625,008 19,456,908 (1,168,100)$ -6%
Transfers from other accounts have been factored in the above figures
OPERATING EXPENDITURES
16

2016-2017 2017-2018 Variance 2016-2017 2017-2018 Variance 2016-2017 2017-2018 Variance
Variance
Dean's Office 1,396,100$ 1,643,082$ 246,983$ 103,000$ 113,600$ 10,600$ 1,499,100$ 1,756,682$ 257,583$ 17%
Biology/Science/Chemistry 1,725,005$ 1,845,364$ 120,360$ 122,100$ 137,300$ 15,200$ 1,847,105$ 1,982,664$ 135,560$ 7%
Computer Science/Mathematics 1,243,665$ 1,308,435$ 64,770$ 51,050$ 50,750$ (300)$ 1,294,715$ 1,359,185$ 64,470$ 5%
Geography/Geology 1,368,574$ 1,437,781$ 69,207$ 82,650$ 79,000$ (3,650)$ 1,451,224$ 1,516,781$ 65,557$ 5%
Psychology 1,359,187$ 1,413,723$ 54,536$ 42,800$ 40,900$ (1,900)$ 1,401,987$ 1,454,623$ 52,636$ 4%
English 1,286,797$ 1,407,238$ 120,441$ 35,025$ 31,125$ (3,900)$ 1,321,822$ 1,438,363$ 116,541$ 9%
History 1,281,274$ 1,202,689$ (78,586)$ 41,100$ 42,050$ 950$ 1,322,374$ 1,244,739$ (77,636)$ -6%
Political Sci/Economics/Philosophy 1,032,688$ 1,093,017$ 60,329$ 30,750$ 29,700$ (1,050)$ 1,063,438$ 1,122,717$ 59,279$ 6%
Classics 246,046$ 245,481$ (564)$ 4,820$ 4,770$ (50)$ 250,866$ 250,251$ (614)$ 0%
Religion & Culture 459,831$ 479,410$ 19,579$ 19,175$ 19,800$ 625$ 479,006$ 499,210$ 20,204$ 4%
GESJ 450,924$ 456,237$ 5,313$ 22,975$ 21,775$ (1,200)$ 473,899$ 478,012$ 4,113$ 1%
Fine & Performing Arts 687,869$ 733,420$ 45,551$ 33,925$ 30,550$ (3,375)$ 721,794$ 763,970$ 42,176$ 6%
Sociology 923,023$ 961,478$ 38,455$ 29,900$ 30,800$ 900$ 952,923$ 992,278$ 39,355$ 4%
Native Studies 224,180$ 218,047$ (6,133)$ 5,325$ 5,325$ -$ 229,505$ 223,372$ (6,133)$ -3%
Total 13,685,165$ 14,445,403$ 760,238$ 624,595$ 637,445$ 12,850$ 14,309,760$ 15,082,848$ 773,088$ 5%
Transfers from other accounts have been factored in the above figures
SALARIES OPERATING TOTAL BUDGETFACULTY OF ARTS & SCIENCE
17

2016-2017 2017-2018 Variance 2016-2017 2017-2018 Variance 2016-2017 2017-2018 Variance % VarianceDean's Office 476,376$ 508,774$ 32,398$ 79,000$ 81,750$ 2,750$ 555,376$ 590,524$ 35,148$ 6%Business 2,907,306$ 3,063,126$ 155,820$ 717,600$ 678,175$ (39,425)$ 3,624,906$ 3,741,301$ 116,395$ 3%Nursing 5,152,324$ 6,160,031$ 1,007,707$ 498,425$ 625,925$ 127,500$ 5,650,749$ 6,785,956$ 1,135,207$ 20%Criminal Justice 839,120$ 905,125$ 66,005$ 26,975$ 27,775$ 800$ 866,095$ 932,900$ 66,805$ 8%Social Welfare/Social Work 604,048$ 1,012,065$ 408,017$ 39,260$ 68,550$ 29,290$ 643,308$ 1,080,615$ 437,307$ 68%Child & Family Studies 451,893$ 388,611$ (63,282)$ 44,410$ 18,800$ (25,610)$ 496,303$ 407,411$ (88,892)$ -18%
Total 10,431,067$ 12,037,732$ 1,606,664$ 1,405,670$ 1,500,975$ 95,305$ 11,836,737$ 13,538,707$ 1,701,969$ 14%
2016-2017 2017-2018 Variance 2016-2017 2017-2018 Variance 2016-2017 2017-2018 Variance % VarianceDean's Office 585,094$ 584,075$ (1,019)$ 55,300$ 65,700$ 10,400$ 640,394$ 649,775$ 9,381$ 1%Education 6,214,494$ 6,442,276$ 227,782$ 671,860$ 499,570$ (172,290)$ 6,886,354$ 6,941,846$ 55,492$ 1%Practice Teaching 301,573$ 300,043$ (1,530)$ 196,251$ 177,443$ (18,808)$ 497,824$ 477,486$ (20,338)$ -4%BPHE 1,704,595$ 1,634,149$ (70,446)$ 97,300$ 97,350$ 50$ 1,801,895$ 1,731,499$ (70,396)$ -4%Additional Qualifications 609,830$ 369,907$ (239,923)$ 26,350$ 16,350$ (10,000)$ 636,180$ 386,257$ (249,923)$ -39%Aboriginal 315,036$ 313,894$ (1,143)$ 71,000$ 52,200$ (18,800)$ 386,036$ 366,094$ (19,943)$ -5%
Total 9,730,623$ 9,644,344$ (86,279)$ 1,118,061$ 908,613$ (209,448)$ 10,848,684$ 10,552,957$ (295,727)$ -3%
2016-2017 2017-2018 Variance 2016-2017 2017-2018 Variance 2016-2017 2017-2018 Variance % VarianceIndigenious Initiatives 506,032$ 602,814$ 96,782$ 192,440$ 188,070$ (4,370)$ 698,472$ 790,884$ 92,412$ 13%Total 506,032$ 602,814$ 96,782$ 192,440$ 188,070$ (4,370)$ 698,472$ 790,884$ 92,412$ 13%
Transfers from other accounts have been factored in the above figures
APPLIED AND PROFESSIONAL SCHOOLS
SCHULICH SCHOOL OF EDUCATIONTOTAL BUDGET
TOTAL BUDGET
OFFICE OF INDEGINOUS INITIATIVESSALARIES OPERATING
SALARIES OPERATING
SALARIES OPERATING
TOTAL BUDGET
18

2016-2017 2017-2018 Variance 2016-2017 2017-2018 Variance 2016-2017 2017-18 Variance % VarianceVP Academic & Research 453,964$ 441,571$ (12,393)$ 115,400$ 176,800$ 61,400$ 569,364$ 618,371$ 49,007$ 9%Research & Graduate Studies 625,177$ 908,155$ 282,978$ 401,701$ 462,650$ 60,949$ 1,026,878$ 1,370,805$ 343,927$ 33%Faculty & Administrative Support 502,089$ 525,745$ 23,656$ 131,790$ 54,240$ (77,550)$ 633,879$ 579,985$ (53,894)$ -9%Library 1,349,739$ 1,369,578$ 19,839$ 1,141,509$ 1,226,857$ 85,348$ 2,491,248$ 2,596,435$ 105,187$ 4%Registrar 985,890$ 1,027,089$ 41,199$ 184,000$ 185,500$ 1,500$ 1,169,890$ 1,212,589$ 42,699$ 4%Total 3,916,858$ 4,272,137$ 355,279$ 1,974,400$ 2,106,047$ 131,647$ 5,891,258$ 6,378,184$ 486,925$ 8%
2016-2017 2017-2018 Variance 2016-2017 2017-2018 Variance 2016-2017 2017-2018 Variance % VarianceComputer Services 2,512,406$ 2,298,065$ (214,341)$ 2,147,880$ 2,083,064$ (64,816)$ 4,660,286$ 4,381,128$ (279,158)$ -6%Physical Plant 1,071,036$ 1,024,980$ (46,056)$ 2,562,282$ 2,252,604$ (309,678)$ 3,633,318$ 3,277,584$ (355,734)$ -10%Plant Shared (Canadore) 3,105,318$ 3,369,000$ 263,683$ 3,105,318$ 3,369,000$ 263,683$ 8%Total 3,583,442$ 3,323,045$ (260,397)$ 7,815,479$ 7,704,667$ (110,812)$ 11,398,921$ 11,027,712$ (371,209)$ -3%
Transfers from other accounts have been factored in the above figures
ACADEMIC SUPPORT AND LIBRARY
COMPUTER SERVICES/PLANTTOTA BUDGETSALARIES OPERATING
SALARIES OPERATING TOTA BUDGET
19

2016-17 2017-2018 Variance 2016-2017 2017-2018 Variance 2016-2017 2017-2018 Variance % VarianceStudent Services 1,351,859$ 1,392,516$ 40,657$ 252,653$ 170,441$ (82,211)$ 1,604,512$ 1,562,957$ (41,555)$ -3%International 76,998$ 85,320$ 8,322$ 93,800$ 63,300$ (30,500)$ 170,798$ 148,620$ (22,178)$ -13%Financial Aid 245,481$ 251,913$ 6,432$ 3,467,759$ 3,741,660$ 273,901$ 3,713,240$ 3,993,573$ 280,333$ 8%Accessibility Services 705,728$ 724,953$ 19,225$ 49,250$ 54,460$ 5,210$ 754,978$ 779,413$ 24,435$ 3%Academic Advising 501,982$ 599,542$ 97,560$ 5,775$ 5,275$ (500)$ 507,757$ 604,817$ 97,060$ 19%Total 2,882,047$ 3,054,244$ 172,196$ 3,869,237$ 4,035,136$ 165,900$ 6,751,284$ 7,089,380$ 338,096$ 5%
2016-2017 2017-2018 Variance 2016-2017 2017-2018 Variance 2016-2017 2017-2018 Variance % VarianceBasketball 228,955$ 194,036$ (34,920)$ 167,694$ 201,538$ 33,844$ 396,649$ 395,574$ (1,076)$ 0%Hockey 304,384$ 273,994$ (30,390)$ 336,035$ 329,520$ (6,515)$ 640,419$ 603,514$ (36,905)$ -6%Soccer 60,053$ 84,960$ 24,908$ 92,050$ 91,100$ (950)$ 152,103$ 176,060$ 23,958$ 16%Volleyball 217,887$ 223,481$ 5,594$ 129,724$ 125,200$ (4,524)$ 347,611$ 348,681$ 1,070$ 0%Others 410,841$ 403,184$ (7,658)$ 197,770$ 225,330$ 27,560$ 608,611$ 628,514$ 19,902$ 3%Athletic Scholarships -$ 350,000$ 385,000$ 35,000$ 350,000$ 385,000$ 35,000$ 10%Total 1,222,120$ 1,179,655$ (42,465)$ 1,273,273$ 1,357,688$ 84,415$ 2,495,393$ 2,537,343$ 41,950$ 2%
Transfers from other accounts have been factored in the above figures
SALARIES OPERATING TOTAL BUDGET
STUDENT SERVICES
ATHLETICS
SALARIES OPERATING TOTAL BUDGET
20

2016-2017 2017-2018 Variance 2016-2017 2017-2018 Variance 2016-2017 2017-2018 Variance % VariancePresident's Office 445,445$ 482,573$ 37,128$ 117,100$ 115,450$ (1,650)$ 562,545$ 598,023$ 35,478$ 6%Board of Governors 85,932$ 98,117$ 12,186$ 24,450$ 41,250$ 16,800$ 110,382$ 139,367$ 28,986$ 26%Instutional Research & Analysis 318,048$ 212,801$ (105,247)$ 27,800$ 22,500$ (5,300)$ 345,848$ 235,301$ (110,547)$ -32%Finance 895,907$ 1,002,220$ 106,312$ 321,400$ 114,300$ (207,100)$ 1,217,307$ 1,116,520$ (100,788)$ -8%Administration -$ -$ -$ 1,150,403$ 940,418$ (209,986)$ 1,150,403$ 940,418$ (209,986)$ -18%VP Finance -$ 311,419$ 311,419$ -$ 28,250$ 28,250$ -$ 339,669$ 339,669$ 100%Human Resources 916,791$ 842,235$ (74,556)$ 163,000$ 192,912$ 29,912$ 1,079,791$ 1,035,147$ (44,644)$ -4%Total 2,662,122$ 2,949,364$ 287,242$ 1,804,153$ 1,455,080$ (349,074)$ 4,466,276$ 4,404,444$ (61,832)$ -1%Additional SavingsLoan Savings - Transfer from Ancillary -$ -$ -$ (400,000)$ (1,064,313)$ (664,313)$ (400,000)$ (1,064,313)$ (664,313)$ 166%Anticipated Operating Savings -$ -$ -$ -$ (400,000)$ (400,000)$ -$ (400,000)$ (400,000)$ 100%Total -$ -$ -$ (400,000)$ (1,464,313)$ (1,064,313)$ (400,000)$ (1,464,313)$ (1,064,313)$ 266%
2016-2017 2017-2018 Variance 2017-2018 2017-2018 Variance 2016-2017 2017-2018 Variance % VarianceIntegrated Marketing 472,067$ 490,408$ 18,340$ 492,600$ 466,500$ (26,100)$ 964,667$ 956,908$ (7,760)$ -1%Recruitment 483,208$ 525,578$ 42,371$ 277,300$ 279,900$ 2,600$ 760,508$ 805,478$ 44,971$ 6%Development 170,509$ 239,876$ 69,367$ 177,800$ 281,100$ 103,300$ 348,309$ 520,976$ 172,667$ 50%Total 1,125,784$ 1,255,862$ 130,078$ 947,700$ 1,027,500$ 79,800$ 2,073,484$ 2,283,362$ 209,878$ 10%
Transfers from other accounts have been factored in the above figures
SALARIES OPERATING
SALARIES OPERATINGADMINISTRATION
EXTERNAL RELATIONS
TOTAL BUDGET
TOTAL BUDGET
21