2010 fourth quarter/full year earnings supplement fourth quarter/full year earnings supplement the...
TRANSCRIPT

2010 Fourth Quarter/Full Year
Earnings Supplement
The enclosed summary should be read in conjunction with the text and statistical tables included in American Express Company’s (the “Company” or “AXP”) Fourth Quarter/Full Year 2010 Earnings Release.
This presentation contains certain forward-looking statements that are subject to risks and uncertainties and speak only as of the date on which they are made. Important factors that could cause actual results to differ materially from these forward-looking statements, including the Company’s financial and other goals, are set forth on page 40 of this Supplement, in the Company’s 2009 Annual Report to Shareholders, in its 2009 Annual Report on Form 10-K and in other reports on file with the Securities and Exchange Commission.

AMERICAN EXPRESS COMPANY
FOURTH QUARTER 2010 OVERVIEW
CONSOLIDATED
1
FINANCIAL RESULTS
Fourth quarter diluted EPS from continuing operations attributable to common shareholders of $0.88 increased 49% from $0.59 last year. Total revenues net of interest expense increased 13%. The revenue increase primarily reflects the impact of the consolidation of off-balance sheet cardmember loans and related debt as discussed below. Return on average common equity (“ROCE”) was 27.2% and return on average tangible common equity (“ROTCE”), which excludes goodwill and intangibles, was 35.1%.*
- Q4’10 income from continuing operations included $113MM ($74MM after-tax) of net costs related to the Company’s reengineering initiatives, as discussed further on page 6. Excluding these costs, adjusted diluted earnings per share from continuing operations for Q4’10 was $0.94.
- The discontinued operations line in the Consolidated Financial Statements contains the results of operations, assets and liabilities related to various business sales. During Q4’09, this included adjustments related to the sale of certain operations in prior periods of $6MM in income versus nil in Q4’10.
Including discontinued operations, diluted EPS on net income attributable to common shareholders of $0.88 increased 47% from $0.60 earned last year.
ADOPTION OF GAAP GOVERNING TRANSFERS OF FINANCIAL ASSETS & RELATED IMPACT
On January 1, 2010, the Company consolidated its off balance sheet cardmember loans and related debt onto its balance sheet in compliance with GAAP governing transfers of financial assets and consolidation of variable interest entities (referred to herein as “new GAAP effective January 1, 2010”, and formerly known as “SFAS 166/167”). The adoption of this guidance eliminates the securitization income, net line from the Company’s Consolidated Statements of Income starting in Q1’10, as income and expense related to securitized loans and related debt are now reported on the natural income statement lines. The Company did not restate prior period results.
In addition, the Company has historically provided an “owned” basis and “managed” basis presentation of certain key loan metrics where “owned” basis metrics were prepared in accordance with GAAP and “managed” basis metrics included both non-securitized and securitized loan portfolios. Please see the “Cardmember Loan Portfolio Presentation” discussion on page 17 for a further description of currently reported information.
BUSINESS METRICS
Compared with the fourth quarter of 2009:
- Worldwide billed business of $197.7B increased 15% reflecting strong card spending across all segments. Adjusted for the impact of changes in foreign exchange rates, worldwide billings grew 14%.
- Worldwide total cards-in-force of 91.0MM increased 4% or 3.1MM cards from last year, and increased 2MM from last quarter. During Q3’10 the definition of cards-in-force was changed for certain retail co-brand cards in Global Network Services (“GNS”) as further discussed on page 10. The change caused a reduction to reported cards-in-force in Q3’10 of 1.6MM.
- Worldwide average spending per proprietary basic cards-in-force of $3,629 increased 13% versus last year reflecting broad-based improvement in cardmember spending levels. Adjusted for the impact of changes in foreign exchange rates, worldwide average spending per proprietary basic card also grew 13%.
- Worldwide cardmember loan balances of $60.9B increased 86% on a GAAP basis. On a comparable managed basis, including securitized loans in both periods, cardmember loan balances of $60.9B declined 1% from $61.8B last year, reflecting higher cardmember payment rates and lower revolving levels, partially offset by the higher cardmember spending volumes.
*Please refer to Appendix I of the Fourth Quarter/Full Year 2010 Earnings Release for the components of return on average equity (“ROE”), ROCE and ROTCE on a consolidated basis and Appendix II for return on average segment capital (“ROSC”) and return on average tangible segment capital (“ROTSC”) on a segment basis.

AMERICAN EXPRESS COMPANY
FOURTH QUARTER 2010 OVERVIEW
CONSOLIDATED
2
FINANCIAL HIGHLIGHTS
Discount Revenue: Increased 12% reflecting 15% growth in billed business volumes and a slight increase in the discount rate, partially offset by relatively faster growth in billed business related to GNS, where the Company shares the discount revenue with card issuing partners, and higher contra-revenues, including cash-back rewards costs and corporate incentive payments.
Securitization Income, Net: In accordance with the new GAAP effective January 1, 2010, the Company no longer reports securitization income, net in its income statement. Securitization income, net in Q4’09 was $190MM.
Net Interest Income: Increased 68%, primarily reflecting higher loan balances and related debt due to the new GAAP effective January 1, 2010 as interest income and interest expense from loans and debt previously held off balance sheet are now reported in the net interest income line, where in previous periods they are components of securitization income, net. Interest income and expense from the higher loan and debt balances were partially offset by a lower net yield, reflecting higher payment rates and lower revolving levels, and the implementation of elements of the recently passed H.R. 627: Credit Card Accountability Responsibility and Disclosure Act of 2009 (the “CARD Act”). These reductions to yield were partially offset by the benefit of certain repricing initiatives effective during 2009 and 2010.
Total Provisions for Losses: Decreased 68%, primarily driven by a lower lending reserve requirement due to improving credit performance within the cardmember loan portfolio. This cardmember lending reserve benefit was partially offset by write-offs related to securitized loans, which are reported in securitization income, net in periods prior to 2010 and are now reported in provisions for cardmember loan losses, and an increased charge card provision expense.
Marketing and Promotion Expenses: Increased 14% versus last year as lower credit provision expenses and better business trends enabled higher investment levels. Marketing and promotion expense decreased 4% or $37MM versus Q3’10, primarily reflecting lower investments in brand advertising.
Cardmember Rewards Expense: Increased 14%, primarily due to greater rewards-related spending volumes and higher co-brand expense.
Salaries and Employee Benefits Expense: Increased 31%, reflecting reengineering-related severance costs of $114MM as discussed further on page 6, as well as higher employee levels, merit increases for existing employees, higher benefit-related costs, including the impact of reinstating certain benefits that were temporarily suspended during the recession, higher management incentive compensation expenses, and greater volume-related sales-force incentives.
- Compared with last year, the total employee count from continuing operations of 60,500 increased by 1,300 or 2% from a
year ago. Compared with last quarter, the total employee count increased by 700 or 1%.
Professional Services Expense: Increased 27%, reflecting higher technology development expenditures (including various initiatives related to digitizing the business, globalizing operating platforms, and enhancing analytical and data capabilities); greater third-party merchant sales-force commissions; higher legal costs; and other costs related to obtaining expertise in support of new business initiatives; partially offset by lower credit and collection agency costs.
Segment Allocation Changes: Beginning Q4’10, the Company completed its conversion to a new general ledger platform. This conversion enabled the Company to streamline its ledger reporting unit structure, resulting in a reconfiguration of intercompany accounts. These changes have the effect of altering intercompany balances among segments, thus altering reported total segment assets. Total segment assets as of December 31, 2010 and 2009 presented in the Fourth Quarter/Full Year 2010 Earnings Release reflect the changes described above. This conversion has no impact on segment results, segment capital or return on segment capital metrics. Beginning Q1’10, the Company changed the manner in which it allocates capital and related interest expense to its reportable operating segments. The changes reflect modifications in allocation methodology that the Company believes more accurately reflect the funding and capital characteristics of its segments. The change to interest allocation also impacted the consolidated and segment reported net interest yield on cardmember loans. The segment results and net interest yield on cardmember loans for quarters prior to Q1’10 have been restated for this change.

AMERICAN EXPRESS COMPANY
FOURTH QUARTER 2010 OVERVIEW
CONSOLIDATED
3
Charge Card Write-off Period Changes: In Q1’10, the Company modified its reporting in the International Card Services (“ICS”) and Global Commercial Services (“GCS”) segments to write-off past due cardmember receivables when 180 days past due or earlier, versus its prior methodology of writing them off when 360 days past billing or earlier. This change is consistent with bank regulatory guidance and the write-off methodology adopted for the cardmember receivables portfolio in the U.S. Card Services (“USCS”) segment in Q4’08. This change resulted in approximately $60MM and $48MM of net write-offs for ICS and GCS, respectively, being included in Q1’10, which increased the net loss ratios and decreased the 90 days past billing metrics for these segments, but did not have a substantial impact on provisions for losses. Additionally, beginning in Q1’10, the Company revised the net loss ratio in the ICS and GCS segments to exclude net write-offs related to unauthorized transactions, consistent with the methodology employed in calculating the net write-off rate for USCS. Lastly, in Q1’10, the Company also enhanced the methodology for assessing the adequacy of its reserves. These modifications do not result in a change in management’s view of the Company’s underlying credit quality or risk profile for its charge card portfolio.
CAPITAL
Capital Purchase Program (“CPP”): On June 9, 2009, the Company announced that it had received notification from the Treasury that it had met all of the requirements to repurchase the CPP preferred shares. This included the pre-condition that the Company raise capital in the public markets, which it successfully did with its issuance of $3.0B of non-guaranteed senior debt on May 18, 2009 and the completion of a $500MM common equity offering on June 5, 2009. As such, the Company completed the repurchase of the CPP shares on June 17, 2009. Upon repurchase, the accretion of the preferred shares to face value was accelerated, amounting to a one-time negative EPS impact during Q2’09 of $212MM, or $0.18 per basic and diluted common share. On July 29, 2009, the Company repurchased the warrants issued under the CPP Program for $340MM, which provided the Treasury with an annualized return on the Company’s CPP participation of 26%. The warrant repurchase resulted in a reduction of cash and corresponding adjustment to Retained Earnings and Additional Paid-In Capital on the Company’s Consolidated Balance Sheet. There was no impact to the Company’s net income or EPS.
Capital Distribution to Shareholders: During Q4’10, approximately 57% of capital generated was distributed to shareholders through the Company’s quarterly common share dividend and share repurchase activities. Limited share repurchases were reinstated during the quarter after being suspended during Q1’08 in light of the challenging global economic environment and limitations imposed while participating in the CPP.
Since the inception of repurchase programs in December 1994, 684MM shares have been acquired under cumulative Board authorizations to repurchase up to 770MM shares. On a cumulative basis, since 1994 the Company has distributed 64% of capital generated through share repurchases and dividends. On January 7, 2011 the Company submitted its Comprehensive Capital Plan (“CCP”) to the Federal Reserve requesting approval to proceed with additional share repurchases in 2011. The CCP includes an analysis of performance and capital availability under certain adverse economic assumptions. The Company expects a response from the Federal Reserve by the end of the first quarter. No additional shares are expected to be repurchased prior to their response.
- Shares Outstanding:
Millions of Shares
Q4’10 Q3’10 Q4’09 Shares outstanding – beginning of period 1,204 1,202 1,189 Issuance of common shares - - - Repurchase of common shares (14) - - Employee benefit plans, compensation and other 7 2 3 Shares outstanding – end of period 1,197 1,204 1,192

AMERICAN EXPRESS COMPANY
FOURTH QUARTER 2010 OVERVIEW
CONSOLIDATED
4
Capital Ratios: As of December 31, 2010, the Company’s key consolidated capital ratios* were as follows:
($ in billions) December 31, 2010
Risk-Based Capital Tier 1 11.1% Total 13.1%
Tier 1 Leverage 9.3% Tier 1 Common Equity/Risk Weighted Assets (RWA) 11.1 % Tangible Common Equity (TCE)/RWA 10.7%
Tier 1 Capital $13.1 Tier 1 Common Equity $13.1 Tier 2 Capital $2.4 Total Average Assets** $141.3 RWA $118.3 TCE*** $12.6
On December 16, 2010 the Basel Committee on Banking Supervision issued the Basel III rules text, which presents details of global regulatory standards on bank capital adequacy and liquidity agreed to by the Governors and Heads of Supervision, and endorsed by the G20 Leaders at their November, 2010 summit. While final implementation of the rules related to capital ratios will be determined by the Federal Reserve, the Company estimates that had the new rules been in place during Q4’10, the reported tier 1 common and tier 1 capital ratios would decline by approximately 50 basis points.
FUNDING AND LIQUIDITY
Funding Activities: During Q4’10, the Company primarily funded its business through deposit-taking and issuance under a new asset-backed conduit facility.
- Deposits: The Company held the following deposits at the end of Q4’10 and Q4’09:
($ in billions) December 31, 2010
December 31, 2009
Change
U.S. Direct Deposits**** $8.7 $2.2 $6.5 U.S. 3rd Party CD’s U.S. 3rd Party Sweep Accounts Other Deposits
11.4 8.9 0.7
14.8 8.6 0.7
(3.4) 0.3 -
Total $29.7 $26.3 $3.4
The total portfolio of U.S. retail Certificate of Deposits (“CDs”), issued through the direct deposit and third party programs, had an average remaining maturity of 19.2 months, and an average rate at issuance of 2.5%. The U.S. retail CDs issued during the fourth quarter of 2010 had a weighted average maturity at issuance of 16.5 months with an average rate at issuance of 1.2%.
During the fourth quarter of 2010, the Company continued to focus its deposit strategy on direct deposits gathered through Personal Savings® from American Express, in particular the High Yield Savings Account, rather than CDs distributed through third-party distribution channels.
Asset-Backed Conduit: During December 2010, the Company entered into a $3B, 3-year committed, revolving, secured financing facility. This facility will be used in the ordinary course of business to fund working capital needs, as well as to further enhance the Company’s contingent funding resources. The facility is sponsored by a syndicate of banks and uses the Company’s charge card asset-backed securities program as collateral. The borrowing cost of the facility includes a fixed facility fee. In addition, the drawn balance incurs a weighted average cost of funds for the participating banks plus 25 basis points. On December 16, 2010, the Company drew $2.5B from the facility, which was still outstanding at December 31, 2010. The Company incurred an interest cost on the drawn amount that was equal to the weighted average cost of funds for the participating banks, which approximated 1 month LIBOR, plus 25 basis points.
*These ratios represent a preliminary estimate as of the date of this Earnings Supplement and may be revised in the Company’s 2010 Form 10-K.
**For the purpose of calculating the Tier 1 Leverage Ratio. ***Based upon shareholders’ equity of $16.2B less goodwill and intangible assets of $3.6B.
****Direct primarily includes the Personal Savings® direct deposit program, which consists of $7.5B from high yield savings accounts and $1.0B from retail
CDs.

AMERICAN EXPRESS COMPANY
FOURTH QUARTER 2010 OVERVIEW
CONSOLIDATED
5
Funding Sources: The Company’s primary funding sources consist of retail deposits, unsecured debt and asset-backed securities.
The Company offers deposits within its American Express Centurion Bank and American Express Bank, FSB (“FSB”) subsidiaries (together, the “Banks”). These funds are insured up to $250,000 per account through the Federal Deposit Insurance Corporation (“FDIC”). During Q2’09, the Company, through FSB, launched a direct deposit-taking program, Personal Savings® from American Express, to supplement its distribution of deposit products through third-party distribution channels. This program makes FDIC-insured CDs and high-yield savings account products available directly to consumers.
The Company currently has an objective to hold excess cash and readily marketable securities to satisfy all maturing long-term funding obligations for a 12-month period, in addition to having access to significant additional contingent liquidity sources in the event that access to its primary funding sources should become unavailable. As of December 31, 2010, the Company held $20B** of excess cash and readily marketable securities versus $20B of long-term debt and CDs maturing over the next 12 months.
- Additional Funding Sources: The Company can also draw upon the following additional funding sources:
-- Commercial Paper: At December 31, 2010, the Company had $0.6B of commercial paper outstanding.
-- Discount Window: The Banks are insured depository institutions that have the capability of borrowing from the Federal Reserve Bank of San Francisco (i.e., access to the Federal Reserve Bank discount window), subject to the amount of qualifying collateral that they pledge. The Federal Reserve has indicated that both credit and charge card receivables are a form of qualifying collateral for secured borrowing made through the discount window. Whether specific assets will be considered qualifying collateral for secured borrowings made through the discount window, and the amount that may be borrowed against the collateral, remains in the discretion of the Federal Reserve.
-- Bank Lines: At December 31, 2010, the Company maintained committed bank lines of credit totaling $13.6B, of which $6.6B was drawn as part of the Company’s normal funding activities. The committed facilities have $3.3B of expirations in 2011, with the remainder expiring in 2012 and 2013.
Maturity Obligations: The maturities of the Company’s long-term unsecured debt, debt issued in connection with asset-backed securitizations and long-term CDs for the next four quarters are as follows:
($ in billions) Funding Maturities
Quarter Ending: Unsecured
Debt Asset-Backed
Securitizations Certificates of
Deposit Total March 31, 2011 $ - $3.2 $2.0 $5.2 June 30, 2011 1.4 1.5 1.6 4.5 September 30, 2011 0.6 0.6 0.7 1.9 December 31, 2011 6.9 - 1.3 8.2 $8.9 $5.3 $5.6 $19.8
OTHER ITEMS OF NOTE
Department of Justice Complaint against American Express: On October 4, 2010, the United States Department of Justice (“DOJ”) and certain state attorneys general filed an anti-trust lawsuit against American Express Company, claiming that certain “non-discrimination” provisions in its merchant contracts violate antitrust laws. While announcing this lawsuit, the Justice Department also said that it reached agreements with Visa Inc., Visa USA and Visa International (collectively “Visa”) and MasterCard Inc. (“Mastercard”) to settle similar claims against them. The Company has indicated that it will defend in court the rights of its cardmembers at the point of sale and its own ability to negotiate freely with merchants. The Company believes the case is wrong on the law; that it is a significant retreat from previous DOJ efforts to promote competition in payments; that it will ultimately limit customer choice and reduce competition; and that the DOJ’s remedy would strengthen Visa and MasterCard while harming smaller networks.
**Excess cash includes $3.6B classified as other assets on the balance sheet, which is held against certain forthcoming asset-backed securitization maturities.

AMERICAN EXPRESS COMPANY
FOURTH QUARTER 2010 OVERVIEW
CONSOLIDATED
6
Acquisition of Accertify: On November 10, 2010, the Company completed the acquisition of Accertify Inc., a leading provider of solutions that help merchants combat fraudulent online and other card-not-present transactions, for total consideration of $151MM. The acquisition enables the Company to broaden its offering of fraud prevention services to merchants to include transactions that take place on all networks.
Acquisition of Loyalty Partner: On December 16, 2010, the Company announced an agreement to acquire Loyalty Partner, a leading marketing services company best known for the loyalty programs it operates in Germany, Poland and India. Loyalty Partner also provides market analysis, operating platforms and consulting services that help merchants grow their businesses. The purchase, which is subject to regulatory approval, is expected to close in the first quarter of 2011. The transaction, which values Loyalty Partner at approximately $660MM, consists of an upfront cash purchase price of approximately $566MM and an additional $94MM equity interest that the Company will acquire over the next five years at a value based on business performance.
Visa and MasterCard Litigation Settlements: In November of 2004, the Company filed suit against Visa, MasterCard, and certain
of their member banks to seek monetary damages for the lost business opportunity that resulted from the illegal conspiracy to boycott American Express from partnering with U.S. credit card issuing banks. The Company reached agreements with Visa on November 7, 2007 and with MasterCard on June 25, 2008. All defendants were removed and the case was dismissed.
Under the terms of the settlement agreements, the Company will receive aggregate maximum payments of up to $2.25B from Visa and $1.8B from MasterCard. The settlement with Visa is comprised of an initial payment of $1.13B ($700MM after-tax) that was recorded in Q4’07 and received in March 2008, and quarterly payments of up to $70MM ($43MM after-tax) for four years from Q1’08 through Q4’11. The settlement with MasterCard is comprised of quarterly payments of up to $150MM ($93MM after-tax) for three years from Q3’08 through Q2‘11. The Company recognized $70MM from Visa for each of the past twelve quarters and $150MM from MasterCard for each of the past ten quarters pursuant to these agreements.
The installment payments from both parties are subject to the Company achieving certain quarterly performance criteria in the GNS business within the U.S., which the Company believes it is positioned to meet. Payments earned through December 2010 have been recorded as a reduction to the “other, net” expense line within the Corporate & Other segment.
Reengineering Initiatives: On January 19, 2011, the Company announced that it was undertaking various reengineering initiatives resulting in charges aggregating approximately $113MM pre-tax (approximately $74MM after-tax), which were recorded in the fourth quarter of 2010. The charges relating to the reengineering activities include a restructuring charge recorded in the fourth quarter (pursuant to a plan approved by the Company’s management on December 20, 2010) in the amount of approximately $98MM pre-tax (approximately $63MM after-tax) relating to employee severance obligations and other employee-related costs resulting from the planned consolidation of facilities within the Company’s global servicing network. The reengineering activities are expected to result in the elimination of approximately 3,500 jobs in the aggregate (including approximately 3,200 jobs relating to the restructuring charge described in the preceding sentence); however, overall staffing levels are expected to decrease only by approximately 550 positions on a net basis as new employees are hired at the locations to which work is being transferred.
The $113MM of net reengineering costs consists primarily of $114MM of net severance-related costs, partially offset by revisions of certain estimates impacting real estate-related reserve balances tied to the Company’s reengineering initiatives. In addition, the Company expects to record further restructuring charges in one or more quarterly periods during 2011 relating to the reengineering activities described above in the aggregate amount of approximately $60MM to $80MM pre-tax (approximately $38MM to $51MM after-tax). The total expected additional charges include approximately $25MM to $35MM in costs associated with additional employee compensation and approximately $35MM to $45MM in other costs principally relating to the termination of certain real property leases. Substantially all of the reengineering activities are expected to be completed by the end of the fourth quarter of 2011. The Company also announced that it expects the charges recorded in the fourth quarter of 2010 and to be recorded during 2011 to result in annualized cost savings to the Company of approximately $70MM, starting in 2012. The Company announced that it intends to reinvest a portion of such savings into new servicing capabilities and other business building initiatives.

AMERICAN EXPRESS COMPANY
FOURTH QUARTER 2010 OVERVIEW
CONSOLIDATED
7
EXPANDED PRODUCTS AND SERVICES
During the quarter, American Express continued to invest in growth opportunities through expanded products and services.
In our proprietary issuing and network businesses, the Company:
- Announced the elimination of foreign currency transaction fees for U.S. consumer and small business Cardmembers who make international purchases with their Platinum Cards® or Centurion® Cards. The change, which is scheduled to be effective towards the end of Q1’11, is aimed at strengthening relationships with Cardmembers and to make sure that American Express is top of mind and top of wallet when they shop, travel and entertain both at home and abroad.
- In conjunction with New York City Mayor Michael Bloomberg and dozens of advocacy groups, launched Small Business Saturday, a national movement to drive shoppers to local merchants across the U.S. in order to support the local businesses that create jobs, boost the economy and preserve neighborhoods around the country. The Company supported the movement by offering certain statement credits to cardmembers, marketing subsidies to merchants and other promotional programs.
- Launched inSiteSM from American Express – an innovative new shopping tool that delivers Membership Rewards® bonus points, discounts, free shipping and other special benefits exclusively to American Express Cardmembers as they shop online.
- With our partner American Airlines, announced the launch of the American Express® / Business ExtrAA® Corporate Platinum Card to help mid-sized companies balance comfort, ease and productivity for their executive business travelers while simultaneously reducing corporate expenses. In addition to existing benefits, the product includes new benefits, such as one American Airlines domestic companion ticket per year, access to the Admirals Club® and concierge services.
- Announced the launch of a new co-branded corporate card with Cathay Pacific that offers greater rewards and savings for mid- to large- sized companies in Hong Kong through which both companies and employees earn airline reward points.
- In an industry first, announced a strategic relationship with Zynga that allows cardmembers to use Membership Rewards points to pay for limited edition virtual goods, as well as physical and virtual game cards for Zynga’s games. The relationship will also entail unique joint-marketing endeavors and exclusive offers for both company’s membership bases.
- Announced a memorandum of understanding with China UnionPay, calling for both companies to explore the expansion of their current cooperative activities and establishing working teams to develop potential new areas of cooperation between the two companies within China and in markets outside of China.
- Expanded the offerings for Zync cardmembers with four new “Packs” focused on Art, Health & Fitness, Spa, and Vegas, which provide cardmembers with special benefits, from discounts to bonus Membership Rewards® points, in each category. In keeping with the collaborative process in which American Express launched the ZYNC Card in May 2010, American Express once again engaged existing and target cardmembers to help identify additional passion areas to help shape the new Pack offerings.
In the GNS business the Company: - Announced a new card-issuing partnership with Sberbank in Russia; by partnering with two of the country's leading financial
institutions, Russian Standard Bank and Sberbank, GNS is helping expand American Express' presence in Russia. - Announced a new card-issuing partnership with First National Bank of Omaha in the U.S. - Supported existing GNS partners in launching a wide range of new products, including: the American Express® Corporate
Card from China Merchants Bank in China, the UOB Preferred Platinum American Express® Card from United Overseas Bank in Singapore, the American Express® Corporate Card from City Bank in Bangladesh, the American Express® Gold Card from Acba Credit Agricole Bank in Armenia, and the American Express® Pluna FlyClub Card from Banco Comercial in Uruguay.
AMERICAN EXPRESS COMPANY
FOURTH QUARTER 2010 OVERVIEW
CONSOLIDATED
8
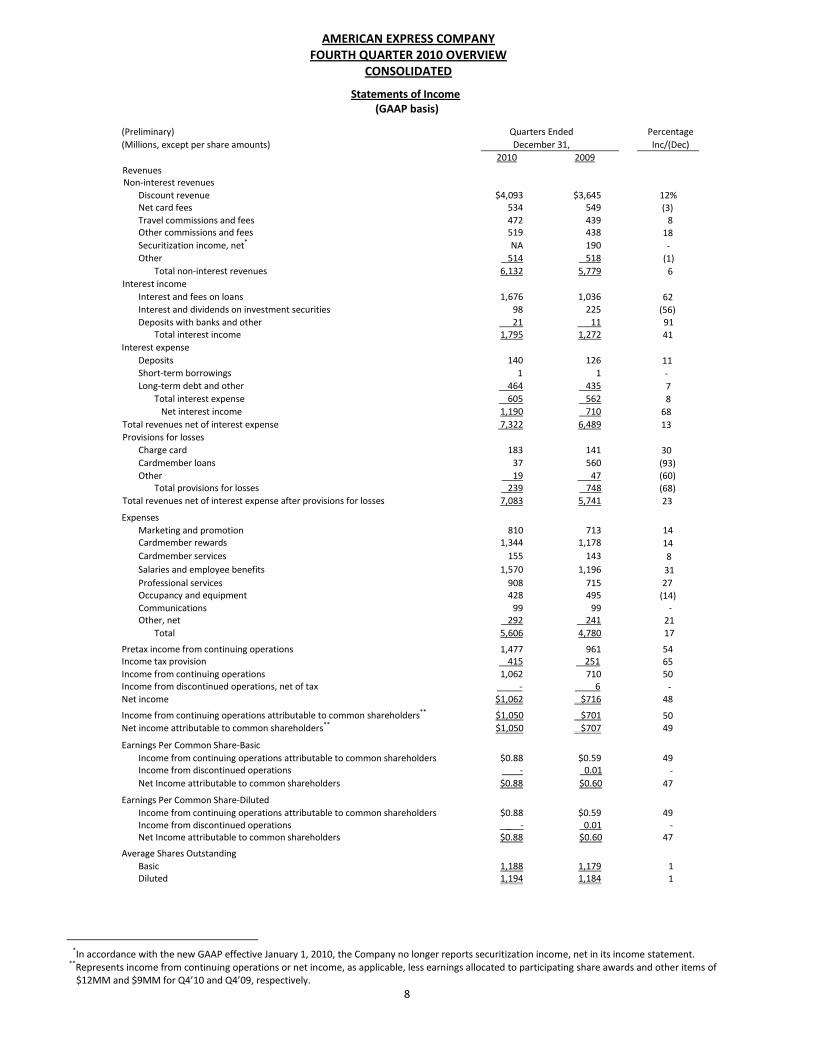
Statements of Income (GAAP basis)
(Preliminary) Quarters Ended Percentage
(Millions, except per share amounts) December 31, Inc/(Dec)
2010 2009
Revenues Non-interest revenues
Discount revenue $4,093 $3,645 12% Net card fees 534 549 (3) Travel commissions and fees 472 439 8 Other commissions and fees 519 438 18 Securitization income, net* NA 190 - Other 514 518 (1)
Total non-interest revenues 6,132 5,779 6 Interest income
Interest and fees on loans 1,676 1,036 62 Interest and dividends on investment securities 98 225 (56) Deposits with banks and other 21 11 91
Total interest income 1,795 1,272 41 Interest expense
Deposits 140 126 11 Short-term borrowings 1 1 - Long-term debt and other 464 435 7
Total interest expense 605 562 8 Net interest income 1,190 710 68
Total revenues net of interest expense 7,322 6,489 13 Provisions for losses
Charge card 183 141 30
Cardmember loans 37 560 (93) Other 19 47 (60)
Total provisions for losses 239 748 (68) Total revenues net of interest expense after provisions for losses 7,083 5,741 23 Expenses
Marketing and promotion 810 713 14 Cardmember rewards 1,344 1,178 14
Cardmember services 155 143 8
Salaries and employee benefits 1,570 1,196 31
Professional services 908 715 27 Occupancy and equipment 428 495 (14) Communications 99 99 - Other, net 292 241 21
Total 5,606 4,780 17 Pretax income from continuing operations 1,477 961 54
Income tax provision 415 251 65 Income from continuing operations 1,062 710 50 Income from discontinued operations, net of tax - 6 - Net income $1,062 $716 48 Income from continuing operations attributable to common shareholders** $1,050 $701 50 Net income attributable to common shareholders** $1,050 $707 49 Earnings Per Common Share-Basic
Income from continuing operations attributable to common shareholders $0.88 $0.59 49 Income from discontinued operations - 0.01 -
Net Income attributable to common shareholders $0.88 $0.60 47 Earnings Per Common Share-Diluted
Income from continuing operations attributable to common shareholders $0.88 $0.59 49 Income from discontinued operations _ - 0.01 - Net Income attributable to common shareholders $0.88 $0.60 47
Average Shares Outstanding Basic 1,188 1,179 1 Diluted 1,194 1,184 1
*In accordance with the new GAAP effective January 1, 2010, the Company no longer reports securitization income, net in its income statement.
**Represents income from continuing operations or net income, as applicable, less earnings allocated to participating share awards and other items of $12MM and $9MM for Q4’10 and Q4’09, respectively.

AMERICAN EXPRESS COMPANY
FOURTH QUARTER 2010 OVERVIEW
CONSOLIDATED
9
Consolidated Total Revenues Net of Interest Expense: Consolidated total revenues net of interest expense increased 13% versus last year, reflecting increases of 18% in USCS, 2% in ICS, 7% in GCS, and 15% in Global Network and Merchant Services (“GNMS”). The increase in total revenues net of interest expense primarily reflects the new GAAP effective January 1, 2010, which caused the reporting of write-offs related to securitized loans to move from securitization income, net in Q4’09 to provisions for cardmember loan losses in Q4’10. In addition, total revenues net of interest expense reflects higher discount revenues, increased other commissions and fees and greater travel commissions and fees partially offset by lower net interest income on the combined securitized and non-securitized loan portfolio, and slightly lower net card fees and other revenue. On an F/X adjusted basis, consolidated total revenues net of interest expense also increased 13%*.
Consolidated Provisions for Losses: Consolidated provisions for losses decreased 68% versus last year, reflecting decreases of 68% in USCS, 75% in ICS, 19% in GCS and 56% in GNMS. Provisions for losses declined despite the new GAAP effective January 1, 2010, which caused write-offs related to securitized loans to be reported in the provisions for losses line in Q4’10 as opposed to securitization income, net in Q4’09. The provision decrease reflects the benefit of improving year-over-year credit metrics in the cardmember loan portfolio, partially offset by a higher charge card provision expense. On an F/X adjusted basis, consolidated provisions for losses also decreased 68%*.
Consolidated Expenses: Consolidated expenses increased 17%, reflecting increases of 18% in USCS, 23% in ICS, 9% in GCS and 16% in GNMS. The total expenses increase reflects higher salaries and employee benefits expenses, greater professional services expenses, increased cardmember rewards expenses, higher marketing and promotion expenses and higher other, net expenses, partially offset by lower occupancy and equipment expense. Consolidated expenses also include the $113MM of reengineering costs previously discussed. Adjusted for these costs, consolidated expenses grew 15%. On an F/X adjusted basis, consolidated expenses also increased 17%*.
Pretax Margin: Was 20.2% of total revenues net of interest expense in Q4’10 compared with 14.8% in Q4’09.
Effective Tax Rate: Was 28% in Q4’10 versus 26% in Q4’09. The tax rates in both quarters reflect the level of pre-tax income in relation to recurring permanent tax benefits. The tax rate in Q4’10 reflects a reduction in the 2010 full year rate related to the extension during the quarter of certain U.S. tax laws that had expired at the end of 2009.
Discount Revenue: Increased 12% on a 15% increase in billed business. The lesser revenue versus billed business growth reflects the relatively faster growth in billed business related to GNS, where discount revenue is shared with card issuing partners, and higher contra-revenues, including cash-back rewards costs and corporate incentive payments.
- The average discount rate** was 2.52% in Q4’10 versus 2.56% in Q3’10 and 2.51% in Q4’09. The decline in rate versus Q3’10 reflects the normal seasonal impact of a higher level of retail-related business volumes during the fourth quarter. As indicated in prior quarters, certain pricing initiatives, changes in the mix of business and volume-related pricing discounts and investments will likely result in some erosion of the average discount rate over time. Quarters Ended
December 31, Percentage
Inc/(Dec)
2010 2009 Card billed business**
(billions): United States $131.1 $115.0 14% Outside the United States 66.6 57.6 16 Total $197.7 $172.6 15
Total cards-in-force (millions): United States 48.9 48.9 - Outside the United States 42.1 39.0 8 Total 91.0 87.9 4
Basic cards-in-force (millions): United States 37.9 38.2 (1) Outside the United States 37.4 34.3 9 Total 75.3 72.5 4
Average basic cardmember spending*** United States $3,744 $3,321 13 Outside the United States $3,343 $2,932 14 Total $3,629 $3,209 13
*As reported in this Earnings Supplement, F/X adjusted information assumes a constant exchange rate between the periods being compared for purposes of currency translation into U.S. dollars (i.e., assumes the foreign exchange rates used to determine results for the three months ended December 31, 2010 apply to the period(s) against which such results are being compared). Management believes the presentation of information on an F/X adjusted basis is helpful to investors by making it easier to compare the Company's performance in one period to that of another period without the variability caused by fluctuations in currency exchange rates. **For additional information about discount rate calculations and billed business, please refer to the Fourth Quarter/Full Year 2010 Earnings release,
American Express Company Selected Statistical Information pages. ***Proprietary card activity only.

AMERICAN EXPRESS COMPANY
FOURTH QUARTER 2010 OVERVIEW
CONSOLIDATED
10
- Worldwide Billed Business: The 15% increase in worldwide billed business reflected growth of 12% in USCS, 12% in ICS,
16% in GCS and 26% in GNS. The table below summarizes selected billed business related statistics for Q4’10:
Percentage Increase/(Decrease)
Percentage Increase/(Decrease)
Assuming No Changes in Foreign Exchange Rates
Worldwide* Total billed business 15% 14% Proprietary billed business 13 13 GNS billed business 26 24 Average spending per proprietary basic card 13 13 Basic cards-in-force 4
U.S.* Billed business 14 Average spending per proprietary basic card 13 Basic cards-in-force (1) Proprietary consumer card billed business** 12 Proprietary small business billed business** 13 Proprietary Corporate Services billed business*** 17
Outside the U.S.* Billed business 16 15 Average spending per proprietary basic card 14 14 Basic cards-in-force 9 Proprietary consumer and small business billed business† 12 11 Proprietary Corporate Services billed business*** 14 16
-- U.S. non-T&E-related volume categories, which represented approximately 74% of total U.S. billed business, increased 15% and T&E volumes increased 12%.
-- U.S. airline-related volume, which represented approximately 8% of total U.S. volumes during the quarter, increased 14% due to a 13% increase in airline transactions and a 1% increase in the average airline charge.
-- Worldwide airline volumes, which represented approximately 9% of total volumes during the quarter, increased 13% due to a 13% increase in airline transactions and a flat average airline charge.
-- Assuming no changes in foreign exchange rates, billed business outside the U.S. grew 20% in Asia Pacific, 17% in Latin America, 11% in Canada, and 10% in Europe.
- Total cards-in-force: Increased 4% worldwide due to a 10% increase in GNS, a 1% increase in USCS and a flat level in ICS and GCS. During Q3’10, the definition of non-proprietary cards-in-force was changed to exclude retail co-brand cardmember accounts in GNS which have no out-of-store spend activity during the prior 12 month period. This change caused a reduction to reported cards-in-force in Q3’10 of 1.6MM. -- During the quarter, total cards-in-force increased by 800K in the U.S. and increased by 1.2MM outside the U.S.
Net Card Fees: Decreased 3% primarily due to a non-renewal reserve adjustment in the prior year. Travel Commissions and Fees: Increased 8%, primarily reflecting a 12% increase in worldwide travel sales, partially offset by a
lower sales revenue rate.
Other Commissions and Fees: Increased 18%, driven primarily by the new GAAP effective January 1, 2010 where fees related to securitized receivables are now recognized as other commissions and fees starting in Q1’10. These fees were previously reported in securitization income, net. The increase also reflects greater foreign currency conversion revenues related to higher spending, partially offset by lower delinquency fees in the non-securitized cardmember loan portfolio.
*Captions not designated as “proprietary” or “GNS” include both proprietary and GNS data. **Included in USCS. ***Included in GCS. †Included in ICS.

AMERICAN EXPRESS COMPANY
FOURTH QUARTER 2010 OVERVIEW
CONSOLIDATED
11
Securitization Income, Net: In accordance with the new GAAP effective January 1, 2010, the Company no longer reports securitization income, net in its income statement. The components of securitization income, net now appear on the relevant natural income statement lines. For the period ended Q4’09, securitization income, net represented the non-credit provision components of the gains/(losses) from securitization activities within USCS, excess spread, net* related to securitized loans and servicing income, net of related discounts or fees.
- Components of Securitization Income, Net: (millions) Quarter Ended
December 31, 2009
Excess spread, net* $49 Servicing fees 141 Total securitization income, net $190
Other Revenues: Decreased 1%, primarily reflecting investments in partnership initiatives, lower travelers cheque-related revenues and reduced insurance revenues, partially offset by higher GNS partner royalty and merchant-related fee revenues.
Total Interest Income: Increased 41%.
- Interest and Fees on Loans: Increased 62%, driven by an increase in the average loan balance resulting from the consolidation of securitized receivables in accordance with the new GAAP effective January 1, 2010. Interest income related to securitized receivables is reported in securitization income, net in prior periods, but is now reported in interest and fees on loans. The increase related to this consolidation was partially offset by a lower yield on cardmember loans, reflecting higher payment rates and lower revolving levels, and the implementation of elements of the CARD Act. These reductions to yield were partially offset by the benefit of certain repricing initiatives effective during 2009 and 2010.
- Interest and Dividends on Investment Securities: Decreased 56%, primarily reflecting the elimination of interest on
retained securities driven by the new GAAP effective January 1, 2010 and decreased short-term investment levels.
- Deposits with Banks and Other: Was $21MM versus $11MM in Q4‘09, primarily due to higher average deposit balances versus the prior year, partially offset by lower interest yields.
Total Interest Expense: Increased 8%. - Deposits: Increased 11% versus last year, as an increase in balances was partially offset by a lower cost of funds. - Short-term Borrowings: Was flat versus the prior year at $1MM. - Long-term Debt and Other: Increased 7%, reflecting the consolidation of long-term debt associated with securitized loans
previously held off balance sheet in accordance with the new GAAP effective January 1, 2010. Interest expense related to this debt is reported in securitization income, net in prior periods, but is now reported in long-term debt and other interest expense.
*Excess spread, net is the net cash flow from interest and fee collections allocated to the investors’ interests after deducting the interest paid on investor certificates, credit losses, contractual servicing fees, other expenses and changes in the fair value of the interest-only strip (“I/O Strip”).
AMERICAN EXPRESS COMPANY
FOURTH QUARTER 2010 OVERVIEW
CONSOLIDATED
12
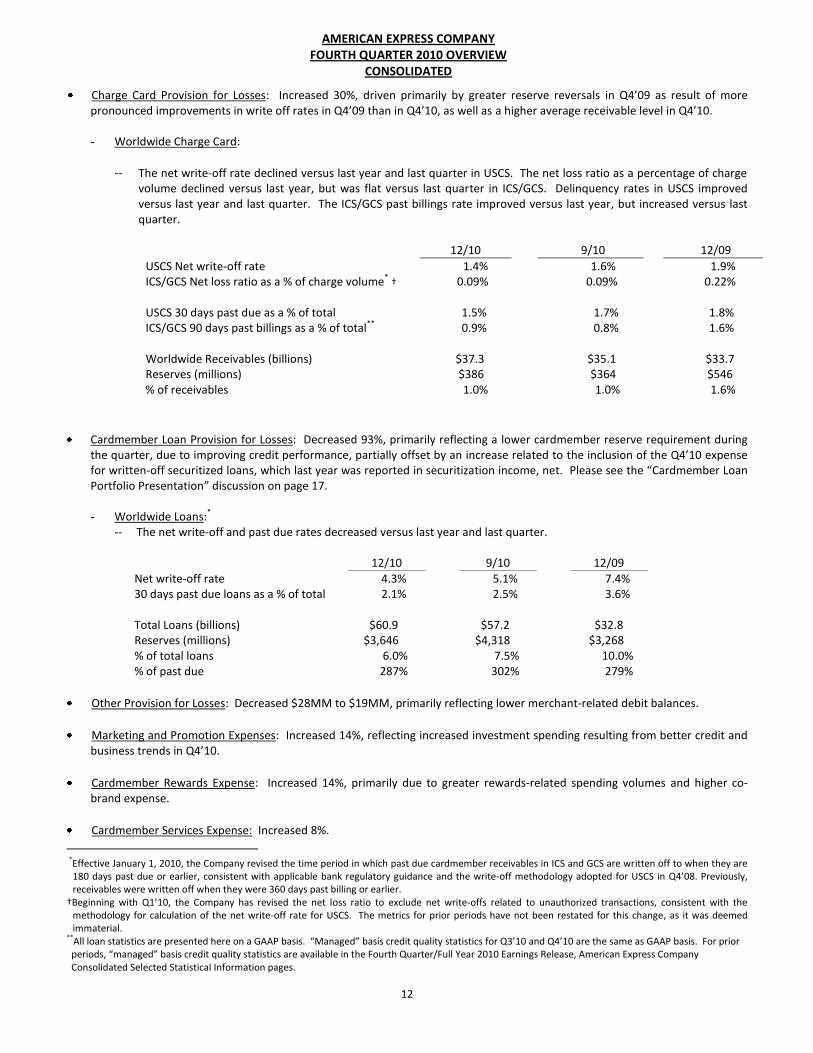
Charge Card Provision for Losses: Increased 30%, driven primarily by greater reserve reversals in Q4’09 as result of more pronounced improvements in write off rates in Q4’09 than in Q4’10, as well as a higher average receivable level in Q4’10. - Worldwide Charge Card:
-- The net write-off rate declined versus last year and last quarter in USCS. The net loss ratio as a percentage of charge volume declined versus last year, but was flat versus last quarter in ICS/GCS. Delinquency rates in USCS improved versus last year and last quarter. The ICS/GCS past billings rate improved versus last year, but increased versus last quarter.
12/10 9/10 12/09
USCS Net write-off rate 1.4% 1.6% 1.9% ICS/GCS Net loss ratio as a % of charge volume* † 0.09% 0.09% 0.22% USCS 30 days past due as a % of total 1.5% 1.7% 1.8% ICS/GCS 90 days past billings as a % of total** 0.9% 0.8% 1.6% Worldwide Receivables (billions) $37.3 $35.1 $33.7 Reserves (millions) $386 $364 $546 % of receivables 1.0% 1.0% 1.6%
Cardmember Loan Provision for Losses: Decreased 93%, primarily reflecting a lower cardmember reserve requirement during the quarter, due to improving credit performance, partially offset by an increase related to the inclusion of the Q4’10 expense for written-off securitized loans, which last year was reported in securitization income, net. Please see the “Cardmember Loan Portfolio Presentation” discussion on page 17. - Worldwide Loans:*
-- The net write-off and past due rates decreased versus last year and last quarter.
12/10 9/10 12/09
Net write-off rate 4.3% 5.1% 7.4% 30 days past due loans as a % of total 2.1% 2.5% 3.6% Total Loans (billions) $60.9 $57.2 $32.8 Reserves (millions) $3,646 $4,318 $3,268 % of total loans 6.0% 7.5% 10.0% % of past due 287% 302% 279%
Other Provision for Losses: Decreased $28MM to $19MM, primarily reflecting lower merchant-related debit balances.
Marketing and Promotion Expenses: Increased 14%, reflecting increased investment spending resulting from better credit and business trends in Q4’10.
Cardmember Rewards Expense: Increased 14%, primarily due to greater rewards-related spending volumes and higher co-brand expense.
Cardmember Services Expense: Increased 8%.
*Effective January 1, 2010, the Company revised the time period in which past due cardmember receivables in ICS and GCS are written off to when they are
180 days past due or earlier, consistent with applicable bank regulatory guidance and the write-off methodology adopted for USCS in Q4’08. Previously, receivables were written off when they were 360 days past billing or earlier.
†Beginning with Q1’10, the Company has revised the net loss ratio to exclude net write-offs related to unauthorized transactions, consistent with the methodology for calculation of the net write-off rate for USCS. The metrics for prior periods have not been restated for this change, as it was deemed immaterial.
**All loan statistics are presented here on a GAAP basis. “Managed” basis credit quality statistics for Q3’10 and Q4’10 are the same as GAAP basis. For prior periods, “managed” basis credit quality statistics are available in the Fourth Quarter/Full Year 2010 Earnings Release, American Express Company Consolidated Selected Statistical Information pages.

AMERICAN EXPRESS COMPANY
FOURTH QUARTER 2010 OVERVIEW
CONSOLIDATED
13
Salaries and Employee Benefits Expense: Increased 31%, to $1,570MM reflecting the $114MM of severance costs described on page 6. Adjusting for those costs, salaries and benefits expense would have increased 22% to $1,456MM reflecting higher employee levels, merit increases for existing employees, higher benefit-related costs, including the impact of reinstating certain benefits that were temporarily suspended during the recession, higher management incentive compensation expenses, and greater volume-related sales incentives.
Professional Services Expense: Increased 27%, reflecting higher technology development expenditures (including various initiatives related to digitizing the business, globalizing operating platforms, and enhancing analytical and data capabilities); greater third-party merchant sales-force commissions; higher legal costs; and other costs related to obtaining expertise in support of new business initiatives; partially offset by lower credit and collection agency costs.
Occupancy and Equipment Expense: Decreased 14%, primarily reflecting a Q4’09 charge of $63MM for certain property exits.
Communications Expense: Was flat versus the prior year.
Other, Net Expense: Increased 21%, primarily reflecting higher taxes other than income, higher travel and entertainment costs and a net negative impact associated with fair value hedge ineffectiveness versus the prior year, partially offset by lower printing and stationary costs.

AMERICAN EXPRESS COMPANY
FOURTH QUARTER 2010 OVERVIEW
CONSOLIDATED
14
Supplemental Information – Tangible Common Equity and Total Adjusted Assets During the third quarter of 2006, the Company issued $750MM of 6.80% Subordinated Debentures due 2036 (“Subordinated Debentures”), which are automatically extendable until 2066 unless certain events occur prior to that date. In connection with the Subordinated Debentures, the Company has undertaken to disclose on a quarterly basis the amount of its “tangible common equity” and “total adjusted assets”, as defined in the Subordinated Debentures. The Company’s consolidated “tangible common equity” amount as of the end of any fiscal quarter means the total shareholders’ equity, excluding preferred stock, of the Company as reflected on its consolidated balance sheet prepared in accordance with GAAP as of such fiscal quarter end minus (i) intangible assets and goodwill and (ii) deferred acquisition costs, as determined in accordance with GAAP and reflected in such consolidated balance sheet. The Company’s “total adjusted assets” as of the end of any fiscal quarter is calculated as the sum of (i) total consolidated assets as reflected on the Company’s balance sheet minus (ii) non-securitized Cardmember loan receivables (without deduction for reserves), which are set forth on the Company’s balance sheet, plus (iii) managed (i.e., securitized and non-securitized) worldwide Cardmember loan receivables as reported by the Company for such fiscal quarter. Upon the adoption of new GAAP effective January 1, 2010, the Company’s “total consolidated assets” as reflected on the Company’s balance sheet now are the same amount as would be calculated as “total adjusted assets” as defined in the Subordinated Debentures before the change in GAAP. As of December 31, 2010, the Company’s “tangible common equity” was $13B and its “total adjusted assets” as defined in the Subordinated Debentures, were $147B. As of December 31, 2010, the consolidated total assets as reflected on the Company’s balance sheet were also $147B.
CORPORATE & OTHER SEGMENT
Net expense was $115MM in Q4’10 compared with $73MM in Q3’10 and $72MM in Q4‘09. - Q4’10 included:
-- $93MM and $43MM of after-tax income related to the MasterCard and Visa litigation settlements, respectively; -- Various investments in the Global Prepaid business and Enterprise Growth initiatives; -- Higher incentive compensation and benefit reinstatement-related expenses; and -- Lower interest costs due to decreased cost of excess liquidity.
- Q3’10 included: -- $93MM and $43MM of after-tax income related to the MasterCard and Visa litigation settlements, respectively; -- Various investments in the Global Prepaid business and Enterprise Growth initiatives; and -- $5MM of after-tax expense related to the Company’s reengineering efforts.
- Q4’09 included: -- $93MM and $43MM of after-tax income related to the MasterCard and Visa litigation settlements, respectively; -- $8MM of net after-tax benefit reflecting revisions of certain estimates impacting reserve balances tied to the
Company’s reengineering efforts; and -- $39MM of after-tax cost related to certain property exits.

AMERICAN EXPRESS COMPANY
FOURTH QUARTER 2010 OVERVIEW
U.S. CARD SERVICES
15
Condensed Statements of Income (GAAP Basis)
(Preliminary)
Quarters Ended December 31,
Percentage Inc/(Dec)
(Millions) 2010 2009 Revenues
Discount revenue, net card fees and other $2,647 $2,377 11% Securitization income, net* NA 190 - Interest income 1,330 754 76 Interest expense 208 133 56
Net interest income 1,122 621 81 Total revenues net of interest expense 3,769 3,188 18 Provisions for losses 111 346 (68) Total revenues net of interest expense after provisions for losses 3,658 2,842 29 Expenses
Marketing, promotion, rewards and cardmember services 1,509 1,306 16 Salaries and employee benefits and other operating expenses 1,088 890 22
Total 2,597 2,196 18 Pretax segment income 1,061 646 64 Income tax provision 360 233 55 Segment income $701 $413 70
# Denotes a variance of more than 100%.
Statistical Information
Quarters Ended December 31,
Percentage Inc/(Dec)
2010 2009 Card billed business (billions) $103.4 $92.1 12% Total cards-in-force (millions) 39.9 39.5 1 Basic cards-in-force (millions) 29.7 29.5 1 Average basic cardmember spending** $3,480 $3,112 12 Segment capital (millions)*** $7,411 $6,021 23 Return on average segment capital*** 35.4% 8.0% Return on average tangible segment capital*** 38.1% 8.7%
- Billed Business: The 12% increase in billed business was driven by the higher average spending per proprietary basic cards-in-force. -- U.S. consumer billed business volumes increased by 12%; small business volumes increased by 13%.
- Total cards-in-force: Increased by 400K versus last year reflecting the company’s emphasis on investments in charge and co-brand product acquisitions. Total cards in force was flat sequentially.
P&L Discussion:
Segment Income: Increased to $701MM from $413MM in Q4’09, as total revenues net of interest expense increased 18%, provisions for losses decreased 68% and expenses increased by 18%.
- Q4’10 includes $56MM ($36MM after-tax) of the previously discussed reengineering costs. Q4’09 included a net benefit of $4MM ($3MM after-tax), reflecting revisions of certain estimates impacting reserve balances tied to the Company’s reengineering initiatives in that period.
- Pretax Margin: Was 28.2% in Q4’10 compared with 20.3% in Q4’09.
*In accordance with the new GAAP effective January 1, 2010, the Company no longer reports securitization income, net in its income statement. **Proprietary cards only. ***Segment capital represents capital allocated to a segment based upon specific business operational needs, risk measures, and regulatory capital
requirements. Please refer to Appendix II of the Fourth Quarter /Full Year 2010 Earnings Release for the components of ROSC and ROTSC.

AMERICAN EXPRESS COMPANY
FOURTH QUARTER 2010 OVERVIEW
U.S. CARD SERVICES
16
- Effective Tax Rate: Was 33.9% in Q4’10 compared with 36.1% in Q4’09.
Discount Revenue, Net Card Fees and Other: Increased 11%, primarily due to billed business growth of 12%. This line also reflects higher other commissions and fees, driven by the new GAAP effective January 1, 2010, which led to the inclusion of fees formerly recorded in securitization income, net.
Securitization Income, Net: Was not applicable in Q4’10 due to the new GAAP effective January 1, 2010, versus income of $190MM in Q4’09.
Interest Income: Increased 76%, due to the new GAAP effective January 1, 2010, partially offset by lower yields on cardmember loans.
Interest Expense: Increased 56%, primarily reflecting higher expense related to the new GAAP effective January 1, 2010, and a higher cost of funds.
Provisions for Losses: Decreased 68%, principally reflecting improved cardmember loan credit trends, partially offset by the inclusion in Q4’10 of write-offs on the securitized cardmember loans and a higher charge card provision. - Charge Card:
-- The net write-off and past due rates decreased versus last year and last quarter.
12/10 9/10 12/09
Total Receivables (billions) $19.2 $16.5 $17.8 Net write-off rate 1.4% 1.6% 1.9% 30 days past due as a % of total 1.5% 1.7% 1.8%
- Cardmember Loans:*
-- The net write-off and past due rates decreased versus last year and last quarter.
12/10 9/10 12/09
Total Loans (billions) $51.6 $48.7 $23.5 Net write-off rate 4.4% 5.2% 8.0% 30 days past due loans as a % of total 2.1% 2.5% 3.7%
Marketing, Promotion, Rewards and Cardmember Services Expenses: Increased 16%, reflecting increased marketing and promotion expenses due to higher investment spending resulting from better credit and business trends in Q4’10 and higher rewards costs primarily due to greater rewards-related spending volumes and higher co-brand expense.
Salaries and Employee Benefits and Other Operating Expenses: Increased 22%, primarily reflecting the $56MM of reengineering costs, in addition to higher technology development expenditures, and other business building investments.
*GAAP basis. See page 17 for Cardmember Loan Portfolio Presentation discussion.

AMERICAN EXPRESS COMPANY
FOURTH QUARTER 2010 OVERVIEW
U.S. CARD SERVICES
17
Cardmember Loan Portfolio Presentation
For periods ended on or prior to December 31, 2009, the Company’s non-securitized cardmember loans and related debt performance information on a GAAP basis was referred to as the “owned” basis presentation. For such periods, the Company also provided information on a non-GAAP “managed” basis. Unlike the GAAP basis presentation, the managed basis presentation in such periods assumed there had been no off-balance sheet securitizations for the Company’s USCS segment (the Company does not currently securitize its international cardmember loans), resulting in the inclusion of all securitized and non-securitized cardmember loans and related debt in the Company’s performance information.
Under the GAAP basis presentation prior to a securitization for periods ended on or prior to December 31, 2009, revenues and expenses from cardmember loans and related debt were reflected in the Company’s income statements in other commissions and fees, net interest income and provisions for losses for cardmember loans. At the time of a securitization transaction, the securitized cardmember loans were removed from the Company’s balance sheet, and the resulting gain on sale was reflected in securitization income, net, as well as a reduction to provisions for losses (credit reserves were no longer recorded for the cardmember loans once sold). Over the life of a securitization transaction, the Company recognized the net cash flow from interest and fee collections on interests sold to investors (the investors’ interests) after deducting interest paid on the investors’ certificates, credit losses, contractual service fees, other expenses and changes in the fair value of the interest-only strip (referred to as “excess spread”). These amounts, in addition to servicing fees and the non-credit components of the gains/(losses) from securitization activities, were reflected in securitization income, net. The Company also recognized interest income over the life of the securitization transaction related to the interest it retained (i.e., the seller’s interest). At the maturity of a securitization transaction, cardmember loans on the balance sheet increased, and the impact of the incremental required loss reserves was recorded in provisions for losses.
Under the managed basis presentation for periods ended on or prior to December 31, 2009, revenues and expenses related to securitized cardmember loans and related debt were reflected in other commissions and fees (included in discount revenue, net card fees and other), interest income, interest expense and provisions for losses. In addition, there was no securitization income, net as this presentation assumed no securitization transactions had occurred.
Historically, the Company included USCS information on a managed basis, as that was the manner in which the Company’s management viewed and managed the business. Management believed that a full picture of trends in the Company’s cardmember loans business could only be derived by evaluating the performance of both securitized and non-securitized cardmember loans, as the presentation of the entire cardmember loan portfolio was more representative of the economics of the aggregate cardmember relationships and ongoing business performance and related trends over time. The managed basis presentation also provided investors a more comprehensive assessment of the information necessary for the Company and investors to evaluate the Company’s market share.
The adoption of new GAAP on January 1, 2010 resulted in accounting for both the Company’s securitized and non-securitized cardmember loans in the consolidated financial statements. As a result, the Company’s 2010 GAAP presentations and managed basis presentations prior to 2010 are generally comparable.
For additional information on the differences between the Company’s historical GAAP and managed basis presentations, see the Company’s 2009 Financial Review included in the Company’s Annual Report on Form 10-K for the year ended December 31, 2009.

AMERICAN EXPRESS COMPANY
FOURTH QUARTER 2010 OVERVIEW
U.S. CARD SERVICES
18
The following table sets forth portfolio financial information for Q4’10 and Q4’09. The Q4’10 financial information was determined in accordance with the new GAAP effective January 1, 2010. The Q4’09 information includes the “owned” (GAAP) basis presentation, together with the adjustments for securitization activity to arrive at the “managed” (non-GAAP) basis presentation. For additional information, please see the Cardmember Loan Portfolio Presentation discussion on page 17.
Quarters Ended Percentage
(Millions) December 31, Inc/(Dec)
2010 2009 Discount revenue, net card fees and other:
Reported for the period (GAAP) $2,647 $2,377 11% Securitization adjustments NA 71 - Managed discount revenue, net card fees and other $2,647 $2,448 8
Interest income:
Reported for the period (GAAP) $1,330 $754 76% Securitization adjustments NA 726 - Managed interest income $1,330 $1,480 (10)
Securitization income, net*:
Reported for the period (GAAP) NA $190 - Securitization adjustments NA (190) - Managed securitization income, net NA $- -
$1,411 Interest expense:
Reported for the period (GAAP) $208 $133 56% Securitization adjustments NA 55 - Managed interest expense $208 $188 11
Provisions for losses:
Reported for the period (GAAP) $111 $346 (68)% Securitization adjustments NA 572** - Managed provisions for losses $111 $918** (88)
Managed P&L Discussion:
Discount Revenue, Net Card Fees and Other: Increased 8%, reflecting higher billed business volumes.
Interest Income: Decreased 10%, due to a 4% decline in the average loan balance and a lower portfolio yield. The lower yield was driven by higher payment rates, lower revolving levels and effects of the CARD Act, partially offset by repricing initiatives.
Interest Expense: Increased 11%, due to a higher cost of funds and a greater average receivable balance, partially offset by the lower average loan balance.
Provisions for Losses: Decreased 88%, due to lower reserve requirements resulting from improving cardmember loan credit trends, partially offset by a higher charge card provision.
- Cardmember Loans: -- The net write-off and past due rates decreased versus last year and last quarter.
12/10 9/10 12/09
Total Loans (billions) $51.6 $48.7 $52.6 Net write-off rate 4.4% 5.2% 7.5% 30 days past due loans as a % of total 2.1% 2.5% 3.7%
*In accordance with the new GAAP effective January 1, 2010, the Company no longer reports securitization income, net in its income statement.
**Includes provisions for losses for off-balance sheet cardmember loans based on the same methodology as applied to on-balance sheet cardmember loans, except that any quarterly adjustment to reserve levels for on-balance sheet loans to address external environmental factors was not applied to adjust the provision expense for the securitized portfolio.
AMERICAN EXPRESS COMPANY
FOUTH QUARTER 2010 OVERVIEW
INTERNATIONAL CARD SERVICES
19
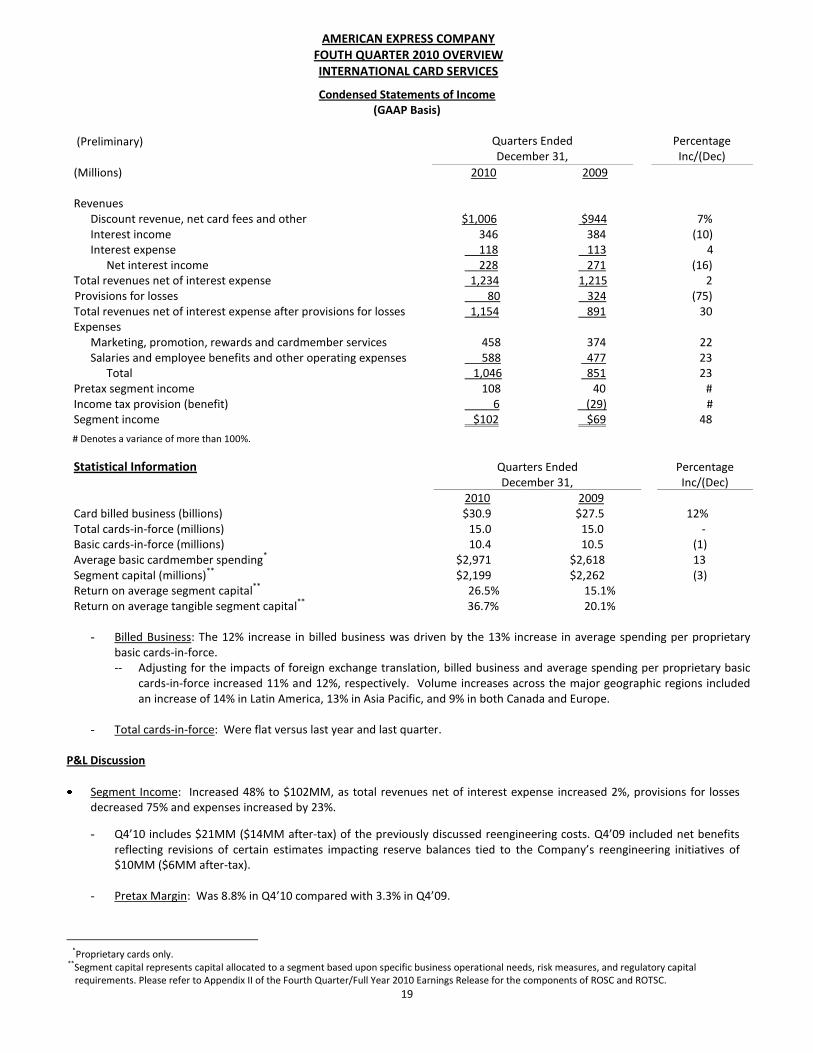
Condensed Statements of Income (GAAP Basis)
(Preliminary)
Quarters Ended December 31,
Percentage Inc/(Dec)
(Millions) 2010 2009 Revenues
Discount revenue, net card fees and other $1,006 $944 7% Interest income 346 384 (10) Interest expense 118 113 4
Net interest income 228 271 (16) Total revenues net of interest expense 1,234 1,215 2 Provisions for losses 80 324 (75) Total revenues net of interest expense after provisions for losses 1,154 891 30 Expenses
Marketing, promotion, rewards and cardmember services 458 374 22 Salaries and employee benefits and other operating expenses 588 477 23
Total 1,046 851 23 Pretax segment income 108 40 # Income tax provision (benefit) 6 (29) # Segment income $102 $69 48
# Denotes a variance of more than 100%.
Statistical Information
Quarters Ended December 31,
Percentage Inc/(Dec)
2010 2009 Card billed business (billions) $30.9 $27.5 12% Total cards-in-force (millions) 15.0 15.0 - Basic cards-in-force (millions) 10.4 10.5 (1) Average basic cardmember spending* $2,971 $2,618 13 Segment capital (millions)** $2,199 $2,262 (3) Return on average segment capital** 26.5% 15.1% Return on average tangible segment capital**
36.7% 20.1%
- Billed Business: The 12% increase in billed business was driven by the 13% increase in average spending per proprietary basic cards-in-force. -- Adjusting for the impacts of foreign exchange translation, billed business and average spending per proprietary basic
cards-in-force increased 11% and 12%, respectively. Volume increases across the major geographic regions included an increase of 14% in Latin America, 13% in Asia Pacific, and 9% in both Canada and Europe.
- Total cards-in-force: Were flat versus last year and last quarter.
P&L Discussion
Segment Income: Increased 48% to $102MM, as total revenues net of interest expense increased 2%, provisions for losses decreased 75% and expenses increased by 23%.
- Q4’10 includes $21MM ($14MM after-tax) of the previously discussed reengineering costs. Q4’09 included net benefits reflecting revisions of certain estimates impacting reserve balances tied to the Company’s reengineering initiatives of $10MM ($6MM after-tax).
- Pretax Margin: Was 8.8% in Q4’10 compared with 3.3% in Q4’09.
*Proprietary cards only.
**Segment capital represents capital allocated to a segment based upon specific business operational needs, risk measures, and regulatory capital requirements. Please refer to Appendix II of the Fourth Quarter/Full Year 2010 Earnings Release for the components of ROSC and ROTSC.

AMERICAN EXPRESS COMPANY
FOUTH QUARTER 2010 OVERVIEW
INTERNATIONAL CARD SERVICES
20
- Effective Tax Rate: The tax rate was 5.6% in Q4’10 versus (72.5)% in Q4’09. The tax rates in both periods primarily reflect
the impact of recurring tax benefits on varying levels of pretax income. As indicated in previous quarters, this segment reflects the favorable impact of the consolidated tax benefit related to its ongoing funding activities outside the U.S., which is allocated to ICS under the Company’s internal tax allocation process.
Discount Revenue, Net Card Fees and Other: Increased 7%, driven primarily by the higher level of cardmember spending and higher other commissions and fees.
Interest Income: Declined 10%, as a lower yield on cardmember loans was partially offset by higher lending card fees.
Interest Expense: Increased 4% as the impact of a higher average receivable balance was partially offset by a lower average loan balance.
Provisions for Losses: Decreased 75%, primarily reflecting improving cardmember loan credit trends.
- Charge Card: -- The net loss ratio and past billing rate decreased versus last year. Sequentially, the net loss ratio increased slightly and
the past billing rate was flat.
12/10 9/10 12/09
Total Receivables (billions) $6.7 $6.2 $5.9 Net loss ratio as a % of charge volume*
† 0.15% 0.14% 0.37% 90 days past billing as a % of total* 1.0% 1.0% 2.1%
- Cardmember Loans:
-- The net write-off and past due rates decreased versus last year and last quarter.
12/10 9/10 12/09
Cardmember Loans (billions) $9.3 $8.5 $9.2 Net write-off rate 4.0% 4.3% 6.1% 30 days past due loans as a % of total 2.3% 2.8% 3.3%
Marketing, Promotion, Rewards and Cardmember Services Expenses: Increased 22%, due to greater volume-related rewards
costs and higher marketing and promotion expenses. Salaries and Employee Benefits and Other Operating Expenses: Increased 23%, reflecting the $21MM of reengineering costs in
addition to higher technology development expenditures, increased investments in sales-force, closing costs related to the acquisition of Loyalty Partner and other business building investments.
*Effective January 1, 2010, the Company revised the time period in which past due cardmember receivables in ICS are written off to when they are 180 days past due or earlier, consistent with applicable bank regulatory guidance and the write-off methodology adopted for USCS in Q4‘08. Previously, receivables were written off when they were 360 days past billing or earlier. †Beginning with Q1‘10, the Company has revised the net loss ratio to exclude net write-offs related to unauthorized transactions, consistent with the
methodology for calculation of the net write-off rate for USCS. The metrics for prior periods have not been restated for this change, as it was deemed immaterial.

AMERICAN EXPRESS COMPANY
FOURTH QUARTER 2010 OVERVIEW
GLOBAL COMMERCIAL SERVICES
21
Condensed Statements of Income (GAAP Basis)
(Preliminary)
Quarters Ended December 31,
Percentage Inc/(Dec)
(Millions) 2010 2009 Revenues
Discount revenue, net card fees and other $1,215 $1,120 8% Interest income 2 1 100 Interest expense 65 49 33
Net interest expense (63) (48) 31 Total revenues net of interest expense 1,152 1,072 7 Provisions for losses 30 37 (19) Total revenues net of interest expense after provisions for losses 1,122 1,035 8 Expenses
Marketing, promotion, rewards and cardmember services 112 98 14 Salaries and employee benefits and other operating expenses 865 796 9
Total 977 894 9 Pretax segment income 145 141 3 Income tax provision 39 41 (5) Segment income $106 $100 6
Statistical Information
Quarters Ended December 31,
Percentage Inc/(Dec)
2010 2009 Card billed business (billions) $35.9 $31.0 16% Total cards-in-force (millions) 7.1 7.1 - Basic cards-in-force (millions) 7.1 7.1 - Average basic cardmember spending* $5,083 $4,357 17 Segment capital (millions)** $3,650 $3,719 (2) Return on average segment capital** 13.2% 9.7% Return on average tangible segment capital**
28.6% 20.8%
- Billed Business: The 16% increase in billed business was driven by the 17% increase in average spending per proprietary
basic cards-in-force.
-- Adjusting for the impacts of foreign exchange translation, billed business and average spending per proprietary basic cards-in-force both grew at a rate of 17%. Volume increased 17% within the U.S., compared to an increase of 16% outside the U.S.
- Total cards-in-force: Were flat compared to last year and increased by 100K versus last quarter.
P&L Discussion
Segment Income: Increased 6% to $106MM as total revenues net of interest expense increased 7%, provisions for losses decreased 19% and expenses increased 9%. - Q4’10 includes $18MM ($12MM after-tax) of the previously discussed reengineering costs. Q4’09 included $20MM
($13MM after-tax) of net costs related to such initiatives.
- Pretax Margin: Was 12.6% in Q4’10 compared with 13.2% in Q4’09. - Effective Tax Rate: Was 26.9% in Q4’10 compared with 29.1% in Q4’09.
*Proprietary cards only. **Segment capital represents capital allocated to a segment based upon specific business operational needs, risk measures, and regulatory capital requirements. Please refer to Appendix II of the Fourth Quarter/Full Year 2010 Earnings Release for the components of ROSC and ROTSC.

AMERICAN EXPRESS COMPANY
FOURTH QUARTER 2010 OVERVIEW
GLOBAL COMMERCIAL SERVICES
22
Discount Revenue, Net Card Fees and Other: Increased 8%, as an increased level of card spending and greater travel commissions and fees were partially offset by higher client incentive payments.
Interest Income: Increased to $2MM in Q4’10 from $1MM in Q4’09.
Interest Expense: Increased 33%, primarily driven by increased funding requirements due to a higher average receivable balance and a higher cost of funds, primarily in the U.S. and Asia Pacific.
Provisions for Losses: Decreased 19%, driven by improved credit performance within the underlying portfolio.
- Charge Card: -- The net loss ratio and past billing rate decreased versus last year. Sequentially, the net loss ratio and past billing rate
remained flat.
12/10 9/10 12/09
Total Receivables (billions) $11.3 $12.2 $9.8 Net loss ratio as a % of charge volume*
† 0.06% 0.06% 0.14% 90 days past billing as a % of total* 0.8% 0.8% 1.4%
Marketing, Promotion, Rewards and Cardmember Services Expenses: Increased 14%, reflecting higher volume-related rewards costs and greater marketing and promotion expenses.
Salaries and Employee Benefits and Other Operating Expenses: Increased 9%, reflecting higher travel volume-driven personnel costs, greater incentive-based sales-force costs and other business building investments.
*Effective January 1, 2010, the Company revised the time period in which past due cardmember receivables in GCS are written off to when they are 180 days
past due or earlier, consistent with applicable bank regulatory guidance and the write-off methodology adopted for USCS in Q4‘08. Previously, receivables were written off when they were 360 days past billing or earlier.
†Beginning with Q1‘10, the Company has revised the net loss ratio to exclude write-offs related to unauthorized transactions, consistent with the methodology for calculation of the net write-off rate for USCS. The metrics for prior periods have not been restated for this change, as it was deemed immaterial.
AMERICAN EXPRESS COMPANY
FOURTH QUARTER 2010 OVERVIEW
GLOBAL NETWORK & MERCHANT SERVICES
23
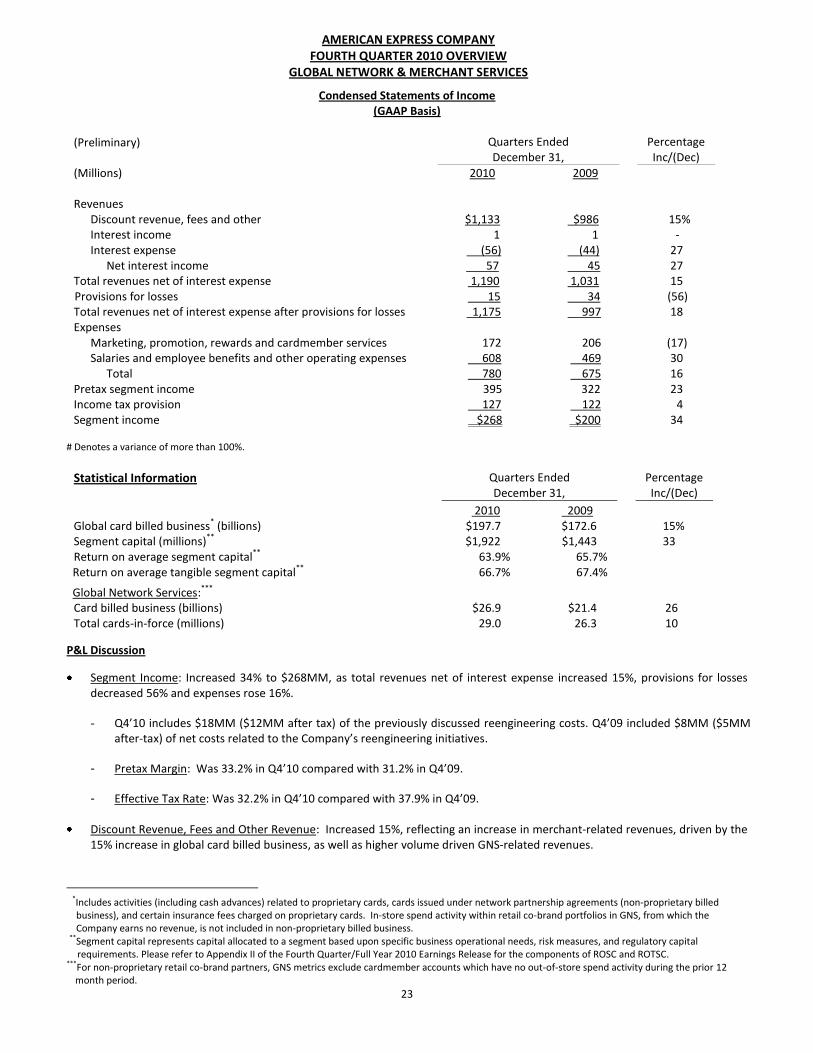
Condensed Statements of Income (GAAP Basis)
(Preliminary) Quarters Ended December 31,
Percentage Inc/(Dec)
(Millions) 2010 2009 Revenues
Discount revenue, fees and other $1,133 $986 15% Interest income 1 1 - Interest expense (56) (44) 27
Net interest income 57 45 27 Total revenues net of interest expense 1,190 1,031 15 Provisions for losses 15 34 (56) Total revenues net of interest expense after provisions for losses 1,175 997 18 Expenses
Marketing, promotion, rewards and cardmember services 172 206 (17) Salaries and employee benefits and other operating expenses 608 469 30
Total 780 675 16 Pretax segment income 395 322 23 Income tax provision 127 122 4 Segment income $268 $200 34
# Denotes a variance of more than 100%.
Statistical Information Quarters Ended December 31,
Percentage Inc/(Dec)
2010 2009 Global card billed business* (billions) $197.7 $172.6 15% Segment capital (millions)** $1,922 $1,443 33 Return on average segment capital** 63.9% 65.7% Return on average tangible segment capital** 66.7% 67.4%
Global Network Services:*** Card billed business (billions) $26.9 $21.4 26 Total cards-in-force (millions) 29.0 26.3 10
P&L Discussion
Segment Income: Increased 34% to $268MM, as total revenues net of interest expense increased 15%, provisions for losses decreased 56% and expenses rose 16%.
- Q4’10 includes $18MM ($12MM after tax) of the previously discussed reengineering costs. Q4’09 included $8MM ($5MM after-tax) of net costs related to the Company’s reengineering initiatives.
- Pretax Margin: Was 33.2% in Q4’10 compared with 31.2% in Q4’09.
- Effective Tax Rate: Was 32.2% in Q4’10 compared with 37.9% in Q4’09.
Discount Revenue, Fees and Other Revenue: Increased 15%, reflecting an increase in merchant-related revenues, driven by the 15% increase in global card billed business, as well as higher volume driven GNS-related revenues.
*Includes activities (including cash advances) related to proprietary cards, cards issued under network partnership agreements (non-proprietary billed business), and certain insurance fees charged on proprietary cards. In-store spend activity within retail co-brand portfolios in GNS, from which the Company earns no revenue, is not included in non-proprietary billed business. **Segment capital represents capital allocated to a segment based upon specific business operational needs, risk measures, and regulatory capital
requirements. Please refer to Appendix II of the Fourth Quarter/Full Year 2010 Earnings Release for the components of ROSC and ROTSC. ***For non-proprietary retail co-brand partners, GNS metrics exclude cardmember accounts which have no out-of-store spend activity during the prior 12
month period.

AMERICAN EXPRESS COMPANY
FOURTH QUARTER 2010 OVERVIEW
GLOBAL NETWORK & MERCHANT SERVICES
24
Interest Income: Was $1MM in both Q4’10 and Q4’09.
Interest Expense: The expense credit increased 27% due to a higher funding-driven interest credit related to internal transfer pricing, which recognizes the merchant services’ accounts payable-related funding benefit.
Provisions for Losses: Decreased by $19MM, or 56%, primarily due to lower merchant-related debit balances.
Marketing, Promotion, Rewards and Cardmember Services Expenses: Decreased 17%, reflecting a reduction in brand and merchant-related activities, partially offset by higher network-related partner activities.
Salaries and Employee Benefits and Other Operating Expenses: Increased 30%, reflecting the $18MM of reengineering costs, in addition to third-party merchant sales-force commissions, higher technology development expenditures, and other business building investments.

AMERICAN EXPRESS COMPANY
FULL YEAR 2010 OVERVIEW
CONSOLIDATED
25
Statements of Income (GAAP basis)
(Preliminary) Years Ended Percentage
(Millions, except per share amounts) December 31, Inc/(Dec)
2010 2009
Revenues Non-interest revenues
Discount revenue $15,111 $13,389 13% Net card fees 2,102 2,151 (2) Travel commissions and fees 1,779 1,594 12 Other commissions and fees 2,031 1,778 14 Securitization income, net* NA 400 - Other 1,927 2,087 (8)
Total non-interest revenues 22,950 21,399 7 Interest income
Interest and fees on loans 6,783 4,468 52 Interest and dividends on investment securities 443 804 (45) Deposits with banks and other 66 59 12
Total interest income 7,292 5,331 37 Interest expense
Deposits 546 425 28 Short-term borrowings 3 37 (92) Long-term debt and other 1,874 1,745 7
Total interest expense 2,423 2,207 10 Net interest income 4,869 3,124 56
Total revenues net of interest expense 27,819 24,523 13 Provisions for losses
Charge card 595 857 (31) Cardmember loans 1,527 4,266 (64) Other 85 190 (55)
Total provisions for losses 2,207 5,313 (58) Total revenues net of interest expense after provisions for losses 25,612 19,210 33 Expenses
Marketing and promotion 3,054 1,914 60 Cardmember rewards 5,029 4,036 25
Cardmember services 561 517 9
Salaries and employee benefits 5,566 5,080 10
Professional services 2,806 2,408 17 Occupancy and equipment 1,562 1,619 (4) Communications 383 414 (7) Other, net 687 381 80
Total 19,648 16,369 20 Pretax income from continuing operations 5,964 2,841 #
Income tax provision 1,907 704 #
Income from continuing operations 4,057 2,137 90 Loss from discontinued operations, net of tax - (7) - Net income $4,057 $2,130 90 Income from continuing operations attributable to common shareholders** $4,006 $1,809 #
Net income attributable to common shareholders** $4,006 $1,802 # Earnings Per Common Share-Basic
Income from continuing operations attributable to common shareholders $3.37 $1.55 # Loss from discontinued operations - (0.01) -
Net Income attributable to common shareholders $3.37 $1.54 # Earnings Per Common Share-Diluted
Income from continuing operations attributable to common shareholders $3.35 $1.54 # Loss from discontinued operations _ - - - Net Income attributable to common shareholders $3.35 $1.54 #
Average Shares Outstanding Basic 1,188 1,168 2 Diluted 1,195 1,171 2
#Denotes a variance of more than 100%. *In accordance with the new GAAP effective January 1, 2010, the Company no longer reports securitization income, net in its income statement. **Represents income from continuing operations or net income, as applicable, less (i) accelerated preferred dividend accretion of $212MM for 2009 due to the repurchase of $3.39B of preferred shares issued as part of the CPP, (ii) preferred share dividends and related accretion of $94MM for 2009, and (iii) earnings allocated to participating share awards and other items of $51MM and $22MM for 2010 and 2009, respectively.

AMERICAN EXPRESS COMPANY
FULL YEAR 2010 OVERVIEW
CONSOLIDATED
26
FINANCIAL RESULTS
Full year 2010 diluted EPS from continuing operations attributable to common shareholders of $3.35 increased significantly from $1.54 last year. Total revenues net of interest expense increased 13%. The revenue increase primarily reflects the impact of the consolidation of off-balance sheet cardmember loans and related debt discussed on page 1. - 2010 income from continuing operations included:
-- $127MM ($83MM after-tax) of net costs related to the Company’s reengineering initiatives.
- 2009 Income from continuing operations included: -- A $180MM ($113MM after-tax) benefit in 3Q‘09 primarily representing the correction of an error related to the
accounting for a net investment in the Company’s consolidated foreign subsidiaries; -- A $211MM ($135MM after-tax) gain in 2Q‘09 on the sale of 50% of the Company’s equity holdings of Industrial and
Commercial Bank of China (“ICBC”); and -- $190MM ($125MM after-tax) of net costs related to the Company’s reengineering initiatives.
Including discontinued operations, diluted EPS on net income attributable to common shareholders was $3.35 in 2010 versus $1.54 last year.
CAPITAL
Capital Distribution to Shareholders: During 2010, approximately 30% of capital generated was distributed to shareholders through the Company’s quarterly common share dividend and share repurchase activities.
- Shares Outstanding:
Millions of Shares 2010 2009
Shares outstanding – beginning of period 1,192 1,160 Issuance of common shares - 22 Repurchase of common shares (14) - Employee benefit plans, compensation and other 19 10 Shares outstanding – end of period 1,197 1,192
FINANCIAL HIGHLIGHTS
Consolidated Total Revenues Net of Interest Expense: Consolidated total revenues net of interest expense increased 13% versus last year, reflecting increases of 20% in USCS, 3% in ICS, 11% in GCS, and 16% in GNMS. The increase in total revenues net of interest expense primarily reflects the new GAAP effective January 1, 2010, which caused the reporting of write-offs related to securitized loans to move from securitization income, net in 2009 to provisions for cardmember loan losses in 2010. In addition, total revenues net of interest expense reflects higher discount revenues, increased other commissions and fees and greater travel commissions and fees, partially offset by lower other revenue, reduced net card fees and lower net interest income on the combined securitized and non-securitized loan portfolio. On an F/X adjusted basis, consolidated total revenues net of interest expense increased 12%*.
Consolidated Provisions for Losses: Consolidated provisions for losses decreased 58% versus last year, reflecting decreases of 58% in USCS, 68% in ICS, 11% in GCS and 55% in GNMS. Provisions for losses declined despite the new GAAP effective January 1, 2010, which caused write-offs related to securitized loans to be reported in the provisions for losses line in 2010 as opposed to securitization income, net in 2009. The provision decrease reflects the benefit of improving year-over-year credit metrics in both the cardmember loan and charge card portfolios. On an F/X adjusted basis, consolidated provisions for losses decreased 59%*.
*As reported in this Earnings Supplement, F/X adjusted information assumes a constant exchange rate between the periods being compared for purposes of currency translation into U.S. dollars (i.e., assumes the foreign exchange rates used to determine results for the twelve months ended December 31, 2010 apply to the period(s) against which such results are being compared). Management believes the presentation of information on an F/X adjusted basis is helpful to investors by making it easier to compare the Company's performance in one period to that of another period without the variability caused by fluctuations in currency exchange rates.

AMERICAN EXPRESS COMPANY
FULL YEAR 2010 OVERVIEW
CONSOLIDATED
27
Consolidated Expenses: Consolidated expenses increased 20%, reflecting increases of 22% in USCS, 19% in ICS, 6% in GCS and 21% in GNMS. The total expense increase reflected greater marketing and promotion expenses, increased cardmember rewards expense, higher salaries and employee benefits, greater professional services expenses, higher other, net expenses, and increased cardmember services expenses, partially offset by lower occupancy and equipment expense and lower communications expense. On an F/X adjusted basis, consolidated expenses increased 19%†.
Pretax Margin: Was 21.4% of total revenues net of interest expense in 2010 compared with 11.6% in 2009.
Effective Tax Rate: Was 32% in 2010 versus 25% in 2009. The tax rates in both years reflect the level of pretax income in relation to recurring permanent tax benefits.
Discount Revenue: Increased 13% on a 15% increase in billed business and a slightly higher discount rate. The lesser revenue versus billed business growth reflects the relatively faster growth in billed business related to GNS, where discount revenue is shared with card issuing partners, and higher contra-revenues, including cash-back rewards costs and corporate incentive payments.
- The average discount rate* was 2.55% in 2010 versus 2.54% in 2009. As indicated in prior periods, certain pricing initiatives, changes in the mix of business and volume-related pricing discounts and investments will likely result in some erosion of the average discount rate over time.
Years Ended December 31,
Percentage Inc/(Dec)
2010 2009 Card billed business* (billions):
United States $479.3 $423.7 13% Outside the United States 234.0 196.1 19 Total $713.3 $619.8 15
Average basic cardmember spending** United States $13,856 $11,764 18 Outside the United States $11,778 $9,834 20 Total $13,259 $11,213 18
†As reported in this Earnings Supplement, F/X adjusted information assumes a constant exchange rate between the periods being compared for purposes
of currency translation into U.S. dollars (i.e., assumes the foreign exchange rates used to determine results for the twelve months ended December 31, 2010 apply to the period(s) against which such results are being compared). Management believes the presentation of information on an F/X adjusted basis is helpful to investors by making it easier to compare the Company's performance in one period to that of another period without the variability caused by fluctuations in currency exchange rates. *For additional information about billed business and discount rate calculations, please refer to the Fourth Quarter/Full Year 2010 Earnings Release, American Express Company Selected Statistical Information pages. **Proprietary card activity only.

AMERICAN EXPRESS COMPANY
FULL YEAR 2010 OVERVIEW
CONSOLIDATED
28
- Worldwide Billed Business: The 15% increase in worldwide billed business reflected growth of 11% in USCS, 14% in ICS, 19% in GCS and 28% in GNS. The table below summarizes selected billed business related statistics for 2010:
Percentage Increase/(Decrease)
Percentage Increase/(Decrease)
Assuming No Changes in Foreign Exchange Rates
Worldwide* Total billed business 15% 14% Proprietary billed business 13 13 GNS billed business 28 24 Average spending per proprietary basic card 18 17 Basic cards-in-force 4
U.S.* Billed business 13 Average spending per proprietary basic card 18 Basic cards-in-force (1) Proprietary consumer card billed business** 12 Proprietary small business billed business** 11 Proprietary Corporate Services billed business*** 19
Outside the U.S.* Billed business 19 15 Average spending per proprietary basic card 20 16 Basic cards-in-force 9 Proprietary consumer and small business billed business† 14 9 Proprietary Corporate Services billed business*** 20 18
-- Both U.S. non-T&E-related volume categories, which represented approximately 72% of total U.S. billed business, and T&E volumes, increased 13%.
-- U.S. airline-related volume, which represented approximately 9% of total U.S. volumes, increased 20% due to a 13% increase in airline transactions and a 6% increase in the average airline charge.
-- Worldwide airline volumes, which represented approximately 10% of total volumes, increased 20% due to a 13% increase in airline transactions and a 7% increase in the average airline charge.
-- Assuming no changes in foreign exchange rates: billed business outside the U.S. grew 22% in Asia Pacific, 18% in Latin America, 10% in Europe, and 9% in Canada.
Net Card Fees: Decreased 2%, partially due to a non-renewal reserve adjustment in the prior year. Travel Commissions and Fees: Increased 12%, primarily reflecting a 19% increase in worldwide travel sales, partially offset by a
lower sales revenue rate.
Other Commissions and Fees: Increased 14%, driven primarily by the new GAAP effective January 1, 2010 where fees related to securitized receivables are now recognized as other commissions and fees starting in Q1’10. These fees were previously reported in securitization income, net. The increase also reflects greater foreign currency conversion revenues related to higher spending, partially offset by lower delinquency fees in the non-securitized cardmember loan portfolio.
*Captions not designated as “proprietary” or “GNS” include both proprietary and GNS data. **Included in USCS. ***Included in GCS.
†Included in ICS.

AMERICAN EXPRESS COMPANY
FULL YEAR 2010 OVERVIEW
CONSOLIDATED
29
Securitization Income, Net: In accordance with the new GAAP effective January 1, 2010, the Company no longer reports securitization income, net in its income statement. The components of securitization income, net now appear on the relevant natural income statement lines. For the year ended 2009, securitization income, net represented the non-credit provision components of the gains/(losses) from securitization activities within USCS, excess spread, net* related to securitized loans and servicing income, net of related discounts or fees.
- Components of Securitization Income, Net: (millions) Year Ended
December 31, 2009
Excess spread, net* ($155) Servicing fees 562 Loss on securitizations** (7) Total securitization income, net $400
Other Revenues: Decreased 8%, primarily reflecting the $211MM gain on the sale of 50% of the Company’s equity holdings in ICBC in 2009, lower insurance premium revenues and higher partner investments which appear as a contra-other revenue, partially offset by higher GNS partner-related royalty revenues, greater merchant fee-related revenue, and higher publishing revenue.
Total Interest Income: Increased 37%.
- Interest and Fees on Loans: Increased 52%, driven by an increase in the average loan balance resulting from the consolidation of securitized receivables in accordance with the new GAAP effective January 1, 2010. Interest income related to securitized receivables is reported in securitization income, net in prior periods, but is now reported in interest and fees on loans. The increase related to this consolidation was partially offset by a lower yield on cardmember loans, reflecting higher payment rates and lower revolving levels, and the implementation of elements of the CARD Act. These reductions to yield were partially offset by the benefit of certain repricing initiatives effective during 2009 and 2010.
- Interest and Dividends on Investment Securities: Decreased 45%, primarily reflecting the elimination of interest on
retained securities driven by the new GAAP effective January 1, 2010 and lower short-term investment levels.
- Deposits with Banks and Other: Was $66MM versus $59MM in 2009, primarily due to higher average deposit balances versus the prior year.
Total Interest Expense: Increased 10%. - Deposits: Increased 28% versus last year, as higher customer balances were partially offset by a lower cost of funds. - Short-term Borrowings: Decreased to $3MM, reflecting lower commercial paper levels versus the prior year and a lower
cost of funds. - Long-term Debt and Other: Increased 7%, reflecting the consolidation of long-term debt associated with securitized loans
previously held off balance sheet in accordance with the new GAAP effective January 1, 2010. Interest expense related to this debt is reported in securitization income, net in prior periods, but is now reported in long-term debt and other interest expense.
Charge Card Provisions for Losses: Decreased 31%, driven by lower reserve requirements, due to improved credit performance, partially offset by higher receivables.
*Excess spread, net is the net cash flow from interest and fee collections allocated to the investors’ interests after deducting the interest paid on investor
certificates, credit losses, contractual servicing fees, other expenses and changes in the fair value of the interest-only strip (“I/O Strip”). **Excludes $201MM and ($393MM) of impact from cardmember loan sales and maturities, which is reflected in provisions for cardmember loan losses.

AMERICAN EXPRESS COMPANY
FULL YEAR 2010 OVERVIEW
CONSOLIDATED
30
Cardmember Lending Provisions for Losses: Decreased 64%, primarily reflecting lower reserve requirements during the year, due to improving credit performance, partially offset by an increase related to the inclusion of the 2010 expense for written-off securitized loans, which last year was reported in securitization income, net. - The lending net write-off rate was 5.6% in 2010 versus 8.5% in 2009*.
Other Provisions for Losses: Decreased 55% versus last year primarily reflecting lower merchant-related debit balances.
Marketing and Promotion Expenses: Increased 60% versus last year as improved credit and billings trends led to increased investment levels in 2010.
Cardmember Rewards Expense: Increased 25%, reflecting higher rewards-related spending volumes and co-brand expense, and a benefit in Q3’09 relating to the adoption of a more restrictive redemption policy for accounts 30 days past due.
Cardmember Services Expenses: Increased 9%.
Salaries and Employee Benefits Expense: Increased 10%, reflecting higher employee levels, merit increases for existing employees, higher benefit-related costs, including the impact of reinstating certain benefits that were temporarily suspended during the recession, higher management incentive compensation expenses and greater volume-related sales incentives, partially offset by lower net reengineering costs in 2010 versus 2009.
Professional Services Expense: Increased 17% versus last year reflecting higher technology development expenditures, greater legal costs, and higher third-party merchant sales force commissions, partially offset by lower credit and collection agency costs.
Occupancy and Equipment Expense: Decreased 4%, primarily due to a Q4’09 charge of $63MM for certain property exits.
Communications Expense: Decreased 7%, driven by lower postage and telephone-related costs.
Other, Net Expense: Increased 80%, reflecting the $180MM ($113MM after-tax) benefit in 3Q‘09 related to the accounting for a net investment in the Company’s consolidated foreign subsidiaries, as well as higher investments in business building initiatives and higher travel and entertainment costs in 2010.
CORPORATE & OTHER SEGMENT
Net expense was $292MM in 2010 compared with net income of $107MM in 2009. - 2010 included:
-- $372MM and $172MM of after-tax income related to the MasterCard and Visa litigation settlements, respectively; -- Higher incentive compensation and benefit reinstatement-related expenses; -- Various investments in the Global Prepaid business and Enterprise Growth initiatives; and -- $2MM of after-tax expense related to the Company’s reengineering efforts.
- 2009 included: -- $372MM and $172MM of after-tax income related to the MasterCard and Visa litigation settlements, respectively; -- $135MM of after-tax income related to the ICBC sale; -- $113MM of after-tax benefits primarily representing the correction of an error related to the accounting for a net
investment in consolidated foreign subsidiaries; and -- $35MM of after-tax expense related to the Company’s reengineering initiatives.
*All lending statistics are presented here on a GAAP basis. Credit quality statistics are available in the Fourth Quarter/Full Year 2010 Earnings Release, American Express Company Consolidated Selected Statistical Information pages.

AMERICAN EXPRESS COMPANY
FULL YEAR 2010 OVERVIEW
U.S. CARD SERVICES
31
Condensed Statements of Income (GAAP Basis)
(Preliminary)
Years Ended December 31,
Percentage Inc/(Dec)
(Millions) 2010 2009 Revenues
Discount revenue, net card fees and other $10,038 $9,105 10% Securitization income, net* NA 400 - Interest income 5,390 3,216 68 Interest expense 812 568 43
Net interest income 4,578 2,648 73 Total revenues net of interest expense 14,616 12,153 20 Provisions for losses 1,591 3,769 (58) Total revenues net of interest expense after provisions for losses 13,025 8,384 55 Expenses
Marketing, promotion, rewards and cardmember services 5,651 4,266 32 Salaries and employee benefits and other operating expenses 3,837 3,532 9
Total 9,488 7,798 22 Pretax segment income 3,537 586 # Income tax provision 1,291 175 # Segment income $2,246 $411 #
# Denotes a variance of more than 100%.
Statistical Information
Years Ended December 31,
Percentage Inc/(Dec)
2010 2009 Card billed business (billions) $378.1 $339.4 11% Average basic cardmember spending** $12,795 $10,957 17
- Billed Business: The 11% increase in billed business was driven by the 17% increase in average spending per proprietary basic cards-in-force. -- U.S. consumer billed business and small business volumes increased by 12% and 11%, respectively.
P&L Discussion:
Segment Income: Increased to $2,246MM from $411MM in 2009, as total revenues net of interest expense increased 20%, provisions for losses decreased 58% and expenses increased by 22%.
- 2010 includes net reengineering costs of $55MM ($35MM after-tax). 2009 had net costs of $12MM ($8MM after-tax).
- Pretax Margin: Was 24.2% in 2010 compared with 4.8% in 2009.
- Effective Tax Rate: Was 36.5% in 2010 compared with 29.9% in 2009. The rates in both years reflect the benefits from the resolution of certain prior years’ tax items and the relationship of recurring tax benefits to varying levels of pre-tax income.
*In accordance with the new GAAP effective January 1, 2010, the Company no longer reports securitization income, net in its income statement. **Proprietary cards only.
AMERICAN EXPRESS COMPANY
FULL YEAR 2010 OVERVIEW
U.S. CARD SERVICES
32
Discount Revenue, Net Card Fees and Other: Increased 10%, primarily due to billed business growth of 11%. This line also reflects higher other commissions and fees, driven by the new GAAP effective January 1, 2010, which led to the inclusion of fees formerly recorded in securitization income, net and greater travel commissions and fees, partially offset by lower net card fees.
Securitization Income, Net: Was not applicable in 2010 due to the new GAAP effective January 1, 2010, versus income of $400MM in 2009.
Interest Income: Increased 68%, principally due to the new GAAP effective January 1, 2010, partially offset by lower yields on cardmember loans.
Interest Expense: Increased 43%, reflecting higher expense related to the new GAAP effective January 1, 2010, a higher cost of funds and greater average cardmember receivable balances, partially offset by reduced funding requirements due to a reduction in average balances of cardmember loans.
Provisions for Losses: Decreased 58%, principally reflecting lower reserve requirements driven by improving cardmember loan and charge card credit trends, partially offset by the inclusion in 2010 of write-offs on the securitized cardmember loans and a higher charge card provision. - Credit Quality
-- The charge card net write-off rate was 1.6% in 2010 versus 3.8% last year. -- The lending net write-off rate was 5.8% in 2010 versus 9.1% last year.*
Marketing, Promotion, Rewards and Cardmember Services Expenses: Increased 32%, reflecting increased marketing and promotion expenses due to increased investment spending resulting from better credit and business trends in 2010 and higher rewards expense primarily due to greater rewards-related spending volumes and higher co-brand expense. Rewards expense growth also reflects the benefit in 2009 of a revised, more restrictive, redemption policy for accounts 30 days past due.
Salaries and Employee Benefits and Other Operating Expenses: Increased 9%, primarily reflecting the higher reengineering-related costs, higher technology development expenditures, and other business building investments.
*GAAP basis. See page 17 for Cardmember Loan Portfolio Presentation discussion.

AMERICAN EXPRESS COMPANY
FULL YEAR 2010 OVERVIEW
U.S. CARD SERVICES
33
The following table sets forth portfolio financial information for 2010 and 2009. The 2010 financial information was determined in accordance with the new GAAP effective January 1, 2010. The 2009 information includes the “owned” (GAAP) basis presentation, together with the adjustments for securitization activity to arrive at the “managed” (non-GAAP) basis presentation. For additional information, please see the Cardmember Loan Portfolio Presentation discussion on page 17.
Years Ended Percentage
(Millions) December 31, Inc/(Dec)
2010 2009 Discount revenue, net card fees and other:
Reported for the period (GAAP) $10,038 $9,105 10% Securitization adjustments NA 331 - Managed discount revenue, net card fees and other $10,038 $9,436 6
Interest income:
Reported for the period (GAAP) $5,390 $3,216 68% Securitization adjustments NA 3,097 - Managed interest income $5,390 $6,313 (15)
Securitization income, net*:
Reported for the period (GAAP) NA $400 - Securitization adjustments NA 400 - Managed securitization income, net NA $- -
$1,411 Interest expense:
Reported for the period (GAAP) $812 $568 43% Securitization adjustments NA 244 - Managed interest expense $812 $812 -
Provisions for losses:
Reported for the period (GAAP) $1,591 $3,769 (58)% Securitization adjustments NA 2,573** - Managed provisions for losses $1,591 $6,342** (75)
Managed P&L Discussion:
Discount Revenue, Net Card Fees and Other: Increased 6%, reflecting higher billed business volumes and increased travel revenues, partially offset by lower commissions and fees
Interest Income: Decreased 15%, due to a decline in the average loan balance and a lower portfolio yield driven by higher payment rates, lower revolving levels and the CARD Act, partially offset by repricing initiatives during 2009 and 2010.
Interest Expense: Was flat, due to an increase in the cost of funds and higher average cardmember receivable balances, offset by reduced funding requirements due to a lower average cardmember loan balance in the managed portfolio.
Provisions for Losses: Decreased 75%, due to improving cardmember loan and charge card credit performance and a lower average loan balance.
- Cardmember Loans: -- The lending net write-off rate was 5.8% in 2010 versus 8.7% in 2009.
*In accordance with the new GAAP effective January 1, 2010, the Company no longer reports securitization income, net in its income statement. **Includes provisions for losses for off-balance sheet cardmember loans based on the same methodology as applied to on-balance sheet cardmember loans, except that any quarterly adjustment to reserve levels for on-balance sheet loans to address external environmental factors was not applied to adjust the provision expense for the securitized portfolio.

AMERICAN EXPRESS COMPANY
FULL YEAR 2010 OVERVIEW
INTERNATIONAL CARD SERVICES
34
Condensed Statements of Income (GAAP Basis)
(Preliminary)
Years Ended December 31,
Percentage Inc/(Dec)
(Millions) 2010 2009 Revenues
Discount revenue, net card fees and other $3,685 $3,447 7% Interest income 1,393 1,509 (8) Interest expense 428 427 -
Net interest income 965 1,082 (11) Total revenues net of interest expense 4,650 4,529 3 Provisions for losses 392 1,211 (68) Total revenues net of interest expense after provisions for losses 4,258 3,318 28 Expenses
Marketing, promotion, rewards and cardmember services 1,612 1,221 32 Salaries and employee benefits and other operating expenses 2,008 1,821 10
Total 3,620 3,042 19 Pretax segment income 638 276 # Income tax provision (benefit) 72 (56) # Segment income $566 $332 70
# Denotes a variance of more than 100%.
Statistical Information
Years Ended December 31,
Percentage Inc/(Dec)
2010 2009 Card billed business (billions) $107.9 $94.9 14% Average basic cardmember spending* $10,366 $8,758 18
- Billed Business: The 14% increase in billed business reflects an 18% increase in average spending per proprietary basic cards-in-force, partially offset by a 1% decrease in basic cards-in-force. -- Adjusting for the impacts of foreign exchange translation, billed business and average spending per proprietary basic
cards-in-force increased 9% and 14%, respectively. Volumes increased across the major geographic regions, including an increase of 13% in Latin America, 10% in Asia Pacific and 8% in both Canada and Europe.
P&L Discussion
Segment Income: Increased 70% to $566MM, as total revenues net of interest expense increased 3%, provisions for losses decreased 68% and expenses increased by 19%.
- 2010 includes $19MM ($12MM after-tax) of net reengineering costs versus $4MM ($3MM after-tax) of net costs in 2009.
- Pretax Margin: Was 13.7% in 2010 compared with 6.1% in 2009.
- Effective Tax Rate: The tax rate was 11.3% in 2010 versus (20.3)% in 2009. The tax rate in 2010 reflects a benefit from the resolution of certain prior years’ tax items. In addition, the tax rates in both periods primarily reflect the impact of recurring tax benefits on varying levels of pretax income. As indicated in previous quarters, this segment reflects the favorable impact of the consolidated tax benefit related to its ongoing funding activities outside the U.S., which is allocated to ICS under the Company’s internal tax allocation process.
Discount Revenue, Net Card Fees and Other: Increased 7% driven primarily by the higher level of cardmember spending and greater foreign-exchange conversion revenues.
*Proprietary cards only.

AMERICAN EXPRESS COMPANY
FULL YEAR 2010 OVERVIEW
INTERNATIONAL CARD SERVICES
35
Interest Income: Declined 8%, as a lower yield on cardmember loans and a lower average loan balance were partially offset by higher lending card fees.
Interest Expense: Was flat as lower average loan balances offset higher average receivable levels.
Provisions for Losses: Decreased 68%, primarily reflecting lower reserve requirements due to improving cardmember loan and charge card credit trends.
- Credit Quality
-- The charge card net loss ratio (as a percentage of charge volume) was 0.24% in 2010 versus 0.36% last year. -- The lending net write-off rate was 4.6% in 2010 versus 6.8% last year.
Marketing, Promotion, Rewards and Cardmember Services Expenses: Increased 32%, primarily due to higher marketing and
promotion expenses and greater volume-related rewards costs. Salaries and Employee Benefits and Other Operating Expenses: Increased 10%, reflecting the higher net reengineering costs in
2010, higher technology development expenditures, increased investments in sales-force, closing costs related to the acquisition of Loyalty Partner and other business building investments.

AMERICAN EXPRESS COMPANY
FULL YEAR 2010 OVERVIEW
GLOBAL COMMERCIAL SERVICES
36
Condensed Statements of Income
(GAAP Basis)
(Preliminary)
Years Ended December 31,
Percentage Inc/(Dec)
(Millions) 2010 2009 Revenues
Discount revenue, net card fees and other $4,622 $4,158 11% Interest income 7 5 40 Interest expense 227 180 26
Net interest expense (220) (175) 26 Total revenues net of interest expense 4,402 3,983 11 Provisions for losses 158 177 (11) Total revenues net of interest expense after provisions for losses 4,244 3,806 12 Expenses
Marketing, promotion, rewards and cardmember services 442 332 33 Salaries and employee benefits and other operating expenses 3,041 2,969 2
Total 3,483 3,301 6 Pretax segment income 761 505 51 Income tax provision 287 155 85 Segment income $474 $350 35
Statistical Information
Years Ended December 31,
Percentage Inc/(Dec)
2010 2009 Card billed business (billions) $132.8 $111.2 19% Average basic cardmember spending* $18,927 $15,544 22
- Billed Business: The 19% increase in billed business was driven by the 22% increase in average spending per proprietary
basic cards-in-force.
-- Adjusting for the impacts of foreign exchange translation, billed business and average spending per proprietary basic cards-in-force grew 19% and 21%, respectively. Volume increased 19% within the U.S., compared to an increase of 18% outside the U.S.
P&L Discussion
Segment Income: Increased 35% to $474MM as total revenues net of interest expense increased 11%, provisions for losses declined 11% and expenses rose 6%.
- 2010 includes $32MM ($22MM after-tax) of net reengineering costs versus $101MM ($65MM after-tax) in 2009.
- Pretax Margin: Was 17.3% in 2010 compared with 12.7% in 2009.
- Effective Tax Rate: Was 37.7% in 2010 compared with 30.7% in 2009. The higher 2010 rate reflects the impact of increasing the valuation allowance against deferred tax assets associated with certain non-U.S. travel operations.
Discount Revenue, Net Card Fees and Other: Increased 11%, primarily driven by higher cardmember spending and greater travel commissions and fees.
Interest Income: Increased to $7MM in 2010 from $5MM in 2009.
Interest Expense: Increased 26%, driven by increased funding requirements due to a higher average receivable balance and a higher cost of funds.
*Proprietary cards only.

AMERICAN EXPRESS COMPANY
FULL YEAR 2010 OVERVIEW
GLOBAL COMMERCIAL SERVICES
37
Provisions for Losses: Decreased 11%, driven by improved credit performance within the underlying portfolio. - Credit Quality
-- The charge card net loss ratio (as a percentage of charge volume) was 0.11% in 2010 versus 0.19% last year.
Marketing, Promotion, Rewards and Cardmember Services Expenses: Increased 33%, reflecting higher rewards costs and greater marketing and promotion expenses.
Salaries and Employee Benefits and Other Operating Expenses: Increased 2% as higher travel volume-driven personnel costs, greater incentive-based sales-force costs, as well as increased technology development expenditures and other business-building investments were partially offset by the lower reengineering-related costs.

AMERICAN EXPRESS COMPANY
FULL YEAR 2010 OVERVIEW
GLOBAL NETWORK & MERCHANT SERVICES
38
Condensed Statements of Income (GAAP Basis)
(Preliminary) Years Ended December 31,
Percentage Inc/(Dec)
(Millions) 2010 2009 Revenues
Discount revenue, fees and other $4,169 $3,602 16% Interest income 4 1 # Interest expense (200) (177) 13
Net interest income 204 178 15 Total revenues net of interest expense 4,373 3,780 16 Provisions for losses 61 135 (55) Total revenues net of interest expense after provisions for losses 4,312 3,645 18 Expenses
Marketing, promotion, rewards, and cardmember services 755 521 45 Salaries and employee benefits and other operating expenses 1,908 1,679 14
Total 2,663 2,200 21 Pretax segment income 1,649 1,445 14 Income tax provision 586 508 15 Segment income $1,063 $937 13
# Denotes a variance of more than 100%.
Statistical Information Years Ended December 31,
Percentage Inc/(Dec)
(billions) 2010 2009 Global card billed business* $713.3 $619.8 15%
Global Network Services:** Card billed business $91.7 $71.8 28
P&L Discussion
Segment Income: Increased 13% to $1,063MM, as total revenues net of interest expense increased 16%, provisions for losses decreased 55% and expenses rose 21%.
- 2010 included $18MM ($12MM after tax) of net reengineering costs versus $22MM ($14MM after-tax) in 2009.
- Pretax Margin: Was 37.7% in 2010 compared with 38.2% in 2009.
- Effective Tax Rate: Was 35.5% in 2010 compared with 35.2% in 2009.
Discount Revenue, Fees and Other Revenue: Increased 16%, primarily due to an increase in merchant-related revenues, driven by the 15% increase in global billed business, as well as higher volume driven GNS-related revenues.
Interest Income: Increased to $4MM in 2010 from $1MM in 2009.
Interest Expense: The expense credit increased 13% due to a higher funding-driven interest credit related to internal transfer pricing, which recognizes the merchant services’ accounts payable-related funding benefit.
*Includes activities (including cash advances) related to proprietary cards, cards issued under network partnership agreements (non-proprietary billed business), and certain insurance fees charged on proprietary cards. In-store spend activity within retail co-brand portfolios in GNS, from which the Company earns no revenue, is not included in non-proprietary billed business. **For non-proprietary retail co-brand partners, GNS metrics exclude cardmember accounts which have no out-of-store spend activity during the prior 12
month period.

AMERICAN EXPRESS COMPANY
FULL YEAR 2010 OVERVIEW
GLOBAL NETWORK & MERCHANT SERVICES
39
Provisions for Losses: Decreased by $74MM, or 55%, primarily due to lower merchant-related debit balances.
Marketing, Promotion, Rewards, and Cardmember Services Expenses: Increased 45%, reflecting higher network, merchant-related and brand marketing investments.
Salaries and Employee Benefits and Other Operating Expenses: Increased 14%, primarily due to greater third-party merchant sales-force commissions, higher technology development expenditures, and other business building investments.

40
Cautionary Note Regarding Forward-Looking Statements
This supplement includes forward-looking statements within the meaning of the Private Securities Litigation Reform Act of 1995, which are subject to risks and uncertainties. The forward-looking statements, which address the company’s expected business and financial performance, among other matters, contain words such as “believe,” “expect,” “estimate,” “anticipate,” “optimistic,” “intend,” “plan,” “aim,” “will,” “may,” “should,” “could,” “would,” “likely,” and similar expressions. Readers are cautioned not to place undue reliance on these forward-looking statements, which speak only as of the date on which they are made. The company undertakes no obligation to update or revise any forward-looking statements. Factors that could cause actual results to differ materially from these forward-looking statements, include, but are not limited to, the following:
changes in global economic and business conditions, including consumer and business spending, the availability and cost of credit, unemployment and political conditions, all of which may significantly affect spending on the Card, delinquency rates, loan balances and other aspects of our business and results of operations;
changes in capital and credit market conditions, which may significantly affect the company’s ability to meet its liquidity needs, access to capital and cost of capital, including changes in interest rates; changes in market conditions affecting the valuation of our assets; or any reduction in our credit ratings or those of our subsidiaries, which could materially increase the cost and other terms of our funding, restrict our access to the capital markets or result in contingent payments under contracts;
litigation, such as class actions or proceedings brought by governmental and regulatory agencies (including the lawsuit filed against the Company by the U.S. Department of Justice and certain state attorneys general), that could result in (i) the imposition of behavioral remedies against the Company or the Company’s voluntarily making certain changes to its business practices, the effects of which in either case could have a material adverse impact on the Company’s financial performance; (ii) the imposition of substantial monetary damages in private actions against the Company; and/or (iii) damage to the Company’s global reputation and brand;
legal and regulatory developments wherever we do business, including legislative and regulatory reforms in the United States, such as the Dodd-Frank Act’s stricter regulation of large, interconnected financial institutions, changes in requirements relating to securitization and the establishment of the Bureau of Consumer Financial Protection, which could make fundamental changes to many of our business practices or materially affect our capital requirements, results of operations, ability to pay dividends or repurchase our stock; or actions and potential future actions by the FDIC and credit rating agencies applicable to securitization trusts, which could impact the company’s ABS program;
changes in the substantial and increasing worldwide competition in the payments industry, including competitive pressure that may impact the prices we charge merchants that accept our Cards and the success of marketing, promotion or rewards programs;
changes in technology or in our ability to protect our intellectual property (such as copyrights, trademarks, patents and controls on access and distribution), and invest in and compete at the leading edge of technological developments across our businesses, including technology and intellectual property of third parties whom we rely on, all of which could materially affect our results of operations;
data breaches and fraudulent activity, which could damage our brand, increase our costs or have regulatory implications, and changes in regulation affecting privacy and data security under federal, state and foreign law, which could result in higher compliance and technology costs to ourselves or our vendors;
changes in our ability to attract or retain qualified personnel in the management and operation of the company’s business, including any changes that may result from increasing regulatory supervision of compensation practices;
changes in the financial condition and creditworthiness of our business partners, such as bankruptcies, restructurings or consolidations, involving merchants that represent a significant portion of our business, such as the airline industry, or our partners in Global Network Services or financial institutions that we rely on for routine funding and liquidity, which could materially affect our financial condition or results of operations;
uncertainties associated with business acquisitions, including the ability to realize anticipated business retention, growth and cost savings or effectively integrate the acquired business into our existing operations;
changes affecting the success of our reengineering and other cost control initiatives, which may result in the company not realizing all or a significant portion of the benefits that we intend;
the actual amount to be spent by the Company on investments in the business, including on marketing, promotion, rewards and cardmember services and certain other operating expenses, which will be based in part on management’s assessment of competitive opportunities and the Company’s performance and the ability to control and manage operating, infrastructure, advertising and promotion expenses as business expands or changes;
the effectiveness of the company’s risk management policies and procedures, including credit risk relating to consumer debt, liquidity risk in meeting business requirements and operational risks;
changes affecting our ability to accept or maintain deposits due to market demand or regulatory constraints, such as changes in interest rates and regulatory restrictions on our ability to obtain deposit funding or offer competitive interest rates, which could affect our liquidity position and our ability to fund our business; and
factors beyond our control such as fire, power loss, disruptions in telecommunications, severe weather conditions, natural disasters, terrorism, “hackers” or fraud, which could affect travel-related spending or disrupt our global network systems and ability to process transactions.
A further description of these uncertainties and other risks can be found in the company’s Annual Report on Form 10-K for the year ended December 31, 2009, its Quarterly Reports on Form 10-Q for the three months ended March 31, June 30, and September 30, 2010, and the company’s other reports filed with the SEC.