2010 roadside ditch bmp - your.kingcounty.gov · can roadside ditches in rural areas be retrofitted...
TRANSCRIPT

2010 Monitoring Report for King County Stormwater Monitoring Under S8.E of the
NPDES Phase 1 Municipal Permit WAR04-4501
(Issued February 2007) Targeted Stormwater Management Program
Effectiveness Monitoring Roadside Ditch Flow Control
March 2011
King County Department of Transportation
Roads Services Division Environmental Unit
155 Monroe Avenue Northeast Renton, WA 9805
Alternate Formats Available
206-296-7380 TTY Relay: 711

2010 Monitoring Report for King County Stormwater Monitoring Under S8.E of the NPDES Phase 1 Municipal Permit WAR04-4501 (Issued February 2007) Targeted Stormwater Management Program Effectiveness Monitoring Roadside Ditch Flow Control
Submitted by: Jim Crawford King County Roads Division Department of Transportation


Table of Contents 1.0. Introduction ............................................................................................................. 3
2.0. Goals and Objectives .............................................................................................. 5
3.0. Flow Control BMP Study Design ........................................................................... 6
3.1 Project Locations ................................................................................................ 6
3.2 Engineering Designs ........................................................................................... 7
3.3 BMP Function ..................................................................................................... 8
3.4 Work Completed ................................................................................................. 8
3.5 Data Collection and Analysis.............................................................................. 8
4.0. Petrovitsky Road ..................................................................................................... 9
4.1 Flow .................................................................................................................. 10
4.2 Data Analysis .................................................................................................... 15
5.0. 276th Ave SE ......................................................................................................... 16
5.1 Flow .................................................................................................................. 17
5.2 Data Analysis .................................................................................................... 22
6.0. Discussion ............................................................................................................. 23
Tables
Table 1. Study Sites, Station Names and Sample Identifiers ............................................ 7
Table 2. Monthly Flow Summaries and Flow Efficiencies SE Petrovitsky Road ........... 11
Table 3. Monthly Flow Summaries and Flow Efficiencies 276th Ave SE ........................ 18
iv

Figures
No table of figures entries found.
v

vi
APPROVALS
Dean Wilson King County Date
Monitoring Program Manager
Colin Elliott King County Date
Environmental Laboratory Quality Assurance Officer
Certification I certify under penalty of law, that this document and all attachments were prepared under my direction or supervision in accordance with a system designed to assure that qualified personnel properly gathered and evaluated the information submitted. Based on my inquiry of the person or persons who manage the system or those persons directly responsible for gathering information, the information submitted is, to the best of my knowledge and belief, true, accurate, and complete. I am aware that there are significant penalties for submitting false information, including the possibility of fine and imprisonment for willful violations.
Distribution List Rachael McCrae Washington Department of Ecology

EXECUTIVE SUMMARY
This report presents the results from design, installation and monitoring of two roadside ditch flow control BMP studies implemented by King County Roads Maintenance in 2009 and 2010.
Both flow control projects show a reduction in downstream flows during dry-season storm events. At all sites the BMPs functioned to pool storm flows, reducing the scouring energy of high flows and allowing for some settling in addition to any filtering function the BMP may provide. This is thought to be one of the primary reasons for the reduction in TSS. The BMPs at all study sites survived high winter flows. To date the maintenance requirements have only included mowing excess vegetation and removing leaves.
2

1.0. INTRODUCTION The Washington State Phase I Municipal Stormwater Permit (Phase I Permit) applies to all entities in Washington State required to have permit coverage under current (Phase I) U.S. Environmental Protection Agency (EPA) and Washington State Department of Ecology (Ecology) stormwater regulations, which includes cities and unincorporated portions of counties whose populations exceed 100,000. The Phase I Permit includes requirements to conduct stormwater-related monitoring in Special Condition 8 (S8). The required monitoring program detailed in S8 includes three components:
• S8.D Stormwater Monitoring
• S8.E Targeted Stormwater Management Program Effectiveness Monitoring
• S8.F Stormwater Treatment and Hydrologic Management Best Management Practice (BMP) Evaluation Monitoring.
Reporting for all three monitoring components is required as part of Special Condition S8.H and S9. These sections require permittees to complete an annual stormwater monitoring report for each component, to be submitted no later than March 31, detailing monitoring that occurred during the previous water year. A water year starts on October 1 and ends on September 30 of the following year.
This report focuses on the NPDES phase 1 permit requirements listed under Section 8, E, Targeted Stormwater Management Program Effectiveness Monitoring. The monitoring that is being conducted to fulfill this section of the permit is designed to answer two distinct questions:
1. Can roadside ditches in rural areas be retrofitted with stormwater best management practices (BMPs) that will improve the water quality of the stormwater conveyed by these ditches.
2. Can roadside ditches in rural areas be retrofitted with stormwater BMPs that will improve the flow hydraulics of the stormwater conveyed by these ditches.
To answer these questions, King County has designed and implemented two separate studies. This report documents monitoring conducted to answer the second question, regarding flow hydraulics. Water quality BMP monitoring is reported in a companion document.
King County is developing and testing in-line ditch stormwater retrofit BMPs focusing on designs that are simple, low-cost, and low-maintenance. The BMPs tested here are intended to attenuate and/or infiltrate storm flows. They are intended to fit within roadside ditches requiring no additional land purchase or impacts to adjacent lands. The designs intended to be easily modified to on-site conditions such as soil type, ditch gradient, flow regime, and pollutant type(s). The intent is that providing research on low costs of design, installation, and maintenance of the cells will allow other public and private entities to retrofit multiple areas, retaining stormwater locally and creating an aggregate regional decrease in quality and quantity impacts from roadside ditch discharges.
3

This approach focuses on capturing most small storm events and “first flush” conditions from larger events primarily through retention, infiltration to decrease or attenuate stormwater flow peaks. The roadside ditch BMP research will study the costs for development, implementation, and maintenance and evaluate flow reduction. This study includes data colleced from pre- and post-retrofits and during multiple storm events.
4

2.0. GOALS AND OBJECTIVES The goals and objectives for this study are to:
• Develop, install and test low-cost BMP designs intended to provide a measurable level of stormwater treatment to either reduce pollutant loads or attenuate storm peak hydrographs within existing roadside ditches.
• Provide scientifically defensible and reproducible water quality and water quantity data above and below each BMP. The criteria for collecting and reviewing this data are presented in the Quality Assurance Project Plan QAPP.
• Evaluate the level of effort and costs required in designing, installing and maintaining the roadside ditch BMPs.
• Making the results of this study available to the outside community through reports, journal articles and group presentations.
5

6
3.0. FLOW CONTROL BMP STUDY DESIGN
Monitoring stations were established upstream and downstream of roadside ditch BMPs at each project site to continually measure stormflow upstream (background) and downstream of the BMPs. Flow monitoring was accomplished through installation of identical 60° V trapezoidal flumes. Water level in the flumes was measured and recorded by pressure transducers placed in stilling wells attached to the monitoring port of each flume. Rainfall was also recorded using continuous rain gauges. Continuous flow and rainfall data is provided as electronic files for each project in this report's Appendix K. Additional detail on flow monitoring protocol is provided in the Quality Assurance report. Monitoring has been designed to evaluate BMP performance over the course of one water year.
3.1 Project Locations
• SE Petrovitsky Road (Petrovitsky Rd) Figure 1
• 276th Ave SE (276th) Figure 1

Table 1. Study Sites, Station Names and Sample Identifiers
Study Sites, Station Names and Sample Identifiers
Location Station
Location Station Names
SE Petrovitsky Road at 192nd Drive Upstream PETUP Downstream PETDN
276th Ave SE below SE 213th Drive Upstream 276UP Downstream 276DN
Figure 1. Flow Control BMP Project Sites
3.2 Engineering Designs BMP design drawings at 90% completion were submitted to Ecology for review and approval prior to installation of each project. The engineering designs for the two water quality BMP projects studied during the 2010 water year are provided in this report's Appendix J. Design and placement of the primary devices are included as part the engineering designs.
Both BMP designs are based on a modified rock check-dams with internal “treatment cells”. These BMP projects used washed sand wrapped in a non-woven filter fabric secured inside the BMP as they were being constructed in the ditch.
7

3.3 BMP Function The BMPs at both sites function as weirs within the ditch, with the effect of pooling water and taking the scouring energy out of the stormflow. The BMPs are designed to temporarily block flow while allowing flow to filter through the BMP rock structure and treatment media. Higher flows are intended to overtop the BMPs, and flow into the next downstream pool but with less scouring energy, leaving the BMPs intact and preventing scour in the ditch. The monitoring design measures total flow through a primary devise and not velocity; this study can demonstrate a delay in flow from the upstream to downstream monitoring stations and changes in total flow but can not quantify the decrease in energy in the flow. However the pooling effect and minimal fast, scouring water between the BMPs is evident during site visits and is documented in photos.
3.4 Work Completed This section summarizes work completed since the project inception through September 30th 2010 (end of the 2010 water year).
• Design and installation of two flow control BMPs projects: SE Petrovitsky Rd and 276th Ave SE.
• Flow monitoring for a complete water year, from installation through September 30th 2009 at each project site.
3.5 Data Collection and Analysis Apparent BMP efficiency in decreasing downstream flow was evaluated by comparing the results from continuous flow monitoring measured at stations placed upstream and downstream of each BMP project. This evaluation was done both for a series of specific storm events and on a monthly basis. BMPs efficiency in decreasing flows calculated on a using the formula:
Flow Decrease = Upstream Flow – Downstream Flow Upstream Flow Increased downstream flows have a negative value from this analysis.
8

4.0. PETROVITSKY ROAD Project location: Southwest shoulder of S.E. Petrovitsky Road between house #17201 and #17235.
Figure 2. Petrovitsky Road BMP Project Location and Watershed
Drainage basin: 47.8 acres zoned for low density rural residential property (zoned RA-5) and City of Seattle’s Lake Youngs Watershed. This ditch drains southeast and into Shady Lake.
Traffic: Relatively high [average daily traffic volume (ADTV) of approximately 17,060 vehicles.
Five BMPs based on a modified rock check-dam design with an interior “treatment cell” filled with clean sand wrapped in a non-woven filter fabric were installed along the south shoulder of SE Petrovitsky Rd on June 30th 2009. The sand was intended to both decrease the flow rate through the BMP compared to plain rock and provide filtering media.
9

4.1 Flow Upstream Monitoring station: Baseline data was collected from November 20th 2008 until January 30th 2009 using a 1.0 foot HS flume and Isco bubble meter. No baseline data was collected until March 31st 2009 when a Campbell data logger and pressure transducer was installed at the site. Monitoring was continued into June 2009 when the ditch was dry.
Downstream Monitoring Station: Baseline data was collected from November 20th 2008 until January 27th using a 1.0 foot HS flume and Isco bubble meter. No baseline data was collected from January 28th until March 31st 2009 when a Campbell data logger and pressure transducer was installed at the site. Monitoring was continued into June 2009 when the ditch was dry. The downstream flume was moved about 100 feet father downstream to a point below the last BMP after BMPs were installed on June 30th 2009.
The BMP's effect on pooling water to reduce the scouring energy of stormflow is demonstrated in Figures 3 and 4 below:
Figure 3. BMPs Pooling Stormflow, SE Petrovitsky Road
Table 2 summarizes flow reductions or efficiencies at the Petrovitsky Project on a monthly basis. Flow decreases are highest during the dry season and during periods with reduced rainfall and longer time between storms (note February 2010).
10

Table 2. Monthly Flow Summaries and Flow Efficiencies SE Petrovitsky Road
Monthly Flow Summaries and Flow Efficiencies SE Petrovitsky Road
Month
Rainfall
(inches)
Upstream Flow
(gal)
Downstream Flow
(gal)
BMP Efficiency in Reducing Flow
(Percent)
August 2009 0.9 3,827 0 100%
September 2009 2.99 81,321 63,017 23%
October 2009 6.22 519,699 405,728 22%
November 2009 9.46 3,979,520 4,160,870 -5%
December 2009 3.48 1,240,340 1,239,630 0%
January 2010 7.08 3,876,820 4,047,630 -4%
February 2010 3.76 1,470,170 1,402,860 5%
March 2010 5.77 2,362,270 2,490,370 -5%
April 2010 4.66 1,166,150 1,198,680 -3%
May 2010 5.51 674,198 617,210 8%
June 2010 4.4 1,848,780 1,842,410 0%
July 2010 0.43 12,852 6,041 53%
August 2010 1.3 7,042 1,449 79%
September 2010 3.35 79,798 64,424 19%
Figures 4 through 7 provide graphical demonstrations of the downstream change in flow as the dry season (September and October) flow reductions give way to higher downstream flows the wet season. This situation dominates the flow regime until the dry season is well underway. Figure 7 shows a slight downstream flow decrease in late June of 2010.
11

Figure 4. Flow and Rainfall, SE Petrovitsky Road, September 4 – 5th 2009
Rain (inches)
Upstream Flow (gallons)
Downstream Flow (gallons)
Percent Change in Flow
0.52 5,668 1,427 74.8
12
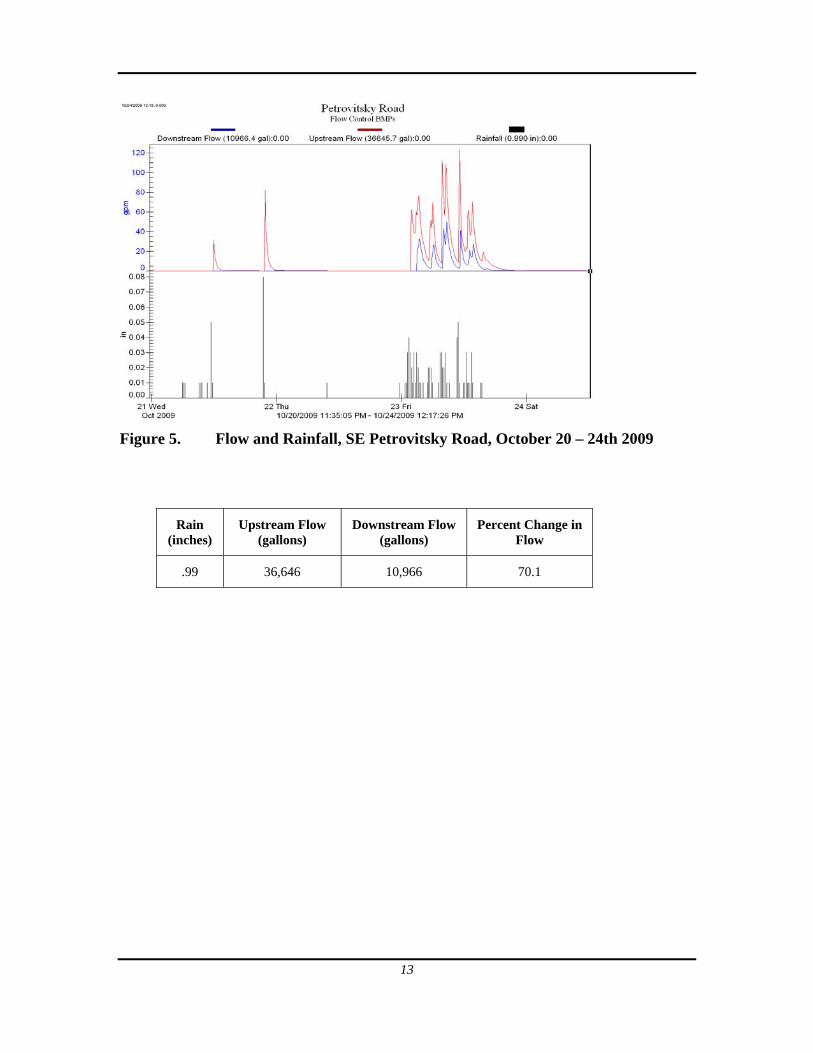
Figure 5. Flow and Rainfall, SE Petrovitsky Road, October 20 – 24th 2009
Rain (inches)
Upstream Flow (gallons)
Downstream Flow (gallons)
Percent Change in Flow
.99 36,646 10,966 70.1
13

Figure 6. Flow and Rainfall SE Petrovitsky Road, Novemeber 16 – 18 2009
Rain (inches)
Upstream Flow (gallons)
Downstream Flow (gallons)
Percent Change in Flow
1.72 667,151 661,772 0.8
14

Figure 7. Flow and Rainfall SE Petrovitsky Road, June 19 – 23rd 2010
Rain (inches)
Upstream Flow (gallons)
Downstream Flow (gallons)
Percent Change in Flow
0.6 107,477 99,213 7.7
4.2 Data Analysis An overall reduction in downstream flows was observed during late dry season/early wet season storms, coinciding with long dry periods between storms and seasonal low soil saturation conditions in the watershed. The increase in flow is considered to be due to downstream watershed contribution along the length of the ditch.
These BMPs modify storm flows by pooling water and taking scouring energy out of the flow. The effectiveness of the BMPs in modifying stormflow is mostly confined to the dry season. Each BMP is limited in the amount of water it can hold back; without modifying the original footprint of the ditch to only way to maximize this effect is to install as many BMPs as the ditch allows.
The positive results in attenuating flows during dry periods lead us to the design of our second year studies where we have added additional BMPs upstream of this study using a similar but modified design.
15

5.0. 276TH AVE SE Project location: West shoulder of 276th Ave. S.E. between S.E. 208th St. and S.E. 216th St (Figure 9).
Drainage basin: 27.4 acres dominated by rural residential properties on the west side 276th Ave. S.E. The ditch collects runoff from adjacent properties and the paved roadway. The ditch drains to a stream that crosses 276th Ave. S.E. just north of S.E. 208th St., flowing west toward Issaquah Creek.
Traffic: Relatively high [average daily traffic volume (ADTV) of approximately 12,700 vehicles.
BMP description: Ten BMPs with coarse washed sand media wrapped in filter fabric secured inside a rock check-dam were placed on July 10th and13th 2009. For these flow control BMPs, the treatment cell was filled with clean sand wrapped in a non-woven filter fabric. The sand was thought to decrease the flow rate through the BMP and provide some filtering.
Figure 8. 276th Ave SE BMP Project Location and Watershed
16

5.1 Flow No pre-BMP baseline flow monitoring data was collected at the 276th project.
The BMPs effect on pooling water to reduce the scouring energy of stormflow is demonstrated in Figures 10 and 11 below:
Figure 9. BMPs Pooling Stormflow, 276th Ave SE
Table 3 summarizes flow reductions or efficiencies at the 276th Ave SE Project on a monthly basis. Flow decreases are highest during the dry season and during periods with reduced rainfall and longer time between storms, but some decreases in flow were recorded for much of the year. These decreases are primarily due to reduced downstream flow measured between storm events, suggesting loss to infiltration.
17

Table 3. Monthly Flow Summaries and Flow Efficiencies 276th Ave SE
Monthly Flow Summaries and Flow Efficiencies 276th Ave SE
Month
Rainfall (in
(inches)
Upstream Flow
(gal)
Downstream Flow
(gal)
BMP Efficiency in Reducing
(Percent)
August 2009 1.37 4,476 6 100%
September 2009 2.88 4,922 613 88%
October 2009 7.38 282,274 29,1557 -3%
November 2009 9.88 1,990,390 2,166,740 -9%
December 2009 3.270 923,343 553,400 40%
January 2010 8.59 1,824,470 1,559,670 15%
February 2010 3.52 743,858 404,639 46%
March 2010 6.22 992,432 771,594 22%
April 2010 5.47 1,045,040 823,027 21%
May 2010 9.23 1,243,440 1,115,910 10%
June 2010 6.61 1,456,870 1,441,410 1%
July 2010 0.84 32,693 5,317 84%
August 2010 2.05 29,436 13,840 53%
September 2010 4.24 54,062 16,382 70%
18
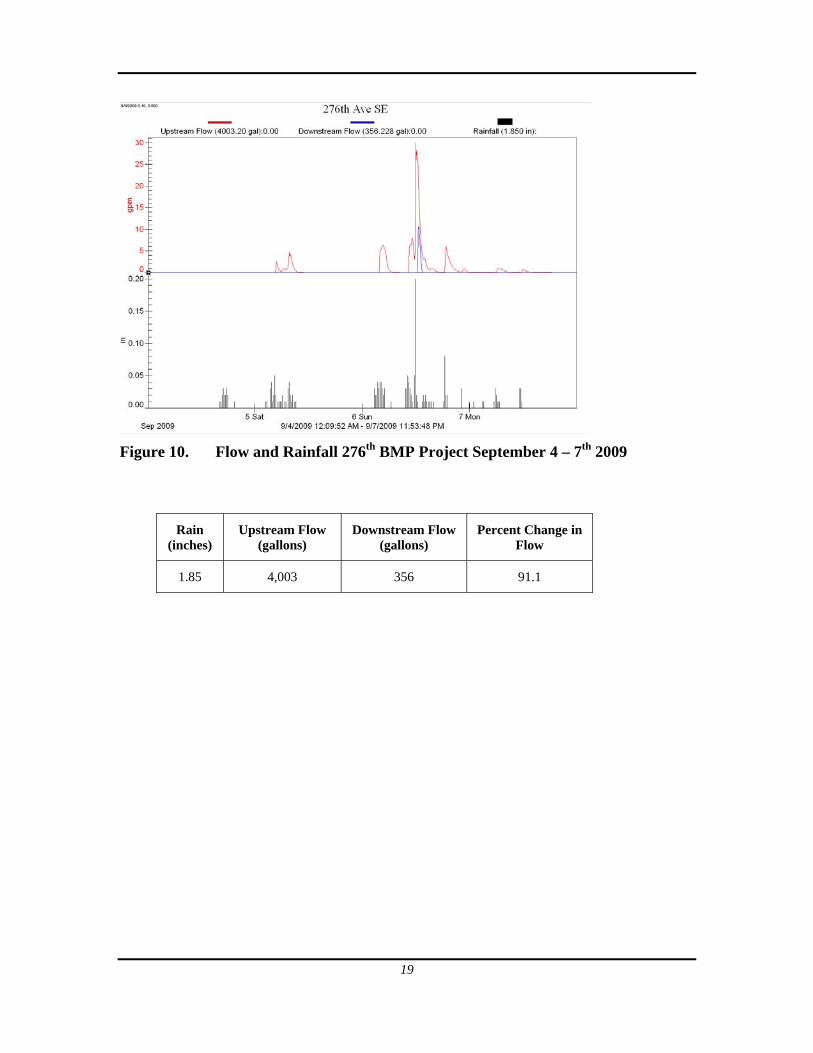
Figure 10. Flow and Rainfall 276th BMP Project September 4 – 7th 2009
Rain (inches)
Upstream Flow (gallons)
Downstream Flow (gallons)
Percent Change in Flow
1.85 4,003 356 91.1
19

Figure 11. Flow and Rainfall 276th BMP Project October 14 - 19 2009
Rain (inches)
Upstream Flow (gallons)
Downstream Flow (gallons)
Percent Change in Flow
3.02 39,934 27,799 30.4
20

Figure 12. Flow and Rainfall 276th BMP Project December 19 – 26 2010
Rain (inches)
Upstream Flow (gallons)
Downstream Flow (gallons)
Percent Change in Flow
1.76 459,095 373,859 18.6
21

Figure 13. Flow and Rainfall 276th BMP Project June 15 – 17 2010
Rain (inches)
Upstream Flow (gallons)
Downstream Flow (gallons)
Percent Change in Flow
.99 108,007 103,022 4.6
5.2 Data Analysis An overall reduction in downstream flows was observed during late dry season/early wet season storms, coinciding with long dry periods between storms and seasonal low soil saturation conditions in the watershed. The increase in flow is considered to be due to downstream watershed contribution along the length of the ditch.
These BMPs modify storm flows by pooling water and taking scouring energy out of the flow. The effectiveness of the BMPs in modifying stormflow is mostly confined to dry Each BMP is limited in the amount of water it can hold back; without modifying the original footprint of the ditch to only way to maximize this effect is to install as many BMPs as the ditch allows.
The positive results in attenuating flows during dry periods lead us to the design of our second year studies where we have added additional BMPs downstream of this study using a similar but modified design.
22

6.0. DISCUSSION The focus of this project is to challenge the main function of typical roadside ditches to see if effective storm water treatment can be accomplished directly in the ditch, utilizing county owned right of way. The main function of these ditches is to transport water down the drainage system, avoiding flood damage to roads and property. Typically the right-of-way for county owned ditches is very limited, particularly when compared to larger freeway systems. The opportunities for amending soils along the shoulders of the ditch to treat sheet flood runoff are very limited. In addition, a significant portion of the stormflow is runoff from non-county owned portions of the watershed, and may consist of commercial, residential, agricultural or undeveloped land. Most opportunities for infiltrating stormwater using typical LID techniques are located farther up in the watershed, usually at the site where rainfall lands in the watershed. Most ditches in rural King County that have consistent flow are in till soils with low permeability with limited options for infiltration within the ditch. Ditches with soils that allow for much infiltration do not carry much flow to begin with.
The KCDOT roads engineer steered us away from many of our original concepts that focused on over-excavating the ditch and applying treatments that typically included rock and media-based filter systems below grade. The main concerns were that these systems would be much more expensive both to install and maintenance costs would be much steeper. Subsurface systems would quickly become clogged with sediment and the media would require being completely dug out and replaced at regular intervals.
BMP efficiencies were calculated from upstream and downstream flow results. While we were able to collect some baseline data at one of the ditch sites, this study did not include a simultaneous comparison to an untreated section of ditch. Future studies should include monitoring of a well maintained ditch with a good vegetation cover as a control.
Watershed contribution to flow along the length of a ditch can be significant – even over short distances. This will be a problem for any linear ditch BMP study. Our understanding from these studies is that due to the volume of flow, any one BMP is limited in its effect on stormwater. A series of BMPs that make use of most of the available length of ditch is probably required to maximize treatment. In terms of a study, it would typically be difficult to eliminate inputs along most natural ditches. This study was intended to evaluate BMPs under real-world conditions; limiting inputs from roadway and watershed sheet or overland flow and seepage would not represent normal conditions in most ditches.
Site selection was probably the single most significant aspect of this project and the one that we had the least information with which to work. In preparation for site selection we prepared a criteria checklist for use in evaluating ditches and submitted this document to Ecology. Unfortunately, this checklist needed to be produced before implementing detailed monitoring of our ditches. During site selection, careful consideration was given to the expected flow regime of the ditch. Little information was available before the start of this study on the hydrologic cycle of ditches in our area. Culverts are sized to convey a maximum expected flow with little thought to the actual flow regime. One significant feature of stormflow in a typical county ditch is the generally small amount of impervious
23

24
road surface contributed flow when compared to an urban setting or a larger highway. The amount of pervious watershed usually represents a significant portion of the watershed, with a high variation in runoff due to differences in soil types, and constantly changing soil saturation conditions. With an emphasis on including dry-season monitoring in our study design we needed to identify ditches that would respond to dry-season rainfall events. As we made field tours to examine ditches we felt less sure of which ditches might produce dry-season flow as opposed to ditches that might only flow in measureable amounts during a few large storm events in any given year. Selection of the water quality sites included direct observations of flow response from smaller storms well into the dry season. The flow control sites were selected based on observation of high winter flows, conversations with landowners and observations of physical scouring in the ditch.
Additional lessons include the steep learning curve in designing and implementing a physical BMP within a roadside ditch where road standards and experience with flooding issues has trained engineering staff to avoid any obstructions other than culverts. That these BMPs have both survived some fairly heavy winter storm flows intact and have not led to road or off-road flooding issues is significant.
The learning curve extends to design and installation of a monitoring system to collect the needed data. Our In-Line Ditch monitoring setup has been robust and provided a good data set for flows. However, the installation of flumes as primary flow measurement devices is invasive. These devices tend to act as BMPs themselves, since they restrict flows and create pools upstream of themselves. Still, we feel that the flow record obtained has been less subject to noise and data gaps, particularly at low flows, when compared to the data obtained through lower-profile electronic velocity sensors.
One season is insufficient to evaluate this type of BMP either for flow or to asses the true cost of maintenance which can be affected by weather patterns and other road and/or landowner maintenance that may not be seen in any one single year.