2010 status of rural texas
DESCRIPTION
A demographic report on conditions and trends in rural Texas.TRANSCRIPT

Charles S. (Charlie) Stone, Executive Director
THE STATUS OF RURAL TEXAS, 2010
Texas Department of Rural Affairs

WWW.TDRA.TEXAS.GOV
TDRA GOVERNING BOARD 1700 N. Congress Avenue, Suite 220 Dr. Wallace Klussmann, Chair
Austin, Texas 78701 David Alders, Vice Chair Dr. Mackie Bobo White, Secretary P: 512-936-6701/800-544-2042 Agriculture Commissioner Todd Staples Remelle Farrar
F: 512-936-6776 Dora G. Alcalà Dr. Charles Graham Woody Anderson Bryan K. Tucker
MISSION: Charles N. Butts Patrick Wallace To enhance the quality of life
for rural Texans. Charles S. (Charlie) Stone
Executive Director
GOVERNOR RICK PERRY
December 31, 2010 The Honorable Rick Perry Governor, State of Texas
The Honorable Joe Straus Speaker of the House of Representatives, State of Texas
The Honorable David Dewhurst Lieutenant Governor, State of Texas
The Honorable Members 81st Legislature
The Texas Department of Rural Affairs (TDRA) is required by Section 487.051, Government Code, to “compile an annual report describing and evaluating the condition of rural communities.” The following report is offered in fulfillment of this requirement. The Status of Rural Texas provides a snapshot of where rural Texas stands today and speaks to the broad spectrum of challenges and opportunities being experienced by rural communities across Texas. Rural Texas is important for many reasons, but especially because of the sheer number of Texans living and working in rural areas of the state. Texas’ rural population (which was 3,347,316 persons according to January 1, 2010 estimates) exceeds the population of 22 individual states and is greater than the combined populations of Alaska, North Dakota, Vermont, Wyoming, and the District of Columbia. Each rural community contributes significantly to the people of the state of Texas and Texas’ economy. In addition to offering a vast array of tourism and recreational opportunities, rural Texas is the primary source of agricultural products, livestock, water, and mineral wealth that enhance the vitality of the Texas economy. In every sense of the word, rural communities are partners in the past, present, and future successes of Texas. Indeed, the viability of rural Texas is critical to the viability of Texas as a state. And because rural, suburban, and urban areas of Texas are inextricably linked, successes in rural Texas are successes for all Texans. It is our hope that this ninth report on the status of rural Texas will contribute to the ongoing dialogue that is shaping Texas’ future. The report highlights some of the complex and diverse issues affecting rural Texas. At TDRA, we will continue to monitor developments with all interested parties to maintain an objective focus on the status of life in rural communities. Thank you on behalf of the TDRA Governing Board and the staff of the agency for the opportunity to contribute to the future of our rural communities. Respectfully submitted,
Charles S. (Charlie) Stone Executive Director

THE STATUS OF RURAL TEXAS, 2010 This report contains statistics and data relating to rural Texas, including: Population
• July 1, 2009 and January 1, 2010 estimates of rural Texas’ population New • July 1, 2009 estimates of the age of Texas’ rural population New • 2009 estimates for the race and ethnicity of rural Texas’ population New • Population projections for rural Texas by race/ethnicity (2000‐2040) • Migration to and from rural Texas (1980‐2000) • Fast growth areas in rural Texas from 2000 to 2008 • Cities, towns, and villages that have lost population since 2000 New • New cities, towns, and villages created since 2000 New
Healthcare
• Rural and urban distribution of physicians by specialty (2009) New • Rural Texans without health insurance (2008) • Physicians in rural Texas, 2008 and 2010 New
Economy
• Updated per capita income and earnings per job (2007‐2008) New • Rural employment change (2008‐2009) New • Updated rural unemployment rates (2009 annual averages) New • Updated poverty rate estimates for 2009 New • Entrepreneurship indicators (2006) • Small businesses in rural Texas (2006 and 2008) New • A focus on the farm: An in‐depth look at agriculture New
Housing
• New Census estimates for rural housing units (2009) New • Survey on the local perception of housing needs (2006) • Public housing authorities in rural Texas (2010) New

This page is intentionally left blank.

THE STATUS OF RURAL TEXAS, 2010
Rural and urban counties in Texas In this report, a “rural county” is a county that is outside of a Metropolitan Statistical Area (or nonmetropolitan) under the 1993 U.S. Office of Management and Budget (OMB) classification scheme for counties. An “urban county” is a county that is part of a Metropolitan Statistical Area (or metropolitan) under the 1993 OMB classification scheme for counties.
Legend
Rural (196 counties)
Urban (58 counties)
Page | 4
THE STATUS OF RURAL TEXAS, 2010
Population
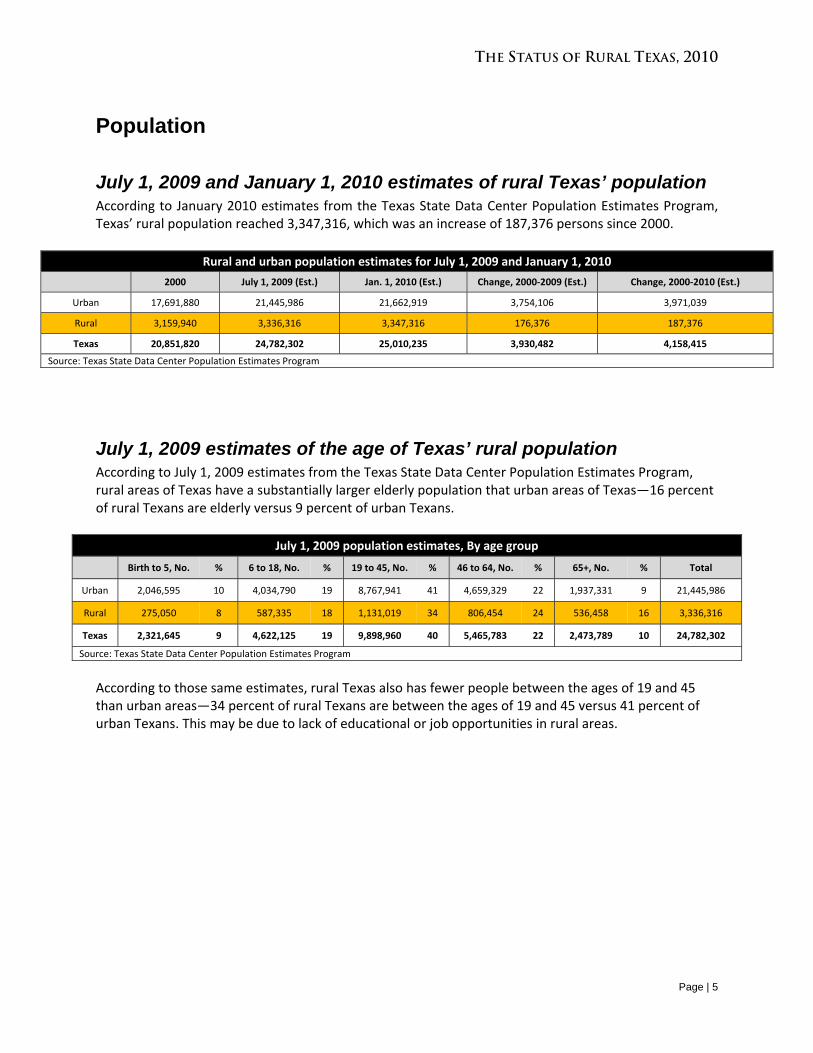
July 1, 2009 and January 1, 2010 estimates of rural Texas’ population According to January 2010 estimates from the Texas State Data Center Population Estimates Program, Texas’ rural population reached 3,347,316, which was an increase of 187,376 persons since 2000.
Rural and urban population estimates for July 1, 2009 and January 1, 2010
2000 July 1, 2009 (Est.) Jan. 1, 2010 (Est.) Change, 2000‐2009 (Est.) Change, 2000‐2010 (Est.)
Urban 17,691,880 21,445,986 21,662,919 3,754,106 3,971,039
Rural 3,159,940 3,336,316 3,347,316 176,376 187,376
Texas 20,851,820 24,782,302 25,010,235 3,930,482 4,158,415
Source: Texas State Data Center Population Estimates Program
July 1, 2009 estimates of the age of Texas’ rural population According to July 1, 2009 estimates from the Texas State Data Center Population Estimates Program, rural areas of Texas have a substantially larger elderly population that urban areas of Texas—16 percent of rural Texans are elderly versus 9 percent of urban Texans.
July 1, 2009 population estimates, By age group
Birth to 5, No. % 6 to 18, No. % 19 to 45, No. % 46 to 64, No. % 65+, No. % Total
Urban 2,046,595 10 4,034,790 19 8,767,941 41 4,659,329 22 1,937,331 9 21,445,986
Rural 275,050 8 587,335 18 1,131,019 34 806,454 24 536,458 16 3,336,316
Texas 2,321,645 9 4,622,125 19 9,898,960 40 5,465,783 22 2,473,789 10 24,782,302
Source: Texas State Data Center Population Estimates Program
According to those same estimates, rural Texas also has fewer people between the ages of 19 and 45 than urban areas—34 percent of rural Texans are between the ages of 19 and 45 versus 41 percent of urban Texans. This may be due to lack of educational or job opportunities in rural areas.
Page | 5

THE STATUS OF RURAL TEXAS, 2010
July 1, 2009 estimates of race and ethnicity for rural and urban areas According to July 1, 2009 estimates of race, ethnicity, and age from the Texas State Data Center Population Estimates Program:
• Rural areas of Texas have a considerably higher proportion of both male and female Anglos compared with urban areas.
• Anglo males represent 59 percent of the rural male population compared with 43 percent in urban areas.
• Anglo females represent 62 percent of the rural female population compared with 44 percent in urban areas.
• Hispanics represent the second largest ethnic group in rural Texas. • Rural areas of Texas have a smaller proportion of Hispanic, African American, and Other
populations when compared with urban areas of Texas.
July 1, 2009 Estimates of Race and Ethnicity in Rural and Urban Texas for Males and Females
Males
Anglo Hispanic African American Other
Urban 43.1% 40.4% 11.6% 4.9%
Rural 58.9% 31.5% 8.7% 0.9%
Females
Anglo Hispanic African American Other
Urban 44.1% 38.3% 12.6% 5.0%
Rural 62.0% 29.5% 7.5% 1.0%
0% 20% 40% 60% 80%
Anglo
African American
Other
Hispanic
Rural & Urban Females by Race and Ethnicity
Rural
Urban
0%20%
40%60%
Anglo
African American
Other
Hispanic
Rural & Urban Males by Race and Ethnicity
Rural
Urban
Page | 6

THE STATUS OF RURAL TEXAS, 2010
Rural Texas’ projected population by race/ethnicity The chart below is based on population projections1 made by the Texas State Data Center and the Office of the State Demographer2. According to these projections:
• The Anglo population will continue to decline as a percentage of Texas’ overall population. • The Hispanic population will increase significantly climbing from 27 percent of rural Texas’
population in 2000 to 42 percent by 2040. • As a percentage of Texas’ population, African American and Other populations will remain fairly
constant.
0%
10%
20%
30%
40%
50%
60%
70%
20002010
20202030
2040
Projected population of rural Texas, by race/ethnicity, 2000‐2040
Anglo
African American
Hispanic
Other
In 2000, Texas’ overall population was 53 percent Anglo. In comparison, in 2000, rural Texas’ population was 64 percent Anglo. By 2040, the percentage of Anglos in Texas will decrease to 32 percent of the state’s overall population. In rural Texas, by 2040, the percentage of Anglos will decrease to 50 percent of the rural population. Hispanics represent rural Texas’ second largest ethnic group. In 2000, rural Texas had five percent fewer Hispanics than the state overall. By 2040, rural Texas is expected to have 11 percent fewer Hispanics than the state overall, according to projections.
1 The One‐Half 1990‐2000 Migration (0.5) Scenario—This scenario has been prepared as an approximate average of the zero (0.0) and 1990‐2000 (1.0) scenarios. It assumes rates of net migration one‐half of those of the 1990s. The reason for including this scenario is that many counties in the State are unlikely to continue to experience the overall levels of relative extensive growth of the 1990s. A scenario which projects rates of population growth that are approximately an average of the zero and the 1990 2000 scenarios is one that suggests slower than 1990‐2000 but steady growth.
2 Source: http://txsdc.utsa.edu/tpepp/2008projections/
Page | 7

THE STATUS OF RURAL TEXAS, 2010
Rural Texas has an increase in net migration Between 1990 and 2000, rural areas of Texas (both adjacent and nonadjacent to urban areas) saw an increase in net migration3. Between 1990 and 2000, rural areas adjacent to urban areas saw the largest influx and achieved a net migration rate of 10 percent. During the 1980s, migration to rural areas adjacent to urban areas had been negligible.
Net migration, net migration rates, and annualized net migration rates 1980‐1990 and 1990‐2000, and the percent of population change due to migration for urban and
rural areas in Texas, 1990‐2000
Net migration Net migration rate (Percent)
Annualized net migration rate
(Percent)
Percent change due
to net migration
Area 1980‐1990
1990‐2000
1980‐1990
1990‐2000
1980‐1990
1990‐2000
1990‐2000
Urban central city 460,477 835,380 5 7 0.5 0.7 35
Urban suburban 511,956 879,913 28 35 2.8 3.5 77
Rural adjacent 4,466 190,692 0 10 0.0 1.0 70
Rural nonadjacent ‐35,250 40,044 ‐4 5 ‐0.4 0.5 59
Source: Texas State Data Center and the Office of the State Demographer
In the 1990s, nonadjacent rural areas reversed the population loss experienced during the 1980s. Net migration rates were lower in nonadjacent rural areas compared to adjacent rural areas. The net migration rate for nonadjacent rural areas was half that of adjacent rural areas during the 1990s. The higher net migration rates of rural areas adjacent to urban areas reflect ongoing suburbanization and exurbanization4 in Texas.
Fastest growth rural areas are adjacent to urban areas In the 1980s, rural areas adjacent to urban areas grew more than three times faster than nonadjacent rural areas. In the 1990s, rural areas adjacent to urban areas grew by 14 percent. In the 1990s, nonadjacent rural areas showed increased vitality, gaining population at a rate four times higher than the 1980s.
Population and population change for urban and rural areas in Texas, 1980‐1990 and 1990‐2000 Population Numerical change Percent change
Area 1980 1990 2000 1980‐1990 1990‐2000 1980‐1990
1990‐2000
Urban central city 9,731,481 11,615,291 13,993,705 1,883,810 2,378,414 19 20
Urban suburban 1,811,073 2,550,367 3,698,175 739,294 1,147,808 41 45
Rural adjacent 1,841,723 1,962,353 2,234,027 120,630 271,674 7 14
Rural nonadjacent 844,914 858,499 925,913 13,585 67,414 2 8
Source: Texas State Data Center and the Office of the State Demographer
3 The net migration rate is the difference of immigrants and emigrants of an area in a period of time. A positive value indicates that more people are entering an area than leaving it. 4 Exurbanization describes the growth of a ring of rural communities beyond suburban areas that become dormitory communities for urban areas.
Page | 8

THE STATUS OF RURAL TEXAS, 2010
A focus on fast growth rural counties
Between 2000 and 2008, 81 of 196 rural counties gained population, while 115 counties lost population.
In Texas, Burnet County had the highest numerical growth, increasing in population by 10,341 between 2000 and 2008. Compared with rural counties across the nation, Burnet County ranked 55th among US counties in numerical growth.
Top 10 fastest growing rural counties, 2000‐2008, number
County name 2000 2008 (Est.) Change, No.2000‐2008
Change, %2000‐2008
Burnet 34,147 44,488 10,341 30.3%
Wise 48,793 58,506 9,713 19.9%
Kendall 23,743 32,886 9,143 38.5%
Starr 53,597 62,249 8,652 16.1%
Wood 36,752 42,461 5,709 15.5%
Atascosa 38,628 43,877 5,249 13.6%
Polk 41,133 46,144 5,011 12.2%
Maverick 47,297 52,279 4,982 10.5%
Medina 39,304 44,275 4,971 12.6%
Kerr 43,653 48,269 4,616 10.6%
Burnet County was the fastest growth rural county in terms of numerical population increase between 2000 and 2008.
Kendall County had the highest percentage growth, increasing its population by 38.5 percent. Kendall County ranked 69th in numerical growth among US counties between 2000 and 2008.
Top 10 fastest growing rural counties, 2000‐2008, percent County name 2000 2008 (Est.)
Change, No. 2000‐2008
Change, % 2000‐2008
Kendall 23,743 32,886 9,143 38.5%
Burnet 34,147 44,488 10,341 30.3%
Rains 9,139 11,204 2,065 22.6%
Wise 48,793 58,506 9,713 19.9%
Lampasas 17,762 21,197 3,435 19.3%
Somervell 6,809 7,942 1,133 16.6%
Franklin 9,458 11,001 1,543 16.3%
Starr 53,597 62,249 8,652 16.1%
Wood 36,752 42,461 5,709 15.5%
Bandera 17,645 20,303 2,658 15.1%
Kendall County was the fastest growth rural county in terms of percentage population increase between 2000 and 2008.
Page | 9

THE STATUS OF RURAL TEXAS, 2010
Trends in population among Texas’ places between 2000 and 2009 Texas’ population grew from 20,851,820 persons (in 2000) to 24,782,302 (in 2009), according to estimates from the Texas State Data Center, resulting in an increase of 3,930,482 persons. This growth was not evenly distributed among places (cities, towns, and villages) in Texas. The table below looks exclusively at places in Texas that lost population between 2000 and 2009. We grouped places (cities, towns, and villages) by size. Places that ranged in size from 501‐1,000 persons and from 1,001 to 2,500 persons lost the largest percentage of their population between 2000 and 2009 (‐8 percent).
Total population change for places that lost population between 2000 to 2009, by size of place*
Size of place Year Percent change in population (city, town, or village) 2000 2009 for places in this range
<500 24,772 23,041 ‐7%501‐1,000 40,002 36,894 ‐8%1,001‐2,500 164,875 151,896 ‐8%2,501‐5,000 201,377 186,396 ‐7%5,001‐10,000 236,874 223,920 ‐5%
10,000+ 755,890 729,401 ‐4%* This table focuses only on places that lost population. We examined all places in Texas that lost population between 2000 and 2009 and grouped those places by size of place, e.g., less than 500. We combined the total populations of all places within each range for the years 2000 and 2009. We then found the difference between those two years and expressed that difference as a percentage. Source: US Census Bureau, 2009 Estimates of Incorporated Places and Minor Civil Divisions.
0%
10%
20%
30%
40%
50%
60%
70%80%
90%
100%
Less than 500
501 ‐1000
1,001 ‐2,500
2,501 ‐5,000
5,001 ‐10,000
10,000 or more
155 132 191 103 83156
85 56 98 58 3431
Texas places (cities, towns, and villages) that lost population between 2000‐2009, by place size
Lost population
Did not lose population
Page | 10

THE STATUS OF RURAL TEXAS, 2010
Interestingly, from 2000 to 2009 one‐third of Texas cities with a population under 10,000 lost population (not shown in the table below). 36 percent of cities (ranging in size from 2,501 to 5000 persons) lost population (see table below).
Texas places (cities, towns, and villages) that lost population between 2000‐2009, by place size
Less than
500 501 ‐1000
1,001 ‐2,500
2,501 ‐5,000
5,001 ‐ 10,000
10,000 or more
Places in this range 240 188 289 161 117 187
Lost population 85 56 98 58 34 31
Did not lose population 155 132 191 103 83 156 Percent of cities in this range losing population from 2000 to 2009
35% 30% 34% 36% 29% 17%
Source: US Census Bureau, 2009 Estimates of Incorporated Places and Minor Civil Divisions.
New places in Texas since 2000 Texas has added 27 new places (four villages, three towns, and 20 cities) since the 2000 Census. These new places range in size from Brazos Bend with a population of 76 to Meadows Place with a population of 6,377. The city of Brazos Bend is more populous than Loving County, which had a population of 67 persons in 2000 and had a population of 45 in 2009, according to available estimates.
New places in Texas since 2000
Place 2009
Population Brazos Bend city 76Union Valley city 194Taylor Landing city 211DISH town 218Kurten town 233Brazos Country city 302Cashion Community city 328Volente village 402Iola city 430Bedias city 442Webberville village 454Point Venture village 506Scurry town 705Cresson city 856Weston Lakes city 1,297Von Ormy city 1,442Escobares city 1,459Jarrell city 1,470Salado village 2,042East Bernard city 2,220Horseshoe Bay city 2,502Wimberley city 2,846Hideaway city 3,001Westworth Village city 3,050deCordova city 3,365Spring Valley Village city 3,959Meadows Place city 6,377Source: US Census Bureau, 2009 Estimates of Incorporated Places and Minor Civil Divisions.
Page | 11
THE STATUS OF RURAL TEXAS, 2010
Healthcare
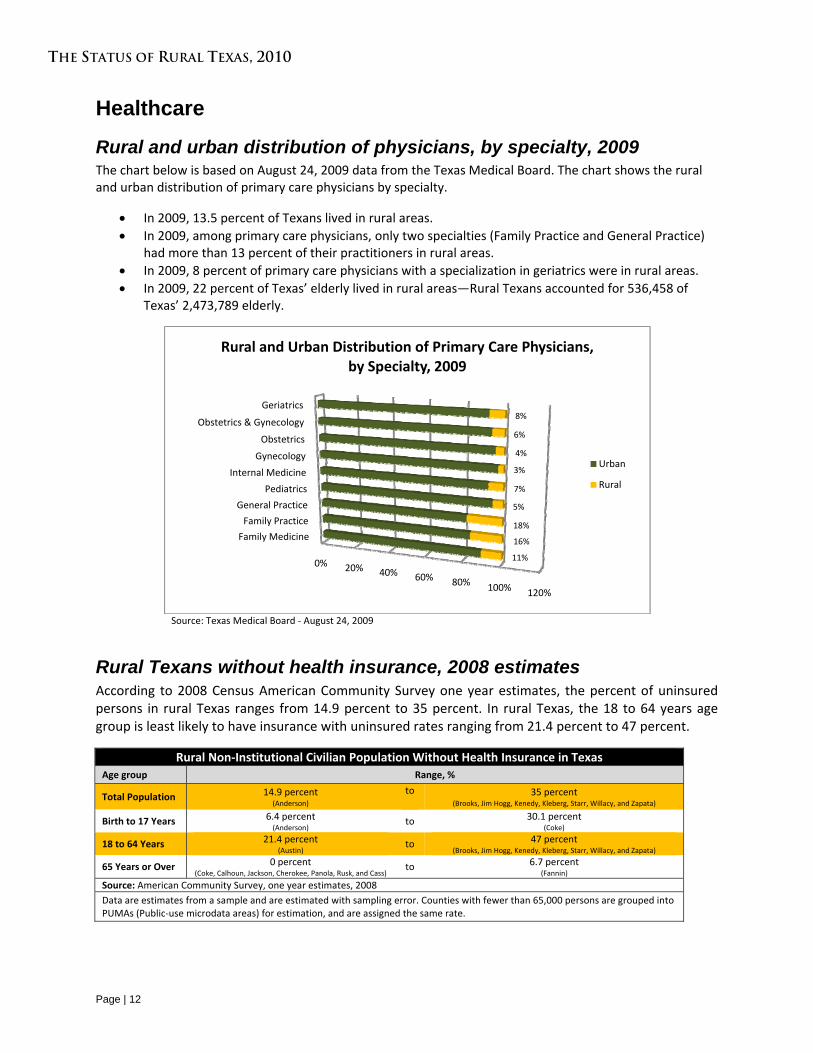
Rural and urban distribution of physicians, by specialty, 2009 The chart below is based on August 24, 2009 data from the Texas Medical Board. The chart shows the rural and urban distribution of primary care physicians by specialty.
• In 2009, 13.5 percent of Texans lived in rural areas. • In 2009, among primary care physicians, only two specialties (Family Practice and General Practice)
had more than 13 percent of their practitioners in rural areas. • In 2009, 8 percent of primary care physicians with a specialization in geriatrics were in rural areas. • In 2009, 22 percent of Texas’ elderly lived in rural areas—Rural Texans accounted for 536,458 of
Texas’ 2,473,789 elderly.
Source: Texas Medical Board ‐ August 24, 2009
0% 20% 40% 60% 80% 100% 120%
Family Medicine
Family Practice
General Practice
Pediatrics
Internal Medicine
Gynecology
Obstetrics
Obstetrics & Gynecology
Geriatrics
11%
16%
18%
5%
7%
3%
4%
6%
8%
Rural and Urban Distribution of Primary Care Physicians, by Specialty, 2009
Urban
Rural
Rural Texans without health insurance, 2008 estimates According to 2008 Census American Community Survey one year estimates, the percent of uninsured persons in rural Texas ranges from 14.9 percent to 35 percent. In rural Texas, the 18 to 64 years age group is least likely to have insurance with uninsured rates ranging from 21.4 percent to 47 percent.
Rural Non‐Institutional Civilian Population Without Health Insurance in Texas Age group Range, %
Total Population 14.9 percent (Anderson)
to
35 percent (Brooks, Jim Hogg, Kenedy, Kleberg, Starr, Willacy, and Zapata)
Birth to 17 Years 6.4 percent (Anderson)
to 30.1 percent (Coke)
18 to 64 Years 21.4 percent (Austin)
to 47 percent (Brooks, Jim Hogg, Kenedy, Kleberg, Starr, Willacy, and Zapata)
65 Years or Over 0 percent (Coke, Calhoun, Jackson, Cherokee, Panola, Rusk, and Cass)
to 6.7 percent (Fannin)
Source: American Community Survey, one year estimates, 2008Data are estimates from a sample and are estimated with sampling error. Counties with fewer than 65,000 persons are grouped into PUMAs (Public‐use microdata areas) for estimation, and are assigned the same rate.
Page | 12

THE STATUS OF RURAL TEXAS, 2010
Physicians in rural Texas, 2008 and 2010 According to September 2008 Texas Medical Board data, 24 Texas counties lacked even one physician.
• Between 2008 and 2010, Duval and Cochran counties each lost the one physician that lived or worked in the county.
• Presidio County, which lacked a physician in 2008, gained one physician by 2010. • In 2010, 25 Texas counties (all rural) had no physician living or working in that county. • In both 2008 and 2010, all counties without a physician were rural.
Year
Loss or Gain of Physicians, 2008‐2010
Number of counties that lost physicians, 2008‐2010
2008 2010
Urban 43,574 46,061 +2,487 13
Rural 2,902 2,836 ‐66 62
Texas 46,476 48,897 2,421 75
• 75 Texas counties (almost 30 percent) lost at least one physician between 2008 and 2010. • In both 2008 and 2010, seventeen rural counties had only one physician. • In 2008, 20 rural counties had two physicians; in 2010, 19 had two physicians. • Between 2008 and 2010, rural counties lost 66 physicians overall (a decrease of 2.3 percent).
0%10%20%30%40%50%60%70%80%90%100%
Urban Rural
29% 20%
71% 80%
Percentage of male and female primary care physicians in rural and urban areas, 2010
Male
Female
In 2010, 71 percent of urban physicians were male. In 2010, 80 percent of rural physicians in Texas were male (a decrease of one percent since 2008).
Page | 13

THE STATUS OF RURAL TEXAS, 2010
Increase in active physicians not in practice In 2008, 156 of Texas’ 46,476 active physicians were not in practice (0.3 percent were not in practice). In 2010, 1,359 of Texas’ 48,897 active physicians were not in practice (2.8 percent were not in practice).
‐
200
400
600
800
1,000
1,200
1,400
2008 2010
Active physicians not in practice, 2008 and 2010
Female
Male
Page | 14

THE STATUS OF RURAL TEXAS, 2010
Economy In Texas, rural unemployment has closely mirrored urban unemployment since August 2009.
7.0%7.2%7.4%7.6%7.8%8.0%8.2%8.4%8.6%8.8%9.0%
Aug 09
Sep 09
Oct 09
Nov 09
Dec 09
Jan 10
Feb 10
Mar 10
Apr 10
May 10
Jun 10
Jul 10
Aug 10
Sep 10
Unemployment in rural & urban areas of Texas, Aug. 2009‐Sep. 2010
Urban
Rural
From August 2009 to March 2010, rural unemployment was slightly higher than urban unemployment in Texas. Since May 2010, rural unemployment has been slightly lower than urban unemployment.
Page | 15

THE STATUS OF RURAL TEXAS, 2010
Employment change in rural Texas In 2008, rural Texas’ annual average unemployment rate was 4.9 percent, up from 4.5 percent in 2007. In 2009, rural Texas’ annual average unemployment rate was 7.8 percent. From 2008 to 2009, employment increased by 0.3 percent in rural Texas.
Employment
Rural5 Urban Total
Total number of jobs
2007 1,527,993 12,490,860 14,018,853
2008 1,571,714 12,898,186 14,469,900
Percent employment change
2006‐2007 0.9 1.6 1.5
2007‐2008 1.4 1.2 1.3
2008‐2009 0.3 ‐0.4 ‐0.4
Unemployment rate (percent)
2008 4.9 5 4.9
2009 7.8 7.6 7.6
Prepared by Economic Research Service, USDA, Washington, DC.
Per capita income According to the Economic Research Service at the United States Department of Agriculture, per capita income in rural Texas remained flat between 2007 and 2008. During the same time period, urban per capita income decreased by 1.3 percent. However, rural per capita income continued to trail urban per capita income significantly—by $9,078—in 2008.
Per‐capita income (2008 dollars)
Rural Urban Total
2007 29,849 39,447 38,252
2008 29,843 38,921 37,809
Percent change 0 ‐1.3 ‐1.2
Prepared by Economic Research Service, USDA, Washington, DC.
Earnings per job Between 2007 and 2008, earnings per job in rural areas of Texas decreased from $33,707 to $32,790 (a decrease of 2.7 percent). In 2008, rural earnings per job trailed urban earnings per job significantly (by $20,134).
Earnings per job (2008 dollars)
Rural Urban Total
2007 33,707 54,183 51,951
2008 32,790 52,924 50,737
Percent change ‐2.7 ‐2.3 ‐2.3Prepared by Economic Research Service, USDA, Washington, DC.
5 For data provided by the USDA Economic Research Service, urban and rural (metro and nonmetro) definitions are based on the Office of Management and Budget (OMB) June 2003 classification. See Measuring Rurality: New Definitions in 2003 for more information.
Page | 16

THE STATUS OF RURAL TEXAS, 2010
Poverty rate In 2009, the poverty rate in rural Texas was 19.5 percent (more than 3 percent higher than the poverty rate in urban areas of Texas). In the United States, rural poverty rose from 2008 to 2009, reaching 16.6 percent, which is the highest rate since 1992 when it was 16.9 percent.
Poverty rate (percent)Rural Urban Total
1979 19.1 13.7 14.71989 23.5 17.1 18.11999 18.7 14.8 15.42009 (latest model‐based estimates) 19.5 16.8 17.1Prepared by Economic Research Service, USDA, Washington, DC.
In 2005: • the US poverty rate was 13.3 percent; • Texas’ rate was 17.5 percent; and • Rural Texas’ rate was 19.7 percent. In 2007: • the US poverty rate was 13 percent; • Texas’ rate was 16.3 percent; and • Rural Texas’ rate was 18.4 percent. In 2009: • the US poverty rate was 14.3 percent; • Texas’ rate was 17.1 percent; and • Rural Texas’ rate was 19.5 percent.
Page | 17

THE STATUS OF RURAL TEXAS, 2010
Entrepreneurship indicators
Employment In 2006, US non‐farm proprietor employment accounted for almost 19 percent of total nonfarm employment. That same year, the figure for Texas was 20.1 percent. In rural Texas, non‐farm proprietor employment accounted for 26.1 percent of total nonfarm employment.
In 2006, Texas’ average income per non‐farm proprietor was $47,214, exceeding the United States average of $29,950.
Income In 2006, at the national level, non‐farm proprietors’ income accounted for 9 percent of total personal income. In Texas, non‐farm proprietors accounted for 15.2 percent of total personal income. In rural Texas counties, the percentage ranged from 1.7 percent to 26.5 percent. In 2006, the average income per non‐farm proprietor in the United States was $29,950. In Texas, the figure stood at $47,214. The average income per non‐farm proprietor in Texas counties ranged from just over $5,000 to $112,631. For rural Texas counties, the highest income average was $42,765.
Small businesses in rural Texas The Texas Workforce Commission (TWC) indicates that 70,350 business reporting units were operating in rural Texas in the first quarter of 2006 with an average of 14.35 workers per unit. The Texas average during that time period was 23.12 workers per unit. By the first quarter of 2008, 72,549 business reporting units were operating in rural Texas. That marked an increase of 2,199 business reporting units from 2006‐2008. In 2008, the average number of workers remained fairly constant with rural business reporting units, which reported an average of 14.17 workers and Texas business reporting units reported an overall average of 22.86 workers per unit.
Page | 18

THE STATUS OF RURAL TEXAS, 2010
A focus on the farm: An in-depth look at agriculture
Farm characteristics The table below shows data for the last three censuses of agriculture (the most recent was conducted in 2007).
Farm characteristics(1997, 2002 and 2007 Census of Agriculture)
1997 2002 2007 Approximate total land area (acres) 167,625,165 167,550,149 167,145,209 Total farmland (acres) 133,956,359 129,877,666 130,398,753 Percent of total land area 79.9 77.5 78
Cropland (acres) 39,051,211 38,657,710 33,667,177 Percent of total farmland 29.2 29.8 25.8 Percent in pasture 31.3 33.5 23.3 Percent irrigated 13.9 11.8 13.7
Harvested Cropland (acres) 20,357,767 17,750,938 19,174,301
Woodland (acres) 5,471,015 5,651,181 7,099,790 Percent of total farmland 4.1 4.4 5.4 Percent in pasture 72.4 74.4 74.4
Pastureland (acres) 86,947,714 83,402,865 87,217,416 Percent of total farmland 64.9 64.2 66.9
Land in house lots, ponds,2,486,419 2,165,910 2,414,370
roads, wasteland, etc. (acres)Percent of total farmland 1.9 1.7 1.9 Prepared by Economic Research Service, USDA, Washington, DC.
Farms by size In 2007, the majority of Texas farms were between 1 and 99 acres in size.
Farms by size (percent) 1997 2002 2007
1 to 99 acres 46.6 48.3 52.5 100 to 499 acres 34.8 33.7 31.2 500 to 999 acres 8.6 8.1 7.2 1000 to 1,999 acres 5.4 5.3 4.6 2,000 or more acres 4.6 4.6 4.5 Prepared by Economic Research Service, USDA, Washington, DC.
Page | 19

THE STATUS OF RURAL TEXAS, 2010
Farms by sales The vast majority of Texas’ farms (71 percent in 2007) have less than $10,000 in sales.
Farms by sales (percent) 1997 2002 2007
Less than $9,999 70.2 71.5 71 $10,000 to $49,999 18.4 18.3 18.3 $50,000 to $99,999 3.8 3.8 3.5 $100,000 to $499,999 5.9 4.9 4.7 More than $500,000 1.7 1.5 2.4 Prepared by Economic Research Service, USDA, Washington, DC.
Tenure of farmers In 2007, nearly 72 percent of farms were owned by a full owner.
Tenure of farmers 1997 2002 2007
Full owner (farms) 143,245 155,053 177,147 Percent of total 62.8 67.7 71.6
Part owner (farms) 60,336 55,703 54,773 Percent of total 26.4 24.3 22.1
Tenant owner (farms) 24,592 18,170 15,517 Percent of total 10.8 7.9 6.3 Prepared by Economic Research Service, USDA, Washington, DC.
Farm organization In terms of the number of farms in Texas, individuals/family or sole proprietorship is the most common form of farm organization (88.2 percent in 2007).
Farm organization 1997 2002 2007
Individuals/family, sole201,896 210,409 218,126
proprietorship (farms)Percent of total 88.5 91.9 88.2
Family‐held corporations5,057 3,842 4,956
(farms) Percent of total 2.2 1.7 2
Partnerships (farms) 18,658 12,720 20,657Percent of total 8.2 5.6 8.3
Non‐family corporations (farms) 688 456 750Percent of total 0.3 0.2 0.3
Others ‐ cooperative, estate or1,874 1,499 2,948
trust, institutional, etc. (farms)Percent of total 0.8 0.7 1.2Prepared by Economic Research Service, USDA, Washington, DC.
Page | 20

THE STATUS OF RURAL TEXAS, 2010
Characteristics of principal farm operators The average age of a principal farm operator in Texas is increasing—up from 56 years of age in 1997 to nearly 59 years of age in 2007. Between 1997 and 2007, the number of female farm operators increased by more than 36 percent.
Characteristics of principal farm operators1997 2002 2007
Average operator age (years) 56 56.9 58.9Percent with farming as their
40.4 53.6 39.9 primary occupationMen 202,463 201,734 212,426Women 25,710 27,192 35,011Prepared by Economic Research Service, USDA, Washington, DC.
Farm financial indicators Between 2007 and 2008, the number of farms in Texas remained constant, according to USDA data. Final agricultural sector output decreased by 4.5 percent—services and forestry grew by 15.3 percent; final crop output fell by 17.8 percent; and final animal output fell slightly by $45 million or 0.4 percent.
Farm financial indicatorsFarm income and value added data
2007 2008Number of farms 247,500 247,500
Thousand $Final crop output 8,590,838 7,061,726+ Final animal output 11,077,615 11,032,630+ Services and forestry 3,456,628 3,985,894= Final agricultural sector output 23,125,082 22,080,250
‐ Intermediate consumption outlays 14,232,975 14,324,074+ Net government transactions 562,432 273,698= Gross value added 9,454,538 8,029,875
‐ Capital consumption 2,093,945 2,232,644
= Net value added 7,360,593 5,797,231
‐ Factor payments 2,608,301 2,579,941Employee compensation (total hired labor) 1,286,684 1,407,685Net rent received by nonoperator landlords 317,084 205,442Real estate and nonreal estate interest 1,004,533 966,814
= Net farm income 4,752,292 3,217,290Prepared by Economic Research Service, USDA, Washington, DC.
Manufactured inputs From 2007 to 2008, manufactured inputs increased from roughly $2.9 billion to approximately $3.4 billion.
Manufactured inputs in Texas, 2007 and 20082007 2008
($, thousands) ($, thousands)Manufactured inputs (total) 2,859,169 3,401,261 Fertilizers and lime 920,000 1,080,000 Pesticides 470,000 510,000 Petroleum fuel and oils 1,102,839 1,336,069 Electricity 366,330 475,192Prepared by Economic Research Service, USDA, Washington, DC.
Page | 21

THE STATUS OF RURAL TEXAS, 2010
Organic agriculture Between 2006 and 2008, organic agriculture increased in Texas. The number of certified operations increased by 21 percent and total acreage increased by 36 percent.
Organic agriculture 2006 2007 2008 Change 2006‐2008
Number of certified operations 230 227 279 21% Crops (acres) 104,474 130,603 155,957 49% Pasture & rangeland (acres) 227,323 288,050 294,749 30% Total acres 331,798 418,652 450,706 36% Prepared by Economic Research Service, USDA, Washington, DC.
Conservation practices Between 1997 and 2007, the number of acres of farmland in conservation or wetlands reserve programs increased by 12.8 percent in Texas.
Conservation practices 1997 2002 2007
Farmland in conservation orwetlands reserve programs (acres)
3,695,646 3,302,766 4,170,044
Average farm size (acres) 587 567 527 Prepared by Economic Research Service, USDA, Washington, DC.
Top commodities, exports, and counties The table below highlights Texas’ top five agricultural commodities in 2009. Texas produced more than a third of US cotton and nearly 16 percent of cattle and calves by value.
Top 5 agriculture commodities, 2009 Value of receipts (Thousand $) Percent of state total farm receipts Percent of US value
1. Cattle and calves 6,938,721 41.9 15.9 2. Broilers 1,650,227 10 7.6 3. Greenhouse/nursery 1,284,269 7.7 8.1 4. Cotton 1,188,629 7.2 34.1 5. Dairy products 1,172,129 7.1 4.8 All commodities 16,573,054 5.8 Prepared by Economic Research Service, USDA, Washington, DC.
In 2009, Texas was first in exports for cotton and linters and third for live animals and meat.
Top 5 agriculture exports, estimates, FY 2009 Rank among states Value (million $)
1. Cotton and linters 1 1,389.802. Live animals and meat 3 709.53. Other 6 441.24. Feed grains and products 10 378.85. Poultry and products 6 289.4Overall rank 5 4,541.60Prepared by Economic Research Service, USDA, Washington, DC.
In 2007, Deaf Smith County was highest in agricultural sales, accounting for 5.5 percent of Texas’ total receipts.
Top 5 counties in agricultural sales 2007 Percent of state total receipts Thousand $
1. Deaf Smith County 5.5 1,148,3592. Castro County 4.6 973,3523. Parmer County 4.5 937,6644. Hartley County 3.4 724,5085. Hansford County 2.8 589,799State total 21,001,074Prepared by Economic Research Service, USDA, Washington, DC.
Page | 22

THE STATUS OF RURAL TEXAS, 2010
Housing
Census housing unit estimates, 2009 Between 2000 and 2009, the number of housing units in rural Texas increased by more than six percent (from 1,381,471 to 1,466,445 units), according to 2009 Census estimates. During the same period, Texas’ urban housing stock grew by nearly 22 percent.
Rural and urban housing units: 2000, 2008, and 2009
2000 2008 2009
Change, 2008‐2009Number %
Change, 2000‐2009 Number
%
Urban 6,776,104 8,145,598 8,257,775 112,177 1.4% 1,481,671 21.9%
Rural 1,381,471 1,462,445 1,466,445 4,000 0.3% 84,974 6.2%
Texas 8,157,575 9,608,043 9,724,220 116,177 1.2% 1,566,645 19.2%
Between 2008 and 2009, according to Census estimates, 4,000 homes were added in rural Texas and 112,177 homes were added in urban areas. Overall, Texas added 116,177 homes between 2008 and 2009.
0%10%20%30%40%50%60%70%80%90%
100%
20002008
2009
1,381,471 1,462,445 1,466,445
Housing Units: 2000, 2008, and 2009
Rural
Urban
Page | 23

THE STATUS OF RURAL TEXAS, 2010
Survey on the local perception of housing needs
From March to May 2006, the Texas Department of Housing and Community Affairs (TDHCA) conducted a survey of the housing and community development needs, as well as issues and problems at the state, regional, and local levels. The survey was distributed to state representatives, state senators, mayors, county judges, city managers, housing/planning departments, United States Department of Agriculture (USDA) local offices, public housing authorities, councils of government, community action agencies, and Housing Opportunities for Persons with AIDS (HOPWA) agencies for total of 2,529 individuals and entities. The survey had a 17.2 percent response rate.
To assess top housing needs for rural Texas, TDRA reviewed TDHCA’s survey and identified responses from rural communities and from entities representing rural Texas. Approximately 85 percent of the survey respondents were rural communities or represented rural communities. According to rural survey respondents, housing assistance, development of rental units, and energy assistance were top needs. Survey respondents gave lowest priority to assistance for homeless persons.
Survey on the local perception of housing needs
Number of responses per need rank (1 highest, 5 lowest), and percent of total responses within each activity
Answer Choice 1 2 3 4 5 No Opinion Total Responses
Housing Assistance 114 62 49 22 1 14 262 43.5% 23.7% 18.7% 8.4% 0.4% 5.3%
Energy Assistance 66 98 72 37 9 9 291
22.7% 33.7% 24.7% 12.7% 3.1% 3.1%
Development of Rental Units 58 51 72 34 32 23 270
21.5% 18.9% 26.7% 12.6% 11.9% 8.5%
Capacity Building 49 35 57 90 70 41 342
14.3% 10.2% 16.7% 26.3% 20.5% 12.0% Assistance for Homeless Persons
14 22 34 61 127 51 309 4.5% 7.1% 11.0% 19.7% 41.1% 16.5%
Items ranked by highest need Housing Assistance Over half of respondents identified home repair assistance as the highest need for housing assistance. Almost a quarter of respondents identified assistance to purchase a home as the highest need for housing assistance.
Energy Assistance Both utility payment assistance and weatherization/minor home repairs were identified as the top activities with the greatest need for energy assistance activities.
Development of Rental Units For the development of rental units, over a third of the respondents identified construction of new rental units as the greatest needed activity. Also, a third of respondents responded that the need for both new construction and rehabilitation of rental units is the same as the need for the development of rental units.
Capacity Building Assistance Over a quarter of the respondents identified assistance with operating costs as the greatest need activity for capacity building assistance. Nineteen percent of respondents indicated that training and technical assistance was the greatest need activity.
Assistance for Homeless Persons Over half of the respondents said that there is minimal need for assistance for homeless persons, and 18 percent had no opinion on the issue. Ten percent identified homeless prevention services as the greatest need activity for assistance for homeless persons.
Page | 24

THE STATUS OF RURAL TEXAS, 2010
Page | 25
Public Housing Authorities, 2010
According to the 2011 State Low Income Housing Plan, beginning in the 1930s, local public housing authorities (PHAs) built and managed properties for low‐income residents. This was achieved primarily through funding provided by the U.S. Department of Housing and Urban Development (HUD). According to the plan, most public housing developments were completed during the 1970s.
Public housing authority (PHA) units in rural and urban Texas, 2010 Rural Urban Texas36,740 26,676 63,41657.9% 42.1%
In 2010, according to HUD, Texas had 63,416 PHA units. Nearly 60 percent of those units were located in rural areas (see table above). The chart below shows the distribution of rural and urban PHAs by uniform state service region (see a map of the regions on the next page).
0 1,000 2,000 3,000 4,000 5,000 6,000 7,000 8,000
1
2
3
4
5
6
7
8
9
10
11
12
13
Rural & Urban Public Housing Authority Units, By Region
Urban
Rural

THE STATUS OF RURAL TEXAS, 2010
Page | 26
Credits and acknowledgements
This report is written and researched by Eric Beverly and Kim White from the Texas Department of Rural Affairs, with the exception of
“Survey on the local perception of housing needs,” written by Alexandra Gamble in consultation with Brenda Hull (of the Texas Department of Housing and Community Affairs).
Map by: Eric Beverly
Layout and design by: Eric Beverly
Special thanks to: Texas State Data Center and the Office of the State Demographer
SOCRATES, Texas Workforce Commission