2010 ubo/ubu conference 1 title: productivity metrics/tools session: r-4-0800
TRANSCRIPT

2010 UBO/UBU Conference
1
Title: Productivity Metrics/Tools
Session: R-4-0800

2
Objectives
To show the different data available in MEPRS including:– Expenses – how your money is being spent– Personnel – where your folks are spending their time– Workload – how much work they are producing
Why so many codes and how they are used How to take a look at your time How to identify potential problems How “straight 8s” look in the big picture How to look at an entire clinic of providers’ time
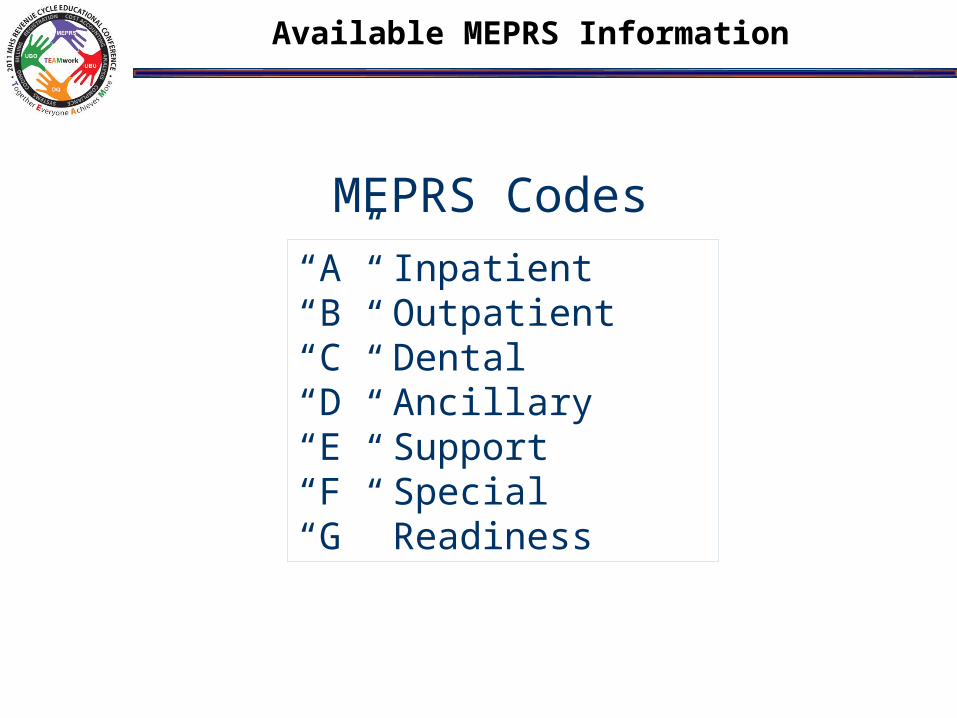
“A” Inpatient“B” Outpatient“C” Dental“D” Ancillary“E” Support“F” Special“G” Readiness
MEPRS Codes
Available MEPRS Information

4
Stepdown Expense
What is Stepdown?– The distribution of expenses from one work center to
another based on the percentage of workload requested
– Example Pharmacy total workload 1,000 prescriptions Family Practice wrote 500 prescriptions 50% of Pharmacy work was to Family Practice Pharmacy total expenses were $10,000 So 50% of Pharmacy expenses ($5,000) will be added to
Family Practice total expense
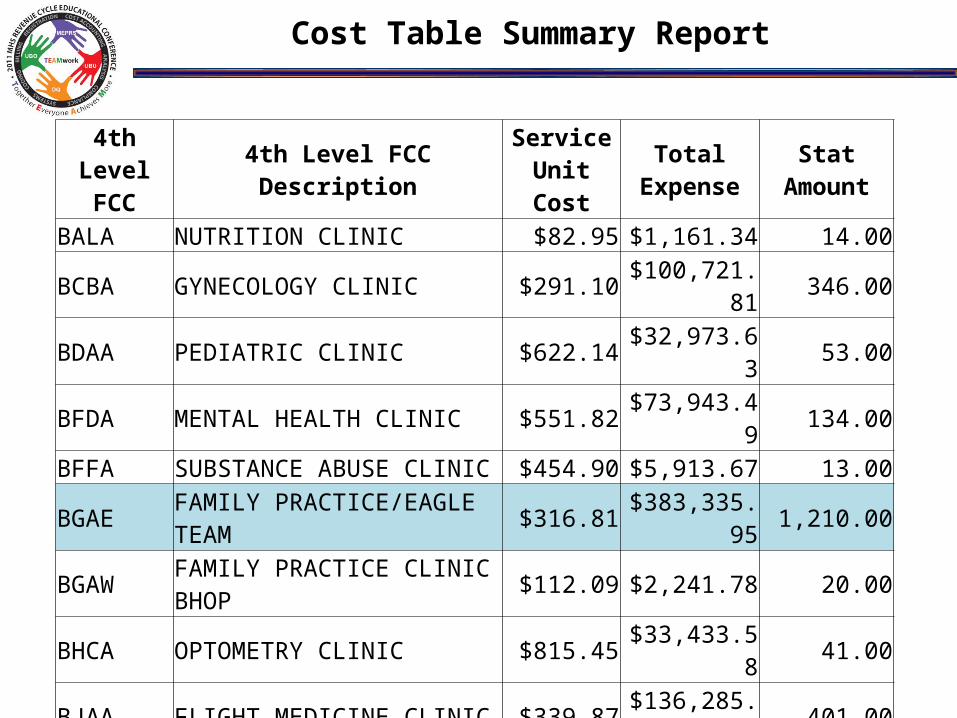
4th Level FCC 4th Level FCC Description Service
Unit Cost Total Expense Stat Amount
BALA NUTRITION CLINIC $82.95 $1,161.34 14.00BCBA GYNECOLOGY CLINIC $291.10 $100,721.81 346.00BDAA PEDIATRIC CLINIC $622.14 $32,973.63 53.00BFDA MENTAL HEALTH CLINIC $551.82 $73,943.49 134.00BFFA SUBSTANCE ABUSE CLINIC $454.90 $5,913.67 13.00BGAE FAMILY PRACTICE/EAGLE TEAM $316.81 $383,335.95 1,210.00BGAW FAMILY PRACTICE CLINIC BHOP $112.09 $2,241.78 20.00BHCA OPTOMETRY CLINIC $815.45 $33,433.58 41.00BJAA FLIGHT MEDICINE CLINIC $339.87 $136,285.96 401.00BLAA PHYSICAL THERAPY CLINIC $116.11 $44,934.08 387.00CAAA DENTAL CARE $145.68 $166,747.41 1,144.59CBAA DENTAL LABORATORY SERVICE $26.06 $11,911.15 457.00DAAA PHARMACY $44.89 $279,208.11 6,219.60DBAA CLINICAL PATHOLOGY $39.27 $58,711.12 1,495.18DCAA DIAGNOSTIC RADIOLOGY $143.73 $32,683.28 227.39
Cost Table Summary Report
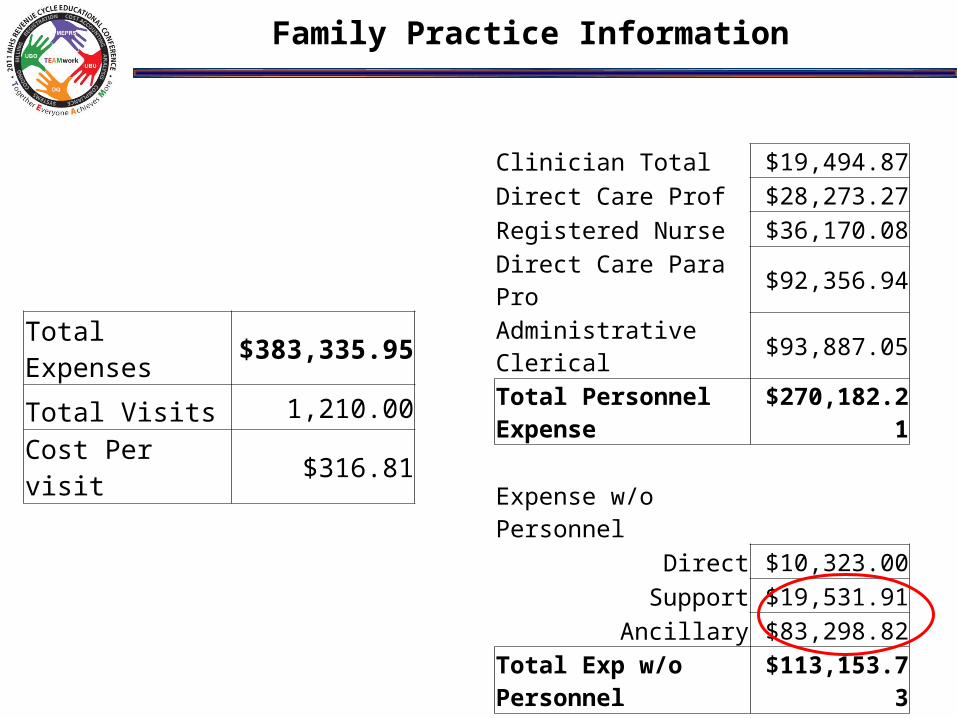
Total Expenses $383,335.95
Total Visits 1,210.00
Cost Per visit $316.81
Clinician Total $19,494.87
Direct Care Prof $28,273.27
Registered Nurse $36,170.08
Direct Care Para Pro $92,356.94
Administrative Clerical $93,887.05
Total Personnel Expense $270,182.21
Expense w/o PersonnelDirect $10,323.00
Support $19,531.91
Ancillary $83,298.82
Total Exp w/o Personnel $113,153.73
Total Detail Expenses $383,335.94
Family Practice Information
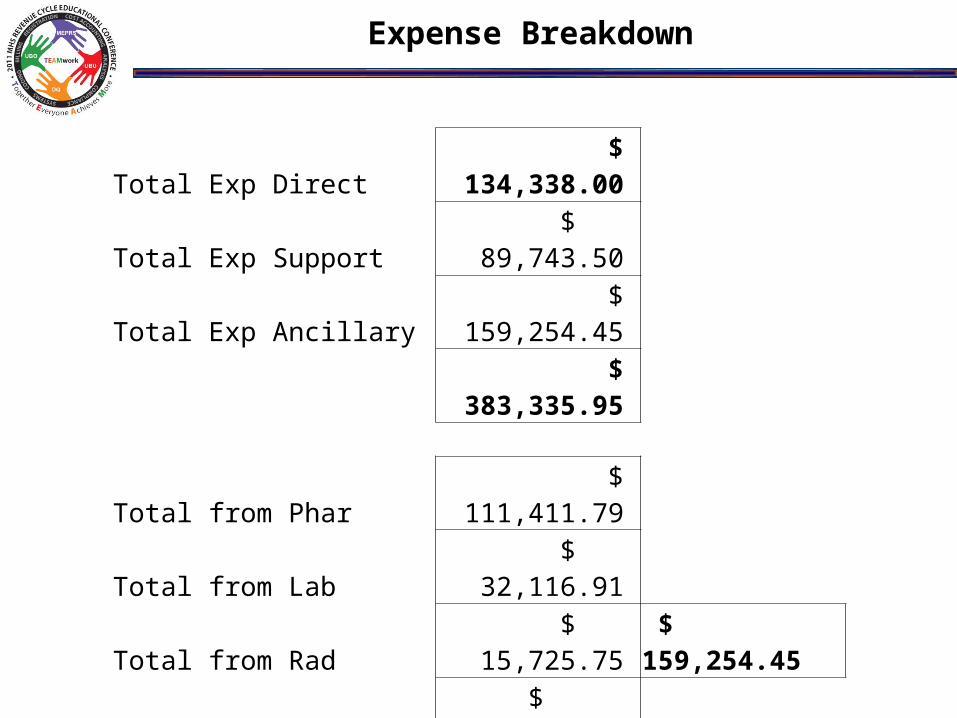
Total Exp Direct $ 134,338.00
Total Exp Support $ 89,743.50
Total Exp Ancillary $ 159,254.45
$ 383,335.95
Total from Phar $ 111,411.79
Total from Lab $ 32,116.91
Total from Rad $ 15,725.75 $ 159,254.45 Total from Command $ 3,800.72
Total from Squadron $ 2,709.93
Total from RMO $ 3,488.03
All other "E" codes $ 79,744.83 $ 89,743.50
Expense Breakdown

Pharmacy Stepdown Expense DistributionWomens Health $ 20,943.08
Pediatrics $ 3,415.61 Mental Health $ 1,123.56
Family Practice $ 111,411.79 Optometry $ 1,869.60 Flight Med $ 15,999.43
Physical Therapy $ 179.77 Dental $ 6,921.10
Public Health $ 44.94 Outside providers $ 117,299.23
Total Phar Exp $ 279,208.11
Pharmacy Expense Distribution
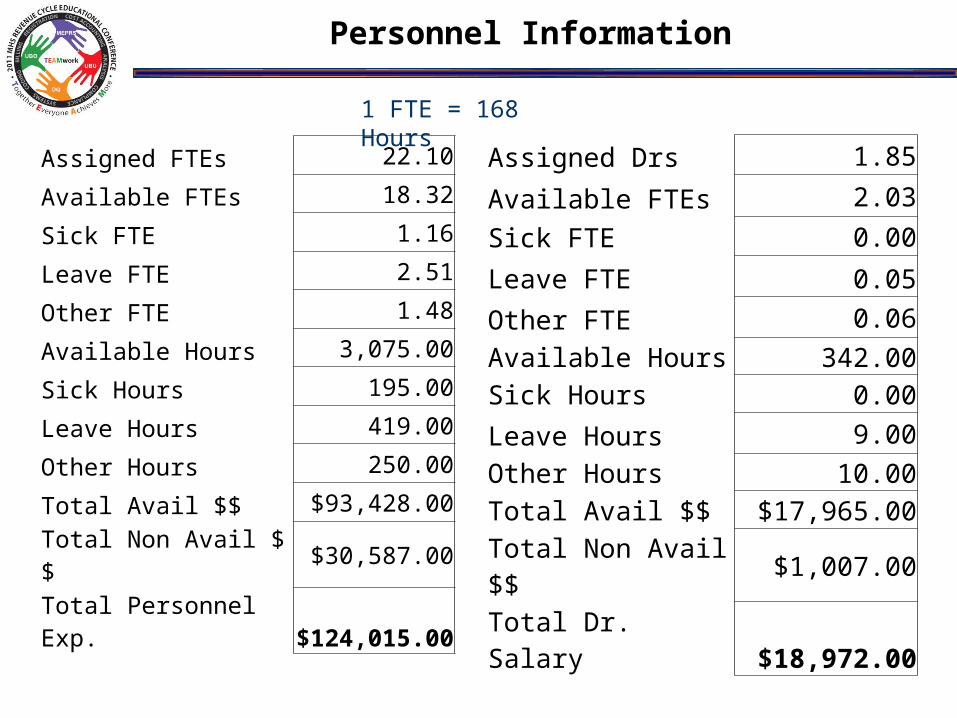
Assigned FTEs 22.10
Available FTEs 18.32
Sick FTE 1.16
Leave FTE 2.51
Other FTE 1.48
Available Hours 3,075.00
Sick Hours 195.00
Leave Hours 419.00
Other Hours 250.00
Total Avail $$ $93,428.00
Total Non Avail $$ $30,587.00
Total Personnel Exp. $124,015.00
Assigned Drs 1.85
Available FTEs 2.03
Sick FTE 0.00
Leave FTE 0.05
Other FTE 0.06Available Hours 342.00Sick Hours 0.00
Leave Hours 9.00
Other Hours 10.00Total Avail $$ $17,965.00
Total Non Avail $$ $1,007.00
Total Dr. Salary $18,972.00
1 FTE = 168 Hours
Personnel Information
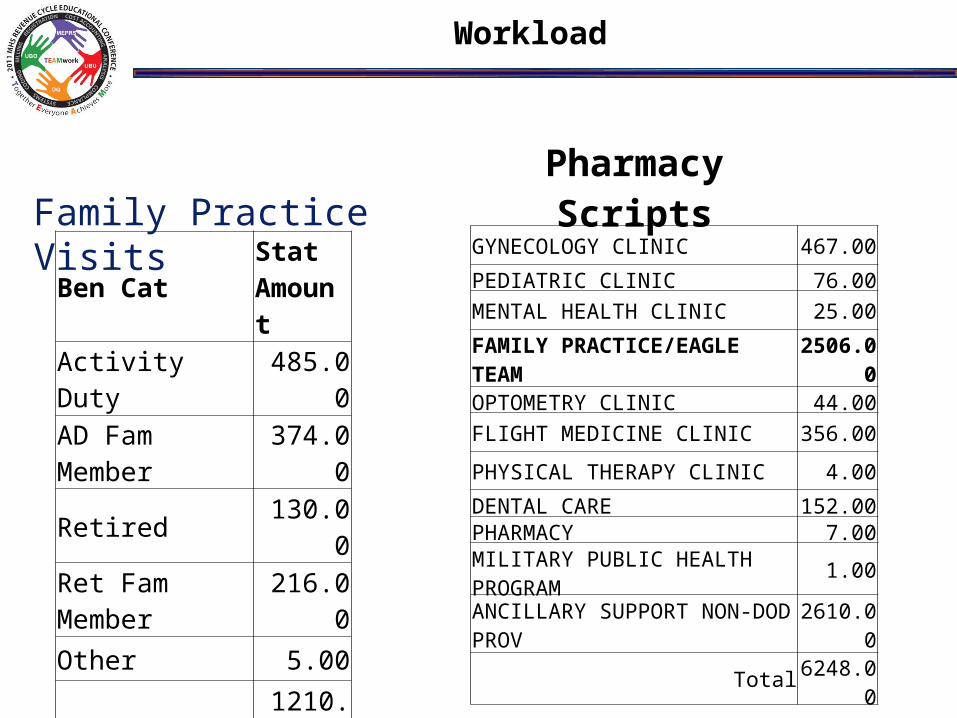
Ben Cat Stat Amount
Activity Duty 485.00
AD Fam Member 374.00
Retired 130.00
Ret Fam Member 216.00
Other 5.00
Total Visits 1210.00
Family Practice VisitsPharmacy Scripts
GYNECOLOGY CLINIC 467.00
PEDIATRIC CLINIC 76.00
MENTAL HEALTH CLINIC 25.00
FAMILY PRACTICE/EAGLE TEAM 2506.00
OPTOMETRY CLINIC 44.00
FLIGHT MEDICINE CLINIC 356.00
PHYSICAL THERAPY CLINIC 4.00
DENTAL CARE 152.00PHARMACY 7.00
MILITARY PUBLIC HEALTH PROGRAM 1.00
ANCILLARY SUPPORT NON-DOD PROV 2610.00
Total 6248.00
Workload

11
Time Accounting
EBAA
CAAA
DBAA
FBIA
EEAA
GFAA
BGAA_DMIS_FF
GBAAEBCA
FCGA
FALA
CODES!! CODES!! CODES!!WHY SO MANY?
HOW ARE THEY USED?

12
Month ProviderFact to Face
Non Face to Face
Non Clinical Clinic Hrs.
E Hours (Support)
G Hours (Readiness)
F hours (Special)
Non avail (Lv, sick, other)
Total Hours
Oct Pokey 0 0 0 0 0 168 0 0 168
Nov Pokey 65 0 0 65 0 103 0 0 168
Dec Pokey 78.5 32 4.5 115 1 0 3 94.5 213.5
Jan Pokey 103 36 4 143 3.5 4 3 50 203.5
Feb Pokey 80 26 2 108 5 2 40 32 187
Each Code Tells a Story
Month ProviderFact to Face
Non Face to Face
Non Clinical Clinic Hrs.
E Hours (Support)
G Hours (Readiness)
F hours (Special)
Non avail (Lv, sick, other)
Total Hours
Oct Jones 177 0 0 177 12 6 0 8 203
Nov Jones 144 10 0 154 3 0 0 56 213
Dec Jones 122 2 2 126 0 0 0 104 230
Jan Jones 87 0 33 120 6 52 0 64 242
Feb Jones 109 14 60 183 3 13 0 72 271
Accurate Time Accounting

13
Charts for Providers
BGAA_FF35%
BGAA_NF10%
BGAA_NC1%
E Hours (Support)
1%
G Hours (Readiness)
29%
F hours (Special)
5%
Non avail (Lv, sick, other)
19%
Dr Pokey Oct-Feb FY10
BGAA_FF55%
BGAA_NF3%
BGAA_NC8%
E Hours (Support)
2%
G Hours (Readiness)
6%
F hours (Special)
0%
Non avail (Lv, sick, other)
26%
Dr. Jones Oct - Feb FY10
14
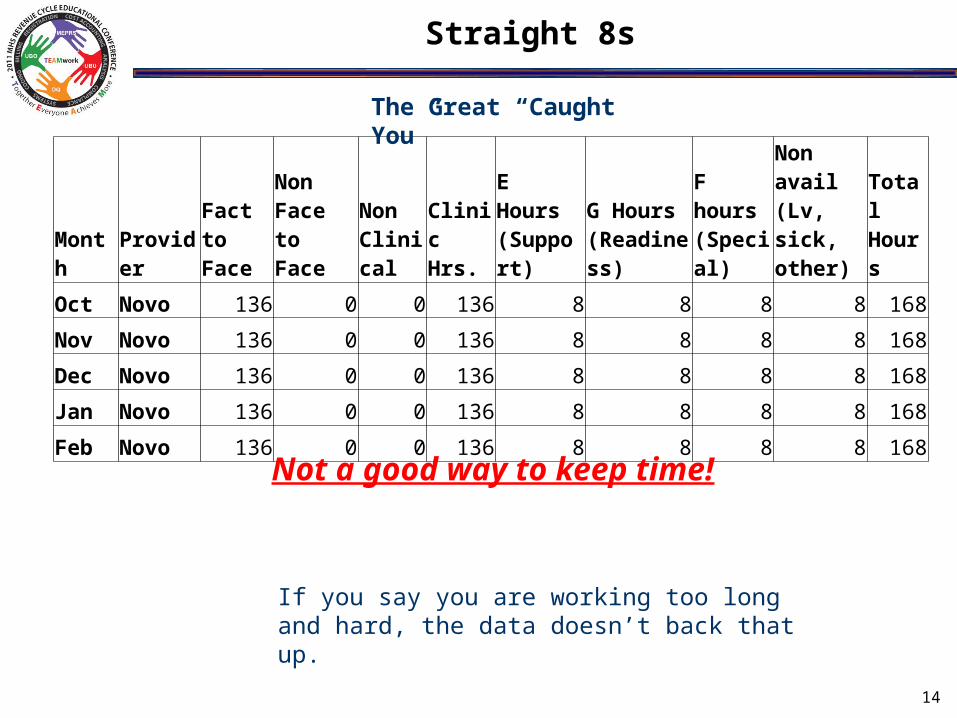
Straight 8s
Month ProviderFact to Face
Non Face to Face
Non Clinical
Clinic Hrs.
E Hours (Support)
G Hours (Readiness)
F hours (Special)
Non avail (Lv, sick, other)
Total Hours
Oct Novo 136 0 0 136 8 8 8 8 168
Nov Novo 136 0 0 136 8 8 8 8 168
Dec Novo 136 0 0 136 8 8 8 8 168
Jan Novo 136 0 0 136 8 8 8 8 168
Feb Novo 136 0 0 136 8 8 8 8 168
The Great “Caught You”
Not a good way to keep time!
If you say you are working too long and hard, the data doesn’t back that up.
Source; DMHRSi & M2
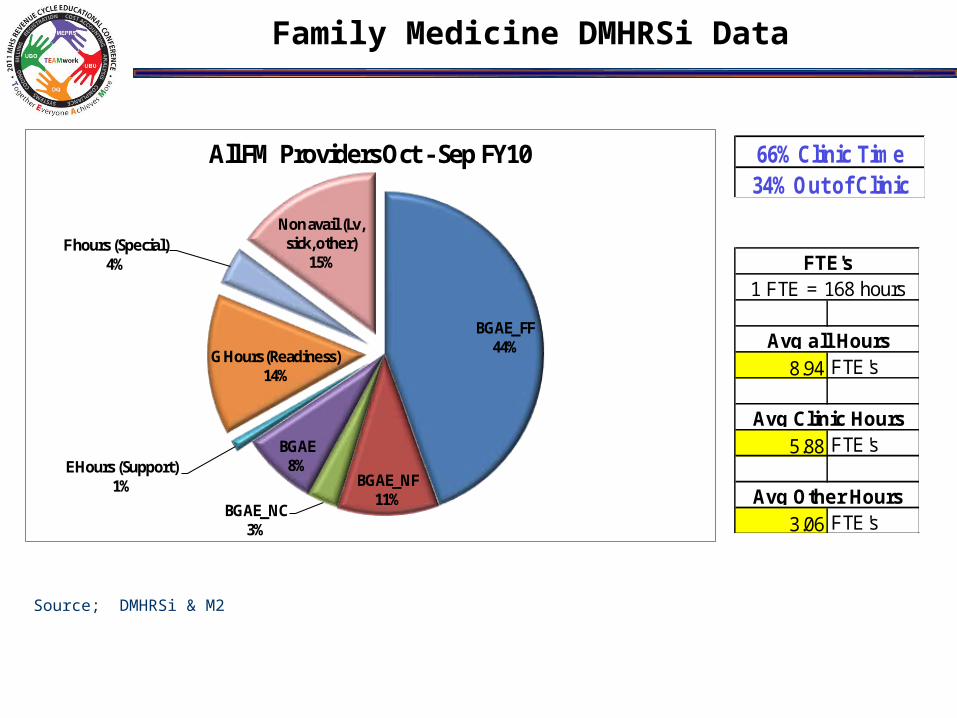
BGAE_FF44%
BGAE_NF11%
BGAE_NC3%
BGAE8%E Hours (Support)
1%
G Hours (Readiness)14%
F hours (Special)4%
Non avail (Lv, sick, other)
15%
All FM Providers Oct - Sep FY10
8.94 FTE's
5.88 FTE's
3.06 FTE'sAvg Other Hours
FTE's1 FTE = 168 hours
Avg all Hours
Avg Clinic Hours
66% Clinic Time34% Out of Clinic
Family Medicine DMHRSi Data
16
Review
To show the different data available in MEPRS including:– Expenses – how your money is being spent– Personnel – where my folks are spending their time– Workload – how much work they are producing
Why so many codes and how they are used How to take a look at time accounting How to identify potential problems How “straight 8s” look in the big picture How to look at an entire clinic of providers’ time

17
Questions
QUESTIONS?