2010/11 road policing programme (rpp) - nz transport agency · 2010/11 road policing programme 8...
TRANSCRIPT
2010/11 Road Policing Programme (RPP)
A variation of the 2009/12 RPP

ISSN 978-0-478-37120-8 (electronic)
The 2010/11 Road Policing Programme (RPP) is a variation of the 2009/12 RPP. It was prepared by the
NZ Transport Agency, and approved by the Minister of Transport in consultation with the Minister of
Police, in accordance with section 18 of the Land Transport Management Act 2003. It contains the
2010/11 police activities to be funded from the National Land Transport Fund which comprise Vote
Police output class 7.
2010/11 Road Policing Programme (RPP) Contents
Part 1: RPP strategic context and road safety progress 1
Part 2: 2010/11 RPP funding and resource allocation 17
Part 3: 2010/11 RPP Police activities and measures 27
Part 4: NZ Police RPP delivery arrangements 67
Part 5: Glossary of terms and additional information 83

Part 1: RPP strategic context and road safety progress

2010/11 Road Policing Programme
2

Part 1: RPP strategic context and road safety progress
3
Contents – Strategic context and road safety progress
1 Introduction.........................................................................................................................................................................5 1.1 The 2010/11 Road Policing Programme (RPP) .........................................................................5
1.2 Legislative provision................................................................................................................5
1.3 Recommended funding summary ............................................................................................5
2 RPP strategic context.......................................................................................................................................................6 2.1 Government Policy Statement ..................................................................................................6
2.2 Safer Journeys – New Zealand’s road safety strategy to 2020 .................................................6
2.3 What Safer Journeys will achieve .............................................................................................7
2.4 Safer Journeys and the RPP .....................................................................................................8
2.5 NZTA strategic priorities .........................................................................................................8
2.6 NZ Police Road Policing Strategy..............................................................................................8
3 Road safety progress ......................................................................................................................................................9 3.1 National overview of road safety progress...............................................................................9
3.2 National and NZ Police district control charts ........................................................................13

2010/11 Road Policing Programme
4

Part 1: RPP strategic context and road safety progress
5
1 Introduction
1.1 The 2010/11 Road Policing Programme (RPP)
The 2010/11 RPP aligns with Safer Journeys, New Zealand’s road safety strategy to 2020, and was
prepared by the New Zealand Transport Agency (NZTA) in consultation with NZ Police and the Ministry of
Transport. The overriding outcome sought by the 2010/11 RPP is a reduction in deaths and injuries on
New Zealand roads and in associated social cost. The Minister of Transport, in consultation with the
Minister of Police, has approved $296.015 million for the delivery of the work programme detailed in this
RPP.
1.2 Legislative provision
The 2010/11 RPP was prepared as a variation to the 2009/12 RPP in accordance with section 18M of the
Land Transport Management Act 2003 (LTMA). It forms part of the 2009/12 RPP, and is funded from the
National Land Transport Fund (NLTF).
1.3 Recommended funding summary
The funding for the 2010/11 RPP, which aligns with Budget 2010 for Vote Police output class 7, is set out
in table 1.1 below. See Part 2 of this RPP for further funding explanation and detail.
Table 1.1 NLTF funding for the 2010/11 RPP as a variation to the 2009/12 RPP
2010/11 ($m)
Current approved 2010/11 funding in the 2009/12 RPP 284.581
2009 wage and salary settlement variation (previously
approved by Minister of Transport) 5.644
Capital charge on property revaluation 3.790
Budget 2010 for Vote Police output class 7 $294.015 New funding for SMART1 technology support 2.000
2010/11 RPP variation $296.015
1 SMART: Secure Mobile Access and Recording Technology

2010/11 Road Policing Programme
6
2 RPP strategic context
2.1 Government Policy Statement
The Government Policy Statement on Land Transport Funding 2009/10 – 2018/19 (GPS) identifies the
importance of reducing deaths and serious injuries as a result of road crashes. The government’s new
road safety strategy, Safer Journeys, expands on this objective.
2.2 Safer Journeys – New Zealand’s road safety strategy to 2020
On 3 March 2010, the Minister of Transport, Hon Steven Joyce released Safer Journeys, a 10-year road
safety strategy designed to reduce the number of people killed and seriously injured on our roads.
The Minister noted that the need for action was clear, because despite substantial progress over the last
30 years New Zealand lagged behind many other countries in road safety. During recent years, about 400
people per annum have been killed on our roads, nearly 2900 people have been seriously injured and
approximately 13,000 New Zealanders have suffered minor injuries as a result of road crashes.
The long-term goal for road safety in New Zealand is set out in the Safer Journeys vision: ‘A safe road system
increasingly free of death and serious injury’. This vision recognises that while we can never prevent all road
crashes from happening, we can ultimately stop crashes resulting in death and serious injury.
To support the vision, Safer Journeys takes a safe system approach to road safety with actions spread
across the entire road system: road use, vehicles, speeds and roads and roadsides. This approach means
working across all elements of the system and recognises that everybody has responsibility for road
safety. It acknowledges the possibility of driver error and human vulnerability to crash forces, and seeks to
minimise trauma severity when crashes do occur. This RPP recognises that road policing plays a critical
role in achieving a safe road system.
2.2.1 Areas of concern and first actions The issues of most concern are the priorities for road safety in New Zealand, and Safer Journeys describes
the actions New Zealand will take to address these issues.
Safer Journeys identifies a number of first actions to start in 2010 that will address four areas of high
concern: increasing the safety of young drivers, reducing alcohol/drug-impaired driving, safer roads and
roadsides, and increasing the safety of motorcycling. The first actions package will also focus on the medium
area of concern – high-risk drivers – through the young drivers and alcohol/drug-impaired driving actions.
Other areas of medium concern are: improving the safety of the light vehicle fleet, safe walking and
cycling, improving the safety of heavy vehicles, reducing the impact of fatigue and addressing distraction.
Continued or emerging focus areas are increasing the level of restraint use and increasing the safety of
older New Zealanders.
2.2.2 Implementing Safer Journeys The actions in Safer Journeys are aimed at addressing the priority areas through a safe system approach.
These actions, along with existing initiatives, are intended to help build a safer road transport system.
A key part of implementing the strategy is the development of a sector-wide action plan which will identify
the actions to be taken, the time line for actions and the responsibility for their implementation. It will also
detail how progress will be monitored and actions evaluated. NZ Police and the NZTA are key contributors
to the development of the action plan.
Part 1: RPP strategic context and road safety progress
7
Implementation will be tailored to respond to the differing needs of New Zealand’s communities and will
increasingly focus on communities at risk while retaining a balance between general and specific road
safety enforcement. Currently, New Zealand’s road system delivers significantly better road safety
outcomes for some population groups, regions and methods of transport than for others. Māori, however,
are almost twice as likely to die or be seriously injured in road crashes as other ethnic populations
because their demographic is over represented with youth, rural and lower socio-economic profiles – the
three key demographic characteristics related to road deaths and injuries. The increased focus on
communities at risk is intended to help address these issues.
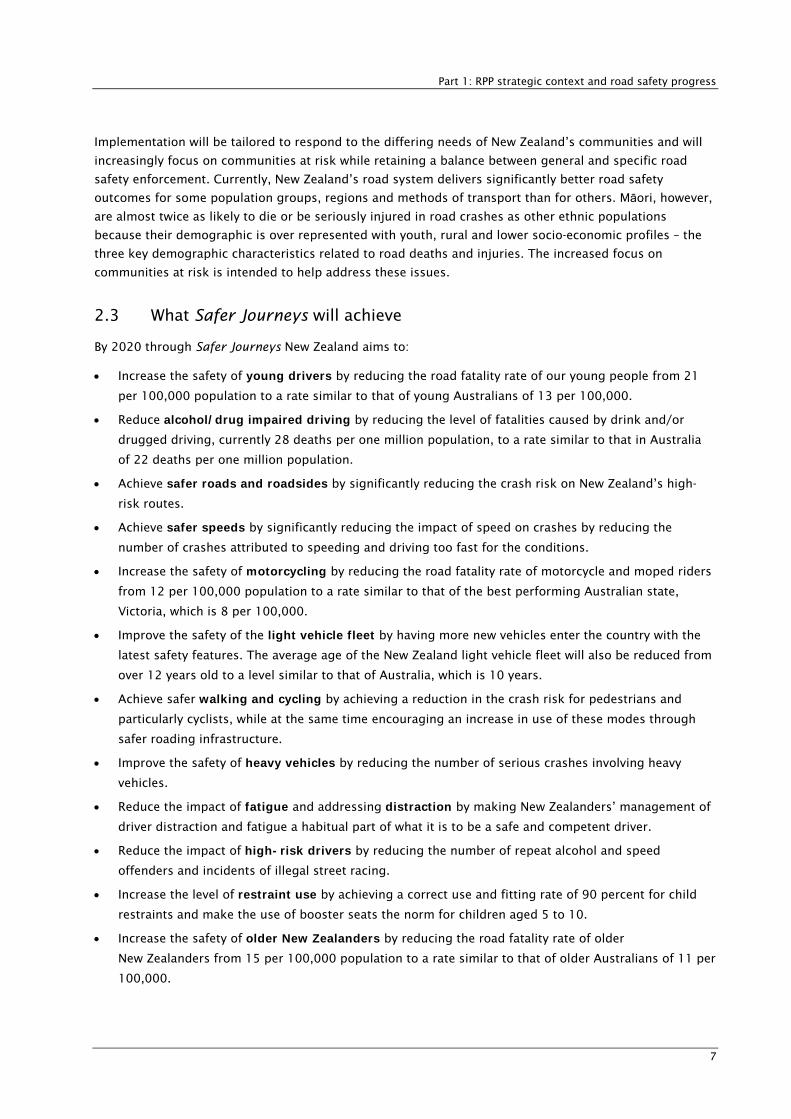
2.3 What Safer Journeys will achieve
By 2020 through Safer Journeys New Zealand aims to:
Increase the safety of young drivers by reducing the road fatality rate of our young people from 21
per 100,000 population to a rate similar to that of young Australians of 13 per 100,000.
Reduce alcohol/drug impaired driving by reducing the level of fatalities caused by drink and/or
drugged driving, currently 28 deaths per one million population, to a rate similar to that in Australia
of 22 deaths per one million population.
Achieve safer roads and roadsides by significantly reducing the crash risk on New Zealand’s high-
risk routes.
Achieve safer speeds by significantly reducing the impact of speed on crashes by reducing the
number of crashes attributed to speeding and driving too fast for the conditions.
Increase the safety of motorcycling by reducing the road fatality rate of motorcycle and moped riders
from 12 per 100,000 population to a rate similar to that of the best performing Australian state,
Victoria, which is 8 per 100,000.
Improve the safety of the light vehicle fleet by having more new vehicles enter the country with the
latest safety features. The average age of the New Zealand light vehicle fleet will also be reduced from
over 12 years old to a level similar to that of Australia, which is 10 years.
Achieve safer walking and cycling by achieving a reduction in the crash risk for pedestrians and
particularly cyclists, while at the same time encouraging an increase in use of these modes through
safer roading infrastructure.
Improve the safety of heavy vehicles by reducing the number of serious crashes involving heavy
vehicles.
Reduce the impact of fatigue and addressing distraction by making New Zealanders’ management of
driver distraction and fatigue a habitual part of what it is to be a safe and competent driver.
Reduce the impact of high-risk drivers by reducing the number of repeat alcohol and speed
offenders and incidents of illegal street racing.
Increase the level of restraint use by achieving a correct use and fitting rate of 90 percent for child
restraints and make the use of booster seats the norm for children aged 5 to 10.
Increase the safety of older New Zealanders by reducing the road fatality rate of older
New Zealanders from 15 per 100,000 population to a rate similar to that of older Australians of 11 per
100,000.
2010/11 Road Policing Programme
8
2.4 Safer Journeys and the RPP
The 2010/11 RPP is a first step towards changing the direction of the RPP to support the Safer Journeys
vision of ‘a safe road system increasingly free of death and serious injury’.
In particular, the high priority given to young drivers and motorcyclists in Safer Journeys has been
recognised by the creation of two new RPP activities to directly address these issues, namely ‘young driver
safety' and ‘motorcycling safety’. Previously these high-risk road users were addressed as part of broader
road policing activities. Now, with increased transparency, the safety of these road users will be enhanced.
The rationale for the creation and reallocation of funds to the young driver safety and motorcycling safety
activities is based on crashes from 2007 to 2009 and the percentage of risk associated with these
drivers/riders – as evidenced in the baseline activities of speed control, drinking or drugged driver control,
restraint device control and visible road safety and general enforcement. To this end a proportion of
funding and associated indicative Police FTEs has been reallocated to the new activities. In addition, some
funding has been moved from restraints to drinking or drugged driver control, because while restraints
are an area of continuing concern in Safer Journeys, alcohol use is a significant factor among fatally
injured people not wearing safety belts.
In addition, the NZ Police RPP work programme has been restructured to focus on the outcomes Safer
Journeys seeks to achieve. This has involved realigning activities and redeveloping the performance and
reporting framework.
The NZTA, the Ministry of Transport and NZ Police are together focused on ensuring that effective road
safety interventions are progressed. To that end, Safer Journeys will be subject to further analysis in
2010/11 in order to maximise implementation through the RPP, and ensure funding remains available
within the Board-approved allocation from the National Land Transport Programme to progress specific
Safer Journeys initiatives that require funding and cannot be accommodated within baseline.
2.5 NZTA strategic priorities
Transport-related incidents remain one of the main causes of accidental loss of life in New Zealand and are
a leading cause of death for children and young adults – and the majority of these deaths and serious
injuries occur on roads.
Consequently, improving road safety is one of the NZTA’s five priority areas for its work programme.
2.6 NZ Police Road Policing Strategy
NZ Police's Road Policing Strategy to 2010 sets out the road policing focus on the ‘fatal five’ namely:
1 speeding
2 drink/drug driving
3 restraint
4 dangerous/careless driving
5 high-risk drivers.
This strategy is due for renewal by the end of 2010. An integral part of the new strategy will be to align
the key areas of focus for road policing with Safer Journeys.

Part 1: RPP strategic context and road safety progress
9
3 Road safety progress
3.1 National overview of road safety progress
The following pages contain a brief overview of road safety outcome trends in New Zealand. In addition to
road deaths and days spent in hospital as a result of road crashes, the intermediate outcome trends for
speed, alcohol and restraint use are highlighted.
Since 1990, road deaths and days in hospital have dropped by about 50 percent (figure 1.1). Over the
same period the number of motor vehicles on our roads has increased by 50 percent. Nevertheless, road
traffic crashes result in the loss of more years of life than any other source of injury in New Zealand and
are the leading cause of death for children. Current figures equate to roughly one person being killed
every 23 hours and one person being admitted to hospital every 65 minutes. Looking at the trends since
the beginning of 2001 (figure 1.2), there has been no further reduction in the number of days spent in
hospital. Overall since January 2001, road deaths have decreased by 20 percent.
Figure 1.1 Road deaths, days in hospital, vehicles and population indexed to January 1990
-60%
-40%
-20%
0%
20%
40%
60%
Pe
rce
nta
ge
ch
ang
e s
ince
Jan
199
0
Year/month
Vehicle fleet
Deaths
Days stay in hospital
Population
Figure 1.2 Road deaths, days in hospital and vehicles indexed to January 2001
-40%
-30%
-20%
-10%
0%
10%
20%
30%
40%
Pe
rce
nta
ge
ch
ang
e s
ince
Jan
200
1
Year/month
Vehicle fleet
Deaths
Days stay in hospital
2010/11 Road Policing Programme
10
Regarding regional road safety outcomes, table 1.2 displays the 2010 goals (as per the Road Safety to
2010 strategy) for fatalities and hospitalisations of more than one day, and progress towards achieving
these as at 2009.
Table 1.2 Regional road safety outcomes (2009) and goals (2010)
Fatalities and hospitalisations of more than 1 day Region
2009 2010 Goal (not exceeding)
Northland 177 150
Auckland 792 690
Waikato 391 330
Bay of Plenty 274 210
Gisborne 49 30
Hawke’s Bay 121 110
Taranaki 83 60
Manawatu/Wanganui 182 190
Wellington 185 150
Nelson/Marlborough 111 60
West Coast 49 30
Canterbury 354 300
Otago 161 110
Southland 76 70
3.1.1 Drink-driving In terms of alcohol-related outcomes (figure 1.3), both the number and percentage of fatal crashes where
alcohol was cited as a contributing factor dropped markedly during the 1990s. In the early 1990s, more
than 250 people died each year in crashes where alcohol was a contributing factor. This was 40 percent of
all road deaths. The number has now dropped to about 120 deaths a year, just over 30 percent of all road
deaths. There has been no improvement in alcohol-related crashes since 1999; in fact the percentage of
fatal crashes involving alcohol has increased over that time.
Part 1: RPP strategic context and road safety progress
11
Figure 1.3 Road deaths where alcohol was a contributing factor 1990 to 2009
3.1.2 Young drivers The 15–24, 35–44 and 45–54 age groups have experienced rising numbers of road deaths in the first
quarter of 2010. To the end of the third quarter in 2009, serious injury levels among the 15–24 age group
remain prominent, as shown in figures 1.4 and 1.5 below.
Figures 1.4 and 1.5 Road deaths and serious injuries by age group
0
20
40
60
80
100
120
140
160
00 01 02 03 04 05 06 07 08 09 10
Ro
ad d
eat
hs
Year / Quarter
Road deaths by age group
0-14
15-24
25-34
35-44
45-54
55-64
65-74
75+
0
50
100
150
200
250
300
350
1990 1991 1992 1993 1994 1995 1996 1997 1998 1999 2000 2001 2002 2003 2004 2005 2006 2007 2008 2009
Year
Deaths
0
5
10
15
20
25
30
35
40
45
50
% of deaths
Deaths
Percent
2010/11 Road Policing Programme
12
0
100
200
300
400
500
600
700
800
900
1000
00 01 02 03 04 05 06 07 08 09
Po
lice
re
po
rte
d s
eri
ou
s in
juri
es
Year / Quarter
Police reported serious injuries by age group
0-14
15-24
25-34
35-44
45-54
55-64
65-74
75+
3.1.3 Speed Regarding speed-related outcomes, the percentage of car drivers choosing to travel above the speed limit
has reduced since about 2000 (figure 1.6). On urban roads the percentage above the limit has dropped
from 80 percent in 1996 to nearly 60 percent in 2009, and on the open road it has dropped from about
55 percent to 30 percent during the same years.
Figure 1.6 Percentage of vehicles travelling over the speed limit 1996 to 2009 (unimpeded speeds)
0
20
40
60
80
100
1996 1997 1998 1999 2000 2001 2002 2003 2004 2005 2006 2007 2008 2009
Year
Pe
rce
nt
Urban -50km/h
Open road -100km/h

Part 1: RPP strategic context and road safety progress
13
3.1.4 Motorcycling safety Motorcyclist deaths and injuries dropped significantly during the 1990s. However, from 2000 there has
been no further decrease and since 2005 deaths and injuries have risen. The number of motorcycle
casualties in 2009 was double the total in 2000. This is particularly noticeable for motorcyclists aged over
40 years – see figure 1.7.
Figure 1.7 Motorcycle deaths and injuries by age group
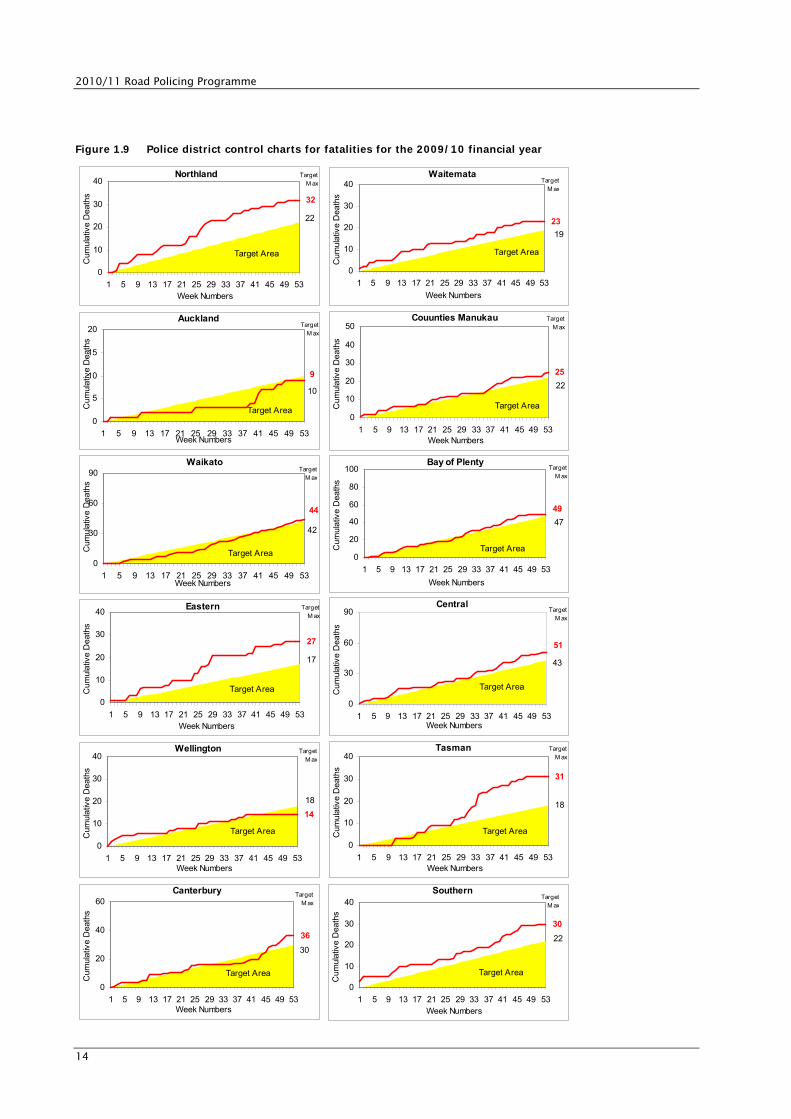
3.2 National and NZ Police district control charts
Figures 1.8 and 1.9 contain control charts which display road safety deaths nationally and by NZ Police
district, respectively, for the 2009/10 year. Control charts monitor road safety outcome performance and
are used by NZ Police to monitor Police district progress. They illustrate how the nation as a whole and
individual Police districts are performing in relation to the targets specified in the Road Safety to 2010
strategy.
Figure 1.8 National control chart for fatalities for the 2009/10 financial year
371
0
100
200
300
400
500
600
1 5 9 13 17 21 25 29 33 37 41 45 49 53Week Numbers
Cum
ulat
ive
Dea
ths
310
Target Area
TargetM ax
0
500
1000
1500
2000
2500
1980
1982
1984
1986
1988
1990
1992
1994
1996
1998
2000
2002
2004
2006
2008
Year
Dea
ths
and
in
juri
es
15-19
20-24
25-29
30-39
40+
2010/11 Road Policing Programme
14
Figure 1.9 Police district control charts for fatalities for the 2009/10 financial year
32
0
10
20
30
40
1 5 9 13 17 21 25 29 33 37 41 45 49 53Week Numbers
Cum
ulat
ive
Dea
ths
Target Area
TargetM ax
22
Northland
23
0
10
20
30
40
1 5 9 13 17 21 25 29 33 37 41 45 49 53
Week Numbers
Cum
ulat
ive
Dea
ths
Target Area
TargetM ax
19
Waitemata
9
0
5
10
15
20
1 5 9 13 17 21 25 29 33 37 41 45 49 53Week Numbers
Cum
ulat
ive
Dea
ths
Target Area
TargetM ax
10
Auckland
25
0
10
20
30
40
50
1 5 9 13 17 21 25 29 33 37 41 45 49 53Week Numbers
Cum
ulat
ive
Dea
ths
Target Area
TargetM ax
22
Couunties Manukau
44
0
30
60
90
1 5 9 13 17 21 25 29 33 37 41 45 49 53Week Numbers
Cum
ulat
ive
Dea
ths
Target Area
TargetM ax
42
Waikato
49
0
20
40
60
80
100
1 5 9 13 17 21 25 29 33 37 41 45 49 53
Week Numbers
Cum
ulat
ive
Dea
ths
Target Area
TargetM ax
47
Bay of Plenty
27
0
10
20
30
40
1 5 9 13 17 21 25 29 33 37 41 45 49 53Week Numbers
Cum
ulat
ive
Dea
ths
Target Area
TargetM ax
17
Eastern
51
0
30
60
90
1 5 9 13 17 21 25 29 33 37 41 45 49 53Week Numbers
Cum
ulat
ive
Dea
ths
Target Area
TargetM ax
43
Central
14
0
10
20
30
40
1 5 9 13 17 21 25 29 33 37 41 45 49 53Week Numbers
Cum
ulat
ive
Dea
ths
Target Area
TargetM ax
18
Wellington
31
0
10
20
30
40
1 5 9 13 17 21 25 29 33 37 41 45 49 53Week Numbers
Cum
ulat
ive
Dea
ths
Target Area
TargetM ax
18
Tasman
36
0
20
40
60
1 5 9 13 17 21 25 29 33 37 41 45 49 53Week Numbers
Cum
ulat
ive
Dea
ths
Target Area
TargetM ax
30
Canterbury
30
0
10
20
30
40
1 5 9 13 17 21 25 29 33 37 41 45 49 53Week Numbers
Cum
ulat
ive
Dea
ths
Target Area
TargetM ax
22
Southern

Part 1: RPP strategic context and road safety progress
15
3.2.1 Road safety outcomes and intermediate outcomes Table 1.3 provides a summary of road safety outcomes and intermediate outcomes achieved over the last
eight calendar years.
Table 1.3 Road safety outcomes and intermediate outcomes 2002 to 2009 Safety outcomes 2002 2003 2004 2005 2006 2007 2008 2009 Social cost** (2001 prices, $b) 2.72 2.80 2.74 2.73 2.75 2.89 2.63 2.60
Number of road deaths 405 461 435 405 393 421 365 384
per billion vehicle-kilometres 11.0 12.1 11.2 10.3 9.9 10.5 9.2 9.6
per 10,000 vehicles 1.5 1.6 1.5 1.3 1.3 1.3 1.1 1.2
per 100,000 population 10.3 11.5 10.7 9.9 9.5 10.0 8.6 8.9
Fatal crashes 365 405 375 341 350 375 330 337
per 10,000 vehicle 1.3 1.4 1.3 1.1 1.1 1.2 1.0 1.0
per 100,000 population 9.3 10.1 9.2 8.3 8.5 8.9 7.7 7.8
Reported serious injuries 2,600 2,578 2,491 2,531 2,629 2,654 2,531 2,425
All reported injuries 13,918 14,372 13,890 14,451 15,174 16,013 15,174 14,541
per 10,000 vehicle 51 51 48 48 49 50 47 45
per 100,000 population 353 358 342 353 367 379 356 341
Number hospitalised (discharges) 6,530 6,540 6,580 7,210 7,680 7,440 7,560 7,530
Hospitalised, more than 1 day* 2,750 2,720 2,710 2,860 3,020 3,060 2,880 2,660
Hospitalised, more than 3 days* 1,740 1,700 1,700 1,840 1,900 1,990 1,880 1,720
Cyclists, pedestrians killed or hospitalised
(more than 1 day) 570 550 526 526 571 525 519 480
Behaviour measures 2002 2003 2004 2005 2006 2007 2008 2009 Number of drivers killed with excess alcohol 60 70 69 58 54 65 59 66
Proportion of drivers killed with excess
alcohol 24% 27% 27% 25% 24% 27% 28% 28%
Proportion of fatal crashes with driver
alcohol as contributor 26% 31% 31% 29% 28% 31% 31% 34%
Proportion of fatal crashes with excess
speed as contributor 30% 35% 37% 33% 31% 31% 34% 30%
Speed, rural winter mean (km/h) 99.1 98.0 97.8 97.1 96.4 96.3 96.6 96.3
Speed, percentage exceeding 100km/h 43% 39% 39% 36% 32% 29% 30% 29%
Speed, rural winter 85th percentile (km/h) 107 105 105 104 103 103 103 103
Speed, urban mean (km/h) 54.3 53.7 52.9 52.4 52.6 52.5 52.6 52.3
Speed, percentage exceeding 60km/h 76% 72% 67% 63% 63% 63% 64% 61%
Speed, urban 85th percentile (km/h) 61 60 58 58 58 58 58 57
Safety belts (adult): front 92% 92% 94% 95% 95% 95% 95% 95%
Safety belts (adult): rear 78% 81% 86% 86% 89% 87% 87% 87%
Children restrained: 0–14, all 94% 96% 97% 94% 96% 94% 97% 97%
Child restraints used, 0–4 yrs 86% 86% 87% 89% 91% 91% 90% 91%
Cycle helmets, weekday 89% 89% 92% 91% 94% 92% 92% 92%
*includes only the first stay in hospital.
**2001 prices, and includes adjustment for changes in reporting rate, and excludes property damage only crashes.

2010/11 Road Policing Programme
16

Part 2: 2010/11 RPP funding and resource allocation
2010/11 Road Policing Programme
18
Part 2: RPP funding and resource allocation
19
Contents – Funding and resource allocation
1 2010/11 RPP funding...................................................................................................................................................21
1.1 New funding..........................................................................................................................21 1.2 Formation of young driver safety and motorcycling safety activities......................................21 1.3 Indicative allocation of Police FTEs by regional council area, Police area and Police district ...22
2 Police output class 7: Road Safety Programme ................................................................................................23
2.1 2010/11 Police hourly rate....................................................................................................23 2.2 Road policing strategic resource allocation model.................................................................23
3 2010/11 RPP funding by activities and FTEs....................................................................................................24
3.1 Pie graph illustrating 2010/11 RPP funding percentage by RPP activity .................................25

2010/11 Road Policing Programme
20

Part 2: RPP funding and resource allocation
21
1 2010/11 RPP funding
1.1 New funding
1.1.1 Implementing SMART technology The 2010/11 RPP contribution to SMART provides for the following: $1 million for the purpose of
automating Police data capture and processing so that when SMART devices are used at the roadside, data
from these devices does not need to be manually entered at the Police Infringement Bureau (PIB); and to
support the operating costs associated with 100 handheld devices for the Highway Patrol. The second $1
million is operational funding to support Police data capture and transfer to the NZTA Roadside Inspection
Database for CVIU staff. Thus the benefits accrue to NZ Police as well as to the NZTA as SMART is an
important enabler of NZTA’s Operator Rating System.
The benefits of implementing SMART include:
improved accuracy of the enforcement process
immediate increase in productivity and visibility as officers spend less time carrying out administration
tasks that are currently done manually
information processing efficiencies which reduce the time at the roadside and subsequent risk to
officer safety
data integrity improvement which will reduce backend administration support and infrastructure and
result in less notices being rejected by PIB
improved intelligence information and data quality for reporting purposes.
1.1.2 Capital charge on property revaluation In accordance with generally accepted accounting practices, NZ Police’s recent revaluation of its property
portfolio attracted capital charge on a higher value, and the resulting additional costs have been
apportioned across all Police output classes, including Road Safety Programme output class 7, which is the
RPP. This resulted in an additional $3.79 million per annum being funded from the NLTF.
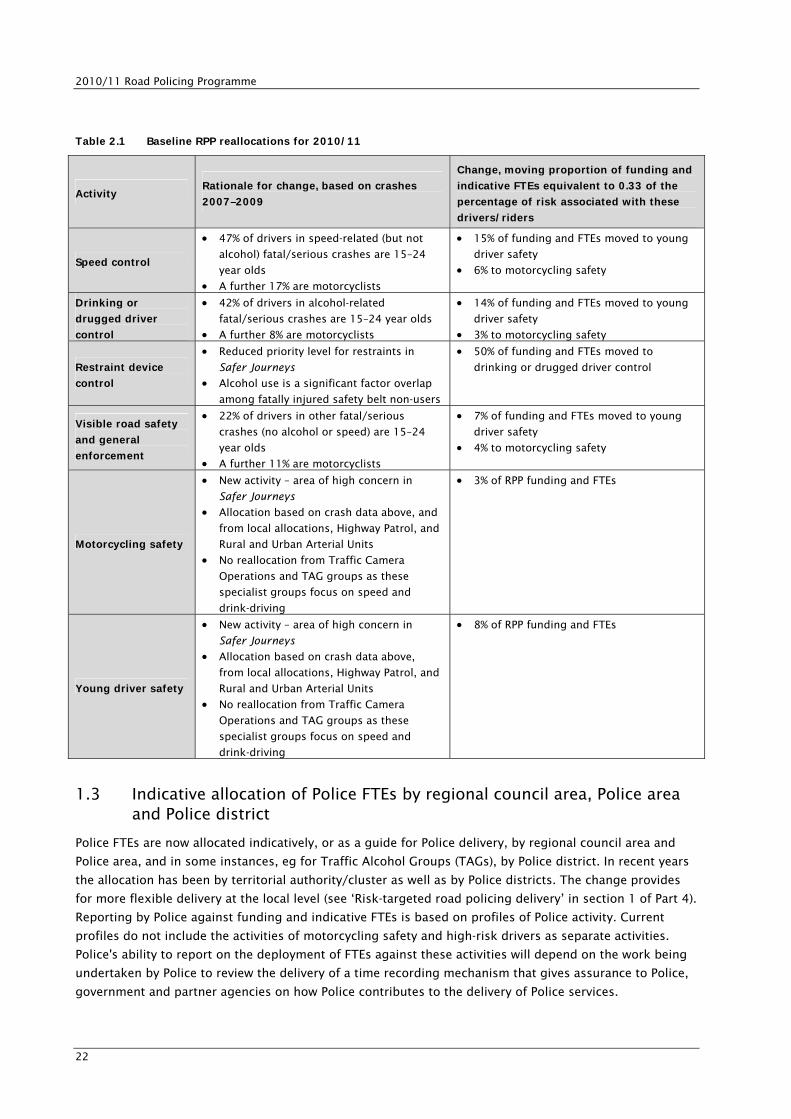
1.2 Formation of young driver safety and motorcycling safety activities
The rationale for the creation of the young driver safety and motorcycling safety activities is based on
crashes during the 2007 to 2009 years and the percentage of risk associated with these drivers/riders – as
evidenced in the baseline activities of speed control, drinking or drugged driver control, restraint device
control and visible road safety and general enforcement. To this end a proportion of funding, and
associated Police FTEs, equivalent to 0.33 of the percentage of risk, previously allocated to these activities,
has been reallocated to the two new activities as summarised in table 2.1 below and the context is
provided in Part 3, section 1.2, on page 32.
The reallocation of funding, and associated indicative FTEs, are within Police and regional council areas, so
that the total resource for each area or region has remained at the same level as for 2009/10 (see Part 3,
pages 57 to 65).
2010/11 Road Policing Programme
22
Table 2.1 Baseline RPP reallocations for 2010/11
Activity Rationale for change, based on crashes 2007–2009
Change, moving proportion of funding and indicative FTEs equivalent to 0.33 of the percentage of risk associated with these drivers/riders
Speed control 47% of drivers in speed-related (but not
alcohol) fatal/serious crashes are 15–24
year olds
A further 17% are motorcyclists
15% of funding and FTEs moved to young
driver safety
6% to motorcycling safety
Drinking or drugged driver control
42% of drivers in alcohol-related
fatal/serious crashes are 15–24 year olds
A further 8% are motorcyclists
14% of funding and FTEs moved to young
driver safety
3% to motorcycling safety
Restraint device control
Reduced priority level for restraints in
Safer Journeys
Alcohol use is a significant factor overlap
among fatally injured safety belt non-users
50% of funding and FTEs moved to
drinking or drugged driver control
Visible road safety and general enforcement
22% of drivers in other fatal/serious
crashes (no alcohol or speed) are 15–24
year olds
A further 11% are motorcyclists
7% of funding and FTEs moved to young
driver safety
4% to motorcycling safety
Motorcycling safety
New activity – area of high concern in
Safer Journeys
Allocation based on crash data above, and
from local allocations, Highway Patrol, and
Rural and Urban Arterial Units
No reallocation from Traffic Camera
Operations and TAG groups as these
specialist groups focus on speed and
drink-driving
3% of RPP funding and FTEs
Young driver safety
New activity – area of high concern in
Safer Journeys
Allocation based on crash data above,
from local allocations, Highway Patrol, and
Rural and Urban Arterial Units
No reallocation from Traffic Camera
Operations and TAG groups as these
specialist groups focus on speed and
drink-driving
8% of RPP funding and FTEs
1.3 Indicative allocation of Police FTEs by regional council area, Police area and Police district
Police FTEs are now allocated indicatively, or as a guide for Police delivery, by regional council area and
Police area, and in some instances, eg for Traffic Alcohol Groups (TAGs), by Police district. In recent years
the allocation has been by territorial authority/cluster as well as by Police districts. The change provides
for more flexible delivery at the local level (see ‘Risk-targeted road policing delivery’ in section 1 of Part 4).
Reporting by Police against funding and indicative FTEs is based on profiles of Police activity. Current
profiles do not include the activities of motorcycling safety and high-risk drivers as separate activities.
Police's ability to report on the deployment of FTEs against these activities will depend on the work being
undertaken by Police to review the delivery of a time recording mechanism that gives assurance to Police,
government and partner agencies on how Police contributes to the delivery of Police services.
Part 2: RPP funding and resource allocation
23
2 Police output class 7: Road Safety Programme
Police delivers road policing activities in accordance with its Statement of Intent output class 7, namely
Road Safety Programme. Within this output class Police delivers the proactive road policing activities of
speed control, drink and/or drugged driver control, motorcycling safety, young driver safety, restraint
device control and visible road safety and general enforcement, along with commercial vehicle
investigation and road user charges enforcement, crash attendance and investigation, traffic management,
resolutions (ie sanctions, prosecutions and court orders), Police community services and school road
safety education.
2.1 2010/11 Police hourly rate
The overall 2010/11 hourly rate for Police is $111.83 per hour. This is calculated by dividing the total
funding ($296.015 million) by the total hours (2,647,080), which equates to 1,762.6 full-time equivalents
(FTEs) where one FTE equals 1500 productive hours. Included in the hourly rate is funding for 338 FTE
support staff, for NZ Police road policing, as described on page 52 and listed in table 3.1.
This hourly rate includes all overheads such as personnel costs, equipment maintenance, ‘booze buses’,
the calibration of speed-measuring and vehicle-weighing devices, the Police Infringement Bureau (PIB)
(which includes the Traffic Camera Office), road policing management and strategic capability,
depreciation (which funds capital items such as Police vehicles and other equipment) and a proportional
contribution for Police buildings and office equipment. In other words, built into the cost of an hour of
activity are both the direct costs of road policing, and the indirect costs such as vehicles, breath-screening
tests, corporate overheads (eg a share of IT costs and radio network costs) and headquarters activity (eg
payroll services, human resources and financial services).
Police activities for road policing are provided by constabulary staff, authorised officers and Police
employees. Police employees without constabulary powers are, in the main, office-based rather than on-
road. They are involved in activities such as the production of infringement notices in the PIB, the
provision of communication services in Communication Centres, the operation of speed cameras and the
provision of support for strategy, intelligence, performance, planning, public relations and administrative
support.
In summary, Police allocations are in terms of funding and FTE Police personnel. One FTE equals 1500
hours of productive (as opposed to support) activity per annum, which is in addition to training, leave and
other non-productive hours. Funding for support personnel is funded as an overhead on the FTE costs.
This arrangement provides for NZ Police to manage its road policing funded personnel appropriately.
2.2 Road policing strategic resource allocation model
A resource allocation model was developed and has been applied to NZ Police road policing strategic
activities during recent years. Strategic road policing activities are those that target road safety risk
directly, and primarily comprise the enforcement of speed, drink/drugged driving, restraint wearing and
visible road safety and general enforcement (see descriptions in Part 3). The model was developed to
facilitate the distribution of these activities throughout the country in order to ensure that the resources
were allocated to the areas where the greatest benefits would be achieved within the constraints of both
the allocation model and available funding. The model was used to provide guidance for the allocation of
strategic road policing time by both activity type and road type on the basis of territorial authority
geographic areas. In this RPP the model has been applied by activity type.

2010/11 Road Policing Programme
24
3 2010/11 RPP funding by activities and FTEs
Table 2.2 sets out 2010/11 RPP funding by NZ Police road policing activities and indicative FTEs.
Table 2.2 2010/11 RPP funding by activities and FTEs
Activity category and activity 2010/11
Police funding ($000)
2010/11 FTE (indicative)
Strategic road policing
Speed control1 55.571 331.3
Drinking or drugged driver control 69.964 417.1
Young driver safety 24.441 145.7
Motorcycling safety 8.389 50.0
Visible road safety and general enforcement 42.476 253.2
Commercial vehicle investigation and road user charges enforcement 18.136 106.0
Restraint device control 7.423 44.3
Strategic road policing sub-totals 226.400 1,347.6 Road policing incident and emergency management Crash attendance and investigation 36.412 217.1
Traffic management 12.526 74.7
Road policing incident and emergency management sub-totals 48.938 291.8 Resolutions Resolutions 8.370 49.9
Resolutions sub-totals 8.370 49.9 Road policing community Police community services 5.256 31.3
School road safety education 7.051 42.0
Road policing community sub-totals 12.307 73.3 Recommended expenditure and FTEs totals: 296.0152 1,762.63 Note: Highway Patrol delivery, speed camera person hours (119,000) and enhanced alcohol CBT project delivery are, along with delivery by other NZ Police units, included in the activities listed above.
1 This activity incorporates 119,000 programmed traffic camera person hours. A minimum of 100,953 traffic camera hours has also been programmed.
2 Revenue, offsetting other costs, which is applicable to the NZ Police activities in this programme for the 2010/11 year, and is to be received by the Commissioner from sources other than the NLTF, is estimated to total $2.51 million.
3 In addition, 338 FTEs provide support services ranging from road policing strategic capability to communication centre operations – refer table 3.1 on page 52.
Part 2: RPP funding and resource allocation
25
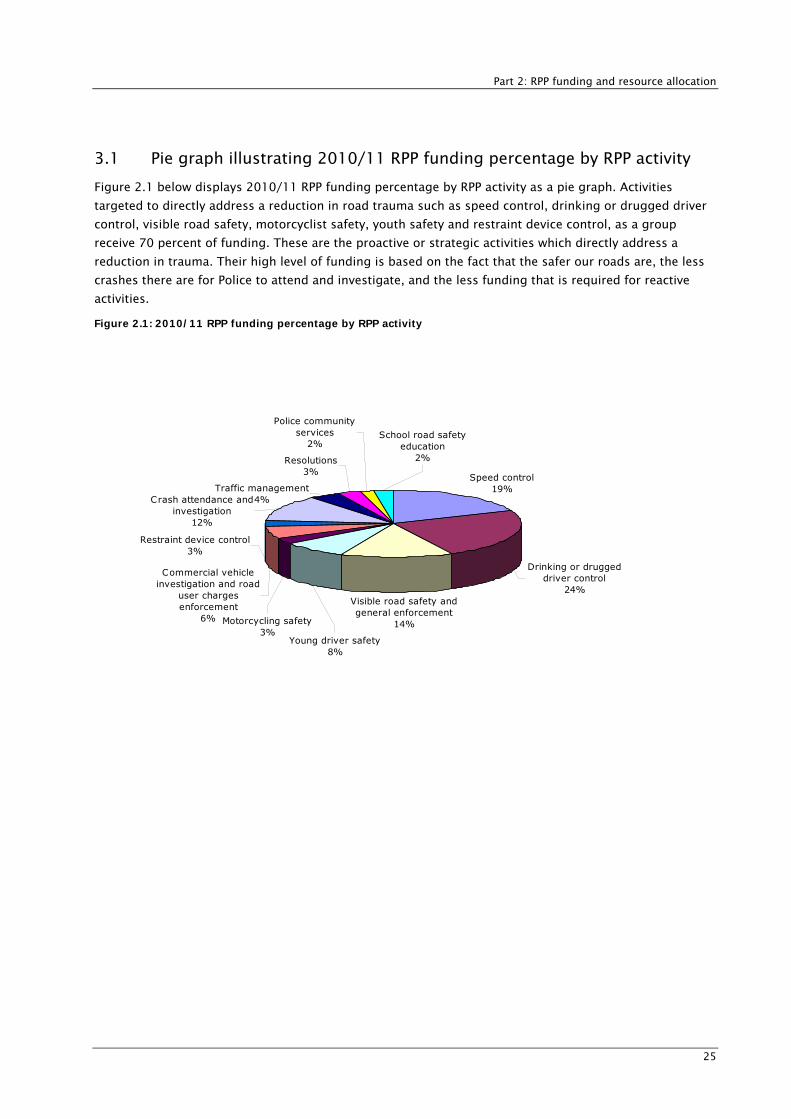
3.1 Pie graph illustrating 2010/11 RPP funding percentage by RPP activity
Figure 2.1 below displays 2010/11 RPP funding percentage by RPP activity as a pie graph. Activities
targeted to directly address a reduction in road trauma such as speed control, drinking or drugged driver
control, visible road safety, motorcyclist safety, youth safety and restraint device control, as a group
receive 70 percent of funding. These are the proactive or strategic activities which directly address a
reduction in trauma. Their high level of funding is based on the fact that the safer our roads are, the less
crashes there are for Police to attend and investigate, and the less funding that is required for reactive
activities.
Figure 2.1: 2010/11 RPP funding percentage by RPP activity
Speed control19%
Visible road safety and general enforcement
14%
Traffic management4%
Resolutions3%
Police community services
2%
Crash attendance and investigation
12%
Drinking or drugged driver control
24%
Commercial vehicle investigation and road
user charges enforcement
6%
Restraint device control3%
Motorcycling safety3%
Young driver safety8%
School road safety education
2%

2010/11 Road Policing Programme
26

Part 3: 2010/11 RPP Police activities and measures

2010/11 Road Policing Programme
28
Part 3: RPP Police activities and measures
29
Contents – Police activities and measures
1 Introduction......................................................................................................................................................................31 1.1 Safer Journeys commitments – an inter-agency approach .....................................................31
1.2 Links between Safer Journeys, the safe system approach and road policing activities ...........32
2 Achieving Safer Journeys through road safety action planning and Police tasking and coordination .....................................................................................................................................................................33
3 Safer Journeys – areas of high concern ...............................................................................................................34 3.1 Alcohol and drugs .................................................................................................................34
3.2 Young drivers........................................................................................................................35
3.3 Speed....................................................................................................................................36
3.4 Motorcycling .........................................................................................................................37
3.5 Roads and roadsides .............................................................................................................39
4 Safer Journeys – areas of medium concern........................................................................................................40 4.1 High-risk drivers....................................................................................................................40
4.2 Heavy vehicles.......................................................................................................................41
4.3 Light vehicles ........................................................................................................................43
4.4 Fatigue and distraction..........................................................................................................44
4.5 Walking and cycling (visible road safety and general enforcement)........................................45
4.6 Walking and cycling (school road safety education – primary schools) and young drivers
(school road safety education – secondary schools)...............................................................46
5 Safer Journeys – areas of continued and emerging focus...........................................................................48 5.1 Restraints..............................................................................................................................48
5.2 Older road users ...................................................................................................................49
6 Other road policing activities (non Safer Journeys priority area)............................................................50 6.1 Crash attendance and investigation.......................................................................................50
6.2 Road policing resolutions......................................................................................................51
7 Planning and delivery of road policing resources ..........................................................................................52 7.1 Coordinating delivery ............................................................................................................52
7.2 Support resources .................................................................................................................52
7.3 Categorisation of Police activities..........................................................................................53
7.4 Indicative allocations of Police FTEs by regional council area and Police area ........................56
8 RPP reporting and monitoring .................................................................................................................................66 8.1 The format and content of quarterly reports .........................................................................66
8.2 Financial reporting and year-end overview.............................................................................66
8.3 Performance measurement....................................................................................................66

2010/11 Road Policing Programme
30
Part 3: RPP Police activities and measures
31
1 Introduction
Part 3 of the Road Policing Programme (RPP) provides details of NZ Police road policing activities and
measures for the 2010/11 year.
1.1 Safer Journeys commitments – an inter-agency approach
The success of Safer Journeys is dependent on the cooperation, collaboration and commitment of all
sector partners. In order to ensure an interagency approach is taken, working groups for each of the four
key aspects of the safe system approach have been established. The following table sets out the lead and
participating agencies for each group.
NZ Police NZTA ACC LGNZ
Safer roads and roadsides
Police will actively
participate in the
National Road Safety
Management Group
(NRSMG) Working
Group on Safe Roads
and Roadsides to
develop action plans
to support Safer
Journeys
NZTA will jointly lead
the NRSMG Working
Group on Safe Roads
and Roadsides to
develop action plans
to support Safer
Journeys
ACC will actively
participate in the
NRSMG Working Group
on Safe Roads and
Roadsides to develop
action plans to
support Safer
Journeys
Local Government NZ
(LGNZ) will jointly lead the NRSMG
Working Group on
Safe Roads and
Roadsides to develop
action plans to
support Safer
Journeys
Safer speeds Police will actively
participate in the
NRSMG Working Group
on Safe Speeds to
develop action plans
to support Safer
Journeys
NZTA will actively
participate in the
NRSMG Working Group
on Safe Speeds to
develop action plans
to support Safer
Journeys
ACC will actively lead
the NRSMG Working
Group on Safe Speeds
to develop action
plans to support Safer
Journeys
LGNZ will actively
participate in the
NRSMG Working Group
on Safe Speeds to
develop action plans
to support Safer
Journeys
Safer vehicles Police will actively
lead the NRSMG
Working Group on
Safe Vehicles to
develop action plans
to support Safer
Journeys
NZTA will actively
participate in the
NRSMG Working Group
on Safe Vehicles to
develop action plans
to support Safer
Journeys
ACC will actively
participate in the
NRSMG Working Group
on Safe Vehicles to
develop action plans
to support Safer
Journeys
LGNZ will actively
participate in the
NRSMG Working Group
on Safe Vehicles to
develop action plans
to support Safer
Journeys
Safer road use Police will actively
participate in the
NRSMG Working Group
on Safe Road Use to
develop action plans
to support Safer
Journeys
NZTA will actively lead
the NRSMG Working
Group on Safe Road
Use to develop action
plans to support Safer
Journeys
ACC will actively
participate in the
NRSMG Working Group
on Safe Road Use to
develop action plans
to support Safer
Journeys
LGNZ will actively
participate in the
NRSMG Working Group
on Safe Road Use to
develop action plans
to support Safer
Journeys

2010/11 Road Policing Programme
32
1.2 Links between Safer Journeys, the safe system approach and road policing activities
The following table summarises the Safer Journeys areas of concern and how they link to the safe system
approach and the road policing activities that contribute to the Safer Journeys areas of concern, including
the transition of road policing activities from 2009/10 to 2010/11.
Safer Journeys category
Safer Journeys areas of concern
Safe system approach
Road policing activities for 2009/10
Road policing activities for 2010/11
Alcohol and drugs Safer use Drinking or drugged driver control Part of drink-drug
driving, speed and
visible enforcement (see
table 2.1, page 22, for
rationale)
Young driver safety Young drivers Safer use
Secondary schools part of school road safety education
Speed Safer speeds Speed control (including traffic camera
operations)
Motorcycling
Safer use, safer
vehicles and safer
speeds
Part of drink-drug
driving, speed and
visible enforcement (see
table 2.1, page 22, for
rationale)
Motorcycling safety
Areas of high concern
Roads and roadsides Safer roads and
roadsides Traffic management
High-risk drivers Safer use Visible road safety and general enforcement
Heavy vehicles Safer vehicles
Commercial vehicle driver and transport service licence (TSL) operator activity and road user
charges (RUC) enforcement Light vehicles Safer vehicles Visible road safety and general enforcement Fatigue and
distraction Safer use Visible road safety and general enforcement
Areas of medium concern
Walking and cycling Safer use
Visible road safety and general enforcement and
Primary school part of school road safety education
Restraints Safer use and safer
vehicles Restraint device control Areas of continued
and emerging focus Older road users Safer use Police community services
Safer use, safer
vehicles, safer speeds
and safer roads and
roadsides
Crash attendance and investigation Other road policing activities – non Safer Journeys priority area
Safer use, safer
vehicles, safer speeds
and safer roads and
roadsides
Resolutions

Part 3: RPP Police activities and measures
33
2 Achieving Safer Journeys through road safety action planning and Police tasking and coordination
Safe system focus Safer use, safer vehicles, safer speeds, safer roads and roadsides
Police activity All road policing activities
Description Road policing activities are planned as part of road safety action planning processes along with
partners’ activities. Effective road safety action planning requires a collaborative approach from
participating partners to provide focus, commitment and urgency in order to address and
mitigate road safety risks and focus on priorities outlined in Safer Journeys.
Results sought
Final outcomes sought This activity contributes to the Safer Journeys vision of a safe road system increasingly free of
death and serious injury.
Intermediate outcomes sought This activity will contribute to the intermediate outcomes of an:
increase in the percentage of local authorities responding to an annual survey, conducted by
an independent research company, who are satisfied with NZ Police delivery of funded
activities
increase in the percentage of local authorities, and NZTA and ACC regions responding to an
annual survey conducted by an independent research company, who are satisfied with NZ
Police contribution to the road safety action planning process.
Costs and indicative FTEs
All road policing activities will be delivered within budget at a cost of $296.015 million (GST
exclusive).
1762.6 indicative FTEs. Police activity performance measures Task all road policing staff to risk, using a defined tasking and coordination process.
Prepare at least one road safety assessment for each road safety action planning meeting for each Police area per annum.
Police activity quarterly reporting requirements1 Report quarterly on the number of general road safety enforcement offences recorded per 10,000 population.
Provide an example of one road safety assessment for a road safety action planning meeting from a different Police
district each quarter.
Provide quarterly delivery reports on deployment of FTEs against RPP activities using current profiles (as per the 2009/10
RPP).
Estimated demand The Police structure comprises 12 districts and 43 areas.
Tasking and coordination processes form part of Police district and area activities (see description on page 71).
1 The Police quarterly reporting requirements throughout this document are completed at the national level for the purposes of reporting to the Minister of Transport and the Minister of Police.

2010/11 Road Policing Programme
34
3 Safer Journeys – areas of high concern
3.1 Alcohol and drugs
Safe system focus Safer road use
Police activity Drinking or drugged-driver control
Description
Drinking or drugged-driver control is one of the NZ Police Road Policing Strategy’s fatal five
activities. The strategy established five key areas of focus for road policing activities. Police
action will be outlined in the Safer Journeys Action Plan and incorporated into the national and
district Police business planning process.
Detection and deterrence of drink/drug-drive offending and targeting recidivist drink/drug-
drivers through:
directed patrols for compulsory breath testing (CBT), mobile breath testing (MBT) and
drugged driver activities
traffic surveillance
conducting examinations of alcohol- or drug-impaired drivers and subsequent forensic
analysis of blood samples including compulsory impairment testing (CIT)
issuing offence notices and subsequent prosecution requirements of front line staff
Traffic Alcohol Group (TAG) operations including enhanced CBT covering all Police districts
alcohol and drug intelligence and prevention services across all Police districts.
Results sought
Final outcomes sought This activity contributes to the Safer Journeys aim of reducing alcohol/drug-impaired driving by
reducing the level of fatalities caused by drink and/or drugged driving, currently 28 deaths per
one million population, to a rate similar to that in Australia of 22 deaths per one million
population.
Intermediate outcomes sought The aim with each intermediate outcome measure is to do better than the best result of the
previous five years (the best result since 2005 is provided in brackets). This activity will
contribute to the intermediate outcomes of:
a reduction in the number per 100,000 population of drivers with excess alcohol killed (1.3 –
2007)
a reduction in the number per 100,000 population of fatal or serious injury crashes where
Police have indicated alcohol or drugs as a contributing factor to the crash (19.5 – 2007)
an increase in the percentage of survey respondents who believe there is a high probability of
being stopped and tested at CBT checkpoints late at night (55% – 2005)
an increase in the percentage of survey respondents who believe there is a high probability of
being tested for drugs when stopped at CBT checkpoints late at night (new, aim of at least
40%).
Costs and indicative FTEs
This activity will be delivered within budget at a cost of $69.964 million (GST exclusive).
417.1 indicative FTEs. Police activity performance measures Complete 2 million compulsory breath tests.
Complete 700,000 mobile breath tests.
Achieve 1700 trained compulsory impairment testing officers (20% of constabulary staff).
Part 3: RPP Police activities and measures
35
3.1 Alcohol and drugs (cont)
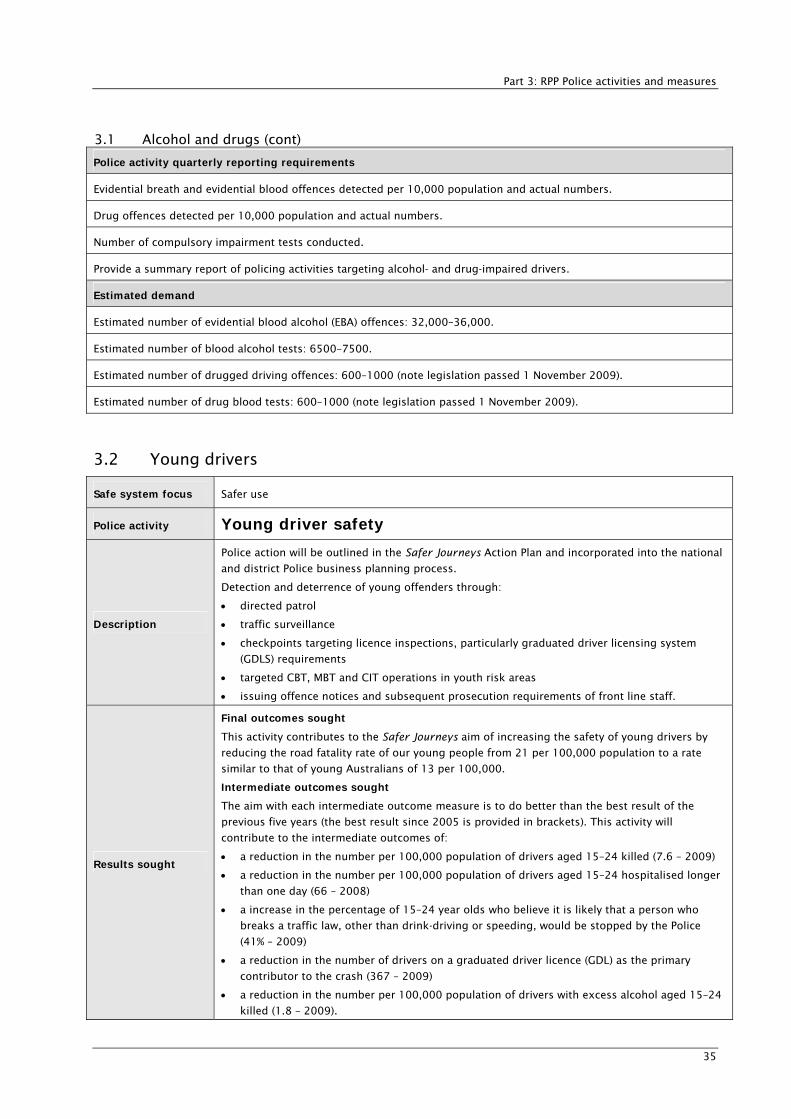
Police activity quarterly reporting requirements Evidential breath and evidential blood offences detected per 10,000 population and actual numbers.
Drug offences detected per 10,000 population and actual numbers.
Number of compulsory impairment tests conducted.
Provide a summary report of policing activities targeting alcohol- and drug-impaired drivers.
Estimated demand Estimated number of evidential blood alcohol (EBA) offences: 32,000–36,000.
Estimated number of blood alcohol tests: 6500–7500.
Estimated number of drugged driving offences: 600–1000 (note legislation passed 1 November 2009).
Estimated number of drug blood tests: 600–1000 (note legislation passed 1 November 2009).
3.2 Young drivers
Safe system focus Safer use
Police activity Young driver safety
Description
Police action will be outlined in the Safer Journeys Action Plan and incorporated into the national
and district Police business planning process.
Detection and deterrence of young offenders through:
directed patrol
traffic surveillance
checkpoints targeting licence inspections, particularly graduated driver licensing system
(GDLS) requirements
targeted CBT, MBT and CIT operations in youth risk areas
issuing offence notices and subsequent prosecution requirements of front line staff.
Results sought
Final outcomes sought This activity contributes to the Safer Journeys aim of increasing the safety of young drivers by
reducing the road fatality rate of our young people from 21 per 100,000 population to a rate
similar to that of young Australians of 13 per 100,000.
Intermediate outcomes sought The aim with each intermediate outcome measure is to do better than the best result of the
previous five years (the best result since 2005 is provided in brackets). This activity will
contribute to the intermediate outcomes of:
a reduction in the number per 100,000 population of drivers aged 15–24 killed (7.6 – 2009)
a reduction in the number per 100,000 population of drivers aged 15–24 hospitalised longer
than one day (66 – 2008)
a increase in the percentage of 15–24 year olds who believe it is likely that a person who
breaks a traffic law, other than drink-driving or speeding, would be stopped by the Police
(41% – 2009)
a reduction in the number of drivers on a graduated driver licence (GDL) as the primary
contributor to the crash (367 – 2009)
a reduction in the number per 100,000 population of drivers with excess alcohol aged 15–24
killed (1.8 – 2009).

2010/11 Road Policing Programme
36
3.2 Young drivers (cont)
Costs and indicative FTEs
This activity will be delivered within budget at a cost of $24.441 million (GST exclusive).
145.7 indicative FTEs. Police activity performance measures Develop a national intelligence knowledge profile on young drivers.
Police activity quarterly reporting requirements GDL breaches detected per 10,000 population and actual numbers for 15–24 year old drivers, broken down to 15–19-
year-old drivers and 20–24 year-old drivers.
Report on offence notices issued to young drivers per 10,000 people and actual numbers (2 classes: 15–19 year-old
drivers and 20–24 year-old drivers) for:
speed
alcohol
drugs
restraints
dangerous and careless driving
high-risk driving.
Provide a summary report of policing activities targeting young drivers.
Estimated demand Estimated number of alcohol-impaired under-20 drivers apprehended: 4500–5500.
Estimated number GDL breaches detected: 80,000–90,000.
3.3 Speed
Safe system focus Safer speeds
Police activity Speed control (including traffic camera operations)
Description
Speed control is one of the NZ Police Road Policing Strategy’s fatal five. The strategy has
established five key areas of focus for road policing activities. Police action will be outlined in the
Safer Journeys Action Plan and incorporated into the national and district Police business
planning process.
Detection and deterrence of speed offending, including enforcement activities at identified speed
risk areas through:
directed patrols using radar and laser speed detection apparatus
traffic surveillance using radar and laser speed detection apparatus
traffic surveillance using mobile and fixed speed cameras throughout New Zealand
evaluation of photographs taken by speed cameras
issuing traffic and infringement offence notices and prosecution follow-up by issuing officers.

Part 3: RPP Police activities and measures
37
3.3 Speed (cont)
Results sought
Final outcomes sought This activity contributes to the Safer Journeys aim of achieving safer speeds through significantly
reducing the impact of speed on crashes by reducing the number of crashes attributed to
speeding and driving too fast for the conditions.
Intermediate outcomes sought The aim with each intermediate outcome measure is to do better than the best result of the
previous five years (the best result since 2005 is provided in brackets). This activity will
contribute to the intermediate outcomes of:
a reduction in the number of speed-related fatal and serious injury road crashes (464 – 2009)
an increase in the percentage of respondents who believe there is a high probability of
detection of speeding (56% – 2005)
a reduction in the percentage of vehicles travelling over 100km/h on open roads (29% – 2009)
a reduction in the percentage of vehicles travelling over 50km/h on urban roads (61% – 2009)
a reduction in the mean vehicle speeds – rural and urban (96.3 and 52.3km/h – 2009).
Costs and indicative FTEs
This activity will be delivered within budget at a cost of $55.571 million (GST exclusive).
331.3 indicative FTEs, including 79.3 speed camera operator indicative FTEs. Police activity performance measures Deliver 20,181 speed camera deployment hours using fixed speed cameras.
Deliver 80,772 speed camera hours using mobile speed cameras.
Aim for 40% of all speeding notices issued to be the 11–15km/h speed band over the speed limit.
Police activity quarterly reporting requirements Speed camera notices by speed band over the speed limit per 10,000 population and actual number.
Speed offences (excluding speed camera offences) by speed band over the speed limit per 10,000 population and actual
number.
Estimated demand Estimated number of speed camera notices: 350,000–450,000
Estimated number of officer issued speed notices: 300,000–350,000.
3.4 Motorcycling
Safe system focus Safer use, safer vehicles and safer speeds
Police activity Motorcycling safety
Description
Increasing the safety of motorcycling is one of the priority areas of the Safer Journeys strategies.
Police action will be outlined in the Safer Journeys Action Plan and incorporated into the national
and district Police business planning process.
Detection and deterrence of motorcycle offending will be achieved through:
directed patrols
traffic surveillance
conducting checkpoints targeting motorcyclists
conducting driver licence checks and vehicle inspections
issuing offence notices and subsequent prosecution requirements of front line staff.
2010/11 Road Policing Programme
38
3.4 Motorcycling (cont)
Results sought
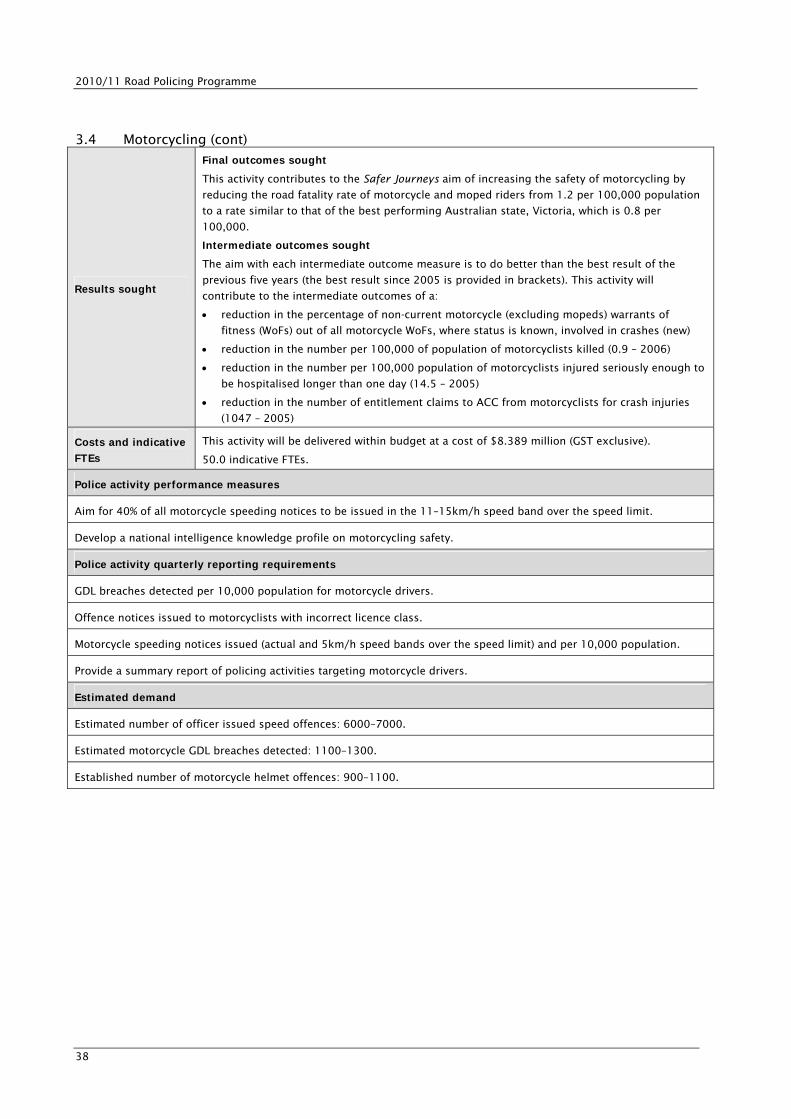
Final outcomes sought This activity contributes to the Safer Journeys aim of increasing the safety of motorcycling by
reducing the road fatality rate of motorcycle and moped riders from 1.2 per 100,000 population
to a rate similar to that of the best performing Australian state, Victoria, which is 0.8 per
100,000.
Intermediate outcomes sought The aim with each intermediate outcome measure is to do better than the best result of the
previous five years (the best result since 2005 is provided in brackets). This activity will
contribute to the intermediate outcomes of a:
reduction in the percentage of non-current motorcycle (excluding mopeds) warrants of
fitness (WoFs) out of all motorcycle WoFs, where status is known, involved in crashes (new)
reduction in the number per 100,000 of population of motorcyclists killed (0.9 – 2006)
reduction in the number per 100,000 population of motorcyclists injured seriously enough to
be hospitalised longer than one day (14.5 – 2005)
reduction in the number of entitlement claims to ACC from motorcyclists for crash injuries
(1047 – 2005)
Costs and indicative FTEs
This activity will be delivered within budget at a cost of $8.389 million (GST exclusive).
50.0 indicative FTEs. Police activity performance measures Aim for 40% of all motorcycle speeding notices to be issued in the 11–15km/h speed band over the speed limit.
Develop a national intelligence knowledge profile on motorcycling safety.
Police activity quarterly reporting requirements GDL breaches detected per 10,000 population for motorcycle drivers.
Offence notices issued to motorcyclists with incorrect licence class.
Motorcycle speeding notices issued (actual and 5km/h speed bands over the speed limit) and per 10,000 population.
Provide a summary report of policing activities targeting motorcycle drivers.
Estimated demand Estimated number of officer issued speed offences: 6000–7000.
Estimated motorcycle GDL breaches detected: 1100–1300.
Established number of motorcycle helmet offences: 900–1100.

Part 3: RPP Police activities and measures
39
3.5 Roads and roadsides
Safe system focus Safer roads and roadsides
Police activity Traffic management
Description
Management of road traffic through:
evacuation and patrol services during incidents, emergencies and disasters to facilitate
resumption of safe traffic flows at affected areas
traffic management services at civic and sporting events.
Management of traffic as appropriate, for example:
in metropolitan and provincial cities during holiday periods
arising from vehicle breakdowns
where traffic control devices fail.
Results sought
Final outcomes sought This activity contributes to the Safer Journeys aim of achieving safer roads and roadsides by
significantly reducing the crash risk on New Zealand’s high-risk routes.
Intermediate outcomes sought The aim with each intermediate outcome measure is to do better than the best result of the
previous five years (the best result since 2005 is provided in brackets). This activity will
contribute to the intermediate outcomes of a:
reduction in the number of fatal and serious head-on crashes (207 – 2008)
reduction in the number of fatal and serious run-off-road crashes (645 – 2009)
reduction in the number of fatal and serious intersection crashes (243 – 2005)
reduction in the number of fatal and serious crashes in KiwiRAP high collective risk routes on
SH network (308 – 2009)
reduction in the number of fatal and serious crashes involving pedestrians and cyclists (406 –
2009).
Costs and indicative FTEs
This activity will be delivered within budget at a cost of $12.526 million (GST exclusive).
74.7 indicative FTEs. Police activity performance measures Number of local intersection campaigns delivered.
Attend 90% of Priority One (P1) traffic events in urban policing areas within 10 minutes of being reported.
Attend 90% of Priority One (P1) traffic events in rural policing areas within 30 minutes of being reported.
Police activity quarterly reporting requirements Traffic incidents, blockages and breakdowns attended.
Actual percentage of Priority One (P1) traffic events attended within 10 minutes (urban) or 30 minutes (rural).
Time within which 90% of Priority One (P1) traffic events are attended:
urban
rural.
Estimated demand Traffic incidents, blockages and breakdowns attended: 80,000–90,000.
Unique Priority One (P1) traffic events created in CSC (Communications Centre data): 30,000–40,000.
2010/11 Road Policing Programme
40
4 Safer Journeys – areas of medium concern
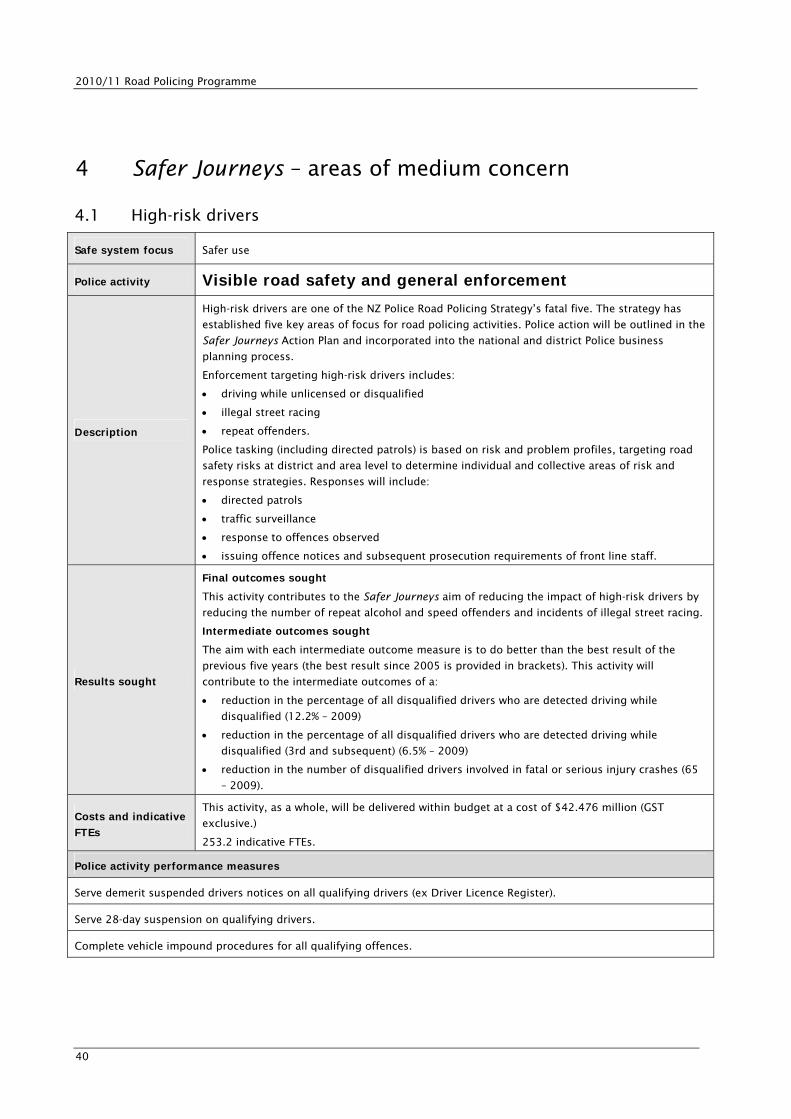
4.1 High-risk drivers
Safe system focus Safer use
Police activity Visible road safety and general enforcement
Description
High-risk drivers are one of the NZ Police Road Policing Strategy’s fatal five. The strategy has
established five key areas of focus for road policing activities. Police action will be outlined in the
Safer Journeys Action Plan and incorporated into the national and district Police business
planning process.
Enforcement targeting high-risk drivers includes:
driving while unlicensed or disqualified
illegal street racing
repeat offenders.
Police tasking (including directed patrols) is based on risk and problem profiles, targeting road
safety risks at district and area level to determine individual and collective areas of risk and
response strategies. Responses will include:
directed patrols
traffic surveillance
response to offences observed
issuing offence notices and subsequent prosecution requirements of front line staff.
Results sought
Final outcomes sought This activity contributes to the Safer Journeys aim of reducing the impact of high-risk drivers by
reducing the number of repeat alcohol and speed offenders and incidents of illegal street racing.
Intermediate outcomes sought The aim with each intermediate outcome measure is to do better than the best result of the
previous five years (the best result since 2005 is provided in brackets). This activity will
contribute to the intermediate outcomes of a:
reduction in the percentage of all disqualified drivers who are detected driving while
disqualified (12.2% – 2009)
reduction in the percentage of all disqualified drivers who are detected driving while
disqualified (3rd and subsequent) (6.5% – 2009)
reduction in the number of disqualified drivers involved in fatal or serious injury crashes (65
– 2009).
Costs and indicative FTEs
This activity, as a whole, will be delivered within budget at a cost of $42.476 million (GST
exclusive.)
253.2 indicative FTEs. Police activity performance measures Serve demerit suspended drivers notices on all qualifying drivers (ex Driver Licence Register).
Serve 28-day suspension on qualifying drivers.
Complete vehicle impound procedures for all qualifying offences.
Part 3: RPP Police activities and measures
41
4.1 High-risk drivers (cont)
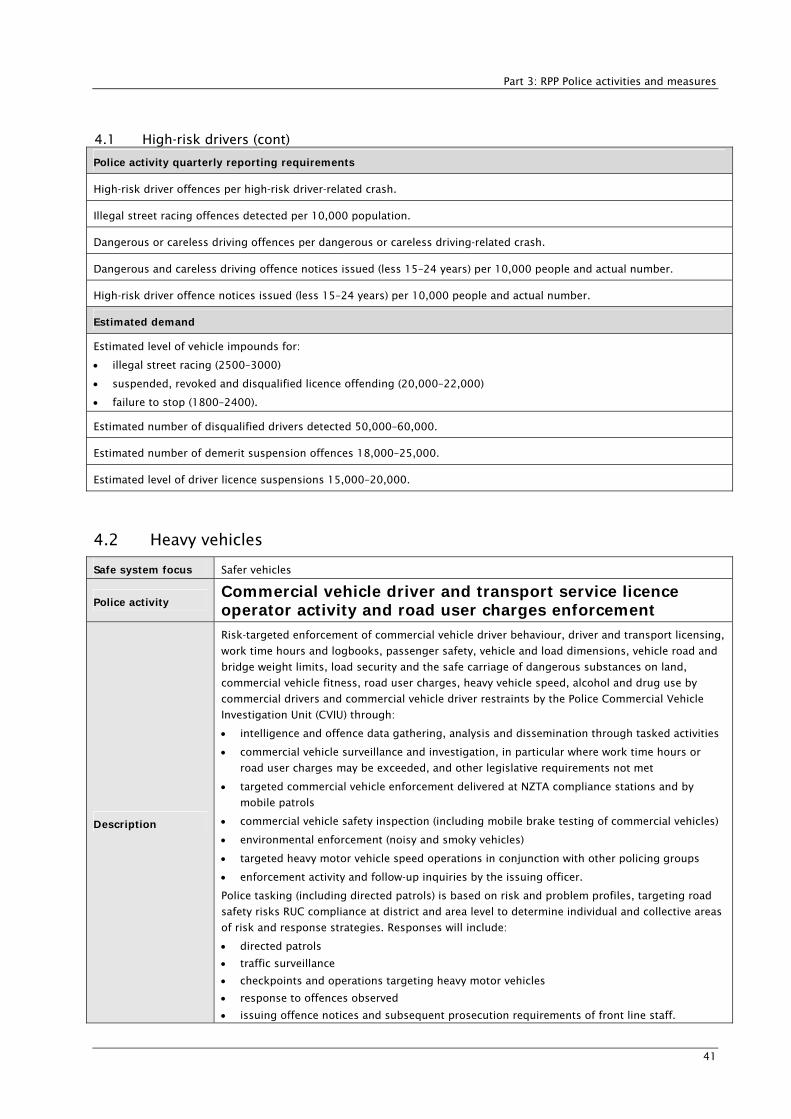
Police activity quarterly reporting requirements High-risk driver offences per high-risk driver-related crash.
Illegal street racing offences detected per 10,000 population.
Dangerous or careless driving offences per dangerous or careless driving-related crash.
Dangerous and careless driving offence notices issued (less 15–24 years) per 10,000 people and actual number.
High-risk driver offence notices issued (less 15–24 years) per 10,000 people and actual number.
Estimated demand Estimated level of vehicle impounds for:
illegal street racing (2500–3000)
suspended, revoked and disqualified licence offending (20,000–22,000)
failure to stop (1800–2400).
Estimated number of disqualified drivers detected 50,000–60,000.
Estimated number of demerit suspension offences 18,000–25,000.
Estimated level of driver licence suspensions 15,000–20,000.
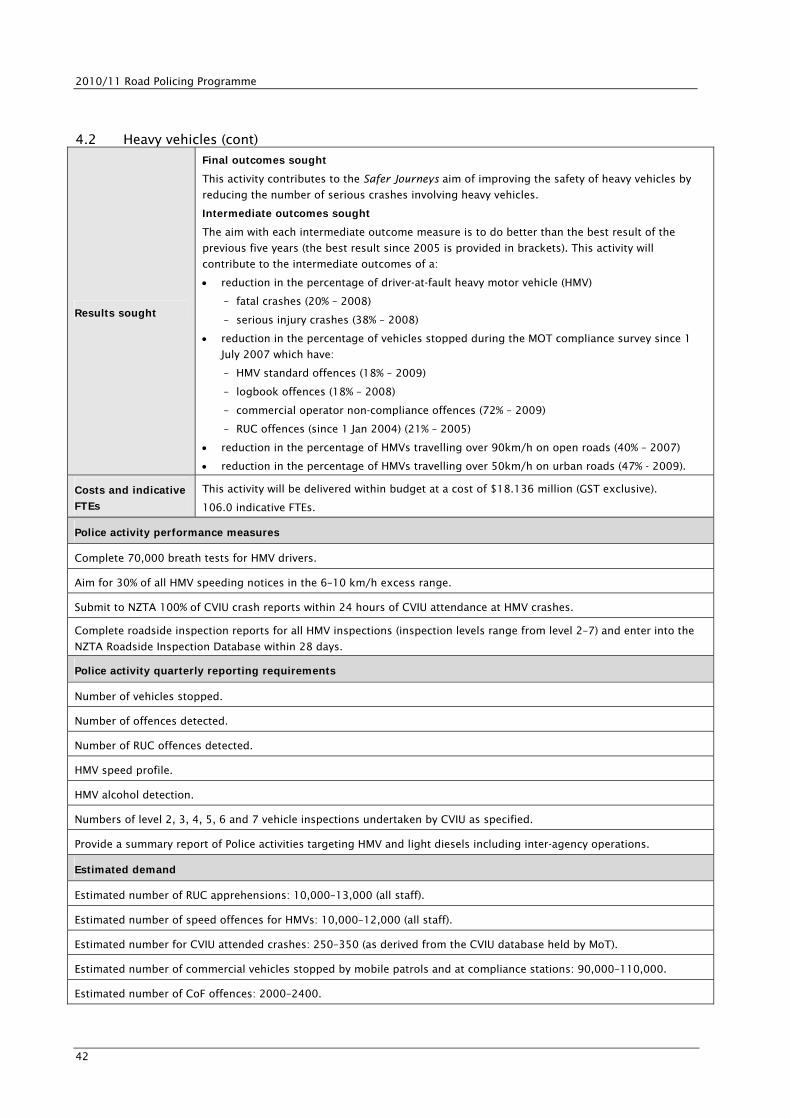
4.2 Heavy vehicles
Safe system focus Safer vehicles
Police activity Commercial vehicle driver and transport service licence operator activity and road user charges enforcement
Description
Risk-targeted enforcement of commercial vehicle driver behaviour, driver and transport licensing,
work time hours and logbooks, passenger safety, vehicle and load dimensions, vehicle road and
bridge weight limits, load security and the safe carriage of dangerous substances on land,
commercial vehicle fitness, road user charges, heavy vehicle speed, alcohol and drug use by
commercial drivers and commercial vehicle driver restraints by the Police Commercial Vehicle
Investigation Unit (CVIU) through:
intelligence and offence data gathering, analysis and dissemination through tasked activities
commercial vehicle surveillance and investigation, in particular where work time hours or
road user charges may be exceeded, and other legislative requirements not met
targeted commercial vehicle enforcement delivered at NZTA compliance stations and by
mobile patrols
commercial vehicle safety inspection (including mobile brake testing of commercial vehicles)
environmental enforcement (noisy and smoky vehicles)
targeted heavy motor vehicle speed operations in conjunction with other policing groups
enforcement activity and follow-up inquiries by the issuing officer.
Police tasking (including directed patrols) is based on risk and problem profiles, targeting road
safety risks RUC compliance at district and area level to determine individual and collective areas
of risk and response strategies. Responses will include:
directed patrols
traffic surveillance
checkpoints and operations targeting heavy motor vehicles
response to offences observed
issuing offence notices and subsequent prosecution requirements of front line staff.
2010/11 Road Policing Programme
42
4.2 Heavy vehicles (cont)
Results sought
Final outcomes sought This activity contributes to the Safer Journeys aim of improving the safety of heavy vehicles by
reducing the number of serious crashes involving heavy vehicles.
Intermediate outcomes sought The aim with each intermediate outcome measure is to do better than the best result of the
previous five years (the best result since 2005 is provided in brackets). This activity will
contribute to the intermediate outcomes of a:
reduction in the percentage of driver-at-fault heavy motor vehicle (HMV)
– fatal crashes (20% – 2008)
– serious injury crashes (38% – 2008)
reduction in the percentage of vehicles stopped during the MOT compliance survey since 1
July 2007 which have:
– HMV standard offences (18% – 2009)
– logbook offences (18% – 2008)
– commercial operator non-compliance offences (72% – 2009)
– RUC offences (since 1 Jan 2004) (21% – 2005)
reduction in the percentage of HMVs travelling over 90km/h on open roads (40% – 2007)
reduction in the percentage of HMVs travelling over 50km/h on urban roads (47% - 2009).
Costs and indicative FTEs
This activity will be delivered within budget at a cost of $18.136 million (GST exclusive).
106.0 indicative FTEs. Police activity performance measures Complete 70,000 breath tests for HMV drivers.
Aim for 30% of all HMV speeding notices in the 6–10 km/h excess range.
Submit to NZTA 100% of CVIU crash reports within 24 hours of CVIU attendance at HMV crashes.
Complete roadside inspection reports for all HMV inspections (inspection levels range from level 2–7) and enter into the
NZTA Roadside Inspection Database within 28 days.
Police activity quarterly reporting requirements Number of vehicles stopped.
Number of offences detected.
Number of RUC offences detected.
HMV speed profile.
HMV alcohol detection.
Numbers of level 2, 3, 4, 5, 6 and 7 vehicle inspections undertaken by CVIU as specified.
Provide a summary report of Police activities targeting HMV and light diesels including inter-agency operations.
Estimated demand Estimated number of RUC apprehensions: 10,000–13,000 (all staff).
Estimated number of speed offences for HMVs: 10,000–12,000 (all staff).
Estimated number for CVIU attended crashes: 250–350 (as derived from the CVIU database held by MoT).
Estimated number of commercial vehicles stopped by mobile patrols and at compliance stations: 90,000–110,000.
Estimated number of CoF offences: 2000–2400.
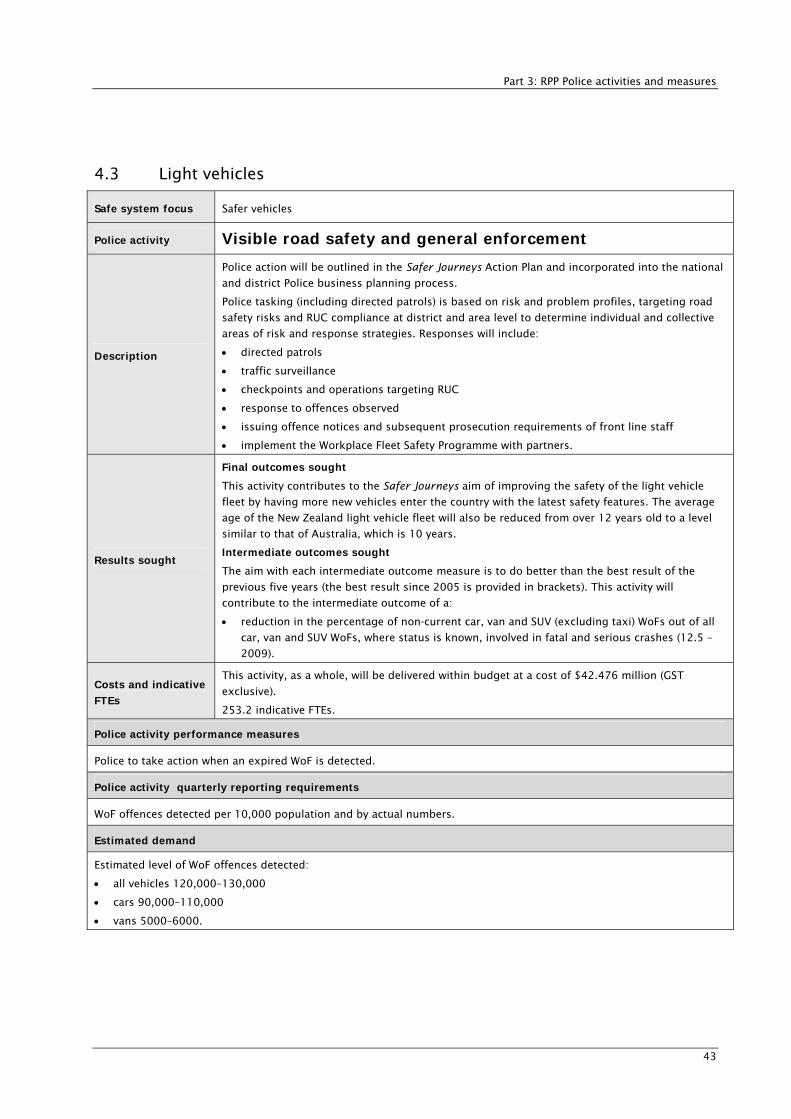
Part 3: RPP Police activities and measures
43
4.3 Light vehicles
Safe system focus Safer vehicles
Police activity Visible road safety and general enforcement
Description
Police action will be outlined in the Safer Journeys Action Plan and incorporated into the national
and district Police business planning process.
Police tasking (including directed patrols) is based on risk and problem profiles, targeting road
safety risks and RUC compliance at district and area level to determine individual and collective
areas of risk and response strategies. Responses will include:
directed patrols
traffic surveillance
checkpoints and operations targeting RUC
response to offences observed
issuing offence notices and subsequent prosecution requirements of front line staff
implement the Workplace Fleet Safety Programme with partners.
Results sought
Final outcomes sought This activity contributes to the Safer Journeys aim of improving the safety of the light vehicle
fleet by having more new vehicles enter the country with the latest safety features. The average
age of the New Zealand light vehicle fleet will also be reduced from over 12 years old to a level
similar to that of Australia, which is 10 years.
Intermediate outcomes sought The aim with each intermediate outcome measure is to do better than the best result of the
previous five years (the best result since 2005 is provided in brackets). This activity will
contribute to the intermediate outcome of a:
reduction in the percentage of non-current car, van and SUV (excluding taxi) WoFs out of all
car, van and SUV WoFs, where status is known, involved in fatal and serious crashes (12.5 –
2009).
Costs and indicative FTEs
This activity, as a whole, will be delivered within budget at a cost of $42.476 million (GST
exclusive).
253.2 indicative FTEs. Police activity performance measures Police to take action when an expired WoF is detected.
Police activity quarterly reporting requirements WoF offences detected per 10,000 population and by actual numbers.
Estimated demand Estimated level of WoF offences detected:
all vehicles 120,000–130,000
cars 90,000–110,000
vans 5000–6000.

2010/11 Road Policing Programme
44
4.4 Fatigue and distraction
Safe system focus Safer use
Police activity Visible road safety and general enforcement
Description
Police action will be outlined in the Safer Journeys Action Plan and incorporated into the national
and district Police business planning process.
Police tasking (including directed patrols) is based on risk and problem profiles, targeting road
safety risks at district and area level to determine individual and collective areas of risk and
response strategies. Responses will include:
directed patrols
traffic surveillance
response to offences observed such as use of handheld cell phones
issuing offence notices and subsequent prosecution requirements of front line staff.
Results sought
Final outcomes sought This activity contributes to the Safer Journeys aim of reducing the impact of fatigue and
addressing distraction by making New Zealanders’ management of driver distraction and fatigue
a habitual part of what it is to be a safe and competent driver.
Intermediate outcomes sought The aim with each intermediate outcome measure is to do better than the best result of the
previous five years (the best result since 2005 is provided in brackets). This activity will
contribute to the intermediate outcome of a:
reduction in the number of fatal and serious injury crashes where fatigue and/or distraction
was considered a contributing factor (545 – 2007).
Costs and indicative FTEs
This activity, as a whole, will be delivered within budget at a cost of $42.476 million (GST
exclusive).
253.2 indicative FTEs. Police activity performance measures Police to take action when a fatigued or distracted driver is detected.
Police activity quarterly reporting requirements Cell phone offences detected.
Provide a summary report of police activity targeting fatigue and distraction.
Estimated demand Estimated level of cell phone offences detected (note legislation came into force 1 November 2009): 7000–9000.

Part 3: RPP Police activities and measures
45
4.5 Walking and cycling (visible road safety and general enforcement)
Safe system focus Safer use and safer roads and roadsides
Police activity Visible road safety and general enforcement
Description
Police action will be outlined in the Safer Journeys Action Plan and incorporated into the national
and district Police business planning process.
Police tasking (including directed patrols) is based on risk and problem profiles, targeting road
safety at district and area level to determine individual and collective areas of risk and response
strategies. Responses will include:
directed patrols
traffic surveillance
response to offences observed
issuing offence notices and subsequent prosecution requirements of front line staff.
Results sought
Final outcomes sought This activity contributes to the Safer Journeys aim of safer walking and cycling by achieving a
reduction in the crash risk for pedestrians and particularly cyclists, while at the same time
encouraging an increase in use of these modes through safer roading infrastructure.
Intermediate outcomes sought The aim with each intermediate outcome measure is to do better than the best result of the
previous five years (the best result since 2005 is provided in brackets). This activity will
contribute to the intermediate outcomes of:
an increase in the percentage of cyclists wearing helmets (94% – 2006)
a reduction in the number per 100,000 population of pedestrians/cyclists killed (0.9 – 2009)
a reduction in the number per 100,000 population of pedestrians/cyclists seriously injured
enough to be hospitalised for longer than one day (10.5 – 2009).
Costs and indicative FTEs
This activity, as a whole, will be delivered within budget at a cost of $42.476 million (GST
exclusive).
253.2 indicative FTEs. Police activity performance measures Police will take action when offences affecting pedestrian or cyclist safety are detected.
Police activity quarterly reporting requirements Cycle helmet offences detected per 10,000 population and by actual numbers.
Provide a summary report of police activity targeting cycling and walking.
Estimated demand Estimated number of cycle helmet offences detected: 9000–11,000.
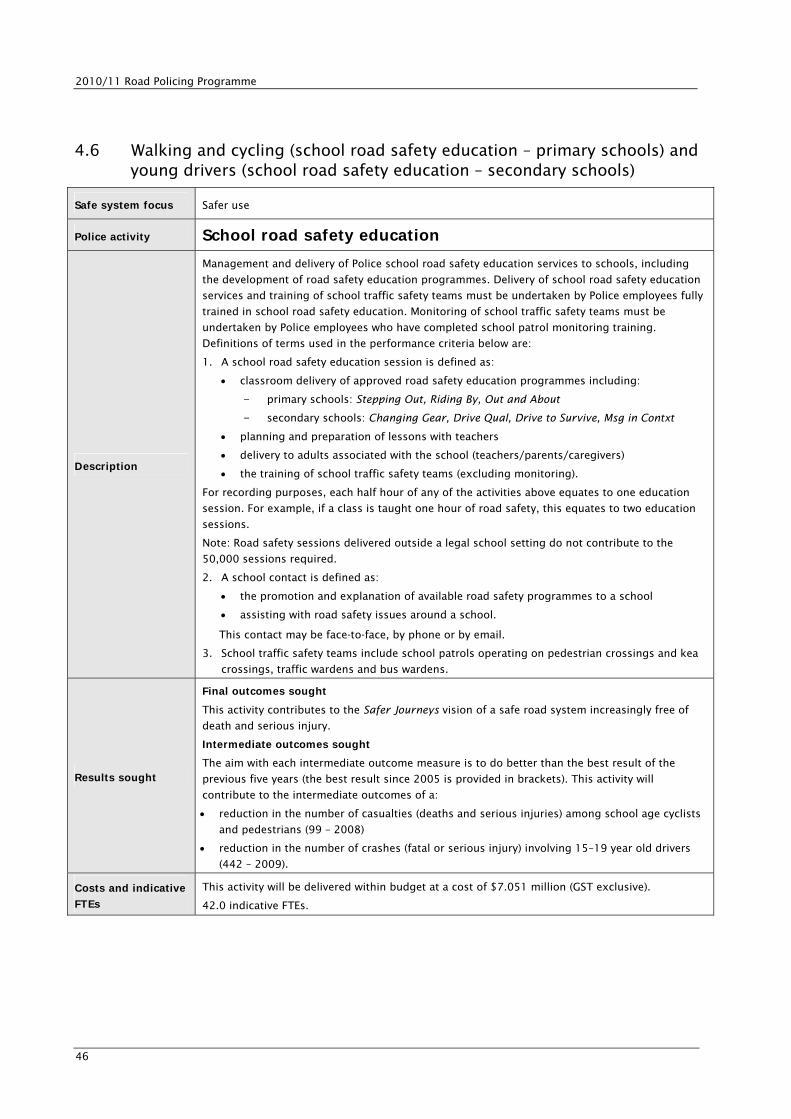
2010/11 Road Policing Programme
46
4.6 Walking and cycling (school road safety education – primary schools) and young drivers (school road safety education – secondary schools)
Safe system focus Safer use
Police activity School road safety education
Description
Management and delivery of Police school road safety education services to schools, including
the development of road safety education programmes. Delivery of school road safety education
services and training of school traffic safety teams must be undertaken by Police employees fully
trained in school road safety education. Monitoring of school traffic safety teams must be
undertaken by Police employees who have completed school patrol monitoring training.
Definitions of terms used in the performance criteria below are:
1. A school road safety education session is defined as:
classroom delivery of approved road safety education programmes including:
- primary schools: Stepping Out, Riding By, Out and About
- secondary schools: Changing Gear, Drive Qual, Drive to Survive, Msg in Contxt
planning and preparation of lessons with teachers
delivery to adults associated with the school (teachers/parents/caregivers)
the training of school traffic safety teams (excluding monitoring).
For recording purposes, each half hour of any of the activities above equates to one education
session. For example, if a class is taught one hour of road safety, this equates to two education
sessions.
Note: Road safety sessions delivered outside a legal school setting do not contribute to the
50,000 sessions required.
2. A school contact is defined as:
the promotion and explanation of available road safety programmes to a school
assisting with road safety issues around a school.
This contact may be face-to-face, by phone or by email.
3. School traffic safety teams include school patrols operating on pedestrian crossings and kea
crossings, traffic wardens and bus wardens.
Results sought
Final outcomes sought This activity contributes to the Safer Journeys vision of a safe road system increasingly free of
death and serious injury.
Intermediate outcomes sought The aim with each intermediate outcome measure is to do better than the best result of the
previous five years (the best result since 2005 is provided in brackets). This activity will
contribute to the intermediate outcomes of a:
reduction in the number of casualties (deaths and serious injuries) among school age cyclists
and pedestrians (99 – 2008)
reduction in the number of crashes (fatal or serious injury) involving 15–19 year old drivers
(442 – 2009).
Costs and indicative FTEs
This activity will be delivered within budget at a cost of $7.051 million (GST exclusive).
42.0 indicative FTEs.
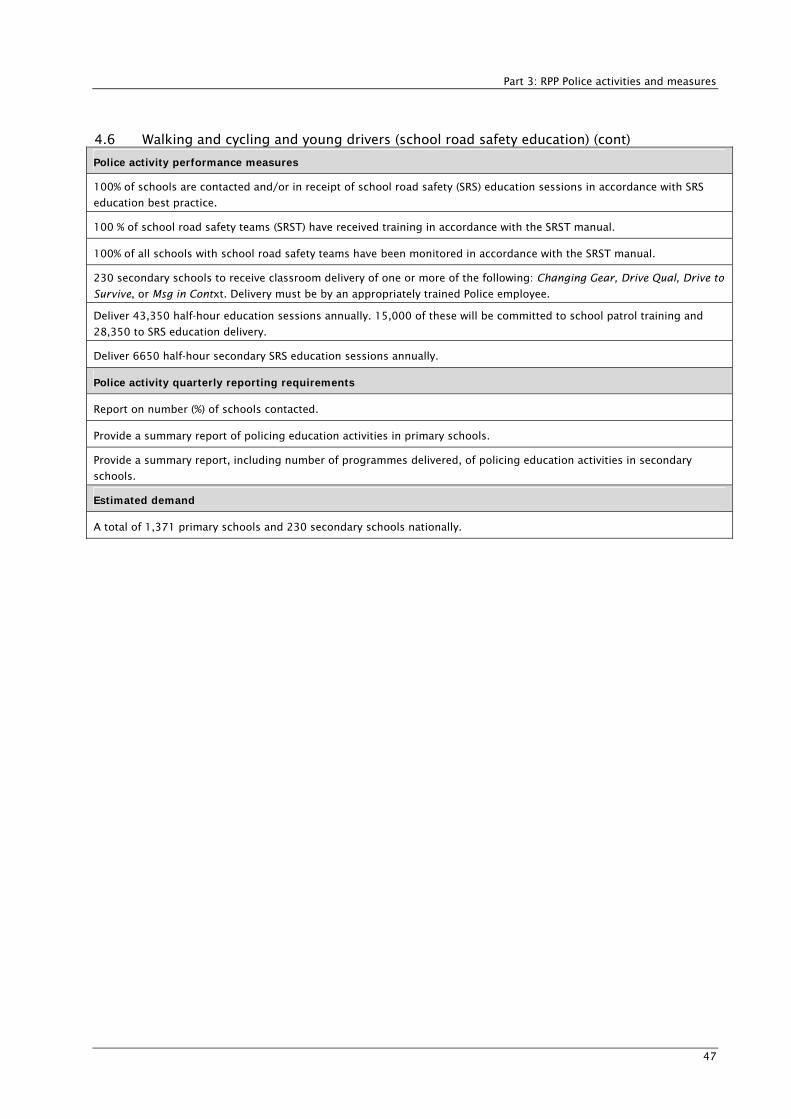
Part 3: RPP Police activities and measures
47
4.6 Walking and cycling and young drivers (school road safety education) (cont)
Police activity performance measures 100% of schools are contacted and/or in receipt of school road safety (SRS) education sessions in accordance with SRS
education best practice.
100 % of school road safety teams (SRST) have received training in accordance with the SRST manual.
100% of all schools with school road safety teams have been monitored in accordance with the SRST manual.
230 secondary schools to receive classroom delivery of one or more of the following: Changing Gear, Drive Qual, Drive to
Survive, or Msg in Contxt. Delivery must be by an appropriately trained Police employee.
Deliver 43,350 half-hour education sessions annually. 15,000 of these will be committed to school patrol training and
28,350 to SRS education delivery.
Deliver 6650 half-hour secondary SRS education sessions annually.
Police activity quarterly reporting requirements Report on number (%) of schools contacted.
Provide a summary report of policing education activities in primary schools.
Provide a summary report, including number of programmes delivered, of policing education activities in secondary
schools.
Estimated demand A total of 1,371 primary schools and 230 secondary schools nationally.
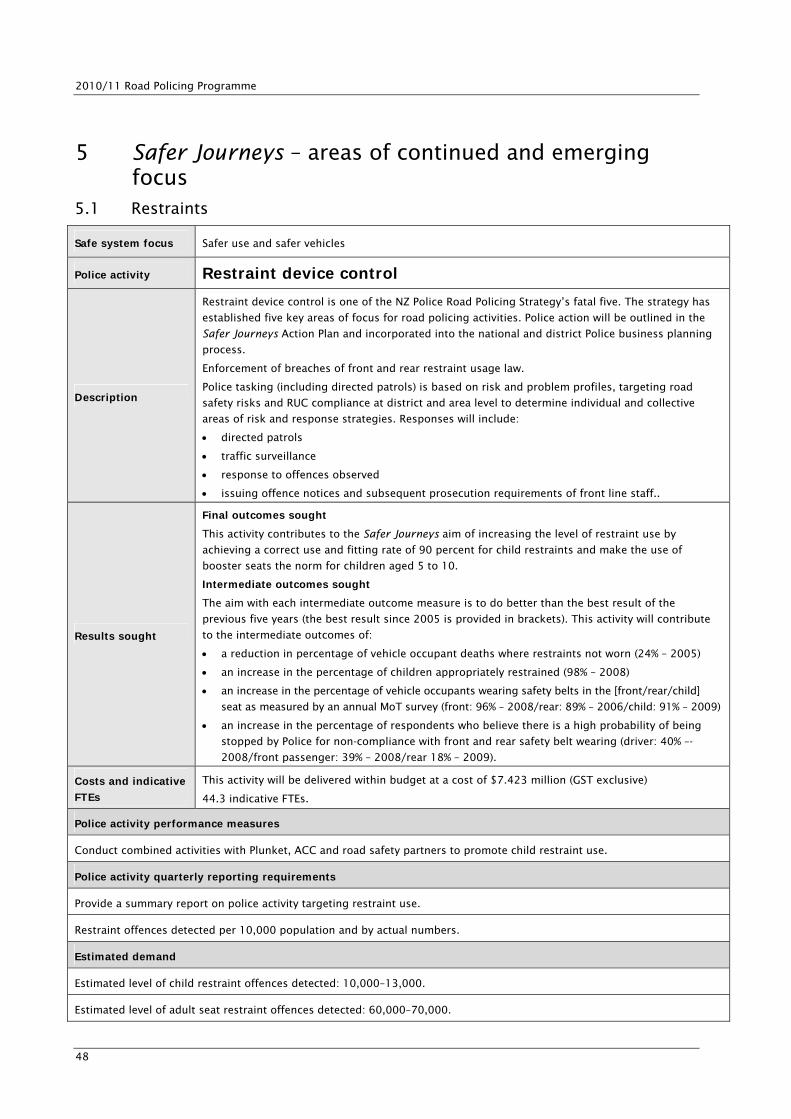
2010/11 Road Policing Programme
48
5 Safer Journeys – areas of continued and emerging focus
5.1 Restraints
Safe system focus Safer use and safer vehicles
Police activity Restraint device control
Description
Restraint device control is one of the NZ Police Road Policing Strategy’s fatal five. The strategy has
established five key areas of focus for road policing activities. Police action will be outlined in the
Safer Journeys Action Plan and incorporated into the national and district Police business planning
process.
Enforcement of breaches of front and rear restraint usage law.
Police tasking (including directed patrols) is based on risk and problem profiles, targeting road
safety risks and RUC compliance at district and area level to determine individual and collective
areas of risk and response strategies. Responses will include:
directed patrols
traffic surveillance
response to offences observed
issuing offence notices and subsequent prosecution requirements of front line staff..
Results sought
Final outcomes sought This activity contributes to the Safer Journeys aim of increasing the level of restraint use by
achieving a correct use and fitting rate of 90 percent for child restraints and make the use of
booster seats the norm for children aged 5 to 10.
Intermediate outcomes sought The aim with each intermediate outcome measure is to do better than the best result of the
previous five years (the best result since 2005 is provided in brackets). This activity will contribute
to the intermediate outcomes of:
a reduction in percentage of vehicle occupant deaths where restraints not worn (24% – 2005)
an increase in the percentage of children appropriately restrained (98% – 2008)
an increase in the percentage of vehicle occupants wearing safety belts in the [front/rear/child]
seat as measured by an annual MoT survey (front: 96% – 2008/rear: 89% – 2006/child: 91% – 2009)
an increase in the percentage of respondents who believe there is a high probability of being
stopped by Police for non-compliance with front and rear safety belt wearing (driver: 40% –-
2008/front passenger: 39% – 2008/rear 18% – 2009).
Costs and indicative FTEs
This activity will be delivered within budget at a cost of $7.423 million (GST exclusive)
44.3 indicative FTEs. Police activity performance measures Conduct combined activities with Plunket, ACC and road safety partners to promote child restraint use.
Police activity quarterly reporting requirements Provide a summary report on police activity targeting restraint use.
Restraint offences detected per 10,000 population and by actual numbers.
Estimated demand Estimated level of child restraint offences detected: 10,000–13,000.
Estimated level of adult seat restraint offences detected: 60,000–70,000.

Part 3: RPP Police activities and measures
49
5.2 Older road users
Safe system focus Safer use
Police activity Police community services
Description
Police action will be outlined in the Safer Journeys Action Plan and incorporated into the national
and district Police business planning process.
Support for road safety through:
community road safety liaison and consultation, including a focus on older drivers
(attendance at meetings, the provision of information, etc)
assisting with the development and delivery of road safety action plans (RSAPs), including a
focus on older drivers
participation in community activities as agreed and planned at the local level.
Results sought
Final outcomes sought This activity contributes to the Safer Journeys aim of increasing the safety of older
New Zealanders by reducing the road fatality rate of older New Zealanders from 15 per 100,000
population to a rate similar to that of older Australians of 11 per 100,000.
Intermediate outcomes sought The aim with each intermediate outcome measure is to do better than the best result of the
previous five years (the best result since 2005 is provided in brackets). This activity will
contribute to the intermediate outcomes of a:
reduction in the number of deaths per 100,000 population of drivers aged over 75 (5.7 –
2009)
reduction in the number of serious injuries per 100,000 population of drivers aged over 75
(20 – 2005)
reduction in the number of entitlement claims to ACC for crash injuries from those over 75
(96 – 2009).
Costs and indicative FTEs
This activity will be delivered within budget at a cost of $5.256 million (GST exclusive).
31.3 indicative FTEs. Police activity performance measures Police to take action when offences affecting the safety of older road users are detected.
Police activity quarterly reporting requirements Report on offence notices issued to drivers aged over 75 per 100,000 population, and actual numbers, for:
speed
alcohol and drugs
dangerous and careless driving.
Provide a summary report of Police activity targeting Police community services
Estimated demand Estimated number of alcohol-impaired drivers over 75: 30–60.
Estimated number of speed offences for drivers over 75: 2000–3000.
Estimated number of dangerous and careless driving offences for drivers over 75: 1200–1600.
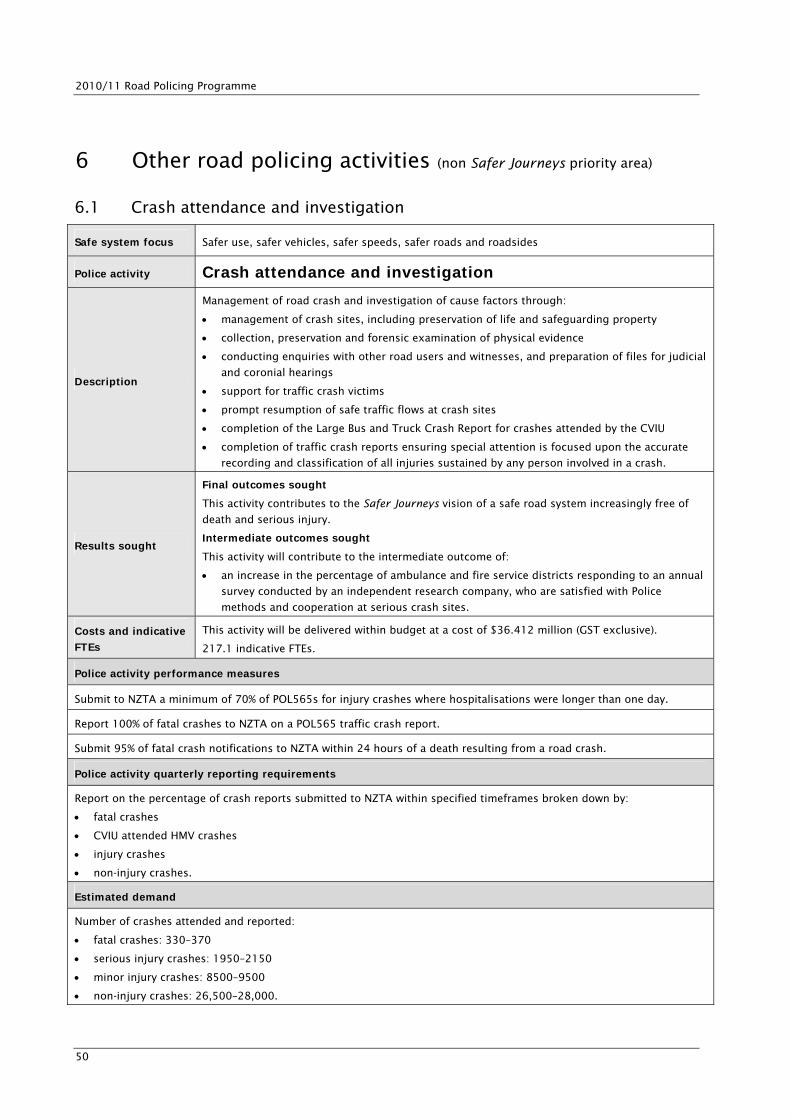
2010/11 Road Policing Programme
50
6 Other road policing activities (non Safer Journeys priority area)
6.1 Crash attendance and investigation
Safe system focus Safer use, safer vehicles, safer speeds, safer roads and roadsides
Police activity Crash attendance and investigation
Description
Management of road crash and investigation of cause factors through:
management of crash sites, including preservation of life and safeguarding property
collection, preservation and forensic examination of physical evidence
conducting enquiries with other road users and witnesses, and preparation of files for judicial
and coronial hearings
support for traffic crash victims
prompt resumption of safe traffic flows at crash sites
completion of the Large Bus and Truck Crash Report for crashes attended by the CVIU
completion of traffic crash reports ensuring special attention is focused upon the accurate
recording and classification of all injuries sustained by any person involved in a crash.
Results sought
Final outcomes sought This activity contributes to the Safer Journeys vision of a safe road system increasingly free of
death and serious injury.
Intermediate outcomes sought This activity will contribute to the intermediate outcome of:
an increase in the percentage of ambulance and fire service districts responding to an annual
survey conducted by an independent research company, who are satisfied with Police
methods and cooperation at serious crash sites.
Costs and indicative FTEs
This activity will be delivered within budget at a cost of $36.412 million (GST exclusive).
217.1 indicative FTEs. Police activity performance measures Submit to NZTA a minimum of 70% of POL565s for injury crashes where hospitalisations were longer than one day.
Report 100% of fatal crashes to NZTA on a POL565 traffic crash report.
Submit 95% of fatal crash notifications to NZTA within 24 hours of a death resulting from a road crash.
Police activity quarterly reporting requirements Report on the percentage of crash reports submitted to NZTA within specified timeframes broken down by:
fatal crashes
CVIU attended HMV crashes
injury crashes
non-injury crashes.
Estimated demand Number of crashes attended and reported:
fatal crashes: 330–370
serious injury crashes: 1950–2150
minor injury crashes: 8500–9500
non-injury crashes: 26,500–28,000.

Part 3: RPP Police activities and measures
51
6.2 Road policing resolutions
Safe system focus Safer use, safer vehicles, safer speeds, safer roads and roadsides
Police activity Road policing resolutions
Description
This activity covers the management of sanctions, prosecution and court orders through:
processing of traffic infringement and offence notices
prosecution of offences against transport and road safety related legislation
processing of limited licence applications
the execution of warrants to arrest, fines warrants and other warrants, and the serving of
summonses and other minor offence notices generated under the Transport Act (court
documents)
contributing to the enforcement of roadside suspensions.
Results sought Final outcomes sought This activity contributes to the Safer Journeys vision of a safe road system increasingly free of
death and serious injury.
Costs and indicative FTEs
This activity will be delivered within budget at a cost of $8.370 million (GST exclusive).
49.9 indicative FTEs. Police activity performance measures No less than 99% of prima facie cases established for traffic informations laid which proceed to prosecution.
Police activity quarterly reporting requirements Report on number of:
traffic prosecutions
court documents served and executed.
Estimated demand Traffic prosecutions: 80,000–90,000.
Court documents served and executed: 20,000–22,000.

2010/11 Road Policing Programme
52
7 Planning and delivery of road policing resources
7.1 Coordinating delivery
Indicative allocations are at the local level and are presented in this RPP by regional council area and
NZ Police area. Strategic road policing resources are allocated to the local level and across the speed
control, drink and/or drugged driver control, young driver safety, motorcycling safety, visible road safety
and general enforcement, restraint device control and older road user activities. Risk is determined at the
local level to address problems in accordance with the road safety action planning process and presented
in road safety assessments (RSAs) and RSAPs, including network safety coordination plans2 and risk-
targeted patrol plans (RTPPs) developed by Police. The approach requires the focus to be on the
coordinated delivery of planned activities.
Road safety action planning, including network safety coordination plans, will continue to be enhanced as
a tool for the delivery of road policing. Road safety action planning should synchronise all road safety
activities delivered at the local level (for example engineering improvements, community programmes and
road policing). RTPPs provide for road policing delivery according to risk, for example, by location, time of
day and day of week and offence type.
7.2 Support resources
Indicative road policing support (or input) resources are recorded in table 3.1 below.
The activity FTE rate contained in table 2.6 includes all the support costs in the activity FTEs. Support
activities such as the road policing management, strategic capability, intelligence, Commercial Vehicle
Investigation Unit (CVIU) intelligence, vehicle safety advice and support staff, Police Infringement Bureau
activities and Communication Centre services are now transparently recorded in table 3.1 and are costed
into the FTE rate for the activity FTEs in table 2.2.
Table 3.1 Road policing resources supporting on-road enforcement
Input FTE resource level Road policing management and strategic capability 51.0
District road policing management and support 8.4
District Intelligence 12.0
Communications Centres (road policing) 119.4
CVIU Office of the Commissioner 5.1
CVIU area intel and support 8.1
Police Infringement Bureau 134.0
Total 338.0
2 These are similar to RSAPs but focus on specific sections of the state highway network.

Part 3: RPP Police activities and measures
53
7.3 Categorisation of Police activities
7.3.1 Vote Police Output expense 7 – Road Policing Programme Police resources can be grouped into the following four categories. These categories align with the
categories for Vote Police output expense 7 – Road Policing Programme:
strategic road policing – speed control, drinking and/or drugged driver control, young driver safety,
motorcycling safety, restraint device control, visible road safety and general enforcement, and
commercial transport service licence (TSL) operator activity and road user charges (RUC) enforcement
community engagement on road policing – Police community services and school road safety
education
road policing incident and emergency management – crash attendance and investigation, and traffic
management
road policing resolutions – sanctions and prosecutions, and court orders.
7.3.2 Safer journeys reprioritisation In accordance with the reprioritisation of activities to align with Safer Journeys, this RPP groups Police
activities into the following four categories:
areas of high concern – speed control (including traffic camera operations), drinking or drugged
driving control, young driver safety, motorcycling safety and traffic management
areas of medium concern – visible road safety and general enforcement, commercial vehicle driver
and commercial TSL operator activity and RUC enforcement and school road safety education
areas of continued and emerging focus – restraint device control and Police community services
other RPP activities – crash attendance and investigation and resolutions.
7.3.3 Funding and indicative full-time equivalent resources Police allocations are in terms of funding and FTE Police personnel. One FTE equals 1500 hours of
productive (as opposed to support) activity per annum, which is in addition to training, leave and other
non-productive hours. Funding for support personnel is funded as an overhead on the FTE costs. This
arrangement provides for NZ Police to manage its road policing funded personnel appropriately.
Tables 3.2 and 3.3 provide a summary of indicative FTE resources across the four Safer Journeys priority
areas listed above by Police district and regional council area respectively. By way of transition, tables 3.4
and 3.5 provide a summary of indicative FTE resources across the four output expense 7: Road Policing
Programme categories listed above by Police district and regional council area respectively. Finally, table
3.6 provides a summary of FTE resources by Police delivery unit.
Table 3.2 Summary of indicative road policing full-time equivalent (FTE) resources by Police district
Police district Areas of high
concern
Areas of medium concern
Areas of continued
or emerging focus
Other road policing activities
Total
Police National Headquarters 106.0 41.3 147.3
Northland 60.1 7.5 2.8 8.4 78.9
Waitemata 76.4 18.9 8.8 18.4 122.4

2010/11 Road Policing Programme
54
Police district Areas of high
concern
Areas of medium concern
Areas of continued
or emerging focus
Other road policing activities
Total
Waitemata (Auck Motorways) 73.3 14.1 1.7 6.1 95.2
Auckland 67.8 27.7 6.3 29.6 131.4
Counties/Manukau 60.6 22.1 4.3 22.9 110.0
Waikato 112.6 17.5 5.2 18.3 153.6
Bay of Plenty 106.2 14.9 4.1 15.2 140.4
Eastern 63.8 12.6 4.2 10.7 91.3
Central 117.4 22.0 5.6 17.0 162.1
Wellington 104.3 25.3 5.8 21.2 156.6
Tasman 56.2 9.4 2.5 9.4 77.6
Canterbury 109.5 24.0 10.5 23.9 167.9
Southern 89.6 19.8 4.7 13.9 128.0
Totals 1097.8 342.1 66.3 256.4 1762.6
Table 3.3 Summary of indicative road policing full-time equivalent (FTE) resources by regional council area
Regional council name Areas of high
concern
Areas of medium concern
Areas of continued
or emerging focus
Other road policing activities
Total
Police National Headquarters 106.0 41.3 147.3
Northland 60.1 7.5 2.8 8.4 78.9
Auckland 278.1 82.9 21.0 77.0 459.0
Waikato 140.9 21.6 6.1 23.0 191.5
Bay of Plenty 77.9 10.9 3.2 10.5 102.5
Gisborne 23.9 4.5 1.6 2.8 32.8
Hawke's Bay 39.9 8.1 2.6 7.9 58.5
Taranaki 37.4 7.3 1.5 5.0 51.3
Manawatu/Wanganui 80.0 14.7 4.0 12.1 110.8
Wellington 104.2 25.3 5.8 21.2 156.4
Nelson/Tasman/Marlborough/Kaikoura 39.6 6.7 1.9 5.8 54.0
Canterbury 109.6 24.1 10.5 23.9 168.1
West Coast 16.6 2.7 0.6 3.6 23.5
Otago 57.9 15.0 3.5 8.8 85.2
Southland 31.7 4.8 1.2 5.1 42.8
Totals 1097.8 342.1 66.3 256.4 1762.6

Part 3: RPP Police activities and measures
55
Table 3.4 Summary of indicative road policing full-time equivalent (FTE) resources by Police district
Police district Strategic road
policing
Community engagement
on road safety
Road policing incident and emergency
management
Road policing
resolutions
Total
Police National Headquarters 106.0 41.3 147.3
Northland 66.2 3.2 9.3 0.2 78.9
Waitematā 91.1 10.2 20.3 0.8 122.4
Waitematā (Auckland Motorways) 66.5 0.7 27.9 0.1 95.2
Auckland 85.8 7.1 37.5 0.9 131.4
Counties/Manukau 77.4 5.6 26.0 0.9 110.0
Waikato 126.3 6.2 20.6 0.5 153.6
Bay of Plenty 117.9 5.3 16.6 0.6 140.4
Eastern 75.2 3.7 11.8 0.5 91.3
Central 137.8 4.9 18.6 0.8 162.1
Wellington 120.5 6.0 29.1 1.0 156.6
Tasman 64.4 2.7 10.1 0.4 77.6
Canterbury 130.4 9.7 26.6 1.2 167.9
Southern 107.0 5.6 14.7 0.7 128.0
Totals 1372.5 70.9 269.2 49.9 1762.6
Table 3.5 Summary of indicative road policing full-time equivalent (FTE) resources by regional council area
Regional council area Strategic road
policing
Community engagement
on road safety
Road policing incident and emergency
management
Road policing
resolutions
Total
Police National Headquarters 106.0 41.3 147.3
Northland 66.2 3.2 9.3 0.2 78.9
Auckland 320.8 23.7 111.8 2.7 459.0
Waikato 157.9 7.1 25.5 1.0 191.5
Bay of Plenty 86.3 4.4 11.7 0.2 102.5
Gisborne 28.2 1.4 3.0 0.2 32.8
Hawke's Bay 47.0 2.3 8.8 0.3 58.5
Taranaki 44.3 1.2 5.5 0.3 51.3
Manawatu/Wanganui 93.5 3.7 13.1 0.5 110.8
Wellington 120.3 6.0 29.1 1.0 156.4
Nelson/Tasman/Marlborough/Kaikoura 45.1 2.1 6.5 0.3 54.0
Canterbury 130.6 9.8 26.6 1.2 168.1
West Coast 19.3 0.5 3.6 0.1 23.5
Otago 70.9 4.5 9.2 0.5 85.2
Southland 36.1 1.1 5.4 0.2 42.8
Totals 1372.5 70.9 269.2 49.9 1762.6
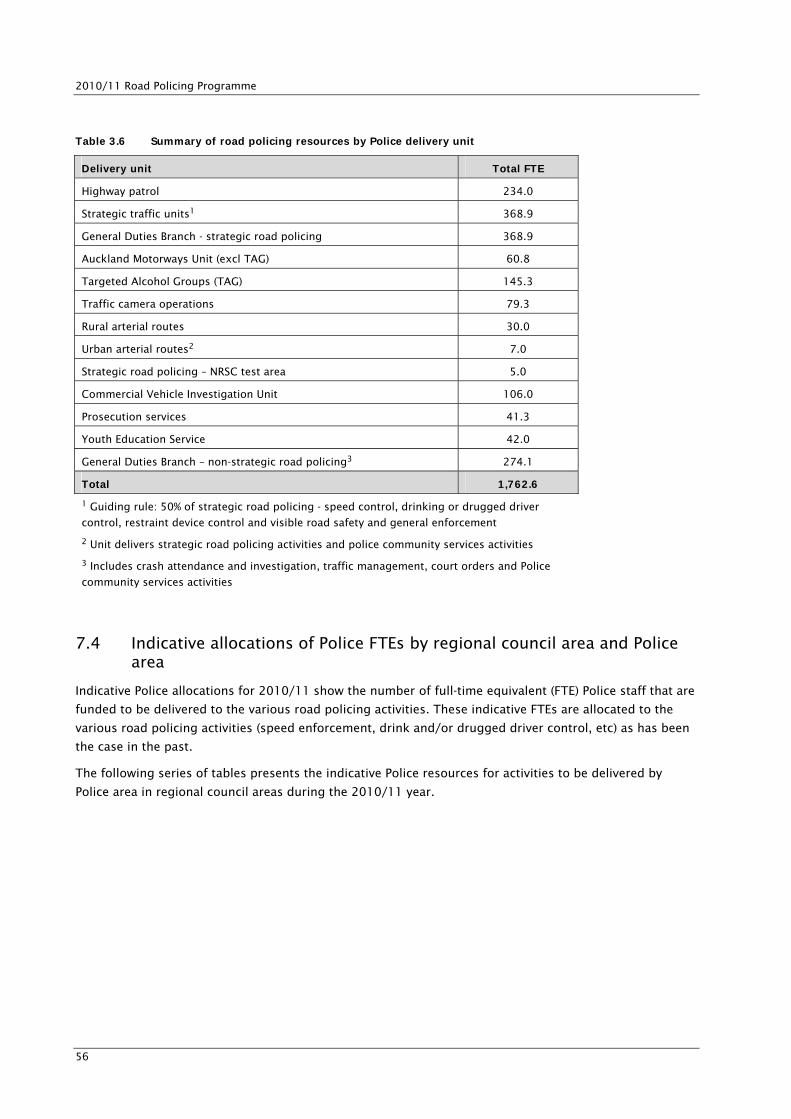
2010/11 Road Policing Programme
56
Table 3.6 Summary of road policing resources by Police delivery unit
Delivery unit Total FTE Highway patrol 234.0
Strategic traffic units1 368.9
General Duties Branch - strategic road policing 368.9
Auckland Motorways Unit (excl TAG) 60.8
Targeted Alcohol Groups (TAG) 145.3
Traffic camera operations 79.3
Rural arterial routes 30.0
Urban arterial routes2 7.0
Strategic road policing – NRSC test area 5.0
Commercial Vehicle Investigation Unit 106.0
Prosecution services 41.3
Youth Education Service 42.0
General Duties Branch – non-strategic road policing3 274.1
Total 1,762.6 1 Guiding rule: 50% of strategic road policing - speed control, drinking or drugged driver
control, restraint device control and visible road safety and general enforcement
2 Unit delivers strategic road policing activities and police community services activities
3 Includes crash attendance and investigation, traffic management, court orders and Police
community services activities
7.4 Indicative allocations of Police FTEs by regional council area and Police area
Indicative Police allocations for 2010/11 show the number of full-time equivalent (FTE) Police staff that are
funded to be delivered to the various road policing activities. These indicative FTEs are allocated to the
various road policing activities (speed enforcement, drink and/or drugged driver control, etc) as has been
the case in the past.
The following series of tables presents the indicative Police resources for activities to be delivered by
Police area in regional council areas during the 2010/11 year.
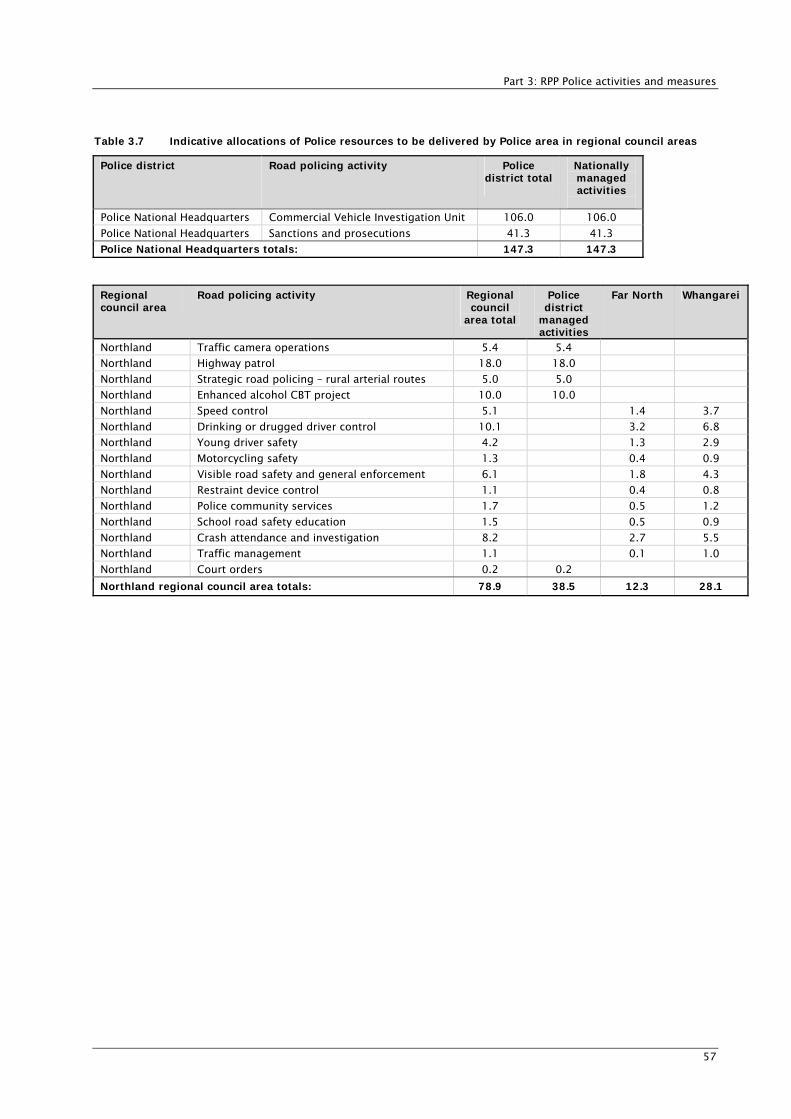
Part 3: RPP Police activities and measures
57
Table 3.7 Indicative allocations of Police resources to be delivered by Police area in regional council areas Police district Road policing activity Police
district total
Nationally managed activities
Police National Headquarters Commercial Vehicle Investigation Unit 106.0 106.0
Police National Headquarters Sanctions and prosecutions 41.3 41.3
Police National Headquarters totals: 147.3 147.3
Regional council area
Road policing activity Regional council
area total Police district
managed activities
Far North Whangarei
Northland Traffic camera operations 5.4 5.4
Northland Highway patrol 18.0 18.0
Northland Strategic road policing – rural arterial routes 5.0 5.0
Northland Enhanced alcohol CBT project 10.0 10.0
Northland Speed control 5.1 1.4 3.7
Northland Drinking or drugged driver control 10.1 3.2 6.8
Northland Young driver safety 4.2 1.3 2.9
Northland Motorcycling safety 1.3 0.4 0.9
Northland Visible road safety and general enforcement 6.1 1.8 4.3
Northland Restraint device control 1.1 0.4 0.8
Northland Police community services 1.7 0.5 1.2
Northland School road safety education 1.5 0.5 0.9
Northland Crash attendance and investigation 8.2 2.7 5.5
Northland Traffic management 1.1 0.1 1.0
Northland Court orders 0.2 0.2
Northland regional council area totals: 78.9 38.5 12.3 28.1

2010/11 Road Policing Programme
58
Regional council area
Road policing activity Regional council
area total Police
district managed activities
Rodney Waitakere North Shore
Auckland East,
West and City
Auckland Motorways
Counties Manukau South*
Counties Manukau
West, Central
and East* Auckland Traffic camera operations 22.3 22.3
Auckland Highway patrol 26.0 26.0
Auckland Strategic road policing – urban arterial routes 3.0 3.0
Auckland Enhanced alcohol CBT project 34.4 34.4
Auckland Speed control 42.5 3.4 3.0 5.1 14.8 5.6 3.3 7.3
Auckland Drinking or drugged driver control 68.9 5.0 7.6 6.7 24.8 6.1 6.7 12.0
Auckland Young driver safety 32.7 2.3 3.2 3.4 11.5 3.9 3.0 5.5
Auckland Motorcycling safety 10.9 0.7 1.0 1.1 3.8 1.5 1.0 1.8
Auckland Visible road safety and general enforcement 70.8 2.4 6.7 6.3 23.5 14.1 6.5 11.3
Auckland Restraint device control 9.3 0.6 0.8 0.7 3.3 1.0 0.9 2.0
Auckland Police community services 11.6 4.0 0.2 1.1 1.5 2.9 0.7 0.6 0.7
Auckland School road safety education 12.0 0.6 1.6 1.4 4.2 1.2 3.1
Auckland Crash attendance and investigation 74.3 2.9 6.7 8.0 28.7 6.0 5.7 16.3
Auckland Traffic management 37.5 0.4 1.3 1.0 8.9 21.9 1.1 2.9
Auckland Court orders 2.7 2.7
Auckland regional council area totals: 459.0 92.4 18.3 33.0 35.1 126.4 60.7 30.2 62.8 * Cross boundary allocations involved
Regional council area
Road policing activity Regional council
area total Police district
managed activities
Waikato East
Hamilton Taupo Waikato West
Waikato Traffic camera operations 10.8 10.8
Waikato Highway patrol 41.9 41.9
Waikato Strategic road policing – rural arterial routes 6.3 6.3
Waikato Enhanced alcohol CBT project 24.2 24.2
Waikato Speed control 15.3 3.6 2.9 3.5 5.3
Waikato Drinking or drugged driver control 24.4 5.8 5.3 5.3 8.0
Waikato Young driver safety 11.0 2.6 2.4 2.4 3.6
Waikato Motorcycling safety 3.6 0.8 0.8 0.8 1.2
Waikato Visible road safety and general enforcement 17.2 3.7 5.2 3.3 5.0
Waikato Restraint device control 3.4 0.7 0.8 0.7 1.1

Part 3: RPP Police activities and measures
59
Regional council area
Road policing activity Regional council
area total Police district
managed activities
Waikato East
Hamilton Taupo Waikato West
Waikato Police community services 2.7 0.3 1.0 0.2 1.2
Waikato School road safety education 4.4 1.2 1.2 0.7 1.2
Waikato Crash attendance and investigation 22.0 4.0 7.8 4.2 6.0
Waikato Traffic management 3.5 0.8 0.6 0.7 1.4
Waikato Court orders 1.0 1.0 Waikato regional council area totals: 191.5 84.1 23.5 27.9 21.9 34.0
Regional council area
Road policing activity Regional council
area total Police
district managed activities
Eastern Bay of Plenty*
Rotorua* Western Bay of Plenty
Bay of Plenty Traffic camera operations 6.0 6.0
Bay of Plenty Highway patrol 24.1 24.1
Bay of Plenty Strategic road policing – rural arterial routes
3.7 3.7
Bay of Plenty Enhanced alcohol CBT project 8.8 8.8
Bay of Plenty Speed control 8.8 1.3 2.5 4.9
Bay of Plenty Drinking or drugged driver control 16.3 3.8 5.3 7.2
Bay of Plenty Young driver safety 6.9 1.4 2.2 3.3
Bay of Plenty Motorcycling safety 2.1 0.4 0.7 1.0
Bay of Plenty Visible road safety and general enforcement
8.1 1.5 2.9 3.7
Bay of Plenty Restraint device control 1.6 0.4 0.6 0.7
Bay of Plenty Police community services 1.5 0.2 0.6 0.7
Bay of Plenty School road safety education 2.8 0.6 1.3 0.9
Bay of Plenty Crash attendance and investigation 10.4 2.1 2.8 5.5
Bay of Plenty Traffic management 1.3 0.2 0.8 0.3
Bay of Plenty Court orders 0.2 0.2
Bay of Plenty regional council area totals: 102.5 42.8 12.0 19.4 28.3 * Cross boundary allocations involved
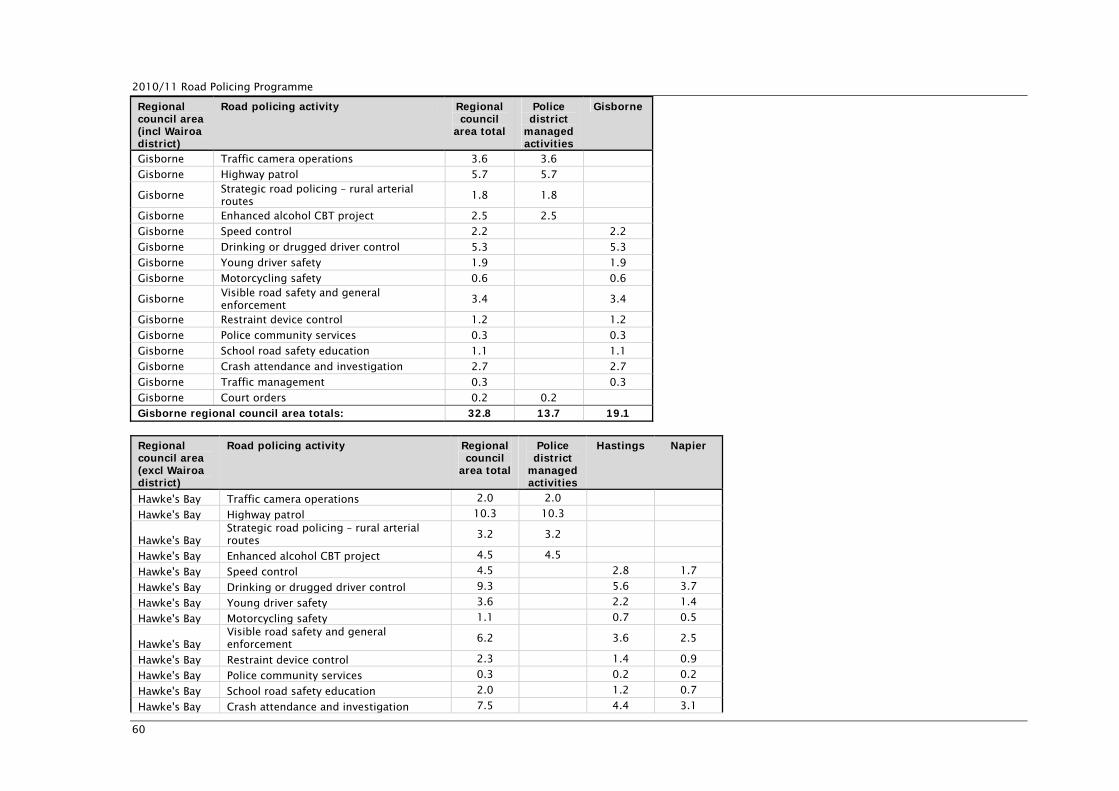
2010/11 Road Policing Programme
60
Regional council area (incl Wairoa district)
Road policing activity Regional council
area total Police district
managed activities
Gisborne
Gisborne Traffic camera operations 3.6 3.6
Gisborne Highway patrol 5.7 5.7
Gisborne Strategic road policing – rural arterial routes
1.8 1.8
Gisborne Enhanced alcohol CBT project 2.5 2.5
Gisborne Speed control 2.2 2.2
Gisborne Drinking or drugged driver control 5.3 5.3
Gisborne Young driver safety 1.9 1.9
Gisborne Motorcycling safety 0.6 0.6
Gisborne Visible road safety and general enforcement
3.4 3.4
Gisborne Restraint device control 1.2 1.2
Gisborne Police community services 0.3 0.3
Gisborne School road safety education 1.1 1.1
Gisborne Crash attendance and investigation 2.7 2.7
Gisborne Traffic management 0.3 0.3
Gisborne Court orders 0.2 0.2
Gisborne regional council area totals: 32.8 13.7 19.1
Regional council area (excl Wairoa district)
Road policing activity Regional council
area total Police
district managed activities
Hastings Napier
Hawke's Bay Traffic camera operations 2.0 2.0
Hawke's Bay Highway patrol 10.3 10.3
Hawke's Bay Strategic road policing – rural arterial routes
3.2 3.2
Hawke's Bay Enhanced alcohol CBT project 4.5 4.5
Hawke's Bay Speed control 4.5 2.8 1.7
Hawke's Bay Drinking or drugged driver control 9.3 5.6 3.7
Hawke's Bay Young driver safety 3.6 2.2 1.4
Hawke's Bay Motorcycling safety 1.1 0.7 0.5
Hawke's Bay Visible road safety and general enforcement
6.2 3.6 2.5
Hawke's Bay Restraint device control 2.3 1.4 0.9
Hawke's Bay Police community services 0.3 0.2 0.2
Hawke's Bay School road safety education 2.0 1.2 0.7
Hawke's Bay Crash attendance and investigation 7.5 4.4 3.1
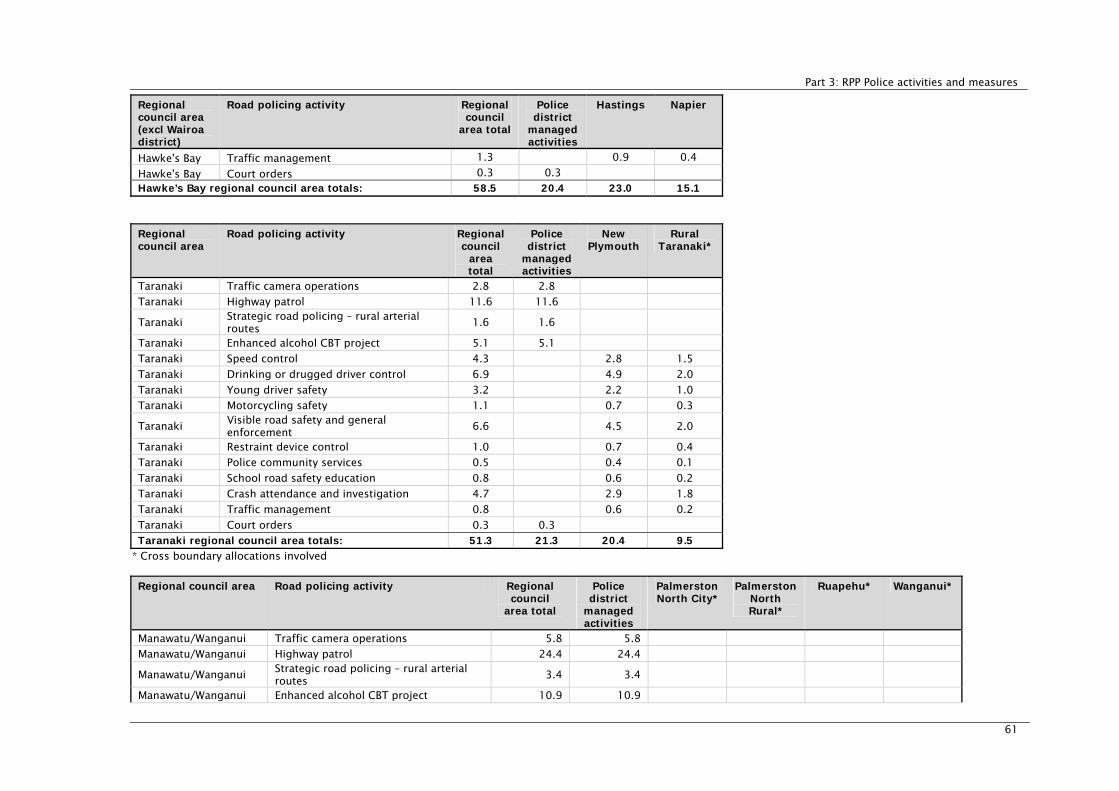
Part 3: RPP Police activities and measures
61
Regional council area (excl Wairoa district)
Road policing activity Regional council
area total Police
district managed activities
Hastings Napier
Hawke's Bay Traffic management 1.3 0.9 0.4
Hawke's Bay Court orders 0.3 0.3
Hawke’s Bay regional council area totals: 58.5 20.4 23.0 15.1
Regional council area
Road policing activity Regional council
area total
Police district
managed activities
New Plymouth
Rural Taranaki*
Taranaki Traffic camera operations 2.8 2.8
Taranaki Highway patrol 11.6 11.6
Taranaki Strategic road policing – rural arterial routes
1.6 1.6
Taranaki Enhanced alcohol CBT project 5.1 5.1
Taranaki Speed control 4.3 2.8 1.5
Taranaki Drinking or drugged driver control 6.9 4.9 2.0
Taranaki Young driver safety 3.2 2.2 1.0
Taranaki Motorcycling safety 1.1 0.7 0.3
Taranaki Visible road safety and general enforcement
6.6 4.5 2.0
Taranaki Restraint device control 1.0 0.7 0.4
Taranaki Police community services 0.5 0.4 0.1
Taranaki School road safety education 0.8 0.6 0.2
Taranaki Crash attendance and investigation 4.7 2.9 1.8
Taranaki Traffic management 0.8 0.6 0.2
Taranaki Court orders 0.3 0.3
Taranaki regional council area totals: 51.3 21.3 20.4 9.5 * Cross boundary allocations involved
Regional council area Road policing activity Regional council
area total Police district
managed activities
Palmerston North City*
Palmerston North Rural*
Ruapehu* Wanganui*
Manawatu/Wanganui Traffic camera operations 5.8 5.8
Manawatu/Wanganui Highway patrol 24.4 24.4
Manawatu/Wanganui Strategic road policing – rural arterial routes
3.4 3.4
Manawatu/Wanganui Enhanced alcohol CBT project 10.9 10.9

2010/11 Road Policing Programme
62
Regional council area Road policing activity Regional council
area total Police district
managed activities
Palmerston North City*
Palmerston North Rural*
Ruapehu* Wanganui*
Manawatu/Wanganui Speed control 10.9 2.0 3.4 3.3 2.2
Manawatu/Wanganui Drinking or drugged driver control 13.9 3.2 5.4 2.3 3.0
Manawatu/Wanganui Young driver safety 6.7 1.5 2.3 1.5 1.4
Manawatu/Wanganui Motorcycling safety 2.3 0.5 0.7 0.5 0.5
Manawatu/Wanganui Visible road safety and general enforcement
12.2 4.1 3.2 2.1 2.8
Manawatu/Wanganui Restraint device control 2.8 0.7 0.8 0.5 0.8
Manawatu/Wanganui Police community services 1.2 0.2 0.6 0.2 0.1
Manawatu/Wanganui School road safety education 2.5 0.8 0.9 0.3 0.5
Manawatu/Wanganui Crash attendance and investigation 11.5 2.7 3.8 2.5 2.5
Manawatu/Wanganui Traffic management 1.6 0.4 0.5 0.4 0.3
Manawatu/Wanganui Court orders 0.5 0.5
Manawatu/Wanganui regional council area totals: 110.8 45.1 16.2 21.6 13.7 14.2 * Cross boundary allocations involved
Regional council area
Road policing activity Regional council
area total Police
district managed activities
Kapiti-Mana
Lower Hutt
Upper Hutt
Wairarapa Wellington
Wellington Traffic camera operations 6.2 6.2
Wellington Highway patrol 14.0 14.0
Wellington Enhanced alcohol CBT project 19.0 19.0
Wellington Speed control 18.0 3.5 3.5 1.7 1.2 8.2
Wellington Drinking or drugged driver control 23.0 5.4 5.4 1.9 2.1 8.3
Wellington Young driver safety 11.3 2.4 2.5 1.0 0.9 4.5
Wellington Motorcycling safety 3.8 0.8 0.8 0.4 0.3 1.6
Wellington Visible road safety and general enforcement
20.7 3.3 4.8 2.2 1.4 9.0
Wellington Restraint device control 4.3 0.6 1.0 0.3 0.3 2.1
Wellington Police community services 1.4 0.4 0.3 0.1 0.1 0.6
Wellington School road safety education 4.5 1.0 1.2 0.5 0.5 1.3
Wellington Crash attendance and investigation 20.2 3.4 3.9 1.2 1.7 9.9
Wellington Traffic management 8.9 2.3 1.9 0.8 0.3 3.6
Wellington Court orders 1.0 1.0
Wellington regional council area totals: 156.4 40.1 23.1 25.3 10.2 8.7 49.1
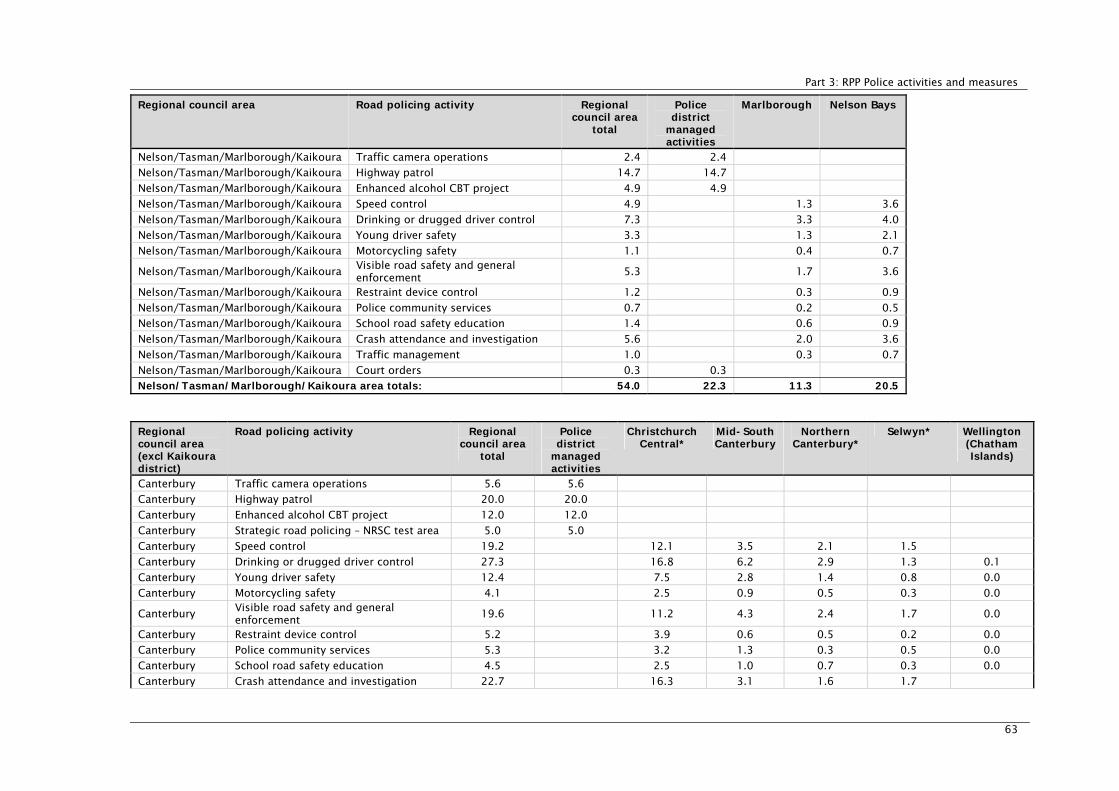
Part 3: RPP Police activities and measures
63
Regional council area Road policing activity Regional council area
total Police
district managed activities
Marlborough Nelson Bays
Nelson/Tasman/Marlborough/Kaikoura Traffic camera operations 2.4 2.4
Nelson/Tasman/Marlborough/Kaikoura Highway patrol 14.7 14.7
Nelson/Tasman/Marlborough/Kaikoura Enhanced alcohol CBT project 4.9 4.9
Nelson/Tasman/Marlborough/Kaikoura Speed control 4.9 1.3 3.6
Nelson/Tasman/Marlborough/Kaikoura Drinking or drugged driver control 7.3 3.3 4.0
Nelson/Tasman/Marlborough/Kaikoura Young driver safety 3.3 1.3 2.1
Nelson/Tasman/Marlborough/Kaikoura Motorcycling safety 1.1 0.4 0.7
Nelson/Tasman/Marlborough/Kaikoura Visible road safety and general enforcement
5.3 1.7 3.6
Nelson/Tasman/Marlborough/Kaikoura Restraint device control 1.2 0.3 0.9
Nelson/Tasman/Marlborough/Kaikoura Police community services 0.7 0.2 0.5
Nelson/Tasman/Marlborough/Kaikoura School road safety education 1.4 0.6 0.9
Nelson/Tasman/Marlborough/Kaikoura Crash attendance and investigation 5.6 2.0 3.6
Nelson/Tasman/Marlborough/Kaikoura Traffic management 1.0 0.3 0.7
Nelson/Tasman/Marlborough/Kaikoura Court orders 0.3 0.3
Nelson/Tasman/Marlborough/Kaikoura area totals: 54.0 22.3 11.3 20.5
Regional council area (excl Kaikoura district)
Road policing activity Regional council area
total Police district
managed activities
Christchurch Central*
Mid-South Canterbury
Northern Canterbury*
Selwyn* Wellington (Chatham Islands)
Canterbury Traffic camera operations 5.6 5.6
Canterbury Highway patrol 20.0 20.0
Canterbury Enhanced alcohol CBT project 12.0 12.0
Canterbury Strategic road policing – NRSC test area 5.0 5.0
Canterbury Speed control 19.2 12.1 3.5 2.1 1.5
Canterbury Drinking or drugged driver control 27.3 16.8 6.2 2.9 1.3 0.1
Canterbury Young driver safety 12.4 7.5 2.8 1.4 0.8 0.0
Canterbury Motorcycling safety 4.1 2.5 0.9 0.5 0.3 0.0
Canterbury Visible road safety and general enforcement
19.6 11.2 4.3 2.4 1.7 0.0
Canterbury Restraint device control 5.2 3.9 0.6 0.5 0.2 0.0
Canterbury Police community services 5.3 3.2 1.3 0.3 0.5 0.0
Canterbury School road safety education 4.5 2.5 1.0 0.7 0.3 0.0
Canterbury Crash attendance and investigation 22.7 16.3 3.1 1.6 1.7
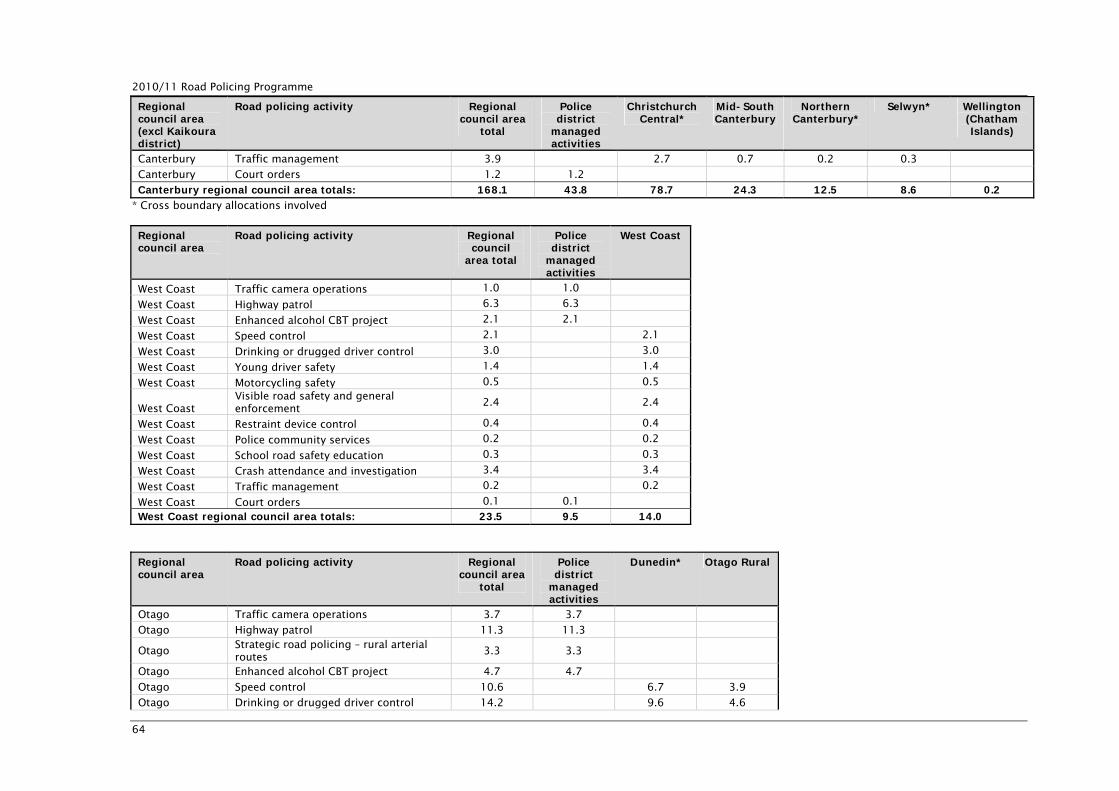
2010/11 Road Policing Programme
64
Regional council area (excl Kaikoura district)
Road policing activity Regional council area
total Police district
managed activities
Christchurch Central*
Mid-South Canterbury
Northern Canterbury*
Selwyn* Wellington (Chatham Islands)
Canterbury Traffic management 3.9 2.7 0.7 0.2 0.3
Canterbury Court orders 1.2 1.2
Canterbury regional council area totals: 168.1 43.8 78.7 24.3 12.5 8.6 0.2 * Cross boundary allocations involved
Regional council area
Road policing activity Regional council
area total Police
district managed activities
West Coast
West Coast Traffic camera operations 1.0 1.0
West Coast Highway patrol 6.3 6.3
West Coast Enhanced alcohol CBT project 2.1 2.1
West Coast Speed control 2.1 2.1
West Coast Drinking or drugged driver control 3.0 3.0
West Coast Young driver safety 1.4 1.4
West Coast Motorcycling safety 0.5 0.5
West Coast Visible road safety and general enforcement
2.4 2.4
West Coast Restraint device control 0.4 0.4
West Coast Police community services 0.2 0.2
West Coast School road safety education 0.3 0.3
West Coast Crash attendance and investigation 3.4 3.4
West Coast Traffic management 0.2 0.2
West Coast Court orders 0.1 0.1
West Coast regional council area totals: 23.5 9.5 14.0
Regional council area
Road policing activity Regional council area
total Police district
managed activities
Dunedin* Otago Rural
Otago Traffic camera operations 3.7 3.7
Otago Highway patrol 11.3 11.3
Otago Strategic road policing – rural arterial routes
3.3 3.3
Otago Enhanced alcohol CBT project 4.7 4.7
Otago Speed control 10.6 6.7 3.9
Otago Drinking or drugged driver control 14.2 9.6 4.6
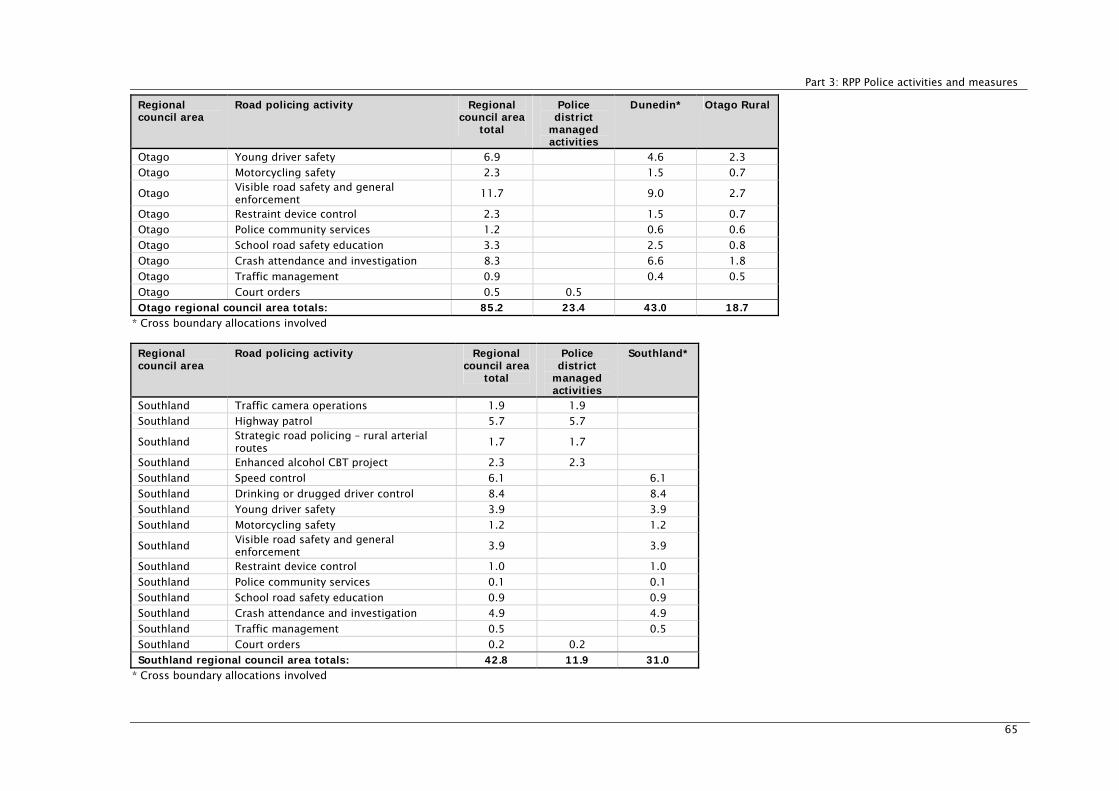
Part 3: RPP Police activities and measures
65
Regional council area
Road policing activity Regional council area
total Police district
managed activities
Dunedin* Otago Rural
Otago Young driver safety 6.9 4.6 2.3
Otago Motorcycling safety 2.3 1.5 0.7
Otago Visible road safety and general enforcement
11.7 9.0 2.7
Otago Restraint device control 2.3 1.5 0.7
Otago Police community services 1.2 0.6 0.6
Otago School road safety education 3.3 2.5 0.8
Otago Crash attendance and investigation 8.3 6.6 1.8
Otago Traffic management 0.9 0.4 0.5
Otago Court orders 0.5 0.5
Otago regional council area totals: 85.2 23.4 43.0 18.7 * Cross boundary allocations involved
Regional council area
Road policing activity Regional council area
total Police
district managed activities
Southland*
Southland Traffic camera operations 1.9 1.9
Southland Highway patrol 5.7 5.7
Southland Strategic road policing – rural arterial routes
1.7 1.7
Southland Enhanced alcohol CBT project 2.3 2.3
Southland Speed control 6.1 6.1
Southland Drinking or drugged driver control 8.4 8.4
Southland Young driver safety 3.9 3.9
Southland Motorcycling safety 1.2 1.2
Southland Visible road safety and general enforcement
3.9 3.9
Southland Restraint device control 1.0 1.0
Southland Police community services 0.1 0.1
Southland School road safety education 0.9 0.9
Southland Crash attendance and investigation 4.9 4.9
Southland Traffic management 0.5 0.5
Southland Court orders 0.2 0.2
Southland regional council area totals: 42.8 11.9 31.0 * Cross boundary allocations involved
2010/11 Road Policing Programme
66
8 RPP reporting and monitoring
8.1 The format and content of quarterly reports
The Commissioner reports each quarter to the Minister of Transport and the Minister of Police, under an
annual performance agreement, with a copy to the Chairperson of the NZ Transport Agency, on the NZ
Police’s performance in delivering road policing activities and contributing to road safety outcomes for
that period.
8.2 Financial reporting and year-end overview
In terms of financial reporting, the quarterly report provides service delivery costs for each output against
budget by quarter and year to date. Details of service delivery costs, expressed as FTEs, are on pages 57–
65 of this 2010/11 RPP.
The fourth quarter report includes an overview of the full year’s approved baseline, expected outturn and
performance, together with reasons for material variances.
8.3 Performance measurement
Police use a variety of performance measure and monitoring processes as appropriate for national, district
and area levels. The overarching road policing measures are contained in the 2010/11 Information for
Appropriations for Vote Police, Output Expense Seven – Road Safety Programme. Comprehensive road
policing performance measures and reporting requirements are contained on pages 33–51 of this
2010/11 RPP.
Part 4: NZ Police RPP delivery arrangements

2010/11 Road Policing Programme
68
Part 4: NZ Police RPP delivery arrangements
69
Contents – Police delivery arrangements
1 Risk-targeted road policing delivery....................................................................................................................71
1.1 NZ Police tasking and coordination .......................................................................................71 1.2 Road safety action planning and network safety coordination ...............................................71 1.3 The National Land Transport Programme ..............................................................................75
2 NZ Police road policing delivery arrangements ...............................................................................................75
2.1 Specialist groups...................................................................................................................75 2.2 Road policing by the General Duties Branch ..........................................................................79 2.3 Other road policing and road safety groups ..........................................................................80

2010/11 Road Policing Programme
70

Part 4: NZ Police RPP delivery arrangements
71
1 Risk-targeted road policing delivery
Risk-targeted road policing is the fundamental basis of road policing. Risks are identified through a
number of mechanisms including the examination of crash data, recorded offending levels, traffic
complaints, and details about repeat offenders and repeat offending. Risk-targeted road policing operates
through the tasking and coordination process which occurs at national, district and area level. Part of this
process is the collection, collation, analysis and dissemination of data to produce intelligence which is
then used to inform decisions about deployment based on risk. Risk targeting is based on historical data
which is supplemented with current intelligence about things such as events and anticipated traffic
movements.
Key to area-based road policing is interconnection with the road safety action planning process. NZ Police
plays an important partnership role which includes feeding road safety intelligence into the road safety
action planning process as well as jointly determining action plans with partners. There is also a feedback
loop from the process into wider Police intelligence processes.
1.1 NZ Police tasking and coordination
Tasking and coordination is a process developed by NZ Police that supports intelligence-led policing and
the community policing model. It encompasses a whole-of-police approach to problem solving.
The tasking and coordination process:
empowers key decision makers to drive operational activity
allows them to prioritise that work
ensures across-the-board accountability for actions undertaken
is forward looking, evidence based and proactive, with an emphasis on outcomes and solutions
links participation, partnerships, community priorities and protection in the community policing
approach
Tasking and coordination offers many benefits in that it allows Police to:
maximise the use and impact of all Police resources
provide a clear link between deployment decisions and business priorities
better manage and increase focus on crash and crime reduction, and prevention and public
reassurance in a way that supports a cooperative, whole-of-government approach
use a risk-targeted deployment approach that targets defined individual and collective risk
have more impact on priority community problems through engagement and cooperation with
partners.
1.2 Road safety action planning and network safety coordination
1.2.1 Regional road safety strategies Regional road safety strategies (RRSSs) provide the context for road safety action planning and network
safety coordination.

2010/11 Road Policing Programme
72
A RRSS is a framework that provides guidance, rationale and direction for actions to be taken to achieve
defined road safety goals. It provides a context for road safety within a range of national and regional
legislation, strategies and policies, and outlines the regionally agreed direction for improving road safety
on a region’s roads.
RRSSs must take into account relevant national documents (ie Safer Journeys road safety strategy to 2020,
the Government Policy Statement on Land Transport Funding 2009/10 – 2018/19, the National Land
Transport Programme (NLTP)) and regional strategies (eg regional land transport strategies). The strategy
should be developed in consultation with key road safety partners and stakeholders, and:
provide strategic direction to regional road safety stakeholders
outline a vision, targets, policies and actions to address regional road safety issues, and to deliver
improving road safety outcomes
provide a monitoring framework to assess regional road safety progress
direct and assist with the prioritisation of regional road safety funding.
1.2.2 Road safety action planning Road safety action planning is a world best-practice process for local engagement and planning and
implementing road safety interventions by road safety partners. Continued and enhanced road safety
action planning, reflecting a safe system approach, is one of the essential platforms for delivering the
Safer Journeys road safety strategy.
Effective road safety action planning requires a collaborative approach from participating partners to
provide focus, commitment and urgency in order to address and mitigate road safety risks, especially in
terms of Safer Journeys high-priority road safety issues (speed, alcohol and drugs, motorcycling, young
drivers and roads and roadsides) for the local area.
Participating partners include regional and local authorities, the NZTA, the NZ Police and the Accident
Compensation Corporation (ACC), and other road safety stakeholders according to local enthusiasm. The
partners together agree on regional and/or local road safety risks, identify objectives, set targets,
undertake road safety actions, and monitor and review progress towards road safety targets.
Effective road safety action planning is an iterative process, repeated up to quarterly, which must involve:
intelligence-based analysis of road safety risks each period – to assist with this, NZ Police provide, on
an annual basis, a Road Safety Assessment for each Police area
intelligence-based analysis of activities undertaken by participating partners during the past period
agreement and commitment to deliver activities that will be undertaken during the next period
towards achieving regional/local road safety targets.
The local road safety objectives and/or targets are developed using a safe system approach and from an
inter-agency perspective. They are formed from an intelligence-based assessment of the road trauma
issues that need to be addressed and include road safety issues of local concern. Primary providers of
quarterly intelligence-based assessments of road-trauma risks are the NZTA and NZ Police; however, local
authorities and ACC also provide intelligence from their perspectives.
The primary output from the road safety action planning process is the road safety action plan (RSAP)
which records:

Part 4: NZ Police RPP delivery arrangements
73
agreed road safety targets and/or objectives, intermediate outcomes in terms of Safer Journeys high-
priority road safety issues (speed, alcohol and drugs, motorcycling, young drivers and roads and
roadsides) for the local area
a list of supportive policies, strategies, plans (including regional and local road safety plans, and
network safety coordination projects)
for each type of analysed risk:
– details of the individual activities, eg engineering, enforcement (specific or general deterrence),
crash reduction studies, education and information activities, that will be applied to the risk
– details of any campaigns that will be applied to the risk
– details of network safety coordination projects that will be applied to the risk
a list of the partners who are responsible for and participate in each of the activities, projects and
campaigns to be undertaken addressing each type of identified risk
a road safety action planning calendar identifying when campaigns and other major activities will
occur
plans for an inter-agency monitoring and reviewing programme with pre-implementation
measurement results, and post-implementation evaluation results, for each type of risk for:
– combined activities delivered
– projects undertaken
– campaigns delivered.
The road safety action planning process results in RSAPs being regularly reassessed and updated to
reflect:
the results and effectiveness of previous activities, project and campaigns undertaken
latest intelligence on road trauma risks
new activities, projects and campaigns that will be delivered for the next period (quarter) to meet
these new risks, and the agency/ies responsible for the activities, projects and campaigns.
In the wider land transport sector, road safety action planning is used to:
support applications for funding and to assist with monitoring the effectiveness of a wide range of
NLTP projects and programmes
assess the relationship between regional land transport programmes and road policing activities
help improve the accountability of all agencies involved in delivering targeted performance
aid the NZTA’s monitoring of the delivery of road policing activities, ensuring ‘value for money’ at the
Police district and area level.
In summary, road safety action planning is a key engagement and coordination mechanism for territorial
authorities to implement the Safer Journeys safe systems approach through integrated and coordinated
activities.

2010/11 Road Policing Programme
74
The resulting RSAPs are:
developed at the level of territorial authorities (either clusters of neighbours or individual councils as
suits the area) which work together on road safety issues with a coordinated and cooperative
approach
a partnership agreement through which partners of a range of disciplines accept both individual and
collective accountability for delivering road safety activities, projects and campaigns in order to
achieve increasingly positive outcomes
jointly owned by the partners, owned and facilitated by territorial authorities which prepare and
manage the planning process with assistance from all parties involved
involve regular, up to quarterly, road safety action planning meetings, at which:
– intelligence updates are provided by the NZTA and Police, complemented by local intelligence
from local authorities and ACC
– reports are provided by partners on activities delivered during the quarter
– RSAPs are monitored and updated to address both analysed and emerging road safety risks.
Aspects for development as we move forward during 2010/11 include the adequacy and effectiveness of
road safety action planning, focusing in particular on:
refreshing road safety action planning to reflect the Safer Journeys safe system approach
developing nationally consistent performance measures to assess the effectiveness of road safety
action planning, improve our understanding of successful road safety action planning, and identify
opportunities for improvement
ensuring that governance arrangements are in place for road safety action planning processes,
particularly that there is a good understanding of partner roles and responsibilities
ensuring the integration of road safety action planning with safety management systems, network
safety coordination and black spot studies, national and local ‘education and enforcement campaigns’
and community activities
meeting the requirements of the RPP with respect to the relationships between local authorities, NZ
Police and the NZTA, and ensuring RSAPs are positioned to be taken through local and regional
political processes.
The following link provides further information on road safety action planning, including templates and
exemplar RSAPs: www.nzta.govt.nz/resources/road-safety-action-plan/
1.2.3 Network safety coordination Network safety coordination projects focus on high-risk corridors through carrying out a detailed analysis
of crash trends along particularly high-risk stretches of the road network. Regional meetings of the NZTA,
relevant local authorities, community groups, ACC and Police develop a coordinated approach to focus
engineering, education and enforcement activities at targeted specific problems along these
predetermined stretches of the network. The project development, implementation and monitoring are
included in the road safety action planning process. The national offices of the NZTA and Police maintain
an interest in network safety coordination projects through receiving regular updates on progress.
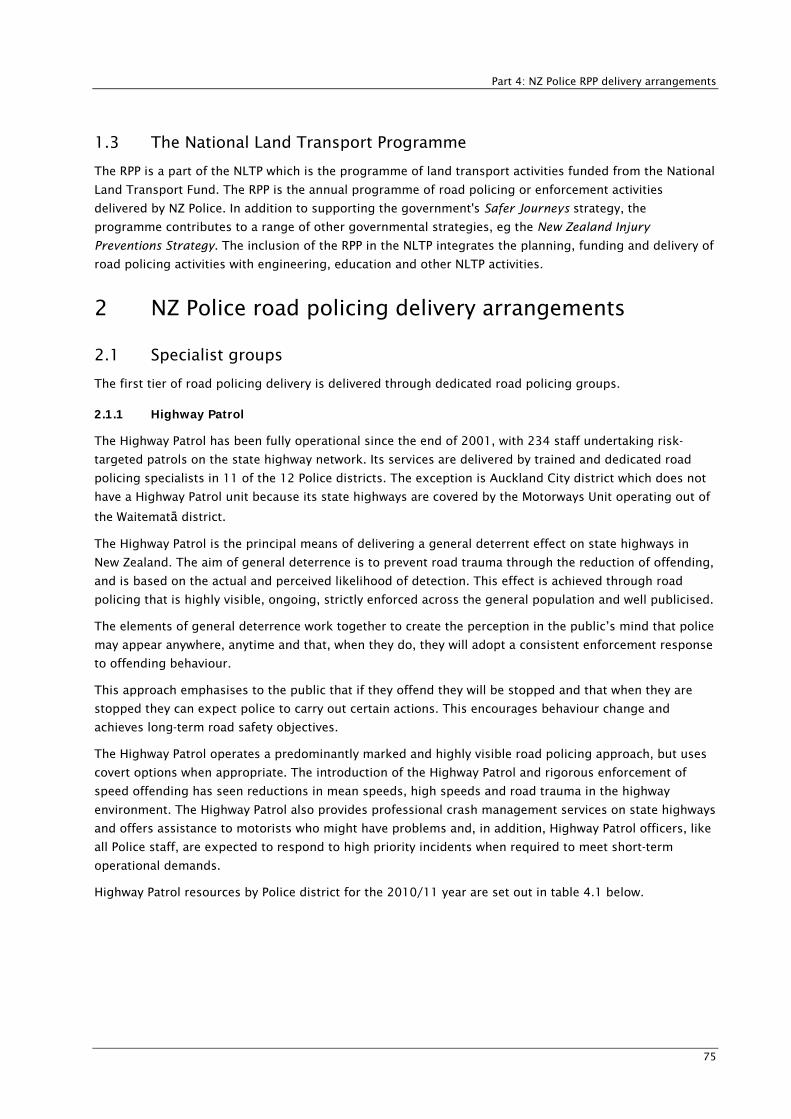
Part 4: NZ Police RPP delivery arrangements
75
1.3 The National Land Transport Programme
The RPP is a part of the NLTP which is the programme of land transport activities funded from the National
Land Transport Fund. The RPP is the annual programme of road policing or enforcement activities
delivered by NZ Police. In addition to supporting the government's Safer Journeys strategy, the
programme contributes to a range of other governmental strategies, eg the New Zealand Injury
Preventions Strategy. The inclusion of the RPP in the NLTP integrates the planning, funding and delivery of
road policing activities with engineering, education and other NLTP activities.
2 NZ Police road policing delivery arrangements
2.1 Specialist groups
The first tier of road policing delivery is delivered through dedicated road policing groups.
2.1.1 Highway Patrol The Highway Patrol has been fully operational since the end of 2001, with 234 staff undertaking risk-
targeted patrols on the state highway network. Its services are delivered by trained and dedicated road
policing specialists in 11 of the 12 Police districts. The exception is Auckland City district which does not
have a Highway Patrol unit because its state highways are covered by the Motorways Unit operating out of
the Waitematā district.
The Highway Patrol is the principal means of delivering a general deterrent effect on state highways in
New Zealand. The aim of general deterrence is to prevent road trauma through the reduction of offending,
and is based on the actual and perceived likelihood of detection. This effect is achieved through road
policing that is highly visible, ongoing, strictly enforced across the general population and well publicised.
The elements of general deterrence work together to create the perception in the public’s mind that police
may appear anywhere, anytime and that, when they do, they will adopt a consistent enforcement response
to offending behaviour.
This approach emphasises to the public that if they offend they will be stopped and that when they are
stopped they can expect police to carry out certain actions. This encourages behaviour change and
achieves long-term road safety objectives.
The Highway Patrol operates a predominantly marked and highly visible road policing approach, but uses
covert options when appropriate. The introduction of the Highway Patrol and rigorous enforcement of
speed offending has seen reductions in mean speeds, high speeds and road trauma in the highway
environment. The Highway Patrol also provides professional crash management services on state highways
and offers assistance to motorists who might have problems and, in addition, Highway Patrol officers, like
all Police staff, are expected to respond to high priority incidents when required to meet short-term
operational demands.
Highway Patrol resources by Police district for the 2010/11 year are set out in table 4.1 below.
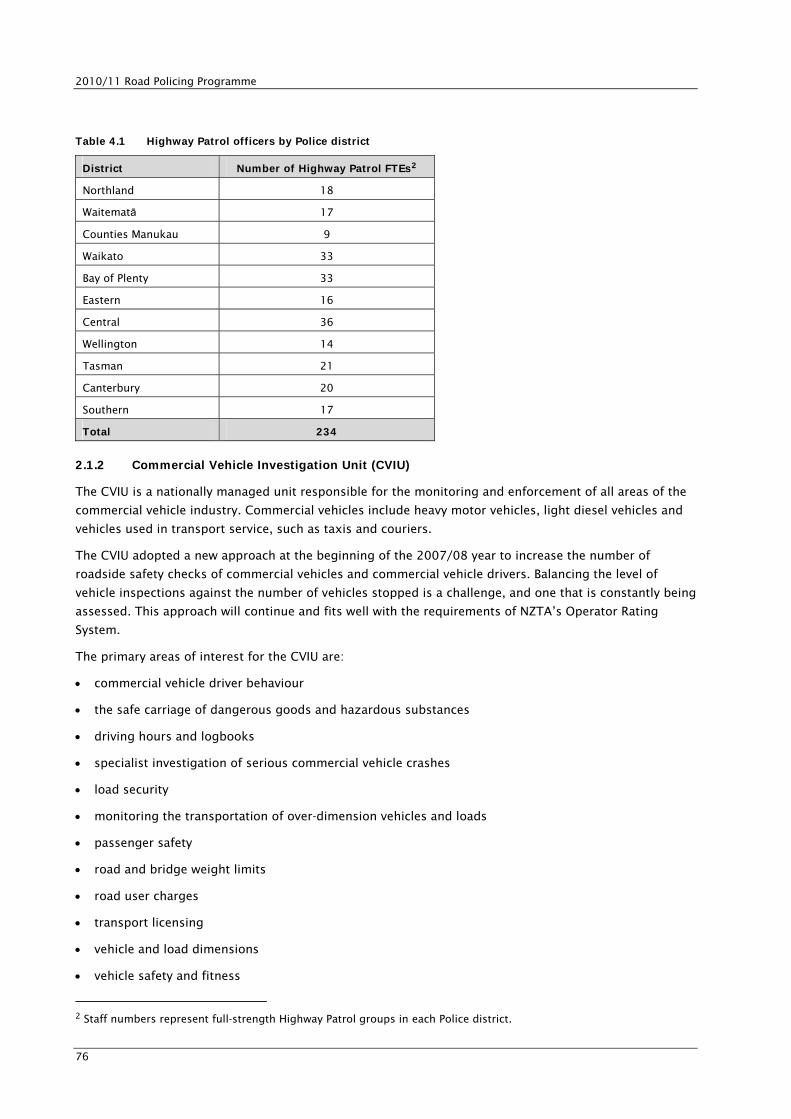
2010/11 Road Policing Programme
76
Table 4.1 Highway Patrol officers by Police district
District Number of Highway Patrol FTEs2 Northland 18
Waitematā 17
Counties Manukau 9
Waikato 33
Bay of Plenty 33
Eastern 16
Central 36
Wellington 14
Tasman 21
Canterbury 20
Southern 17
Total 234
2.1.2 Commercial Vehicle Investigation Unit (CVIU) The CVIU is a nationally managed unit responsible for the monitoring and enforcement of all areas of the
commercial vehicle industry. Commercial vehicles include heavy motor vehicles, light diesel vehicles and
vehicles used in transport service, such as taxis and couriers.
The CVIU adopted a new approach at the beginning of the 2007/08 year to increase the number of
roadside safety checks of commercial vehicles and commercial vehicle drivers. Balancing the level of
vehicle inspections against the number of vehicles stopped is a challenge, and one that is constantly being
assessed. This approach will continue and fits well with the requirements of NZTA’s Operator Rating
System.
The primary areas of interest for the CVIU are:
commercial vehicle driver behaviour
the safe carriage of dangerous goods and hazardous substances
driving hours and logbooks
specialist investigation of serious commercial vehicle crashes
load security
monitoring the transportation of over-dimension vehicles and loads
passenger safety
road and bridge weight limits
road user charges
transport licensing
vehicle and load dimensions
vehicle safety and fitness
2 Staff numbers represent full-strength Highway Patrol groups in each Police district.

Part 4: NZ Police RPP delivery arrangements
77
environmental issues (vehicles emitting excessive smoke and noise)
occupational safety and health (Health and Safety in Employment Act 1992) investigations focusing on
driver workplace safety and vehicle fitness.
The CVIU is divided into four areas:
Area One – all of Northland and Auckland, finishing just north of Mercer
Area Two – the Bay of Plenty, Waikato and part of the Eastern District from Gisborne northwards
Area Three – part of the Eastern District (Hawke’s Bay), Taranaki, Wanganui, Manawatu, Wairarapa and
Wellington
Area Four – all of the South Island.
The CVIU carries out three main types of operations. These are mobile operations (approximately
68 percent of CVIU work), weighbridge operations (approximately 22 percent), and mobile weighbridge
operations (approximately five percent). Management activities account for the remaining five percent of
CVIU work.
The CVIU comprises CVIU area staff, non-sworn staff, mobile constables, weighbridge constables,
intelligence analysts, vehicle safety officers, non-sworn enforcement officers and non-sworn
administration support officers, and five CVIU staff based at the Police National Headquarters.
2.1.3 Strategic Traffic Units Other dedicated road policing services are delivered by the Strategic Traffic Units (STUs) which operate in
each of the 12 NZ Police districts. These groups of specialist officers focus primarily on the delivery of
strategic traffic outputs, but also assist with major traffic events and national campaigns, help to deliver
local road safety campaigns and use risk-targeted patrol plans to help achieve traffic safety outcomes.
The activities of the STUs include assisting road users, deterring drivers from breaching road rules, and
providing specialist support and expertise regarding traffic matters. Along with the Highway Patrol and
other road policing staff, these groups follow a policy of general deterrence, (ie their activities are highly
visible and ongoing, and enforcement is applied across the general population).
As a guiding rule, 50 percent of each district's strategic traffic delivery, excluding Highway Patrol and Traffic
Alcohol Groups (TAG), is delivered by dedicated road policing groups. In addition, these staff also fulfil a
wider policing brief that incorporates activity directed at community safety.
2.1.4 Rural Arterial Patrols Rural Arterial Patrols have been introduced into the Northland, Waikato, Bay of Plenty, Eastern and Central
Southern Police districts. Each patrol consists of five additional sworn staff reporting to the district road
policing manager. These groups focus their enforcement on rural arterial routes and in particular on drink-
driving where alcohol-impaired drivers are a risk.
2.1.5 Traffic Alcohol Group (TAG) teams NZ Police has specialist TAG teams to combat alcohol-related offending on New Zealand roads based in all
12 districts. The districts use local intelligence to determine which tactics are best suited to address drink-
and/or drugged-driver-related offending in their areas, and the teams operate in both rural and urban
environments.
Among other activities, TAG teams operate high-profile compulsory breath test campaigns.
2010/11 Road Policing Programme
78
2.1.6 Crash analysis and reconstruction A number of districts have established specialist crash analysis and reconstruction personnel or teams. In
relation to fatal, potentially fatal and serious injury crashes that occur within the districts, the specialist
crash staff are tasked with:
completing all scene action including detailed analysis and dealing with the vehicles, scene marking,
property, witnesses, suspects and photography
providing advice and assistance to frontline staff to ensure high-quality investigative standards are
maintained
ensuring that scale plans (forensic maps) are completed, all relevant vehicles are inspected and all
relevant official documentation is completed (eg fatal email notification, POL 550, enquiry files and
correspondence for criminal and coroner's court proceedings)
providing comprehensive reports outlining causative factors relating to the crash being investigated
assisting with prosecutions.
The National Advisor Crash Investigation (NACI) based at Police National Headquarters provides national
oversight and training coordination for the specialist district crash analysts. The NACI also has a wider role
including liaison with partner agencies with respect to crash investigation, dissemination of crash findings
to local authorities, and assisting with information and strategies to support deployment decisions in
order to reduce crashes.
2.1.7 Traffic camera operations Speed is one of the main factors that contribute to the road toll’s deaths and injuries. Traffic cameras are
deployed throughout New Zealand in order to help reduce mean speeds, and thus speed-related crashes,
through the mechanism of general deterrence. NZ Police is programmed to deliver 98,770 traffic camera
operation hours in 2010/11.
The programme is managed through the Police Infringement Bureau which is responsible for:
issuing traffic camera notices
approving traffic camera sites
researching, developing and documenting procedures and standards relating to camera deployment
maintaining a site register of all traffic camera usage
ensuring speed camera equipment is tested and calibrated according to requirements
monitoring and reporting on traffic camera data
arranging site surveys and site reviews
responding to official queries about traffic camera matters.
In order to improve the deterrent effect of speed cameras, NZ Police introduced an ‘anywhere, anytime’
policy for the operation of speed cameras in April 2004. Placing cameras so that they are not obvious to
speeding drivers raises the level of uncertainty for drivers who speed and then slow down before coming

Part 4: NZ Police RPP delivery arrangements
79
into speed camera range.3 This initiative has proven to be highly successful in positively influencing driver
behaviour and reducing the average mean speed.
A second speed initiative, the ‘Speed Kills Kids’ road safety campaign, was introduced by Police in 2006.
This initiative aims to reduce road safety risks to children and to ensure they do not lose their lives
needlessly when going to or from school. The enforcement threshold was reduced to four km/h within
250 metres on each side of school boundaries, and is designed to further reduce speeding and thus to
reduce the number of child pedestrian casualties.
Support was received from a range of stakeholders, including the NZTA, Ministry of Transport, ACC,
Ministry of Education, the New Zealand School of Trustees Association and the Automobile Association.
Their support has helped this initiative to develop and move forward successfully.
2.1.8 Urban arterial and community traffic groups In 2006/07 the Waitematā district appointed three staff to urban arterial enforcement with a focus on
reducing mean speeds, and a further four staff tasked with responding to community traffic-related issues
across the greater Auckland Region. These urban arterial and community traffic staff report to the
Waitematā Road Policing Manager who ensures records of problems and issues identified and solved will
be maintained.
2.1.9 Auckland Motorways Auckland Motorways staff provide strategic enforcement and emergency response on the Auckland
motorway network. Five additional non-sworn motorway support officers were approved in the 2008/09
year to assist with non-enforcement emergency response and traffic management services.
2.2 Road policing by the General Duties Branch
The second tier of road policing services is delivered by all general duties staff, whose principal activities
are directed towards criminal, public safety and disorder offences. General duties staff contribute to road
policing activities including attending a large number of the less serious crashes, enforcing traffic laws as
appropriate, and assisting with specialist campaigns such as drink-driving enforcement.
This active involvement in road policing by general duties staff has many benefits, including:
further enhancing the principle of general deterrence
demonstrating Police commitment to road policing as core policing
enabling a high level of enforcement on the roads
encouraging greater understanding of road policing among all branches of Police.
Road policing activities are provided by the wider NZ Police. Although dedicated road policing staff and
general duties staff deliver a significant proportion of road policing activities, these groups are supported
by CIB, youth services, iwi liaison officers, community policing staff and many other members of Police.
Road policing is a core part of providing New Zealanders with safer communities and all Police staff
support this.
3 From Vulcan, P, I Hayes, N Haworth and J Mclean (2003) Assessment of strategies, policies and programmes affecting
road safety. Victoria, Australia: Research and Safety Services.
2010/11 Road Policing Programme
80
2.3 Other road policing and road safety groups
Other major groups delivering road policing services are district and strategic intelligence analysts and
police education officers (PEOs).
2.3.1 Road policing analysts All Police districts and the CVIU have at least one road policing analyst (RPA). These analysts are usually
based within the intelligence units of the district. The role of the RPA is to support risk-targeted road
policing with the information and intelligence needed to ensure road policing delivery is as effective and
efficient as possible.
This support includes:
collection, collation and evaluation of relevant information
analysis of road safety problems, patterns and issues
linking crime problems, patterns and issues where applicable
disseminating information for strategic, operational and tactical decision-making including data
required for RSAPs and risk targeting
monitoring progress and supplying feedback to police managers, frontline staff and road safety
partners.
2.3.2 Road safety education NZ Police has a current staffing of 120 FTE PEOs. These staff are within the Youth Education Service. They
work in partnership with schools, teachers and the school community to implement programmes about
crime prevention, drug misuse prevention, road safety and violence prevention. They are trained to work
cooperatively with teachers so that youth benefit from the expertise and experience of the police officer
and see both their teacher and the police officer giving the same safety messages. PEOs are seen by
schools as road safety experts, but their job does not begin and end in the classroom as they are often
used to help solve enforcement and engineering problems within the school community.
Road safety education is a vital part of police business. Officers who work in this area:
are involved in the training and monitoring of school traffic safety teams school patrols, school
wardens and bus wardens. New Zealand is unique in training school students to operate school
crossing points, and has a proud record of a very low crash rate at these locations
help teachers deliver programmes especially developed for use in school classrooms.
Road safety programmes are produced by the Youth Education Service National Office staff in consultation
with PEOs, teachers, students, road safety agencies and other appropriate experts.
Police Road Safe series:
Stepping Out
Riding By
Out and About
Changing Gear
Dare to Drive to Survive
Drive Qual

Part 4: NZ Police RPP delivery arrangements
81
About ATVs
a msg in Contxt.
In addition, the parents' package, Helping Hands, supports the Road Safe series and informs parents of the
most appropriate times to begin teaching children a number of essential road safety skills.
Police also work in partnership with the NZTA on the RoadSense Strategy. The police officer's role is that
of the road safety expert, with the contracted facilitators providing professional development for school
staff, developing teachers’ knowledge and skill in the delivery of road safety education.
2.3.3 Road policing strategic capability Significant RPP resourcing has been made available in recent years to ensure that NZ Police is able to
underpin its targeted road policing efforts with an adequate level of strategic capability. These resources
have allowed improvements in the areas of:
national oversight of CVIU, PIB and Police Calibration Services
national oversight of road policing programmes
operationally focused research and evaluation
peer review of road policing programmes and tactics
development of operational policy and practice
road policing planning and communications
performance monitoring and reporting
oversight and development of intelligence-led and risk-targeted road policing
quality assurance and risk management
input to training and advice to road safety partners/industry
review and development of crash analysis
compliance with statutory calibration requirements
providing recommendations in respect to legislative developments.
2010/11 Road Policing Programme
82

Part 5: Glossary of terms and additional information

2010/11 Road Policing Programme
84
Part 5: Glossary of terms and additional information
85
Contents – Glossary and additional information 1 Glossary of terms...........................................................................................................................................................87
2 Geographic relationships ...........................................................................................................................................97
3 List of abbreviations.................................................................................................................................................. 102

2010/11 Road Policing Programme
86
Part 5: Glossary of terms and additional information
87
1 Glossary of terms
Appropriately trained police officers Police officers completing serious and fatal crash analytical reports should be trained to at least advanced
investigator level (Level III). Wherever possible, staff tasked with investigation into serious and fatal
crashes should be appropriately trained, or supported by an appropriately trained crash investigator.
Approved organisation An approved organisation is defined in the Land Transport Management Act 2003 as regional councils,
territorial authorities and approved public organisations which are the Department of Conservation, the
National Waitangi Trust Board and the Auckland Regional Transport Authority (ARTA).
Auckland Regional Transport Authority (ARTA) ARTA was established in 2004 to plan, fund and develop a land transport system to provide affordable,
integrated, safe, responsive and sustainable transport for the Auckland region.
Community-focused activities Community-focused land transport activities (community-focused activities) comprise both road safety and
land transport sustainability projects and activities. They include what was previously known as the
Community Road Safety Programme (CRSP), the Safer Routes trial programme (now renamed Neighbourhood
Accessibility Plans) and travel behaviour change activities. Councils work with their communities to identify
the issues that affect them and to deliver programmes that will address these issues. The funding of
community-focused activities is managed through National Land Transport Programme (NLTP) processes
which also plan and manage the funding of land transport education, engineering, public transport,
research, road policing, training and other activities. This combined planning and funding process
encourages the integration of education, enforcement and engineering activities leading to a safer and more
sustainable land transport system.
Compulsory breath testing (CBT) CBT involves the stopping of vehicles at checkpoints in order for drivers to undergo breath alcohol
screening tests. CBT projects adopt best international practice and are prevention programmes, their aim
being to convince drivers not to drink and drive.
Compulsory impairment testing A compulsory impairment test, conducted by a trained enforcement officer, comprises a series of tests to
detect a driver’s impairment by drugs. Crash analysis system (CAS) CAS is an integrated system providing tools to analyse crash data and related data. It has a mapping
capability integrated with a querying and reporting capability.
CAS integrates the following information:
Traffic crashes – approximately 38,000 are reported to the NZ Transport Agency (NZTA) each year
by the Police. Crashes are coded to categorise the crash movement and cause. The data collection
goes back to 1980 and comprises approximately 720,000 crashes.
Site data – mainly crash reduction study sites and speed camera sites. This is used for ongoing
monitoring of the effects of the crash reduction studies and speed camera programmes, and for
technical analysis of the effects of specific interventions (eg flush medians).
2010/11 Road Policing Programme
88
Crash report images – these are scanned copies of NZ Police crash reports. Analysts investigating
specific sites or crash types get maximum benefit from the crash data if they can source the original
interview notes and diagrams.
Roading data – understanding of crashes is enhanced by information about the road on which they
occur and the traffic flows on that road. Crashes and roading data have been linked to the road
vectors that are shown in the CAS maps and this allows crashes and roading data to be combined.
Information can then be provided regarding the number of crashes on a road in comparison with
what is typical for the type of road and traffic flow.
Spatial data – this is the underlying map data. It comprises roads, state highways, railways, natural
features (rivers, lakes, etc) and polygons (territorial authorities, Police districts, NZTA regions, mesh
blocks, etc).
Crash reduction studies The crash reduction study or ‘black spot’ programme has been running since 1985. Crash reduction studies
are joint initiatives between the NZTA and road providers. The programme identifies road sites with high
crash rates – black spots – and makes improvements to them where necessary. Remedial works have been
implemented at about 60 percent of black spots. Sites that have been improved have shown an average
reduction in crashes of 34 percent, which corresponds to an estimated saving of about $3.0 billion in social
cost.
FTEs (full-time equivalents) Police FTEs are calculated by dividing total hours by 1500.
Government Policy Statement on Land Transport Funding (GPS) The GPS details the government’s desired outcomes and funding priorities for the use of the National Land
Transport Fund (NLTF) in order to support activities in the land transport sector. The GPS documents the
impacts the government wishes to achieve from its investment in land transport, and how it will achieve
these impacts through funding.
Road policing is an activity class nominated by the 2009 Government Policy Statement on Land Transport
Funding 2009/10 – 2018/19 for the 2009/12 National Land Transport Programme (NLTP), and is defined
as land transport activities delivered by NZ Police.
Infringement offence notices (IONs) An ION is a prescribed form used to report traffic infringements for which the penalty provision is, in the
first instance, the payment of a set fee.
Joint crash investigation The NZTA supports road controlling authorities (RCAs) in undertaking joint crash investigations to identify
safety deficiencies and to recommend appropriate remedial measures. RCAs should examine crash records
on at least an annual basis, with reference to the annual road safety reports produced by the NZTA. A formal
crash investigation team should also be drawn together at intervals of between one and five years
(depending on the size of the RCA) to review crash patterns in more depth. In addition, a regular series of
reports on crash investigation study interventions effects is produced.

Part 5: Glossary of terms and additional information
89
Land Transport Management Act 2003 (LTMA) The purpose of the LTMA is to contribute to the achievement of an affordable, integrated, safe, responsive
and sustainable land transport system. The 2008 amendment of the LTMA established the NZ Transport
Agency.
Laser speed detection apparatus Laser speed detectors emit a narrow beam of collimated light, which is directed at individual vehicles
moving closer to or away from the laser unit. The light beam is reflected to the laser unit which measures
the change in time taken from transmission to reception. This enables the unit to calculate the distance
from the vehicle to the unit and the change in distance over time produces a direct speed reading. Laser
units can only be used in stationary mode.
Local Government Act 2002 (LGA 2002) The purpose of the LGA 2002 is to provide for democratic and effective local government that recognises
the diversity of New Zealand communities. It provides the planning and decision-making principles and
procedures local authorities must follow when deciding which activities to undertake and how they will be
undertaken.
Local campaigns A local campaign is a coordinated and pre-planned operation of at least seven days of concentrated road
policing on the activities of speeding, drink and/or drugged driving, and failure to wear restraints.
Districts are encouraged, according to risks identified through the road safety action planning process, to
combine an operation with other ‘fatal five’ activities, such as restraint and intersection enforcement
campaigns. The campaign is delivered in conjunction with supporting activity provided by local road safety
partners, such as advertising (in particular ‘moment of truth’ advertising, eg billboards, radio, pamphlets)
and behaviour surveys before and after the campaign. Local campaigns are not usually coordinated at a
national or district level. Instead, coordination normally occurs at the Police area level. Local campaigns
should be recorded in road safety action plans (RSAPs), defined by an operation order, and will have
records kept which show purpose, duration, location and outcomes achieved.
Local road safety issues and data reports Each year (around July) NZTA regional offices produce a road safety issues report and a road safety data
report for each territorial authority and regional council area, and for the state highways throughout
New Zealand. These reports provide information on crash trends over a five-year period, highlighting the
casualty characteristics, crash locations, crash types and characteristics, and the social cost of crashes.
The reports also include a brief summary of the effects of existing road safety measures and outline key
problems for the local area. In addition, the reports provide comparisons with national trends and peer
groups. The peer-group analysis compares the performance of each area with that of others with similar
characteristics. These reports are available from NZTA regional offices.
Ministry of Transport driver alcohol survey The roadside driver alcohol survey is carried out once every two years under contract to the Ministry of
Transport, with the cooperation of the Police, in order to estimate the levels of alcohol on the breath of
drivers during the main drinking times and days (ie between 10.00pm and 2.00am on Friday and Saturday
nights). Vehicles are stopped from the traffic stream while passing randomly sampled sites, and drivers
are breath tested and interviewed.
2010/11 Road Policing Programme
90
Ministry of Transport public attitudes survey This is an annual survey, undertaken through household interviews of 1600 New Zealanders (with a
minimum of 100 per local government region) to monitor attitudes to road safety issues, particularly
alcohol-impaired driving, speed and safety belt use.
Mobile breath testing (MBT) This is a Police alcohol-testing activity conducted during routine patrols, where a driver who is stopped for
any reason (other than at CBT sites) is subjected to a breath test.
Measurement of road user attitudes and behaviour The NZTA and the Ministry of Transport are responsible for the measurement of road user attitudes and
behaviour through ongoing monitoring, surveys and research including:
vehicle kilometres travelled (VKT) survey
safety belt and helmet-wearing surveys
roadside alcohol survey
speed surveys
attitude surveys
breath/blood alcohol test data.
National Land Transport Fund (NLTF) The NLTF, established by the LTMA, is the cumulative balance of land transport revenues which include
road user charges, excise duty on petrol and motor vehicle registration fees.
National Land Transport Programme (NLTP) The NLTP is the document that lists land transport education, engineering, public transport, research,
road policing, training and other activities to be funded from the NLTF for the forward three-year period.
National Road Safety Committee (NRSC) The NRSC is the principal inter-agency forum for communicating and agreeing top-level strategy between
the agencies on matters related to road safety, and for ensuring proper coordination between the parties
on all significant matters associated with road safety. The NRSC is made up of the Secretary for Transport
(chair), the Commissioner of Police, and the Chief Executives of the NZTA, the Accident Compensation
Corporation, and Local Government New Zealand. Associate members are the Director General of Health,
the Secretary for Labour and the Secretary for Justice. It has responsibility for the implementation, ongoing
monitoring and reporting on specific actions arising out of Safer Journeys.
National Road Safety Management Group (NRSMG) The NRSMG supports the NRSC and meets before and after each NRSC meeting. The NRSMG comprises
senior managers and officials from those agencies represented on the NRSC; other members may be co-
opted as appropriate. The NRSMG sets up task groups from time to time to address specific road safety
issues.
National speed surveys Annual speed surveys measure the winter speed of free-running vehicles on both rural and urban roads to
determine whether speeds are increasing or decreasing from year to year. The surveys inconspicuously
measure vehicular speeds at randomly chosen sites using laser guns or tribo-electric cables.
Part 5: Glossary of terms and additional information
91
New Zealand Transport Agency (NZTA) The NZTA is a Crown entity established on 1 August 2008, under the amended Land Transport
Management Act 2003, bringing together the functions of Land Transport New Zealand and Transit New
Zealand to provide an integrated approach to transport planning, funding and delivery.
Offence notices This is a generic term which includes all types of prescribed forms relating to traffic offences issued by the
Police. See also traffic offence notices (TONs) and infringement offence notices (IONs).
Independent Police Conduct Authority This is the statutory body that investigates complaints against the Police.
Police activities or combinations of police activities The NZTA is required to prepare every three years as from 2009, its recommendation for Police activities
or combinations of Police activities to be funded from the NLTF. These activities, in essence, comprise the
Road Policing Programme. In preparing its recommendation for the Minister of Transport's consideration
and approval, the NZTA is required to take into account how Police activities or combinations of Police
activities:
assist economic development
assist safety and personal security
improve access and mobility
protect and promotes public health
ensure environmental sustainability.
Police activity quarterly reporting requirements Quarterly reporting to the Minister of Transport and the Minister of Police on the delivery of road policing
activities as specified in Part 3 of the 2010/11 RPP and completed at the national level.
Police education officer (PEO) A PEO is a constabulary officer who has subsequently specialised in delivering Police education
programmes to schools. The training is provided by The Royal New Zealand Police College. A PEO works in
the Youth Education Service (YES) of Police.
Police Infringement Bureau (PIB) The PIB is a national office which processes offence notices issued either from the speed camera
programme or by police officers on the roadside. The PIB provides a processing service for Police districts
and a central point of contact and associated customer services for the public.
PIB processes Police Infringement Bureau (PIB) processes include court orders, warrants and summonses issued through
the Courts.
Precedent codes The table on the following page provides a summary of the precedent codes for traffic offending across
the each of the NZ Police ‘fatal five’ focus areas plus other visible road safety offences.

2010/11 Road Policing Programme
92
Series Precedent codes Description Speed E E000 Speeding offences
G G000 Speeding offences
J J000 Speed camera offences
Alcohol A A000 Alcohol -related offences
Restraints M M400 Seatbelts and restraints
N N410 Carried infant without seat or container
V V495–496,640–644 Ineffective and unapproved child restraint, and operating a vehicle
without suitable seatbelt
Dangerous and careless driving B B110 Failed to stop when followed by red/blue flashing lights
D D100–200,301, 400–900 Manner of driving
F F100–-600 Driver duties and obligations
M M200–300 Logbooks and miscellaneous
N N301–323, 353–355,404 Vehicle related offences
O O300 Rode or permitted riding a motor vehicle in a dangerous position
V V222,301,504,561,801 Vehicle equipment related offences
High-risk drivers B B184–189 Duties and obligations
D D350–354 Manner of driving
L L100,200,500 Driver licence offences
N N403 Caused damage to road
S S100,806 Motorcycle safety helmet and towing offences
V V562 Operated vehicle likely to cause damage to the road
Other visible road safety offences C C100–400 Warrant and certificate of fitness
K K500 Transport licensing-dangerous goods
N N101–201,326–348,357–401 Vehicle-related offences
O O100,200,400,500 Pedestrians, horses, moped and cycle offences
V
V130–218,225–241,303–
494,497–499,508–560,563–
633,650–704
Vehicle equipment related offences
Prosecutions A prosecution, as used in the Road Policing Programme resolutions activity, relates to all traffic notices
(IONs/TONs) whether admitted or paid, or denied and requiring a charge to be laid before a court. It also
includes all other charges relating to traffic offences that are laid before a court and progressed by the
Police Prosecution Service on behalf of the Police.

Part 5: Glossary of terms and additional information
93
Qualified external audit A function carried out by independent and qualified auditors.
Radar speed detection apparatus Radar speed detectors work by emitting a beam of microwave radio energy toward a target. If the target is
moving, the microwave energy signal’s frequency is changed by this movement and reflected back to the
radar device. The changed reflected signal, known as Doppler shift, provides a means of obtaining the
target vehicle’s speed. Police use radar devices in both stationary and mobile modes.
Regional road safety strategies (RRSSs) A RRSS is a framework that provides guidance, rationale and direction for actions to be taken to achieve
defined road safety goals across a regional area.
Regional transport committees (RTCs), regional land transport strategies (RLTSs) and regional land transport programmes (RLTPs) The amended LTMA requires that each regional council and unitary authority establish an RTC consisting
of appointees from the regional council, territorial authorities in the region, the NZTA, and one person to
represent each of the objectives of economic development, safety and personal security, public health,
access and mobility, environmental sustainability and cultural interests.
The function of each RTC is to prepare the RLTS and RLTP for its region.
RLTSs are required to contribute to the aim of achieving an affordable, integrated, safe, responsive and
sustainable land transport system, and contribute to the five NZTS objectives. An RLTS must be renewed at
least once every six years, and cover a period of at least 30 years.
RLTPs provide an avenue for approved organisations and the NZTA to recommend funding for land
transport activities from the NLTF. Activities are listed in the NLTP – see explanation above.
Restraint device A term used to describe safety equipment in motor vehicles which includes safety belts, child restraints
and infant safety seats.
Risk-targeted patrol plans (RTPPs) RTPPs are intelligence documents that provide information on risks and are critical to ensure the success
of the risk-targeted road policing model. Risk-targeted road policing operates through the Police tasking
and coordination process which occurs at national, district and area levels. Part of this process is the
collection, collation, analysis and dissemination of data to produce intelligence which is then used to
inform decisions about deployment based on risk.
Road Policing Programme (RPP) A national level road policing plan funded from the NLTF. It is updated annually and provides guidance to
Police districts of road policing activities.
Road Policing Strategy to 2010 The Road Policing Strategy to 2010 set out the road policing focus in supporting the government’s Road
Safety to 2010 strategy and the wider strategic goals of NZ Police. It is due for review at the end of 2010 –
and the review will determine how the next iteration aligns with Safer Journeys – the road safety strategy
to 2020.

2010/11 Road Policing Programme
94
Road Safe series A series of school road safety programmes produced by the Police that is linked to the New Zealand
Curriculum Framework. The programmes cover all years of the school system as follows:
Stepping Out Years 0 to 3
Riding By Years 4 to 6
Out and About Years 7 and 8
Changing Gear Years 9 and 10
A msg in contxt Years 9 to 13
Drive qual Years 11 to 13
Tracks are for Trains Years 4 to 8
Road safety action plans (RSAPs) RSAPs are developed at the territorial local authority level, or at the level of territorial local authority
clusters or at Police district level. They involve a collaborative process whereby the key partners, namely
the NZTA, local authorities, the Police and community representatives agree on risks, identify objectives,
direct tasks, set targets, develop plans and monitor and review progress. RSAPs are a partnership
agreement in which partners accept individual and collective accountability. They are a jointly owned
document of the key partners.
Road safety coordinators (RSCs) RSCs play a key role in promoting and coordinating community awareness of road safety and in facilitating
community, organisational and individual involvement in local road safety activities. RSCs are generally
appointed by local authorities in conjunction with local road safety coordinating groups and are funded
through community focused activities – see explanation above.
Road Safety to 2010 strategy The government's Road Safety to 2010 strategy provided the direction for road safety in New Zealand to
2010, and described the results the then government planned to achieve. The goal was to reduce road
casualties to fewer than 300 deaths and 4,500 hospitalisations per year by the end of 2010. This strategy
has now been replaced by the Safer Journeys road safety strategy to 2020.
Road controlling authorities (RCAs) RCAs are territorial authorities and the NZTA. They have management responsibility for all public roads
within their boundaries (in the case of territorial authorities) and for the national state highway network (in
the case of the NZTA).
Road trauma-promoting offences Designated offences which increase the risk of a traffic crash or the severity of injuries received in a crash,
for example: speeding, drink-driving, failing to stop at a Stop sign, corner cutting and overtaking at ‘no
passing’ lines, or failing to wear a safety belt.

Part 5: Glossary of terms and additional information
95
Rules process Briefly, there are five colour-coded stages that a rule can pass through as it moves from being a proposal
to becoming law:
Blue phase – initiation of policy proposals
The relevant sections of the NZTA or the Ministry of Transport prepare the proposed policy. This phase
may include discussion papers or a statement of proposed policy.
Red phase – formal write-up of policy proposals as a legal draft (optional)
This is an optional phase for which a preliminary draft of the rule is prepared. The draft is distributed to a
limited audience, essentially registered interest groups.
Yellow phase – draft for public consultation
This is the official draft which is prepared for comment. It is advertised in newspapers and distributed
widely for public comment.
Green phase – draft for information (optional)
This is an optional phase. A draft is prepared that may be released at the discretion of the NZTA if, for
example, there have been major changes in the policy or a significant delay since the yellow draft was
released.
White phase – departmental draft
This is the final draft which is sent to the Ministry of Transport with accompanying papers. The Ministry
may also decide to circulate this draft to other government departments and agencies. After the white
phase the final rule is submitted to the Minister of Transport to be signed into law, if agreed by Cabinet.
Safer Journeys – road safety strategy to 2020 Safer Journeys is the government’s 2010 to 2020 strategy for road safety in New Zealand with the long-
term vision of ‘a safe road system increasingly free of death and serious injury’. The strategy sets the
direction New Zealand will take to achieve this vision by reducing the number of deaths and injuries on
our roads.
School traffic safety teams (STSTs) The name given to the collective operations of the school patrol, traffic and bus warden systems. STST
personnel are trained by PEOs at the end of the year, with re-training early in the New Year. School patrols
are monitored throughout the year by PEOs and other Police staff who have been trained in monitoring
school patrols.
Significant events These are local, national and international events of significant size which warrant special Police attention
to traffic problems that are likely to arise.
Speed black spots Areas of road which have a history of serious crashes and where speed is identified as a significant factor
in those crashes.

2010/11 Road Policing Programme
96
Targeted audience rating points (TARPs) TARPs measure the percentage of viewers in the target audience watching the advertisement relative to
the advertising spend.
Tasking and coordination Tasking and coordination is a process developed by Police, which supports both intelligence-led policing
and the community policing model. It encompasses a ‘whole of Police’ approach to problem solving.
Traffic Alcohol Group (TAG) TAG teams are specialist groups established to combat alcohol-related offending on New Zealand’s roads.
Police districts use local intelligence to decide which tactics are best suited to address alcohol-related
offending in their areas, and teams operate in both rural and urban environments. Among other things,
the TAG teams operate high-profile CBT campaigns. These normally involve a mixture of resources
including a ‘booze bus’ and marked and unmarked cars.
Traffic offence notices (TONs) A TON is a prescribed form used to report traffic offences, other than those issued as IONs, and are
generally issued for serious offences.
Traffic surveillance Traffic surveillance involves monitoring the progress and behaviour of traffic streams, particularly at times
of heavy traffic flows.
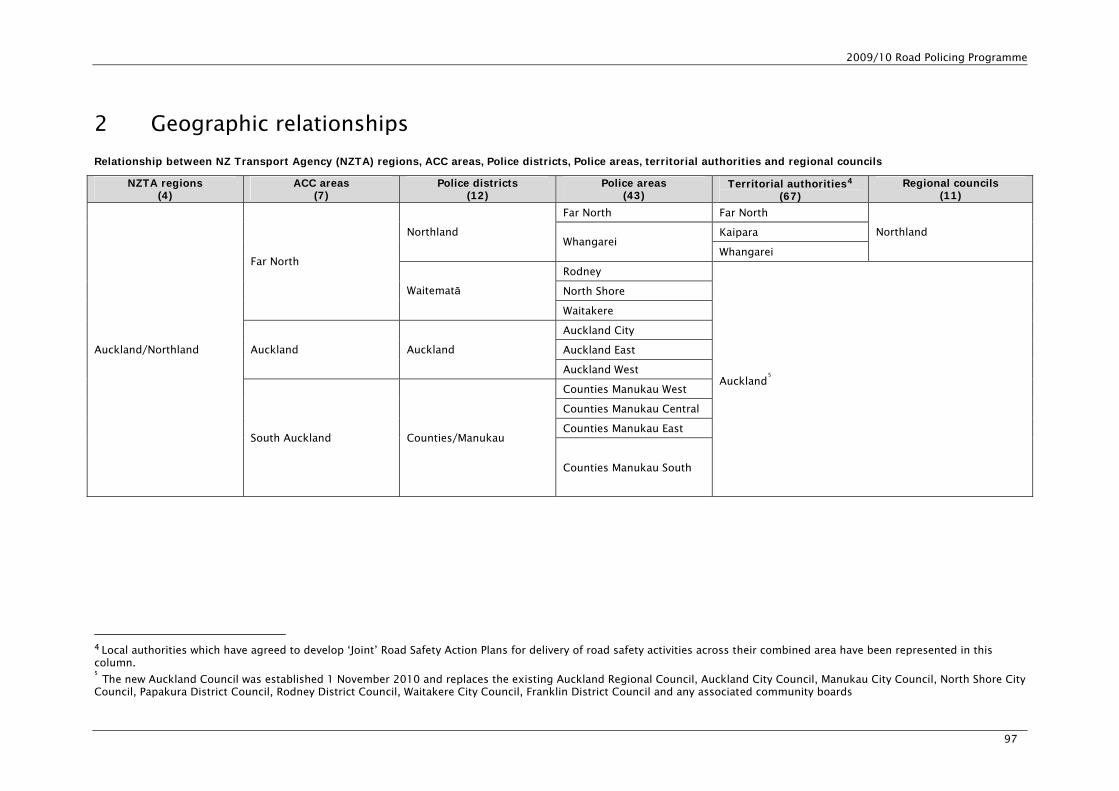
2009/10 Road Policing Programme
97
2 Geographic relationships
Relationship between NZ Transport Agency (NZTA) regions, ACC areas, Police districts, Police areas, territorial authorities and regional councils NZTA regions
(4) ACC areas
(7) Police districts
(12) Police areas
(43) Territorial authorities4
(67) Regional councils
(11) Far North Far North
Kaipara Northland Whangarei
Whangarei
Northland
Rodney
North Shore
Far North
Waitematā
Waitakere
Auckland City
Auckland East Auckland Auckland
Auckland West
Counties Manukau West
Counties Manukau Central
Counties Manukau East
Auckland/Northland
South Auckland Counties/Manukau
Counties Manukau South
Auckland5
44 Local authorities which have agreed to develop ‘Joint’ Road Safety Action Plans for delivery of road safety activities across their combined area have been represented in this column. 55 The new Auckland Council was established 1 November 2010 and replaces the existing Auckland Regional Council, Auckland City Council, Manukau City Council, North Shore City Council, Papakura District Council, Rodney District Council, Waitakere City Council, Franklin District Council and any associated community boards
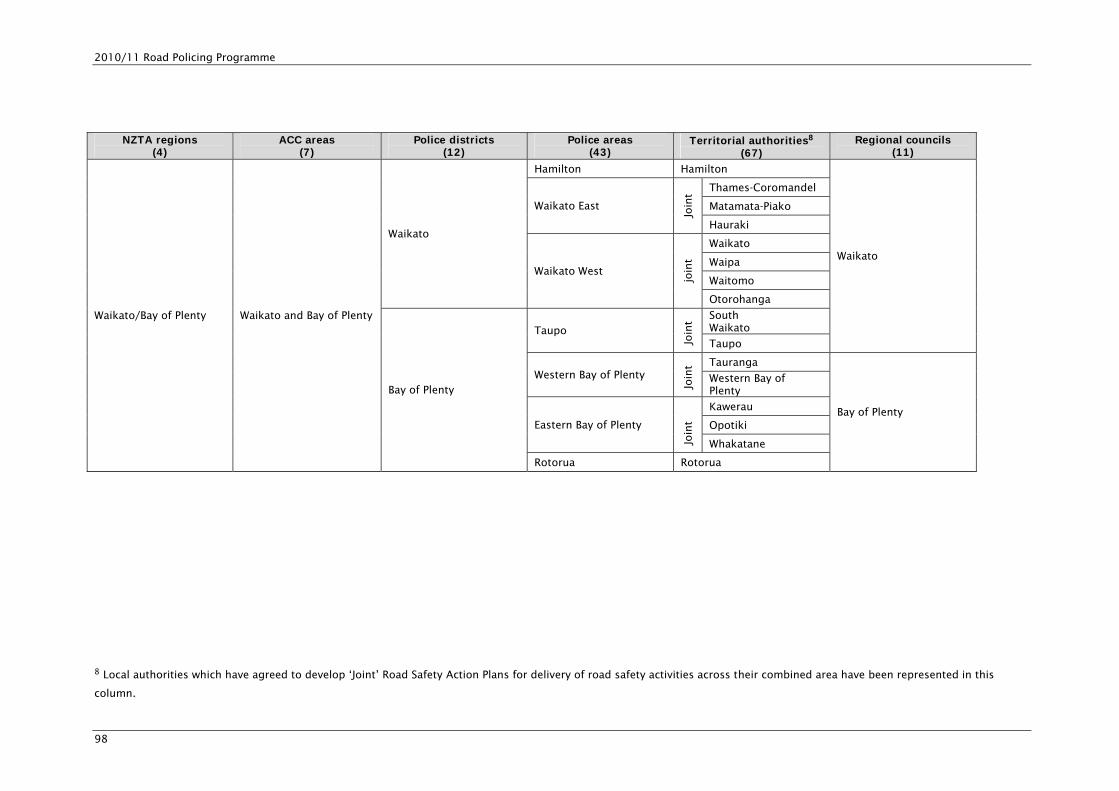
2010/11 Road Policing Programme
98
NZTA regions (4)
ACC areas (7)
Police districts (12)
Police areas (43)
Territorial authorities8 (67)
Regional councils (11)
Hamilton Hamilton
Thames-Coromandel
Matamata-Piako Waikato East
Join
t
Hauraki
Waikato
Waipa
Waitomo
Waikato
Waikato West
join
t
Otorohanga
South Waikato Taupo
Join
t
Taupo
Waikato
Tauranga Western Bay of Plenty
Join
t
Western Bay of Plenty
Kawerau
Opotiki Eastern Bay of Plenty
Join
t
Whakatane
Waikato/Bay of Plenty Waikato and Bay of Plenty
Bay of Plenty
Rotorua Rotorua
Bay of Plenty
8 Local authorities which have agreed to develop ‘Joint’ Road Safety Action Plans for delivery of road safety activities across their combined area have been represented in this
column..
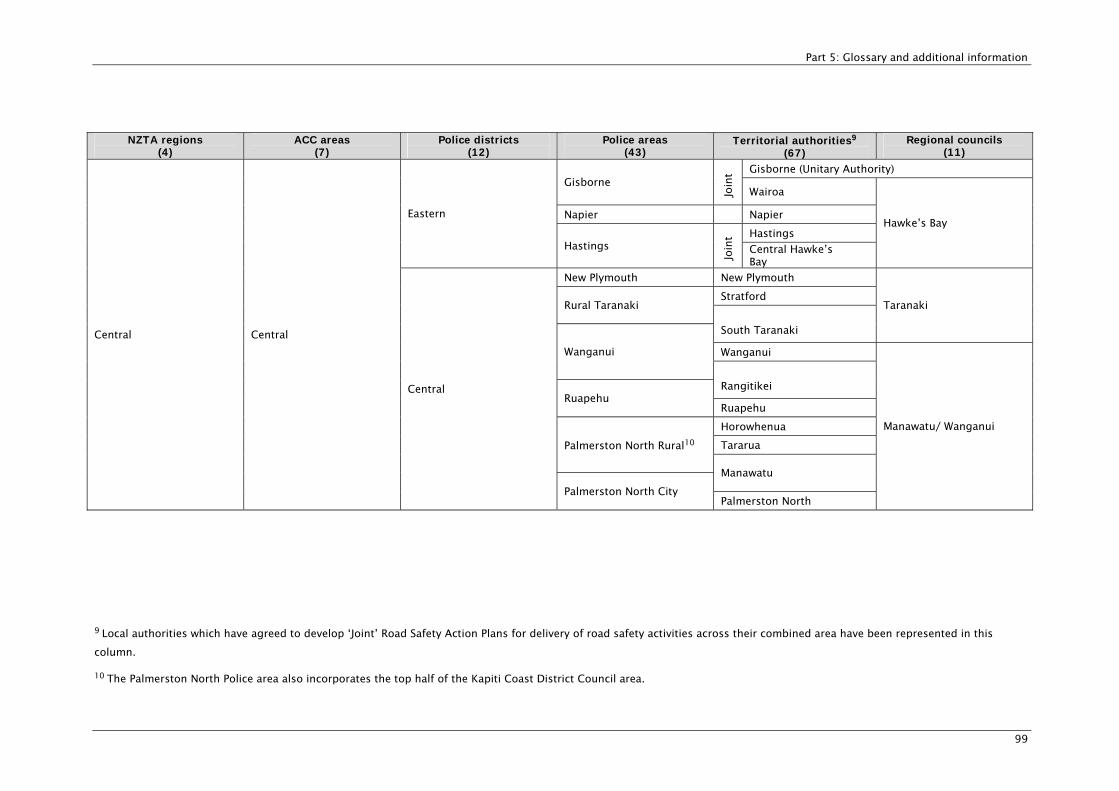
Part 5: Glossary and additional information
99
NZTA regions (4)
ACC areas (7)
Police districts (12)
Police areas (43)
Territorial authorities9 (67)
Regional councils (11)
Gisborne (Unitary Authority) Gisborne
Join
t
Wairoa
Napier Napier
Hastings
Eastern
Hastings
Join
t
Central Hawke’s Bay
Hawke’s Bay
New Plymouth New Plymouth
Stratford Rural Taranaki
South Taranaki
Taranaki
Wanganui Wanganui
Rangitikei Ruapehu
Ruapehu
Horowhenua
Tararua Palmerston North Rural10
Manawatu
Central Central
Central
Palmerston North City Palmerston North
Manawatu/ Wanganui
9 Local authorities which have agreed to develop ‘Joint’ Road Safety Action Plans for delivery of road safety activities across their combined area have been represented in this
column.
10 The Palmerston North Police area also incorporates the top half of the Kapiti Coast District Council area.

2010/11 Road Policing Programme
100
NZTA regions (4)
ACC areas (7)
Police districts (12)
Police areas (43)
Territorial authorities (67)11
Regional councils (11)
Kapiti Coast Kapiti-Mana
Join
t
Porirua
Wellington Wellington
LLoowweerr HHuutttt Hutt City
Upper Hutt Upper Hutt
South Wairarapa
Carterton Wairarapa
Join
t
Masterton
Wellington Wellington
[Wellington] Chatham Islands12
Nelson (Unitary Authority) Nelson Bays
Join
t
Tasman (Unitary Authority)
Central
Marlborough (Unitary Authority)
Southern
Wellington
Tasman
Marlborough Join t
Kaikoura Canterbury
11 Local authorities which have agreed to develop ‘Joint’ Road Safety Action Plans for delivery of road safety activities across their combined area have been represented in this
column.
12 Chatham Islands policing is administered under the Wellington Police district. NZTA’s links with Chatham Islands is through its Southern Region (Christchurch office).
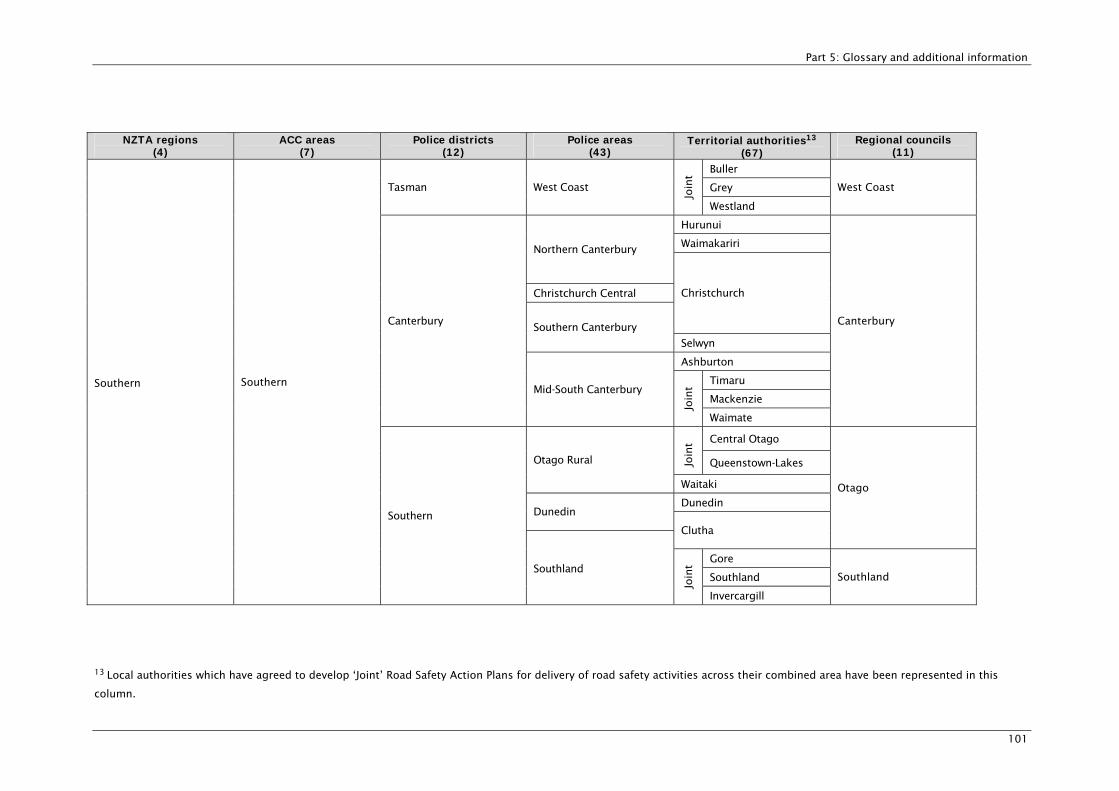
Part 5: Glossary and additional information
101
NZTA regions (4)
ACC areas (7)
Police districts (12)
Police areas (43)
Territorial authorities13 (67)
Regional councils (11)
Buller
Grey Tasman West Coast
Join
t
Westland
West Coast
Hurunui
Waimakariri Northern Canterbury
Christchurch Central Christchurch
Southern Canterbury
Selwyn
Ashburton
Timaru
Mackenzie
Canterbury
Mid-South Canterbury
Join
t
Waimate
Canterbury
Central Otago
Join
t
Queenstown-Lakes Otago Rural
Waitaki
Dunedin Dunedin
Clutha
Otago
Gore
Southland
Southern Southern
Southern
Southland
Join
t
Invercargill
Southland
13 Local authorities which have agreed to develop ‘Joint’ Road Safety Action Plans for delivery of road safety activities across their combined area have been represented in this
column.

2010/11 Road Policing Programme
102
3 List of abbreviations
ACC Accident Compensation Corporation
AMS Activity Management System
ANPR Automatic number plate recognition
ARTA Auckland Regional Transport Authority
AVL Automatic vehicle location
BAC Breath alcohol content
CAS Crash analysis system
CBT Compulsory breath test(ing)
CIT Compulsory impairment testing
CRSP Community Road Safety Programme
CVIU Commercial Vehicle Investigation Unit
DIR Drug influence recognition
EBA Evidential breath alcohol
ECN Enterprise Communications Network (NZ Police)
ESR Institute of Environmental Science and Research Ltd
FIT Field impairment testing
FTE Full-time equivalent
GPS Government Policy Statement on Land Transport Funding
HMV Heavy motor vehicle
HSC Health Sponsorship Council
ICT Information and communication technology
ION Infringement offence notice
IT Information technology
ITS Intelligence transport system
LGA Local Government Act 2002
Land Transport NZ Land Transport New Zealand
LES Law Enforcement System
LTMA Land Transport Management Act 2003
LTP Land transport programme
MBT Mobile breath test(ing)
MoT Ministry of Transport
NACI National Advisor Crash Investigation
NEECS National Energy Efficiency and Conservation Strategy
NLTA National Land Transport Account
NLTF National Land Transport Fund
NLTP National Land Transport Programme
NRSC National Road Safety Committee
NRSMG National Road Safety Management Group
NZEECS New Zealand Energy Efficiency and Conservation Strategy
NZIPS New Zealand Injury Prevention Strategy
NZ Police or Police New Zealand Police
NZTA New Zealand Transport Agency
NZTS New Zealand Transport Strategy
ORS Operator rating system
PCS Police Calibration Services
PEO Police education officer
PIB Police Infringement Bureau
PPDP Police Professional Driving Programme
RCA Road controlling authority
RLTP Regional land transport programme
RLTS Regional land transport strategy
RPA Road policing analyst

Part 5: Glossary and additional information
103
RPP Road Policing Programme
RPS to 2010 Road Policing Strategy to 2010
RRSSs Regional road safety strategies
RSAP Road safety action plan
RSC Road safety coordinator
RTC Regional transport committee
RTPP Risk-targeted patrol plan
SMART Secure Mobile Access and Recording Technology
STST School traffic safety team
STU Strategic Traffic Unit
T&C Tasking and coordination
TAG Traffic Alcohol Group
TARP Targeted audience rating point
TON Traffic offence notice
TSL Transport service licence
T&C Tasking and coordination
VKT Vehicle kilometres travelled

2010/11 Road Policing Programme
104