2011-04 cleobury park survey v2 - geoarch cleobury park survey (no lidar).pdf · geophysical and...
TRANSCRIPT

GeoArch Report 2011/04
Geophysical and topographic survey of Cleobury Park Furnace
Dr Tim Young
18th February 2011

Geophysical and topographic survey of
Cleobury Park Furnace
Dr T.P. Young
Abstract
Geophysical survey revealed significant anomalies due to archaeological features. These were dominantly areal and linear anomalies sub-parallel to the dam. These represent areas of slag, with their rectilinear outlines suggesting they may have functioned as building platforms. The associated linear anomalies may, in part at least, represent drainage features. None of the features identified matched the expected footprint of a sixteenth century blast furnace. Topographic survey indicated that the leat across the northern section of the site was larger than would be expected for a watercourse associated with power and the morphology of the head of the channel (at 81.3m OD) within the thickness of the dam was hard to reconcile with that model either. Instead it is suggested that leat had the function of a spillway, possibly one designed to allow the dam to act as a holding pond for the lower furnace at Furnace Mill. The height of the surviving lip of the spillway channel would supply sufficient head for a blast furnace wheel. The spillway has a slag-topped clay bank on its southern side to provide protection for the ironworks buildings on the lower ground to the south. The dam itself was larger (top at 83.3m OD, giving a height of 5.0m above adjacent modern floodplain) than might be expected for a pond designed simply to provide sufficient head for power for a blast furnace. Instead it would appear capable of storage of at least 2m of water above that minimum level. Whilst it is possible that the dam was taller than strictly necessary to allow for an easier trackway between the valley sides across the top, or to allow charging of the furnace via a bridge from the dam, rather than the valley side, an interpretation of the dam as providing a holding capacity seems more likely. The downstream face of the dam shows a slight ledge, possibly stone faced, at 81.8m OD. It is not impossible that the ledge represents an original dam top (0.5m above the spillway level), which was subsequently heightened to provide extra storage capacity. The height of the quarries on the valley sides suggests that they were dug to supply a dam designed to its full height however. The location of the blast furnace itself remains uncertain. The breaching of the dam at the south end may suggest that the wheel race was at this end of the dam. If so, it is likely that the furnace itself would have been close to the southern valley side, possibly on the course of the modern river, or even partially on its south bank. The main slag dump for the site lies downstream of this point. Investigation of Forestry Commission LIDAR data has provided insight into the likely extent of the various ponds in the valley. The pond at the present site could have held water to about 82m OD without disrupting passage on the site of the modern ford, 200m downstream of the middle dam. The small middle dam would have held water to about 89m OD, which would not have interfered with the area of ore pits below the upper dam. The upper dam is a large structure, 105m long, up to 25m thick at the base and 7m high above the floodplain. Approximately 50 ore pits are visible in an area of 200m by 100m just downstream of the upper dam and show a variable degree of regularity of arrangement.

GeoArch Report 2011/04: Cleobury Park Furnace Survey
2
Contents Abstract .............................................. 1 Methods .............................................. 2 Results .............................................. 4 Interpretation .............................................. 4 Summary .............................................. 5 Acknowledgements ........................................... 6 Appendix: LIDAR survey .................................... 6 References .............................................. 6 Figure Captions .............................................. 7
Methods The surveys were undertaken between 9th and 12
th
February 2011, in order to take advantage of low winter vegetation. The basic methodology of the surveys was similar to that adopted for surveys previously undertaken for The Four Parishes Heritage Group on medieval ironworking sites in woodland. The topographic surveys were undertaken using an arbitrary coordinate systems, aligned sufficiently close to N-S to be able to be used as a basis for the geophysical surveys. An attempt was made to tie in to National Grid using a survey-grade GPS system. This comprised a Trimble 4700 base-station sited on an elevated point with maximum view of the sky, but unfortunately the logged data were insufficient to provide a satisfactory location. The arbitrary origin for the site grid (grid peg C2) was assigned site coordinates of [5000, 5000] and a site elevation of 100m. This report uses a “best-fit” of the survey data with Ordnance Survey mapping and with the Forestry Commission LIDAR mapping. In this fitting of the survey C2 has National Grid coordinates of [371137 276423] (= SO 71137 76423) and site north was 8.9° west of grid north. The elevation is only estimatable with a slightly lower degree of accuracy, but the site elevation is approximately height OD plus 19.7m. The main topographic survey (conducted by T. Young and K. Wycherley) was undertaken with a Nikon DTM330 EDM, with data logged to a TDS Recon 200 running TDS Survey Pro software. Data were collated into the Trimble Geomatics Office software. Topographic data were subsequently exported into Golden Software’s Surfer package for regridding and 3d-imaging. The EDM was used both for the collection of the topographic survey and for staking out the grid pegs for the geophysical survey, which was undertaken using a 20m grid. On completion of the survey all pegs were removed. The magnetic gradiometer survey (conducted by A. Taboga, assisted by D. Dabal) was undertaken with a Geoscan FM36 fluxgate gradiometer. The gradiometer was employed with a range of +/-200nT. The survey was commenced with a 0.5m sample interval and 1.0m traverse interval. After completion of one grid, inspection of the data showed sufficiently good data quality to merit improving the resolution to a 0.25m sample interval, which was then employed for all subsequent grids. The first grid was interpolated to the same resolution using the Geoplot software to permit merging of the grids into a single composite. Because of the difficult terrain and undergrowth, traverses were walked along survey tapes, with readings taken using a manual trigger. The grids were walked in parallel, northwards, commencing with the SW corner, although one grid in the east of the survey was walked in the opposite sense to facilitate finishing lines on the stream bank. Data were downloaded and collated using Geoscan’s Geoplot software. For final image production the data were exported into Golden Software’s Surfer package, where they were regridded to a 0.125m node spacing by kriging.
GeoArch Report 2011/04: Cleobury Park Furnace Survey
3
Results The artificial channel The most prominent feature, apart from the dam, is a prominent artificial channel lying along the northern margin of the valley floor. This feature is preserved today as a very wet area, typically 10-12m wide. The surface is almost planar, but dips along the length of the feature to the east, dropping from 81.3m OD in the west to 78.9m OD, where the line of the channel meets the modern stream in the east. Much of that fall is at the west end of the structure, where the surface falls by 2m over the first 45m of its length. The channel is bounded to the south by a ridge for the western half of its length, but further east the ridge disappears and the channel is more difficult to identify. The ridge shows slag on the surface (although an orange-coloured clay is also seen on the surface locally) and is marked by a series of strong anomalies on the geophysical survey, some of which show somewhat rectilinear encroachments onto the area of topographic expression of the channel. It is unclear whether these encroachments indicate bank collapse, tipping of waste into the channel, or simply that the channel was actually much narrower than its current topographic expression. The western end of the channel cuts through much of the dam except for a slight lip on the upstream side. The ground bordering the channel to the north appears disturbed, and may be, at least in part, slipped ground. An intermittent very strong anomaly is seen close to the south side of the channel in this area. This anomaly is directed towards a tree from which lengths of both simple and barbed wire were removed prior to the survey. It seems likely the strong anomaly is associated with a buried strand of the same fence. The channel becomes indistinct towards the east, but the section in the modern stream shows possible stonework on the line of the northern side of the channel, where the modern stream lies in the projected line of the channel. The dam The dam was probably approximately 70m long (the precise length is uncertain because of subsequent erosion at the southern end) and is approximately 20m thick at the base. The topographic survey showed that the top of the dam lies at approximately 83.3m OD (slightly higher at the south end than the north), whereas adjacent floodplain levels were approximately 78.3m OD, giving an overall height of the earthwork as approximately 5m. Present river level (as measured at the time of survey) is approximately 77.6m OD to the northwest of the dam, 77.3m OD adjacent to the dam and 76.4m close to the point of confluence of the modern river with the line of the spillway channel. This would have allowed a significant potential head for the water power. A pond surface at 82.5m (i.e. 0.8m below surviving top) is illustrated on Figs 16-18, which allows for a head of 5.2m compared with current river level. Cleere and Crossley record a range of 2.5m – 3.9m diameter for Wealden blast furnace wheels, so the dam has plenty of spare capacity. The top of the dam shows a marked positive magnetic anomaly, approximately 2m wide, running the length of the dam (except for a minor break near the northern
end corresponding to a slight hollow). This corresponds to the surface distribution of slag and probably marks a slag surface, rather than an addition to the height of the dam, since the slag distribution corresponds to the flat top of the dam. Some slag shows on the bare surface of the ground on the northern side of the dm towards the west end, and might be either material eroded from the top, or a deliberate dumping of material down the upstream face. The downstream face of the dam was more vegetated, but did not show similar slag deposits. The dam is breached in two locations – at either end where the dam structure abuts the natural slope. The breach to the south carries the modern stream and is deeply incised into bedrock to the south. To the NW of the cut end of the dam a resistant bed of sandstone is visible in the steam and may have formed the base for the dam at this end. A small tributary stream from the south has a course towards the top of the dam and may have contributed to instability of the dam to the south. The northern breach is not quite complete, with a slight ‘lip’ surviving of the western toe of the dam (as described above). The fill of the northern breach lies at a level above that of the floodplain to the west and is waterlogged. This may suggest that the northern end of the dam corresponds to a modern spring. The eastern face of the dam shows a slight ledge or terrace at about 81.8m OD. Slight surface evidence suggests that the outer edge of the ledge is marked by stonework. Immediately to the east of this ledge the geophysical data show a strong linear positive magnetic anomaly with a measured maximum of >70nT and locally >100nT. Towards the south, the form of ledge becomes less regular and the anomaly lessens in amplitude, but appears to continue in a reduced form towards the southwest corner of the geophysical survey. The quarries Both sides of the valley show scooped quarries on the slopes above the ends of the dam. On both sides these extend, irregularly, between approximately 86m and 92m OD. To the north, these quarries abut and lie just above a surviving trackway which may have led from the NE onto the dam top. To the south there are no surviving signs of trackways below the quarries, but LIDAR data suggest that tracks may be present leading towards the area from the hilltop to the south. Below the quarries on the south of the valley, the hillside is truncated by the incision of the modern stream, and is complicated by a small tributary stream. The lowest relatively flat surface seen above the bluff is, however, at the same elevation as the dam top (at 83-84m OD). The valley floor below the dam The floor of the valley below the dam was the focus of the geophysical survey. The magnetic data from the area to the southwest of the bank alongside the channel show a dominantly northeast-southwest grain, sub-parallel to the dam. The magnetic anomalies on the lower parts of the valley floor weaken towards the stream. In the same area the topographic surface actually rises towards the modern stream. Deposits of slag and charcoal were observed at approximately 1m below surface (approximately 77.8m OD), the same

GeoArch Report 2011/04: Cleobury Park Furnace Survey
4
elevation as slag observed near surface in the hollow just southwest of the channel (approximately 78.0m OD). It is likely that substantial post-16
th century
deposition has occurred close to the modern stream, possibly as a result of the failure of the dam. Despite the strong northeast-southwest featuring of the magnetic data, there are few signs of any corresponding orthogonal features which would suggests building outlines. The strongest features form an overall ‘L’ shape, 40m long (SW-NE) zone by 15m wide, to the west near the dam, with a 55m long NW-SE zone bordering the channel. There are several sets of features in this area, which are not quite parallel: i. 030-033° (parallel to the dam): the most prominent of these features is a strong positive linear anomaly (a; for lettered features see Figure 9) running just below the step in the eastern dam face, from just above the surface hollow near the north of the surviving dam for 20m SW and less certainly possibly a further 8m to the edge of the survey (b) as described above. The anomaly runs parallel to the eastern foot of the dam, which is slightly oblique to its crest. Parallel to this is a linear negative anomaly, running for 11m mainly in area of reduced magnetic signature just N of the stream (c). There are some minor possible orthogonal negative anomalies in the same area. ii. 043°: anomalies on this orientation are essentially three parallel linear positive features (d,e,f), approximately 6.5-7m apart. This central anomaly is bordered by a very straight and sharp margin to the SE with a parallel negative linear to its SE (2m, maximum to minimum), suggesting a major structural boundary. The subsurface is exposed on the line of the central anomaly by the pit and exposed root-ball of a fallen tree; it can be seen to be a dense deposit of blast furnace slag of unknown thickness, but extending to within 10cm of surface. These anomalies appear to be border to the NE by a NW-SE magnetically quiet zone about 8m wide (g). This zone appears to underlie the bank on the S of the channel and is aligned on the northern breach in the dam. iii. 049°: features on this alignment include (possibly) the margin of the positive anomaly on the E slope of the dam towards the south and a series of anomalies following the break of slope where the raised area of slag reaches the ‘floodplain’. The main area of anomaly on the west of the site is bounded by these, and has the impression of a parallel-side zone about 8m wide which is slightly oblique to, and intersected by, the base of the dam. It is also possible that some of the areas with a low degree of magnetic featuring might represent some degree of minor channel incision into the archaeological deposits, although the neatly orthogonal outline of these zones probably argues against this. The valley floor below the dam Surface deposits examined during the topographic survey indicate a large slag dump exists on the southern side of the valley, extending eastwards from the point where a small trackway may have descended to valley floor. The surface deposits extended for
approximately 100m east of this point and are between 10 and 20m wide. The northern side of the deposit is truncated by the modern stream. In the southern stream section the slag deposit can be seen to be approximately 1m thick. It is possible that the deposit may, in part, fill a pre-furnace river channel, but the upper surface laps up on the valley side to the south, so it is clearly not simply confined to any putative channel.
Interpretation The interpretation of the geophysical data is not straightforward. The main control on the magnetic anomalies will be variations in magnetic susceptibility (the degree to which materials develop a magnetic field in sympathy with the ambient field). In the context of blast furnace waste the major high-susceptibility component is likely to be iron itself – present as blebs with the slags as well as discrete waste particles. A second highly susceptible phase is magnetite, which may be present in some of the more iron-rich slags. The zones of positive magnetic anomaly are likely, in simple terms, to represent discrete or thicker accumulations of slag. Such accumulations might include linear dumps of slag, slag employed as surfacing of paths or linear accumulations against walls, but might also include slag accumulations within cut features, such as drains and timber slots. Stone walls would be expected to be marked as negative magnetic anomalies, but the margins of slag accumulations would also be marked by negative anomalies, and discrimination of the two may be difficult. However, the data contain no neat building outlines, clear stone structures or anything resembling the footprint of a 5m square stone furnace.
Discussion Cleere and Crossley (1995) provided plans of layout of several Wealden ironworks of the period., and these probably provide the most comprehensive source of comparative plans available. There are several main observations to be made on the design of 16
th century
blast furnace sites in the Weald: a. water-wheels were comparatively small (2.5-3.5m diameter) and narrow. b. of the six furnace wheels listed, five were over-shot, and one either over-shot or back-shot. c. because of the relatively small size of the bellows, the wheel pits lie close to the furnace and parallel to one of its sides. d. In the excavated Wealden examples with overshot wheels (Panningridge, Chingley, Batsford and Maynards Gate; Cleere & Crossley 1995, Fig. 55) the furnace lies on the right bank of the race, so that the bellows lie upstream of the furnace (the cams on the shaft depress the bellows, so for an overshot wheel the bellows must be downstream of the shaft on the right bank or upstream on the left).
GeoArch Report 2011/04: Cleobury Park Furnace Survey
5
e. the blast furnaces were typically situated away from the dam, but in some instances the wall of the bellows house was set into the toe of the dam (e.g. Chingley; Cleere & Crossley 1995, Fig. 58) e. In their original design, all four furnaces described (see list in ‘d’ above) had their casting areas extending out over the culverted tail race. Casting areas were roofed, but are very small in the early furnaces. A completely different furnace plan is provided Dol y Clochydd Furnace in Gwynedd, where (Crew 2009) has shown that a launder from the leat fed a wheel parallel to a steep slope behind the furnace, with the tailrace curving behind the furnace, with the casting area facing away from the slope. Applying these observations to the Cleobury Park site is not simple. Clearly the Wealden Ironworks of the period present one model for the organisation of such a site, but it is not clear whether that organisation would be have been transferred into an area with a rather different topographic setting. The geophysical data described above suggest a series of elongate features, strongly magnetic, so probably formed of slag, perhaps platforms, which might have supported buildings, below the dam. Topographic considerations suggest that the surviving leat was probably the spillway, with a protective bank to the south. Beyond these simple observations, however, the site interpretation becomes much more speculative. The apparent breaching of the dam in two places seems somewhat unlikely. This raises the question of the nature of the head of the spillway channel. The channel appears very even in plan through much of the thickness of the dam, with an upstanding lip on the northern side of the dam. Unless this channel is actually an erosional feature cut by floodwaters during the formation of the supposed breach, this might suggest that the dam was not originally present over this section. The strong geophysical anomaly along the downstream lower slope of the dam is one of the most prominent features of the survey results. This strong anomaly must represent a linear accumulation of slag or other residue. It appears too strong an anomaly to be simply an accumulation against the putative stone revetment forming the edge of the terrace above and the fill of a cut feature would appear more likely. If this is the case, then a substantial cut below the dam face could represent a drain (intended to keep water off the metallurgical activities down-slope) or it could conceivably be a dam-parallel race. One possibility would be a head race drawing water from the same gap as the spillway, taking water to a wheel to the south, but such a design would seem structurally unsafe, and the anomaly is probably at too low an elevation, so this appears unlikely. Alternatively, an arrangement similar in plan to the tail-race at Dol-y-clochydd is conceivable, with a wheel at the north end of the dam, but this would imply a furnace very close to the spillway channel – which, although not impossible, would be a very unusual and potentially dangerous configuration. A simple drain would appear a more likely interpretation of the geophysics. A more likely configuration would be to have the furnace the opposite end of the dam to the spillway, which would place the furnace close to the head of the main slag dump. The strong featuring on the
geophysical survey along the downstream side of dam may represent the creation of slag platforms with drainage, perhaps for ancillary buildings. If the feed for the furnace’s wheel came over the dam in the area where the dam has been destroyed by the modern river, then the likely site for the furnace is a fairly small area close to the south valley side. In the Wealden examples quoted above, the overshot wheel drove bellows facing downstream on the right bank of the wheelpit. That would suggest that the furnace would have had to have been tight to the south valley slope. For the Wealden examples, the casting floor extended over a culverted tail race. This might perhaps be the same arrangement here, with the casting floor directed towards the northeast. If the furnace was close to dam, then it is just possible that the strong “edge” visible to the magnetic material at ‘c’ in Figure 9 might be rear wall of the bellows house, but the structures might equally be located further southeast. It is not impossible that some, or all, of the furnace structure might be preserved on the south bank of the stream, an area not geophysically surveyed in the present work. The question of why the dam is so tall (5m) is also problematic and raises various questions. The dam is actually somewhat larger, and taller, than the middle dam for the lower of the two holding ponds. This seems an excessive head in comparison to the size of wheel known to have been employed on contemporary sites in the Weald. If the size of the dam was designed to provide storage as well as hydrological head (as arguably suggested by the morphology of the spillway), then how would that have worked? Where would the water for the wheel have been drawn from the dam? The lip on the head of the ‘spillway’ lies at 80.3m OD, 3m above current stream level (77.3m). This is actually sufficient head for an overshot wheel of Wealden type. This might mean that the sluice for the bellows wheel was at the same height as the sluice on the ‘spillway’ – allowing the lake level to dropped by 2m (assuming the estimate of lake level of 82.5m OD discussed above). This gives the dam a dual purpose: significant capacity for storage, whilst maintaining sufficient head for the furnace wheel in its low water state. Further work needs to be undertaken to determine the appropriate 16
th century technology for managing such
a sluice system.
Summary The geophysical survey provided evidence for the possible location of ancillary buildings, but did not appear to locate the furnace itself. The topographic survey demonstrates that the dam was likely to have provided storage capacity as well as head for a wheel. If such purposes are contemporary then there must have been complicated sluice or sluices. The leat on the north of the site probably functioned as a spillway, but also arguably, to supply water to the lower, Furnace Mill, site using the dam on this site as a holding pond. The take- off for the supply for the wheel on this site is also likely to have been well below the dam top, but its location is unknown. The breaching of the dam at the south end, and the lack of identification of a furnace

GeoArch Report 2011/04: Cleobury Park Furnace Survey
6
site in the centre of the valley by the geophysics, makes it likely the furnace was close to the south side of the valley, placing it at the head of the large main slag dump to the south of the course of the current stream.
Acknowledgements This project was undertaken for the Four Parishes Heritage Group, with funding from Kinlet Parish Council and Shropshire Council via the Cleobury and Rural Local Joint Committee.. The assistance of the members of the group with is gratefully acknowledged. In particular, thanks go to Ken Wycherley for assistance with the survey. Access to the site was through the permission of the owners, Wessex Forestry. Access to LIDAR data was through the kind permission of the Unit for Landscape Modelling and the Forestry Commission. In particular Peter Crow facilitated the data extract and transmission.
Appendix: LIDAR survey The area containing the site has been surveyed using LIDAR by the Forestry Commission and its Unit for Landscape Modelling. They kindly made data available for the site and the river valley up to the upper dam. These data have been imaged using Surfer and the images are the basis for figures 12-24 as well as for the calibration of the elevation of the site survey as described above. It is beyond the scope of this report to try to put the Cleobury Park Furnace into its full landscape context, but some commentary on the LIDAR data is provided. To aid with landscape interpretation figures 16-18 have been shown with the outlines of the ponds reconstructed with water levels at approximately 1m below the surviving dam tops (98.0m OD for the upper pond, 89.0m for the middle pond and 82.5m for the lower pond). Figure 19 shows the LIDAR survey of the area surrounding the upper dam and the ore pits. The area shows a complex series of features., The dam shows quarry pits on both sides of the valley, and a well developed western spillway. The dam is probably sited to take advantage of naturally rising ground and a constriction of the valley floor, but is a large structure, 105m in length, up to 25m thick at the base, 5m wide at the top, standing 7m above the adjacent floodplain and over 8m above the modern river channel. The dam has been breached centrally and has a second breach, or more likely the original spillway on the western side. The gap through which the spillway passes is 10m wide, with a base 2m below the dam top (97m OD). The area of the presumed spillway is bounded to northeast and southwest by low curvilinear banks of uncertain date, but possibly overlying the spillway (with a third possible bank on the western edge of the modern stream channel). The northeast quarry area is overlain by a NW-SE track descending towards a fording point with several generations of access tracks on the southwest side. To the southeast of these tracks is the area of ore pits (again possibly overlain by
a low curvilinear bank). At least 50 pits are visible, generally decreasing in size and decreasing in regularity of organisation towards the river. The ore pits cover an area of approximately 200 x 150m. Although the lowest pits are very close to the river bank they lie above the water level of the middle pond. The middle dam (Figure 20) is a much simpler structure, 55m long, 12m thick at the base, up to 4.2m above the adjacent floodplain, and with an access route on the east bank leading to the dam top. The breach, and presumably the original sluice, lies at the west end. Just SE of the dam a major (and indeed the current) crossing point of the river shows multiple access routes on gentler western side of the valley. With the lower pond modelled at 82.5m, it is clear that the water level would be slightly raised at the fording point on the river 200m S of the middle dam. If this ford was in use in the sixteenth century, then it may be the water level was maintained at a little below this. The lower, Cleobury Park Furnace, dam is illustrated in Figure 21, but has been fully discussed above.
References Cleere, H. & Crossley, D. 1995. The Iron Industry of
the Weald (2nd
edition edited by J. Hodgkinson). Merton Priory Press.
Crew, P, 2009. Iron working in Merioneth from
prehistory to the 18th century. Merfyn Williams memorial lecture No.2. Maentwrog, Snowdonia National Park/Plas Tan y Bwlch.

GeoArch Report 2011/04: Cleobury Park Furnace Survey
7
Figure Captions
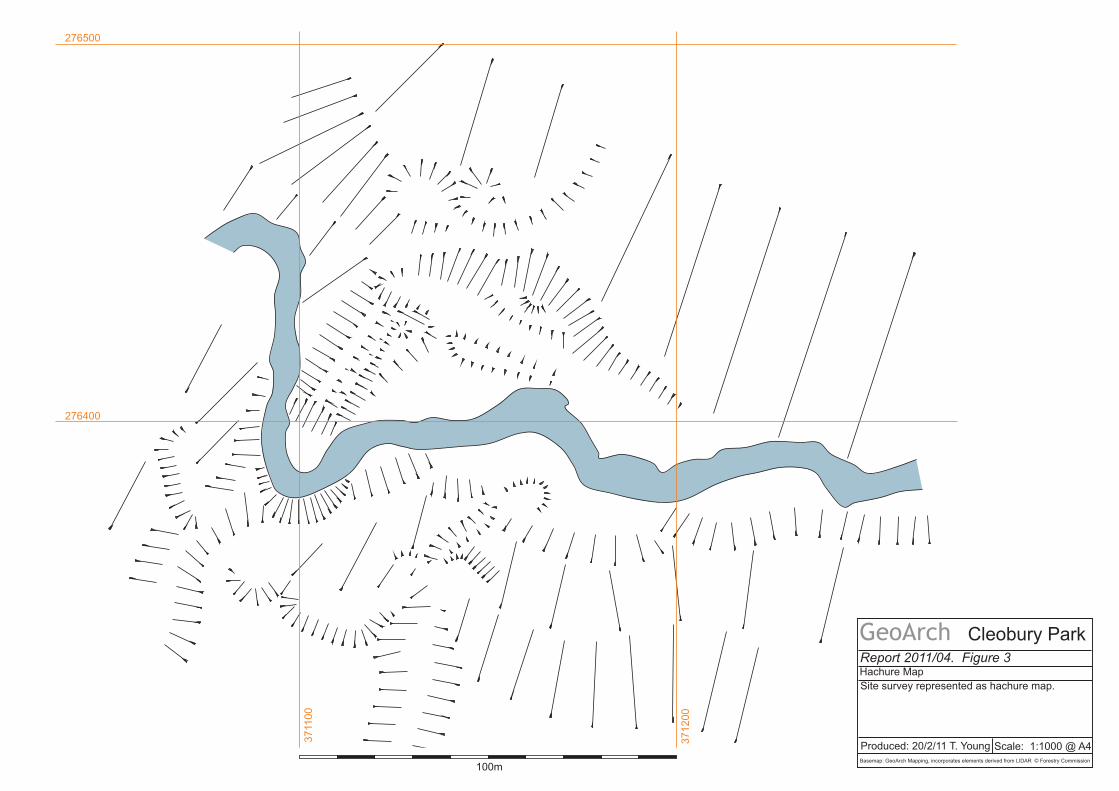
Figure 1. Site grid system and correlation with the National Grid. The river is mapped at the top of its banks, which was considerably wider than the watercourse at the time of survey. Figure 2. Topographic survey presented as contour plot in site coordinates. The site datum is approximately 19.7m below OD. Figure 3. Topographic survey presented as hachured plot Figure 4. Topographic survey presented as hachured plot with mapped breaks of slope. Figure 5. Magnetic gradiometer survey results with a greyscale of -100nT (black) to +100nT (white). Figure 6. Magnetic gradiometer survey results with a greyscale of -30nT (black) to +30nT (white). Figure 7. Magnetic gradiometer survey interpretation. Green – negative anomalies; red – positive anomalies; grey areas – elevated magnetism; yellow – anomalies that are possibly edge effects; pink – buried wire fencing; pecked line – survey limits. Figure 8. Magnetic gradiometer survey interpretation. As Figure 7, but with labels and with features outside the magnetic survey area. Pink tone indicates identified extent of slag dump. Figure 9. As figure 8, but with superimposed hachured topography. Figure 10. Topographic survey presented as contour plot calibrated to OS datum via correlation with the Forestry Commission LIDAR data. The site datum is approximately 19.7m below OD. Figure 11. Tentative site interpretation. Brown – extent of dam; pink – extent of slag deposits; solid black line – magnetic feature, drain?; circle – possible furnace site. The extent of water in the pond is at 82.0m OD. Figure 12. Forestry Commission/Unit of Landscape Modelling LIDAR data. Imaged in Surfer with as shaded relief surface with illumination from the NW. Figure 13. Forestry Commission/Unit of Landscape Modelling LIDAR data. Imaged in Surfer as shaded relief surface with with illumination from the NE. Figure 14. Forestry Commission/Unit of Landscape Modelling LIDAR data. Imaged in Surfer as shaded relief surface with with illumination from the E. Figure 15. Forestry Commission/Unit of Landscape Modelling LIDAR data. Imaged in Surfer with contours at 1m intervals. Figure 16. As Figure 15, but with extent of ponds indicated with water levels at 82.5m for the lower pond, 89.0m for the middle pond and 98.0m for the upper pond (in each case approximately 0.5m below dam top). Figure 17. As Figure 16, but with LIDAR data imaged as shaded relief surface with illumination from the NW. Figure 18. As Figure 17, but with LIDAR data imaged as shaded relief surface with illumination from the NE.
Figure 19. Forestry Commission/Unit of Landscape Modelling LIDAR data. Imaged in Surfer with as shaded relief surface with illumination from the N. Detail of area around upper dam. Figure 20. Forestry Commission/Unit of Landscape Modelling LIDAR data. Imaged in Surfer with as shaded relief surface with illumination from the N. Detail of area around middle dam. Figure 21. Forestry Commission/Unit of Landscape Modelling LIDAR data. Imaged in Surfer with as shaded relief surface with illumination from the N. Detail of area around lower dam/Cleobury Park Furnace. Figure 22. Forestry Commission/Unit of Landscape Modelling LIDAR data. Imaged in Surfer with as coloured contoured 3d surface with illumination from the NW, viewed from the SE. Figure 23. Forestry Commission/Unit of Landscape Modelling LIDAR data. Imaged in Surfer with as 3d surface draped in a shaded relief surface with illumination from the NW. Figure 24. As Figure 23 but with superimposed proposed pond levels as Figure 16. .
371100
371200
276400
276500
4920 4940 4960 4980 5000 5020 5040 5060 5080 5100 5120
4920
4940
4960
4980
5000
5020
5040
5060
100m
Scale: 1:1000 @ A4
Cleobury Park
Basemap: GeoArch Mapping, incorporates elements derived from LIDAR © Forestry Commission
Produced: 20/2/11 T. Young
GeoArchReport 2011/04 Figure 1Site Grid
Site grid system and correlation with NationalGrid

371100
371200
276400
276500
100m
Scale: 1:1000 @ A4
Cleobury Park
Basemap: GeoArch Mapping, incorporates elements derived from LIDAR © Forestry Commission
Produced: 20/2/11 T. Young
GeoArchReport 2011/04. Figure 2Contour survey
Contour survey with contours shown at 1mintervals and in site coordinates. Site datumapproximately 19.7m below OD.
371100
371200
276400
276500
100m
Scale: 1:1000 @ A4
Cleobury Park
Basemap: GeoArch Mapping, incorporates elements derived from LIDAR © Forestry Commission
Produced: 20/2/11 T. Young
GeoArchReport 2011/04. Figure 3Hachure Map
Site survey represented as hachure map.

371100
371200
276400
276500
100m
Scale: 1:1000 @ A4
Cleobury Park
Basemap: GeoArch Mapping, incorporates elements derived from LIDAR © Forestry Commission
Produced: 20/2/11 T. Young
GeoArchReport 2011/04. Figure 4Hachure Map
Site survey represented as hachure map withmapped breaks of slope.

371100
371200
276400
276500
100m
Scale: 1:1000 @ A4
Cleobury Park
Basemap: GeoArch Mapping, incorporates elements derived from LIDAR © Forestry Commission
Produced: 20/2/11 T. Young
GeoArchReport 2011/04. Figure 5Magnetic gradiometer survey
Magnetic gradiometer survey results with agreyscale of:-100nT (black) to +100nT (white)
Data regridded to 0.125m node spacing in Surfer

371100
371200
276400
276500
100m
Scale: 1:1000 @ A4
Cleobury Park
Basemap: GeoArch Mapping, incorporates elements derived from LIDAR © Forestry Commission
Produced: 20/2/11 T. Young
GeoArchReport 2011/04. Figure 6Magnetic gradiometer survey
Magnetic gradiometer survey results with agreyscale of:-30nT (black) to +30nT (white)
Data regridded to 0.125m node spacing in Surfer
371100
371200
276400
276500
100m
Scale: 1:1000 @ A4
Cleobury Park
Basemap: GeoArch Mapping, incorporates elements derived from LIDAR © Forestry Commission
Produced: 20/2/11 T. Young
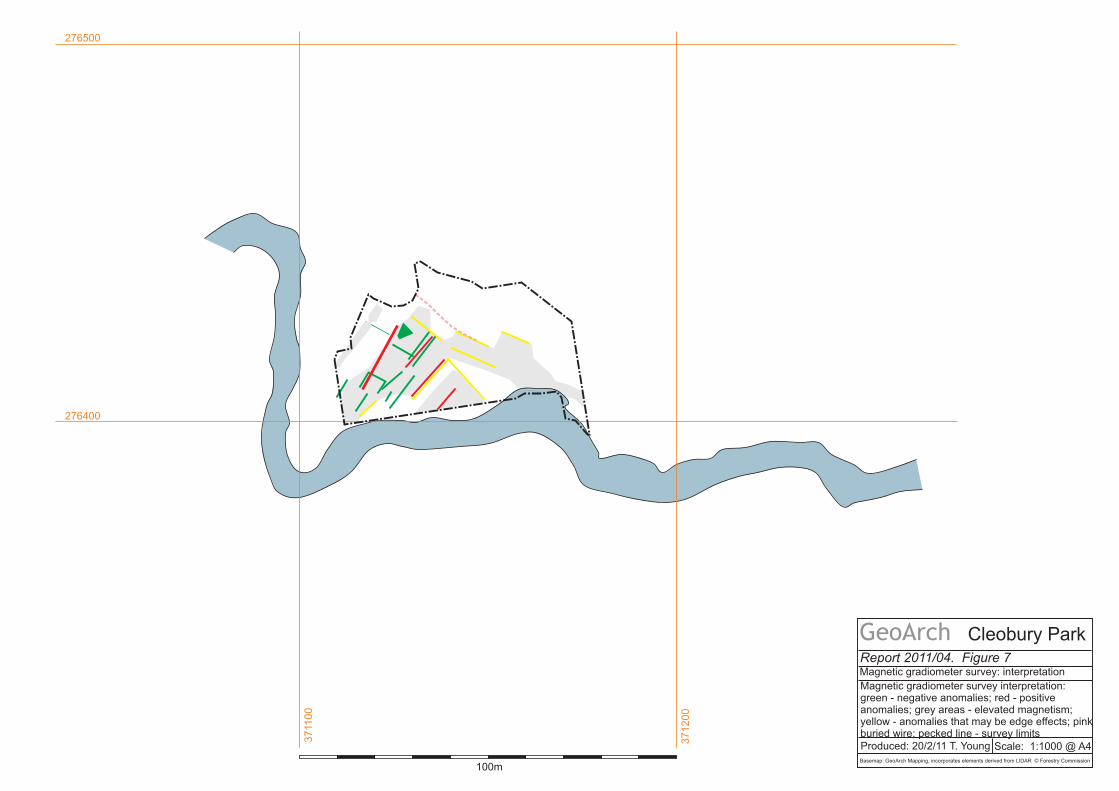
GeoArchReport 2011/04. Figure 7Magnetic gradiometer survey: interpretation
Magnetic gradiometer survey interpretation:green - negative anomalies; red - positiveanomalies; grey areas - elevated magnetism;yellow - anomalies that may be edge effects; pinkburied wire; pecked line - survey limits

371100
371200
276400
276500
100m
Scale: 1:1000 @ A4
Cleobury Park
Basemap: GeoArch Mapping, incorporates elements derived from LIDAR © Forestry Commission
Produced: 20/2/11 T. Young
GeoArchReport 2011/04. Figure 8Surveys: labelled interpretation
Magnetic gradiometer survey interpretation asFigure 7.Pink area - slag dump.
a
b
c
d
e
fg
leat
leat
landslip
bank with slagpossible stonework visible in river
slag
slag
slag
southbreach
northbreach
quarry
quarry
quarry
quarry
quarryquarry
trackway?
trackwaytrackway
trackway

371100
371200
276400
276500
100m
Scale: 1:1000 @ A4
Cleobury Park
Basemap: GeoArch Mapping, incorporates elements derived from LIDAR © Forestry Commission
Produced: 20/2/11 T. Young
GeoArchReport 2011/04. Figure 9Surveys: labelled interpretation (hachured)
Magnetic gradiometer survey interpretation asFigure 7.Pink area - slag dump.
a
b
c
d
e
fg
leat
leat
landslip
bank with slagpossible stonework visible in river
slag
slag
slag
southbreach
northbreach
quarry
quarry
quarry
quarry
quarryquarry
trackway?
trackwaytrackway
trackway

371100
371200
276400
276500
100m
Scale: 1:1000 @ A4
Cleobury Park
Basemap: GeoArch Mapping, incorporates elements derived from LIDAR © Forestry Commission
Produced: 20/2/11 T. Young
GeoArchReport 2011/04. Figure 10Contour survey
Contour survey with contours shown at 0.5mintervals after adjustment against LIDAR-derivedheight estimates.

371100
371200
276400
276500
100m
Scale: 1:1000 @ A4
Cleobury Park
Basemap: GeoArch Mapping, incorporates elements derived from LIDAR © Forestry Commission
Produced: 20/2/11 T. Young
GeoArchReport 2011/04. Figure 11Tentative site interpretation
Brown - extent of dam, conjectural at S end.Pink - extent of slag deposits.Solid black line - magnetic feature ?drainCircle - possible furnace siteExtent of pond shown to water-level at 82m OD

GeoArch
geoarchaeological, archaeometallurgical & geophysical investigations
Mobile: Fax:
54 Heol y Cadno,
Thornhill, Cardiff,
CF14 9DY.
07802 413704 08700 547366
E-Mail: Web:
[email protected] www.GeoArch.co.uk