2011- 2012 annual report - gauteng enterprise propeller · development support programmes within...
TRANSCRIPT
Moulding Entrepreneurs
ANNUAL REPORT2011- 2012
AN
NU
AL
RE
PO
RT
201
1-
2012


1
OrganisatiOnal insight
Mandate ___________________________________________________________________________________________ 5
Vision ______________________________________________________________________________________________ 5
Mission _____________________________________________________________________________________________ 5
statements & FOrewOrd
MEC’s Foreword ____________________________________________________________________________________ 9
Chairperson’s Review _______________________________________________________________________________ 10
Chief Executive Officer’s Reviews _____________________________________________________________________ 11
Business units repOrts
Investment Management ____________________________________________________________________________ 15
Regional Operations ________________________________________________________________________________ 21
Enterprise Support __________________________________________________________________________________ 27
Strategic Support __________________________________________________________________________________ 34
Marketing & Communications ________________________________________________________________________ 37
Human Resources __________________________________________________________________________________ 40
Information Technology & Facilities ____________________________________________________________________ 45
COrpOrate gOvernanCe repOrt
Chief Financial Officer’s Report ______________________________________________________________________ 51
Audit Committee Report ____________________________________________________________________________ 55
FinanCials
Auditor - General Report ____________________________________________________________________________ 61
Directors’ Report ___________________________________________________________________________________ 63
Financial Statements ________________________________________________________________________________ 64
Accounting Policies _________________________________________________________________________________ 67
Notes to the Financial Statements ____________________________________________________________________ 71
COntents

2

3
OrganisatiOnal insight
4
Seven years of fostering and promotion of SMMEs in Gauteng.
‘GEP since 2005’

5
‘GEP since 2005’
MandateTo promote, foster and develop small enterprises in Gauteng thereby implementing the policy of the Gauteng Provincial Government for small enterprise development.
This includes the design and implementation of small enterprise development support programmes within Gauteng, strengthening their capacity to compete successfully domestically and internationally; promoting a support network in order to increase the contribution of small enterprises to the economy, which will in turn contribute to economic growth, job creation and equity.
VisionAfrica’s leading enterprise and business support agency.
MissionTo enable entrepreneurs.
Values
Professional
• Efficient
• Knowledgeable
• Full spectrum service
accountable
• Responsive
• Reliable
• Work with integrity
Focused
• SMME Sector
• Sector specialists
• Trained staff
accessible
• Location
• Language
• Customer service
GoalsTo facilitate increased SMME participation in the mainstream economy, and their contribution to economic growth, development and employment in Gauteng.

6

7
StatementS anD ForeworD

8
Seven years of economic impact through SMME development.
‘GEP since 2005’

9
MEC’s FOREWORD
The development and support of Small, Medium and Micro Enterprises (SMMEs) is a crucial lever towards fighting the triple challenge of unemployment, poverty and inequality. SMMEs create more than 50% of employment opportunities in most countries, especially developing countries. With the backdrop of a 25% unemployment rate and a startling reality of a 42% youth unemployment rate as depicted by recent statistics from the Labour Force Survey, the task to bolster the capacity of SMMEs in order to create decent jobs and build a growing, inclusive economy in the province is an urgent one. We have seen the crucial role that Development Finance Institutions (DFIs) and other SMME development initiatives play in other countries. The Gauteng Enterprise Propeller (GEP) needs to similarly, ensure that it achieves the desired level of impact.
We have during the 2011/2012 financial year, appointed a new
and the Industrial Development Corporation (IDC). This strategic project remains a priority for the Department and its success will serve as an illustration of how beneficiation can be explored as part of the mining value chain in Gauteng and throughout the country.
The GEP continued to seek opportunities to partner with both private and public sector organisations to ensure that it reaches more SMMEs. One such a partnership is with the National Department of Agriculture, through the Micro Agriculture Finance Institute of South Africa (MAFISA) program. Through this scheme, 17 deals to the tune of R7.3 million were written by GEP.
The Agency continued its efforts to ensure that it remains accessible to its clients and co-location negotiation with Khula Enterprise Finance were nearing conclusion by the end of the financial year. In line with the drive to make the Agency accessible, GEP has various offices in several municipalities of the province. The Agency also has satellite offices in Springs, Heidelberg, Alexandra and Soweto.
Partnerships forged between government, labour, business and civil society will also be vital in this task, of course all this will not work if we do not focus on implementation.
________________________________Nkosiphendule Kolisile GautEnG MEC FOR ECOnOMiC DEvElOpMEnt
board for the Agency. This board has been mandated to reposition GEP and take it to another level by reviewing its funding model and core operations. The Agency also has a new CEO who commenced duty on 1 March 2012. We count on this new leadership to bring the much needed new ideas and innovative boost to the entity. The board has already made good strides towards these objectives and we expect this work to reach its conclusion soon.
The Agency has undertaken research that was utilised to feed into the work of developing a new funding model for the entity. This includes studying various models such as the Grameen Bank model as well as a few other models from the African continent. This work is nearing completion and the new model will be implemented in due course. The Agency, working with Hope Africa and their partners, launched the Y-AGE program in October 2011. This program seeks to reach out and assist young existing and potential entrepreneurs in Gauteng. Over 100 000 young people have expressed interest in participating in the program. A total of 14 022 young people had already formally applied to partake in this program by the end of the financial year. The program is currently training 1 012 people, 341 of which are from already existing businesses.
The Agency, in conjunction with the Department of Economic Development, continued to explore different measures to assist and bolster the economic performance of African Romance, a diamond beneficiation company that is partially owned by the Department
10
CHaiRpERsOn’s REviEW
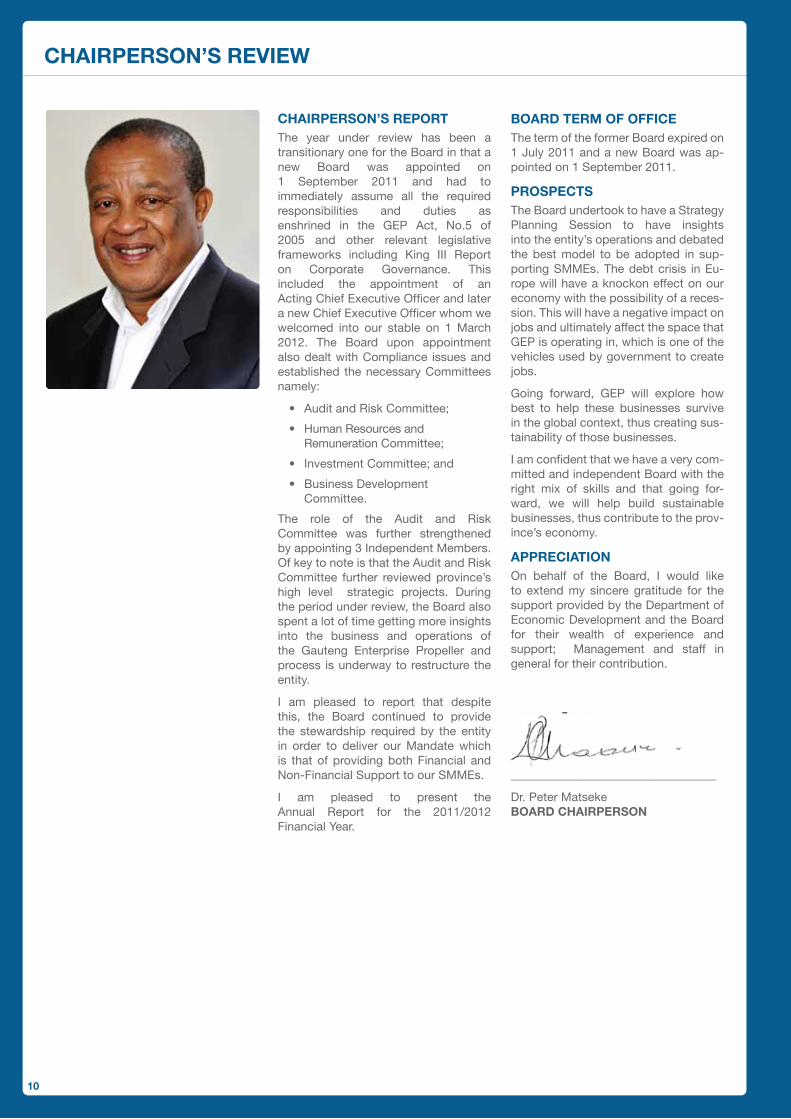
CHaiRpERsOn’s REpORtThe year under review has been a transitionary one for the Board in that a new Board was appointed on 1 September 2011 and had to immediately assume all the required responsibilities and duties as enshrined in the GEP Act, No.5 of 2005 and other relevant legislative frameworks including King III Report on Corporate Governance. This included the appointment of an Acting Chief Executive Officer and later a new Chief Executive Officer whom we welcomed into our stable on 1 March 2012. The Board upon appointment also dealt with Compliance issues and established the necessary Committees namely:
• Audit and Risk Committee;
• Human Resources and Remuneration Committee;
• Investment Committee; and
• Business Development Committee.
The role of the Audit and Risk Committee was further strengthened by appointing 3 Independent Members. Of key to note is that the Audit and Risk Committee further reviewed province’s high level strategic projects. During the period under review, the Board also spent a lot of time getting more insights into the business and operations of the Gauteng Enterprise Propeller and process is underway to restructure the entity.
I am pleased to report that despite this, the Board continued to provide the stewardship required by the entity in order to deliver our Mandate which is that of providing both Financial and Non-Financial Support to our SMMEs.
I am pleased to present the Annual Report for the 2011/2012 Financial Year.
Going forward, GEP will explore how best to help these businesses survive in the global context, thus
creating sustainability of those businesses.
I am confident that we have a very committed and independent Board with the right mix of skills and
that going forward, we will help build sustainable businesses, thus contribute to the province’s
economy.
APPRECIATION
On behalf of the Board, I would like to extend my sincere gratitude for the support provided by the
Department of Economic Development and the Board for their wealth of experience and support;
Management and staff in general for their contribution.
______________________________
Chairperson of the Board
BOaRD tERM OF OFFiCEThe term of the former Board expired on 1 July 2011 and a new Board was ap-pointed on 1 September 2011.
pROspECtsThe Board undertook to have a Strategy Planning Session to have insights into the entity’s operations and debated the best model to be adopted in sup-porting SMMEs. The debt crisis in Eu-rope will have a knockon effect on our economy with the possibility of a reces-sion. This will have a negative impact on jobs and ultimately affect the space that GEP is operating in, which is one of the vehicles used by government to create jobs.
Going forward, GEP will explore how best to help these businesses survive in the global context, thus creating sus-tainability of those businesses.
I am confident that we have a very com-mitted and independent Board with the right mix of skills and that going for-ward, we will help build sustainable businesses, thus contribute to the prov-ince’s economy.
appRECiatiOnOn behalf of the Board, I would like to extend my sincere gratitude for the support provided by the Department of Economic Development and the Board for their wealth of experience and support; Management and staff in general for their contribution.
__________________________________
Dr. Peter Matseke BOaRD CHaiRpERsOn
11
CHIEF EXECUTIVE OFFICER’s REVIEW
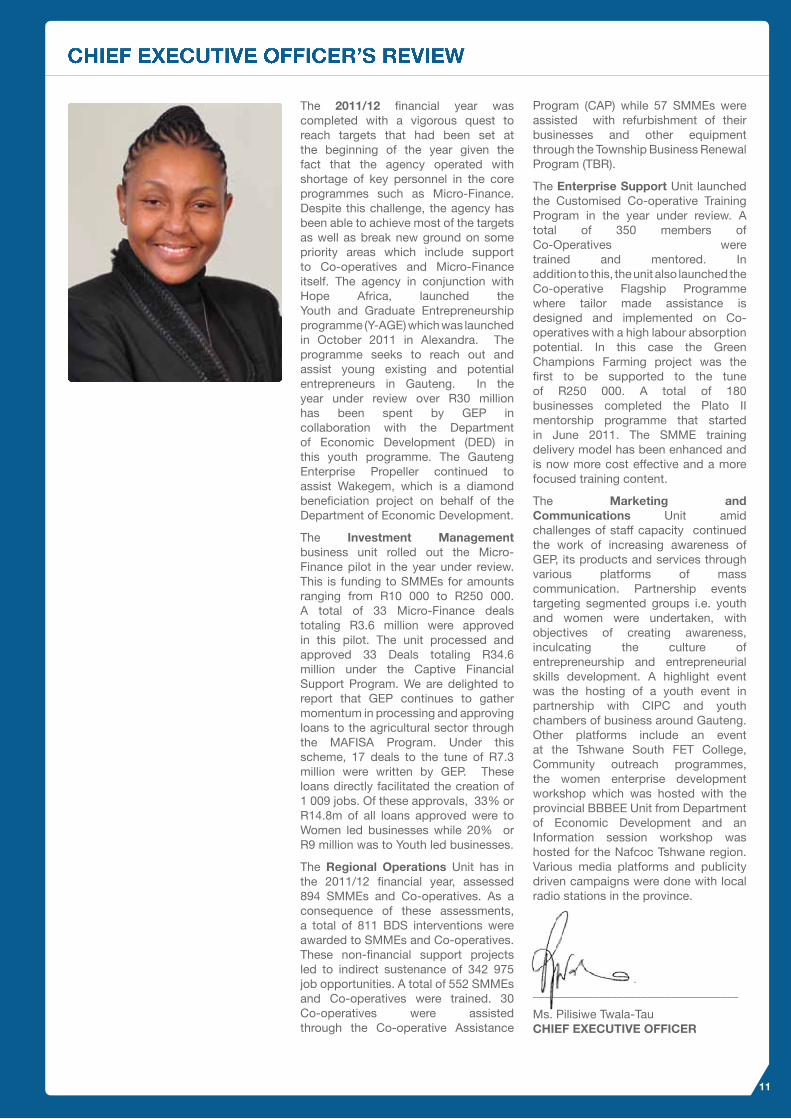
Program (CAP) while 57 SMMEs were assisted with refurbishment of their businesses and other equipment through the Township Business Renewal Program (TBR).
The Enterprise support Unit launched the Customised Co-operative Training Program in the year under review. A total of 350 members of Co-Operatives were trained and mentored. In addition to this, the unit also launched the Co-operative Flagship Programme where tailor made assistance is designed and implemented on Co- operatives with a high labour absorption potential. In this case the Green Champions Farming project was the first to be supported to the tune of R250 000. A total of 180 businesses completed the Plato II mentorship programme that started in June 2011. The SMME training delivery model has been enhanced and is now more cost effective and a more focused training content.
The Marketing and Communications Unit amid challenges of staff capacity continued the work of increasing awareness of GEP, its products and services through various platforms of mass communication. Partnership events targeting segmented groups i.e. youth and women were undertaken, with objectives of creating awareness, inculcating the culture of entrepreneurship and entrepreneurial skills development. A highlight event was the hosting of a youth event in partnership with CIPC and youth chambers of business around Gauteng. Other platforms include an event at the Tshwane South FET College, Community outreach programmes, the women enterprise development workshop which was hosted with the provincial BBBEE Unit from Department of Economic Development and an Information session workshop was hosted for the Nafcoc Tshwane region. Various media platforms and publicity driven campaigns were done with local radio stations in the province.
__________________________________
Ms. Pilisiwe Twala-Tau CHiEF ExECutivE OFFiCERR
The 2011/12 financial year was completed with a vigorous quest to reach targets that had been set at the beginning of the year given the fact that the agency operated with shortage of key personnel in the core programmes such as Micro-Finance. Despite this challenge, the agency has been able to achieve most of the targets as well as break new ground on some priority areas which include support to Co-operatives and Micro-Finance itself. The agency in conjunction with Hope Africa, launched the Youth and Graduate Entrepreneurship programme (Y-AGE) which was launched in October 2011 in Alexandra. The programme seeks to reach out and assist young existing and potential entrepreneurs in Gauteng. In the year under review over R30 million has been spent by GEP in collaboration with the Department of Economic Development (DED) in this youth programme. The Gauteng Enterprise Propeller continued to assist Wakegem, which is a diamond beneficiation project on behalf of the Department of Economic Development.
The investment Management business unit rolled out the Micro- Finance pilot in the year under review. This is funding to SMMEs for amounts ranging from R10 000 to R250 000. A total of 33 Micro-Finance deals totaling R3.6 million were approved in this pilot. The unit processed and approved 33 Deals totaling R34.6 million under the Captive Financial Support Program. We are delighted to report that GEP continues to gather momentum in processing and approving loans to the agricultural sector through the MAFISA Program. Under this scheme, 17 deals to the tune of R7.3 million were written by GEP. These loans directly facilitated the creation of 1 009 jobs. Of these approvals, 33% or R14.8m of all loans approved were to Women led businesses while 20% or R9 million was to Youth led businesses.
The Regional Operations Unit has in the 2011/12 financial year, assessed 894 SMMEs and Co-operatives. As a consequence of these assessments, a total of 811 BDS interventions were awarded to SMMEs and Co-operatives. These non-financial support projects led to indirect sustenance of 342 975 job opportunities. A total of 552 SMMEs and Co-operatives were trained. 30 Co-operatives were assisted through the Co-operative Assistance

12
BOaRD MEMBERs
Dr. Peter Matseke BOaRD CHaiRpERsOn
Mr. Thulani Sithole
Dr. Duma Ndlovu
Ms. Pilisiwe Twala-Tau
CHiEF ExECutivE OFFiCER
Mr. John Ngcebetsha
Ms. Masabata Mutlaneng
Dr. Thami Mazwai
Mr. Kethi Mkhonza
Ms. Morwesi Ramonyai

13
Business units RepoRts

14
Seven years of providing tailored developmental interventions to SMMEs.
‘GEP since 2005’

15
INVESTMENT MANAGEMENT
Refilwe Belebesi MANAGEr:
FINANcIAl SupporT
pErForMANcE INForMATIoN
Strategic objectives of the business unit:
1. To provide accessible financial solutions through special projects.
UNIT: INVESTMENT MANAGEMENT
PlANNING STATEMENT: To EffEcTIVEly ANd TIMEoUSly orIGINATE, IMPlEMENT ANd MoNITor GEP’S INVESTMENTS
STrATEGIc objEcTIVE
oUTcoME / MEASUrAblE
objEcTIVE
INdIcATor / PErforMANcE
MEASUrE
yEArly TArGET
yEAr 2011/12
yEArly TArGET
AchIEVEd
yEAr 2011/12
EVIdENcE AVAIlAblE
(If yES)
MITIGATIoN PlAN
(If No)
rESoUrcES UTIlISEd
cEo coMMENTS
Provide accessible an timeous Financial solutions through special projects
Provision of accessible funding packages (covering the following sectors:)
- Construction
- Capital goods & transport
- Tourism & Leisure
- Agriculture
- Food & beverages
- Manufacturing
- Green economy
- Automotive
- Other
Number of funding solutions
Number of deals approved
Number of direct jobs sustained & created
Total Amount
No of leverage deals finalised
2
20
200
R 25 m
1 bi-annually
2 Funding solutions -Micro Finance - Captive
83
1,009
R45,4 m
On-going
Approved project report

16
UNIT: INVESTMENT MANAGEMENT
PlANNING STATEMENT: To EffEcTIVEly ANd TIMEoUSly orIGINATE, IMPlEMENT ANd MoNITor GEP’S INVESTMENTS
STrATEGIc objEcTIVE
oUTcoME / MEASUrAblE
objEcTIVE
INdIcATor / PErforMANcE
MEASUrE
yEArly TArGET
yEAr 2011/12
yEArly TArGET
AchIEVEd
yEAr 2011/12
EVIdENcE AVAIlAblE
(If yES)
MITIGATIoN PlAN (If No)
rESoUrcES UTIlISEd
cEo coMMENTS
Implement and maintain leverage Financial Suppory Programme with strategic partners (Financial Institutions and other DFIs)
Ensure increased funding of businesses owned by transversal groups
Provision of funding solutions to transversal groups
% of budget allocated for funding to be ring-fenced for transversal groups
Women 40%
Youth 30%
People with disabilities 2%
R 8M
R 6M
R500k
R 12M (153%)
R 8M (135%)
Nil (0%)
Approved project report attached.
Signed EXCO minutes 13 July 2012
The Invest-ment Manage-ment unit under-per-formed with the provision of financial assistance. An offering spe-cially aimed at PwDs is being explored.
Provide accessible an timeous Financial solutions through special projects
Increase access to funding for SMMEs and Co-ops through micro finance
Number of Micro Loans approved
12 33 Approved project report attached.
Provision of funding solutions to transversal groups
Women 40%
Youth 30%
People with disabilities 2%
R2m
1.5m
100k
R2.7m (134%)
986k (66%)
Nil (0%) Signed EXCO minutes 13 July 2012
The Invest-ment Manage-ment unit under-per-formed with the provision of financial assistance. An offering spe-cially aimed at PwDs is being explored.
Ensure timeous implementation and compliance of approved projects
Finalisation of legal agreements
Ensure % of number of deal requests for implementation
80% 59% Implementation Report attached

17
FINANcIAl SupporT proGrAM EXpENDITurE GrApH
2011-2012 2010-2011 2009-2010 Cumulative
ApproVED 45,421,280.00 33,754,957.78 41,492,789.86 120,669,027.64
BuDGET* 35,000,000.00 30,000,000.00 60,000,000.00 125,000,000.00
DISBurSEMENT 12,037,276.00 12,732,036.00 29,650,096.00 54,419,408.00
WITHDrAWN 4,495,054.00 3,091,384.85 3,214,700.00 10,801,138.85
coMMITMENTS 28,888,950.00 17,931,536.93 8,627,993.86 55,448,480.79
2011-2012 2010-2011 2009-2010 CuMuLATIvE
oVErVIEWDuring the 2011/12 financial year, a budget of R 35 million was allocated to the unit, of which 83 applications were approved. Performances against transversal targets for the unit were as follows:
• R 12 million was disbursed
• R4.5 million was withdrawn
• R 28.9 million is still committed
The breakdown per fund was as follows:
Micro finance fund:
33 deals were approved for the 2011/12 financial year
• R 2.7 million (134%) for women owned businesses
• R 986 000 (66%) for youth owned businesses
• R 95 054 was withdrawn
captive fund:
50 deals were approved for the 2011/12 financial year
• R 12 million (153%) for women owned businesses
• R 8 million (135%) for youth owned enterprises
• R4, 4 million was withdrawn.
20 000 000.00
40 000 000.00
60 000 000.00
80 000 000.00
120 000 000.00
140 000 000.00
160 000 000.00
100 000 000.00
aPPROveD BuDGet * DiSBuRSemeNt WitHDRaWN COmmitmeNtS
*Budget includes R10 million from Mafisa fund
AGENcy: fINANcEPlANNING STATEMENT: To EffEcTIVEly ANd TIMEoUSly orIGINATE,
IMPlEMENT ANd MoNITor GEP’S INVESTMENTS
STrATEGIc objEcTIVE
oUTcoME / MEASUrAblE
objEcTIVE
INdIcATor / PErforMANcE
MEASUrE
ANNUAl TArGET
ANNUAl TArGET
AchIEVEd
EVIdENcE AVAIlAblE
(If yES)
MITIGATIoN PlAN (If No)
rESoUrcES UTIlISEd
cEo coMMENTS
Provide legal support to GEP
Provision and facilitation of legal advice Compliance with applicable legislations
% Advise to GEP on legal matters
% compliance with relevant statutes
100%
100%
70%
100%
Legal Report attached.

18
Start - Up
ExpanSion
ContraCt
FranChiSE
agriCUltUrE
aUtomotivE
BUilding & ConStrUCtion
EntErtainmEnt
hEalth & BEaUty
iCt
manUFaCtUring
mEdiCal
propErty
rEtail
SErviCES
EkUrhUlEni
JohannESBUrg
SEdiBEng
tShwanE
wESt rand
ApproVAl BY proDucT
ApproVAl BY SEcTor
ApproVAl BY rEGIoN
proDucTS
STArT - up 1,571,054.00
EXpANSIoN 17,174,765.00
coNTrAcT 25,175,461.00
FrANcHISE 1,500,000.00
ToTAl 45,421,280.00
AGrIculTurE 8,994,020.00
AuToMoTIVE 73,945.00
BuIlDING & coNSTrucTIoN 13,420,000.00
ENTErTAINMENT 1,250,000.00
HEAlTH & BEAuTY 270,000.00
IcT 5,800,000.00
MANuFAcTurING 1,539,205.00
MEDIcAl 3,110,000.00
propErTY 100,000.00
rETAIl 6,211,901.00
SErVIcES 4,652,209.00
ToTAl 45,421,280.00
rEGIoNS
EkurHulENI 5,643,165
JoHANNESBurG 20,268,780
SEDIBENG 3,459,670
TSHWANE 9,106,161
WEST rAND 6,943,504
ToTAl 45,421,280

19
MAMocHEcHErE FArMING prIMArY co-opErATIVE lIMITED
An Ancient Greek writer Aesop’s Fable story about ‘killing a goose that lays golden eggs’ a phrase that has become an idiomic expression used in everyday conversation, had moral lesson about taking good care of your source of income and livelihoods.
One such wise woman that won’t kill hens laying golden eggs, is Florah Shilaloke chairperson and managing director of a family owned farming cooperative in Bronkhorspruit called Mamochechere Farming Primary Co-operative Limited. The cooperative is involved in mixed practice of farming that is piggery, vegetable and crop production including poultry. However their key focus and profit drive is on poultry farming.
Mamochechere Cooperative was established in 2003 and it operated on a small farm in valtaki near Cullinan north east of Tshwane. Due to their passion in the farming life they decided to venture into commercial farming with key focus been on poul-try farming. The cooperative was able to raise enough funds from their own savings to purchase a 22.3 hectors farm in Leeufontein, Bronkorspruit which was bigger to accommodate chicken egg laying facilities.
When the cooperative started their egg selling business they only
had 800 lay chickens and due to inadequate facilities to rear these chickens they could only sell 10 crates a day to suppliers. Florah the cooperative managing director never relinquished her childhood dream of becoming a successful farmer, to that effect she encouraged the members to stay intact and work hard to grow the business.
All hope was not lost in members particularly Florah who went to all corners to seek information that would help her grow the business. It was after attending a workshop by GEP in the neighbouring township of Rethabiseng that she heard information about the Mafisa agricultural funding provided by GEP on behalf of the National Department of Agriculture, Forestry and Fisheries. The cooperative never looked back and applied for Mafisa fund. A feasibility study was conducted by GEP Investment Analyst responsible for Mafisa and a production Fund of R560.000 was approved for Mamochechere cooperative business. The fund was motivated by an order from Lanham Cash & Carry to Mamochechere to supply 100 crates of eggs which is a total of 3000 eggs a day.
Their loan fund was used to erect chicken houses, to purchase 5000 layer chickens including chicken feed that helps these chickens to lay eggs everyday, egg grading machine, and vaccine for the chickens.
These layer chickens when well nurtured like a ‘goose laying golden eggs’ and appropriately fed with correct chicken feed, the chickens are able to lay an average of one egg a day. The loan fund from GEP enabled Mamochechere to supply an order from its key client’s Lanham cash and carry. Lanham Cash and Carry believed in the cooperative’s capabilities of growth and they attributed that to the professional standards that Mamochechere upheld in washing and packaging the eggs also their timely delivery of the eggs.
Mamocherere cooperative has realised a significant growth and expansion in the past year, they are now able to deliver 1000 crates a week to suppliers that includes supermarkets, tuck shops and cash and carries around the Bronkhorspruit area. The layer chickens in the farm chicken houses have also increased from 5000 to 9000, meaning that the cooperative has capacity to produce 1.8 million eggs in a month.
The poultry farming cooperative Mamochechere employs a total of eight workers on a fulltime basis. The hands on and business focused Cooperative’s Chairperson Florah Shilaloke said, “my objective is to have 30 000 chickens so that I can meet the ever increasing demand of eggs from wholesalers in Mpumalanga and Limpopo, I would also want to see the cooperative supplying the SADC region which has a high demand and less supply of eggs”.
cHIckENS lAY GolDEN EGGS AT MAMocHEcHErE’S coopErATIVE FArM
Florah Shalaloke in one of her farm chicken house

A TrIp To BrAzIl, pluS loVE oF SHoES opENS A SHoE SAloN
NIcHolINE’S SHoES, HANDBAGS AND AccESSorIES
nicholine tubane from Soweto got into a plane in 2009 to Sau Paulo in Brazil, accompanying a neighbour who was in a shoe selling business to buy stock. On that trip Tubane was just travelling as a leisure tourist and she got impressed by the shoe and bag products she saw and coming back she started developing a business plan to open up her own store in the heart of Jozi’s CBD, on Pritchard and Market Street.
Coming back from the South American trip, she had bought a few items that she was going to sell from the boot of her car. Demand from her network market started growing and it was no longer feasible to sell from the car boot. Her client base dramatically grew she even expanded product range to bags, sunglasses and designer hats. “I had to make a choice of a lifetime to quit my job and pursue the business which I have just developed a lot of passion for” said Ms. Tubane who never regretted making the inevitable decision. In 2010 she resigned from her Fund Accountant position at Liberty Holdings Limited, to focus fulltime on the growth of Nicholine’s, shoes, hand bags and accessories.
Early last year Ms. Tubane visited GEP to apply for funding that she will utilise to rent a shop at Fashion Kapitol on the busy Pritchard Street which is a historic fashion district centre. With a business plan that she developed using the templates on the GEP website and her own R50 000 contribution to the business, her fund application of R118 000 was approved. The micro funding she received assisted in buying stock, shop fittings like mirrors and stands, it also assisted to fund operational capital of the business.
The business is employing two twin sisters on a full time basis, who have been trained in customer care and professionalism. “Image is key in the clothing retail business and we cannot compromise standards of corporate image”, said Nicholine, while looking at her well corporate looking and presented ladies working for her.
The business is also buying from local suppliers and SMMEs in the hats and bag manufacturing industry. key suppliers of the shoe division is Plum, Rage and Zoom. Bags and purses are supplied by Crouch handbags and she has just signed a contract with an SMME from Soweto Mbonisi Zikala who is a handcrafter manufacturing hand bags.
Her designer hats are also supplied by Ntsekeng Sout a Milliner from Soweto.
Since the opening of the shop she says “the business have been realising a month to month increase of sales, however they dropped in the winter season due to less people visiting malls in the cold season”. Nicholine has also developed various efforts to market her shoe & bags business, she buys advertising space in local CBD media, she has started a social media page (Facebook) and they distribute flyers from time to time especially when they have sales.
Nicholine displays her fashionable ladies shoes
The “twin” faces of Nicholine’s Shoes20
21
Monde MadunarEGIoNAl opErATIoNS
EXEcuTIVE
Strategic objectives of the business unit:
1. To provide quality non-financial support services to SMMEs and Co-operatives;
2. To effectively and efficiently manage regional operations
rEGIoNAl opErATIoNS
pErForMANcE INForMATIoN
UNIT: rEGIoNAl oPErATIoNS PlANNING STATEMENT: To EffEcTIVEly ANd TIMEoUSly orIGINATE,
IMPlEMENT ANd MoNITor GEP’S INVESTMENTS
STrATEGIc objEcTIVE
oUTcoME / MEASUrAblE
objEcTIVE
INdIcATor / PErforMANcE
MEASUrE
yEArly TArGET
yEAr 2011/12
yEArly TArGET AchIEVEd
yEAr 2011/12
EVIdENcE AVAIlAblE
(If yES)
MITIGATIoN PlAN
(If No)
rESoUrcES UTIlISEd
cEo coMMENTS
Provide quality BDS and training services to SMMEs and Co-operatives in Gauteng
Increased number of SMMEs and Co-operatives benefiting from GEP interventions and training
Number of SMMEs assisted
685 SMMEs 1 508 SMMES:-
Assessed = 796
Projects Awarded = 712
Consolidated Excel report
Increase assistance to struggling township businesses through the Township Business Renewal Programme
Number of businesses assisted
50 businesses 57 Businesses Consolidated Excel Report
To train SMMEs and Co-ops
Number of training sessions held
26 Training sessions
75 Training Sessions
Excel Report – Regional Operations Annual Training
Promotion and support of entrepreneurship to target groups
Number of SMMEs assisted from the target groups.
205 Women-owned SMMEs (30%)
882 Women-owned SMMEs
(100%)
Consolidated Transversal Report
22
UNIT: rEGIoNAl oPErATIoNS PlANNING STATEMENT: To EffEcTIVEly ANd TIMEoUSly orIGINATE,
IMPlEMENT ANd MoNITor GEP’S INVESTMENTS
STrATEGIc objEcTIVE
oUTcoME / MEASUrAblE
objEcTIVE
INdIcATor / PErforMANcE
MEASUrE
yEArly TArGET
yEAr 2011/12
yEArly TArGET
AchIEVEd
yEAr 2011/12
EVIdENcE AVAIlAblE
(If yES)
MITIGATIoN PlAN
(If No)
rESoUrcES UTIlISEd
cEo coMMENTS
137 Youth-owned SMMEs assisted (20%)
861 Youth-owned SMMEs assisted (100%)
Consolidated Transversal Report
14 People with disability assisted (2%)
7 People with disability assisted.
Consolidated Transversal Report
This area has been a challenge for Regional Operations and to address this challenge the team intends on PwD organiza-tions within the respective regional offices in the new financial year.
Jobs sustained through BDS & TBR interventions to SMMEs
Number of jobs sustained
633 jobs sustained
342 975 jobs sustained (For both SMMEs asses sed and BDS)
Consolidated Excel Report
To provide focused support to Co-opera-tives
Increased number of co-operatives assisted by GEP
Number of co-ops assisted with CAP
33 Co-Ops 30 Co-Ops Excel consolidated report
The RO fell short of achieving the target by 3 cooperatives on CAP despite the fact that it operated with only 2 Cooperatives Analysts and only employed the other 3 in November 2011. The RO therefore lacked capacity for seven months because of the moratorium on employment emanating from the merger which was underway.
Number of co-ops assisted with BDS
50 Co-Ops 197 Co-Ops assisted:
-Assessed =98
-Projects Awarded =99
Consolidated Excel Report
Promotion of entrepreneurship to target groups
Number of co-ops assisted from the target groups
25 women-led co-ops (30%)
846 women-led co-ops (100%)
Consolidated Transversal Report
16 Youth-led Co-ops assisted (20%)
344 Youth-led Co-ops assisted (100%)
Consolidated Transversal Report
2 People with disability-led co-ops assisted
27 People with disability-led co-ops assisted
Consolidated Transversal Report
Jobs sustained through BDS & CAP interventions to Co-ops
Number of jobs sustained
375 jobs 380 jobs sustained
Consolidated Excel report

23
TArGET ACTuAL vARIANCE
100
200
300
400
600
700
800
500
Smme aSSeSSmeNt
CO-OPS aSSeSSmeNt
Smme & CO-OP BDS
tRaiNiNG SeSSiONS
CaP & tBR
proJEcTS FroM 01 AprIl 2011 To 31 MArcH 2012
FinanCial intErvEntionS
tEChniCal intErvEntionS
planning intErvEntionS
markEting SUpport intErvEntionS
20 ptp SponSorShip
FinanCial intErvEntionS
tEChniCal intErvEntionS
planning intErvEntionS
markEting SUpport intErvEntionS
20 ptp SponSorShip
FINANcIAl INTErVENTIoNS 12084
TEcHNIcAl INTErVENTIoNS 177803.55
plANNING INTErVENTIoNS 98741.7
MArkETING SupporT INTErVENTIoNS 305874.13
20 pTp SpoNSorSHIp 166080.96
FINANcIAl INTErVENTIoNS 2
TEcHNIcAl INTErVENTIoNS 9
plANNING INTErVENTIoNS 10
MArkETING SupporT INTErVENTIoNS 25
20 pTp SpoNSorSHIp 5

24
ApplE NEXuS (IcT INTErNET cAFE’S)
Apple Nexus is an internet and computing service business owned by two young people from vanderbjilpark in Sedibeng, Thuto Mosholi and Gilbert Khosa. The name of the company ‘Apple Nexus’ can be interpreted as a sign of where the two businessmen draws inspiration. With a brand identity that is visually almost linked to global giant IT company Apple Inc, it can only mean that these youth dreams big and aims high. The growth and expansion of Apple Nexus in the few past years, provides optimism that Gauteng might be moulding the next big IT names and company to compete with global names like the late Steve Jobs of Apple Inc, Bill Gates of Microsoft and Google’s Sergey Brin.
Thuto and Gilbert started their business very small when the former used to be the latter’s client in an internet service business where Gilbert used to work. The idea of opening an internet ser-vice business came about when Gilbert
realised a gap with the bad service of internet Cafe’s around the vaal area and including that of his very own place employment. His annoyance on the service was based on how customers are not given added service through assistance in using computers and surfing the net. “I have seen how most computer illiterate customers would sit long hours on a computer with frustration, and in most instances all they wanted was to send a mere Cv to apply for a vacancy, and that used to rip me apart and the sad-dest part was that my workplace policy never allowed staff to assist customers in using computers. In that I saw a business opportunity that could provide better service to internet and computing customers”, said an entrepreneurial Gilbert. It was only a matter of time after the partners toiled with ideas and they were ready to resign from their full time jobs to start their own venture.
Apple Nexus first shop was launched in April 2006, the business operations
started with the usage of only two old machines, ‘Pentium computers’ 1998 version. Situated at the busy vaalgate Mall which is few kilometres away from the vaal university of Technology, Apple Nexus is at the heart of the internet and computing market, with businesses competing to core students market. Apple Nexus market share increased due to an added service of helping customers in using computers and providing other technical and software services to a segment of clients who have their own computer. Most of these customers are small business owners and students.
It was less than six months when a second shop was opened, the branch which is also located at the vanderbjilpark CBD on President Kruger Street not far from the vaalgate shop was a sign of growth to the business. This shop was acquired after a competitor business was closing operations, keeping their ears on the ground Apple Nexus bought the space and expanded their business and
SEDIBENG YouTH INVADES THE ICT servICe SEcTor
Gilbert Khosa (front) co-owner of Apple Nexus with staff members and partners
25
client base. The opening of the President Kruger was now bringing the vision of Apple Nexus closer to reality.
“Starting these businesses never came without challenges, we have in the process done a lot of mistakes and learned from those challenges. Amid all challenges, it was Thuto who kept us headstrong and always motivating everybody to focus and become optimists like most successful businesspeople and entrepreneurs of kind. He’s encouragement boosted our moral, because he was already running a successful engineering company and his experience was a good mentor to me”, admits Gilbert.
After realising that there was a need to further develop their business to enhance customer service and increase client base. They heard of Gauteng Enterprise Propeller on radio interviews, they subsequently visited GEP office in Sedibeng region in vanderbjilpark. An assessment and diagnosis on the business was conducted, and GEP recommended various interventions. Apple Nexus was then assisted with GEP’s Business Development Support (BDS) programmes. Among other interventions, marketing tools to maximise the brand visibility and expose services to the markets were provided, an electronic financial management system was installed for the business to professionally manage their financial records.
The major boost of the BDS intervention that jerked Apple Nexus to significant levels of growth was GEP’s assistance with the Township Business Renewal programme aimed at developing businesses in townships. Through the programme Apple Nexus received a grant fund to acquire, 15 new computers, snap-lab printers and binding machine.
The business started realising increased profits and demand for services was becoming high and all that was due to equipment that ensured faster provision of services.
These interventions from GEP circuitously boosted growth of Apple Nexus, leading to subsequent opening of four more branches in vereeniging, Sharpeville, Berthword Park and Zamdela in Sasolburg. The growth has also provided them with a strategic direction of franchising some of the branches, the President Kruger and Zamdela branch have been franchised and they have been sold to two former employees of Apple Nexus. The two young women Dineo Mokala and Mpho Mokoena (centre on main picture) own the Zamdela and President Kruger franchises respectively. The ladies who are well versed with the internet and
computing business were sold the franchise in a more reasonable price on loan terms and to date Dineo has already pain the loan fund. ‘Our decision to franchise and sell to employees was based on empowerment and growth of people, these are employees who have been with us from inception and they are key in the business decision making processes’ said Gilbert.
The quantum leap growth of Apple Nexus in less than five years can be directed to detailed focus to business, ability to identify market gaps and professionalism. All these elements have seen the business turnover increasing by 40% to a figure of R1, 1 million at the close of their financial year in Febru-ary 2012. The business employs 11 fulltime employees and
2 students on a casual basis.
Apple Nexus strategic objective based on a three year period ending 2015 is to expand the brand to compete with prominent brands in the internet industry, and make inroads into the rural markets and open more branches in Gauteng major cities. “Our wish and hope is that by the time we expand our provincial footprint, the most anticipated Gauteng ICT Hub in Nasrec would be in place, the hub will assist in addressing the issue of SA’s generally slow ADSL, the project will be revolutionary to all ICT projects big and small”, Gilbert concluded.
Gilbert Khosa (front) co-owner of Apple Nexus with staff members and partners
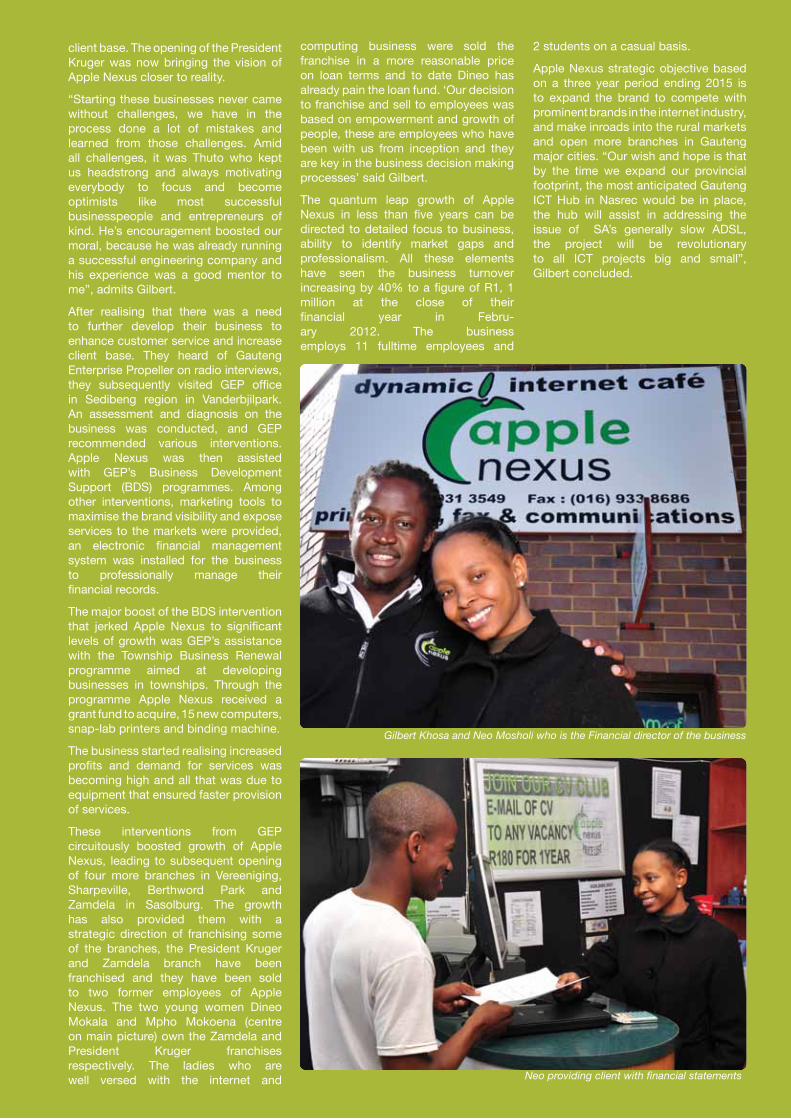
Gilbert Khosa and Neo Mosholi who is the Financial director of the business
Neo providing client with financial statements

26
kHupukANI BAkErY AND coNFEcTIoNErY
A confectionary business owned by five women from the township of Davey ton in Ekurhuleni east of Gauteng, has grown from been stokvel, to an iron corrugated shack bakery business, and currently to a fully fledged structure with potential to expand product range and service a more diverse client base.
Khupukani bakery and Confectionery was started by five women who individually owned, very small and informal bakery businesses, with others working for major confectioneries in Gauteng. Like most middle aged women in the townships the Khupukani women had a stokvel which they met on Fridays to invest an amount of R1 000 to each member on a routine basis. It was on an evening of one of the stokvels gathering that an idea to invest the money to start a business rather than investing to individuals captured the thoughts of the ladies with an enticed imagination. On that Friday evening it was the end of the stokvel and the birth Khupukani Bakeries and Confectionary.
The business started operating in 2007, from an iron corrugated shack on the busy taxi road, Esselen Street in Daveyton. These ambitious women were facing various operational challenges as they were using manual equipments and home stoves to produce their bakery products. These affected business a lot since they were unable to respond to the high demand of their products.
In the same year the women visited Gauteng Enterprise Propeller (GEP) in Germiston to register on its database to receive business training courses offered by GEP. It was during this period that GEP’s flagship developmental programme, Township Business Renewal (TBR) was launched and Khupukani was selected as one of the beneficiaries of the programme.
The TBR developmental interventions boosted the growth of Khupukani, the business through this programme received necessary equipment that helped them to address challenges of products demand. GEP provided
the business with a triple deck oven, double sliding fridge, a cake and dough mixer, pre-warmer and cake cool counter displays. In their application for the grant to GEP they have requested for the premises roof to be refurbished, however the idea was halted as they had a vision of getting a fully fledge building structure to operate from, and the ladies requested GEP to hold on to the money.
Two years after operating in the small shack, Khupukani tested a product range which is referred to in the industry as a ‘yeast line’, they were now producing Portuguese bread & rolls, garlic bread, rye bread and whole-wheat bread. The market response to the new product range was overwhelming and they realised that they cannot respond to the demand operating from a confined space.
A Samaritan customer, who loved Khupukani’s cakes that became acquainted to the women, introduced the ladies to the Ekurhuleni Peermont Chambers of Commerce Trust, which
they made an application for funding of a new structure for the envisioned confectionary. After deliberations and countless presentations before the Trust, an amount of R 600, 000 was approved for khupukani to build a structure.
In 2012 Khupukani ladies are now proud owners of a new constructed building situated across the street from their initial place of business. The TBR money that GEP withheld on their behalf came in very useful in the construction process of the building. The GEP fund was used to install window butlers, security doors and floor tilling of the receiving area of the building.
One of Khupukani members, Agnes Ndlhangamandla spoke with excitement and sigh of victory to overcoming the first challenge: “We have now moved and ready to produce various products range of bakeries, through various training we received from special confectionary training institutes, I can confidently say we are ready to take Khupukani to the next level’.
dAVEyToN TowNShIP woMEN GIVE All ENErGy To coNfEcTIoNEry bUSINESSES
Khupukani ladies displays some of their products in the new owned building
27
Keolebogile ModiseGENErAl MANAGEr:
ENTErprISE SupporT
Strategic objective of the business unit:
1. To research and develop quality products for SMMEs and Co-operatives.
2. To provide effective and efficient aftercare support solutions to SMMEs and Co-operatives.
pErForMANcE INForMATIoN
ENTErprISE SupporT
UNIT: rESEArch ANd dEVEloPMENT
PlANNING STATEMENT: To EffEcTIVEly ANd TIMEoUSly orIGINATE, IMPlEMENT ANd MoNITor GEP’S INVESTMENTS
STrATEGIc objEcTIVE
oUTcoME / MEASUrAblE
objEcTIVE
INdIcATor / PErfor-
MANcE MEASUrE
yEArly TArGET
yEAr 2011/12
yEArly TArGET
AchIEVEd
yEAr 2011/12
MoNThly TArGET AchIEVEd
APrIl AcTUAl
EVIdENcE AVAIlAblE
(If yES)
MITIGATIoN PlAN
(If No)
rESoUrcES UTIlISEd
cEo coMMENTS
To research relevant information in order to improve GEP’s service deliv-ery.
Conduct research studies to provide required information.
Number of research studies done
1 Study 2 Research studies
7 Ongoing research and reports on sectors.
pwd dEvElopmEnt programmE
Internal research was conducted to identify additional sub-programmes and possible partnerships for the PWD development programme. Final report is approved.
dEd/UJ rESEarCh Assisted with providing information on research previously conducted by GEP for the research study.
YES Internal
28
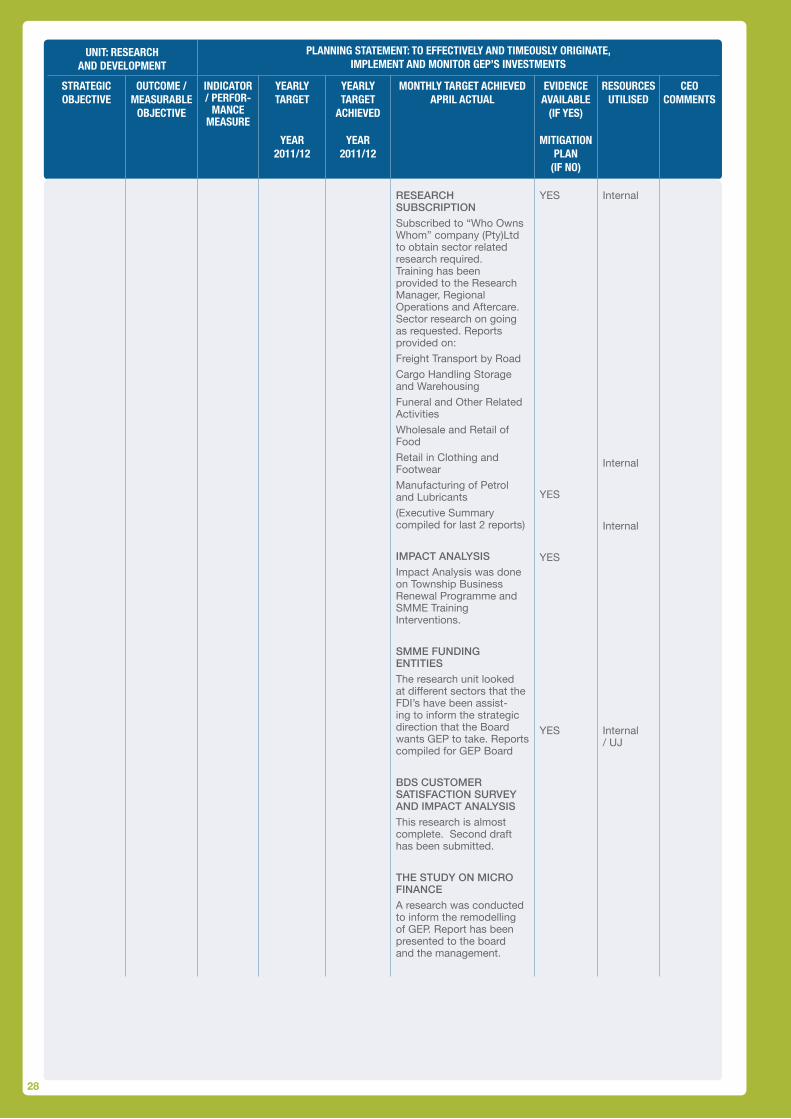
rESEarCh SUBSCription
Subscribed to “Who Owns Whom” company (Pty)Ltd to obtain sector related research required. Training has been provided to the Research Manager, Regional Operations and Aftercare. Sector research on going as requested. Reports provided on:
Freight Transport by Road
Cargo Handling Storage and Warehousing
Funeral and Other Related Activities
Wholesale and Retail of Food
Retail in Clothing and Footwear
Manufacturing of Petrol and Lubricants
(Executive Summary compiled for last 2 reports)
impaCt analySiS
Impact Analysis was done on Township Business Renewal Programme and SMME Training Interventions.
SmmE FUnding EntitiES
The research unit looked at different sectors that the FDI’s have been assisting to inform the strategic direction that the Board wants GEP to take. Reports compiled for GEP Board
BdS CUStomEr SatiSFaCtion SUrvEy and impaCt analySiS
This research is almost complete. Second draft has been submitted.
thE StUdy on miCro FinanCE
A research was conducted to inform the remodelling of GEP. Report has been pre-sented to the board and the management.
UNIT: rESEArch ANd dEVEloPMENT
PlANNING STATEMENT: To EffEcTIVEly ANd TIMEoUSly orIGINATE, IMPlEMENT ANd MoNITor GEP’S INVESTMENTS
STrATEGIc objEcTIVE
oUTcoME / MEASUrAblE
objEcTIVE
INdIcATor / PErfor-
MANcE MEASUrE
yEArly TArGET
yEAr 2011/12
yEArly TArGET
AchIEVEd
yEAr 2011/12
MoNThly TArGET AchIEVEdAPrIl AcTUAl
EVIdENcE AVAIlAblE
(If yES)
MITIGATIoN PlAN
(If No)
rESoUrcES UTIlISEd
cEo coMMENTS
rESEarCh SUBSCription
Subscribed to “Who Owns Whom” company (Pty)Ltd to obtain sector related research required. Training has been provided to the Research Manager, Regional Operations and Aftercare. Sector research on going as requested. Reports provided on:
Freight Transport by Road
Cargo Handling Storage and Warehousing
Funeral and Other Related Activities
Wholesale and Retail of Food
Retail in Clothing and Footwear
Manufacturing of Petrol and Lubricants
(Executive Summary compiled for last 2 reports)
impaCt analySiS
Impact Analysis was done on Township Business Renewal Programme and SMME Training Interventions.
SmmE FUnding EntitiES
The research unit looked at different sectors that the FDI’s have been assist-ing to inform the strategic direction that the Board wants GEP to take. Reports compiled for GEP Board
BdS CUStomEr SatiSFaCtion SUrvEy and impaCt analySiS
This research is almost complete. Second draft has been submitted.
thE StUdy on miCro FinanCE
A research was conducted to inform the remodelling of GEP. Report has been presented to the board and the management.
YES
YES
YES
YES
Internal
Internal
Internal
Internal / uJ

29
UNIT: rESEArch ANd dEVEloPMENT
PlANNING STATEMENT: To EffEcTIVEly ANd TIMEoUSly orIGINATE, IMPlEMENT ANd MoNITor GEP’S INVESTMENTS
STrATEGIc objEcTIVE
oUTcoME / MEASUrAblE
objEcTIVE
INdIcATor / PErfor-
MANcE MEASUrE
yEArly TArGET
yEAr 2011/12
yEArly TArGET
AchIEVEd
yEAr 2011/12
MoNThly TArGET AchIEVEdAPrIl AcTUAl
EVIdENcE AVAIlAblE
(If yES)
MITIGATIoN PlAN
(If No)
rESoUrcES UTIlISEd
cEo coM-
MENTS
gaUtEng provinCial lEgiSlativE
Provided assistance to service provider appointed with interviews and focus group interviews with GEP management. (Research study on the impact of laws passed by GPL).
FinanCE dEpartmEnt
Requested to benchmark GEP’s collection, ageing and non-performing book against the industry/ economy and to provide recommendations on improved debt collection procedures / systems. Referred to Peter Roussos who submitted a quote. CFO to take a decision on way forward. CFO requested Annual Reports from other lending institutions, provided 10.
To develop quality support products and services for SMMEs and co-operatives in Gauteng.
To increase operational effectiveness.
Number of systems improved.
2 Sys-tems/Pro-cesses
2 Systems
Target exceeded
BdS SErviCE providEr aCCrEditation
Service Provider interviews for Accreditation are completed and to-date 54 companies have been interviewed across Gauteng. vendor numbers will be allocated in April.
BdS training manUalS
The unit completed the development of training modules. It has started the process of getting all 24 modules accredited by the Services Seta. Due to budget constraints, only two modules were implemented this year.
BdS intErvEntionS
The updated interventions have been completed and adopted by EXCO. Regional Operations will be advised to implement accordingly.
training
The designing of the GEP Training Certificate has been finalised for implementation.
An Impact Assessment Questionnaire was developed for implementation and has been submitted to Regional Operations.
YES
YES
YES
30
UNIT: rESEArch ANd dEVEloPMENT
PlANNING STATEMENT: To EffEcTIVEly ANd TIMEoUSly orIGINATE, IMPlEMENT ANd MoNITor GEP’S INVESTMENTS
STrATEGIc objEcTIVE
oUTcoME / MEASUrAblE
objEcTIVE
INdIcATor / PErfor-
MANcE MEASUrE
yEArly TArGET
yEAr 2011/12
yEArly TArGET
AchIEVEd
yEAr 2011/12
MoNThly TArGET AchIEVEd
APrIl AcTUAl
EVIdENcE AVAIlAblE
(If yES)
MITIGATIoN PlAN
(If No)
rESoUrcES UTIlISEd
cEo coM-
MENTS
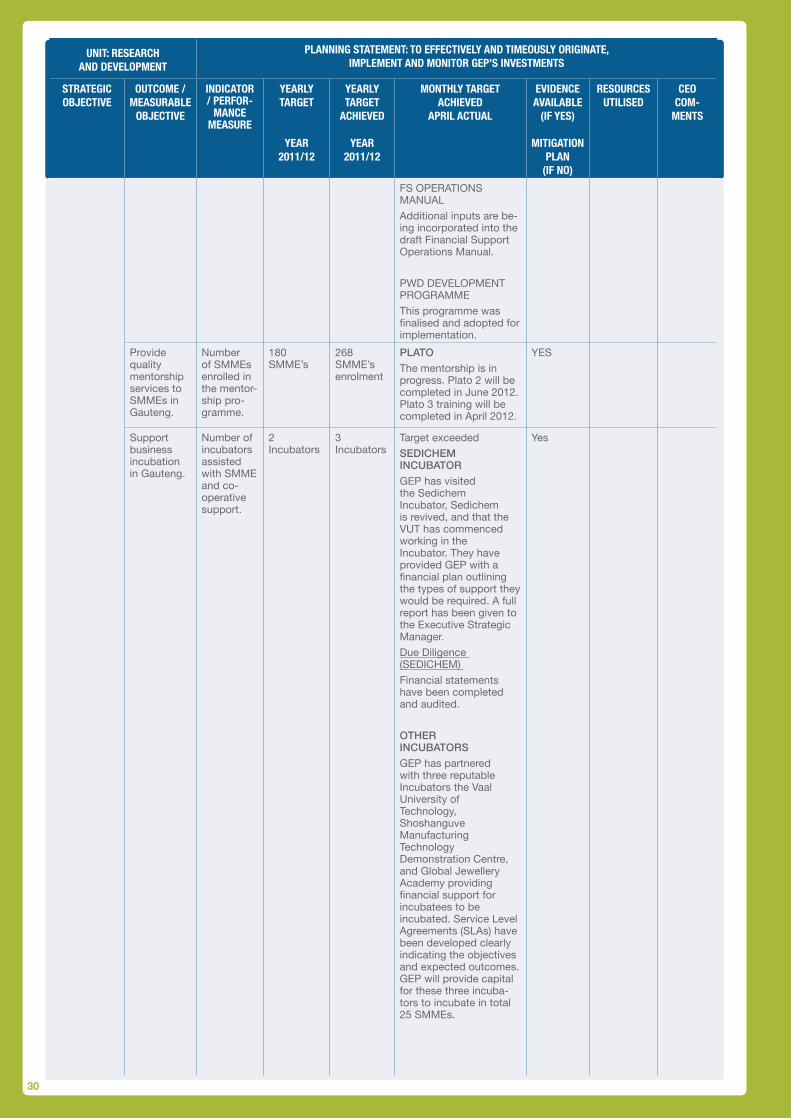
FS OPERATIONS MANuAL
Additional inputs are be-ing incorporated into the draft Financial Support Operations Manual.
PWD DEvELOPMENT PROGRAMME
This programme was finalised and adopted for implementation.
Provide quality mentorship services to SMMEs in Gauteng.
Number of SMMEs enrolled in the mentor-ship pro-gramme.
180 SMME’s
268 SMME’s enrolment
plato
The mentorship is in progress. Plato 2 will be completed in June 2012. Plato 3 training will be completed in April 2012.
YES
Support business incubation in Gauteng.
Number of incubators assisted with SMME and co-operative support.
2 Incubators
3 Incubators
Target exceeded
SEdiChEm inCUBator
GEP has visited the Sedichem Incubator, Sedichem is revived, and that the vuT has commenced working in the Incubator. They have provided GEP with a financial plan outlining the types of support they would be required. A full report has been given to the Executive Strategic Manager.
Due Diligence (SEDICHEM)
Financial statements have been completed and audited.
othEr inCUBatorS
GEP has partnered with three reputable Incubators the vaal university of Technology, Shoshanguve Manufacturing Technology Demonstration Centre, and Global Jewellery Academy providing financial support for incubatees to be incubated. Service Level Agreements (SLAs) have been developed clearly indicating the objectives and expected outcomes. GEP will provide capital for these three incuba-tors to incubate in total 25 SMMEs.
Yes

31
UNIT: rESEArch ANd dEVEloPMENT
PlANNING STATEMENT: To EffEcTIVEly ANd TIMEoUSly orIGINATE, IMPlEMENT ANd MoNITor GEP’S INVESTMENTS
STrATEGIc objEcTIVE
oUTcoME / MEASUrAblE
objEcTIVE
INdIcATor / PErfor-
MANcE MEASUrE
yEArly TArGET
yEAr 2011/12
yEArly TArGET
AchIEVEd
yEAr 2011/12
MoNThly TArGET AchIEVEdAPrIl AcTUAl
EVIdENcE AVAIlAblE
(If yES)
MITIGATIoN PlAN
(If No)
rESoUrcES UTIlISEd
cEo coM-
MENTS
Shoshanguve Manufacturing – 15 incubatees
Global Jewellery Academy - 10 incubatees
vaal university - 10 incubatees
Manage stakeholder relationships
Support pilot co-opera-tives support pro-grammes.
Number of co-opera-tives pilot projects.
1 Pilot Project
1 Project progrESS rEport on JoCod
GEP assisted with the establishment of The Greens Champions Farm Co-operative, which is owned by 7 members. The co-op has created 30 jobs, this number comprises of 10 youth and all 30 are PWDs. This is in addition to the 7 members of the cooperative from which 3 are PWDs, 6 are youth and 2 are female. JOCOD is providing technical and project management support. It has also facilitated formal market for the co-operative.
SaBwa inCUBator
GEP held a meeting with SABWA, and explained the v-Incubator model; SABWA management raised concerns about the model as they want a physical incubator. It was then decided that the project be parked for the next financial year provided SABWA will be able to raise funds by February 2012
inCUBator dEvElopmEnt programmE
GEP drafted the questionnaire for the relevant stakeholders to complete. The responses will inform the development of the Incubation Proposal.
YES
Provide customised training to Co-oper-atives in Gauteng.
Number of co-operatives trained
200 Co-ops
350 Target exceeded
CoopErativES training
GEP appointed Safe Energy Depot (SED) a service provider to provide integrated training to 200 coporators, SED has trained and mentored an additional 150 cooporators.
YES
32
UNIT: rESEArch ANd dEVEloPMENT
PlANNING STATEMENT: To EffEcTIVEly ANd TIMEoUSly orIGINATE, IMPlEMENT ANd MoNITor GEP’S INVESTMENTS
STrATEGIc objEcTIVE
oUTcoME / MEASUrAblE
objEcTIVE
INdIcATor / PErfor-
MANcE MEASUrE
yEArly TArGET
yEAr 2011/12
yEArly TArGET
AchIEVEd
yEAr 2011/12
MoNThly TArGET AchIEVEdAPrIl AcTUAl
EVIdENcE AVAIlAblE
(If yES)
MITIGATIoN PlAN
(If No)
rESoUrcES UTIlISEd
cEo coM-
MENTS
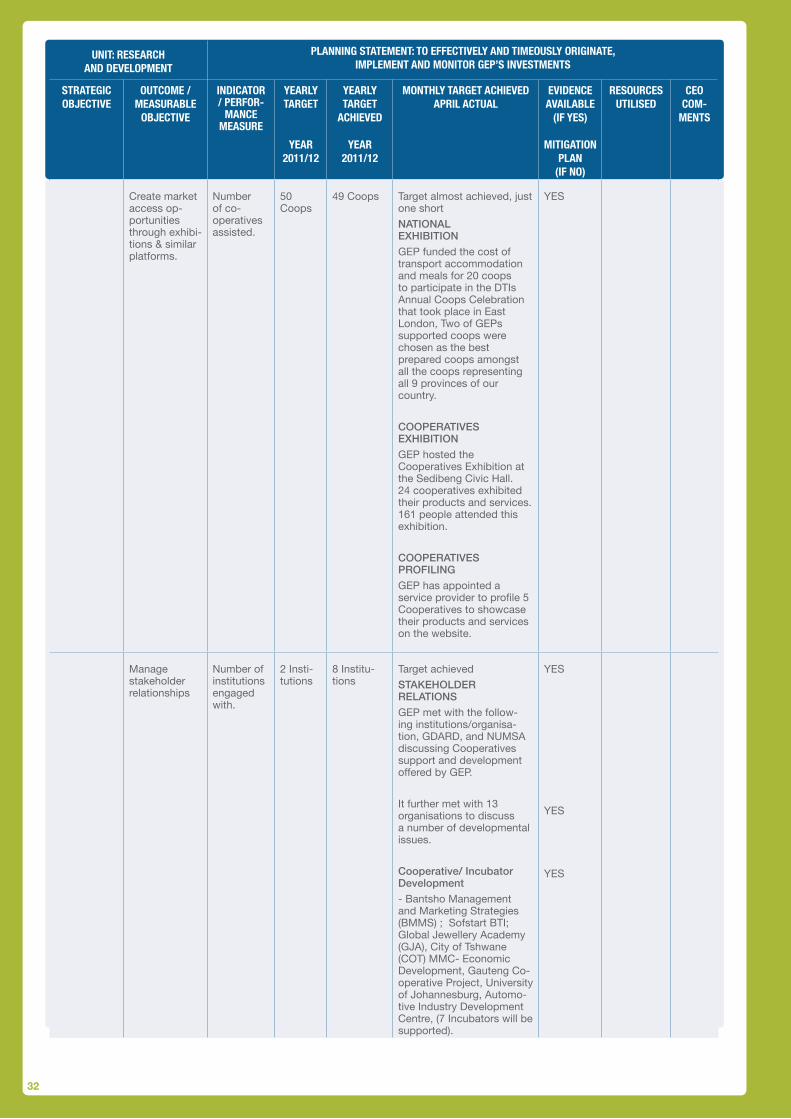
Create market access op-portunities through exhibi-tions & similar platforms.
Number of co-operatives assisted.
50 Coops
49 Coops Target almost achieved, just one short
national ExhiBition
GEP funded the cost of transport accommodation and meals for 20 coops to participate in the DTIs Annual Coops Celebration that took place in East London, Two of GEPs supported coops were chosen as the best prepared coops amongst all the coops representing all 9 provinces of our country.
CoopErativES ExhiBition
GEP hosted the Cooperatives Exhibition at the Sedibeng Civic Hall. 24 cooperatives exhibited their products and services. 161 people attended this exhibition.
CoopErativES proFiling
GEP has appointed a service provider to profile 5 Cooperatives to showcase their products and services on the website.
YES
Manage stakeholder relationships
Number of institutions engaged with.
2 Insti-tutions
8 Institu-tions
Target achieved
StakEholdEr rElationS
GEP met with the follow-ing institutions/organisa-tion, GDARD, and NuMSA discussing Cooperatives support and development offered by GEP.
It further met with 13 organisations to discuss a number of developmental issues.
Cooperative/ incubator development
- Bantsho Management and Marketing Strategies (BMMS) ; Sofstart BTI; Global Jewellery Academy (GJA), City of Tshwane (COT) MMC- Economic Development, Gauteng Co-operative Project, university of Johannesburg, Automo-tive Industry Development Centre, (7 Incubators will be supported).
YES
YES
YES

33A women owned coorporative at GEP 1st Cooperative Exhibitions
UNIT: rESEArch ANd dEVEloPMENT
PlANNING STATEMENT: To EffEcTIVEly ANd TIMEoUSly orIGINATE, IMPlEMENT ANd MoNITor GEP’S INVESTMENTS
STrATEGIc objEcTIVE
oUTcoME / MEASUrAblE
objEcTIVE
INdIcATor / PErfor-
MANcE MEASUrE
yEArly TArGET
yEAr 2011/12
yEArly TArGET AchIEVEd
yEAr 2011/12
MoNThly TArGET AchIEVEdAPrIl AcTUAl
EVIdENcE AVAIlAblE
(If yES)
MITIGATIoN PlAN
(If No)
rESoUrcES UTIlISEd
cEo coM-
MENTS
SmmE develoment, access to Finance - The DTI (BBSDP) [an MOu in review], Gauteng Progressive Tertiary Cooperative Ltd
incubator development - Furntech Roodepoort,
SmmE development, access to markets - South African Supplier Development Council,
NAFCOC (MOu signed), SASDC (25 SMME’s registered in their database from GEP)
YES
Provide effective and efficient after care support.
Evaluation and Monitoring of Perfor-mance of Active Business.
Number of SMMEs visited & assessed by Aftercare.
120 SMME’s
184 SMMEs Target exceeded. YES Internal Resources
Facilitate the implementa-tion of tailor made inter-ventions.
Number of SMMEs supported through After-care interven-tions.
10 internal Re-sources
Facilitation of interventions will be informed by assessment report.
10 projects were approved for implementation.
A strategic decision was taken that Aftercare will implement projects/ interventions identified through their assessments. Aftercare Policy was reviewed; Operations Procedures and all necessary forms were developed this quarter.
YES Internal Resources

34
Leslie KwapengEXEcuTIVE MANAGEr :
oFFIcE oF THE cEo
Strategic objective of the business unit:
1. To manage GEP’s Risk, Partnerships and to provide strategic support to the CEO
STrATEGIc SupporT
pErForMANcE INForMATIoN
UNIT: INVESTMENT MANAGEMENT
PlANNING STATEMENT: To EffEcTIVEly ANd TIMEoUSly orIGINATE, IMPlEMENT ANd MoNITor GEP’S INVESTMENTS
STrATEGIc objEcTIVE
oUTcoME / MEASUrAblE
objEcTIVE
INdIcATor / PErfor-
MANcE MEASUrE
yEArly TArGET
yEAr 2011/12
yEArly TArGET
AchIEVEd
yEAr 2011/12
EVIdENcE AVAIl-AblE
(If yES)
MITIGA-TIoN PlAN
(If No)
rESoUrc-ES
UTIlISEd
cEo coMMENTS
dEVIATIoN rEASoN/S for dEVIATIoN
PlAN of AcTIoN for dE-VIATIoN
Implement and manage GEP Strate-gic Planning Mechanisms and reporting
Collect and consolidate reports for onward conveyance to EXCO, BoD, DED,GT, Gauteng Legislature
Quarterly Reports
4 Quarterly Report
4 Quarterly Report produced
Quar-terly Reports
Internal Re-sources
The internal quarterly report schedule is adhered to in order for the Agency to meet DED and other stakehold-ers deadline
None N/A N/A
Collate and prepare final APP /Strategic Plan for GEP
Final document
Submit by 30 Sep-tember Annually
Final docu-ment submit-ted to DED
Draft 2012/13 F/Y APP submit-ted to DED
Internal Re-sources
Amend-ments to be done by the Board
Strategic Planning Session with the Board was held on the 18 -19 May 2012. Awaiting final sign off by the Board Chairper-son
Final inputs not received at the time of reporting

35
UNIT: STrATEGIc SUPPorT
PlANNING STATEMENT: To EffEcTIVEly ANd TIMEoUSly orIGINATE, IMPlEMENT ANd MoNITor GEP’S INVESTMENTS
STrATE-GIc
objEcTIVE
oUTcoME / MEASUr-
AblE objEcTIVE
INdIcA-Tor /
PErfor-MANcE
MEASUrE
yEArly TArGET
yEAr 2011/12
yEArly TArGET
AchIEVEd
yEAr 2011/12
EVIdENcE AVAIl-AblE
(If yES)
MITIGA-TIoN PlAN
(If No)
rESoUrc-ES
UTIlISEd
cEo coMMENTS
dEVIA-TIoN
rEASoN/S for dEVIATIoN
PlAN of AcTIoN for dE-VIATIoN
Submis-sion to and Liason with DED / Legislature and other stakeholders
Submis-sion of informa-tion & reports
Time-ously per deadline per case
All the requests dealt with
E-mails and other acknowl-edge-ments docu-ments
Internal Resources
The Agency receives lot of requests and they are dealt with on time
None N/A N/A
Forge effective and sus-tainable partner-ships and efficient stake-holder relations manage-ment
Initiate & estab-lish 1 joint agreement with government
-National Dept.
-Provincial Dept.
-Local gov.
-SOEs
-DFI
Agree-ments SLA/MOus with National, Provincial and Local Govern-ment
5 Gov-ernment pro-grammes and agree-ments per an-num
5 Agree-ments concluded with Gov-ernment Depart-ments, DTI BBSDP, City of Tshwane, Khula Enterprise Finance, Auto-motive Industry
Yes. Evidence available as per quarterly evidence
Internal Resource
The partnership arrange-ments are compli-mentary to GEP service offerings for the benefit of SMMEs. The co-operation ar-rangements will assist GEP with leveraging of resources for SMME support
None N/A N/A
Identify and facilitate Strategic Partnership with corpo-rate sectors
Number of pro-grammes or oppor-tunities con-cluded
4 per annum
4 co-operation arrange-ment with Wool-worths, SASDC, Dunlop Tyres and Makro
Yes as per quarterly evidence
Internal Resources
This private sector in compli-ance with the BBBEE Act have afforded GEP to facilitate access to business op-portunities
None None None
Identify and conclude partner-ships with business chambers, academic institutions and manage special pro-grammes
Joint pro-grammes, and agree-ments with chambers (Target-ing focus groups i.e. Youth; Women; PWD & Township busi-nesses)
5 per annum
5 pro-grammes with Gauteng Tooling Initiative, Jewellery Academy, NAFCOC and the Gauteng Industrial Chamber
Yes as per quarterly reports evidence
Internal resources
This pro-gramme has helped GEP to build the capacity of Business Chambers and lever-aged off their database
None None None
Facilitate & analysis of all Risks to GEP through its operations
Risk Reg-isters
Annual Review by 30 May
Annual Risk re-view was done by 30 No-vember as opposed to 30 May 2011
Risk Work-shop register
Internal Resource
N/A An-nual Risk re-view was not done by 30th May 2011
There was no incum-bent for the risk manager position
Risk Manage-ment unit is now fully capaci-tated and outputs will be delivered

36
GEP Official Odirile Ramasodi (right) and AIDC Official (left) hands over recycling trolleys to cooperatives
UNIT: STrATEGIc SUPPorT
PlANNING STATEMENT: To EffEcTIVEly ANd TIMEoUSly orIGINATE, IMPlEMENT ANd MoNITor GEP’S INVESTMENTS
STrATEGIc objEcTIVE
oUTcoME / MEASUr-
AblE objEcTIVE
INdIcATor / PErfor-
MANcE MEASUrE
yEArly TArGET
yEAr 2011/12
yEArly TArGET
AchIEVEd
yEAr 2011/12
EVIdENcE AVAIlAblE
(If yES)
MITIGATIoN PlAN
(If No)
rE-SoUrcES UTIlISEd
cEo coM-
MENTS
dEVIA-TIoN
rEASoN/S for dEVIATIoN
PlAN of AcTIoN for dEVIATIoN
Implement & manage En-terprise Risk Management
Moni-tor GEP Manage-ment im-plementa-tion of mitigation plans
Quarterly Reports
4 Quarterly Reports
1 Quarter-ly report
1 Quarterly Report
Internal Re-source
N/A Only 1 Quar-terly Report pro-duced
Risk Work-shops were per-formed towards the end of the financial year.
Risk Man-agement unit is now capaci-tated and outputs will be delivered.
Facili-tated the imple-mentation of recom-menda-tions of Internal Audit
Quarterly Assess-ments
4 Quarterly Assess-ments
1 Quarter-ly Report
1 Quarterly Report
Internal Re-source
N/A 1 Quar-terly Report
Lack of capacity and the new RAC meeting being held to-wards the end of the financial year
Risk Man-agement unit is now capaci-tated and outputs will be delivered.
Imple-ment Fraud Preven-tion Plan and BCP/DRP oversight
Quarterly Moni-toring Reports
4 Quarterly Reports
1 Report Fraud Prevention Plan was developed and submit-ted to Risk and Audit Committee for recom-mendation to the board
Internal Re-source
N/A 4 Moni-toring reports not pro-duced
Delays in approval of the Fraud Preven-tion Plan due to timing board meeting.
Risk Man-agement unit is now capaci-tated and outputs will be delivered.
37
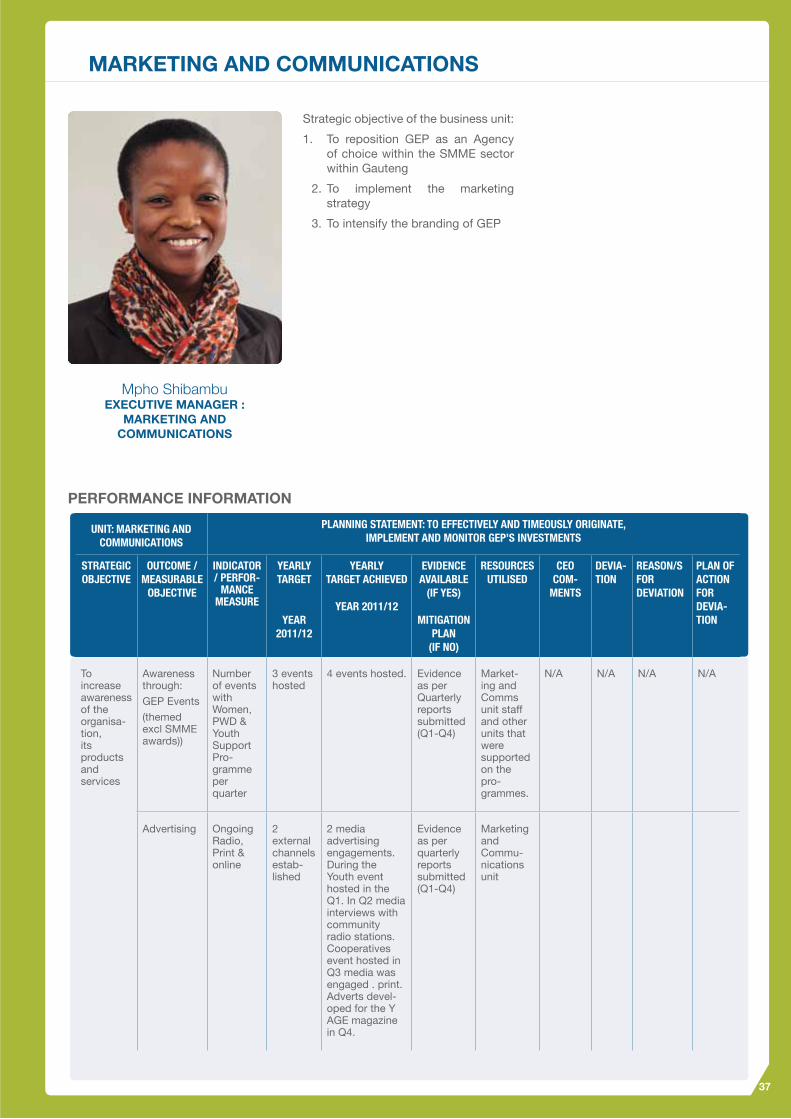
Mpho Shibambu EXEcuTIVE MANAGEr :
MArkETING AND coMMuNIcATIoNS
MArkETING AND coMMuNIcATIoNS
Strategic objective of the business unit:
1. To reposition GEP as an Agency of choice within the SMME sector within Gauteng
2. To implement the marketing strategy
3. To intensify the branding of GEP
pErForMANcE INForMATIoN
GEP Official Odirile Ramasodi (right) and AIDC Official (left) hands over recycling trolleys to cooperatives
UNIT: MArKETING ANd coMMUNIcATIoNS
PlANNING STATEMENT: To EffEcTIVEly ANd TIMEoUSly orIGINATE, IMPlEMENT ANd MoNITor GEP’S INVESTMENTS
STrATEGIc objEcTIVE
oUTcoME / MEASUrAblE
objEcTIVE
INdIcATor / PErfor-
MANcE MEASUrE
yEArly TArGET
yEAr 2011/12
yEArly TArGET AchIEVEd
yEAr 2011/12
EVIdENcE AVAIlAblE
(If yES)
MITIGATIoN PlAN
(If No)
rESoUrcES UTIlISEd
cEo coM-
MENTS
dEVIA-TIoN
rEASoN/S for dEVIATIoN
PlAN of AcTIoN for dEVIA-TIoN
To increase awareness of the organisa-tion, its products and services
Awareness through:
GEP Events
(themed excl SMME awards))
Number of events with Women, PWD & Youth Support Pro-gramme per quarter
3 events hosted
4 events hosted. Evidence as per Quarterly reports submitted (Q1-Q4)
Market-ing and Comms unit staff and other units that were supported on the pro-grammes.
N/A N/A N/A N/A
Advertising Ongoing Radio, Print & online
2 external channels estab-lished
2 media advertising engagements. During the Youth event hosted in the Q1. In Q2 media interviews with community radio stations. Cooperatives event hosted in Q3 media was engaged . print. Adverts devel-oped for the Y AGE magazine in Q4.
Evidence as per quarterly reports submitted (Q1-Q4)
Marketing and Commu-nications unit
38
UNIT: MArKETING ANd coMMUNIcATIoNS
PlANNING STATEMENT: To EffEcTIVEly ANd TIMEoUSly orIGINATE, IMPlEMENT ANd MoNITor GEP’S INVESTMENTS
STrATEGIc objEcTIVE
oUTcoME / MEASUr-
AblE objEcTIVE
INdIcATor / PErforMANcE
MEASUrE
yEArly TArGET
yEAr 2011/12
yEArly TArGET AchIEVEd
yEAr 2011/12
EVIdENcE AVAIlAblE
(If yES)
MITIGA-TIoN PlAN
(If No)
rESoUrcES UTIlISEd
cEo coM-
MENTS
dEVIA-TIoN
rEASoN/S for dEVIATIoN
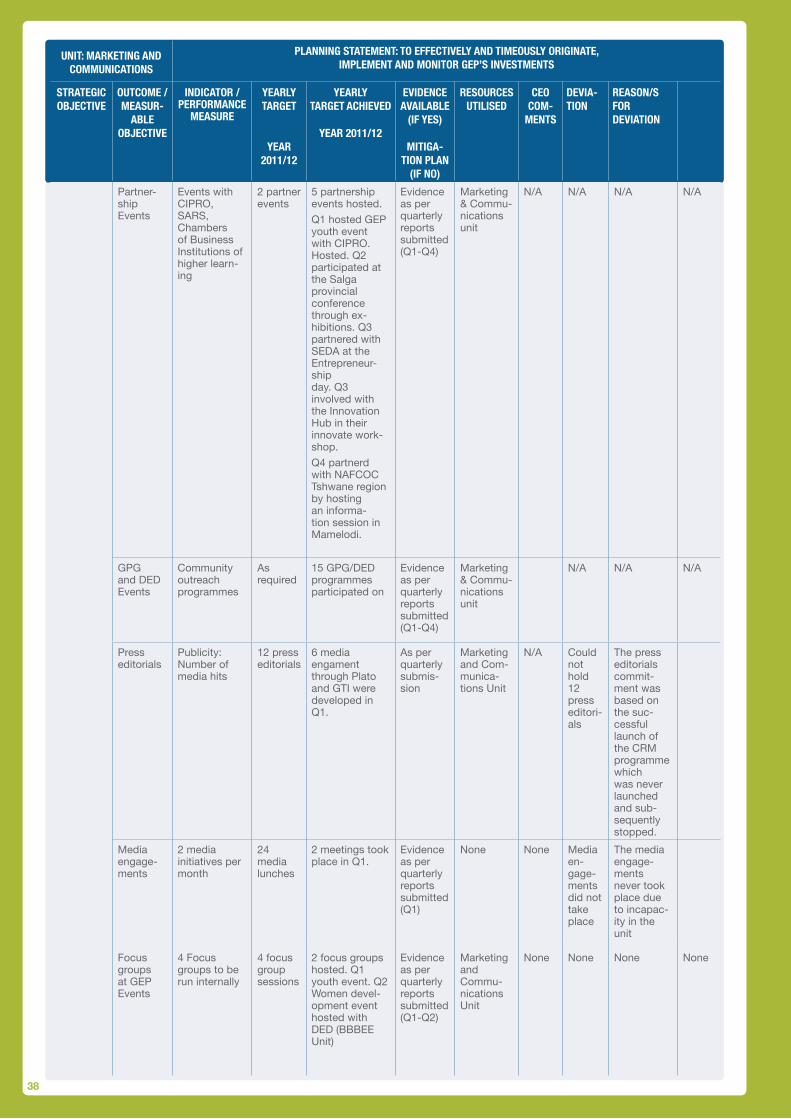
Partner-ship Events
Events with CIPRO, SARS, Chambers of Business Institutions of higher learn-ing
2 partner events
5 partnership events hosted.
Q1 hosted GEP youth event with CIPRO. Hosted. Q2 participated at the Salga provincial conference through ex-hibitions. Q3 partnered with SEDA at the Entrepreneur-ship day. Q3 involved with the Innovation Hub in their innovate work-shop.
Q4 partnerd with NAFCOC Tshwane region by hosting an informa-tion session in Mamelodi.
Evidence as per quarterly reports submitted (Q1-Q4)
Marketing & Commu-nications unit
N/A N/A N/A N/A
GPG and DED Events
Community outreach programmes
As required
15 GPG/DED programmes participated on
Evidence as per quarterly reports submitted (Q1-Q4)
Marketing & Commu-nications unit
N/A N/A N/A
Press editorials
Publicity: Number of media hits
12 press editorials
6 media engament through Plato and GTI were developed in Q1.
As per quarterly submis-sion
Marketing and Com-munica-tions unit
N/A Could not hold 12 press editori-als
The press editorials commit-ment was based on the suc-cessful launch of the CRM programme which was never launched and sub-sequently stopped.
Media engage-ments
2 media initiatives per month
24 media lunches
2 meetings took place in Q1.
Evidence as per quarterly reports submitted (Q1)
None None Media en-gage-ments did not take place
The media engage-ments never took place due to incapac-ity in the unit
Focus groups at GEP Events
4 Focus groups to be run internally
4 focus group sessions
2 focus groups hosted. Q1 youth event. Q2 Women devel-opment event hosted with DED (BBBEE unit)
Evidence as per quarterly reports submitted (Q1-Q2)
Marketing and Commu-nications unit
None None None None

39A student(Right) receives a gift from GEP official, at the FET college entrepreneurship event
UNIT: MArKETING ANd coMMUNIcATIoNS
PlANNING STATEMENT: To EffEcTIVEly ANd TIMEoUSly orIGINATE, IMPlEMENT ANd MoNITor GEP’S INVESTMENTS
STrATEGIc objEcTIVE
oUTcoME / MEASUr-
AblE objEcTIVE
INdIcATor / PErfor-
MANcE MEASUrE
yEArly TArGET
yEAr 2011/12
yEArly TArGET
AchIEVEd
yEAr 2011/12
EVIdENcE AVAIlAblE
(If yES)
MITIGATIoN PlAN
(If No)
rESoUrcES UTIlISEd
cEo coM-
MENTS
dEVIATIoN rEASoN/S for dEVIATIoN
PlAN of AcTIoN for dEVIATIoN
Play a role in SMME & Co-Op-eratives develop-ment tho Stake-holder relations
Play a cata-lytic role through: Com-munity Outreach Pro-gramme
4 pro-gramme to be imple-mented with various stake-holders
2 joint stake-holder pro-grammes per an-num
6 pro-grammes done. Four in Q1 and two in Q3.
Evidence as per quarterly reports submitted (Q1-Q4)
Marketing and Com-munica-tions unit.
None None None None
Sponsor-ships (Out-bound)
Joint initia-tives thro identified partner
units of measure-ments not yet defined
Sponsor-ship was committed to Rycob in Q1.
None None None The sponsor-ship ele-ment was shifted to the office of the CEO. From Q2 onwards.
None
Optimize 2 internal commu-nications platform
Internal News-letter & creation of other platform
Quarterly updates
Not achieved
Evidence as per quarterly reports submitted
None The internal newsletter (Am-bani) was never produced
Ambani newsletter was put on hold due to changes in the organisa-tion.
A monthly electronic newsletter was created and channeled through the office of the ACEO
Press office
weekly
& quarterly updates
Marketing Material (General produc-tion cost, Corporate Gifts & other)
Product Bro-chures, Annual Report, Corporate Gifts
N/A - Product brochures Annual report produced and corporate gifts procured.
Evidence as per quarterly reports submitted (Q1-Q4)
None None None None None
40
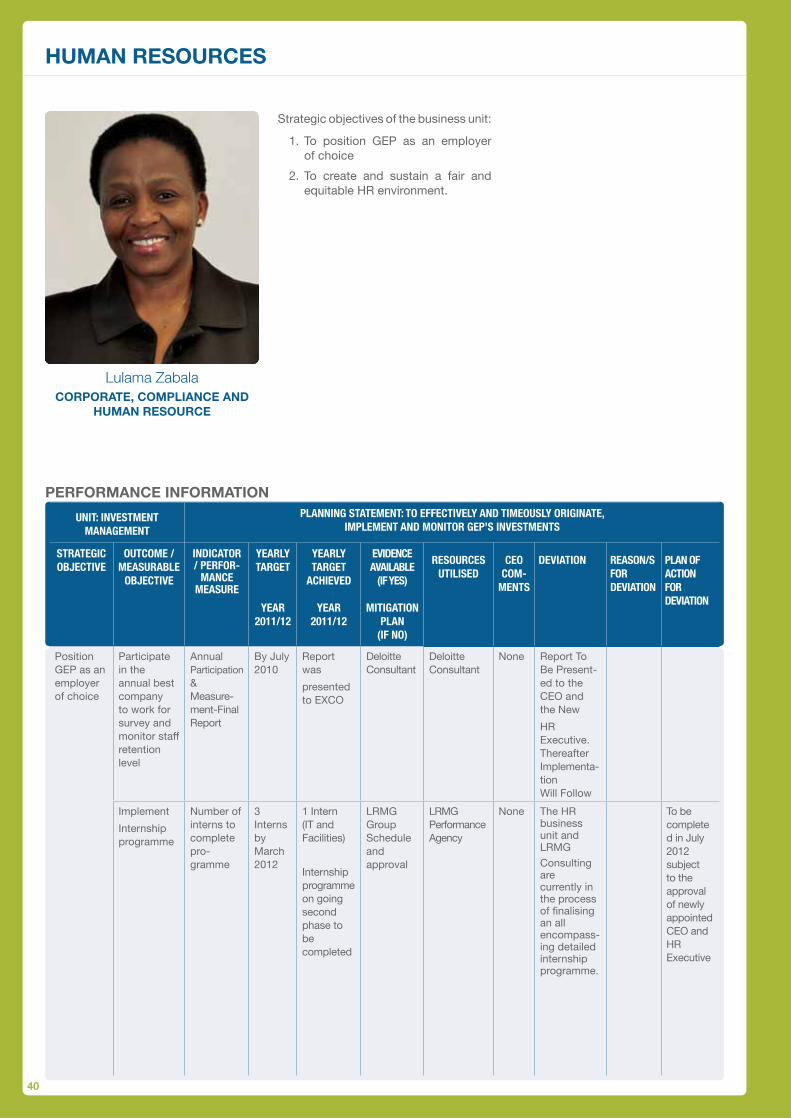
Lulama ZabalacorporATE, coMplIANcE AND
HuMAN rESourcE
HuMAN rESourcES
Strategic objectives of the business unit:
1. To position GEP as an employer of choice
2. To create and sustain a fair and equitable HR environment.
pErForMANcE INForMATIoN
UNIT: INVESTMENT MANAGEMENT
PlANNING STATEMENT: To EffEcTIVEly ANd TIMEoUSly orIGINATE, IMPlEMENT ANd MoNITor GEP’S INVESTMENTS
STrATEGIc objEcTIVE
oUTcoME / MEASUrAblE
objEcTIVE
INdIcATor / PErfor-
MANcE MEASUrE
yEArly TArGET
yEAr 2011/12
yEArly TArGET
AchIEVEd
yEAr 2011/12
EVIdENcE AVAIlAblE
(If yES)
MITIGATIoN PlAN
(If No)
rESoUrcES UTIlISEd
cEo coM-
MENTS
dEVIATIoN rEASoN/S for dEVIATIoN
PlAN of AcTIoN for dEVIATIoN
Position GEP as an employer of choice
Participate in the annual best company to work for survey and monitor staff retention level
Annual Participation & Measure-ment-Final Report
By July 2010
Report was
presented to EXCO
Deloitte Consultant
Deloitte Consultant
None Report To Be Present-ed to the CEO and the New
HR Executive. Thereafter Implementa-tion Will Follow
Implement
Internship programme
Number of interns to complete pro-gramme
3 Interns by March 2012
1 Intern (IT and Facilities)
Internship programme on going second phase to be completed
LRMG Group Schedule and approval
LRMG Performance Agency
None The HR business unit and LRMG
Consulting are currently in the process of finalising an all encompass-ing detailed internship programme.
To be complete d in July 2012 subject to the approval of newly appointed CEO and HR Executive
41
UNIT: INVESTMENT MANAGEMENT
PlANNING STATEMENT: To EffEcTIVEly ANd TIMEoUSly orIGINATE, IMPlEMENT ANd MoNITor GEP’S INVESTMENTS
STrATEGIc objEcTIVE
oUTcoME / MEASUrAblE
objEcTIVE
INdIcATor / PErfor-
MANcE MEASUrE
yEArly TArGET
yEAr 2011/12
yEArly TArGET
AchIEVEd
yEAr 2011/12
EVIdENcE AVAIlAblE
(If yES)
MITIGATIoN PlAN
(If No)
rESoUrcES UTIlISEd
cEo coM-
MENTS
dEVIATIoN rEASoN/S for dEVIATIoN
PlAN of AcTIoN for dEVIATIoN
Position GEP as an employer of choice
Participate in the annual best company to work for survey and monitor staff retention level
Annual Participation & Measure-ment-Final Report
By July 2010
Report was
presented to EXCO
Deloitte Consultant
Deloitte Consultant
None Report To Be Present-ed to the CEO and the New
HR Executive. Thereafter Implementa-tion Will Follow
Implement
Internship programme
Number of interns to complete pro-gramme
3 Interns by March 2012
1 Intern (IT and Facilities)
Internship programme on going second phase to be completed
LRMG Group Schedule and approval
LRMG Performance Agency
None The HR business unit and LRMG
Consulting are currently in the process of finalising an all encompass-ing detailed internship programme.
To be complete d in July 2012 subject to the approval of newly appointed CEO and HR Executive
UNIT: hUMAN rESoUrcESPlANNING STATEMENT: To EffEcTIVEly ANd TIMEoUSly orIGINATE,
IMPlEMENT ANd MoNITor GEP’S INVESTMENTS
STrATEGIc objEcTIVE
oUTcoME / MEASUr-
AblE objEcTIVE
INdIcATor / PErfor-
MANcE MEASUrE
yEArly TArGET
yEAr 2011/12
yEArly TArGET
AchIEVEd
yEAr 2011/12
EVIdENcE AVAIlAblE
(If yES)
MITIGA-TIoN PlAN
(If No)
rE-SoUrcES UTIlISEd
cEo coM-
MENTS
dEVIATIoN rEASoN/S for dEVIATIoN
PlAN of AcTIoN for dEVIA-TIoN
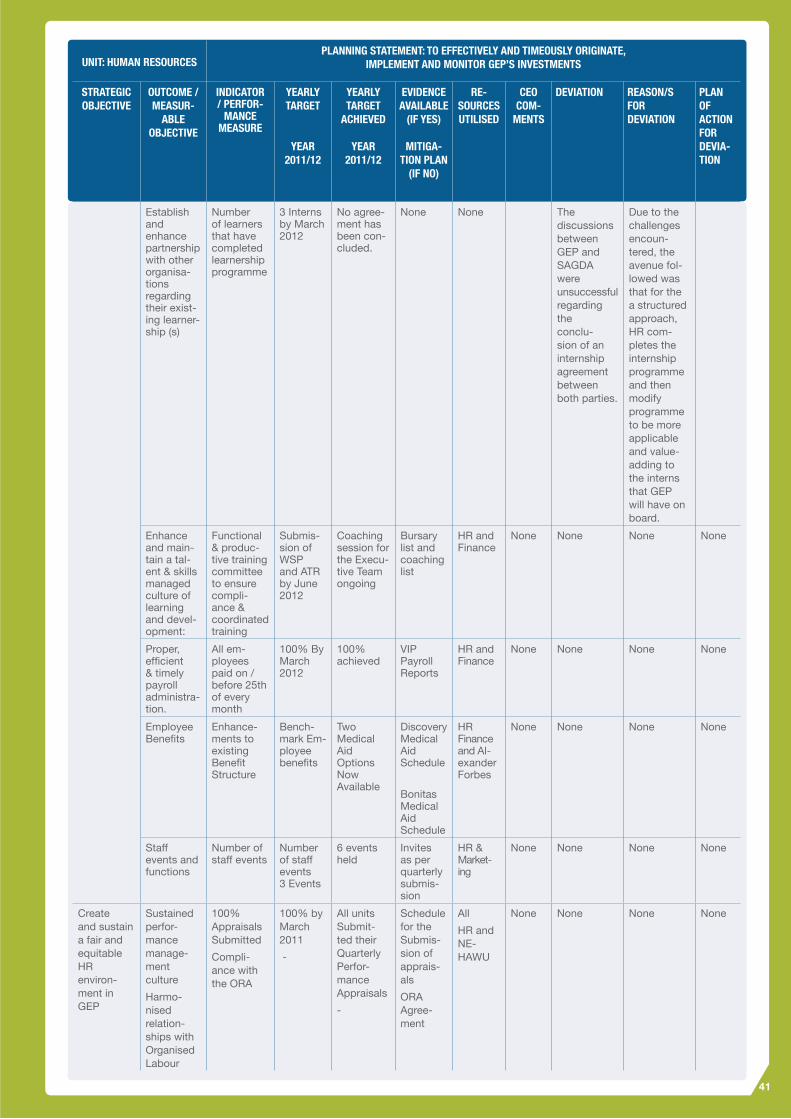
Establish and enhance partnership with other organisa-tions regarding their exist-ing learner-ship (s)
Number of learners that have completed learnership programme
3 Interns by March 2012
No agree-ment has been con-cluded.
None None The discussions between GEP and SAGDA were unsuccessful regarding the conclu-sion of an internship agreement between both parties.
Due to the challenges encoun-tered, the avenue fol-lowed was that for the a structured approach, HR com-pletes the internship programme and then modify programme to be more applicable and value-adding to the interns that GEP will have on board.
Enhance and main-tain a tal-ent & skills managed culture of learning and devel-opment:
Functional & produc-tive training committee to ensure compli-ance & coordinated training
Submis-sion of WSP and ATR by June 2012
Coaching session for the Execu-tive Team ongoing
Bursary list and coaching list
HR and Finance
None None None None
Proper, efficient & timely payroll administra-tion.
All em-ployees paid on / before 25th of every month
100% By March 2012
100% achieved
vIP Payroll Reports
HR and Finance
None None None None
Employee Benefits
Enhance-ments to existing Benefit Structure
Bench-mark Em-ployee benefits
Two Medical Aid Options Now Available
Discovery Medical Aid Schedule
Bonitas Medical Aid Schedule
HR Finance and Al-exander Forbes
None None None None
Staff events and functions
Number of staff events
Number of staff events 3 Events
6 events held
Invites as per quarterly submis-sion
HR & Market-ing
None None None None
Create and sustain a fair and equitable HR environ-ment in GEP
Sustained perfor-mance manage-ment culture
Harmo-nised relation-ships with Organised Labour
100% Appraisals Submitted
Compli-ance with the ORA
100% by March 2011
-
All units Submit-ted their Quarterly Perfor-mance Appraisals
-
Schedule for the Submis-sion of apprais-als
ORA Agree-ment
All
HR and NE-HAWu
None None None None
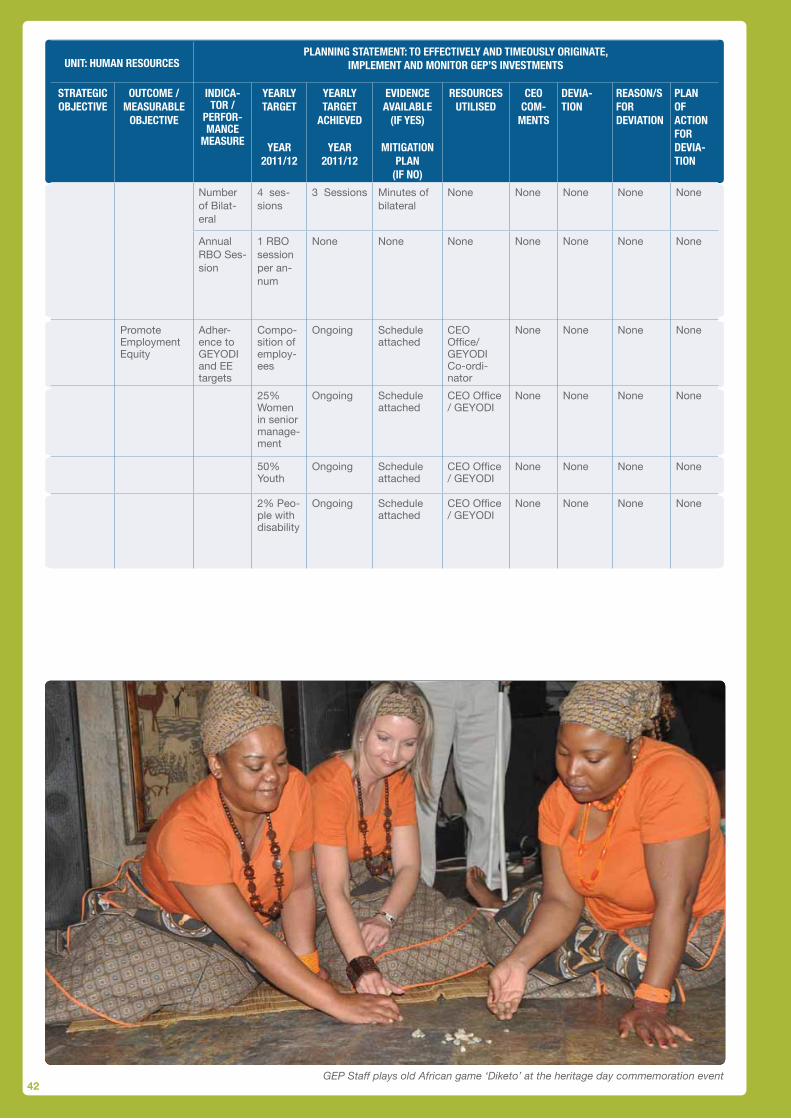
42
UNIT: hUMAN rESoUrcESPlANNING STATEMENT: To EffEcTIVEly ANd TIMEoUSly orIGINATE,
IMPlEMENT ANd MoNITor GEP’S INVESTMENTS
STrATEGIc objEcTIVE
oUTcoME / MEASUrAblE
objEcTIVE
INdIcA-Tor /
PErfor-MANcE
MEASUrE
yEArly TArGET
yEAr 2011/12
yEArly TArGET
AchIEVEd
yEAr 2011/12
EVIdENcE AVAIlAblE
(If yES)
MITIGATIoN PlAN
(If No)
rESoUrcES UTIlISEd
cEo coM-
MENTS
dEVIA-TIoN
rEASoN/S for dEVIATIoN
PlAN of AcTIoN for dEVIA-TIoN
Number of Bilat-eral
4 ses-sions
3 Sessions Minutes of bilateral
None None None None None
Annual RBO Ses-sion
1 RBO session per an-num
None None None None None None None
Promote Employment Equity
Adher-ence to GEYODI and EE targets
Compo-sition of employ-ees
Ongoing Schedule attached
CEO Office/GEYODI Co-ordi-nator
None None None None
25% Women in senior manage-ment
Ongoing Schedule attached
CEO Office / GEYODI
None None None None
50% Youth
Ongoing Schedule attached
CEO Office / GEYODI
None None None None
2% Peo-ple with disability
Ongoing Schedule attached
CEO Office / GEYODI
None None None None
GEP Staff plays old African game ‘Diketo’ at the heritage day commemoration event

43
WHITE INDIAN colourED AFrIcAN
5
10
15
20
30
25
CateGORy 1ReCRuitmeNt
CateGORy 1 ReSiGNatiONS
CateGORy 1 eND Of CONtRaCt
CateGORy 1 DiSmiSSalS
CateGORy 1 RetiRemeNtS
1. Introduction
AcHIEVEMENTS• Formation of focus groups to
ensure employee participation
• Implementation of internship programme. Phased approach being pursued. Mentorship training has commenced.
• Training and development interventions to address skills gap being rolled out across GEP. 100% bursary application approval. None declined.
• Hosting of Cultural Diversity day combined with annual year end function.
• Development /Amendment of the following draft poli-cies: Performance Bonus policy; Remuneration policy (draft) Leave policy (draft).
• Payment of bonuses to all employees. Employee morale improved.
• Recognition and celebration of important calendar dates all aimed at improving employee morale. E.g. Women’s day , Secretaries Day.
• Building of sound labour relations: Successful conclusion of 2011/2012 wage negotiations.
• Submission of the Annual Training Report and funds received by GEP.
kEY cHAllENGES AND plANS To oVErcoME THESE cHAllENGES
• Implementation of recommenda-tions of Deloite report.
• Engagement with top ten best companies to work for to learn from them. Seminar confirmed for 17 November 2011.
• Participation in 2013/2014 survey to gauge progress.
• Training calendar for the rest of financial year being developed and to be circulated to all unit Heads.
• Improving equity within GEP.
The Financial year 2012/2013 came with the the strategic objectives of ensuring that GEP continually strived to be the employer of choice and would built and sustain an equitable HR environment within GEP. The above highlighted successes reveal the progress made towards the attainment of those strategic objectives.
2011/2012 came with a lot of recruitment activity. A total of 25 positions were filled either through new appointees or internal movements. Six employees resigned with four employees reaching the end of their contracts. One employee was dismissed. There was one settlement reached with the Acting Marketing Executive. A new Chief Ex-ecutive Officer, Pilisiwe Twala-Tau was appointed in March 2012 and we wish her success in her endevour of fulfilling GEP’s mandate.
The table below depicts the overall staff movements.
oVErAll STAFF MoVEMENTS AprIl 2011-MArcH 2012
afRiCaN COlOuReD iNDiaN WHite tOtal
rEcruITMENT 24 0 0 1 25
rESIGNATIoN 3 0 0 3 6
END oF coNTrAcT 3 1 0 0 4
DISMISSAlS 1 0 0 0 1
rETIrEMENT 1 0 0 0 1
SETTlEMENTS 1 0 0 0 1
ToTAl 33 1 0 4 38

44
EMploYEE WEllNESSGEP’s employee wellness program (EWP) is being administerd by the Care-ways Group. The following utilization figures provide a snapshot view of the current rate at which all EWP services are being accessed by the employees and such provide the company with an “at a glance” evaluation of the current status of their wellbeing programme.
INDIVIDuAl AND MANAGEr
pArTIcIpATIoNParticipation by individuals and Managers is defined as the number of new events opened in the Care Centre for the period under review, divided by the total number of employees -GEP case the total number of employees used for the calculation was 100. The resulting figure (expressed as a percentage) can thus be understood as reflecting the extent to which
pArTIcIpATIoN BY INDIVIDuAlS AND MANAGErS (2011-2012)
GeP eveNtS % CaReWayS %
1 AprIl- 30 JuNE 2011 4 4% 1.44%
1 JulY-30 SEpT 2011 8 8% 1.60%
1 ocToBEr-31 DEc 2012 7 7% 1.62%
1 JAN-31 MAr 2012 8 8% 1.81%
ToTAl 27* 27% 6.47%
individual employee (whether managers or other employees) engage with the programmes available to individual clients. This percentage represents the percentage of GEP employees who received individual services from the EWP programme during this period.
rEFErrAl SourcE
tOtal %COmPaNy CaReWayS%
MANAGEMENT (ForMAl) 1 4% 12.5%
SElF 26 96% 80.86%
ToTAl 27 100% 100%
DETAIlED BrEAkDoWN oF EMploYEE INITIATED EVENTS
tOtal % Of tOtal eveNtS CaReWayS%
lEGAl SupporT 2 8% 8.5%
FINANcIAl SupporT 2 8% 4.9%
TElEpHoNIc EMoTIoNAl SupporT 4 15% 6.3%
FAcE To FAcE couNSElING 18 69% 67.3%
ToTAl 26 100%
*The overall participation figure of 27% is way above the Careways average for annual utilization. This suggests that the EWP is well recognized throughout GEP, and that employees are familiar with the services offered.

45
INForMATIoN TEcHNoloGY & FAcIlITIES
Sonja Laubscher EXEcuTIVE MANAGEr :
INForMATIoN TEcHNoloGY
Strategic objective of the business unit:
1. Provide a stable and reliable IT platform
2. Facilitate and Implement increased automation and cost reductions
3. Provide for GEP’s physical working environment and oversee shared resources
pErForMANcE INForMATIoN
INforMATIoN TEchNoloGy & fAcIlITIES
PlANNING STATEMENT: To EffEcTIVEly ANd TIMEoUSly orIGINATE, IMPlEMENT ANd MoNITor GEP’S INVESTMENTS
STrATEGIc objEcTIVE
oUTcoME /
MEASUr-AblE
objEcTIVE
INdIcA-Tor /
PErfor-MANcE
MEASUrE
yEArly TArGET
yEAr 2011/12
yEArly TArGET AchIEVEd
yEAr 2011/12
EVIdENcE AVAIlAblE
(If yES)
MITIGATIoN PlAN
(If No)
rESoUrcES UTIlISEd
cEo coM-
MENTS
dEVIA-TIoN
rEASoN/S for dEVIATIoN
PlAN of AcTIoN for dEVIA-TIoN
Provide a stable and reliable IT platform
Manage IT Envi-ronment including WAN/LAN
Manage IT Envi-ronment including WAN/LAN
Maintain 99% uptime
GEP achieved an approximate 96% uptime.
Connectiv-ity issues were experienced at 124 Main Street after the GEP Head Office move in July 2011.
The Soweto server is offline due to the office using the Thusong shared services and the Mohlakeng server is offline due to the office being temporarily closed since December 2010.
Failure of the shared services airconditioning at 124 Main Street caused down time.
Network Praxis &
GEP IT
Yes

46
INforMATIoN TEchNoloGy & fAcIlITIES
PlANNING STATEMENT: To EffEcTIVEly ANd TIMEoUSly orIGINATE, IMPlEMENT ANd MoNITor GEP’S INVESTMENTS
STrATEGIc objEcTIVE
oUTcoME / MEASUrAblE
objEcTIVE
INdIcATor / PErfor-
MANcE MEASUrE
yEArly TArGET
yEAr 2011/12
yEArly TArGET AchIEVEd
yEAr 2011/12
EVIdENcE AVAIlAblE
(If yES)
MITIGATIoN PlAN
(If No)
rESoUrc-ES
UTIlISEd
cEo coM-
MENTS
dEVIA-TIoN
rEASoN/S for dEVIATIoN
PlAN of AcTIoN for dEVIA-TIoN
No virus outbreaks experienced during the last financial year.
Manage IT related Risk
Implement risk
mitigating
measures, i.e.
BIA, DRP,
licensing,
servers, se-curity etc.
Imple-mentation on stage of meas-ures
Bi-Annual testing of DRP and imple-ment BIA
License Renew-als
Servers
A successful DRP Test was completed. A BIA has been completed for GEP IT
The Microsoft licenses have been renewed. The Backup Exec Software and Anti-virus was renewed.
A virtual server has been implemented at head office to replace outdated and redundant servers hosting critical applications.
The GEP intranet username logons have been implemented to increase security and reduce risk.
The Astaro Firewall was procured and installed at GEP Head Office.
upgrade risk software, Bar-nOwl in January 2012.
All DRP Report
BIA
Documen-tation
Documen-tation
Documen-tation
Documen-tation
Documen-tation
Praxis
GEP IT Staff
GEP IT Staff
GEP IT Staff
GEP IT Staff
GEP IT Staff
GEP IT Staff
Yes
Yes
Yes
Yes
Yes
Yes
Facilitate and implement increased automation and cost reductions
Improve Portal Functionality to align requirements of Regional Operations
Increase function-ality of Portal
Changes on Portal
Functionality changes were made on the Portal to assist with the reporting.
Documen-tation
GEP IT Staff
Yes

47
INforMATIoN TEchNoloGy & fAcIlITIES
PlANNING STATEMENT: To EffEcTIVEly ANd TIMEoUSly orIGINATE, IMPlEMENT ANd MoNITor GEP’S INVESTMENTS
STrATEGIc objEcTIVE
oUTcoME / MEASUrAblE
objEcTIVE
INdIcATor / PErfor-
MANcE MEASUrE
yEArly TArGET
yEAr 2011/12
yEArly TArGET
AchIEVEd
yEAr 2011/12
EVIdENcE AVAIlAblE
(If yES)
MITIGATIoN PlAN
(If No)
rESoUrc-ES
UTIlISEd
cEo coM-
MENTS
dEVIA-TIoN
rEASoN/S for dEVIATIoN
PlAN of AcTIoN for dEVIA-TIoN
CRM Implemen-tation
Increase function-ality of CRM
Imple-mentation of CRM
The CRM system was not being used due to operational problems. An assessment was conducted and the CRM Assessment report has been finalized. The CRM project has been suspended until further notice.
CRM Proposal
CRM Assessment
Firefly Simula-tions and GEP IT staff
Yes
Provide for GEP’s physical working environment and oversee shared resources
Increase savings and efficiencies
Ensure availability of resources incl. sat-isfactory condition
value of savings realized
Number of com-plaints
Maximize Savings
Zero Com-plaints
GEP Head office has successfully moved to 124 Main Street.
The Heidelberg office renovation was completed and the office moved end February 2012.
The JHB Regional
office will be relocated to 94 Main Street in June 2012.
All photocopiers and printers serviced as required.
The Messenger Booking System was completed on the GEP intranet and is currently in pilot phase.
Documenta-tion
Documenta-tion
Documenta-tion
Service Reports
Documenta-tion
Facilities Staff
Facilities Staff
Facilities Staff
Gestetner & GEP IT Staff
Facilities Staff
Yes
Yes
Yes
Yes
Yes

48

49
Corporate GovernanCe report
50
Seven years of commitment to corporate governance and proper management of public finances.
‘GEP since 2005’

51
GEP has continued in its role of facilitating in reducing or bridging the gap between the first and second economies in South Africa over the past year. With the country still being in a mild recession, it has been difficult to achieve our aims to the full extent of our mandate as so many businesses are battling to continue successfully, with costs rising continuously and sales being adversely affected by international events. As a result a number of loan debtors are in arrears with their instalments.
Our lending has been at a reduced rate this year as we have tightened our requirements for new loans and this has made it more difficult for a number of potential debtors to meet our criteria. The difficult trading conditions experienced by many of our debtors has once again increased our credit risk and we therefore needed to make a greater provision for doubtful accounts for the year. Our debt collection unit has stepped up their efforts and a number of debtors have been able to increase their repayments. A number of debtors pay additional amounts on their instalments, thus decreasing the term of the loan, improving their credit rating and giving us an increased amount of funds for on lending to other loan debtors. The advances made during the year were R14.9 million compared with
R24.2 million during the previous year, a reduction in lending of 38%. A decision was made to lend more to companies which have contracts, which enable us to secure repayments through the operation of a joint account with the debtor. This imposes a certain amount of discipline on the debtor and benefits our cash flows.
FINANCIAL PERFORMANCEThe provincial grant for the year was originally R91.4 million, a reduction of just over R40 million from the previous year. During the year additional grants of R34 million were approved and paid to us and, in addition, we were granted a rollover of the previous year’s surplus amounting to R35.1 million, so that our funding for the year amounted to an increase of R29 million over the 2011 year. Interest income was up by R1 million and other income was insignificant. Impairment of trade receivables was R20.4 million, compared to R13.8 million the year before. Provision against loan accounts amounted to R7 million, whereas the previous year there was a small credit of R337 000. Spending on Business Development Support increased significantly to R46.3 million, whereas only R17.4 was spent the previous year. This figure includes R14 million, for which a special grant was received. Spending on Product Development also increased substantially from R343 193 to R4.3 million this year but, on the other hand, we reduced Seminar and Training expenditure from R5.1 million to only R636 055. As a result of salary and staff increases, the payroll cost for the year was R47.7 million, an increase of R5.2 million over the previous year. Total expenditure came to R154.1 million, compared with R107.6 million for the 2011 year. Our project expenditure for the year was R7.5 million below budget but other expenses were R4.5 million above budget. The revenue surplus for the year was R73.3 million, compared with a surplus of R35.1 million the year before. At the year end we had R45.7 million in projects outstanding, a large increase over the previous year, which was R37 million.
BALANCE SHEETThe gross amount of loans outstanding at the year end was R46.5 million, a reduction of R6 million, due to the slower rate of lending during the year. Debtors, on the other hand, increased from R34.9 million last year to R46.5 million this year, indicating the poor repayment rate of a number of debtors. The loan advances for Mafisa were increased substantially during the year, amounting to R2.5 million, resulting in the loans outstanding at the year end amounting to R2.9 million, compared with only R480 000 the previous year. Towards the year end we made an investment of R20 million in a private company. Capital expenditure for the year was R1 060 000 but fixed assets at year end were down by about R250 000 on the previous year due to depreciation and disposals of old items. Bank balances were reduced by R30 million during the year to R54.1 million due to utilising the previous year’s surplus and capital development.
THE YEAR AHEADOur budget continues to be constrained by Government’s great needs in every area and the budget for the forthcoming year has been increased by only a small amount, resulting in our having a very tight control on our spending in every unit in the organisation. We will continuously monitor all aspects of our organisation in order to get the greatest possible benefit from the limited funds at our disposal.
Lorato Sithole CHIEF FINANCIAL OFFICER
CHIEF FINANCIAL OFFICER’S REPORT

52
BOARD OF DIRECTORS
MEETINGS FREQUENCY:- 4 TIMES PER ANNUM
MEMBERSHIP8 NON EXECUTIVES
1 EXECUTIVE (CHIEF EXECUTIVE OFFICER )
DEPARTMENT OF ECONOMIC DEVELOPMENT
MEMBERSHIP
2 Non-Executives 2 Independent/
Co-opted Members Chief Executive Officer
MEMBERSHIP
2 Non-Executives 2 Co-opted Members
Chief Executive Officer
MEMBERSHIP
3 Non-Executives Chief Executive Officer
MEMBERSHIP
2 Non-ExecutivesChief Executive Officer
RISK & AUDIT COMMITTEE
Meetings Frequency:-4 times per Annum
HR & REMUNERATION COMMITTEE
Meetings Frequency:-At least 2 times
per Annum
BUSINESS DEVELOPMENT
COMMITTEE
Meetings Frequency:-4 times annually
INVESTMENT COMMITTEE
Meetings Frequency:-4 times per Annum
BOARD STRUCTURE
CORPORATE GOVERNANCE INPUT TO THE ANNUAL REPORT: 2011/2012 FINANCIAL YEAR
The Board of the Gauteng Enterprise Propeller has adopted the required corporate governance principles as enshrined in the relevant governance frameworks such as the Public Finance Management Act (PFMA), Treasury Regulations and King III Report on Governance.
BOARD CHARTERThe Board has formalised and disclosed its function through a Board Charter designed detailing the duties and responsibilities of the Board. The Charter also takes into account the nature of matters reserved for the Board and those delegated to Management.
APPOINTMENT OF THE BOARDThe Board is appointed by the Member of the Executive Committee (MEC) who is the shareholder and the Board acts on behalf of the shareholder. The appointment of Board members is in accordance with the GEP Act No.5 of 2005.
BOARD COMPOSITIONThe Board comprised 8 Non- Executives and 1 Executive, the Chief Executive Officer.
BOARD INDUCTIONUpon appointment, the Board is taken through an induction programme to help equip Board members with the information and tools required to become valuable Board members. The induction covered a 2 day workshop wherein Business Units’ Heads shared their units’ challenges, plans going forward including insights into the entity’s business.
BOARD TRAINING AND DEVELOPMENTThe Board is encouraged to attend training sessions or courses on specialised topics to help them better understand their role and what is expected of them. The Board attended a workshop on the Public Finance Management Act (PFMA) through an independent facilitator from the Institute of Directors South Africa (IoDSA).
DECLARATION OF INTERESTBoard members are required to declare their interest on items presented in the agenda at every Board. Declaration of Interest is a standing agenda item at every Board meeting. In addition, Board members complete Declaration of Interest forms on an annual basis. However, it had been proposed that this be done on a quarterly basis in case their circumstances change.
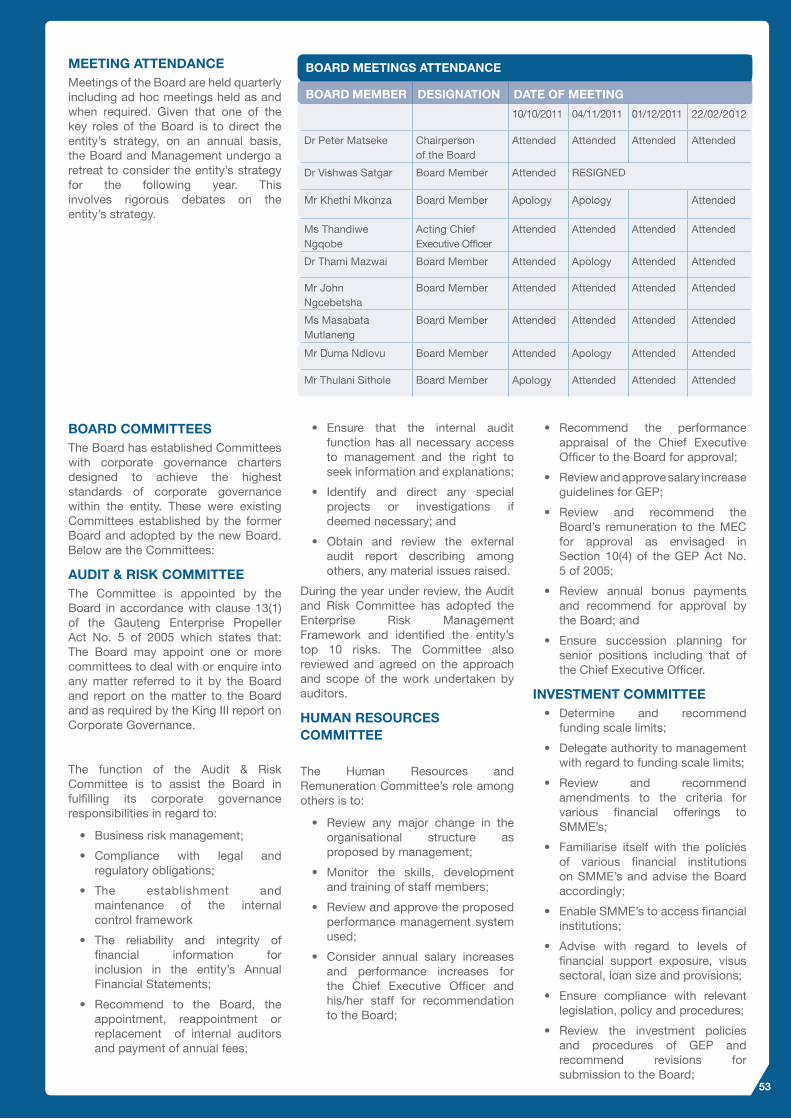
53
MEETING ATTENDANCEMeetings of the Board are held quarterly including ad hoc meetings held as and when required. Given that one of the key roles of the Board is to direct the entity’s strategy, on an annual basis, the Board and Management undergo a retreat to consider the entity’s strategy for the following year. This involves rigorous debates on the entity’s strategy.
BOARD COMMITTEESThe Board has established Committees with corporate governance charters designed to achieve the highest standards of corporate governance within the entity. These were existing Committees established by the former Board and adopted by the new Board. Below are the Committees:
AUDIT & RISK COMMITTEEThe Committee is appointed by the Board in accordance with clause 13(1) of the Gauteng Enterprise Propeller Act No. 5 of 2005 which states that: The Board may appoint one or more committees to deal with or enquire into any matter referred to it by the Board and report on the matter to the Board and as required by the King III report on Corporate Governance.
The function of the Audit & Risk Committee is to assist the Board in fulfilling its corporate governance responsibilities in regard to:
• Business risk management;
• Compliance with legal and regulatory obligations;
• The establishment and maintenance of the internal control framework
• The reliability and integrity of financial information for inclusion in the entity’s Annual Financial Statements;
• Recommend to the Board, the appointment, reappointment or replacement of internal auditors and payment of annual fees;
• Ensure that the internal audit function has all necessary access to management and the right to seek information and explanations;
• Identify and direct any special projects or investigations if deemed necessary; and
• Obtain and review the external audit report describing among others, any material issues raised.
During the year under review, the Audit and Risk Committee has adopted the Enterprise Risk Management Framework and identified the entity’s top 10 risks. The Committee also reviewed and agreed on the approach and scope of the work undertaken by auditors.
HUMAN RESOURCES COMMITTEE
The Human Resources and Remuneration Committee’s role among others is to:
• Review any major change in the organisational structure as proposed by management;
• Monitor the skills, development and training of staff members;
• Review and approve the proposed performance management system used;
• Consider annual salary increases and performance increases for the Chief Executive Officer and his/her staff for recommendation to the Board;
• Recommend the performance appraisal of the Chief Executive Officer to the Board for approval;
• Review and approve salary increase guidelines for GEP;
• Review and recommend the Board’s remuneration to the MEC for approval as envisaged in Section 10(4) of the GEP Act No. 5 of 2005;
• Review annual bonus payments and recommend for approval by the Board; and
• Ensure succession planning for senior positions including that of the Chief Executive Officer.
INVESTMENT COMMITTEE• Determine and recommend
funding scale limits;
• Delegate authority to management with regard to funding scale limits;
• Review and recommend amendments to the criteria for various financial offerings to SMME’s;
• Familiarise itself with the policies of various financial institutions on SMME’s and advise the Board accordingly;
• Enable SMME’s to access financial institutions;
• Advise with regard to levels of financial support exposure, visus sectoral, loan size and provisions;
• Ensure compliance with relevant legislation, policy and procedures;
• Review the investment policies and procedures of GEP and recommend revisions for submission to the Board;
BOARD MEETINGS ATTENDANCE
BOARD MEMBER DESIGNATION DATE OF MEETING
10/10/2011 04/11/2011 01/12/2011 22/02/2012
Dr Peter Matseke Chairperson of the Board
Attended Attended Attended Attended
Dr Vishwas Satgar Board Member Attended RESIGNED
Mr Khethi Mkonza Board Member Apology Apology Attended
Ms Thandiwe Ngqobe
Acting Chief Executive Officer
Attended Attended Attended Attended
Dr Thami Mazwai Board Member Attended Apology Attended Attended
Mr John Ngcebetsha
Board Member Attended Attended Attended Attended
Ms Masabata Mutlaneng
Board Member Attended Attended Attended Attended
Mr Duma Ndlovu Board Member Attended Apology Attended Attended
Mr Thulani Sithole Board Member Apology Attended Attended Attended
54
• To develop a policy regarding the in-house GEP SMME fund;
• Consider recommendations from management for finance applications up to R2,5 million;
• Oversee SMME finance related issues; and
• Consider topics as defined by the Board.
BUSINESS DEVELOPMENT COMMITTEEThe Business Development Committee’s role among others is to:
• To develop the policy and strategy for Business Development Support and recommend the Board’s approval thereof;
• To guide the Board on key emerging focus areas for Business Development Support, in line with the Growth and Development Strategy;
• To ensure that there are adequate and competent service providers for various Business Development Support interventions;
• Advise the Board on best practice in respect of non financial support to SMMEs; and
• Approve policies in relation to Business Development.
The fee paid for events outside ordinary Board sittings was based on the National Treasury circular released last year on the adjustment of remuneration levels for Boards. The Chairman would be paid R492.00 per hour, R382.00 per hour for the Deputy Chairman and R382.00 for ordinary Board members.
The new Board, after consultation with the Shareholder who had commissioned a benchmark exercise against other similar agencies recommended that the fee structure used for the previous Board be applied to the current Board.
BOARD MEMBERS REMUNERATION The Board is responsible and accountable to the Shareholder in respect of all affairs of the entity. However, in order to avoid conflict of interest by deciding on its remuneration, the Board seeks direction from the Shareholder on Board remuneration. The GEP Board is paid both a retainer and a sitting allowance for each meeting attended.
The former GEP Board was paid both a retainer and as sitting allowance for each meeting attended, fee per hour for GEP events or events outside an ordinary Board sitting and reimbursement at 60 km per meeting at a rate of R2.92. Please refer below:
DESIGNATION RETAINER FEE PER ANNUM
MONTHLY RETAINER FEE
SITTING ALLOWANCE (PER MEETING ATTENDED)
Chairman of the Board R150 000 R12 500 R3 600
Deputy Chairman R120 000 R10 000 R3 250
Ordinary Board Member R120 000 R10 000 R3 250
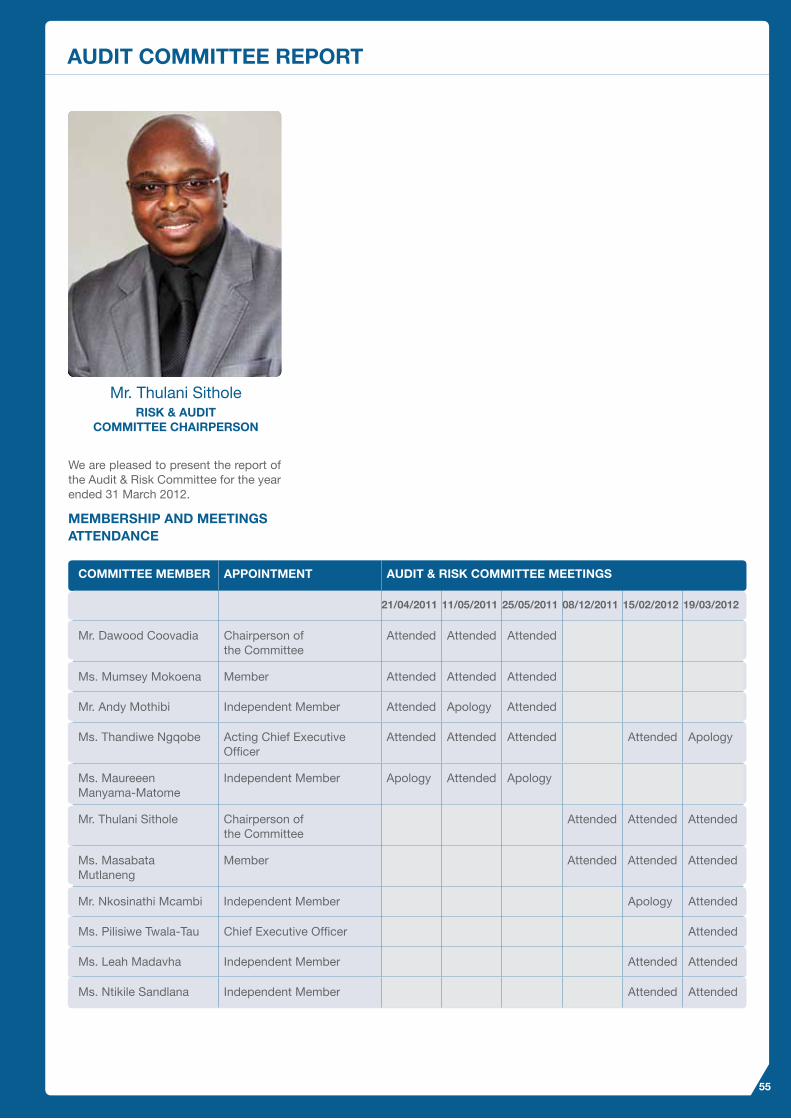
55
AUDIT COMMITTEE REPORT
Mr. Thulani SitholeRISK & AUDIT
COMMITTEE CHAIRPERSON
We are pleased to present the report of the Audit & Risk Committee for the year ended 31 March 2012.
MEMBERSHIP AND MEETINGS ATTENDANCE
COMMITTEE MEMBER APPOINTMENT AUDIT & RISK COMMITTEE MEETINGS
21/04/2011 11/05/2011 25/05/2011 08/12/2011 15/02/2012 19/03/2012
Mr. Dawood Coovadia Chairperson of the Committee
Attended Attended Attended
Ms. Mumsey Mokoena Member Attended Attended Attended
Mr. Andy Mothibi Independent Member Attended Apology Attended
Ms. Thandiwe Ngqobe Acting Chief Executive Officer
Attended Attended Attended Attended Apology
Ms. Maureeen Manyama-Matome
Independent Member Apology Attended Apology
Mr. Thulani Sithole Chairperson of the Committee
Attended Attended Attended
Ms. Masabata Mutlaneng
Member Attended Attended Attended
Mr. Nkosinathi Mcambi Independent Member Apology Attended
Ms. Pilisiwe Twala-Tau Chief Executive Officer Attended
Ms. Leah Madavha Independent Member Attended Attended
Ms. Ntikile Sandlana Independent Member Attended Attended

56
NB: The Chief Executive Officer was appointed and commenced duty on 1 March 2012.
Following the appointment of the new Board on 1 September 2011, a new Committee was established.
AUDIT & RISK COMMITTEE’S RESPONSIBILITIESThe Audit & Risk Committee has adopted Terms of Reference adopted by the Board and has fulfilled its responsibilities as outlined in Section 541(1) (a) of the Public Finance Management Act and Section 3.1.13 of the Treasury Regulations and is in line with King 3 report on corporate governance.
The Committee assists the Board in discharging its duties relating to the review of the Risk Management process, safeguarding of the entity’s assets and operations of adequate systems. The Audit and Risk Committee serves as a link between the Board, Management and both the Internal and External Auditors.
In performing its performance, the Audit & Risk Committee has reviewed the following:
• Risk management, control and governance processes;
• External auditors prior to the commencement of the audit, the auditors engagement letters, the nature and scope of the audit function, the audit fee including the terms of audit;
• Risk Management Framework of the entity;
• The effectiveness of the entity’ s internal control systems, including internal financial control and IT risks;
• Actions and judgements of management in relation to the Annual Financial Statements prior to submission to the Board in relation to compliance to statutory requirements; and
• The effectiveness of the Internal Audit function.
2
External auditors prior to the commencement of the audit, the auditors engagement letters, the nature and scope of the audit function, the audit fee including the terms of audit;
Risk Management Framework of the entity; The effectiveness of the entity’ s internal control systems, including internal financial control
and IT risks; Actions and judgements of management in relation to the Annual Financial Statements prior
to submission to the Board in relation to compliance to statutory requirements; and The effectiveness of the Internal Audit function.
During the year under review, the Committee has in addition to two members appointed 3 Independent Members who possess diverse skills including Finance, IT, Risk, etc. and have contributed immensely in the deliberation of matters. In addition, the Committee has reviewed the province’s high level strategic projects and recommended the best mechanisms in managing those.
The Committee can report that the systems of internal control were adequate and partially effective due to the reported weaknesses in the control environment.
The Committee has evaluated the entity’s Annual Financial Statements for the year ended 31 March 2012 and, based on the information provided to the Committee, concludes that the audited Annual Financial Statements comply in all respects with the requirements of the Public Finance Management Act and International Financial Reporting Standards and that, these be accepted and read together with the report of the Auditor-General. In addition the committee has vigorously debated management letter with both auditors and management.
Appreciation:
The committee would like to thank the board, MEC, DED team, management, internal and external auditors for their co-operation and dedication in assisting the committee to discharge its duties in the current financial year.
____________________________________
Mr Thulani Sithole
Chairperson: Audit & Risk Committee
During the year under review, the Committee has in addition to two members appointed 3 Independent Members who possess diverse skills including Finance, IT, Risk, etc. and have contributed immensely in the deliberation of matters. In addition, the Committee has reviewed the province’s high level strategic projects and recommended the best mechanisms in managing those.
The Committee can report that the systems of internal control were adequate and partially effective due to the reported weaknesses in the control environment.
The Committee has evaluated the entity’s Annual Financial Statements for the year ended 31 March 2012 and, based on the information provided to the Committee, concludes that the audited Annual Financial Statements comply in all respects with the requirements of the Public Finance Management Act and International Financial Reporting Standards and that these be accepted and read together with the report of the Auditor-General. In addition the committee has vigorously debated the management letter with both auditors and management.
APPRECIATION:The committee would like to thank the board, MEC, DED team, management, internal and external auditors for their co-operation and dedication in assisting the committee to discharge its duties in the current financial year.
Mr. Thulani Sithole CHAIRPERSON: AUDIT & RISK COMMITTEER

57
Financials

58
‘GEP since 2005’
59
FOR THE YEAR ENDED 31 MARCH 2012
Approval of the annual financial statements ____________________________________________________________ 60
Report of the auditors _______________________________________________________________________________ 61
Directors’ report ____________________________________________________________________________________ 63
Statement of Financial Position _______________________________________________________________________ 64
Statement of Financial Performance __________________________________________________________________ 65
Statement of Changes in Net Assets __________________________________________________________________ 65
Cash flow Statement ________________________________________________________________________________ 66
Accounting Policies _________________________________________________________________________________ 67
Notes to the annual financial statements ______________________________________________________________ 71
‘GEP since 2005’
FINANCIAL STATEMENTS CONTENTS
60
DIRECTORS’ RESPONSIBILITY AND APPROVAL OF ANNUAL FINANCIAL STATEMENTS FOR THE YEAR ENDED 31 MARCH 2012
The entity’s directors are responsible for the preparation and fair presentation of the entity annual financial statements, comprising the statements of financial position at 31 March 2012; the statements of financial performance; the statements of the changes in net assets; statements of cash flows and the notes to the annual financial statements for the year then ended, which include a summary of significant accounting policies and other explanatory notes and the directors’ report in accordance with South African Standards of Generally Recognised Accounting Practices (SA Standards of GRAP).
The directors’ responsibility includes: design, implementing and maintaining internal controls relevant to the preparation and fair presentation of these financial statements that are free from material misstatement, whether due to fraud or error; selecting and applying appropriate accounting policies; and making accounting estimates that are reasonable under the circumstances.
The director’s responsibility also includes maintaining adequate accounting records and an effective system of risk management as well as the preparation of supplementary schedules included in these financial statements.
The entity’s annual financial statements are based on appropriate accounting policies, which are supported by reasonable and prudent judgments and estimates.
The annual financial statements have been prepared on a going concern basis. This basis presumes that the assets will be realised and the liabilities settled in the normal course of business.
Accordingly, no adjustments have been made to the valuation or classification of the assets or liabilities, which may have been necessary if the entity had been unable to continue as a going concern.
The auditor is responsible for reporting on whether the entity annual financial statements are fairly presented in accordance with the applicable financial reporting framework.
The annual financial statements set on pages 64 to 90 were circulated and approved by the board of directors on 30 May, 2012 and are signed on its behalf by:
__________________________________
Ms. P. Twala-Tau CHIEF ExECUTIVE OFFICER
_________________________________ Dr. P. Matseke BOARD CHAIRPERSON
Going forward, GEP will explore how best to help these businesses survive in the global context, thus
creating sustainability of those businesses.
I am confident that we have a very committed and independent Board with the right mix of skills and
that going forward, we will help build sustainable businesses, thus contribute to the province’s
economy.
APPRECIATION
On behalf of the Board, I would like to extend my sincere gratitude for the support provided by the
Department of Economic Development and the Board for their wealth of experience and support;
Management and staff in general for their contribution.
______________________________
Chairperson of the Board
61
REPORT OF THE AUDITOR-GENERAL TO THE GAUTENG PROVINCIAL LEGISLATURE FINANCIAL STATEMENTS AND PERFORMANCE INFORMATION OF GAUTENG ENTERPRISE PROPELLER FOR THE YEAR ENDED 31 MARCH 2012
REPORT ON THE FINANCIAL STATEMENTS
Introduction
1. I have audited the financial statements of the Gauteng Enterprise Propeller set out on pages 64 to 90, which comprise the statement of financial position as at 31 March 2012, the statement of financial performance, statement of changes in net assets and the cash flow statement for the year then ended, and the notes, comprising a summary of significant accounting policies and other explanatory information.
Accounting authority’s responsibility for the financial statements
2. The accounting authority is responsible for the preparation and fair presentation of these financial statements in accordance with the South African Standards of Generally Recognised Accounting Practice (SA Standards of GRAP) and the requirements of the Public Finance Management Act of South Africa, 1999 (Act No. 1 of 1999) (PFMA), and for such internal control as the accounting authority determines is necessary to enable the preparation of financial statements that are free from material misstatement, whether due to fraud or error.
Auditor-General’s responsibility
3. My responsibility is to express an opinion on these financial statements based on my audit. I conducted my audit in accordance with the Public Audit Act of South Africa, 2004 (Act No. 25 of 2004 (PAA), the General Notice issued in terms thereof and International Standards on Auditing. Those standards require that I comply with ethical requirements and plan and perform the audit to obtain reasonable assurance about whether the financial statements are free from material misstatement.
4. An audit involves performing procedures to obtain audit evidence about the amounts and disclosures in the financial statements. The
procedures selected depend on the auditor’s judgement, including the assessment of the risks of material misstatement of the financial statements, whether due to fraud or error. In making those risk assessments, the auditor considers internal control relevant to the entity’s preparation and fair presentation of the financial statements in order to design audit procedures that are appropriate in the circumstances, but not for the purpose of expressing an opinion on the effectiveness of the entity’s internal control. An audit also includes evaluating the appropriateness of accounting policies used and the reasonableness of accounting estimates made by management, as well as evaluating the overall presentation of the financial statements.
5. I believe that the audit evidence I have obtained is sufficient and appropriate to provide a basis for my audit opinion.
Opinion
6. In my opinion, the financial statements present fairly, in all material respects, the financial position of the Gauteng Enterprise Propeller as at 31 March 2012, and its financial performance and cash flows for the year then ended in accordance with SA Standards of GRAP and the requirements of the PFMA.
Emphasis of matter
7. I draw attention to the matter below. My opinion is not modified in respect of this matter.
Material Impairment
8. As disclosed in note 3 to the financial statements, material impairments to the amount of R27 400 000 were incurred on debtors, as the recoverability of these amounts are doubtful. This could have an impact on the financial sustainability of the entity.
Additional matters
9. I draw attention to the matters below. My opinion is not modified in respect of these matters.
Unaudited supplementary schedules
10. The supplementary information set out on pages 92 to 93 does not form part of the financial statements and is presented as additional information. I have not audited these schedules and, accordingly, I do not express an opinion thereon.
REPORT ON OTHER LEGAL AND REGULATORY REQUIREMENTS 11. In accordance with the PAA and the General Notice issued in terms thereof, I report the following findings relevant to performance against predetermined objectives, compliance with laws and regulations and internal control, but not for the purpose of expressing an opinion.
Predetermined objectives
12. I performed procedures to obtain a evidence about the usefulness and reliability of the information in the annual performance report as set out on pages 15 to 47 of the annual report.
13. The reported performance against predetermined objectives was evaluated against the overall criteria of usefulness and reliability. The usefulness of information in the annual performance report relates to whether it is presented in accordance with the National Treasury annual reporting principles and whether the reported performance is consistent with the planned objectives. The usefulness of information further relates to whether indicators and targets are measurable (i.e. well defined, verifiable, specific, measurable and time bound) and relevant as required by the National Treasury Framework for managing programme performance information.
The reliability of the information in respect of the selected programmes is assessed to determine whether it adequately reflects the facts (i.e. whether it is valid, accurate and complete).
62
14. The material findings are as follows:
Usefulness of information
Presentation
Reasons for major variances not explained
15. A total of 62% of major variances between planned and actual achievements were not explained in the annual performance report for the year under review as per the National Treasury annual report preparation guide. This was due to a lack of documented and approved internal policies and procedures to address reporting processes and events pertaining to performance management and reporting.
Reliability of information
16. There were no material findings on the annual performance report concerning the reliability of the information.
Additional matter
17. I draw attention to the matter below. My conclusion is not modified in respect of this matter:
Achievement of planned targets
18. Of the total number of planned targets of 90, only 60 were achieved during the year under review. This represents 33% of total planned targets that were not achieved during the year under review.
Compliance with laws and regulations
19. I performed procedures to obtain evidence that the entity has complied with applicable laws and regulations regarding financial matters, financial management and other related matters. My findings on material non-compliance with specific matters in key applicable laws and regulations as set out in the General Notice issued in terms of the PAA are as follows:
Annual financial statements
20. The financial statements submitted for auditing were not prepared in all material respects in accordance with the requirements of section 55(2) of the PFMA. Material misstatements of revenue, investments and disclosure items identified by the auditors were subsequently corrected, resulting in the financial statements receiving an unqualified audit opinion.
Procurement and contract management
21. Contracts and quotations were awarded to suppliers whose tax matters had not been declared by the South African Revenue Services to be in order as required by Treasury Regulations (TR) 16A9.1(d) and the Preferential Procurement Regulations.
22. Quotations were awarded to bidders who did not submit a declaration on whether they are employed by the state or connected to any person employed by the state, which is prescribed in order to comply with TR 16A8.3.
23. The preference point system was not applied in some procurement of goods and services above R30 000 as required by section 2(a) of the Preferential Procurement Policy Framework Act and TR 16A6.3(b).
24. The awarded unsolicited was not incompliant with paragraph 4.2.1 of the Practice note number 11 2008/09 which states that a submission to an institution must comply with the requirement of existing unsolicited bid provisions in terms of the National Treasury issued circular entitled “Implementation of Supply Chain Management” (dated 27 October 2004), namely the product or service is unique, innovative and provided by a sole.
Expenditure management
25. The accounting authority did not take effective and appropriate steps to prevent irregular expenditure as per the requirements of section 51(1)(b)(ii) of the PFMA.
Revenue management
26. The accounting authority did not take effective and appropriate steps to timeously collect all money due to the entity as per the requirements of TR 11.2.1.
Internal control
27. I considered internal control relevant to my audit of the financial statements, annual performance report and compliance with laws and regulations. The matters reported below under the fundamentals of internal control are limited to the significant deficiencies that resulted in the basis for the findings on the annual performance report and the findings on compliance with laws and regulations included in this report.
Leadership
28. Accounting authority did not review and update the policies and procedures to ensure compliance with the applicable laws and regulations and preparation of complete and accurate financial statements and performance reports.
Financial and performance management
29. Management did not adequately review and monitor compliance with applicable laws and regulations, preparation of accurate and complete annual financial statements and performance reports.
Governance
30. The fraud prevention plan was not formally communicated to all staff and the risk assessment for the year under review was only performed during February 2012.
OTHER REPORTS
Investigations
An investigation was completed on senior official regarding the irregularities on supply chain management and contravention of internal financial policies.
__________________________________
Johannesburg
31 July 2012
63
DIRECTORS REPORT FOR THE YEAR ENDED 31 MARCH 2012
The directors have pleasure in presenting their report on the activities of the entity for the year ended
31 March 2012.
NATURE OF THE BUSINESSThe Gauteng Enterprise Propeller (GEP) was incorporated in terms of Gauteng Enterprise Propeller Act (No.5 of 2005) and listed as a Schedule 3c Provincial Public Entity in terms of the Public Finance Management Act.
The enterprise renders services to provide financial and business development support to SMME’s located in Gauteng, including the provision of short term loans for project finance, working capital and start up businesses.
All financial support, in the form of loans to SMMEs, is governed by the regulations contained in the National Credit Act, as amended.
GENERAL REVIEWThe company received grants totaling R125 445 000 (2011: R131 659 000) for the year. This money was successfully used to achieve its primary objectives, including the provision of several loans to small businesses. An annual amount is allocated by the Provincial Government on a rolling three year basis.
In terms of the Public Finance Management Act the directors are required to prepare annual financial statements that fairly present the state of affairs and business of the entity at the end of financial year and of the surplus or deficit for the year. To achieve the highest standards of financial reporting, these annual financial statements have been drawn up to comply with South African Standards of Generally Recognised Accounting Practices.
Supported by the Risk and Audit Committee, the directors are satisfied that the internal controls, systems and procedures in operation provide reasonable assurance that all assets are safeguarded, that transactions are properly executed and recorded, and that the possibility of material loss or misstatement is minimised. The directors have reviewed the appropriateness of the accounting policies, and concluded that the estimates and judgments are prudent. They are of the opinion that the annual financial statements fairly present the state of affairs and business of the entity at 31 March 2012 and of the
surplus for the year ended on that date. The external auditors, who have unrestricted access to all records and information, as well as to the Audit Committee, concur with this statement
GOING CONCERNThe entity financial position of the entity, its cash flows, liquidity position and funding facilities, as set out in the annual financial statements, and future projections of funding requirements from the Provincial Government, have been reviewed and considered by the directors.
The directors are of the opinion that the entity will be able to operate within the level of its current facilities for the foreseeable future. For this reason the Group continues to adopt the going concern basis in preparing its financial statements.
EVENTS AFTER THE REPORTING DATEThere are no material events that have been taken place between the balance sheet and the reporting date.
DIRECTORSThe directors in the office during the financial year were as follows:
K Matseke (Chairperson, appointed 01 September 2011)
P. Mgulwa (Chairperson,contract concluded 31 July 2011)
M. Mutlaneng (Appointed 01 September 2011)
M. Mokoena (Contract concluded 31 July 2011)
J. Ngcebetsha (Appointed 01 September 2011)
D. Coovadia (Contract concluded 31 July 2011)
T. Mazwai (Appointed 01 September 2011) C. Mvelase (Contract concluded 31 July 2011)
T. Sithole (Appointed 01 September 2011)
D. Sadike (Contract concluded 31 July 2011)
D. Ndlovu (Appointed 01 September 2011)
D. Mngomezulu (Contract concluded 31 July 2011)
K. Mkhonza
(Appointed 01 September 2011) D. Morobe (Contract concluded 30 September 2011)
P. Twala-Tau (Appointed 01 March 2012)
T. Ngqobe (Acting CEO until 28 February 2012)
V. Satgar (Appointed 01 September 2011 & resigned 30 October 2011)
BUSINESS AND POSTAL ADDRESSBusiness address
6th Floor 124 Main Street Marshalltown 2001
Postal address
P O Box 61464 Johannesburg 2107
SECRETARYThe entity’s secretary function was performed by the Finance Manager from 01 April 2011 to 30 September 2011; thereafter by K Onuoka.
CONTINGENT LIABILITIES AND GUARANTEESDuring the year the entity did not enter into contracts with service providers which could lead to expenses being incurred in the next financial year, other than those recorded under note 23: Commitments.
BANKERSABSA Bank Limited Registration number 1986/004794/06
First National Bank Registration number 1929/001225/06
NON-CURRENT ASSETSThere has been no material change in the non-current assets of the entity during the financial year under review.
DISTRIBUTION TO OWNERSThere has not been any distribution made to the owners of Gauteng Enter-prise Propeller as it is not in the nature of the group to do so.
AUDITORSGauteng Enterprise Propeller is audited by the Auditor-General of South Africa.

64
STATEMENT OF FINANCIAL POSITION AT 31 MARCH 2012
NOTES 2012R
2011R
ASSETS
Non current assets 94 126 552 27 389 513
Property, plant and equipment
- Own assets 9 3 503 281 3 765 220
- Leasehold improvements 9 - 148 349
- Leased assets 9 34 971 142 759
Intangible assets 10 317 735 60 801
Mafisa loans 11 1 843 541 209 349
Financial support loans 12 13 427 024 23 063 035
Other investments 14 75 000 000 -
Investment in associated companies 13 - -
Current assets 92 235 536 121 612 699
Mafisa loans 11 1 043 397 271 353
Financial support loans 12 16 214 839 19 697 457
Trade and other receivables 15 20 862 202 17 127 143
Cash and cash equivalents 16 54 115 098 84 516 746
TOTAL ASSETS 186 362 088 149 002 212
NET ASSETS
Accumulated surplus 166 304 391 128 123 277
Long term Liabilities 568 586 79 969
Finance lease liability 21 568 586 79 969
Current liabilities 19 489 111 20 798 965
Trade and other payables 19 6 485 022 8 730 593
Rent straight-lining accrual 20 71 611 172 070
Finance lease liability 21 757 923 295 190
Mafisa Funds 18 12 174 554 11 601 112
TOTAL NET ASSETS 186 362 088 149 002 212
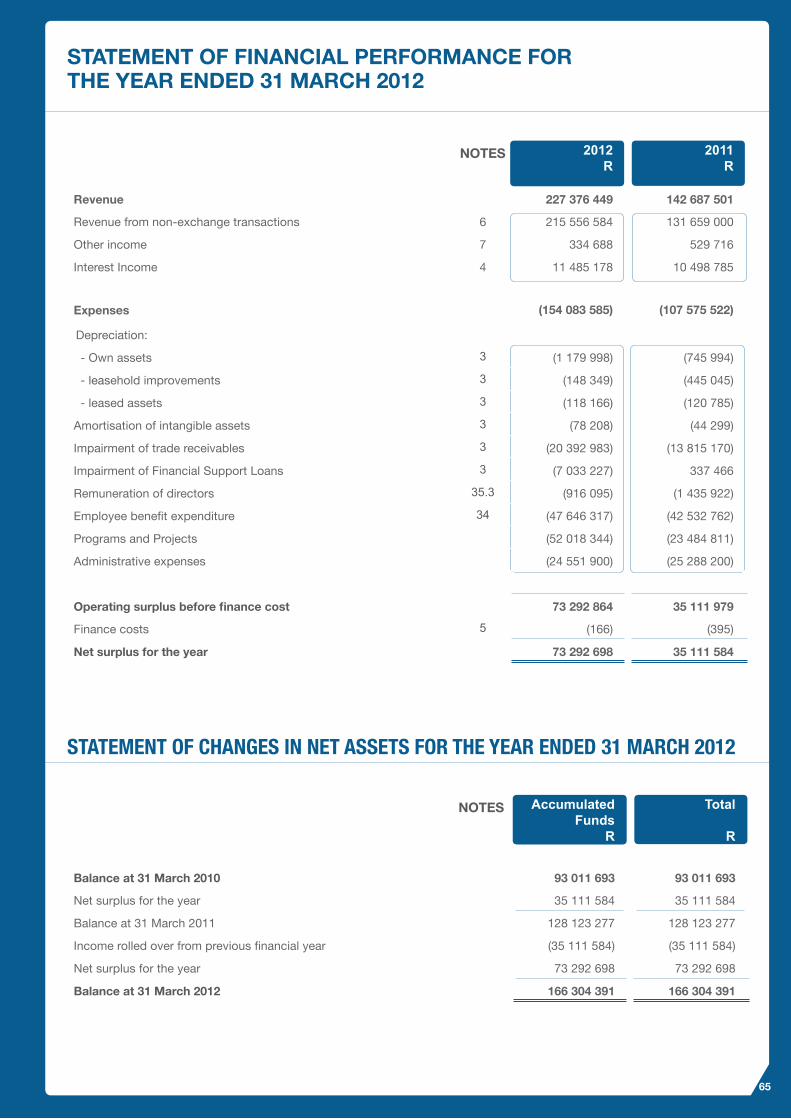
65
STATEMENT OF FINANCIAL PERFORMANCE FOR THE YEAR ENDED 31 MARCH 2012
STATEMENT OF CHANGES IN NET ASSETS FOR THE YEAR ENDED 31 MARCH 2012
NOTES 2012R
2011R
Revenue 227 376 449 142 687 501
Revenue from non-exchange transactions 6 215 556 584 131 659 000
Other income 7 334 688 529 716
Interest Income 4 11 485 178 10 498 785
Expenses (154 083 585) (107 575 522)
Depreciation:
- Own assets 3 (1 179 998) (745 994)
- leasehold improvements 3 (148 349) (445 045)
- leased assets 3 (118 166) (120 785)
Amortisation of intangible assets 3 (78 208) (44 299)
Impairment of trade receivables 3 (20 392 983) (13 815 170)
Impairment of Financial Support Loans 3 (7 033 227) 337 466
Remuneration of directors 35.3 (916 095) (1 435 922)
Employee benefit expenditure 34 (47 646 317) (42 532 762)
Programs and Projects (52 018 344) (23 484 811)
Administrative expenses (24 551 900) (25 288 200)
Operating surplus before finance cost 73 292 864 35 111 979
Finance costs 5 (166) (395)
Net surplus for the year 73 292 698 35 111 584
NOTES AccumulatedFunds
R
Total
R
Balance at 31 March 2010 93 011 693 93 011 693
Net surplus for the year 35 111 584 35 111 584
Balance at 31 March 2011 128 123 277 128 123 277
Income rolled over from previous financial year (35 111 584) (35 111 584)
Net surplus for the year 73 292 698 73 292 698
Balance at 31 March 2012 166 304 391 166 304 391
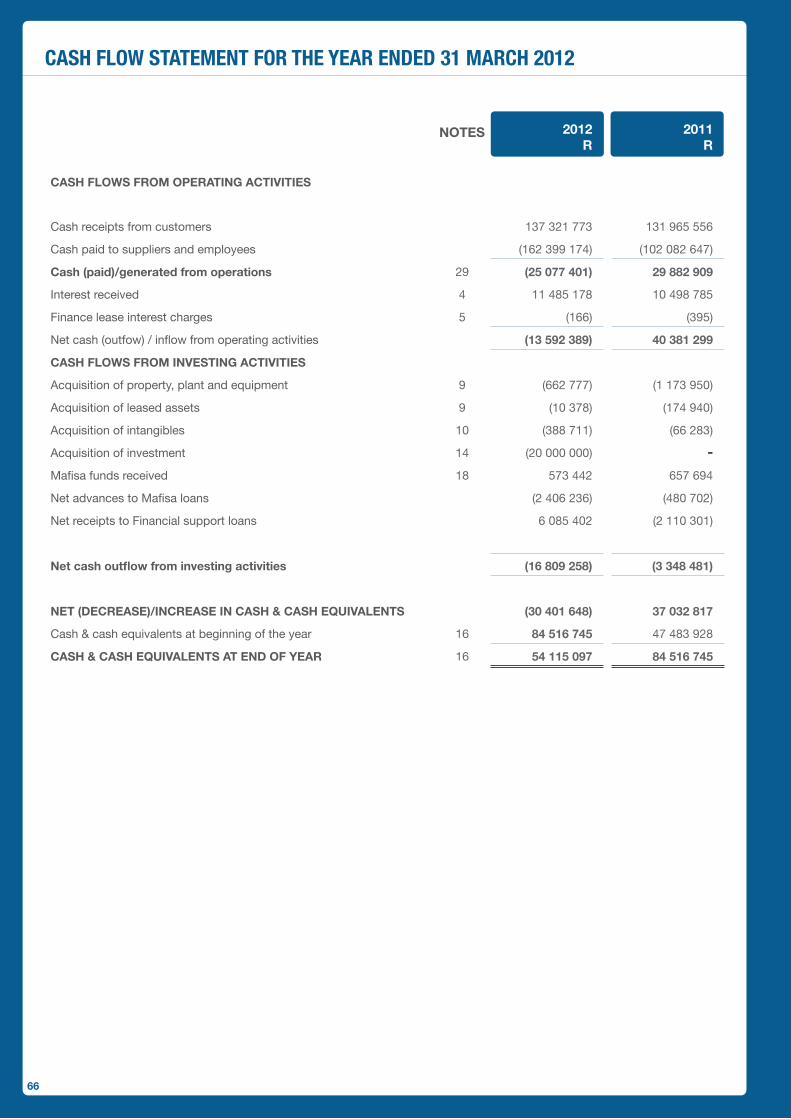
66
CASH FLOW STATEMENT FOR THE YEAR ENDED 31 MARCH 2012
NOTES 2012 R
2011R
CASH FLOWS FROM OPERATING ACTIVITIES
Cash receipts from customers 137 321 773 131 965 556
Cash paid to suppliers and employees (162 399 174) (102 082 647)
Cash (paid)/generated from operations 29 (25 077 401) 29 882 909
Interest received 4 11 485 178 10 498 785
Finance lease interest charges 5 (166) (395)
Net cash (outfow) / inflow from operating activities (13 592 389) 40 381 299
CASH FLOWS FROM INVESTING ACTIVITIES
Acquisition of property, plant and equipment 9 (662 777) (1 173 950)
Acquisition of leased assets 9 (10 378) (174 940)
Acquisition of intangibles 10 (388 711) (66 283)
Acquisition of investment 14 (20 000 000) -Mafisa funds received 18 573 442 657 694
Net advances to Mafisa loans (2 406 236) (480 702)
Net receipts to Financial support loans 6 085 402 (2 110 301)
Net cash outflow from investing activities (16 809 258) (3 348 481)
NET (DECREASE)/INCREASE IN CASH & CASH EQUIVALENTS (30 401 648) 37 032 817
Cash & cash equivalents at beginning of the year 16 84 516 745 47 483 928
CASH & CASH EQUIVALENTS AT END OF YEAR 16 54 115 097 84 516 745
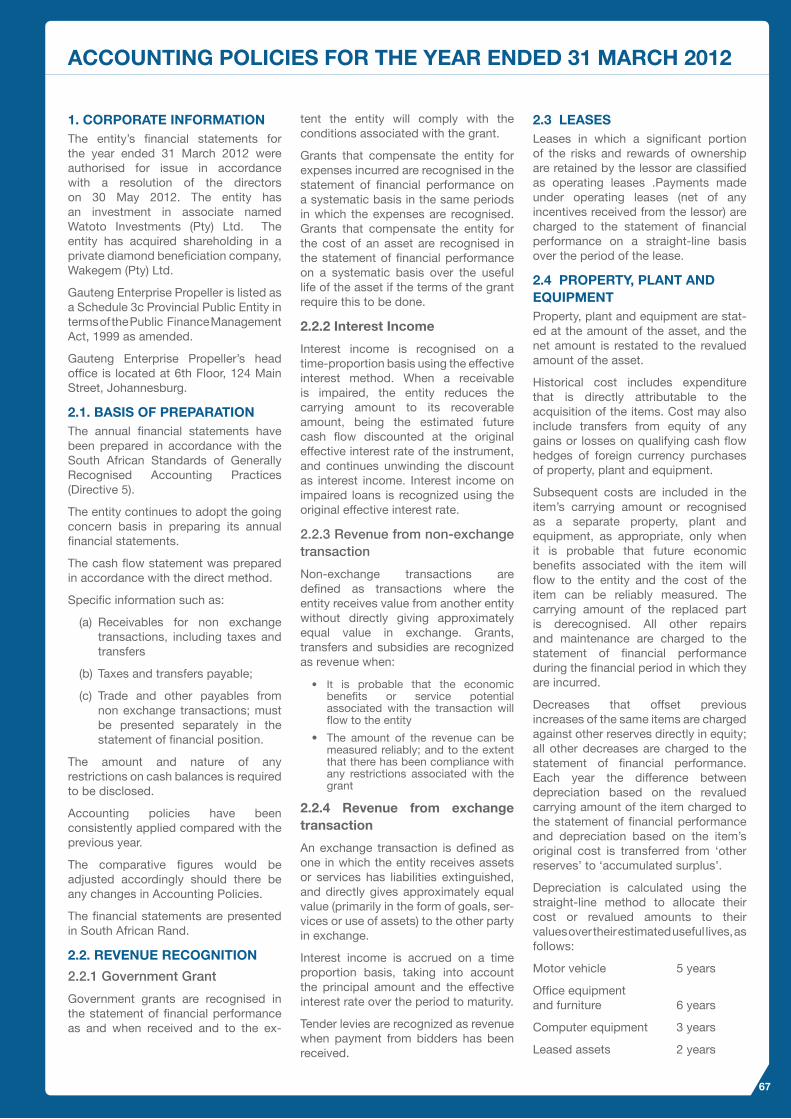
67
ACCOUNTING POLICIES FOR THE YEAR ENDED 31 MARCH 2012
1. CORPORATE INFORMATIONThe entity’s financial statements for the year ended 31 March 2012 were authorised for issue in accordance with a resolution of the directors on 30 May 2012. The entity has an investment in associate named Watoto Investments (Pty) Ltd. The entity has acquired shareholding in a private diamond beneficiation company, Wakegem (Pty) Ltd.
Gauteng Enterprise Propeller is listed as a Schedule 3c Provincial Public Entity in terms of the Public Finance Management Act, 1999 as amended.
Gauteng Enterprise Propeller’s head office is located at 6th Floor, 124 Main Street, Johannesburg.
2.1. BASIS OF PREPARATIONThe annual financial statements have been prepared in accordance with the South African Standards of Generally Recognised Accounting Practices (Directive 5).
The entity continues to adopt the going concern basis in preparing its annual financial statements.
The cash flow statement was prepared in accordance with the direct method.
Specific information such as:
(a) Receivables for non exchange transactions, including taxes and transfers
(b) Taxes and transfers payable;
(c) Trade and other payables from non exchange transactions; must be presented separately in the statement of financial position.
The amount and nature of any restrictions on cash balances is required to be disclosed.
Accounting policies have been consistently applied compared with the previous year.
The comparative figures would be adjusted accordingly should there be any changes in Accounting Policies.
The financial statements are presented in South African Rand.
2.2. REVENUE RECOGNITION
2.2.1 Government Grant
Government grants are recognised in the statement of financial performance as and when received and to the ex-
tent the entity will comply with the conditions associated with the grant.
Grants that compensate the entity for expenses incurred are recognised in the statement of financial performance on a systematic basis in the same periods in which the expenses are recognised. Grants that compensate the entity for the cost of an asset are recognised in the statement of financial performance on a systematic basis over the useful life of the asset if the terms of the grant require this to be done.
2.2.2 Interest Income
Interest income is recognised on a time-proportion basis using the effective interest method. When a receivable is impaired, the entity reduces the carrying amount to its recoverable amount, being the estimated future cash flow discounted at the original effective interest rate of the instrument, and continues unwinding the discount as interest income. Interest income on impaired loans is recognized using the original effective interest rate.
2.2.3 Revenue from non-exchange transaction
Non-exchange transactions are defined as transactions where the entity receives value from another entity without directly giving approximately equal value in exchange. Grants, transfers and subsidies are recognized as revenue when:
• It is probable that the economic benefits or service potential associated with the transaction will flow to the entity
• The amount of the revenue can be measured reliably; and to the extent that there has been compliance with any restrictions associated with the grant
2.2.4 Revenue from exchange transaction
An exchange transaction is defined as one in which the entity receives assets or services has liabilities extinguished, and directly gives approximately equal value (primarily in the form of goals, ser-vices or use of assets) to the other party in exchange.
Interest income is accrued on a time proportion basis, taking into account the principal amount and the effective interest rate over the period to maturity.
Tender levies are recognized as revenue when payment from bidders has been received.
2.3 LEASESLeases in which a significant portion of the risks and rewards of ownership are retained by the lessor are classified as operating leases .Payments made under operating leases (net of any incentives received from the lessor) are charged to the statement of financial performance on a straight-line basis over the period of the lease.
2.4 PROPERTY, PLANT AND EQUIPMENT Property, plant and equipment are stat-ed at the amount of the asset, and the net amount is restated to the revalued amount of the asset.
Historical cost includes expenditure that is directly attributable to the acquisition of the items. Cost may also include transfers from equity of any gains or losses on qualifying cash flow hedges of foreign currency purchases of property, plant and equipment.
Subsequent costs are included in the item’s carrying amount or recognised as a separate property, plant and equipment, as appropriate, only when it is probable that future economic benefits associated with the item will flow to the entity and the cost of the item can be reliably measured. The carrying amount of the replaced part is derecognised. All other repairs and maintenance are charged to the statement of financial performance during the financial period in which they are incurred.
Decreases that offset previous increases of the same items are charged against other reserves directly in equity; all other decreases are charged to the statement of financial performance. Each year the difference between depreciation based on the revalued carrying amount of the item charged to the statement of financial performance and depreciation based on the item’s original cost is transferred from ‘other reserves’ to ‘accumulated surplus’.
Depreciation is calculated using the straight-line method to allocate their cost or revalued amounts to their values over their estimated useful lives, as follows:
Motor vehicle 5 years
Office equipment and furniture 6 years
Computer equipment 3 years
Leased assets 2 years

68
The item’s residual values and useful lives are reviewed and adjusted, if appropriate, at each statement of financial position date.
An item’s carrying amount is written down immediately to its recoverable amount if the item’s carrying amount is greater than its estimated recoverable amount. Gains and losses on disposals are determined by comparing the pro-ceeds with the carrying amounts and are recognised within ‘Other (losses)/gains – net’ in the statement of financial performance.
When revalued items are sold, the amounts included in other reserves are transferred to accumulated surplus.
Expenditure on the leasehold improvements, if material, is capitalised and depreciated over the period of the lease.
An item’s carrying amount is derecognised from the statement of financial position on disposal or when no future economic benefit or service potential is expected from its use or disposal.
2.5. INTANGIBLE ASSETIntangible assets acquired separately are reported at cost less accumulated amortization and accumulated impairment losses. Amortization is charged on a straight-line basis over their estimated useful lives. The estimated useful life and amortisation method are reviewed at the end of each annual reporting period, with the effect of any changes in estimate being accounted for on a prospective basis.
The annual rate of amortisation currently used is 50%.
An item’s carrying amount is derecognized from the statement of financial position on disposal or when no future economic benefit or service potential is expected from its use or disposal.
2.6. IMPAIRMENT OF ASSETS The carrying amounts of assets stated in the statement of financial position, are reviewed at each balance sheet date to determine whether there is any indication of impairment. If such indication exists, the recoverable amount of the asset is estimated as the higher of the net selling price and its value in use. An impairment loss is recognised in the statement of financial performance whenever the carrying amount exceeds the recoverable amount.
In assessing value in use, the expected future cash flows are discounted to their present value that reflects current market assessment of the time value
of money and the risks specific to the asset. For an asset that does not generate cash flows largely independent of those from other assets, the recoverable amount that would have been determined (nett of depreciation and amortisation) had no impairment loss been recognised in previous years.
2.7. ASSOCIATESAssociates are all entities over which the significant influence but not control, generally accompanying a shareholding of between 20% and 50% of the voting rights. Investments in associates are accounted for using the equity method of accounting and are initially recognised at cost. The entity’s investment in associates includes goodwill identified on acquisition, net of any accumulated impairment loss.
The entity’s share of its associates’ post-acquisition profits or losses is recognised in the statement of financial performance, and its share of post-acquisition movements in reserves is recognised in reserves. The cumulative post-acquisition movements are adjusted against the carrying amount of the investment. When the entity’s share of losses in an associate equals or exceeds its interest in the associate, including any other unsecured receivables, the entity does not recognise further losses , unless it has incurred obligations or made payments on behalf of the associate.
Unrealised gains on transactions between the entity and its associates are eliminated to the extent of the entity’s interest in the associates. Unrealised losses are also eliminated unless the transaction provides evidence of an impairment of the asset transferred. Accounting policies of associates have been changed where necessary to ensure consistency with the policies adopted by the group. Dilution gains and losses arising in investments in associates are recognised in the statement of financial performance.
2.8. TAxATION The entity has been exempted from income tax by the South African Revenue Service in terms of Section 10(1)(ca)(i) of the Income Tax Act.(Act No.58 of 1962)
2.9. PROVISIONSProvisions for restructuring costs and legal claims are recognised when:
• the entity has a present legal or constructive obligation as a result of past events;
• it is probable that an outflow of resources will be required to settle the obligation;
• and the amount has been reliably estimated.
Provisions are not recognised for future operating losses. Where there are a number of similar obligations, the likelihood that an outflow will be required in settlement is determined by considering the class of obligations as a whole. A provision is recognised even if the likelihood of an outflow with respect to any one item included in the same class of obligation may be small.
Provisions are measured at the present value of the expenditures expected to be required to settle the obligation using a pre-tax rate that reflects current market assessments of the time value of money and the risks specific to the obligation. The increase in the provision due to passage of time is recognised as interest expense.
2.10. FINANCIAL INSTRUMENTSFinancial assets and liabilities are recognised in the entity’s statement of financial position when the entity becomes a party to the contractual provisions of the instrument.
The entity does not offset a financial asset and financial liability unless legally enforceable rights to set off the recognised amounts currently exist and the entity intends either to settle on a net basis, or to realise the assets and settle the liability simultaneously.
Financial instruments that are classified as measured at fair value through profit or loss are initially measured at fair value plus transaction costs that are directly attributable to acquisition or issue. All other financial instruments are initially measured at fair value. Subsequent to initial recognition financial instruments are measured as set out overleaf.
At reporting date, the entity determines whether there is any objective evidence that a financial asset or group of financial assets is impaired. If there is objective evidence that an impairment loss on loan and receivable or held to maturity investment carried at amortised cost has incurred ,the amount of the loss is measured as the difference between the asset’s carrying amount and the present value of the estimated future cash flows discounted at the financial asset’s original effective interest rate.
Subsequent recoveries of amounts previously written off are credited in the statement of financial position.
Changes in the carrying amount of the allowance account are recognized in the statement of Financial Performance.
The entity derecognises a financial asset when and only when the right to the cash flows from the financial asset expires or it transfers the financial asset and the transfer qualifies for derecognition.
69
The entity transfers a financial asset if, and only if, it either transfers the cash flows of the financial asset or retains the contractual rights to receive the cash flows of the financial asset.
2.11. FINANCIAL ASSETSThe entity’s principal financial assets are bank and cash balances and trade and other receivables:
Cash and Cash Equivalents
Cash and cash equivalents includes cash in hand, deposits held at call with banks, and other short-term highly liquid investments with original maturities of three month or less.
Trade and other receivables
Trade and other receivables are recognized initially at fair value and subsequently measured at amortised cost using the effective interest method, less provision for impairment. A provision for impairment of trade receivables is established when there is objective evidence that the group will not be able to collect all amounts due according to the original terms of the receivables. Significant, financial difficulties of the debtor, probability that the debtor will be bankrupt or financial reorganization, and default or delinquency in payments (more than 60 days overdue) are considered indicators that the trade receivable is impaired. The amount of the provision is the difference between the asset’s carrying amount and the present value of the estimated future cash flows, discounted at the original effective interest rate. Gains and losses are recognized in the group’s statement of financial performance when trade and other receivables are derecognized, or impaired as well as through the amortization process. When a trade debtor is uncollectible, it is written off against the allowance account for the trade receivables. Subsequent recoveries of amounts previously written off are credited in the statement of financial performance.
Financial Support and Mafisa Loans
Financial Support loans and Mafisa loans are categorised as held to maturity and are stated at their amortised cost using the effective interest rate method less an allowance for impairment. An estimate of doubtful debts is made on a review of all outstanding amounts at statement of financial position date. Bad debts are written off during the year in which they are identified. Due to the short term nature of the group’s receivables, amortised cost approximates its fair value.
2.12 FINANCIAL LIABILITIESThe entity’s principal financial liabilities are trade and other payables:
Trade and other payables
Trade and other payables are recognized initially at fair value and subsequently measured at amortised cost using the effective interest method.
2.13 CONTINGENCIES AND COMMITMENTSTransactions are classified as contingencies where the entity’s obligation depends on uncertain future events. Items are classified as commitments where the entity commits itself to future transactions or if the items will result in the acquisition of assets.
2.14 COMPARATIVE INFORMATIONPrior year comparative information has been presented in the current year’s financial statements. Where necessary, figures included in the prior year financial statements have been reclassified to ensure that the format in which the information is presented is consistent with the format of the current year’s financial statements.
2.15 FRUITLESS AND WASTEFUL ExPENDITUREFruitless and wasteful expenditure is defined as expenditure that was made in vain and would have been avoided had reasonable care been exercised, therefore it must be recovered from:
• A responsible official (a debtor account should be raised); or
• The vote (if responsibility cannot be determined)
Such expenditure is treated as a current asset in the statement of financial position until such expenditure is recovered from the responsible official or written off as irrecoverable.
2.16 IRREGULAR ExPENDITUREIrregular expenditure is defined as expenditure, other than unauthorized expenditure, incurred in contravention or not in accordance with a requirement or applicable legislation, the PFMA, or any provincial legislation providing for procurement procedures in that provincial accounted for as revenue in the statement of financial performance.
2.17 UNAUTHORISED ExPENDITUREUnauthorized expenditure is expenditure that has not been budgeted, expenditure that is not in terms of the conditions of an allocation received from another sphere of government, municipality or organ
of state. Unauthorised expenditure is accounted for as an expense in the statement of financial performance and where subsequently recovered, it is accounted for as revenue in the statement of financial performance.
2.18 SHORT TERM EMPLOYEE BENEFITSThe cost of short term employee benefits, (those payable within 12 months after the service is rendered, such as paid vacation leave and sick leave, bonuses and non monetary benefits such as medical care), are recognized in the period in which the service is rendered and are not discounted.
2.19 CRITICAL ACCOUNTING ESTIMATES AND jUDGMENTSEstimates and judgments are continually evaluated and are based on historical experience and other factors, including expectations of future events that are believed to be reasonable under the circumstances.
The entity and group makes estimates and assumptions concerning the future. The resulting accounting estimates will, by definition, seldom equal the related actual results. The estimates and assumptions that have a significant risk of incurring a material adjustment to the carrying amounts to assets and liabilities within the next financial year are discussed below.
Impairment of trade debtors
An impairment of trade debtors is established when there is objective evidence that the entity will not be able to collect all amounts due according to the original terms of receivables reorganisation. Significant financial difficulties of the debtor, probability that the debtor will enter bankruptcy or financial recognition, and default or delinquency in payments are considered indicators that the debtor is impaired. The amount of impairment is the difference between the trade debtor’s carrying amount and the present value of estimated future cash flow, discounted at the effective interest rate. Refer to note 15 for details of the entity’s impairment.
Property, plant and equipment are depreciated on a straight-line basis over its useful life to value. Residual values and useful lives are based on management’s best estimate and actual future outcomes may differ from these estimates. Refer to note 9 for details of the entity’s property, plant and equipment. The entity annually tests whether property, plant and equipment has suffered any impairment. When performing impairment testing, the

70
recoverable amount which is determined for the individual asset. If the asset does not generate cash flows which are largely independent from other assets then the recoverable amounts of cash flows that are largely independent from other assets or group of assets that those assets belong to are determined based on discounted future cash flows.
2.20 PRIOR PERIOD ERRORSPrior period errors are omissions from, and misstatements in, the entity’s financial statements for one or more prior periods arising from a failure to use, or misuse of, reliable information. Such errors include the effects of mathematical mistakes, mistakes inapplying accounting policies, oversights or misinterpretations of facts, and fraud. Where practical to determine the period specific or cumulative effect of the error, these are corrected retrospectively in the first set of financial statements produced after discovery of the error.
2.21 EVENTS AFTER THE REPORTING DATEEvents after the reporting date are those which could be favourable, that occur between the reporting date and the date the financial statements are authorized for issue. Such events are of two types:
• Those that provide evidence of conditions that existed at the reporting date (adjusting events after the reporting date).
• Those that are indicative of conditions that arose after the reporting date (non-adjusting events after the reporting date).
Amounts recognized in the annual financial statements are, where applicable, adjusted to reflect adjusting events after the reporting date. Non- adjusting events are not adjusted for.
2.22 RELATED PARTIESParties are considered to be related if one party has the ability to control the other party or exercise significant influence over the other party in making financial and operating decisions or if the related party entity and another entity are subject to common control. Related parties include:
• Entities that directly or indirectly through one or more intermediaries control or are controlled by the reporting entity.
• Key management personnel and close members of the family of key management personnel
A related party transaction is a transfer of resources, services or obligations between the reporting entity and a related party, regardless of whether a price is charged. Related party
transactions exclude transactions with any other entity that is a related party solely because of its economic dependence on the reporting entity or the government of which it forms part.
Related party transactions are measured and recognized on terms and conditions are normal for such transactions.
2.23 BUDGET INFORMATIONBudget information is disclosed in terms of GRAP1 (Presentation of Financial Statements) which requires that entities, in their general purpose financial reporting, provide information on whether resources were obtained and used in accordance with their legally adopted budgets.
2.24 STANDARDS ISSUED BUT NOT EFFECTIVEThe following standards have been issued but are not yet effective:
GRAP 18 Segment Reporting
The standard will be effective from a date still to be determined by the Minister. The adoption of this standard is not expected to impact on the results of the entity, but may result in more disclosure than is currently provided in the annual financial statements.
GRAP 20 Related Party Disclosures
The standard will be effective from a date still to be determined by the Minister.
GRAP 21 Impairment of non-cash generating assets
The Standard will be effective from April 01, 2012. The entity expects to adopt the standard for the first time in the 2013 annual financial statements. It is unlikely that the standard will have a material impact on the entity’s annual financial statements.
GRAP 23 Revenue from Non- exchange transactions
The standard will be effective from April 01, 2012. The entity expects to adopt the standard for the first time in the 2013 annual financial statements. It is unlikely that the standards will have a material impact on the entity’s annual financial statements.
GRAP 24 Presentation of Budget Information in Financial Statements
The standard will be effective from April 01, 2012. The entity expects to adopt the standard for the first time in the 2013 annual financial statements. It is unlikely that the standard will have a material
impact on the entity’s annual financial statements.
GRAP 25 Employee benefits
The standard will be effective from a date still to be determined by the Minister.
GRAP 26 Impairment of cash-generating assets
The standard will be effective from 01, 2012. The entity expects to adopt the standard for the first time in the 2013 annual financial statements. It is unlikely that the standard will have material impact on the financial statements.
GRAP 103 Heritage Assets
The standard will be effective from April 01, 2012. The entity does not envisage the adoption of the standard until such time as it becomes applicable to the entity’s operations.
GRAP 104 Financial Instruments
The standard will be effective from a date still to be determined by the Minister.
GRAP 105 Transfer of Functions between Entities under Common Control
The standard will be effective from a date still to be determined by the Minister.
GRAP 106 Transfer of Functions between Entities Not Under Common Control
The Standard will be effective from a date still to be determined by the Minister.
GRAP 107 Mergers
The standards will be effective from a date still to be determined by the Minister.

71
NOTES TO THE ANNUAL FINANCIAL STATEMENTS FOR THE YEAR ENDED 31 MARCH 2012
3. OPERATING SURPLUS2012
R2011
R
Operating (deficit)/surplus is arrived at after taking the following items into account:
Auditor’s remuneration 2 378 807 2 232 963
Internal auditors 1 124 858 955 870
External auditors 897 580 501 311
Forensic auditors 356 369 775 782
Bad debts: 27 426 210 13 477 704
- Impairment of trade receivables 20 392 983 13 815 170
- Impairment of financial support loans 7 033 227 (337 466)
Depreciation on own assets 1 179 998 745 994
Motor vehicle 107 039 95 650
Office equipment and furniture 236 367 536 422
Computer equipment 836 592 113 922
Depreciation 344 723 610 129
Leasehold Improvements 148 349 445 045
Leased assets 118 166 120 785
Amortisation of intangibles 78 208 44 299
Total Depreciation 1 524 721 1 356 123
Operating lease payments 8 054 071 6 382 877
- Properties 7 985 464 6 280 039
- Equipment 68 607 102 839
4. INTEREST INCOME 2012R
2011R
Interest received:
Bank current account 2 461 443 3 242 214
Financial Support Loans 9 023 735 7 256 571
11 485 178 10 498 785
5. FINANCE COSTS 2012R
2011R
Finance costs – fruitless and wasteful expenditure 166 395
166 395

72
NOTES TO THE ANNUAL FINANCIAL STATEMENTS (CONTINUED…)FOR THE YEAR ENDED 31 MARCH 2012
6. REVENUE 2012R
2011R
Provincial Grants 105 445 000 131 659 000
Transfer from the Department 20 000 000 -
Transfer of asset 55 000 000 -
Income rolled over from previous financial year 35 111 584 -
215 556 584 131 659 000
7. OTHER INCOME 2012R
2011R
Training fees 51 513 97 800
Insurance claims recovered 71 717 46 751
Bad debts recovered - 17 132
VAT recovery - 49 891
SETA subsidy 90 443 94 982
Sundry income 121 015 223 160
334 688 529 716
8. TAXATION2012
R2011
R
SA normal taxation comprising:-
- Current taxation: not applicable - -
- Deferred taxation: not applicable - -
- -
The company is a public benefit organization in terms of the Income Tax Act and has a tax exempt status.

73
9. PROPERTY, PLANT & EQUIPMENT
Own assets
Motor Vehicle
R
Office equipment & furniture
R
Computer equipment
R
Total
R
2012
Cost
Opening Balance 478 238 6 436 738 3 674 871 10 589 847
Additions 119 500 116 184 427 093 662 777
Transfers (253 610) 411 771 158 161
Disposals/Write off - (15 685) (440 493) (456 178)
Closing balance 597 738 6 283 627 4 073 242 10 954 607
Accumulated depreciation
Opening balance 169 891 4 367 417 2 287 319 6 824 627
Depreciation for the year 107 039 236 367 836 592 1 179 998
Transfers (203 563) 122 523 (81 040)
Disposal/Write off - (12 360) (459 899) (472 259)
Closing balance 276 930 4 387 861 2 786 535 7 451 326
Closing carrying value 320 808 1 895 766 1 286 707 3 503 281
2011
Cost
Opening balance 120 392 5 830 311 2 887 000 8 837 703
Additions 357 846 206 462 609 642 1 173 950
Adjustments - 399 965 178 229 578194
Disposals/Write off - - - -
Closing balance 478 238 6 436 738 3 674 871 10 589 847
Accumulated depreciation
Opening balance 74 241 3 628 703 2 051 043 5 753 987
Depreciation for the year 95 650 536 422 113 922 745 994
Adjustments - 202 292 122 354 324 646
Disposals/Write off - - - -
Closing balance 169 891 4 367 417 2 287 319 6 824 627
Closing carrying value 308 347 2 069 321 1 387 552 3 765 220
NOTES TO THE ANNUAL FINANCIAL STATEMENTS (CONTINUED…)FOR THE YEAR ENDED 31 MARCH 2012
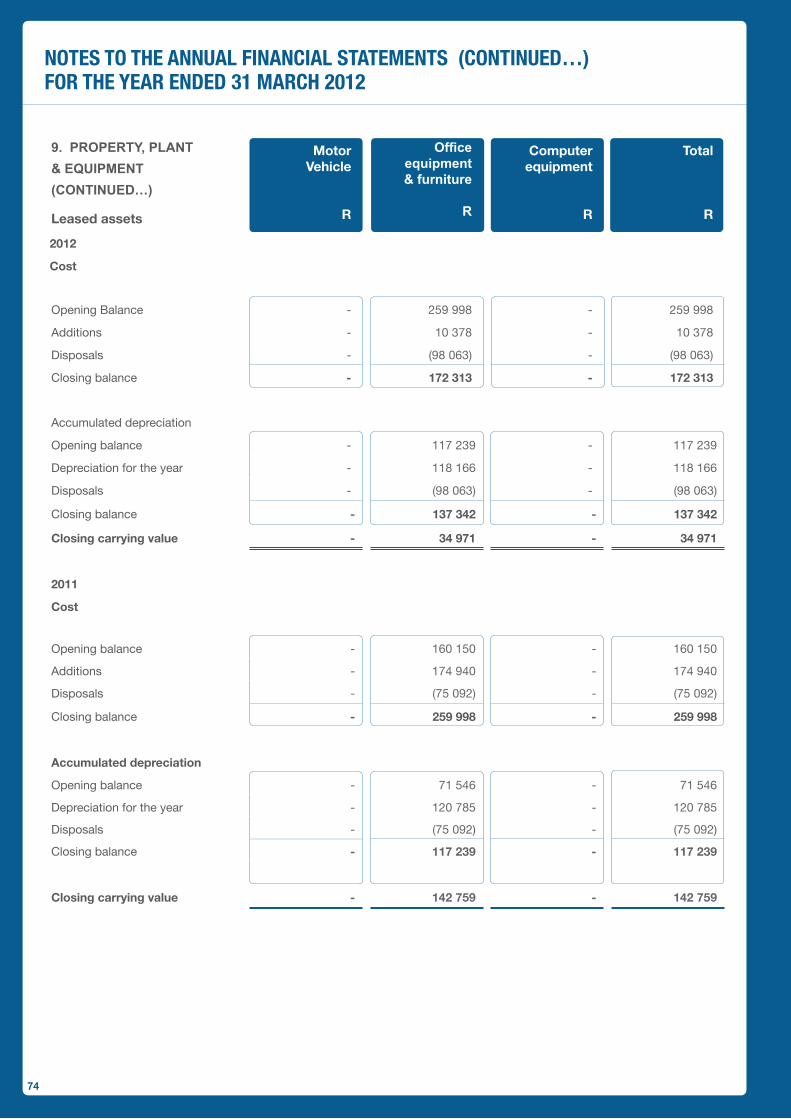
74
NOTES TO THE ANNUAL FINANCIAL STATEMENTS (CONTINUED…)FOR THE YEAR ENDED 31 MARCH 2012
9. PROPERTY, PLANT & EQUIPMENT (CONTINUED…)
Leased assets
Motor Vehicle
R
Office equipment & furniture
R
Computer equipment
R
Total
R
2012
Cost
Opening Balance - 259 998 - 259 998
Additions - 10 378 - 10 378
Disposals - (98 063) - (98 063)
Closing balance - 172 313 - 172 313
Accumulated depreciation
Opening balance - 117 239 - 117 239
Depreciation for the year - 118 166 - 118 166
Disposals - (98 063) - (98 063)
Closing balance - 137 342 - 137 342
Closing carrying value - 34 971 - 34 971
2011
Cost
Opening balance - 160 150 - 160 150
Additions - 174 940 - 174 940
Disposals - (75 092) - (75 092)
Closing balance - 259 998 - 259 998
Accumulated depreciation
Opening balance - 71 546 - 71 546
Depreciation for the year - 120 785 - 120 785
Disposals - (75 092) - (75 092)
Closing balance - 117 239 - 117 239
Closing carrying value - 142 759 - 142 759

75
9. PROPERTY, PLANT & EQUIPMENT (CONTINUED…) TotalR
Leasehold Improvements
2012
Cost
Opening Balance 1 090 091
Additions -
Disposals (1 090 091)
Closing balance -
Accumulated depreciation
Opening balance 941 742
Depreciation for the year 148 349
Disposals (1 090 091)
Closing balance -
Closing carrying value -
2011
Cost
Opening balance 1 090 091
Additions -
Diposals -
Closing balance 1 090 091
Accumulated depreciation
Opening balance 496 697
Depreciation for the year 445 045
Disposals -
Closing balance 941 742
Closing carrying value 148 349
NOTES TO THE ANNUAL FINANCIAL STATEMENTS (CONTINUED…)FOR THE YEAR ENDED 31 MARCH 2012
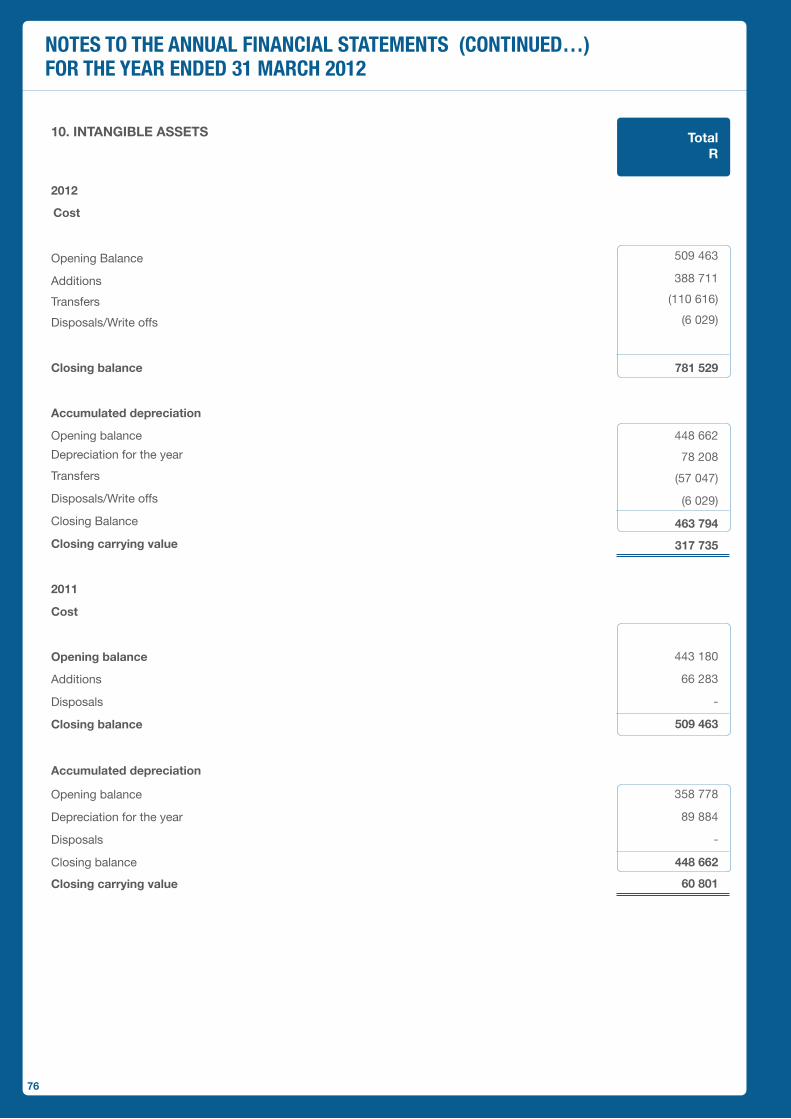
76
10. INTANGIBLE ASSETS TotalR
2012
Cost
Opening Balance 509 463
Additions 388 711
Transfers (110 616)
Disposals/Write offs (6 029)
Closing balance 781 529
Accumulated depreciation
Opening balance 448 662
Depreciation for the year 78 208
Transfers (57 047)
Disposals/Write offs (6 029)
Closing Balance 463 794
Closing carrying value 317 735
2011
Cost
Opening balance 443 180
Additions 66 283
Disposals -
Closing balance 509 463
Accumulated depreciation
Opening balance 358 778
Depreciation for the year 89 884
Disposals -
Closing balance 448 662
Closing carrying value 60 801
NOTES TO THE ANNUAL FINANCIAL STATEMENTS (CONTINUED…)FOR THE YEAR ENDED 31 MARCH 2012
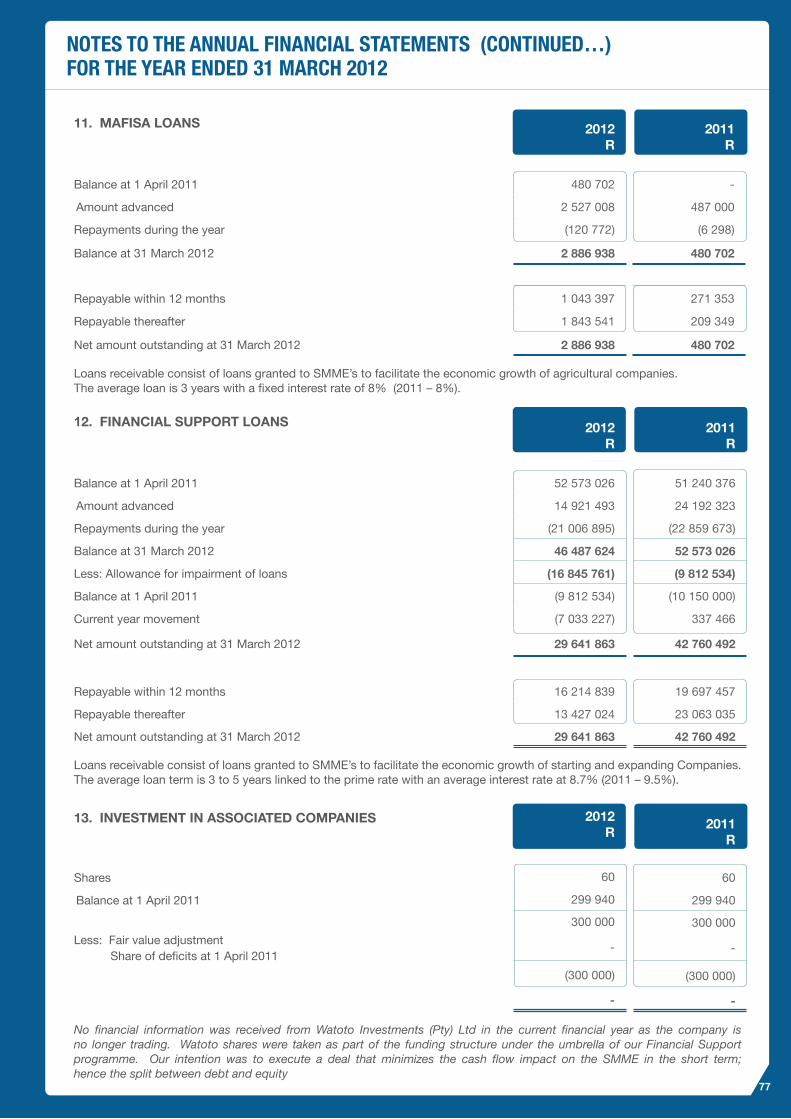
77
11. MAFISA LOANS 2012R
2011R
Balance at 1 April 2011 480 702 -
Amount advanced 2 527 008 487 000
Repayments during the year (120 772) (6 298)
Balance at 31 March 2012 2 886 938 480 702
Repayable within 12 months 1 043 397 271 353
Repayable thereafter 1 843 541 209 349
Net amount outstanding at 31 March 2012 2 886 938 480 702
Loans receivable consist of loans granted to SMME’s to facilitate the economic growth of agricultural companies. The average loan is 3 years with a fixed interest rate of 8% (2011 – 8%).
13. INVESTMENT IN ASSOCIATED COMPANIES 2012R
2011R
Shares 60 60
Balance at 1 April 2011 299 940 299 940
300 000 300 000Less: Fair value adjustment Share of deficits at 1 April 2011
- -
(300 000) (300 000)
- -
No financial information was received from Watoto Investments (Pty) Ltd in the current financial year as the company is no longer trading. Watoto shares were taken as part of the funding structure under the umbrella of our Financial Support programme. Our intention was to execute a deal that minimizes the cash flow impact on the SMME in the short term; hence the split between debt and equity
12. FINANCIAL SUPPORT LOANS 2012R
2011R
Balance at 1 April 2011 52 573 026 51 240 376
Amount advanced 14 921 493 24 192 323
Repayments during the year (21 006 895) (22 859 673)
Balance at 31 March 2012 46 487 624 52 573 026
Less: Allowance for impairment of loans (16 845 761) (9 812 534)
Balance at 1 April 2011 (9 812 534) (10 150 000)
Current year movement (7 033 227) 337 466
Net amount outstanding at 31 March 2012 29 641 863 42 760 492
Repayable within 12 months 16 214 839 19 697 457
Repayable thereafter 13 427 024 23 063 035
Net amount outstanding at 31 March 2012 29 641 863 42 760 492
Loans receivable consist of loans granted to SMME’s to facilitate the economic growth of starting and expanding Companies. The average loan term is 3 to 5 years linked to the prime rate with an average interest rate at 8.7% (2011 – 9.5%).
NOTES TO THE ANNUAL FINANCIAL STATEMENTS (CONTINUED…)FOR THE YEAR ENDED 31 MARCH 2012

78
15. TRADE & OTHER RECEIVABLES 2012R
2011R
Trade receivables 46 523 313 34 894 331
Less Impairment of trade receivables (38 958 153) (18 565 170)
Balance at 1 April 2011 (18 565 170) (4 750 000)
Current year movement (20 392 983) (13 815 170)
Net trade receivables 7 565 160 16 329 161
Grant receivable 11 533 144 -
Finance lease charges paid in advance 1 022 719 232 400
Prepayments 741 179 565 582
20 862 202 17 127 143
17. GUARANTEES ISSUED
At 31 March 2012 (2011 R nil) there were no funds pledged as guarantees issued by Gauteng Enterprise Propeller.
16. CASH & CASH EQUIVALENTS 2012R
2011R
Bank current accounts – Main Account 13 778 328 61 361 816
- Financial Support Account 31 305 052 11 999 856
Mafisa funds 8 988 718 11 112 073
Cash on hand 43 000 43 000
54 115 098 84 516 746
Cash at bank earns interest at floating rates based on daily bank deposit rates.
14. OTHER INVESTMENTS 2012R
2011R
Transfer of asset 55 000 000 -
Acquisition of shares in a private company 20 000 000 -
Net amount outstanding at 31 March 2012 75 000 000 -
In line with the objectives of the entity, the Department transferred an investment in Wakegem (Pty) Limited with a cost value of R55 000 000. During the financial year, the entity further injected R20 000 000 into the investment. The equity transfer was in the process of being concluded at year end.
NOTES TO THE ANNUAL FINANCIAL STATEMENTS (CONTINUED…)FOR THE YEAR ENDED 31 MARCH 2012
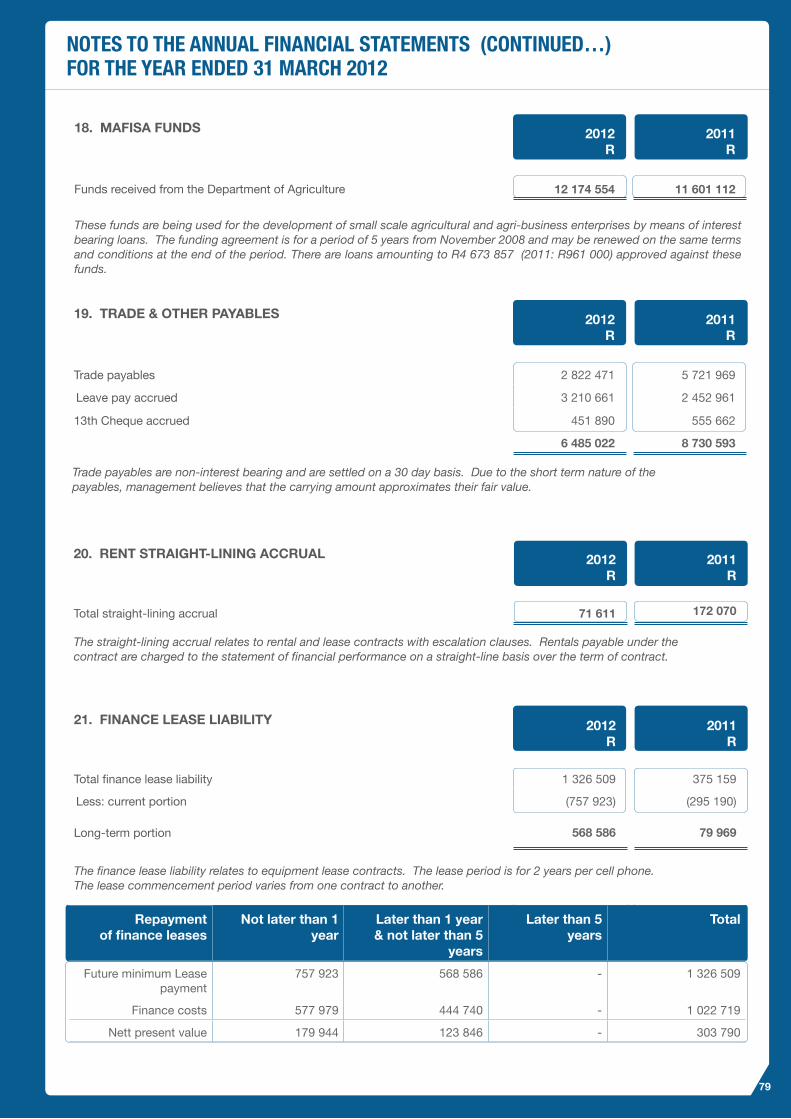
79
18. MAFISA FUNDS 2012R
2011R
Funds received from the Department of Agriculture 12 174 554 11 601 112
These funds are being used for the development of small scale agricultural and agri-business enterprises by means of interest bearing loans. The funding agreement is for a period of 5 years from November 2008 and may be renewed on the same terms and conditions at the end of the period. There are loans amounting to R4 673 857 (2011: R961 000) approved against these funds.
20. RENT STRAIGHT-LINING ACCRUAL 2012R
2011R
Total straight-lining accrual 71 611 172 070
The straight-lining accrual relates to rental and lease contracts with escalation clauses. Rentals payable under the contract are charged to the statement of financial performance on a straight-line basis over the term of contract.
19. TRADE & OTHER PAYABLES 2012R
2011R
Trade payables 2 822 471 5 721 969
Leave pay accrued 3 210 661 2 452 961
13th Cheque accrued 451 890 555 662
6 485 022 8 730 593
Trade payables are non-interest bearing and are settled on a 30 day basis. Due to the short term nature of the payables, management believes that the carrying amount approximates their fair value.
21. FINANCE LEASE LIABILITY 2012R
2011R
Total finance lease liability 1 326 509 375 159
Less: current portion (757 923) (295 190)
Long-term portion 568 586 79 969
The finance lease liability relates to equipment lease contracts. The lease period is for 2 years per cell phone. The lease commencement period varies from one contract to another.
Repayment of finance leases
Not later than 1 year
Later than 1 year & not later than 5
years
Later than 5 years
Total
Future minimum Lease payment
757 923 568 586 - 1 326 509
Finance costs 577 979 444 740 - 1 022 719
Nett present value 179 944 123 846 - 303 790
NOTES TO THE ANNUAL FINANCIAL STATEMENTS (CONTINUED…)FOR THE YEAR ENDED 31 MARCH 2012

80
22. CONTINGENT LIABILITES
SERVICE PROVIDERSIn addition to the commitments noted under note 23, the entity has entered into a contract with a service provider which could lead to program expenses amounting to R30m being incurred in the next financial year. This is dependent upon the successful delivery of the stated outcomes as per the agreement. This will be funded by a transfer of funds from the Department of Economic Development.
23. COMMITMENTS 2012R
2011R
OPERATING LEASESAt the statement of financial position date, the entity had outstanding commitments under non-cancellable operating leases, which fall due as follows :
Within one year 1 157 631 2 111 575
Between two and five years 3 458 399 316 606
After five years - -
4 616 030 2 428 181
Operating lease payments represent rentals payable for the use of the office properties and equipment. Leases escalate at rates between 5% and 8% per annum. Leases are in operation for 3 regional offices. Leases for premises without current lease agreements are in the process of being renegotiated.
CONTRACTS CONCLUDED BEFORE YEAR END 2012R
2011R
Certain contracts were entered into during the year for the provision
of services.
At the 31st March, the outstanding commitment for contracts in progress amounted to:
Approved and contracted 45 705 958 37 007 520
45 705 958 37 007 520
NOTES TO THE ANNUAL FINANCIAL STATEMENTS (CONTINUED…)FOR THE YEAR ENDED 31 MARCH 2012

81
DETAILS OF CONTRACTS IN FORCE AT 31 MARCH 2012 2012R
2011R
Financial Support loans approved but not yet paid 32 244 352 20 162 468
Business Development Support 4 601 425 2 587 906
Service providers not yet paid for goods and services delivered 2 833 722 5 548 138
Township Business Renewal 2 554 443 2 169 903
Orders placed but goods or services not delivered 1 468 077 -
Plato Project and training 884 446 -
Product Development Project 524 088 -
Capacity Training 253 617 -
Aftercare Program 206 288 -
Co-operative Support & Incubation 85 500 -
Sponsorships 50 000 -
Customer Satisfaction Survey - 710 470
Publicity Campaigns - 1 063 942
Diagnostic Tool - 136 914
Finance Model - 132 000
Service Provider Accreditation - 847 800
Co-operatives Training - 997 500
Capacity Training Manual - 150 480
Sedichem - 1 000 000
GEP Business Remodelling - 1 500 000
45 705 958 37 007 520
24. IRREGULAR ExPENDITURE 2012R
2011R
During the year under review expenditure amounting to R32 105 085 (2011:
Rnil) was spent in an irregular manner as defined by the PFMA of 1999, as
amended. The details are as follows:
Details of the irregular expenditure:
1. Non compliance with supply chain laws and regulations 32 034 699 -
2. Employees acted in higher vacant posts for an uninterrupted period exceeding 12 months
70 385 -
25. UNAUTHORISED ExPENDITURE
There was no unauthorized expenditure noted for the financial year under review.
NOTES TO THE ANNUAL FINANCIAL STATEMENTS (CONTINUED…)FOR THE YEAR ENDED 31 MARCH 2012
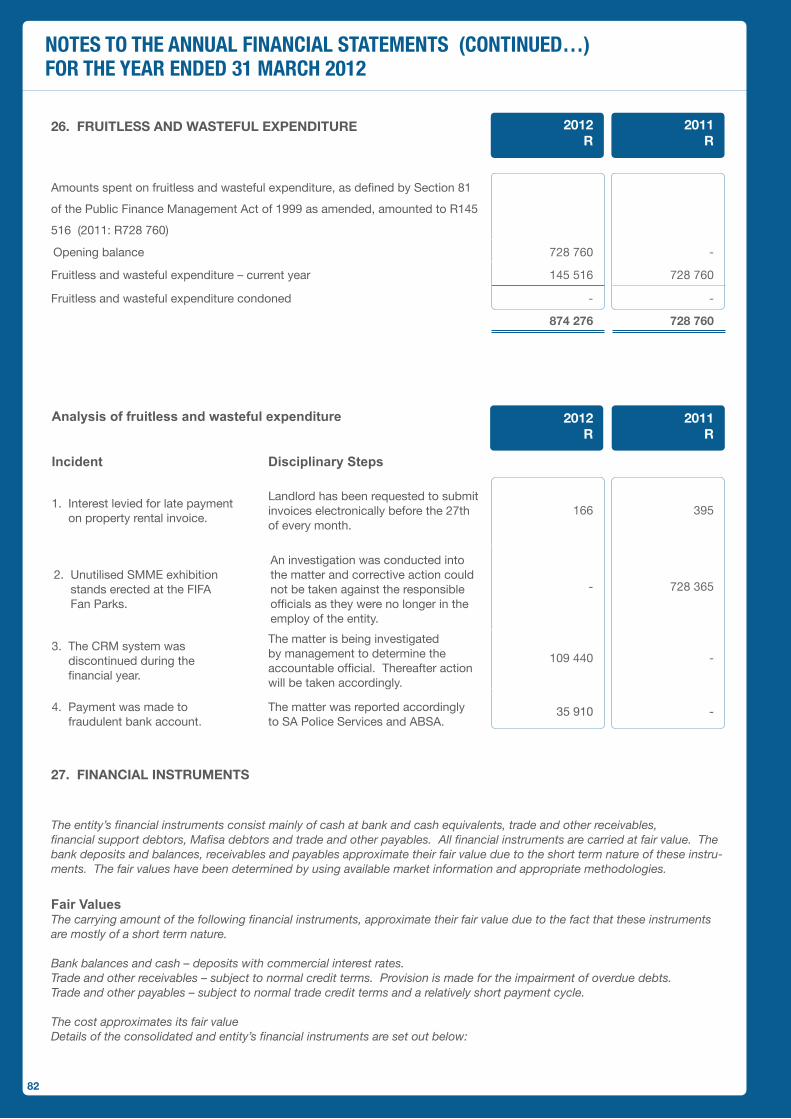
82
27. FINANCIAL INSTRUMENTS11R
The entity’s financial instruments consist mainly of cash at bank and cash equivalents, trade and other receivables, financial support debtors, Mafisa debtors and trade and other payables. All financial instruments are carried at fair value. The bank deposits and balances, receivables and payables approximate their fair value due to the short term nature of these instru-ments. The fair values have been determined by using available market information and appropriate methodologies.
Fair ValuesThe carrying amount of the following financial instruments, approximate their fair value due to the fact that these instruments are mostly of a short term nature.
Bank balances and cash – deposits with commercial interest rates.Trade and other receivables – subject to normal credit terms. Provision is made for the impairment of overdue debts. Trade and other payables – subject to normal trade credit terms and a relatively short payment cycle.
The cost approximates its fair valueDetails of the consolidated and entity’s financial instruments are set out below:
Analysis of fruitless and wasteful expenditure 2012R
2011R
Incident Disciplinary Steps
1. Interest levied for late payment on property rental invoice.
Landlord has been requested to submit invoices electronically before the 27th of every month.
166 395
2. Unutilised SMME exhibition stands erected at the FIFA Fan Parks.
An investigation was conducted into the matter and corrective action could not be taken against the responsible officials as they were no longer in the employ of the entity.
- 728 365
3. The CRM system was discontinued during the financial year.
The matter is being investigated by management to determine the accountable official. Thereafter action will be taken accordingly.
109 440 -
4. Payment was made to fraudulent bank account.
The matter was reported accordingly to SA Police Services and ABSA.
35 910 -
26. FRUITLESS AND WASTEFUL ExPENDITURE 2012R
2011R
Amounts spent on fruitless and wasteful expenditure, as defined by Section 81
of the Public Finance Management Act of 1999 as amended, amounted to R145
516 (2011: R728 760)
Opening balance 728 760 -
Fruitless and wasteful expenditure – current year 145 516 728 760
Fruitless and wasteful expenditure condoned - -
874 276 728 760
NOTES TO THE ANNUAL FINANCIAL STATEMENTS (CONTINUED…)FOR THE YEAR ENDED 31 MARCH 2012
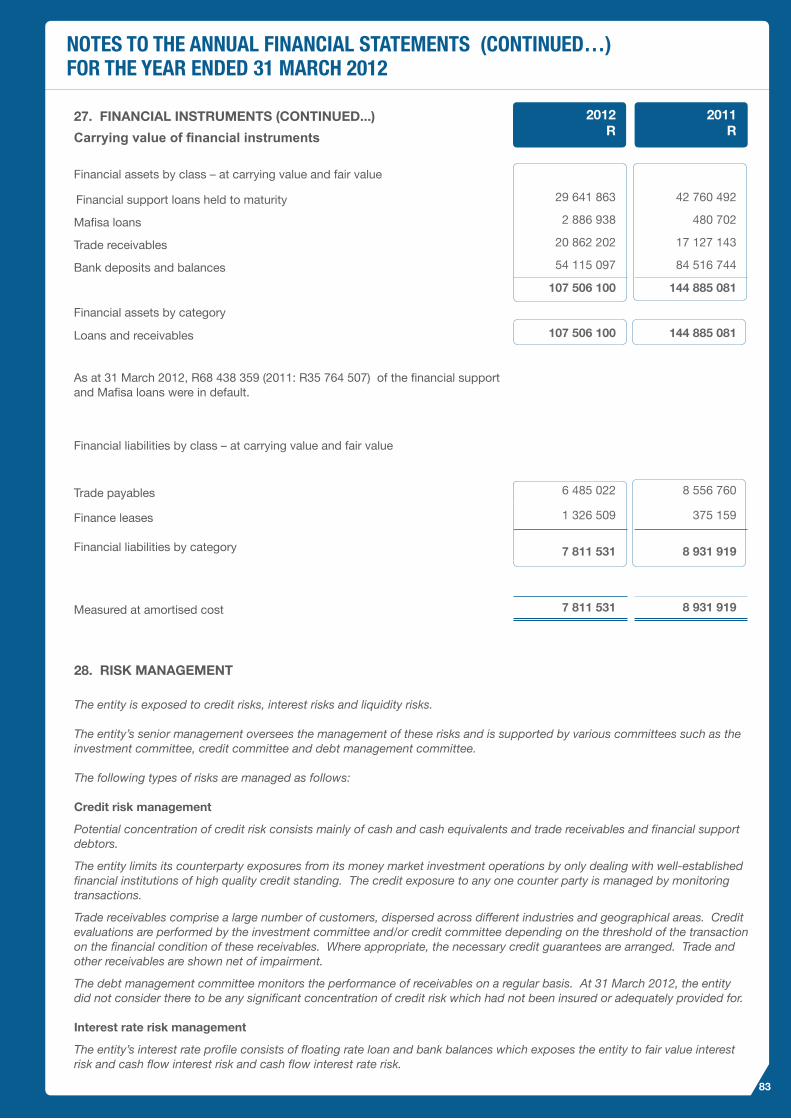
83
27. FINANCIAL INSTRUMENTS (CONTINUED...)
Carrying value of financial instruments2012
R2011
R
Financial assets by class – at carrying value and fair value
Financial support loans held to maturity 29 641 863 42 760 492
Mafisa loans 2 886 938 480 702
Trade receivables 20 862 202 17 127 143
Bank deposits and balances 54 115 097 84 516 744
107 506 100 144 885 081
Financial assets by category
Loans and receivables 107 506 100 144 885 081
As at 31 March 2012, R68 438 359 (2011: R35 764 507) of the financial support and Mafisa loans were in default.
Financial liabilities by class – at carrying value and fair value
Trade payables 6 485 022 8 556 760
Finance leases 1 326 509 375 159
Financial liabilities by category 7 811 531 8 931 919
Measured at amortised cost 7 811 531 8 931 919
28. RISK MANAGEMENT
The entity is exposed to credit risks, interest risks and liquidity risks.
The entity’s senior management oversees the management of these risks and is supported by various committees such as the investment committee, credit committee and debt management committee.
The following types of risks are managed as follows:
Credit risk management
Potential concentration of credit risk consists mainly of cash and cash equivalents and trade receivables and financial support debtors.
The entity limits its counterparty exposures from its money market investment operations by only dealing with well-established financial institutions of high quality credit standing. The credit exposure to any one counter party is managed by monitoring transactions.
Trade receivables comprise a large number of customers, dispersed across different industries and geographical areas. Credit evaluations are performed by the investment committee and/or credit committee depending on the threshold of the transaction on the financial condition of these receivables. Where appropriate, the necessary credit guarantees are arranged. Trade and other receivables are shown net of impairment.
The debt management committee monitors the performance of receivables on a regular basis. At 31 March 2012, the entity did not consider there to be any significant concentration of credit risk which had not been insured or adequately provided for.
Interest rate risk management
The entity’s interest rate profile consists of floating rate loan and bank balances which exposes the entity to fair value interest risk and cash flow interest risk and cash flow interest rate risk.
NOTES TO THE ANNUAL FINANCIAL STATEMENTS (CONTINUED…)FOR THE YEAR ENDED 31 MARCH 2012
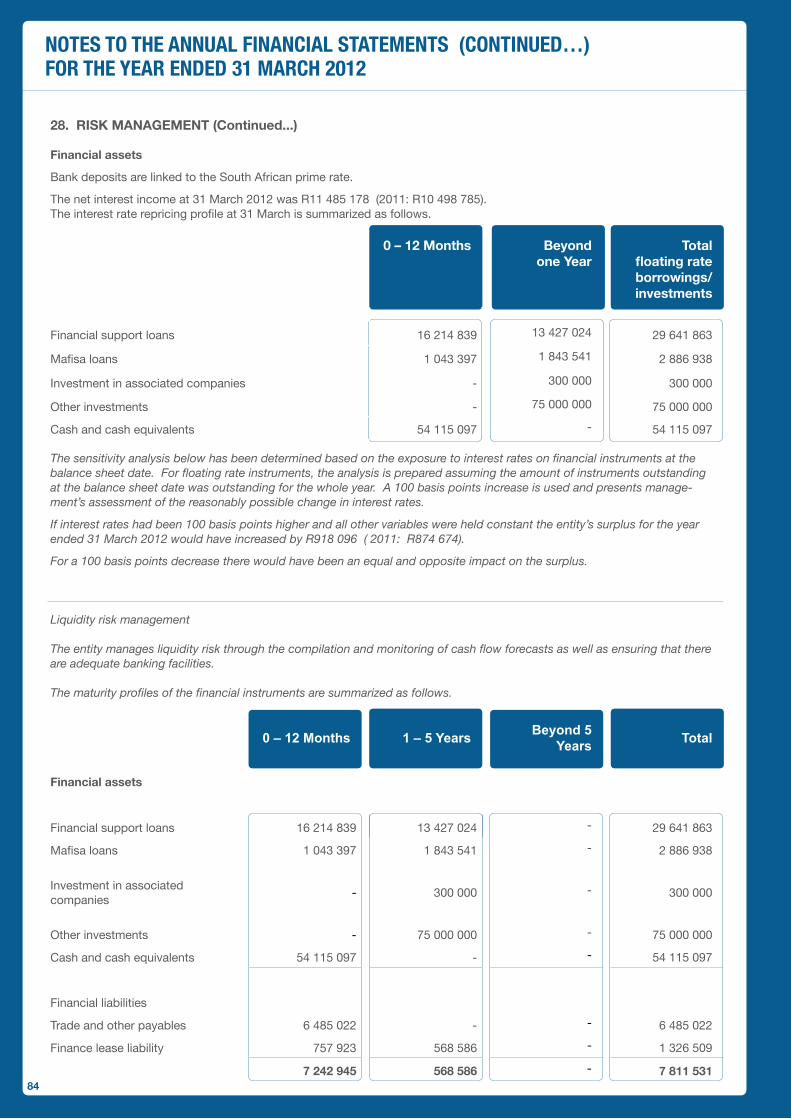
84
28. RISK MANAGEMENT (Continued...)
Financial assets
Bank deposits are linked to the South African prime rate.
The net interest income at 31 March 2012 was R11 485 178 (2011: R10 498 785). The interest rate repricing profile at 31 March is summarized as follows.
0 – 12 Months Beyond one Year
Total floating rate borrowings/ investments
Financial support loans 16 214 839 13 427 024 29 641 863
Mafisa loans 1 043 397 1 843 541 2 886 938
Investment in associated companies - 300 000 300 000
Other investments - 75 000 000 75 000 000
Cash and cash equivalents 54 115 097 - 54 115 097
The sensitivity analysis below has been determined based on the exposure to interest rates on financial instruments at the balance sheet date. For floating rate instruments, the analysis is prepared assuming the amount of instruments outstanding at the balance sheet date was outstanding for the whole year. A 100 basis points increase is used and presents manage-ment’s assessment of the reasonably possible change in interest rates.
If interest rates had been 100 basis points higher and all other variables were held constant the entity’s surplus for the year ended 31 March 2012 would have increased by R918 096 ( 2011: R874 674).
For a 100 basis points decrease there would have been an equal and opposite impact on the surplus.
Liquidity risk management
The entity manages liquidity risk through the compilation and monitoring of cash flow forecasts as well as ensuring that there are adequate banking facilities.
The maturity profiles of the financial instruments are summarized as follows.
0 – 12 Months 1 – 5 Years Beyond 5 Years Total
Financial assets
Financial support loans 16 214 839 13 427 024 - 29 641 863
Mafisa loans 1 043 397 1 843 541 - 2 886 938
Investment in associated companies
- 300 000 - 300 000
Other investments - 75 000 000 - 75 000 000
Cash and cash equivalents 54 115 097 - - 54 115 097
Financial liabilities
Trade and other payables 6 485 022 - - 6 485 022
Finance lease liability 757 923 568 586 - 1 326 509
7 242 945 568 586 - 7 811 531
NOTES TO THE ANNUAL FINANCIAL STATEMENTS (CONTINUED…)FOR THE YEAR ENDED 31 MARCH 2012
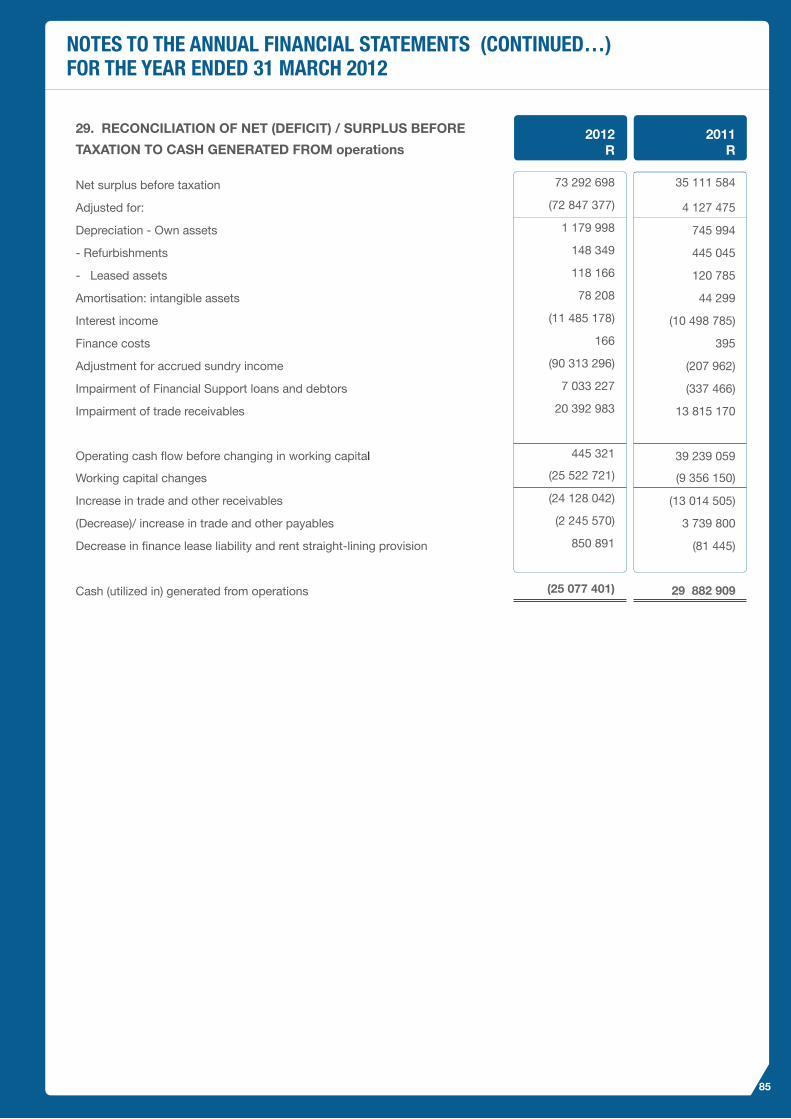
85
29. RECONCILIATION OF NET (DEFICIT) / SURPLUS BEFORE
TAxATION TO CASH GENERATED FROM operations 2012
R2011
R
Net surplus before taxation 73 292 698 35 111 584
Adjusted for: (72 847 377) 4 127 475
Depreciation - Own assets 1 179 998 745 994
- Refurbishments 148 349 445 045
- Leased assets 118 166 120 785
Amortisation: intangible assets 78 208 44 299
Interest income (11 485 178) (10 498 785)
Finance costs 166 395
Adjustment for accrued sundry income (90 313 296) (207 962)
Impairment of Financial Support loans and debtors 7 033 227 (337 466)
Impairment of trade receivables 20 392 983 13 815 170
Operating cash flow before changing in working capital 445 321 39 239 059
Working capital changes (25 522 721) (9 356 150)
Increase in trade and other receivables (24 128 042) (13 014 505)
(Decrease)/ increase in trade and other payables (2 245 570) 3 739 800
Decrease in finance lease liability and rent straight-lining provision 850 891 (81 445)
Cash (utilized in) generated from operations (25 077 401) 29 882 909
NOTES TO THE ANNUAL FINANCIAL STATEMENTS (CONTINUED…)FOR THE YEAR ENDED 31 MARCH 2012
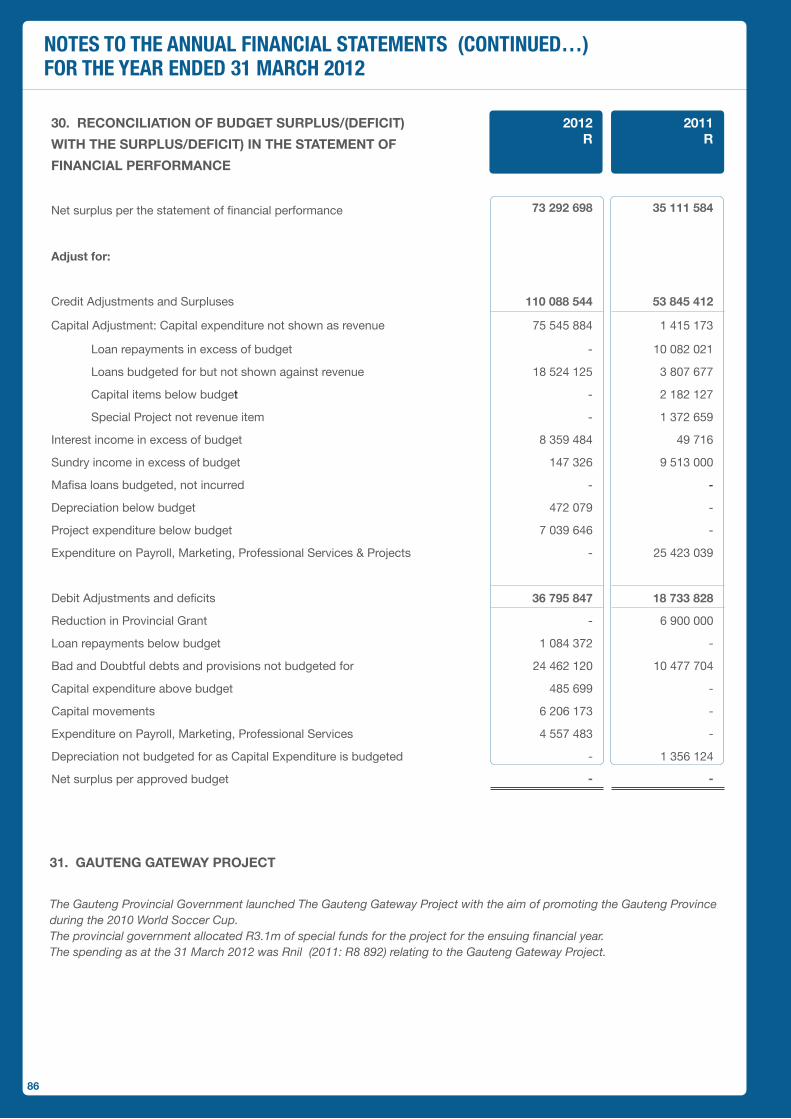
86
30. RECONCILIATION OF BUDGET SURPLUS/(DEFICIT)
WITH THE SURPLUS/DEFICIT) IN THE STATEMENT OF
FINANCIAL PERFORMANCE
2012R
2011R
Net surplus per the statement of financial performance 73 292 698 35 111 584
Adjust for:
Credit Adjustments and Surpluses 110 088 544 53 845 412
Capital Adjustment: Capital expenditure not shown as revenue 75 545 884 1 415 173
Loan repayments in excess of budget - 10 082 021
Loans budgeted for but not shown against revenue 18 524 125 3 807 677
Capital items below budget - 2 182 127
Special Project not revenue item - 1 372 659
Interest income in excess of budget 8 359 484 49 716
Sundry income in excess of budget 147 326 9 513 000
Mafisa loans budgeted, not incurred - -
Depreciation below budget 472 079 -
Project expenditure below budget 7 039 646 -
Expenditure on Payroll, Marketing, Professional Services & Projects - 25 423 039
Debit Adjustments and deficits 36 795 847 18 733 828
Reduction in Provincial Grant - 6 900 000
Loan repayments below budget 1 084 372 -
Bad and Doubtful debts and provisions not budgeted for 24 462 120 10 477 704
Capital expenditure above budget 485 699 -
Capital movements 6 206 173 -
Expenditure on Payroll, Marketing, Professional Services 4 557 483 -
Depreciation not budgeted for as Capital Expenditure is budgeted - 1 356 124
Net surplus per approved budget - -
31. GAUTENG GATEWAY PROjECT
The Gauteng Provincial Government launched The Gauteng Gateway Project with the aim of promoting the Gauteng Province during the 2010 World Soccer Cup.The provincial government allocated R3.1m of special funds for the project for the ensuing financial year.The spending as at the 31 March 2012 was Rnil (2011: R8 892) relating to the Gauteng Gateway Project.
NOTES TO THE ANNUAL FINANCIAL STATEMENTS (CONTINUED…)FOR THE YEAR ENDED 31 MARCH 2012

87
34. EMPLOYEE BENEFIT ExPENDITURE 2012R
2011R
Salaries 37 779 201 32 256 561
Leave Gratuity 1 546 278 1 789 565
Bonus 1 691 531 2 704 682
Acting Allowance 647 004 220 778
Medical and retirement funds 5 305 504 4 937 240
UIF & SDL Levies 580 291 512 524
Employee care 69 428 111 413
47 646 317 42 532 762
35.1 LOANS RECEIVABLE FROM RELATED PARTIES 2012R
2011R
Watoto Investments (Pty) Ltd 300 000 300 000
Net loans receivable from related parties 300 000 300 000
33. MEDICAL AID INFORMATION
Permanent employees are normally members of an independent medical aid fund. The entity has no post retirement obligations for medical aid benefits.
32. RETIREMENT BENEFIT INFORMATION
It is the policy of the entity to encourage, facilitate and contribute to the provision of retirement benefits for all permanent employees. To this end the entity’s permanent employees are required to be members of an independently administered provident fund.
Defined-contribution plans
The total cost charged to the Statement of Financial Performance of R3 255 122 (2011: R3 049 902) represents contributions payable to those schemes by the entity at rates specified in the rules of the schemes. The entity has no post retirement obligations for retirement benefits.
35. RELATED PARTY TRANSACTIONS
Principal related parties
Related Party: Country of Incorporation: Nature of Relationship:
Watoto Kidswear (Pty) Ltd South Africa AssociateDepartment of Economic Development South Africa Government DepartmentDepartment of Agriculture South Africa Government DepartmentWakegem (Pty) Limited South Africa Investee
The Gauteng Enterprise Propeller is a listed provincial public entity and therefore is also a related party to other provincial state-controlled entities.
NOTES TO THE ANNUAL FINANCIAL STATEMENTS (CONTINUED…)FOR THE YEAR ENDED 31 MARCH 2012
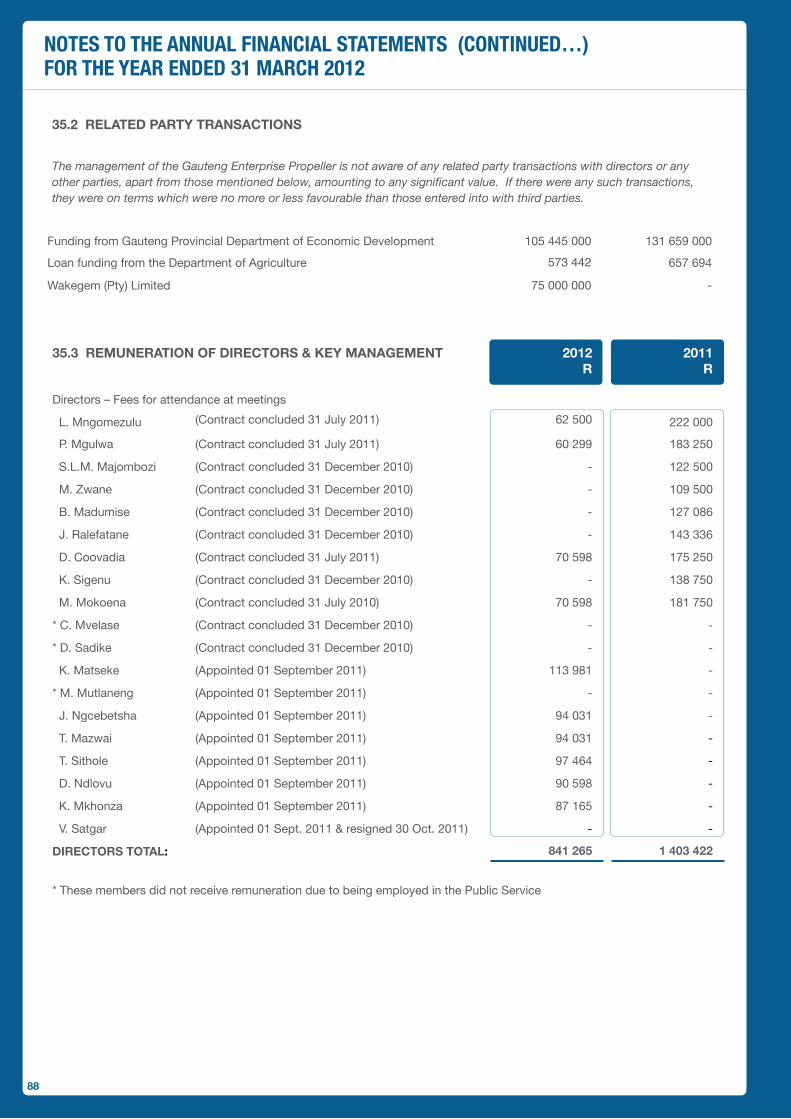
88
35.2 RELATED PARTY TRANSACTIONS
The management of the Gauteng Enterprise Propeller is not aware of any related party transactions with directors or any other parties, apart from those mentioned below, amounting to any significant value. If there were any such transactions, they were on terms which were no more or less favourable than those entered into with third parties.
Funding from Gauteng Provincial Department of Economic Development 105 445 000 131 659 000
Loan funding from the Department of Agriculture 573 442 657 694
Wakegem (Pty) Limited 75 000 000 -
35.3 REMUNERATION OF DIRECTORS & KEY MANAGEMENT 2012R
2011R
Directors – Fees for attendance at meetings
L. Mngomezulu (Contract concluded 31 July 2011) 62 500 222 000
P. Mgulwa (Contract concluded 31 July 2011) 60 299 183 250
S.L.M. Majombozi (Contract concluded 31 December 2010) - 122 500
M. Zwane (Contract concluded 31 December 2010) - 109 500
B. Madumise (Contract concluded 31 December 2010) - 127 086
J. Ralefatane (Contract concluded 31 December 2010) - 143 336
D. Coovadia (Contract concluded 31 July 2011) 70 598 175 250
K. Sigenu (Contract concluded 31 December 2010) - 138 750
M. Mokoena (Contract concluded 31 July 2010) 70 598 181 750
* C. Mvelase (Contract concluded 31 December 2010) - -
* D. Sadike (Contract concluded 31 December 2010) - -
K. Matseke (Appointed 01 September 2011) 113 981 -
* M. Mutlaneng (Appointed 01 September 2011) - -
J. Ngcebetsha (Appointed 01 September 2011) 94 031 -
T. Mazwai (Appointed 01 September 2011) 94 031 -
T. Sithole (Appointed 01 September 2011) 97 464 -
D. Ndlovu (Appointed 01 September 2011) 90 598 -
K. Mkhonza (Appointed 01 September 2011) 87 165 -
V. Satgar (Appointed 01 Sept. 2011 & resigned 30 Oct. 2011) - -
DIRECTORS TOTAL: 841 265 1 403 422
* These members did not receive remuneration due to being employed in the Public Service
NOTES TO THE ANNUAL FINANCIAL STATEMENTS (CONTINUED…)FOR THE YEAR ENDED 31 MARCH 2012

89
35.3 REMUNERATION OF DIRECTORS & KEY MANAGEMENT
(Continued...)
2012R
2011R
Audit Committee Members:
H. Moolla (Contract concluded 31 December 2010) - 16 250
T. Moja (Contract concluded 31 December 2010) - 16 250
L. Mothibi (Contract concluded 31 July 2011) 10 299 -
M. Manyama-Matome (Resigned 19 July 2011) 3 433 -
N. Sandlana (Appointed 01 February 2012) 20 366 -
N. Mcambi (Appointed 01 February 2012) 20 366 -
L. Madavha (Appointed 01 February 2012) 20 366 -
Committee Members Total: 74 830 32 500
TOTAL PAID TO DIRECTORS: 916 095 1 435 922
SENIOR MANAGEMENT SALARY ACTING ALLOW
ANCE
BONUS LEAVE PAY
SETTLE-MENTS
TOTALS
D. Morobe – Chief Executive Officer 1 070 984 - - 285 037 882 291 2 238 312
P. Twala-Tau – Chief Executive Officer
181 083 - - - - 181 083
T. Ngqobe – Chief Operating Officer
1 644 116 357 803 88 209 - - 2 090 128
L. Fosu – Acting Chief Financial Officer
47 618 - - 6 404 - 54 022
L. Sithole – Chief Financial Officer
931 683 23 535 39 960 - - 995 178
P. Sithole – Gen. Man. Financial Support
828 202 53 327 106 474 - 988 003
C. Potgieter – Gen. Man. Enterprise Supp
248 305 - - 114 160 - 362 465
K. Modise – Gen. Man. Enterprise Supp.
985 228 28 886 57 771 - - 1 071 885
M. Maduna – Exec. Man. Regional Ops.
824 442 - 40 863 - - 865 305
L. Mphai – Exec. Man. Human Resources
629 304 - 46 437 71 435 232 186 979 362
T. Mgulwa – Act. Exc. Man. Marketing
350 517 39 258 - 69 451 81 550 540 776
K. Onuoka – Company Secretary
281 612 - - - - 281 612
L. Kwapeng – Exc. Man: Office of CEO
822 585 - 44 132 - 866 717
M. Benjamin – Act. Exec: IT & Facilities
205 030 37 856 23 295 - 266 181
TOTAL EMOLUMENTS 9 050 709 487 338 370 699 676 256 1 196 02 11 781 029
NOTES TO THE ANNUAL FINANCIAL STATEMENTS (CONTINUED…)FOR THE YEAR ENDED 31 MARCH 2012
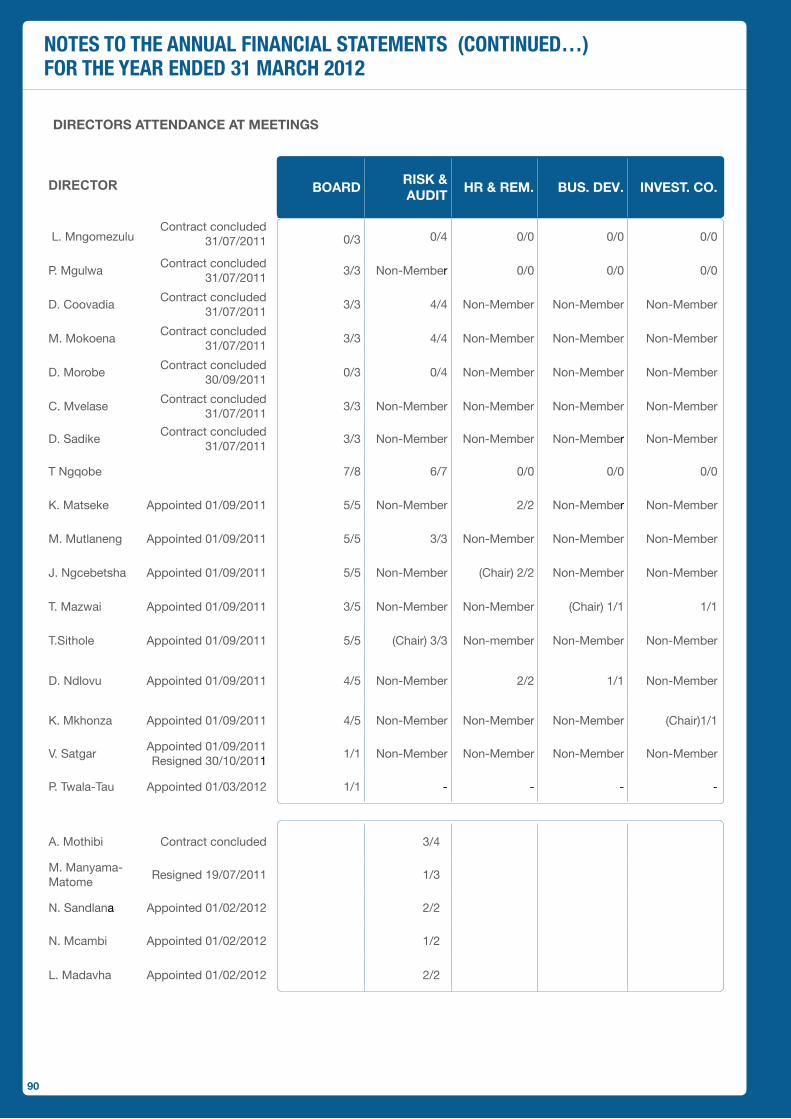
90
DIRECTORS ATTENDANCE AT MEETINGS
DIRECTOR BOARDRISK & AUDIT
HR & REM. BUS. DEV. INVEST. CO.
L. MngomezuluContract concluded
31/07/2011 0/3 0/4 0/0 0/0 0/0
P. MgulwaContract concluded
31/07/20113/3 Non-Member 0/0 0/0 0/0
D. CoovadiaContract concluded
31/07/20113/3 4/4 Non-Member Non-Member Non-Member
M. Mokoena Contract concluded
31/07/20113/3 4/4 Non-Member Non-Member Non-Member
D. MorobeContract concluded
30/09/20110/3 0/4 Non-Member Non-Member Non-Member
C. MvelaseContract concluded
31/07/20113/3 Non-Member Non-Member Non-Member Non-Member
D. SadikeContract concluded
31/07/20113/3 Non-Member Non-Member Non-Member Non-Member
T Ngqobe 7/8 6/7 0/0 0/0 0/0
K. Matseke Appointed 01/09/2011 5/5 Non-Member 2/2 Non-Member Non-Member
M. Mutlaneng Appointed 01/09/2011 5/5 3/3 Non-Member Non-Member Non-Member
J. Ngcebetsha Appointed 01/09/2011 5/5 Non-Member (Chair) 2/2 Non-Member Non-Member
T. Mazwai Appointed 01/09/2011 3/5 Non-Member Non-Member (Chair) 1/1 1/1
T.Sithole Appointed 01/09/2011 5/5 (Chair) 3/3 Non-member Non-Member Non-Member
D. Ndlovu Appointed 01/09/2011 4/5 Non-Member 2/2 1/1 Non-Member
K. Mkhonza Appointed 01/09/2011 4/5 Non-Member Non-Member Non-Member (Chair)1/1
V. SatgarAppointed 01/09/2011 Resigned 30/10/2011
1/1 Non-Member Non-Member Non-Member Non-Member
P. Twala-Tau Appointed 01/03/2012 1/1 - - - -
A. Mothibi Contract concluded 3/4
M. Manyama-Matome
Resigned 19/07/2011 1/3
N. Sandlana Appointed 01/02/2012 2/2
N. Mcambi Appointed 01/02/2012 1/2
L. Madavha Appointed 01/02/2012 2/2
NOTES TO THE ANNUAL FINANCIAL STATEMENTS (CONTINUED…)FOR THE YEAR ENDED 31 MARCH 2012

91
36. DETAILED INCOME STATEMENT 2012R
2011R
REVENUE:
Grants from Province 105 445 000 131 659 000
Transfer from Department 20 000 000 -
Transfer of assets 55 000 000 -
Rolled over income 35 111 584 -
Training fees 51 513 97 800
Interest received 11 485 178 10 498 785
Bad debts recovered - 17 132
VAT recovery - 49 891
SETA subsidy 90 443 94 982
Sundry income 121 015 223 160
Insurance claims received 71 717 46 751
TOTAL REVENUE 227 376 449 142 687 501
ExPENSES:
Advertising promotion and marketing 1 654 393 1 545 447
Airfares and travelling costs 54 043 252 363
Amortisation – intangible assets 78 208 44 299
Bank charges 19 273 17 424
Board meetings 21 031 59 501
Board members remuneration 916 095 1 435 922
Bursaries 716 482 153 064
Courier services 251 624 329 072
Depreciation - Own assets
1 179 998 745 995
- Leasehold improvements 148 349 445 045
- Leased assets 118 166 120 785
Entertainment 350 149 261 449
External audit fees 897 580 501 311
Finance costs 166 395
Forensic audit fees 356 369 775 782
Gateway - 1 895 618
Impairment of trade receivables 20 392 983 13 815 170
Insurance 409 509 336 814
Internal audit fees 1 124 858 955 870
IT related costs 1 310 407 799 249
Legal expenses 175 692 893 649
Library maintenance 196 044 73 298
Maintenance of software 146 747 672 559
Maintenance equipment and premises 840 884 744 473
Office rent and utilities 7 962 924 6 280 039
Office equipment rental 68 607 102 839
NOTES TO THE ANNUAL FINANCIAL STATEMENTS (CONTINUED…)FOR THE YEAR ENDED 31 MARCH 2012

92
36. DETAILED INCOME STATEMENT (CONTINUED...) 2012R
2011R
Printing and stationery 928 839 685 879
Professional services 1 995 451 3 418 953
Provision against loans 7 033 227 (337 466)
Recruitment 1 066 974 184 114
Severance pay 246 216 -
SMME Business Development Support 46 286 789 17 437 610
SMME Product Development 4 297 612 343 193
SMME Research and Development 273 174 82 762
SMME Seminars and training 636 055 5 086 549
SMME Sponsorships 524 714 534 696
Staff Salaries 47 646 317 42 532 762
Staff training 825 829 1 332 499
Telephone and cell phones 2 137 222 2 230 543
Travel reimbursement 725 134 755 420
Vehicle running costs 69 620 30 969
TOTAL ExPENSES 154 083 752 107 575 917
NET SURPLUS FOR THE YEAR 73 292 698 35 111 584
*This supplementary schedule does not form part of the audited annual financial statements.
NOTES TO THE ANNUAL FINANCIAL STATEMENTS (CONTINUED…)FOR THE YEAR ENDED 31 MARCH 2012

93
37. WORLD CUP ExPENDITURE
QUANTITY 2012 2011
Tickets acquired
Distribution of tickets
Clients/Stakeholders - - -
Accounting Authority
Executive - - -
Non-executive - - -
Accounting Officer - - -
Senior Management - - -
Other employees - - -
Family members of officials - - -
Other government entities - - -
Audit Committee members - - -
Other - - -
Total - - -
Travel costs
Clients/Stakeholders - - -
Accounting Authority - - -
Executive - - -
Non-executive - - -
Accounting Officer - - -
Senior Management - - -
Other employees - - -
Family members of officials - - -
Other government entities - - -
Audit Committee members - - -
Other - - -
Purchase of other world cup apparel
Specify the nature of the purchase(e.g. t-shirts, caps etc)
T-shirts and Vuvuzelas - - 8 892
Please specify - - 8 892
Total world cup expenditure - - 8 892
* This schedule is unaudited and does not form part of the audited annual financial statements.
NOTES TO THE ANNUAL FINANCIAL STATEMENTS (CONTINUED…)FOR THE YEAR ENDED 31 MARCH 2012

94
Notes

95
Notes

96
Notes

97
Notes

98
Head office6th Floor, 124 Main Street Marshalltown Johannesburg Tel: +27 11 085 2001 Fax: +27 11 388 4010
GaUteNG eNteRPRise PRoPeLLeR offices
ReGioNaL offices
JoHaNNesbURG
7th Floor, 124 Main Street Marshalltown Johannesburg Tel: +27 11 089 2002 Fax: +27 11 834 6702
tsHwaNe4th Floor, City Tower Building 221 Van der Walt Street Pretoria Central Tel: +27 12 323 4203/5 Fax: +27 12 323 4207
west RaNd 23 Eloff Street Krugersdorp Tel: +27 11 950 9870 Fax: +27 11 950 9886
sedibeNG1st Floor, GEP House 22 Hertz Boulevard Tel: +27 16 910 1200 Fax: +27 16 910 1216
ekURHULeNi188 Victoria Street Ground Floor Cnr Victoria & Spilsbury Germiston Tel: +27 11 821 2870 Fax: +27 11 821 2886
sateLLite offices
bRoNkHoRstsPRUitLazarus Building 43 Lanham Street Bronkhorstspruit Tel: +27 13 932 3828 Fax: +27 13 932 3829
MoHLakeNG3521 Ralerata Street Mohlakeng Tel: +27 11 414 1753 Fax: +27 11 692 4683
sPRiNGs21 Levsure House Cnr 5th Avenue & 8h Street Springs Tel: +27 11 362 4950 Fax: +27 11 362 5690
HeideLbeRG
Unit 34, PG Glass Building 52 Voortrekker Road Heidelberg Tel: +27 16 349 2658
Fax: +27 16 341 6206
soweto Maponya Mall Thusong Centre 2127 Chris Hani Road Soweto Tel: +27 11 938 4257
aLexaNdRa Alexsan Resource Centre Cnr Selbourne Street & 12th Avenue Alexandra Tel: +27 11 882 9672 / 4 Fax: +27 11 882 9678


AN
NU
AL
RE
PO
RT
201
1-
2012
Head Office
6th Floor, 124 Main Street, Marshalltown, Johannesburg, 2001
Tel: +27 11 085 2001, Fax: +27 11 388 4010 www.gep.co.za