2011 -2012 the association of independent kentucky ... · the association of independent kentucky...
TRANSCRIPT

AIKCU Economic Impact Estimate
1
The Association of Independent Kentucky Colleges and Universities (AIKCU) is composed of
twenty (20) non-public institutions of higher education. AIKCU member institutions directly
employ more than 7,000 employees, and pay salaries above the state average wage and salary.
These jobs are widely spread across the Commonwealth and can be characterized as being
economically, socially, and environmentally friendly. Additionally, AIKCU’s member colleges
and universities serve more than 36,000 students and play a critical role in Kentucky’s
postsecondary education system.
This economic estimate measures the operational annual economic impact value of AIKCU’s
member institutions. This economic impact estimate does not measure the economic and social
value of the students and alumni to the Commonwealth of Kentucky. The economic benefits,
which Kentucky receives from AIKCU’s member institutions operating in Kentucky, is
significant, adding $617 million to Kentucky’s state gross domestic product (GDP) annually.
These annual operational values recur each year. Based on the one-year (academic year 2011 -
2012) operational impact estimate, the AIKCU’s member institutions could easily add $6 billion
(cumulative) to Kentucky’s state GDP during a ten (10) year period. If the value of the AIKCU’s
member institutions’ alumni were to be added to this impact, then the impact would be
noticeably higher.
Uniqueness of the Economic and Social Impact
AIKCU’s member institutions vary from Kentucky’s public universities to Kentucky’s
Community and Technical College System (KCTCS) in how they cost and benefit the
Commonwealth. Kentucky’s public institutions of higher education receive funding from state
revenues. AIKCU’s member institutions do not receive direct state operational funds.
Additionally, Kentucky historically has utilized state revenue to assist in the creation of jobs in
the Commonwealth. Each year in Kentucky, several hundred new and existing businesses are
approved to receive state financial incentives for creating and retaining jobs in the state.
AIKCU’s member institutions provide both economic benefits and social benefits to Kentucky
without direct state appropriations for the operation of these institutions. This may make the
Annual Economic Impact Estimate
2011 -2012
The Association of Independent Kentucky Colleges and Universities
AIKCU
Frankfort, Kentucky
5/4/2014

AIKCU Economic Impact Estimate
2
AIKCU’s member institutions the one of the greatest economic and social bargain to the
residents and taxpayers of Kentucky.
Industries such as manufacturing and transportation tend to have a significant impact on the
environment and the state’s infrastructure. Air and water pollution tend to be externalities of
these types of industries, while at the same time they place a burden on the state’s infrastructure
(exempli gratia: heavy trucks put wear and tear on the highway system). Operationally,
AIKCU’s member institutions are friendly to the environment and to the state’s cost of
maintaining the state’s infrastructure.
Economic Impacts Not Measured in This Report
1. Perhaps the greatest benefit AIKCU’s member institutions provide for the state of
Kentucky is an economic impact not measured in this report. The impact of AIKCU’s
member institutions’ alumni has a tremendous effect across the spectrum of industries
doing business within the Commonwealth. Human capital is the most essential input for
any state’s economy, and Kentucky receives this benefit at little or no cost from the
alumni of these twenty (20) AIKCU’s member institutions. It can easily be expected that
wages, productivity, employment levels, business and industry recruitment, and state and
local taxes paid are each enhanced by the presence of the twenty (20) AIKCU’s member
institutions’ alumni.
2. Construction projects, which take place on the campuses of AIKCU’s member
institutions, generate non-recurring economic impacts, which generate jobs and pay
taxes.
3. Student spending beyond payments to AIKCU’s member institutions are not accounted
for in this report.
4. Research, federal and corporate grants, and community services provided by the
AIKCU’s member institutions have a true value to the state’s economy. However, the
results of research projects and the community service provided have not been calculated
in this study.
Input Data
The direct inputs for the economic impact estimates for the operational impact of Kentucky’s
AIKCU’s member institutions are listed in Table 1 (below). The member institutions are shown
in Table 2 (below), which is inclusive of total wages and employment.
Wage and salary benefits have been estimated at 30%. The benefit value for this industry sector
is derived from the United States Bureau of Economic Analysis Kentucky state average annual
wage benefit for educational services. The components of personal income benefits are inclusive
of employer contributions for employee pension and insurance funds (these consist of employer
payments to private and government employee retirement plans, private group health and life
insurance plans, privately administered workers' compensation plans, and supplemental
unemployment benefit plans) and of employer contributions for government social insurance.

AIKCU Economic Impact Estimate
3
The industry sectors utilized for the economic impact model are NAICS 6112 and 6113 (Private
junior colleges, colleges, universities, and professional schools).
Table 1: Direct Input Assumptions for the Economic Impact Estimate
Full &
Part-time
Employment
Total
Annual Payroll
Without
Benefits
Estimated
Benefits
Total
Annual
Payroll
With
Benefits
Annual
Average
Wage
Without
Benefits
Annual
Average
Wage
With
Benefit
7,037 $264,821,000 30% $344,300,000 $37,632 $48,920 The AIKCU Frankfort, Kentucky, has provided the employment and wage values, utilizing NCES
Integrated Postsecondary Education Data System (IPEDS) data sets.
The employment and wage values are for the academic year 2011 to 2012.
The employment and wage values are for AIKCU member institutions.
Table 2: Association of Independent Kentucky Colleges and Universities Wages and
Employment
Institution
Name
Total Expenses-
Salaries and Wages
Full-time
Employees
Part-time
Employees
Total
Employees
Alice Lloyd College $ 3,877,609 106 13 119
Asbury University $ 14,371,567 284 138 422
Bellarmine University $ 28,976,472 398 284 682
Berea College $ 30,582,087 428 90 518
Brescia University $ 4,728,771 124 52 176
Campbellsville University $ 16,837,382 360 326 686
Centre College $ 19,612,361 364 45 409
Georgetown College $ 15,552,290 314 98 412
Kentucky Christian University $ 5,059,395 100 31 131
Kentucky Wesleyan College $ 5,648,420 122 74 196
Lindsey Wilson College $ 16,697,384 379 169 548
Mid-Continent University $ 8,954,463 199 162 361
Midway College $ 11,280,469 207 114 321
Saint Catharine College $ 5,823,411 128 16 144
Spalding University $ 14,048,706 213 188 401
Thomas More College $ 10,547,593 182 115 297
Transylvania University $ 17,137,712 284 36 320
Union College $ 7,664,986 188 45 233
University of Pikeville $ 12,515,336 231 39 270
University of the Cumberlands $ 14,904,319 287 104 391
Totals $ 264,820,733 4,898 2,139 7,037 Source: NCES Integrated Postsecondary Education Data System (IPEDS) data sets. Salary and wage data is for
fiscal 2011-12. Employee data is for fall 2011.

AIKCU Economic Impact Estimate
4
Economic Impact Operational Estimate
(These impacts occur annually within the state of Kentucky)
The comprehensive estimate of AIKCU’s member institutions’ economic impact will combine
direct, indirect, and induced economic effects. These economic impacts have been segmented as
follows:
Direct Effects: Direct effects are the initial employment and wage impacts of AIKCU’s member
institutions, id est, the direct employment of faculty and staff.
Monies spent by the AIKCU’s member institutions directly flow into the salaries of 4,898 full-
time faculty and staff and 2,139 part-time faculty and staff. Total direct wages of $265 million
were paid during the 2011 – 2012 academic year. Total direct wages inclusive of benefits during
this academic year were $344 million. The average annual wage (inclusive of benefits) is
$48,920 (full and part-time combined average). The direct GDP impact is estimated at $344
million (annual).
Indirect Effects: This involves AIKCU’s member institutions purchasing goods and services
from other Kentucky businesses and industries. These recirculating dollars go on to support the
employment of suppliers of goods and services to AIKCU’s member institutions. These dollars
continue to circulate further into Kentucky’s economy as businesses owners and employees
spend their wages in the state’s economy (induced effect below). An estimated indirect 1,166
Kentucky jobs exist due to the operation of the AIKCU’s member institutions. These industries
may consist of food services, building maintenance/repair, employment services, computer
related services, wholesale trade, waste management, telecommunications, utilities, air
transportation, legal services, et cetera. Total indirect wages with benefits were more than $47
million. The average annual wage (inclusive of benefits) for those workers supporting the
AIKCU’s member institutions as suppliers of goods and services is $40,600 (estimate) annually.
Indirect Kentucky (GDP) was $102 million (estimate) during the 2011 – 2012 academic year.
Induced Effects: This involves the response by Kentucky’s economy to the AIKCU’s member
institutions, which occurs through re-spending of income received at the direct and induced
stages of the AIKCU’s member institutions operating within the Commonwealth. The induced
benefit is the result of direct AIKCU faculty and staff and the indirect jobs of the suppliers of
goods and services to the AIKCU’s member institutions spending money as consumers in
Kentucky’s economy.
This money is recirculated through the household spending patterns, causing further local
economic activity. An estimated induced 2,231 Kentucky jobs exist due to the operation of the
AIKCU’s member institutions. New jobs created in the areas of food services, plumbing,
medical/dental care, barbershops, clothing sales, police & fire protection, lawn care, legal
services, financial services, real estate, merchandise stores, automobile dealers, and service
stations, et cetera, are due to the direct and indirect effects of the initial creation of jobs. Total
induced wages with benefits were $89 million. The average annual wage (inclusive of benefits)
is $39,370. Indirect Kentucky gross domestic product was $162 million. Induced Kentucky
(GDP) was $162 million (estimate) during the 2011 – 2012 academic year.

AIKCU Economic Impact Estimate
5
Total Economic Impact:
The value added to Kentucky’s economy on an annual operational basis by the AIKCU’s
member institutions indicates this to be one of Kentucky’s primary economic engines.
AIKCU’s member institutions direct employment of 7,037 (full and part-time) has the total
estimated operational (recurring) economic impact of
Creating 10,434 Kentucky jobs which pay an average of $45,950 per year (inclusive of
benefits); and
Generating $617 million in Kentucky GDP annually (2011-12);
o Approximately 0.4% of Kentucky’s total (GDP).
Table 3 breaks the operational economic impact into direct, indirect, induced, and total effects on
the state’s economy.
Table 3: Annual Operational Economic Impact Estimate for AIKCU Institutions
Impact Type Employment
Average Annual
Wage and Salary
(Inclusive of
Benefits)
Total Labor
Income
(Inclusive of
Benefits)
Gross Domestic
Product/
Value Added
Direct Effect 7,037 $ 48,920 $344,300,000 $354,100,000
Indirect Effect 1,166 $ 40,600 $47,300,000 $101,800,000
Induced Effect 2,231 $ 39,370 $87,800,000 $161,700,000
Total Effect 10,434 $ 45,950 $479,400,000 $617,600,000 Note: All economic impacts values occur within Kentucky.
Note: All impact values are annual.
Note: Totals may have variance due to rounding.
Note on Gross Domestic Product (Value Added): Gross Domestic Product is the value of new goods and
services added to the state’s economy. This varies from output, which may be characterized by spending
and/or the ultimate value of production. Output is often inclusive of economic values generated in other states
or countries and may not be a true measure of GDP for Kentucky.
Direct
72%
Indirect
10%
Induced
18%
Value Added to Kentucky's Economy by AIKCU’s Member Institutions
(Gross Domestic Product Estimate)
AIKCU Economic Impact Estimate
6
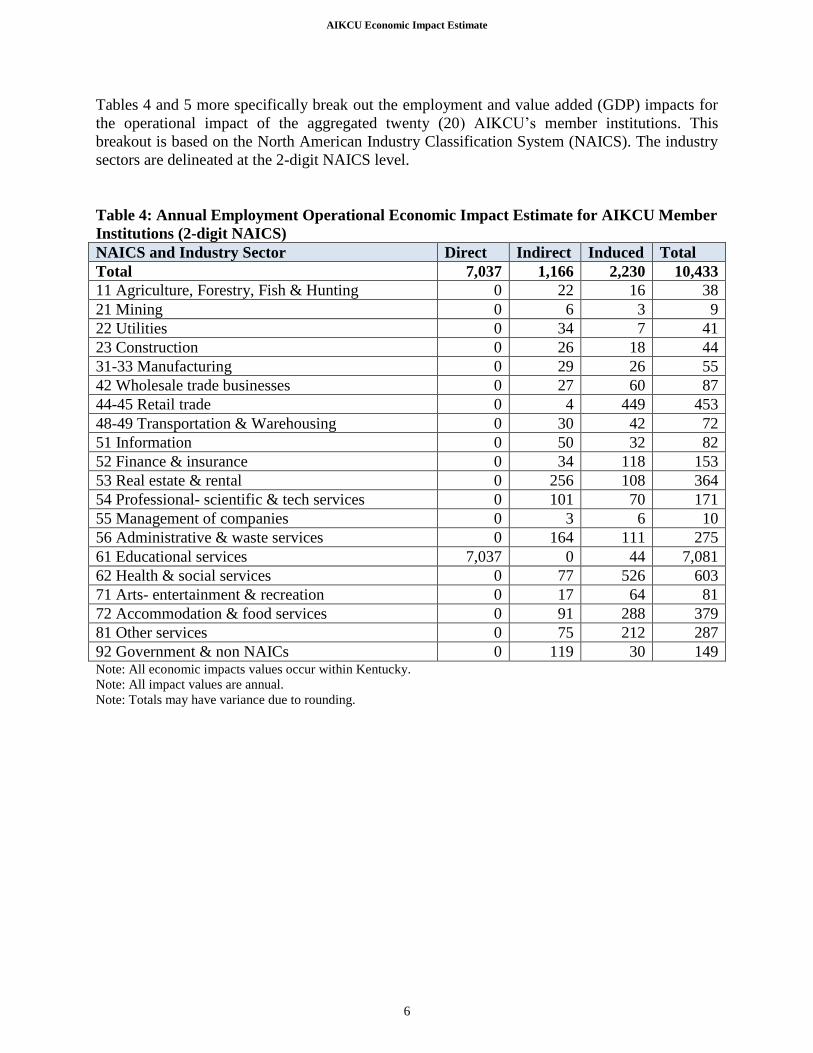
Tables 4 and 5 more specifically break out the employment and value added (GDP) impacts for
the operational impact of the aggregated twenty (20) AIKCU’s member institutions. This
breakout is based on the North American Industry Classification System (NAICS). The industry
sectors are delineated at the 2-digit NAICS level.
Table 4: Annual Employment Operational Economic Impact Estimate for AIKCU Member
Institutions (2-digit NAICS)
NAICS and Industry Sector Direct Indirect Induced Total
Total 7,037 1,166 2,230 10,433
11 Agriculture, Forestry, Fish & Hunting 0 22 16 38
21 Mining 0 6 3 9
22 Utilities 0 34 7 41
23 Construction 0 26 18 44
31-33 Manufacturing 0 29 26 55
42 Wholesale trade businesses 0 27 60 87
44-45 Retail trade 0 4 449 453
48-49 Transportation & Warehousing 0 30 42 72
51 Information 0 50 32 82
52 Finance & insurance 0 34 118 153
53 Real estate & rental 0 256 108 364
54 Professional- scientific & tech services 0 101 70 171
55 Management of companies 0 3 6 10
56 Administrative & waste services 0 164 111 275
61 Educational services 7,037 0 44 7,081
62 Health & social services 0 77 526 603
71 Arts- entertainment & recreation 0 17 64 81
72 Accommodation & food services 0 91 288 379
81 Other services 0 75 212 287
92 Government & non NAICs 0 119 30 149 Note: All economic impacts values occur within Kentucky.
Note: All impact values are annual.
Note: Totals may have variance due to rounding.

AIKCU Economic Impact Estimate
7
Table 5: Annual Value Added (GDP) Operational Economic Impact Estimate for AIKCU
Member Institutions
NAICS and
Industry Sector Direct Indirect Induced Total
Total $354,113,000 $101,843,000 $161,671,000 $617,627,000
11 Agriculture, Forestry,
Fish & Hunting $ - $ 540,000 $ 415,000 $ 955,000
21 Mining $ - $ 352,000 $ 155,000 $ 507,000
22 Utilities $ - $ 15,573,000 $ 3,907,000 $ 19,480,000
23 Construction $ - $ 1,478,000 $ 1,031,000 $ 2,509,000
31-33 Manufacturing $ - $ 2,852,000 $ 3,764,000 $ 6,616,000
42 Wholesale trade
businesses $ - $ 3,875,000 $ 8,598,000 $ 12,474,000
44-45 Retail trade $ - $ 170,000 $ 20,102,000 $ 20,272,000
48-49 Transportation &
Warehousing $ - $ 2,718,000 $ 2,989,000 $ 5,707,000
51 Information $ - $ 6,391,000 $ 5,246,000 $ 11,636,000
52 Finance & insurance $ - $ 4,072,000 $ 13,240,000 $ 17,312,000
53 Real estate & rental $ - $ 26,241,000 $ 38,188,000 $ 64,428,000
54 Professional- scientific
& tech services $ - $ 10,076,000 $ 5,537,000 $ 15,613,000
55 Management of
companies $ - $ 425,000 $ 827,000 $ 1,252,000
56 Administrative & waste
services $ - $ 6,946,000 $ 3,932,000 $ 10,878,000
61 Educational services $354,113,000 $ 3,000 $ 1,357,000 $355,474,000
62 Health & social services $ - $ 2,181,000 $ 33,106,000 $ 35,287,000
71 Arts- entertainment &
recreation $ - $ 332,000 $ 1,496,000 $ 1,828,000
72 Accommodation & food
services $ - $ 2,892,000 $ 8,973,000 $ 11,865,000
81 Other services $ - $ 3,733,000 $ 6,209,000 $ 9,943,000
92 Government & non
NAICs $ - $ 10,991,000 $ 2,599,000 $ 13,590,000 Note: All economic impacts values occur within Kentucky.
Note: All impact values are annual.
Note: Totals may have variance due to rounding.
Professional industry sectors such as medical offices, law firms, insurance agencies, accounting
firms, and private higher education institutions are industries that have similar employment
impacts for Kentucky economy. The graph below provides prospective concerning how
AIKCU’s member institutions fit into Kentucky’s economy. The employment multiplier for
AIKCU’s member institutions is comparable to these Kentucky professional (white-collar)
industries.

AIKCU Economic Impact Estimate
8
Taxes
AIKCU’s member institutions are nonprofit entities operated as educational and research
organizations. Therefore, AIKCU’s member institutions are exempt from direct taxation. This
does not mean that the economic effects of these institutions do not generate tax revenue. The
7,037 direct full and part-time employees of the AIKCU’s member institutions do pay personal
taxes without exemption to federal, state, and local governments. These taxes consist of income,
sales, ad valorem, license, excise, social security, et cetera, taxes. Additionally, the businesses,
the employees, and the commerce generated by AIKCU’s member institutions pay taxes.
AIKCU’s member institutions’ economic effects cause estimated Kentucky state and local tax
revenue (annual) of $27.5 million. AIKCU’s member institutions’ economic effects cause
estimated federal tax revenue (annual) of $81 million. Approximately $51 million of the federal
taxes are social insurance tax (primarily Social Security).
Note: This economic impact estimate does not include taxes paid to school districts (education
taxes) in the tax estimates.
Table 6 (below) provides a breakout estimate of Kentucky state and local taxes paid. Table 7
(below) provides a breakout estimate of federal taxes paid.
0
20
40
60
80
100
120
140
160
Legal
services
Accounting
& tax
preparation
AIKCU
Members
Home health
care services
Veterinary
services
Induced 35.4 36.6 31.7 31.4 20.6
Indirect 17.5 13.2 16.6 9.3 8.6
Direct 100 100 100 100 100
Estimated Impact of 100 Direct Kentucky Jobs in Kentucky
Source: The estimates are derived from and based on IMPLAN Group LLC 2012 databases and IMPLAN Version 3.1 software system matrices.

AIKCU Economic Impact Estimate
9
Table 6: AIKCU Member Institutions
Annual Kentucky State and Local Taxes
Based on economic activities, which occur in Kentucky
State and Local Taxes
(Estimates Exclude Education Taxes)
Total
Tax
Social Ins Tax- Employee Contribution (1) $296,000
Social Ins Tax- Employer Contribution (2) $582,000
Indirect Bus Tax: Sales Tax (3) $7,083,000
Indirect Bus Tax: Property Tax (4) $3,716,000
Indirect Bus Tax: Motor Vehicle Lic (5) $122,000
Indirect Bus Tax: Severance Tax (6) $507,000
Indirect Bus Tax: S/L Non Taxes (7) $365,000
Corporate Profits Tax (8) $598,000
Tax on Production and Imports: Other Taxes (9) $95,000
Personal Tax: Income Tax (10) $11,890,000
Personal Tax: Non Taxes (Fines- Fees) (11) $1,458,000
Personal Tax: Motor Vehicle License (12) $416,000
Personal Tax: Property Taxes (13) $120,000
Personal Tax: Other Tax (Fish/Hunt) (14) $240,000
Total Taxes $27,488,000 Tax estimates are model based.
Estimates are based on 7,037-direct, 1,166- indirect, 2,231-induced Kentucky AIKCU jobs.
Local education taxes are excluded.
Table 7: AIKCU Member Institutions
Estimated Annual Kentucky Federal Taxes
Based on economic activities, which occur in Kentucky
Federal Taxes Total
Tax
Social Ins Tax- Employee Contribution (15) $22,197,000
Social Ins Tax- Employer Contribution (16) $28,045,000
Indirect Bus Tax: Excise Taxes (17) $1,865,000
Indirect Bus Tax: Custom Duty (18) $1,479,000
Indirect Bus Tax: Fed Non Taxes (19) $212,000
Corporate Profits Tax (20) $3,579,000
Personal Tax: Income Tax (21) $24,004,000
Total Federal Tax $81,381,000 Tax estimates are model based.
Estimates are based on 7,037= direct, 1,166 = indirect, 2,231= induced Kentucky AIKCU jobs.
Glossary of Economic Impact Terms
Economic impacts are a mathematical method of specifying the economic relationships among
all businesses/industries and between businesses/industries and consumers. Input-output (I/O)
modeling is the most commonly utilized method to assess the economic outcomes of job creation

AIKCU Economic Impact Estimate
10
or reduction. Economic impact modeling captures the direct impact of an employment
expenditure (jobs with wages, salaries, and benefits) on the economy. Additionally, the
secondary effect (indirect) on the economy is captured and the consumer based (induced) effects
are calculated by the model.
Economic impact analysis typically utilizes an economic model input-output (I/O) which traces
the flow of goods and services, income, and employment among related sectors of the economy.
The I/O model generates a mathematical depiction of the flow of economic activity. Id est:
Final demand changes on the industrial sector producing the good/service (output) purchases
inputs from other industrial sectors, which in turn purchase inputs from other sectors. These
industrial sectors purchase additional labor inputs. Employees of these industries use their
compensation to purchase goods and services from the economy. Linkages between
industries in a region create an economic ripple effect because of changes in demand for
products. Strong linkages can lead to a healthier economy, as capital flows through the
economy rather than out of it.
Gross Domestic Product-Total Value Added: This indicates the total economic value (impact)
attributable to Kentucky’s workers and industries. Note: Data consistent with Kentucky’s Gross
Domestic Product (GDP).
Labor Income-Employee Compensation (Includes Benefits): Employee compensation
describes the total payroll costs (including benefits). This includes wage and salary payments (by
employers) as well as benefits including overtime compensation, health and life insurance,
retirement payments, and other non-cash compensation.
Source: Wage and salary benefits estimates are derived from data provided by the United States
Bureau of Economic Analysis
SA07N Wage and salary disbursements by industry – Kentucky
http://www.bea.gov/regional/spi/default.cfm?satable=SA07N&series=NAICS
SA06N Compensations by industry – Kentucky
http://www.bea.gov/regional/spi/default.cfm?satable=SA06N&series=NAICS
Sector: United States Bureau of Economic Analysis = Educational Services.
Note: Benefits are based on United States Bureau of Economic Analysis Total Compensation
for Wages and Salaries paid during 2012 (Compensation of Employees by Industry –
Kentucky). This component of personal income benefits is inclusive of employer
contributions for employee pension and insurance funds (consists of employer payments to
private and government employee retirement plans, private group health and life insurance
plans, privately administered workers' compensation plans, and supplemental unemployment
benefit plans) and of employer contributions for government social insurance.
Tax Data Sources
Estimated tax impact report values are based on the existing relationships of the data
found in and allocated by the IMPLAN database/matrix. The general sources for that data
are described below:

AIKCU Economic Impact Estimate
11
National Income and Product Accounts (NIPA): As with all items in the IMPLAN data sets,
all data is ultimately controlled, at the US level, by the BEA’s (Bureau of Economic Analysis)
NIPA (National Income and Product Accounts) values. For 2012, IMPLAN data, the national
values were controlled with the NIPA accounts utilizing the Survey of Current Business –
Personal Tax and Non Tax Receipts, Indirect Business Tax and Non Tax Accruals, and
Contributions for Social Insurance. Federal Government Receipts and Current Expenditures, and
State and Local Government Receipts and Current Expenditures contain controls for all the
IMPLAN data elements found in the tax impact report.
Consumer Expenditure Survey (CES): The United States Bureau of the Census annually
conducts surveys and diary samplings of household expenditure patterns. It is from these surveys
that the BEA benchmarks the personal consumption expenditure portion of NIPA. The survey
data is reported for nine different categories of household income establishing the tax to income
level relationships for the nine different household categories. The tax matrix are based on the
relationships, which can be distributed to many of the state and federal tax values to a county and
state level by utilizing the number of local households in each of the nine household categories.
Annual Survey of State and Local Government Finances (SLGF): The Bureau of the Census
also collects annual state and local government receipts and expenditures data. This data acts as
initial controls for state level values (subject to controlling to the NIPA values).
Regional Economic Information System (REIS): The BEA collects and reports income,
wealth, tax, and employment data on a regional (state and county) basis. Much of the data used
to distribute the United States NIPA values to states and counties come from REIS tables:
Personal Income by Major Source and Earnings by Industry, and Personal Tax and Non Tax
Payments.
State and Local Tax Definitions and Sources
1. Social Insurance Tax- Employee Contribution -- The employee paid portion for state
social insurance – this represents retirement plans and temporary disability insurance.
Source: US NIPA value (“Personal contributions: State and local social insurance funds are
distributed to states and based on each state’s share of employee paid state social insurance
specified in the SLGF. The SLGF categories comprising employee paid state social insurance
are inclusive of Employee Retirement – Local Employee Contribution, Employee Retirement
– State Employee Contribution, and Worker’s Compensation – Other Contributions. County
distribution is based on county portion of state and local government non-education
employee compensation from IMPLAN.
2. Social Insurance Tax- Employer Contribution-- The employer paid portion for state social
insurance – this represents retirement plans, worker’s comp and temporary disability
insurance. Source: US NIPA value (Employer contributions: State and local social insurance
funds are distributed to states and based on each state’s share of employer paid state social
insurance specified in the SLGF. The SLGF categories comprising employer paid state social
insurance are inclusive of Employee Retirement – From Local Government, Employee
Retirement from State Government, Unemployment Compensation – Contribution, and
Worker’s Compensation – Own Contributions. County distribution is based on county
portion of state and local government non-education employee compensation from IMPLAN.

AIKCU Economic Impact Estimate
12
3. Sales taxes paid to state and local government.
Source: US NIPA value (“Indirect business tax and non-tax accruals: Property taxes”) is
distributed to states based on each state’s proportion of “Tax – Total General Sales” from the
SLGF. State values are distributed to counties based on total “Personal Income” from the
BEA REIS (Personal Income) table.
4. Property taxes paid to state and local governments.
Source: US NIPA value (“Indirect business tax and non-tax accruals: Property Taxes” table)
is distributed to states based on each state’s proportion of “Tax – Property” from the SLGF.
State values are distributed to counties based on total “Personal Income” from the BEA REIS
(Personal Income) table.
5. Motor vehicle license taxes paid to state and local governments.
Source: US NIPA value (“State and Local: Motor Vehicle Licenses” table) is distributed to
states based on each state’s proportion of “Tax – Motor Vehicle Operator’s License” plus
“Tax – Motor Vehicle License” from the SLGF. State values are distributed to counties based
on total “Personal Income” from the BEA REIS (Personal Income) table.
6. Severance taxes paid to state and local governments.
Source: US NIPA value (“State and Local: Severance taxes”) is distributed to states based on
each state’s proportion of “Tax - Severance” plus “Tax – Motor Vehicle License” from the
SLGF. State values are distributed to counties based on total “Personal Income” from the
BEA REIS (Personal Income) table.
7. Non-taxes paid to state and local governments include rents and royalties, special
assessments, fines, settlements, and donations.
Source: US NIPA value (“State and Local: Non taxes” table) is distributed to states based on
each state’s proportion “Miscellaneous – Rents”; “Miscellaneous – Special Assessments”;
“Miscellaneous – Royalties”; and “Miscellaneous – Donations From Private Sources” from
the SLGF. State values are distributed to counties based on total “Personal Income” from the
BEA REIS (Personal Income) table.
8. State & local government corporate profits tax. Source: US NIPA value (“Corporate
profits tax accruals” table) is distributed to states based on “Tax – Corporate Net Income”
from the SLGF. The state distribution to counties is based on their proportion of state Other
Property Income (from IMPLAN database).
9. Taxes on production and imports Source: US NIPA value (“State and Local: Other taxes”
table) is distributed to states based on each state’s proportion of: “Tax – Corporation
License”; “Tax – Amusement License”; “Tax – Other License”; “Tax – Documentary &
Stock Transfer”; “ Tax – Public Utility License”; “ Tax – Alcoholic Beverage License”; “Tax
– Occupation & Business License, NEC”; and “Tax – NEC” from the SLGF. State values are
distributed to counties based on total “Personal Income” from the BEA REIS (Personal
Income) table.
a. Other taxes paid to state and local governments include business licenses,
documentary, and stamp taxes.
10. Household personal income tax payments to state and local governments.
Source: US NIPA value (“State and local: Income taxes” table) is distributed to states based
on “Tax – Individual Income” from the SLGF. State values are distributed to counties based
on total “Personal Income” from the BEA REIS (Personal Income) table.
a. State & local government dividends represent dividend payments to government by
corporations from investments.

AIKCU Economic Impact Estimate
13
Source: US NIPA value (“Dividends received by government” table) is distributed to
states based upon: “Employee Retirement – Securities – Mortgages”; “Employee
Retirement – Securities – Corporate Stocks”; “Employee Retirement – Securities –
Corporate Bonds”); and “Employee Retirement – Total Other Securities” from the SLGF.
The state distribution to counties is based on their proportion of state Other Property
Income (from IMPLAN database).
Note: The dividend payment to government has been merged with State & Local
Government Corporate Profits Tax due to Kentucky tax reform legislation.
State values are distributed to counties based on total “Personal Income” from the BEA
REIS (Personal Income) table.
11. Household personal non-tax payments to state and local governments include payments for
fines and donations. State values are distributed to counties based on total “Personal Income”
from the BEA REIS (Personal Income) table.
12. Household personal motor vehicle fee payments to state and local governments.
Source: US NIPA value (“State and local: Motor Vehicle Licenses” table) is distributed to
states based on “Miscellaneous – Fines & Forfeits” from the SLGF. State values are
distributed to counties based on total “Personal Income” from the BEA REIS (Personal
Income) table.
13. Household personal property tax payments to state and local governments.
Source: US NIPA value (“State and local: Property taxes” table) is distributed to states based
on “Tax – Property” from the SLGF. State values are distributed to counties based on total
“Personal Income” from the BEA REIS (Personal Income) table.
14. Household personal--other tax payments to state and local governments--includes hunting,
fishing, and other personal licenses.
Source: US NIPA value (“State and local: Other taxes” table) is distributed to states based on
“Tax – Hunting and Fishing License” from the SLGF. State values are distributed to counties
based on total “Personal Income” from the BEA REIS (Personal Income) table.
Federal Tax Definitions and Sources
15. Social Insurance Tax- Employee Contribution -- The employee paid portion for federal
social insurance – this includes social security, unemployment insurance, medical and
retirement plans. Source: US NIPA value (“Personal contributions: Federal social insurance
funds” minus “Old-age, survivors, disability and hospital insurance: Self-employed is
distributed to states and counties based on the “Personal Contribution for Social Insurance”
from BEA REIS (Personal Income) table.
16. Social Insurance Tax- Employer Contribution -- The employer paid portion for federal
social insurance – this includes social security, medical and retirement plans. Source: US
NIPA value employer contributions: Federal social insurance funds are distributed to states
and counties based on the “Personal Contribution for Social Insurance” from BEA REIS
(Personal Income) table. The employer paid portion is assumed to be a constant proportion of
the personal paid proportion. This assumption will be affected by a greater or lesser than
average proprietor income.
Includes federally levied excise taxes on alcohol, tobacco, telephones, coal, fuels, air
transportation, vehicles, et cetera.
Source: US NIPA value (“Federal: Excise taxes” table) is distributed to states and counties
based on IMPLAN estimates of total IBT for all industries in relationship to US total IBT.

AIKCU Economic Impact Estimate
14
17. Excise tax - an inland tax on the sale and/or production for sale of goods or a tax on a good
produced. Excises taxes are distinguished from customs duties, which are taxes on
importation. Considered an indirect tax, excise taxes are typically a per unit tax, which cost a
defined amount per unit of the item purchased. Examples of excise taxes are those on
gasoline, tobacco, and alcohol.
18. Custom duties are gross collections - net refunds.
Source: US NIPA value (“Federal: Customs duties” table) is distributed to states and counties
based on IMPLAN estimates of total IBT for all industries in relationship to US total IBT.
19. Total Indirect Business Tax (IBT) federal non-tax payments include petroleum royalties,
fines, regulatory fees, forfeitures, and donated funds.
Source: US NIPA value (“Federal: Non taxes” table) is distributed to states and counties.
20. Federal corporate profits tax.
Source: US NIPA value (“Corporate profits tax accruals” table) is distributed to states and
counties based on their proportion of US Other Property Income (from IMPLAN database).
Counties based on IMPLAN estimates of total IBT for all industries in relationship to US
total IBT.
21. Income taxes are taxes paid to the federal government through withholding, declarations,
and final settlement less refunds. Source: State “Federal government: Individual income
taxes (net of refunds)” from REIS tax tables are controlled by the US NIPA value (“Federal:
Income Taxes”). State values are distributed to counties based on total “Personal Income”
from the BEA REIS Personal Income table.
How multipliers work -- The analysis in this report relies heavily on the use of the IMPLAN
modeling system and multipliers. The multiplier processes are based on the principle that new
expenditures will have a greater economic impact on the state than the initial dollars spent.
Exempli gratia, a student spends a dollar for tuition: the university receives a dollar of revenue.
Next to occur, the local university will spend some of that dollar of revenue on Kentucky
produced goods and services. The second round of spending is not as large as the first because
some of the initial dollars received by the university (employees) will be spent on goods and
services produced outside the state. Economists refer to the reduction in spending in the second
round as a leakage. Nevertheless, the impact of the initial dollar of spending will be some
multiple of the amount of the initial spending. The third round of spending will occur when
consumers receive wages and salaries from the first two (2) rounds of economic activity.

AIKCU Economic Impact Estimate
15
Methodology/Sources (partial)
The economic impacts estimates and conclusions resulting from this study have been derived
from Minnesota IMPLAN Group, Inc. databases. This aggregate database is primarily composed
of government data sources including information from
US Bureau of Economic Analysis Benchmark I/O Accounts of the US;
US Bureau of Economic Analysis Output Estimates;
US Bureau of Economic Analysis REIS Program;
US Bureau of Labor Statistics ES 202 Program;
US Bureau of Labor Statistics Consumer Expenditure Survey;
US Bureau of County Business Patterns;
US Census Bureau Decennial Census and Population Surveys;
US Census Bureau Economic Census and Surveys;
US Department of Agriculture; and
US Geological Survey.
Model Source: The estimates are derived from and based on IMPLAN Group LLC 2012
databases and IMPLAN Version 3.1 software system matrices.
Prepared by Phil Flynn
Economist
Versailles, Kentucky
The information provided herein is believed to be accurate and has been prepared for the
Association of Independent Kentucky Colleges and Universities (AIKCU). Users of the
information other than AIKCU and/or those authorized by AIKCU should perform their own due
diligence in drawing conclusions from the information provided.
This economic impact report is not a product of any government agency.

AIKCU Economic Impact Estimate
16
Detailed Economic Impact Appendix

AIKCU Economic Impact Estimate
17
Table 8: Detailed Employment Annual Operational Economic Impact Estimate
Description Direct Indirect Induced Total
Total 7,037.0 1,166.0 2,230.5 10,433.5
Private junior colleges, colleges, universities,
and professional schools 7,037.0 0.1 31.4 7,068.5
Food services and drinking places 0.0 87.8 286.2 374.0
Real estate establishments 0.0 250.0 97.7 347.7
Private hospitals 0.0 0.0 143.9 143.9
Offices of physicians, dentists, and other health
practitioners 0.0 0.0 129.8 129.8
Other private educational services 0.0 76.8 23.3 100.1
Other state and local government enterprises 0.0 83.0 15.9 98.9
Services to buildings and dwellings 0.0 66.9 28.1 94.9
Retail Stores - General merchandise 0.0 0.7 88.2 88.9
Nursing and residential care facilities 0.0 0.0 87.4 87.4
Wholesale trade businesses 0.0 27.1 60.1 87.2
Employment services 0.0 32.7 53.1 85.8
Retail Stores - Food and beverage 0.0 0.6 72.5 73.0
Civic, social, professional, and similar
organizations 0.0 16.7 43.6 60.2
Private household operations 0.0 0.0 58.3 58.3
Retail Stores - Motor vehicle and parts 0.0 0.6 56.5 57.1
Monetary authorities and depository credit
intermediation activities 0.0 13.7 35.3 49.0
Retail Stores - Miscellaneous 0.0 0.4 46.9 47.2
Maintenance and repair construction of
nonresidential structures 0.0 25.4 12.5 38.0
US Postal Service 0.0 29.3 8.4 37.7
Medical and diagnostic labs and outpatient and
other ambulatory care services 0.0 0.0 37.5 37.6
Securities, commodity contracts, investments,
and related activities 0.0 11.3 26.2 37.4
Individual and family services 0.0 0.0 36.1 36.1
Automotive repair and maintenance, except car
washes 0.0 9.9 23.1 33.1
Legal services 0.0 11.4 20.6 32.0
Retail Stores - Clothing and clothing accessories 0.0 0.2 31.7 31.9
Retail Stores - Health and personal care 0.0 0.2 30.5 30.8
Business support services 0.0 21.8 8.9 30.7
Child day care services 0.0 0.0 30.5 30.5
Retail Nonstories - Direct and electronic sales 0.0 0.1 29.6 29.7
Retail Stores - Gasoline stations 0.0 0.2 29.1 29.3
Dry-cleaning and laundry services 0.0 19.3 9.3 28.7

AIKCU Economic Impact Estimate
18
Continued -- Table 8: Detailed Employment Annual Operational Economic Impact Estimate
Description Direct Indirect Induced Total
Telecommunications 0.0 13.7 12.1 25.9
Transport by truck 0.0 8.2 17.7 25.8
Electric power generation, transmission, and
distribution 0.0 20.0 5.7 25.7
Personal care services 0.0 0.0 25.5 25.5
Accounting, tax preparation, bookkeeping, and
payroll services 0.0 12.7 12.7 25.3
Retail Stores - Building material and garden
supply 0.0 0.4 24.8 25.2
Grant making, giving, and social advocacy
organizations 0.0 0.0 23.7 23.8
Commercial and industrial machinery and
equipment repair and maintenance 0.0 19.4 3.7 23.2
Non depository credit intermediation and related
activities 0.0 4.5 18.4 23.0
Home health care services 0.0 0.0 22.8 22.8
Spectator sports companies 0.0 7.8 14.0 21.8
Internet publishing and broadcasting 0.0 20.4 0.5 21.0
Other computer related services, including
facilities management 0.0 18.8 1.8 20.6
Other support services 0.0 17.0 2.7 19.6
Waste management and remediation services 0.0 14.0 4.7 18.7
Insurance agencies, brokerages, and related
activities 0.0 3.0 15.3 18.3
Insurance carriers 0.0 1.8 16.4 18.2
Fitness and recreational sports centers 0.0 3.6 13.8 17.4
Retail Stores - Sporting goods, hobby, book and
music 0.0 0.1 16.8 16.9
Couriers and messengers 0.0 11.2 5.4 16.7
Animal production, except cattle and poultry and
eggs 0.0 8.9 6.6 15.5
Community food, housing, and other relief
services, including rehabilitation services 0.0 0.0 14.6 14.6
Investigation and security services 0.0 7.0 7.5 14.5
Advertising and related services 0.0 8.4 6.1 14.4
Architectural, engineering, and related services 0.0 10.9 2.8 13.8
Management, scientific, and technical consulting
services 0.0 4.5 8.6 13.1
Amusement parks, arcades, and gambling
industries 0.0 0.0 12.8 12.8
Private elementary and secondary schools 0.0 0.0 12.4 12.4
Computer systems design services 0.0 10.2 2.2 12.4

AIKCU Economic Impact Estimate
19
Continued -- Table 8: Detailed Employment Annual Operational Economic Impact Estimate
Description Direct Indirect Induced Total
Other amusement and recreation industries 0.0 1.9 9.7 11.7
All other miscellaneous professional, scientific,
and technical services 0.0 9.0 2.5 11.5
Retail Stores - Electronics and appliances 0.0 0.1 11.4 11.5
Retail Stores - Furniture and home furnishings 0.0 0.1 11.2 11.3
Warehousing and storage 0.0 2.6 8.5 11.0
General and consumer goods rental except video
tapes and discs 0.0 4.4 6.0 10.4
Water, sewage and other treatment and delivery
systems 0.0 9.0 0.9 9.9
Scientific research and development services 0.0 9.2 0.6 9.7
Management of companies and enterprises 0.0 3.3 6.4 9.7
Data processing, hosting, ISP, web search portals
and related services 0.0 3.0 6.4 9.4
Printing 0.0 6.3 2.9 9.2
Newspaper publishers 0.0 3.9 5.1 9.0
Transit and ground passenger transportation 0.0 3.3 5.8 9.0
Promoters of performing arts and sports and
agents for public figures 0.0 2.6 6.2 8.9
Veterinary services 0.0 0.0 8.5 8.5
Other personal services 0.0 0.1 7.1 7.3
Extraction of oil and natural gas 0.0 4.6 2.6 7.2
Radio and television broadcasting 0.0 4.0 3.2 7.2
Cattle ranching and farming 0.0 5.9 1.3 7.1
Death care services 0.0 0.0 6.9 6.9
Animal (except poultry) slaughtering, rendering,
and processing 0.0 5.6 1.1 6.8
Electronic and precision equipment repair and
maintenance 0.0 4.2 2.5 6.7
Funds, trusts, and other financial vehicles 0.0 0.1 6.6 6.7
Personal and household goods repair and
maintenance 0.0 4.9 1.4 6.3
Office administrative services 0.0 2.3 3.9 6.2
Maintenance and repair construction of
residential structures 0.0 0.9 5.2 6.1
Natural gas distribution 0.0 5.0 0.6 5.6
Car washes 0.0 0.4 4.7 5.1
Grain farming 0.0 2.3 2.7 5.0
Performing arts companies 0.0 0.7 4.0 4.7
Hotels and motels, including casino hotels 0.0 2.7 1.3 4.0
Transport by air 0.0 1.7 2.0 3.7
Motion picture and video industries 0.0 0.9 2.7 3.6

AIKCU Economic Impact Estimate
20
Continued -- Table 8: Detailed Employment Annual Operational Economic Impact Estimate
Description Direct Indirect Induced Total
Bread and bakery product manufacturing 0.0 2.7 0.8 3.6
Federal electric utilities 0.0 2.7 0.8 3.5
Automotive equipment rental and leasing 0.0 0.8 2.6 3.4
Travel arrangement and reservation services 0.0 2.0 1.3 3.4
Dairy cattle and milk production 0.0 2.4 1.0 3.3
Poultry processing 0.0 0.2 3.0 3.3
State and local government electric utilities 0.0 2.4 0.8 3.2
Custom computer programming services 0.0 2.7 0.4 3.2
Other Federal Government enterprises 0.0 0.8 2.1 2.9
Environmental and other technical consulting
services 0.0 1.1 1.7 2.8
Fluid milk and butter manufacturing 0.0 2.0 0.7 2.7
Scenic and sightseeing transportation and
support activities for transportation 0.0 1.0 1.7 2.7
Periodical publishers 0.0 2.0 0.7 2.7
State and local government passenger transit 0.0 1.0 1.7 2.6
Museums, historical sites, zoos, and parks 0.0 0.0 2.5 2.5
Specialized design services 0.0 1.9 0.6 2.5
Support activities for agriculture and forestry 0.0 0.8 1.1 1.9
Religious organizations 0.0 0.0 1.9 1.9
Soft drink and ice manufacturing 0.0 0.1 1.8 1.9
Frozen food manufacturing 0.0 0.8 1.1 1.9
Transport by rail 0.0 1.1 0.8 1.8
Cookie, cracker, and pasta manufacturing 0.0 1.1 0.5 1.6
Commercial and industrial machinery and
equipment rental and leasing 0.0 0.9 0.6 1.5
Mining coal 0.0 1.1 0.3 1.5
Photographic services 0.0 0.3 1.1 1.4
All other crop farming 0.0 0.8 0.4 1.2
Directory, mailing list, and other publishers 0.0 0.8 0.3 1.2
Transport by pipeline 0.0 0.8 0.3 1.1
Tobacco farming 0.0 0.1 1.0 1.1
Video tape and disc rental 0.0 0.0 1.0 1.0
Other plastics product manufacturing 0.0 0.7 0.3 1.0
Facilities support services 0.0 0.4 0.5 0.9
Book publishers 0.0 0.4 0.5 0.9
Independent artists, writers, and performers 0.0 0.4 0.5 0.9
Motor vehicle parts manufacturing 0.0 0.4 0.5 0.9
Oilseed farming 0.0 0.3 0.5 0.8
All other miscellaneous manufacturing 0.0 0.1 0.7 0.8
Other accommodations 0.0 0.0 0.6 0.7
Paperboard container manufacturing 0.0 0.3 0.4 0.7

AIKCU Economic Impact Estimate
21
Continued -- Table 8: Detailed Employment Annual Operational Economic Impact Estimate
Description Direct Indirect Induced Total
Dry, condensed, and evaporated dairy product
manufacturing 0.0 0.5 0.2 0.7
Sawmills and wood preservation 0.0 0.3 0.3 0.6
Fruit and vegetable canning, pickling, and drying 0.0 0.4 0.2 0.6
Tobacco product manufacturing 0.0 0.0 0.6 0.6
Seasoning and dressing manufacturing 0.0 0.5 0.1 0.6
Wood windows and doors and millwork
manufacturing 0.0 0.3 0.3 0.6
Ready-mix concrete manufacturing 0.0 0.3 0.2 0.6
Wood container and pallet manufacturing 0.0 0.1 0.4 0.5
Greenhouse, nursery, and floriculture production 0.0 0.0 0.5 0.5
Sign manufacturing 0.0 0.3 0.2 0.5
All other food manufacturing 0.0 0.2 0.3 0.5
Commercial hunting and trapping 0.0 0.0 0.5 0.5
Poultry and egg production 0.0 0.1 0.3 0.5
Petroleum refineries 0.0 0.1 0.3 0.5
Automobile manufacturing 0.0 0.0 0.4 0.4
Lessors of nonfinancial intangible assets 0.0 0.4 0.1 0.4
Software publishers 0.0 0.3 0.2 0.4
Men’s and boy’s cut and sew apparel
manufacturing 0.0 0.0 0.4 0.4
Cut and sew apparel contractors 0.0 0.1 0.3 0.4
Mining and quarrying stone 0.0 0.2 0.1 0.4
Vegetable and melon farming 0.0 0.1 0.2 0.4
Heating equipment (except warm air furnaces)
manufacturing 0.0 0.3 0.0 0.4
Bowling centers 0.0 0.0 0.4 0.4
Other concrete product manufacturing 0.0 0.2 0.1 0.3
Coated and laminated paper, packaging paper
and plastics film manufacturing 0.0 0.1 0.2 0.3
Soap and cleaning compound manufacturing 0.0 0.2 0.1 0.3
Cable and other subscription programming 0.0 0.2 0.2 0.3
Cheese manufacturing 0.0 0.2 0.1 0.3
Ornamental and architectural metal products
manufacturing 0.0 0.2 0.1 0.3
Cut stone and stone product manufacturing 0.0 0.0 0.3 0.3
Other animal food manufacturing 0.0 0.1 0.2 0.3
Polystyrene foam product manufacturing 0.0 0.1 0.2 0.3
Other information services 0.0 0.0 0.2 0.3
Sound recording industries 0.0 0.1 0.1 0.2
Concrete pipe, brick, and block manufacturing 0.0 0.1 0.1 0.2
Snack food manufacturing 0.0 0.1 0.2 0.2

AIKCU Economic Impact Estimate
22
Continued -- Table 8: Detailed Employment Annual Operational Economic Impact Estimate
Description Direct Indirect Induced Total
Paint and coating manufacturing 0.0 0.2 0.0 0.2
Ice cream and frozen dessert manufacturing 0.0 0.2 0.1 0.2
Transport by water 0.0 0.0 0.2 0.2
Wineries 0.0 0.0 0.2 0.2
Wood kitchen cabinet and countertop
manufacturing 0.0 0.0 0.2 0.2
Non-chocolate confectionery manufacturing 0.0 0.2 0.0 0.2
All other miscellaneous wood product
manufacturing 0.0 0.1 0.1 0.2
Commercial logging 0.0 0.1 0.1 0.2
Sanitary paper product manufacturing 0.0 0.0 0.2 0.2
Non-upholstered wood household furniture
manufacturing 0.0 0.0 0.2 0.2
Other major household appliance manufacturing 0.0 0.1 0.1 0.2
All other paper bag and coated and treated paper
manufacturing 0.0 0.1 0.1 0.2
Apparel knitting mills 0.0 0.0 0.2 0.2
Support activities for oil and gas operations 0.0 0.1 0.1 0.2
Air conditioning, refrigeration, and warm air
heating equipment manufacturing 0.0 0.1 0.0 0.2
Dental laboratories manufacturing 0.0 0.0 0.2 0.2
Coffee and tea manufacturing 0.0 0.1 0.1 0.2
Paper mills 0.0 0.0 0.1 0.2
Distilleries 0.0 0.0 0.1 0.2
Plastics packaging materials and unlamented
film and sheet manufacturing 0.0 0.0 0.1 0.1
Surgical appliance and supplies manufacturing 0.0 0.0 0.1 0.1
Stationery product manufacturing 0.0 0.1 0.0 0.1
Engineered wood member and truss
manufacturing 0.0 0.1 0.1 0.1
Curtain and linen mills 0.0 0.0 0.1 0.1
Support activities for printing 0.0 0.1 0.0 0.1
Electric lamp bulb and part manufacturing 0.0 0.1 0.1 0.1
Apparel accessories and other apparel
manufacturing 0.0 0.0 0.1 0.1
Electronic computer manufacturing 0.0 0.0 0.1 0.1
Veneer and plywood manufacturing 0.0 0.1 0.0 0.1
Material handling equipment manufacturing 0.0 0.1 0.0 0.1
Urethane and other foam product (except
polystyrene) manufacturing 0.0 0.1 0.0 0.1
Plate work and fabricated structural product
manufacturing 0.0 0.1 0.0 0.1

AIKCU Economic Impact Estimate
23
Continued -- Table 8: Detailed Employment Annual Operational Economic Impact Estimate
Description Direct Indirect Induced Total
Pharmaceutical preparation manufacturing 0.0 0.0 0.1 0.1
Industrial gas manufacturing 0.0 0.0 0.1 0.1
Fats and oils refining and blending 0.0 0.1 0.0 0.1
Other pressed and blown glass and glassware
manufacturing 0.0 0.0 0.1 0.1
Glass product manufacturing made of purchased
glass 0.0 0.0 0.1 0.1
Textile bag and canvas mills 0.0 0.0 0.1 0.1
Electron tube manufacturing 0.0 0.1 0.0 0.1
Sporting and athletic goods manufacturing 0.0 0.0 0.1 0.1
Tire manufacturing 0.0 0.0 0.1 0.1
Other fabricated metal manufacturing 0.0 0.0 0.0 0.1
Dog and cat food manufacturing 0.0 0.0 0.1 0.1
Plastics bottle manufacturing 0.0 0.0 0.1 0.1
Lime and gypsum product manufacturing 0.0 0.0 0.0 0.1
In-vitro diagnostic substance manufacturing 0.0 0.0 0.0 0.1
Brick, tile, and other structural clay product
manufacturing 0.0 0.0 0.0 0.1
Audio and video equipment manufacturing 0.0 0.0 0.0 0.1
Seafood product preparation and packaging 0.0 0.1 0.0 0.1
Spring and wire product manufacturing 0.0 0.0 0.0 0.1
All other converted paper product manufacturing 0.0 0.0 0.0 0.1
Coating, engraving, heat treating and allied
activities 0.0 0.0 0.0 0.1
Breweries 0.0 0.0 0.0 0.1
Aluminum product manufacturing from
purchased aluminum 0.0 0.0 0.1 0.1
Storage battery manufacturing 0.0 0.0 0.1 0.1
Household refrigerator and home freezer
manufacturing 0.0 0.0 0.1 0.1
Computer terminals and other computer
peripheral equipment manufacturing 0.0 0.0 0.0 0.1
Other cut and sew apparel manufacturing 0.0 0.1 0.0 0.1
Printing ink manufacturing 0.0 0.1 0.0 0.1
All other petroleum and coal products
manufacturing 0.0 0.0 0.0 0.1
Mining and quarrying sand, gravel, clay, and
ceramic and refractory minerals 0.0 0.0 0.0 0.1
Other basic organic chemical manufacturing 0.0 0.0 0.0 0.1
Plastics material and resin manufacturing 0.0 0.0 0.0 0.1
Other rubber product manufacturing 0.0 0.0 0.0 0.1

AIKCU Economic Impact Estimate
24
Continued -- Table 8: Detailed Employment Annual Operational Economic Impact Estimate
Description Direct Indirect Induced Total
All other chemical product and preparation
manufacturing 0.0 0.0 0.0 0.1
Mattress manufacturing 0.0 0.0 0.1 0.1
Confectionery manufacturing from purchased
chocolate 0.0 0.0 0.0 0.1
Machine shops 0.0 0.0 0.0 0.1
Wiring device manufacturing 0.0 0.0 0.0 0.1
Boat building 0.0 0.0 0.1 0.1
Flavoring syrup and concentrate manufacturing 0.0 0.0 0.0 0.1
All other basic inorganic chemical
manufacturing 0.0 0.0 0.0 0.1
Fruit farming 0.0 0.0 0.0 0.1

AIKCU Economic Impact Estimate
25
Table 9: Detailed Gross Domestic Product Annual Operational Economic Impact Estimate
Description Direct Indirect Induced Total
Total $354,113,403 $101,843,026 $161,670,653 $617,627,082
Private junior colleges,
colleges, universities, and
professional schools
$354,113,403 $ 3,495 $ 970,162 $355,087,060
Real estate establishments $ - $25,435,641 $ 9,939,481 $35,375,122
Imputed rental activity for
owner-occupied dwellings $ - $ - $27,564,801 $27,564,801
Electric power generation,
transmission, and distribution $ - $12,466,779 $ 3,567,222 $16,034,001
Wholesale trade businesses $ - $ 3,875,012 $ 8,598,490 $12,473,502
Food services and drinking
places $ - $ 2,720,100 $ 8,866,847 $11,586,946
Offices of physicians, dentists,
and other health practitioners $ - $ 35 $11,032,693 $11,032,728
Private hospitals $ - $ 47 $10,595,881 $10,595,928
Monetary authorities and
depository credit
intermediation activities
$ - $ 2,864,321 $ 7,386,900 $10,251,221
Other state and local
government enterprises $ - $ 7,591,099 $ 1,453,851 $ 9,044,950
Telecommunications $ - $ 4,214,386 $ 3,727,211 $ 7,941,597
Nursing and residential care
facilities $ - $ - $ 4,092,952 $ 4,092,952
Retail Stores - General
merchandise $ - $ 31,310 $ 3,984,480 $ 4,015,790
Other computer related
services, including facilities
management
$ - $ 3,572,807 $ 339,684 $ 3,912,491
Medical and diagnostic labs
and outpatient and other
ambulatory care services
$ - $ 1,369 $ 3,371,202 $ 3,372,570
Retail Stores - Motor vehicle
and parts $ - $ 33,077 $ 3,227,204 $ 3,260,282
Legal services $ - $ 1,067,425 $ 1,929,158 $ 2,996,582
Services to buildings and
dwellings $ - $ 2,086,821 $ 876,281 $ 2,963,102
Retail Stores - Food and
beverage $ - $ 23,503 $ 2,875,548 $ 2,899,052
Other private educational
services $ - $ 2,179,347 $ 661,816 $ 2,841,164
Insurance carriers $ - $ 274,261 $ 2,428,066 $ 2,702,327
US Postal Service $ - $ 2,075,770 $ 595,904 $ 2,671,674

AIKCU Economic Impact Estimate
26
Continued -- Table 9: Detailed Gross Domestic Product Annual Operational Economic Impact Estimate
Description Direct Indirect Induced Total
Employment services $ - $ 910,724 $ 1,481,113 $ 2,391,837
Accounting, tax preparation,
bookkeeping, and payroll
services
$ - $ 1,087,095 $ 1,089,245 $ 2,176,340
Maintenance and repair
construction of nonresidential
structures
$ - $ 1,422,854 $ 701,481 $ 2,124,334
Couriers and messengers $ - $ 1,412,059 $ 678,823 $ 2,090,883
Waste management and
remediation services $ - $ 1,493,142 $ 505,109 $ 1,998,251
Natural gas distribution $ - $ 1,667,459 $ 191,754 $ 1,859,213
Civic, social, professional, and
similar organizations $ - $ 488,953 $ 1,278,719 $ 1,767,672
Retail Stores - Health and
personal care $ - $ 13,261 $ 1,631,680 $ 1,644,941
Transport by truck $ - $ 515,952 $ 1,114,680 $ 1,630,632
Commercial and industrial
machinery and equipment
repair and maintenance
$ - $ 1,335,783 $ 256,051 $ 1,591,834
Water, sewage and other
treatment and delivery systems $ - $ 1,438,855 $ 147,683 $ 1,586,538
Retail Stores - Miscellaneous $ - $ 12,006 $ 1,546,019 $ 1,558,024
Securities, commodity
contracts, investments, and
related activities
$ - $ 434,560 $ 1,009,971 $ 1,444,531
Retail Stores - Building
material and garden supply $ - $ 20,250 $ 1,382,937 $ 1,403,187
Non depository credit
intermediation and related
activities
$ - $ 274,437 $ 1,123,685 $ 1,398,122
Other support services $ - $ 1,197,168 $ 187,498 $ 1,384,666
Insurance agencies,
brokerages, and related
activities
$ - $ 222,269 $ 1,117,572 $ 1,339,841
Automotive repair and
maintenance, except car
washes
$ - $ 393,003 $ 917,045 $ 1,310,048
Retail Nonstories - Direct and
electronic sales $ - $ 4,757 $ 1,288,749 $ 1,293,505
All other miscellaneous
professional, scientific, and
technical services
$ - $ 1,014,231 $ 275,574 $ 1,289,805
Home health care services $ - $ - $ 1,263,947 $ 1,263,947

AIKCU Economic Impact Estimate
27
Continued -- Table 9: Detailed Gross Domestic Product Annual Operational Economic Impact Estimate
Description Direct Indirect Induced Total
Management of companies and
enterprises $ - $ 424,573 $ 827,026 $ 1,251,599
Retail Stores - Gasoline
stations $ - $ 8,819 $ 1,238,287 $ 1,247,106
Dry-cleaning and laundry
services $ - $ 820,382 $ 396,627 $ 1,217,009
Advertising and related
services $ - $ 674,232 $ 488,817 $ 1,163,049
Federal electric utilities $ - $ 849,310 $ 262,747 $ 1,112,058
Data processing, hosting, ISP,
web search portals and related
services
$ - $ 355,986 $ 751,925 $ 1,107,911
Retail Stores - Clothing and
clothing accessories $ - $ 8,062 $ 1,086,525 $ 1,094,587
Business support services $ - $ 728,682 $ 299,404 $ 1,028,086
Internet publishing and
broadcasting $ - $ 985,453 $ 26,528 $ 1,011,981
Individual and family services $ - $ - $ 975,015 $ 975,015
Personal care services $ - $ 0 $ 929,925 $ 929,925
Architectural, engineering, and
related services $ - $ 713,133 $ 185,808 $ 898,941
Scientific research and
development services $ - $ 834,832 $ 51,293 $ 886,125
Management, scientific, and
technical consulting services $ - $ 284,482 $ 548,394 $ 832,877
Petroleum refineries $ - $ 212,785 $ 600,865 $ 813,650
Grant making, giving, and
social advocacy organizations $ - $ 169 $ 798,300 $ 798,468
Retail Stores - Electronics and
appliances $ - $ 6,071 $ 782,378 $ 788,449
Child day care services $ - $ - $ 706,806 $ 706,806
Warehousing and storage $ - $ 152,468 $ 502,582 $ 655,050
Printing $ - $ 436,370 $ 199,974 $ 636,344
Retail Stores - Sporting goods,
hobby, book and music $ - $ 4,321 $ 585,676 $ 589,997
State and local government
electric utilities $ - $ 442,966 $ 137,039 $ 580,005
Fluid milk and butter
manufacturing $ - $ 385,650 $ 145,205 $ 530,856
Electronic and precision
equipment repair and
maintenance
$ - $ 335,210 $ 195,346 $ 530,556

AIKCU Economic Impact Estimate
28
Continued -- Table 9: Detailed Gross Domestic Product Annual Operational Economic Impact Estimate
Description Direct Indirect Induced Total
Lessors of nonfinancial
intangible assets $ - $ 430,623 $ 69,702 $ 500,325
Computer systems design
services $ - $ 393,486 $ 84,622 $ 478,109
Retail Stores - Furniture and
home furnishings $ - $ 5,025 $ 472,376 $ 477,400
Newspaper publishers $ - $ 199,896 $ 260,167 $ 460,063
Personal and household goods
repair and maintenance $ - $ 344,698 $ 99,797 $ 444,495
General and consumer goods
rental except video tapes and
discs
$ - $ 185,577 $ 252,399 $ 437,976
Community food, housing, and
other relief services, including
rehabilitation services
$ - $ 0 $ 405,921 $ 405,921
Radio and television
broadcasting $ - $ 221,044 $ 177,088 $ 398,131
Other Federal Government
enterprises $ - $ 109,468 $ 285,969 $ 395,437
Spectator sports companies $ - $ 141,423 $ 253,592 $ 395,015
Private elementary and
secondary schools $ - $ - $ 387,045 $ 387,045
Maintenance and repair
construction of residential
structures
$ - $ 55,562 $ 329,381 $ 384,944
Transport by air $ - $ 174,606 $ 207,004 $ 381,610
Tobacco product
manufacturing $ - $ 0 $ 381,370 $ 381,370
Office administrative services $ - $ 143,190 $ 236,950 $ 380,140
Distilleries $ - $ 30,630 $ 346,100 $ 376,730
Death care services $ - $ - $ 368,464 $ 368,464
Investigation and security
services $ - $ 172,301 $ 183,668 $ 355,968
Transit and ground passenger
transportation $ - $ 124,019 $ 218,650 $ 342,669
Other amusement and
recreation industries $ - $ 56,087 $ 281,274 $ 337,361
Other personal services $ - $ 6,464 $ 327,360 $ 333,824
Private household operations $ - $ - $ 330,346 $ 330,346
Amusement parks, arcades,
and gambling industries $ - $ 252 $ 325,772 $ 326,024
Automotive equipment rental
and leasing $ - $ 79,141 $ 245,303 $ 324,444

AIKCU Economic Impact Estimate
29
Continued -- Table 9: Detailed Gross Domestic Product Annual Operational Economic Impact Estimate
Description Direct Indirect Induced Total
Veterinary services $ - $ 1,448 $ 306,164 $ 307,612
Animal (except poultry)
slaughtering, rendering, and
processing
$ - $ 247,812 $ 50,278 $ 298,090
Animal production, except
cattle and poultry and eggs $ - $ 168,018 $ 125,533 $ 293,550
Fitness and recreational sports
centers $ - $ 59,383 $ 228,769 $ 288,152
Travel arrangement and
reservation services $ - $ 163,957 $ 106,168 $ 270,125
Transport by rail $ - $ 154,955 $ 109,860 $ 264,815
Bread and bakery product
manufacturing $ - $ 202,288 $ 62,233 $ 264,521
Hotels and motels, including
casino hotels $ - $ 170,191 $ 81,620 $ 251,810
Mining coal $ - $ 180,094 $ 53,776 $ 233,869
Periodical publishers $ - $ 168,828 $ 60,608 $ 229,435
Custom computer
programming services $ - $ 194,765 $ 30,462 $ 225,226
Religious organizations $ - $ - $ 217,782 $ 217,782
Poultry processing $ - $ 14,794 $ 196,669 $ 211,463
Specialized design services $ - $ 159,307 $ 46,394 $ 205,701
Museums, historical sites,
zoos, and parks $ - $ - $ 197,923 $ 197,923
Transport by pipeline $ - $ 140,049 $ 51,903 $ 191,952
Cookie, cracker, and pasta
manufacturing $ - $ 128,212 $ 63,275 $ 191,487
Dairy cattle and milk
production $ - $ 134,481 $ 55,309 $ 189,790
Commercial and industrial
machinery and equipment
rental and leasing
$ - $ 109,722 $ 79,137 $ 188,858
Soft drink and ice
manufacturing $ - $ 12,771 $ 172,388 $ 185,159
Funds, trusts, and other
financial vehicles $ - $ 2,211 $ 173,926 $ 176,136
Promoters of performing arts
and sports and agents for
public figures
$ - $ 50,084 $ 118,675 $ 168,760
Extraction of oil and natural
gas $ - $ 105,493 $ 60,134 $ 165,628
Environmental and other
technical consulting services $ - $ 64,413 $ 98,816 $ 163,229

AIKCU Economic Impact Estimate
30
Continued -- Table 9: Detailed Gross Domestic Product Annual Operational Economic Impact Estimate
Description Direct Indirect Induced Total
Frozen food manufacturing $ - $ 60,088 $ 79,560 $ 139,648
Directory, mailing list, and
other publishers $ - $ 95,550 $ 36,884 $ 132,434
Cattle ranching and farming $ - $ 109,007 $ 23,172 $ 132,179
All other petroleum and coal
products manufacturing $ - $ 34,280 $ 92,020 $ 126,300
Book publishers $ - $ 47,904 $ 61,209 $ 109,113
Facilities support services $ - $ 50,206 $ 55,756 $ 105,962
Dry, condensed, and
evaporated dairy product
manufacturing
$ - $ 77,292 $ 26,238 $ 103,530
Car washes $ - $ 8,731 $ 93,611 $ 102,342
Soap and cleaning compound
manufacturing $ - $ 73,463 $ 28,182 $ 101,645
Scenic and sightseeing
transportation and support
activities for transportation
$ - $ 38,452 $ 63,051 $ 101,503
Motion picture and video
industries $ - $ 24,501 $ 72,708 $ 97,209
Other plastics product
manufacturing $ - $ 62,476 $ 28,932 $ 91,408
Petroleum lubricating oil and
grease manufacturing $ - $ 15,899 $ 73,672 $ 89,571
Mining and quarrying stone $ - $ 50,616 $ 33,337 $ 83,953
Automobile manufacturing $ - $ 149 $ 78,610 $ 78,759
Photographic services $ - $ 14,539 $ 62,853 $ 77,392
Software publishers $ - $ 49,245 $ 27,165 $ 76,409
Fruit and vegetable canning,
pickling, and drying $ - $ 46,114 $ 29,385 $ 75,499
Performing arts companies $ - $ 10,701 $ 63,052 $ 73,753
All other crop farming $ - $ 44,108 $ 24,083 $ 68,191
Sanitary paper product
manufacturing $ - $ 5,502 $ 61,917 $ 67,419
Paperboard container
manufacturing $ - $ 27,480 $ 39,685 $ 67,165
Motor vehicle parts
manufacturing $ - $ 26,681 $ 33,795 $ 60,475
Flavoring syrup and
concentrate manufacturing $ - $ 18,105 $ 41,519 $ 59,624
Seasoning and dressing
manufacturing $ - $ 45,707 $ 13,330 $ 59,036
Support activities for
agriculture and forestry $ - $ 21,765 $ 28,813 $ 50,578

AIKCU Economic Impact Estimate
31
Continued -- Table 9: Detailed Gross Domestic Product Annual Operational Economic Impact Estimate
Description Direct Indirect Induced Total
Coated and laminated paper,
packaging paper and plastics
film manufacturing
$ - $ 20,377 $ 29,783 $ 50,160
Fats and oils refining and
blending $ - $ 34,741 $ 15,097 $ 49,838
All other miscellaneous
manufacturing $ - $ 5,052 $ 44,313 $ 49,365
Paper mills $ - $ 14,565 $ 33,525 $ 48,089
Grain farming $ - $ 22,170 $ 25,893 $ 48,063
Transport by water $ - $ 5,633 $ 42,097 $ 47,731
Other animal food
manufacturing $ - $ 18,273 $ 29,382 $ 47,655
Snack food manufacturing $ - $ 10,069 $ 33,156 $ 43,224
All other food manufacturing $ - $ 17,814 $ 23,354 $ 41,168
Greenhouse, nursery, and
floriculture production $ - $ 1,225 $ 38,985 $ 40,211
Poultry and egg production $ - $ 12,597 $ 27,464 $ 40,061
Non-chocolate confectionery
manufacturing $ - $ 29,031 $ 8,822 $ 37,853
Video tape and disc rental $ - $ - $ 36,861 $ 36,861
Other major household
appliance manufacturing $ - $ 10,975 $ 23,941 $ 34,916
Ready-mix concrete
manufacturing $ - $ 20,260 $ 14,368 $ 34,627
Independent artists, writers,
and performers $ - $ 14,024 $ 19,219 $ 33,244
Electronic computer
manufacturing $ - $ 8,737 $ 24,315 $ 33,052
Vegetable and melon farming $ - $ 12,115 $ 20,306 $ 32,421
Sign manufacturing $ - $ 18,785 $ 13,520 $ 32,305
Cable and other subscription
programming $ - $ 15,087 $ 14,782 $ 29,869
Heating equipment (except
warm air furnaces)
manufacturing
$ - $ 26,713 $ 3,029 $ 29,743
Paint and coating
manufacturing $ - $ 24,830 $ 4,219 $ 29,049
Breweries $ - $ 13,402 $ 14,500 $ 27,902
Polystyrene foam product
manufacturing $ - $ 8,941 $ 17,158 $ 26,099
Other accommodations $ - $ 1,786 $ 24,114 $ 25,900
Sound recording industries $ - $ 10,185 $ 15,001 $ 25,186

AIKCU Economic Impact Estimate
32
Continued -- Table 9: Detailed Gross Domestic Product Annual Operational Economic Impact Estimate
Description Direct Indirect Induced Total
Wood windows and doors and
millwork manufacturing $ - $ 13,005 $ 11,730 $ 24,735
Wood container and pallet
manufacturing $ - $ 4,110 $ 19,748 $ 23,857
Electric lamp bulb and part
manufacturing $ - $ 11,500 $ 11,997 $ 23,496
Pharmaceutical preparation
manufacturing $ - $ 1,879 $ 20,416 $ 22,295
Oilseed farming $ - $ 9,375 $ 12,883 $ 22,258
Sawmills and wood
preservation $ - $ 10,966 $ 10,976 $ 21,942
Ornamental and architectural
metal products manufacturing $ - $ 14,421 $ 7,017 $ 21,438
Asphalt paving mixture and
block manufacturing $ - $ 12,160 $ 8,832 $ 20,992
Dog and cat food
manufacturing $ - $ 2 $ 20,885 $ 20,887
Industrial gas manufacturing $ - $ 5,709 $ 14,504 $ 20,212
Concrete pipe, brick, and block
manufacturing $ - $ 11,720 $ 8,044 $ 19,764
Other concrete product
manufacturing $ - $ 10,236 $ 8,764 $ 18,999
Air conditioning, refrigeration,
and warm air heating
equipment manufacturing
$ - $ 15,481 $ 2,770 $ 18,250
In-vitro diagnostic substance
manufacturing $ - $ 10,551 $ 7,375 $ 17,926
Plastics packaging materials
and unlamented film and sheet
manufacturing
$ - $ 5,825 $ 11,928 $ 17,754
Other information services $ - $ 2,533 $ 14,579 $ 17,112
Household refrigerator and
home freezer manufacturing $ - $ 692 $ 15,999 $ 16,691
Men’s and boy’s cut and sew
apparel manufacturing $ - $ 92 $ 15,497 $ 15,589
Toilet preparation
manufacturing $ - $ 1,276 $ 14,207 $ 15,483
All other paper bag and coated
and treated paper
manufacturing
$ - $ 7,570 $ 7,843 $ 15,413
Wineries $ - $ 1,164 $ 14,030 $ 15,194
Cut stone and stone product
manufacturing $ - $ 2,066 $ 12,823 $ 14,889

AIKCU Economic Impact Estimate
33
Continued -- Table 9: Detailed Gross Domestic Product Annual Operational Economic Impact Estimate
Description Direct Indirect Induced Total
Material handling equipment
manufacturing $ - $ 13,065 $ 768 $ 13,833
Commercial hunting and
trapping $ - $ - $ 13,513 $ 13,513
Support activities for printing $ - $ 10,377 $ 2,729 $ 13,106
Stationery product
manufacturing $ - $ 9,218 $ 3,798 $ 13,016
Other pressed and blown glass
and glassware manufacturing $ - $ 5,349 $ 7,578 $ 12,928
Surgical appliance and supplies
manufacturing $ - $ 375 $ 12,026 $ 12,401
Tobacco farming $ - $ 705 $ 11,194 $ 11,899
Plastics bottle manufacturing $ - $ 3,171 $ 8,032 $ 11,203
Other basic organic chemical
manufacturing $ - $ 5,334 $ 5,500 $ 10,834
Cheese manufacturing $ - $ 5,843 $ 4,738 $ 10,581
Cut and sew apparel
contractors $ - $ 3,749 $ 6,554 $ 10,303
Plastics material and resin
manufacturing $ - $ 4,817 $ 5,273 $ 10,090
All other basic inorganic
chemical manufacturing $ - $ 3,989 $ 5,960 $ 9,949
Ice cream and frozen dessert
manufacturing $ - $ 7,054 $ 2,794 $ 9,847
All other converted paper
product manufacturing $ - $ 3,994 $ 5,587 $ 9,581
Urethane and other foam
product (except polystyrene)
manufacturing
$ - $ 5,646 $ 3,845 $ 9,491
Wood kitchen cabinet and
countertop manufacturing $ - $ 2,001 $ 7,486 $ 9,486
Coffee and tea manufacturing $ - $ 5,219 $ 4,203 $ 9,422
Beet sugar manufacturing $ - $ 6,852 $ 2,500 $ 9,353
Support activities for oil and
gas operations $ - $ 5,826 $ 3,328 $ 9,154
Dental laboratories
manufacturing $ - $ 0 $ 8,975 $ 8,975
Plate work and fabricated
structural product
manufacturing
$ - $ 5,879 $ 3,090 $ 8,969
Lime and gypsum product
manufacturing $ - $ 5,321 $ 3,585 $ 8,907

AIKCU Economic Impact Estimate
34
Continued -- Table 9: Detailed Gross Domestic Product Annual Operational Economic Impact Estimate
Description Direct Indirect Induced Total
Sporting and athletic goods
manufacturing $ - $ 98 $ 8,704 $ 8,802
Tire manufacturing $ - $ 1,382 $ 7,281 $ 8,663
Coating, engraving, heat
treating and allied activities $ - $ 4,298 $ 4,192 $ 8,490
All other miscellaneous wood
product manufacturing $ - $ 2,467 $ 5,879 $ 8,346
Other fabricated metal
manufacturing $ - $ 3,432 $ 4,910 $ 8,342
Glass product manufacturing
made of purchased glass $ - $ 3,070 $ 5,223 $ 8,293
Spring and wire product
manufacturing $ - $ 3,071 $ 5,213 $ 8,284
Seafood product preparation
and packaging $ - $ 6,951 $ 1,217 $ 8,169
Computer terminals and other
computer peripheral equipment
manufacturing
$ - $ 3,756 $ 4,164 $ 7,920
Bowling centers $ - $ 153 $ 7,729 $ 7,882
Aluminum product
manufacturing from purchased
aluminum
$ - $ 1,096 $ 6,739 $ 7,835
All other chemical product and
preparation manufacturing $ - $ 4,223 $ 3,488 $ 7,711
Nonupholstered wood
household furniture
manufacturing
$ - $ 2 $ 7,637 $ 7,640
Light truck and utility vehicle
manufacturing $ - $ 1 $ 7,524 $ 7,525
Mattress manufacturing $ - $ 17 $ 7,445 $ 7,461
Printing ink manufacturing $ - $ 5,885 $ 1,427 $ 7,312
Mining and quarrying sand,
gravel, clay, and ceramic and
refractory minerals
$ - $ 4,893 $ 2,287 $ 7,180
Support activities for other
mining $ - $ 5,103 $ 1,872 $ 6,976
Arms, ordnance, and
accessories manufacturing $ - $ 297 $ 6,389 $ 6,686
Wiring device manufacturing $ - $ 5,823 $ 748 $ 6,571
Commercial logging $ - $ 2,914 $ 3,153 $ 6,067
Power boiler and heat
exchanger manufacturing $ - $ 3,897 $ 2,162 $ 6,059
Storage battery manufacturing $ - $ 1,778 $ 4,205 $ 5,984

AIKCU Economic Impact Estimate
35
Continued -- Table 9: Detailed Gross Domestic Product Annual Operational Economic Impact Estimate
Description Direct Indirect Induced Total
Soybean and other oilseed
processing $ - $ 3,132 $ 2,722 $ 5,854
Engineered wood member and
truss manufacturing $ - $ 2,922 $ 2,926 $ 5,848
Electron tube manufacturing $ - $ 5,668 $ 152 $ 5,821
Cement manufacturing $ - $ 3,189 $ 2,337 $ 5,526
Apparel knitting mills $ - $ 51 $ 5,258 $ 5,309
Curtain and linen mills $ - $ 232 $ 5,045 $ 5,277
Other rubber product
manufacturing $ - $ 2,146 $ 3,092 $ 5,238
Household cooking appliance
manufacturing $ - $ 178 $ 4,989 $ 5,166
Steel product manufacturing
from purchased steel $ - $ 3,112 $ 1,890 $ 5,002
Brick, tile, and other structural
clay product manufacturing $ - $ 2,475 $ 2,486 $ 4,960
Audio and video equipment
manufacturing $ - $ 2,057 $ 2,828 $ 4,885
Apparel accessories and other
apparel manufacturing $ - $ 75 $ 4,799 $ 4,874
Plastics pipe and pipe fitting
manufacturing $ - $ 2,892 $ 1,932 $ 4,824
Veneer and plywood
manufacturing $ - $ 2,834 $ 1,953 $ 4,787
Machine shops $ - $ 2,555 $ 1,867 $ 4,421
Fruit farming $ - $ 708 $ 3,500 $ 4,208
Rubber and plastics hoses and
belting manufacturing $ - $ 1,942 $ 2,159 $ 4,101
Adhesive manufacturing $ - $ 1,674 $ 2,407 $ 4,081
Tortilla manufacturing $ - $ 2,343 $ 1,476 $ 3,819
All other forging, stamping,
and sintering $ - $ 1,891 $ 1,918 $ 3,809
Air purification and ventilation
equipment manufacturing $ - $ 2,962 $ 832 $ 3,793
Lighting fixture manufacturing $ - $ 2,695 $ 1,046 $ 3,742
Switchgear and switchboard
apparatus manufacturing $ - $ 2,003 $ 1,587 $ 3,590
Iron and steel mills and
ferroalloy manufacturing $ - $ 1,943 $ 1,523 $ 3,466
Synthetic dye and pigment
manufacturing $ - $ 2,162 $ 1,192 $ 3,354

AIKCU Economic Impact Estimate
36
Continued -- Table 9: Detailed Gross Domestic Product Annual Operational Economic Impact Estimate
Description Direct Indirect Induced Total
Metal can, box, and other
metal container (light gauge)
manufacturing
$ - $ 1,412 $ 1,878 $ 3,291
Flour milling and malt
manufacturing $ - $ 2,278 $ 1,011 $ 3,289
Upholstered household
furniture manufacturing $ - $ 1 $ 3,275 $ 3,276
Communication and energy
wire and cable manufacturing $ - $ 1,785 $ 1,486 $ 3,272
Textile bag and canvas mills $ - $ 838 $ 2,432 $ 3,270
Office Furniture $ - $ 14 $ 3,121 $ 3,135
Confectionery manufacturing
from purchased chocolate $ - $ 798 $ 2,280 $ 3,077
Ball and roller bearing
manufacturing $ - $ 1,774 $ 1,218 $ 2,992
Broom, brush, and mop
manufacturing $ - $ 910 $ 1,951 $ 2,861
Other cut and sew apparel
manufacturing $ - $ 2,091 $ 757 $ 2,849
Hardware manufacturing $ - $ 889 $ 1,906 $ 2,795
Pesticide and other agricultural
chemical manufacturing $ - $ 1,709 $ 965 $ 2,673
Miscellaneous nonmetallic
mineral product manufacturing $ - $ 2,063 $ 590 $ 2,654
Synthetic rubber
manufacturing $ - $ 892 $ 1,749 $ 2,641
Crown and closure
manufacturing and metal
stamping
$ - $ 1,005 $ 1,635 $ 2,640
Ophthalmic goods
manufacturing $ - $ 11 $ 2,512 $ 2,523
Other communications
equipment manufacturing $ - $ 1,308 $ 1,196 $ 2,505
Boat building $ - $ 93 $ 2,392 $ 2,485
Dental equipment and supplies
manufacturing $ - $ 11 $ 2,227 $ 2,237
Turned product and screw, nut,
and bolt manufacturing $ - $ 1,213 $ 1,005 $ 2,218
Alumina refining and primary
aluminum production $ - $ 1,165 $ 1,045 $ 2,210
Blind and shade manufacturing $ - $ 35 $ 2,147 $ 2,182
Paperboard Mills $ - $ 954 $ 1,130 $ 2,085

AIKCU Economic Impact Estimate
37
Continued -- Table 9: Detailed Gross Domestic Product Annual Operational Economic Impact Estimate
Description Direct Indirect Induced Total
Showcase, partition, shelving,
and locker manufacturing $ - $ 653 $ 1,371 $ 2,025
Unlamented plastics profile
shape manufacturing $ - $ 841 $ 1,118 $ 1,959
Hand tool manufacturing $ - $ 856 $ 993 $ 1,848
Other industrial machinery
manufacturing $ - $ 889 $ 946 $ 1,835
Lawn and garden equipment
manufacturing $ - $ 306 $ 1,514 $ 1,820
All other textile product mills $ - $ 227 $ 1,586 $ 1,812
Motorcycle, bicycle, and parts
manufacturing $ - $ 72 $ 1,685 $ 1,757
Prefabricated wood building
manufacturing $ - $ 1,031 $ 633 $ 1,663
Forestry, forest products, and
timber tract production $ - $ 783 $ 879 $ 1,663
Jewelry and silverware
manufacturing $ - $ 21 $ 1,619 $ 1,640
Heavy duty truck
manufacturing $ - $ 69 $ 1,528 $ 1,597
Other engine equipment
manufacturing $ - $ 500 $ 1,056 $ 1,556
Other leather and allied
product manufacturing $ - $ 91 $ 1,454 $ 1,545
Mineral wool manufacturing $ - $ 630 $ 903 $ 1,533
Gasket, packing, and sealing
device manufacturing $ - $ 417 $ 1,092 $ 1,509
Small electrical appliance
manufacturing $ - $ 297 $ 1,201 $ 1,498
Cutlery, utensil, pot, and pan
manufacturing $ - $ 896 $ 580 $ 1,476
Metal tank (heavy gauge)
manufacturing $ - $ 1,003 $ 460 $ 1,463
Custom roll forming $ - $ 985 $ 474 $ 1,460
Valve and fittings other than
plumbing manufacturing $ - $ 986 $ 382 $ 1,368
Fertilizer manufacturing $ - $ 685 $ 659 $ 1,344
Copper rolling, drawing,
extruding and alloying $ - $ 556 $ 644 $ 1,200
Pump and pumping equipment
manufacturing $ - $ 866 $ 333 $ 1,199
Medicinal and botanical
manufacturing $ - $ 268 $ 918 $ 1,186

AIKCU Economic Impact Estimate
38
Continued -- Table 9: Detailed Gross Domestic Product Annual Operational Economic Impact Estimate
Description Direct Indirect Induced Total
Construction machinery
manufacturing $ - $ 878 $ 305 $ 1,183
Motor and generator
manufacturing $ - $ 802 $ 372 $ 1,173
Nonferrous metal (except
copper and aluminum) rolling,
drawing, extruding and
alloying
$ - $ 644 $ 500 $ 1,144
Flat glass manufacturing $ - $ 494 $ 647 $ 1,141
Abrasive product
manufacturing $ - $ 676 $ 428 $ 1,104
Other commercial and service
industry machinery
manufacturing
$ - $ 540 $ 514 $ 1,054
Surgical and medical
instrument, laboratory and
medical instrument
manufacturing
$ - $ 57 $ 934 $ 992
Ground or treated mineral and
earth manufacturing $ - $ 547 $ 445 $ 991
Totalizing fluid meters and
counting devices
manufacturing
$ - $ 698 $ 276 $ 975
Turbine and turbine generator
set units manufacturing $ - $ 729 $ 199 $ 929
Special tool, die, jig, and
fixture manufacturing $ - $ 72 $ 841 $ 913
Narrow fabric mills and
schiffli machine embroidery $ - $ 84 $ 829 $ 913
Nonferrous metal foundries $ - $ 445 $ 465 $ 910
Fluid power process machinery
manufacturing $ - $ 563 $ 346 $ 909
Footwear manufacturing $ - $ 0 $ 908 $ 908
Relay and industrial control
manufacturing $ - $ 530 $ 343 $ 873
Industrial mold manufacturing $ - $ 618 $ 236 $ 854
Pottery, ceramics, and
plumbing fixture
manufacturing
$ - $ 88 $ 647 $ 735
Electronic capacitor, resistor,
coil, transformer, and other
inductor manufacturing
$ - $ 449 $ 250 $ 698
Nonwoven fabric mills $ - $ 155 $ 539 $ 694

AIKCU Economic Impact Estimate
39
Continued -- Table 9: Detailed Gross Domestic Product Annual Operational Economic Impact Estimate
Description Direct Indirect Induced Total
Mechanical power
transmission equipment
manufacturing
$ - $ 387 $ 297 $ 684
Institutional furniture
manufacturing $ - $ 135 $ 520 $ 656
Metal and other household
furniture manufacturing $ - $ 6 $ 648 $ 655
Cutting tool and machine tool
accessory manufacturing $ - $ 395 $ 233 $ 629
Metal cutting and forming
machine tool manufacturing $ - $ 384 $ 204 $ 587
Secondary smelting and
alloying of aluminum $ - $ 327 $ 257 $ 584
Laminated plastics plate, sheet
(except packaging), and shape
manufacturing
$ - $ 320 $ 261 $ 580
Other electronic component
manufacturing $ - $ 336 $ 237 $ 574
Farm machinery and
equipment manufacturing $ - $ 400 $ 161 $ 562
Other general purpose
machinery manufacturing $ - $ 330 $ 220 $ 550
Plumbing fixture fitting and
trim manufacturing $ - $ 276 $ 244 $ 520
Musical instrument
manufacturing $ - $ 44 $ 475 $ 520
All other miscellaneous
electrical equipment and
component manufacturing
$ - $ 145 $ 369 $ 514
Aircraft engine and engine
parts manufacturing $ - $ 381 $ 116 $ 497
Fabricated pipe and pipe fitting
manufacturing $ - $ 263 $ 222 $ 485
Printed circuit assembly
(electronic assembly)
manufacturing
$ - $ 184 $ 293 $ 477
Carbon black manufacturing $ - $ 187 $ 291 $ 477
Commercial Fishing $ - $ 147 $ 326 $ 473
Motor vehicle body
manufacturing $ - $ 120 $ 338 $ 458
Packaging machinery
manufacturing $ - $ 86 $ 368 $ 454

AIKCU Economic Impact Estimate
40
Continued -- Table 9: Detailed Gross Domestic Product Annual Operational Economic Impact Estimate
Description Direct Indirect Induced Total
Watch, clock, and other
measuring and controlling
device manufacturing
$ - $ 42 $ 382 $ 424
Power, distribution, and
specialty transformer
manufacturing
$ - $ 204 $ 216 $ 420
Doll, toy, and game
manufacturing $ - $ 1 $ 397 $ 398
Clay and non-clay refractory
manufacturing $ - $ 213 $ 181 $ 394
Air and gas compressor
manufacturing $ - $ 100 $ 200 $ 300
Industrial process furnace and
oven manufacturing $ - $ 266 $ 34 $ 300
Ammunition manufacturing $ - $ 10 $ 272 $ 283
Mining and oil and gas field
machinery manufacturing $ - $ 178 $ 100 $ 278
Travel trailer and camper
manufacturing $ - $ 18 $ 257 $ 275
Speed changer, industrial high-
speed drive, and gear
manufacturing
$ - $ 191 $ 76 $ 267
Railroad rolling stock
manufacturing $ - $ 141 $ 106 $ 247
Vending, commercial,
industrial, and office
machinery manufacturing
$ - $ 57 $ 163 $ 220
Software, audio, and video
media for reproduction $ - $ 122 $ 93 $ 215
Analytical laboratory
instrument manufacturing $ - $ 74 $ 116 $ 190
Automatic environmental
control manufacturing $ - $ 112 $ 73 $ 185
Electro medical and
electrotherapeutic apparatus
manufacturing
$ - $ 8 $ 167 $ 175
Office supplies (except paper)
manufacturing $ - $ 54 $ 103 $ 158
Semiconductor and related
device manufacturing $ - $ 90 $ 64 $ 154
Carbon and graphite product
manufacturing $ - $ 101 $ 52 $ 153

AIKCU Economic Impact Estimate
41
Continued -- Table 9: Detailed Gross Domestic Product Annual Operational Economic Impact Estimate
Description Direct Indirect Induced Total
Other aircraft parts and
auxiliary equipment
manufacturing
$ - $ 67 $ 85 $ 153
Textile and fabric finishing
mills $ - $ 18 $ 130 $ 147
Tree nut farming $ - $ 26 $ 119 $ 145
Carpet and rug mills $ - $ 4 $ 141 $ 145
Ferrous metal foundries $ - $ 80 $ 58 $ 138
Reconstituted wood product
manufacturing $ - $ 46 $ 83 $ 128
Mining and quarrying other
nonmetallic minerals $ - $ 71 $ 57 $ 128
Plastics and rubber industry
machinery manufacturing $ - $ 65 $ 62 $ 128
Rolling mill and other
metalworking machinery
manufacturing
$ - $ 92 $ 34 $ 126
Industrial process variable
instruments manufacturing $ - $ 81 $ 43 $ 124
Women’s and girl’s cut and
sew apparel manufacturing $ - $ 3 $ 88 $ 91
Truck trailer manufacturing $ - $ 47 $ 16 $ 63
Telephone apparatus
manufacturing $ - $ 27 $ 35 $ 62
Leather and hide tanning and
finishing $ - $ 24 $ 37 $ 61
Custom architectural
woodwork and millwork
manufacturing
$ - $ 10 $ 38 $ 47
Broad woven fabric mills $ - $ 4 $ 43 $ 46
Electricity and signal testing
instruments manufacturing $ - $ 17 $ 15 $ 31
Bare printed circuit board
manufacturing $ - $ 19 $ 11 $ 30
Ship building and repairing $ - $ 8 $ 18 $ 27
Search, detection, and
navigation instruments
manufacturing
$ - $ 4 $ 7 $ 11
Aircraft manufacturing $ - $ 2 $ 5 $ 7