2011 air quality progress report - harrogate
TRANSCRIPT

Harrogate Borough Council April 2011
2011 Air Quality Progress Report for Harrogate Borough Council
In fulfillment of Part IV of the Environment Act 1995 Local Air Quality Management
April 2011
Progress Report i

April 2011 Harrogate Borough Council
Local Authority Officer
Miss Emily Revill
Department Department of Community Services Address Springfield House
Kings Road Harrogate HG1 5NX
Telephone 01423 556633 E-mail [email protected]
Report Reference number
Air Quality Progress Report 2011
Date April 2011
ii Progress Report
Harrogate Borough Council April 2011
Executive Summary
The monitoring data for 2010 has shown that the only relevant breaches of the annual mean Air Quality Objective for nitrogen dioxide have been within the areas that were declared Air Quality Management Areas in November 2010. The full years monitoring results for the Royal Oak at Bond End, Knaresborough (tube H51) has confirmed that the annual mean Air Quality Objective has been exceeded. No other new locations within the Ripon and Knaresborough studies have exceeded the objective.
The results for the Woodlands public house at the Wetherby Road/Hookstone Drive junction have shown that whilst the Air Quality Objective for nitrogen dioxide has not been breached, there is a borderline figure. Monitoring will carry on at this location and a further assessment of the results will be made at the next round.
The tubes for the general district survey did not exceed the annual mean or the 1hour mean Air Quality Objective for nitrogen dioxide. Tube H45 reached a level of 38.48µg/m³, this will be considered at the next round of assessment. The report highlights that there is currently a plan being put forward to reduce traffic on Station Parade Harrogate, to allow taxis and buses only. Results are recorded for the 1-hour mean at this location.
The background concentration of nitrogen dioxide across the Harrogate district has reduced when compared with results from the past 5 years.
The report concludes that the following actions are required;
• Continue with developing the Further Assessment and Air Quality Action Plan • Continue monitoring at locations close to the limits • Carry out triplicate tube monitoring within the Air Quality Management Areas • Continue to monitor the nitrogen dioxide concentration at the Woodlands
public house at the 1st floor level, which is the relevant exposure
Progress Report iii

April 2011 Harrogate Borough Council
Table of contents
1 Introduction 7
1.1 Description of Local Authority Area 7
1.2 Purpose of Progress Report 7
1.3 Air Quality Objectives 8
1.4 Summary of Previous Review and Assessments 10
1.4.1 2006 Updating and Screening Assessment Report 11
1.4.2 2007 Annual Progress Report 11
1.4.3 2008 Interim Annual Progress Report 12
1.4.4 2009 Detailed Assessment Report 12
2 New Monitoring Data 18
2.1 Summary of Monitoring Undertaken 18
2.2 Comparison of Monitoring Results with Air Quality Objectives 23
3 New Local Developments 34
4 Local / Regional Air Quality Strategy 35
5 Planning Applications 36
6 Air Quality Planning Policies 37
7 Local Transport Plans and Strategies 38
8 Climate Change Strategies 40
9 Conclusions and Proposed Actions 41
9.1 Conclusions from New Monitoring Data 41
9.2 Conclusions relating to New Local Developments 41
9.3 Proposed Actions 41
10 References 42
iv Progress Report

Harrogate Borough Council April 2011
Appendices
Appendix A Plans Showing The Locations of The Nitrogen Dioxide Diffusion Tube Sites
Appendix B QA:QC Data
Appendix C Nitrogen Dioxide Diffusion Tube Monitoring Data for 2009
Appendix D Calculation of Nitrogen Dioxide Concentrations Corrected for Distance to Relevant Location and Annualised Means
List of Tables
Table 1.1 Air Quality Objectives included in Regulations for the purpose of Local Air Quality Management in England
Table 2.1 Details of Non- Automatic Monitoring Sites Table 2.2 Results of Nitrogen Dioxide Diffusion Tubes – Ripon Central Survey Table 2.3 Results of Nitrogen Dioxide Diffusion Tubes – Knaresborough Central
Survey Table 2.4 Results of Nitrogen Dioxide Diffusion Tubes – Wetherby
Road/Hookstone Drive Junction Harrogate Survey Table 2.5 Results of Nitrogen Dioxide Diffusion Tubes – General District
Survey
List of Figures
Figure 2.1 Trends in Annual Mean Nitrogen Dioxide Concentration Measured at Diffusion Tube Monitoring Sites
Figure 2.2 Trends in Annual Mean Nitrogen Dioxide Concentration Measured at Diffusion Tube Monitoring Sites – Knaresborough Town Centre
Figure 2.3 Trends in Annual Mean Nitrogen Dioxide Concentration Measured at Diffusion Tube Monitoring Sites – Urban Background
Progress Report v

Harrogate Borough Council April 2011
1 Introduction
1.1 Description of Local Authority Area
The Harrogate district is part of the County of North Yorkshire and extends over an area of 1,305 square kilometres. It has boundaries with the Leeds/Bradford conurbation to the south, has Nidderdale to the west and extends across part of the Vale of York to the east. The district consists of both rural and urban areas, having large, sparsely populated areas alongside the major settlements of Harrogate, Knaresborough and Ripon.
The district has an estimated population of 151,500. Approximately 65% of the population is centred in the three main towns, with Harrogate having around 69,400 residents, and Knaresborough and Ripon having around 15,000.
Seven local authorities surround Harrogate namely Richmondshire, Hambleton, York, Selby, Leeds, Bradford and Craven.
The most significant source of pollutants likely to impact on air quality objectives is the road network in the district. The A1 (M) motorway, A1 dual carriageway and a small part of the A168 dual carriageway run to the east of the district. There is very little relevant exposure to these roads. Other major roads are the A59 and A61, which both pass through the urban areas of the district.
As the Harrogate district is predominantly rural, consideration is given to emissions associated with agricultural activities especially intensive poultry farming, and domestic solid fuel burning in villages not on the mains gas network, in particular to the north and east of the district.
There are a number of industrial installations and waste facilities in the district of varying sizes that are mostly regulated under the Environmental Permitting Regulations. The Leeds-Harrogate-York railway line runs to the south of the district.
1.2 Purpose of Progress Report
Progress Reports are required in the intervening years between the three-yearly Updating and Screening Assessment reports. Their purpose is to maintain continuity in the Local Air Quality Management process.
They are not intended to be as detailed as Updating and Screening Assessment Reports, or to require as much effort. However, if the Progress Report identifies the risk of exceedence of an Air Quality Objective, the Local Authority (LA) should undertake a Detailed Assessment immediately, and not wait until the next round of Review and Assessment.
Progress Report 7

April 2011 Harrogate Borough Council
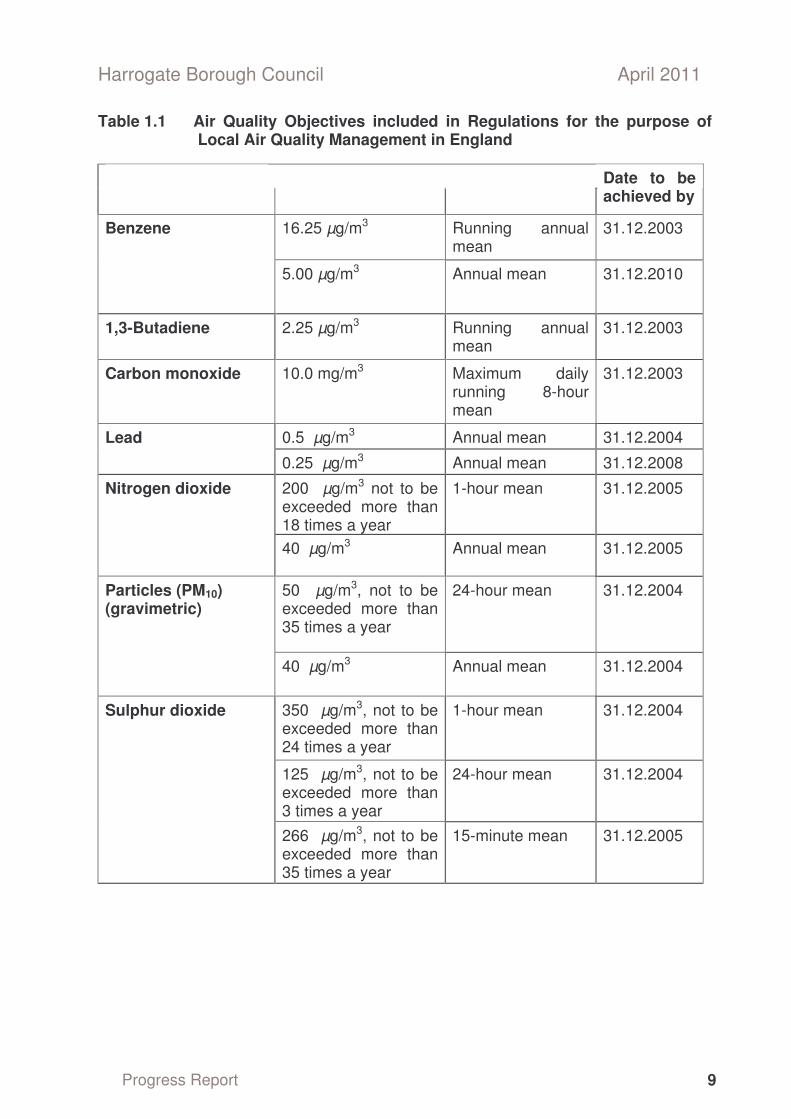
1.3 Air Quality Objectives
The Air Quality Objectives applicable to Local Air Quality Management (LAQM) in England are set out in the Air Quality (England) Regulations 2000 (SI 928), and the Air Quality (England) (Amendment) Regulations 2002 (SI 3043). They are shown in Table 1.1. This table shows the objectives in units of microgrammes per cubic metre µg/m3 (for carbon monoxide the units used are milligrammes per cubic metre, mg/m3). Table 1.1. includes the number of permitted exceedences in any given year (where applicable).
Progress Report 8
Pollutant Concentration Measured as
Harrogate Borough Council April 2011
Table 1.1 Air Quality Objectives included in Regulations for the purpose of Local Air Quality Management in England
Date to be achieved by
16.25 µg/m3 Running annual mean
31.12.2003 Benzene
5.00 µg/m3 Annual mean 31.12.2010
1,3-Butadiene 2.25 µg/m3 Running annual mean
31.12.2003
Carbon monoxide 10.0 mg/m3 Maximum daily running 8-hour mean
31.12.2003
0.5 µg/m3 Annual mean 31.12.2004 Lead
0.25 µg/m3 Annual mean 31.12.2008
200 µg/m3 not to be exceeded more than 18 times a year
1-hour mean 31.12.2005 Nitrogen dioxide
40 µg/m3 Annual mean 31.12.2005
50 µg/m3, not to be exceeded more than 35 times a year
24-hour mean 31.12.2004 Particles (PM10) (gravimetric)
40 µg/m3 Annual mean 31.12.2004
350 µg/m3, not to be exceeded more than 24 times a year
1-hour mean 31.12.2004
125 µg/m3, not to be exceeded more than 3 times a year
24-hour mean 31.12.2004
Sulphur dioxide
266 µg/m3, not to be exceeded more than 35 times a year
15-minute mean 31.12.2005
Progress Report 9

Report Title and Date
April 2011 Harrogate Borough Council
1.4 Summary of Previous Review and Assessments
Outcome
2006 Updating and Screening Assessment Report
September 2006
Detailed Assessment required for sulphur dioxide at Knaresborough Railway Station. Nitrogen dioxide Annual Mean Objective not met at the Woodlands public house, but progress to Detailed Assessment not required. Sulphur dioxide Detailed Assessment at
2007 Annual Progress Report
July 2007
Knaresborough railway station not carried out as initial investigative work identified no relevant exposure.
Nitrogen dioxide annual mean exceedence at Low Skellgate, Ripon and Bond End, Knaresborough reported. Detailed Assessment required.
Nitrogen dioxide Annual Mean Objective not met at the Woodlands public house, but progress to a Detailed Assessment not required. Detailed Assessment continues to be
2008 Interim Annual Progress Report
June 2008
required for nitrogen dioxide in central Ripon and central Knaresborough (as per previous year).
Continuation of nitrogen dioxide Annual Mean Objective not being met at the Woodlands public house, leads to recommendation for progress to a Detailed Assessment. Progress to declaration of Air Quality
2009 Detailed Assessment Report
February 2009
Management Areas (AQMAs) was recommended at the locations in Knaresborough and Ripon, due to a predicted exceedence of the nitrogen dioxide annual mean.
2009 Updating and Screening Assessment Report
September 2009
Nitrogen dioxide monitoring data for 2008 continues to indicate an exceedence of the annual mean Air Quality Objective at; Bond End Knaresborough; Low and High Skellgate, Ripon; Skipton Road, Harrogate and the junction of Wetherby Road and Hookstone Chase in Harrogate. A number of recommendations were made for future monitoring.
Screening for other pollutants did not identify
Progress Report 10

Harrogate Borough Council April 2011 ant other potential exceedences of air quality objectives in the district. New monitoring data for nitrogen dioxide
2010 Annual Progress Report
June 2010
confirmed that Air Quality Management Areas should be declared at Low and High Skellgate, Ripon and Bond End, Knaresborough.
Resiting the diffusion tube to first floor level at Woodlands public house has indicated that the annual mean Air Quality Objective for nitrogen dioxide was not exceeded.
Declaration
November 2010
Air Quality Management Areas Declared for Low and High Skellgate, Ripon and Bond End, Knaresborough for exceedences of the annual mean Air Quality Objective for nitrogen dioxide.
1.4.1 2006 Updating and Screening Assessment Report
The 2006 Updating and Screening Assessment Report concluded that all air quality objectives for lead, 1,3-butadiene, benzene, carbon dioxide and PM10 would be likely to be achieved throughout the district.
The report showed an exceedence of the Annual Mean Objective for nitrogen dioxide at the junction of Wetherby Road and Hookstone Chase in Harrogate. The result was considered to be irregular due to the placing of the passive diffusion tube close to a ventilation outlet from the public house. In accordance with current guidance it was not considered further.
A potential exceedence of the objective mean for sulphur dioxide was identified at Knaresborough Railway Station. The report recommended progress to a Detailed Assessment for sulphur dioxide at this location.
The report did not identify any other potential or actual exceedences of the objectives for nitrogen dioxide within the Harrogate district.
1.4.2 2007 Annual Progress Report
The 2007 Annual Progress Report reported on findings that led to a detailed assessment for sulphur dioxide at Knaresborough Railway Station being considered unnecessary due to the lack of relevant exposure. It also concluded that monitoring for nitrogen dioxide had identified an exceedence of the Annual Mean Objective at Low Skellgate in Ripon and Bond End in Knaresborough, and recommended progress to a Detailed Assessment for these locations.
It also highlighted monitoring, which indicated a potential exceedence of the nitrogen dioxide Air Quality Objective at the Hookstone Chase/Wetherby Road junction in
Progress Report 11
April 2011 Harrogate Borough Council Harrogate, but concluded that progress to a Detailed Assessment at this location was unnecessary.
It reported that real time monitoring of nitrogen dioxide and particulate matter at the air quality monitoring station located on Skipton Road, Harrogate had not identified any potential exceedence of the relevant Air Quality Objective, and that monitoring had been suspended at the end of 2006.
1.4.3 2008 Interim Annual Progress Report
Due to a delay in producing the Detailed Assessment required by the findings of the 2007 Annual Progress Report, an interim Annual Progress Report was produced in June 2008.
The report predicted a continuing exceedence of the nitrogen dioxide Annual Mean Objective at the same locations as the previous year, at Bond End in Knaresborough and Low and High Skellgate in Ripon. It also predicted an exceedence at the Woodlands public house in Harrogate due to its close proximity to the junction of Wetherby Road and Hookstone Chase. It recommended that a Detailed Assessment be produced for the three areas.
Passive diffusion tube monitoring of nitrogen dioxide indicated no other potential or actual exceedences of Air Quality Objectives in the district.
1.4.4 2009 Detailed Assessment Report
The Detailed Assessment was carried out in response to the identification of possible breaches of the nitrogen dioxide annual mean Air Quality Objective in the Harrogate district, caused by vehicle emissions, at the junction of Wetherby Road and Hookstone Chase in Harrogate, at Bond End, Knaresborough and Low and High Skellgate, Ripon. The assessment was carried out on behalf of Harrogate Borough Council by Air Quality Consultants using a combination of monitoring data collected by the Council and modelled concentrations produced by the consultants using the ADMS (Advanced Dispersion Modelling Software) Roads dispersion model. It made the following conclusions:
The nitrogen dioxide Annual Mean Objective was predicted to be exceeded at ground floor level at the façade of the Woodlands public house at the junction of Wetherby Road and Hookstone Chase in Harrogate, however the objective applies only to the first floor level at the flat above. The predictions for the first floor were that the objective was not being exceeded, and so the assessment concluded that an AQMA would not be required. It recommended that monitoring be carried out on the upper floor of the public house for a period of twelve months, following which, if the measurements showed that the Annual Mean Objective was being exceeded, then an AQMA should be declared to cover the public house. There were no other potential exceedences of the nitrogen dioxide Annual Mean Objective in the area of this junction.
Progress Report 12

Harrogate Borough Council April 2011 The nitrogen dioxide Annual Mean Objective was predicted to be exceeded both at ground floor level and at first floor level, at Low and High Skellgate in central Ripon with an estimated 30 properties being affected.
At Bond End, Knaresborough, the nitrogen dioxide Annual Mean Objective was predicted to be exceeded at ground floor level, and, in the worst-case locations, first floor levels too. It estimated that approximately 21 properties were affected.
It recommended that an AQMA be declared to include at least the residential properties whose exposure was predicted to be above the Annual Mean Objective for nitrogen dioxide at both the area in central Ripon and in Bond End Knaresborough.
In addition it was found at both the locations in Ripon and Knaresborough that the area with an annual mean above the objective extended beyond the area in which air quality had been modelled, the monitoring domain. It thus recommended that the Further Assessment report consider a wider road network.
1.4.5 2009 Updating and Screening Assessment Report
Monitoring data in 2008 indicated that the nitrogen dioxide Annual Mean Objective had been exceeded at various locations in the district. None of the exceedences were with existing AQMAs, although the majority are within areas covered by the 2009 Detailed Assessment, and therefore are in areas likely to be declared AQMAs in the near future. In the Central Ripon Survey monitoring indicated exceedences of the nitrogen dioxide Annual Mean Objective at four monitoring locations that are all representative of relevant exposure, two of which had shown exceedences in previous years, and two of which had not.
In the Central Knaresborough Survey, monitoring indicated exceedences of the nitrogen dioxide Annual Mean Objective at four monitoring locations, all of which were representative of relevant exposure, one of which had shown an exceedence in previous years. The other three monitoring locations had shown an exceedence for the first time. Of these locations three are on the Bond End junction and the remaining location is on York Place.
The three locations on Bond End are within the modelling domain and were therefore assessed in the 2009 Detailed Assessment and so a further Detailed Assessment was not required. The monitoring location on York Place was not considered in the 2009 Detailed Assessment and is outside the monitoring domain, however rather than conducting a further Detailed Assessment it was recommended that the monitoring domain assessed in the ADMS Roads model was extended to include the new area of exceedence and the findings included in the 2010 Annual Progress Report.
In the Woodlands junction Harrogate survey the 2008 monitoring data identified an exceedence of the nitrogen dioxide Annual Mean Objective at the façade of the Woodlands public house facing Wetherby Road, although only ten months of monitoring data were collected at this location. In accordance with the recommendations of the 2009 Detailed Assessment this monitoring location and the other monitoring location on the façade of the public house were moved to first floor
Progress Report 13

April 2011 Harrogate Borough Council level, as there is relevant exposure at this location at first floor only. The annual mean nitrogen dioxide concentration measured once twelve months of monitoring data has been collected will be reported in the 2010 Annual Progress Report. If an exceedence of the Annual Mean Objective is predicted then progress straight to declaration of an AQMA will be made, as a Detailed Assessment has already been completed in this location.
In the General District Survey the 2008 monitoring data identified exceedences of the nitrogen dioxide Annual Mean Objective at two locations, one at Skipton Road, Harrogate (borderline exceedence), and the other at Devonshire Place (off Skipton Road), Harrogate. These two residential receptors are located in close proximity to the kerbside of Skipton Road, a busy and congested road, which is one of the main routes through Harrogate.
The assessment of likely impacts of local developments including road transport, other transport, industrial installations, commercial/domestic, residential and fugitive emissions did not identified any potential exceedences of any of the air quality objectives.
The assessment of poultry farms identified one installation which met the criteria stated in TG.09 regarding capacity and relevant exposure, however it is concluded that progress to a Detailed Assessment at this location, Oaklands Farm near Moor Monkton, was not required due to the geographical separation of the poultry units which meant that relevant receptors were only exposed to a portion of the poultry houses.
The assessment of the biomass district -heating scheme at Denton Hall using the Review and Assessment Tool for biomass combustion stacks identified potential exceedences of the air quality objectives for PM10 and nitrogen dioxide, with regard to the one-hour mean objective. Use of the ‘Approaches to adding industrial contributions to the background’ methodology taken from TG.09 and emission rate data specific to the type of appliance have ruled out these potential exceedences and it was concluded that there is no requirement to proceed to a Detailed Assessment with respect to emissions from the district-heating scheme.
The report concluded that it was not necessary to carry out any additional Detailed Assessments (other than those reported in 2009). A number of recommendations were made in the report for additional monitoring to be undertaken during 2009. These are reported in this Progress Report.
1.4.6 2010 Annual Progress Report
The monitoring data for 2009 confirmed the conclusions from the Detailed Assessment undertaken, that AQMA’s should be declared at Low Skellgate and High Skellgate, Ripon and Bond End, Knaresborough. The re-siting of diffusion tubes at the Woodlands public house at the Wetherby Road/Hookstone Drive junction, has confirmed that at the first floor level (relevant exposure) the annual mean Air Quality Objective for nitrogen
Progress Report 14

Harrogate Borough Council April 2011 dioxide was not exceeded and that it is not necessary to declare an AQMA at this location at this time,
The exposure of extra tubes at locations in Ripon and Knaresborough, for 5 months only, has suggested that the nitrogen dioxide concentration is below the Air Quality Objective with the exception of the Royal Oak, Bond End Knaresborough. This was calculated using the annualised mean from the Knaresborough town centre study. The 18 diffusion tubes forming the general district survey indicated that no location was breaching the annual or 1-hour mean for nitrogen dioxide. The background nitrogen dioxide concentration has remained fairly constant for the past five years, at between 14µg/m³ and 16µg/m³.
The main actions arising from the report were to complete the declaration of the two proposed AQMAs, develop an Air Quality Action Plan for the areas, to continue to monitor the nitrogen dioxide concentration at the Woodlands Public House at the 1st
floor level (the relevant exposure) and to evaluate the data from the additional diffusion tube monitoring undertaken in Knaresborough and Ripon, when a full 12 months of data has been obtained.
1.4.7 2010 Air Quality Management Area Declaration
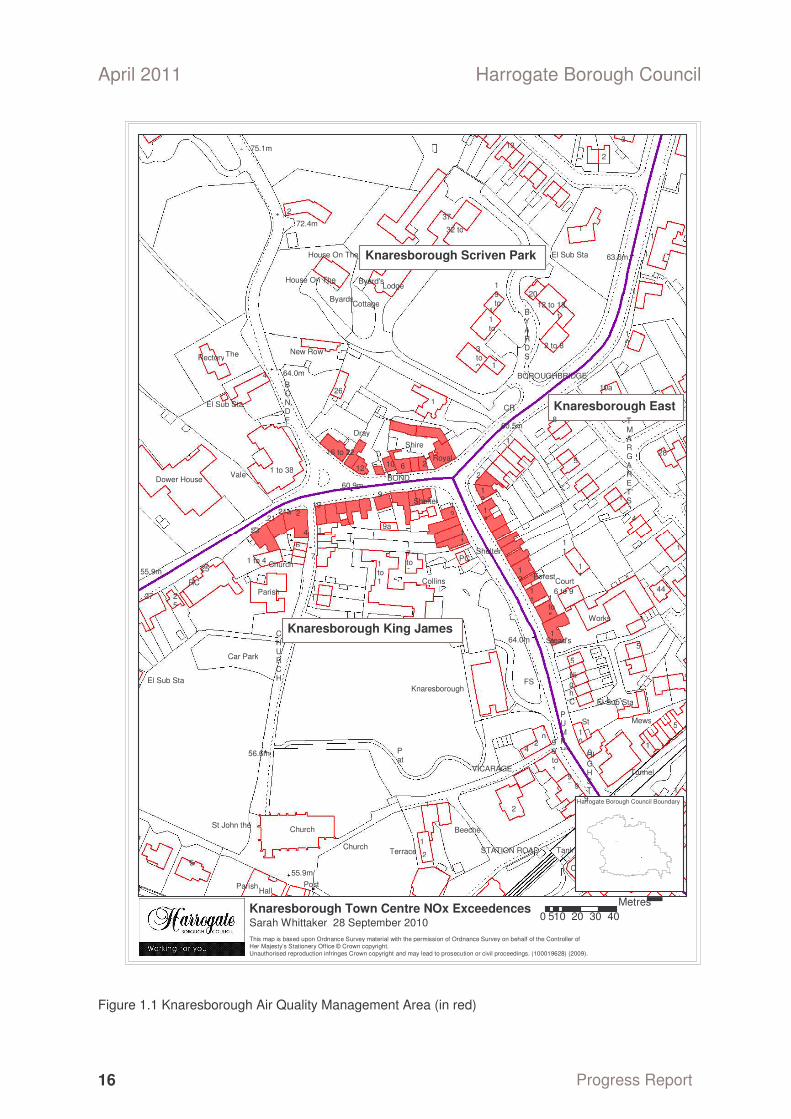
The Air Quality Management Areas for Low and High Skellgate, Ripon and Bond End, Knaresborough were declared on the 26 November 2010, Figures 1.1 and 1.2 show maps of the AQMA boundaries. Work on the Further Assessment and planning for the Air Quality Action Plan has commenced.
Progress Report 15
a
h
P
o
9
8
75
9
84
8
77
83
8
7
86
94a
liff
CR
R
S
72.0m
2
9
April 2011 Harrogate Borough Council
1
2
7
8
9
6
5
4
4
26
25
21
9 8
5
9 1
9 7
28
12
1 4
6
23
1 0
13
19
20
4 0
9
5 5
1 6
27
9a
1 7
9 5
44
7
9
1 5
37
Tunnel
Church
FS
1 3
1 0
1 3
2 5
21a
1 2
1 0
1 0
1 2
1 0
10a
RC
C
The
BOND
Church
Knaresborough
Dower House
P U M P HI
PC
1 1
1 1
1 1
C H U R C H
Mews
St John the
HI G H S T
Post
32 to
Hall
3
P at
BOROUGHBRIDGE
1 to 4
3 to 9
2 to 8
6 to 9 1 to 5
VICARAGE
Court
1 1
B Y A R D S
Works
Forest
STATION ROAD
T M A R G A R E T' S G
Lodge
1 to 1
Parish
Tank
75.1m
72.4m
64.0m
55.9m
56.6m
63.6m
60.9m
60.5m
Shelter
1 to 38
Terrace
16 to 22
12 to 18
1 7 to 2
1 9 to 2
Church
9 9 to 1
1 1 to 1
Cottage
Car Park
Stead's
Vale
Byards
Rectory
St
Byard's
Hi g h C
Beeche
El Sub Sta
Collins
Royal
Shire Dray
House On The
New Row
5
1
64.0m
CR
House On The
2
1
El Sub Sta
1
1
El Sub Sta
2
4
1
El Sub Sta
10
2
4
6
1 0
Parish
1
2
55.9m
1
1
5
1
1 2
2
2
2
5
B O N D E
Shelter
Harrogate Borough Council Boundary
Knaresborough Scriven Park
Knaresborough King James
Knaresborough East
Knaresborough Town Centre NOx Exceedences Sarah Whittaker 28 September 2010 This map is based upon Ordnance Survey material with the permission of Ordnance Survey on behalf of the Controller of Her Majesty’s Stationery Office © Crown copyright. Unauthorised reproduction infringes Crown copyright and may lead to prosecution or civil proceedings. (100019628) (2009).
0 510 20 30 40 Metres¯
Figure 1.1 Knaresborough Air Quality Management Area (in red)
Progress Report 16

A
ws
Controller ofcopyright.
.
Boundary
4
10
I
V
Harrogate Borough Council April 2011
LB
Bk
Mews
5
7
6
9
1
2
8
3
P H
Georgias
SM
Wks
PC
Hall
Posts
21 a
36.6m
37.4m Bl ac k
Ba nk
Obelisk
Y M C
LOW
To w n
to
Cl ub
Church
HI G H
Lands PLACE
TCBs
CLOSE
S w an Ya rd
Be lle vu e Te rra ce
23
34
24
20
31
62
19
3a
21
28
30
60
15
27
33
39
14
12
16
6a
25
17
8a
18
13
32
37
22
4a
WESTGATE
S K EL L G A T
M AL LA R D C L
11
L O W S K EL L G A
W es tg at e M e
SOMERSET ROW
WI LL IA M S O N D R
Cr o w n C ou
WILLIAMSON CLOSE
Heath's Court
Ri po n Cit y Cl ub
WATER SKELLGATE
MARKET
21 b
30 a
11c
11a
1 to 8
1 to 3
Court
58
Fisher's
Jacksons
El Su b St a
Youngs Court
Riverside House
39.0m
5
15
11
7
1
6
H all
34
1
6
22
3a
21
27
2
27
3
PH
17
7
28
9
3
24
9
13
28
1
Court
8a
PH
Court
27
S K EL L G A T
19 23
8
37
1
2 11
4
4
22
5
Ba nk
1
14
1 4
20
19
16
34
20
1
2
4Hall
19
31
25
3
4
21
4
Ba nk 33
1
14
22
Ripon Spa
Ripon Minster
Harrogate Borough Council
Metres Sarah Whittaker 28 September 2010 0 5 10 20 30 40 Ripon Town Centre NOx Exceedences
This map is based upon Ordnance Survey material with the permission of Ordnance Survey on behalf of the ¯ Her Majesty’s Stationery Office © Crown Unauthorised reproduction infringes Crown copyright and may lead to prosecution or civil proceedings. (100019628) (2009)
Figure 1.2 Ripon Air Quality Management Area (in red)
Progress Report 17

Site Name Site Type OS Grid Ref
Pollutants Monitored
In AQMA Relevant Exposure
Distance to kerb of nearest road
April 2011 Harrogate Borough Council
2 New Monitoring Data
2.1 Summary of Monitoring Undertaken
2.1.1 Automatic Monitoring Sites
Harrogate Borough Council has not undertaken any automatic monitoring since January 2007.
2.1.2 Non-Automatic Monitoring
Non-automatic monitoring conducted in the calendar year 2010 consisted of 57 nitrogen dioxide diffusion tubes in 51 locations. The monitoring focussed on areas that are thought to be at potential risk of exceeding the Annual Mean Objective because of traffic volume, narrow congested streets and junctions. Additional monitoring has been undertaken at urban background locations.
Location maps of each passive diffusion tube monitoring location are shown in Appendix A.
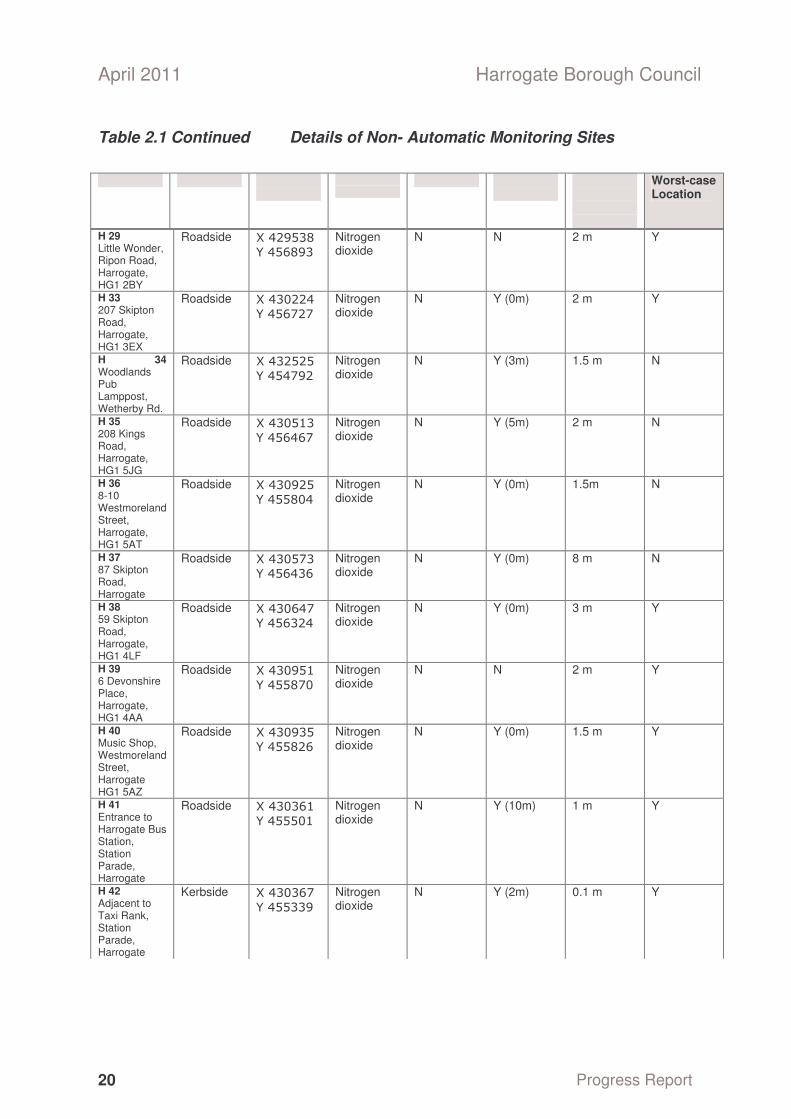
Table 2.1 Details of Non- Automatic Monitoring Sites
Worst-case Location
H 1 5 Otley Road Killinghall
Roadside X 428594
Y458666
Nitrogen dioxide
N Y (0m) 1.5m Y
H 2 24 Low Skellgate, Ripon
Roadside X 431044
Y471039
Nitrogen dioxide
Y Y (0m) 1m N
H 3 8a Heath’s Court, Ripon
Roadside X 431071
Y471085
Nitrogen dioxide
Y Y (0m) 1m Y
H 4/H 5 5 Low Skellgate, Ripon
Roadside Duplicate
X 431087
Y471100
Nitrogen dioxide
Y Y (0m) 1m Y
H 6 27 Water Skellgate, Ripon
Roadside X 431189
Y471146
Nitrogen dioxide
N Y (0m) 3m N
H 7 1 Low Skellgate, Ripon
Roadside X 431110
Y471124
Nitrogen dioxide
Y Y (0m) 1.5m N
H 8 24 High Skellgate, Ripon
Roadside X 431155
Y471216
Nitrogen dioxide
Y Y (0m) 1m Y
H 9 9 High Skellgate, Ripon
Roadside X 431135
Y471186
Nitrogen dioxide
Y Y (0m) 1m Y
Progress Report 18

Site Name Site Type OS Grid Ref
Pollutants Monitored
In AQMA Relevant Exposure
Distance to kerb of nearest road
Harrogate Borough Council April 2011
Table 2.1 Continued Details of Non- Automatic Monitoring Sites
Worst-case Location
H 10 3a Westgate, Ripon
Roadside X 431146
Y471258
Nitrogen dioxide
Y Y (0m) 1m Y
H 12 Vale Court, Bond End, Knares.
Roadside X 434706
Y457380
Nitrogen dioxide
N Y (0m) 5m N
H 13 21 Bond End, Knares.
Roadside X 434716
Y457369
Nitrogen dioxide
Y Y (0m) 1 m N
H 14 9 Bond End, Knares.
Roadside X 434759
Y457375
Nitrogen dioxide
Y Y (0m) 1 m Y
H 15 117 High St. Knares.
Roadside X 434804
Y457358
Nitrogen dioxide
Y Y (0m) 2 m N
H 16 10 Bond End, Knares.
Roadside X 434763
Y457388
Nitrogen dioxide
Y Y (0m) 2 m N
H 17 16-18 Bond End, Knares.
Roadside X 434725
Y457405
Nitrogen dioxide
Y Y (0m) 1.5 m N
H 18 46 High St. Knares.
Roadside X 435040
Y457082
Nitrogen dioxide
N Y (0m) 1.5 m Y
H 19 35 High St. Knares.
Roadside X 435012
Y457084
Nitrogen dioxide
N Y (0m) 1 m N
H 20 22 High St. Knares.
Roadside X 435133
Y457009
Nitrogen dioxide
N Y (0m) 2 m N
H 21 10 High St. Knares.
Roadside X 435158
Y456992
Nitrogen dioxide
N Y (0m) 1.5 m N
H 22 14 York Pl. Knares.
Roadside X 435224
Y456913
Nitrogen dioxide
N N 2 m Y
H 23 32 High St. Harrogate
Roadside X 432904
Y455940
Nitrogen dioxide
N Y (0m) 3 m N
H 24 Woodlands Pub, Hookstone Dr. facade
Roadside X 432477
Y454805
Nitrogen dioxide
N Y (0m) 1st floor only
2 m N
H 25 Wagamama, Parliament St, facade
Roadside X 430063
Y455354
Nitrogen dioxide
N Y (0m) 2m N
H 26 Woodlands Pub, Wetherby Rd. facade
Roadside X 432494
Y454808
Nitrogen dioxide
N Y (0m) 1st floor only
1 m Y
H 27/H 44 The Old Police House, nr Walshford
Roadside Duplicate
X 441851
Y453686
Nitrogen dioxide
N Y (0m) 15 m Y
H 28 77 Harlow Crescent, Harrogate
Urban background
X 429313
Y453820
Nitrogen dioxide
N Y (0m) 5m Y
Progress Report 19
Site Name Site Type OS Grid Ref
Pollutants Monitored
In AQMA Relevant Exposure
Distance to kerb of nearest road
April 2011 Harrogate Borough Council
Table 2.1 Continued Details of Non- Automatic Monitoring Sites
Worst-case Location
H 29 Little Wonder, Ripon Road, Harrogate, HG1 2BY
Roadside X 429538
Y456893
Nitrogen dioxide
N N 2 m Y
H 33 207 Skipton Road, Harrogate, HG1 3EX
Roadside X 430224
Y456727
Nitrogen dioxide
N Y (0m) 2 m Y
H 34 Woodlands Pub Lamppost, Wetherby Rd.
Roadside X 432525
Y454792
Nitrogen dioxide
N Y (3m) 1.5 m N
H 35 208 Kings Road, Harrogate, HG1 5JG
Roadside X 430513
Y456467
Nitrogen dioxide
N Y (5m) 2 m N
H 36 8-10 Westmoreland Street, Harrogate, HG1 5AT
Roadside X 430925
Y455804
Nitrogen dioxide
N Y (0m) 1.5m N
H 37 87 Skipton Road, Harrogate
Roadside X 430573
Y456436
Nitrogen dioxide
N Y (0m) 8 m N
H 38 59 Skipton Road, Harrogate, HG1 4LF
Roadside X 430647
Y456324
Nitrogen dioxide
N Y (0m) 3 m Y
H 39 6 Devonshire Place, Harrogate, HG1 4AA
Roadside X 430951
Y455870
Nitrogen dioxide
N N 2 m Y
H 40 Music Shop, Westmoreland Street, Harrogate HG1 5AZ
Roadside X 430935
Y455826
Nitrogen dioxide
N Y (0m) 1.5 m Y
H 41 Entrance to Harrogate Bus Station, Station Parade, Harrogate
Roadside X 430361
Y455501
Nitrogen dioxide
N Y (10m) 1 m Y
H 42 Adjacent to Taxi Rank, Station Parade, Harrogate
Kerbside X 430367
Y455339
Nitrogen dioxide
N Y (2m) 0.1 m Y
Progress Report 20

Site Name Site Type OS Grid
Ref Pollutants Monitored
In AQMA Relevant Exposure
Distance to kerb of nearest road
Harrogate Borough Council April 2011
Table 2.1 Continued Details of Non- Automatic Monitoring Sites
Worst-case Location
H 43 1 Station Sq. Harrogate HG1 1TB
Roadside X 430397
Y455194
Nitrogen dioxide
N Y (1m) 0.5 m Y
H 45 15 Devons Pl Harrogate HG1 4NN
Roadside X 430991
Y455828
Nitrogen dioxide
N Y (0m) 2 m N
H 44/H 27 The Old Police House, nr Walshford
Roadside Duplicate
X 441851
Y453686
Nitrogen dioxide
N Y (0m) 15 m Y
H 46 93 Skipton Rd, Hgte, HG1 4LJ
Roadside X 43053
Y456499
Nitrogen dioxide
N Y (0m) 5 m Y
H 47 43 Woodfield Road, Hgte, HG1 4LN
Urban Backgroun d
X 430800
Y456572
Nitrogen dioxide
N Y (0m) 30 m N
H49 29 Bond End Knares
Roadside X434623
Y457314
Nitrogen dioxide
N Y (0m) 1 m Y
H50 55 Bond end Knares
Roadside X434578
Y457260
Nitrogen dioxide
N Y (0m) 1.5 m Y
H51 Royal Oak Knares
Roadside X434796
Y457393
Nitrogen dioxide
Y Y (0m) 1 m Y
H52 High Street Knares
Roadside X434835
Y457329
Nitrogen dioxide
Y Y (0m) 2 m Y
H53 Royal Tannery York Pl Knares
Roadside X435253
Y456893
Nitrogen dioxide
N N 2.5 m Y
H54 30 Low Skellgate Ripon
Roadside X431075
Y471077
Nitrogen dioxide
Y Y (0m) 1.3 m Y
H55 Turks Head Low Skellgate Ripon
Roadside X431102
Y471101
Nitrogen dioxide
Y N 1.3 m Y
H56 Crown Court Ripon
Roadside X431151
Y471119
Nitrogen dioxide
N Y (0m) 3 m Y
H57 6.6a Waterskellgate Ripon
Roadside X431193
Y471132
Nitrogen dioxide
N Y (0m) 3 m Y
H58 17 Waterskellgate Ripon
Roadside X431242
Y471135
Nitrogen dioxide
N Y (0m) 1.6 m Y
2.1.3 Details of Quality Assurance/Quality Control (QA/QC)
Monitoring of nitrogen dioxide by way of passive diffusion tubes has been carried out in the Harrogate district since 1993. Over the years more monitoring sites have been added in order to gain a better understanding of air quality within the district. By
Progress Report 21

April 2011 Harrogate Borough Council December 2009 diffusion tube monitoring was being undertaken in 11 general areas, covering 51 sites, with two tubes forming part of the national nitrogen dioxide survey network.
The council’s nitrogen dioxide diffusion tubes are supplied and analysed by Kirklees Metropolitan District Council’s (MDC), Environment and Transportation Service, Scientific Services in Huddersfield.
Details of the QA/QC process and bias adjustment factor used throughout this report are shown in Appendix B.
Progress Report 22

Harrogate Borough Council April 2011
2.2 Comparison of Monitoring Results with Air Quality Objectives
2.2.1 Nitrogen Dioxide
Automatic Monitoring Data
Harrogate Borough Council has not undertaken any automatic monitoring since January 2007.
Diffusion Tube Monitoring Data
A summary of nitrogen dioxide diffusion tube data is shown below in Tables 2.2 -2.8. The full dataset (monthly mean values) are at Appendix C.
The results of diffusion tube monitoring are discussed below in detail. Conclusions are drawn from them on whether progress towards Detailed Assessment is required.
2.2.1.1 Ripon Central Survey
Data capture is above 90% for all but two sites, H2 Low Skellgate and H8 High Skellgate, as such this is considered to be an accurate reflection of nitrogen dioxide concentrations in the area.
Previous reports had highlighted the need for an Air Quality Management Area (AQMA) to be declared on Low and High Skellgate, Ripon. They also discussed the results of new diffusion tubes, and recommended that the results be analysed when a full years data was available. The results for the 2010 Ripon Survey have taken account of the new tube locations added in 2009. Three tube locations within the Ripon Survey exceeded the Annual Mean Objective, these locations are within the AQMA declared on the 26 November 2010.Additionally two locations within the AQMA, which exceeded the Annual Mean Objective in 2009 did not exceed it in 2010, the locations being H10 Westgate, Ripon and H7 Low Skellgate, these had values of 33.56µg/m³ and 28.60µg/m³ respectively. In all cases the exceedence of the Air Quality Objective was less than previously found.
The conclusions from the Ripon Central Survey are to carry on with the Further Assessment and Air Quality Action Plan for the AQMA and to continue to monitor nitrogen dioxide at other survey locations. In addition it proposed to carry out triplicate tube monitoring at locations within the AQMA, to make sure that the most accurate results are recorded.
Progress Report 23

Site ID. Location Within AQMA
Data Capture for full calendar year %
AQ Obj Level (µg/m³)
2010 2009 2008
April 2011 Harrogate Borough Council
Table 2.2 Results of Nitrogen Dioxide Diffusion Tubes – Ripon Central Survey
Annual Mean Concentrations (µg/m³)
2007
H2 Low Skellgate N 83 40 25.12 25.9 30.3 21.2
H3 Low Skellgate Y 100 40 43.36 46.9 50.6 44.7
H4/5 Low Skellgate (5A) Y 100 40 44.00 50.6 52.2 46.5
H6 Waterskellgate (26) N 100 40 25.29 29.7 30.7 23.6
H7 Low/Waterskellgate Y 100 40 28.60 33.4 41.1 28.6
H8 High Skellgate Y 83 40 41.60 43.0 43.5 42.6
H9 High Skellgate Y 100 40 34.81 39.2 37.2 38.2
H10 Westgate Y 100 40 33.56 41.0 39.5 38.9
H54 Low Skellgate (30) Y 100 40 29.39
H55 Low Skellgate (Turks Head) Y 100 40 29.83
H56 Waterskellgate (Crown Ct) N 100 40 25.96
H57 Waterskellgate (6/6a) N 92 40 33.39
H58 Waterskellgate (17) N 100 40 29.84 * Bias adjustment factor for 2010 = 0.78; 2009 = 0.85; 2008 = 0.88; 2007 = 0.84; 2006 = 0.67
The annual mean nitrogen dioxide concentrations for the Ripon town centre sites are shown for each of the past four years at Figure 2.1.
Progress Report 24

Harrogate Borough Council April 2011
Air Quality Objective 40µµµµg/m3
Figure 2.1 Trends in Annual Mean Nitrogen Dioxide Concentration Measured at Diffusion Tube Monitoring Sites.
The nitrogen dioxide concentrations have fallen when compared to the previous year at all locations. The graph appears to show a downward trend from 2008 levels at those sites with more than one years data. For consistency the bias adjustment factor was calculated using the data published on the DEFRA Air Quality website for the laboratory rather than the co-located tubes at the Hambleton site.
Progress Report 25

Site ID. Location Within AQMA
Data Capture for full calendar year %
AQ Obj Level (µg/m³)
2010 2009 2008
April 2011 Harrogate Borough Council
2.2.1.2 Knaresborough Central Survey
Table 2.3 Results of Nitrogen Dioxide Diffusion Tubes – Knaresborough Survey
Annual Mean Concentrations (µg/m³)
2007
H12 VC, Bond End N 100 40 31.61 32.6 37.3 33.8
H13 Bond End (21) Y 100 40 39.83
H14 Bond End (11) Y 100 40 43.61 53.6 55.6 45.6
H15 Bond End (117) Y 100 40 34.42 38.7 42.2 38.7
H16 Bond End (HHJ) Y 100 40 29.28 36.6 38.5 31.9
H17 Bond End (22) Y 100 40 28.86 33.2 36.2 30.6
H18 High Street (Dry Cleaners) N 100 40 29.91 30.5 34.4 26.7
H19 High Street (Gift Shop) N 100 40 26.81 29.9 35.3 27.7
H20 High Street (Music Shop) N 100 40 31.73 35.5 36.1 30.1
H21 High Street (Barbers) N 58 40 34.49 38.5 33.4 29.4
H22 York Place (14) N 100 40 37.01 38.9 41.0 33.3 H49 Bond End (29) N 100 40 27.82 H50 Bond End (55) N 100 40 33.13
H51 Bond End (The Royal Oak) Y 100 40 44.17
H52 High Street (120) Y 100 40 33.00
H53 York Place (The Royal Tannery) N 100 40 31.51
* Bias adjustment factor for 2010 =0.78; 2009 = 0.85; 2008 = 0.88; 2007 = 0.84; 2006 = 0.67
In 2010 100% data capture was achieved at all but one location, H21 the Barbers on High Street, Knaresborough, which achieved only a 58% data capture.
All locations within the survey are representative of public exposure, being located on the facades of residential receptors, and therefore all results are compared to the nitrogen dioxide Annual Mean Objective level of 40 µg/m3.
Previous reports had highlighted that an AQMA needed to be declared in the area around Bond End, Knaresborough, with public consultation concluding that borderline locations identified from the modelling carried out in the Detailed Assessment should also be included in the declaration area. The AQMA was declared in November
Progress Report 26

Harrogate Borough Council April 2011
2010. The 2010 monitoring data has identified that the Air Quality Objective has been exceeded at two locations in the survey, H14 and H51, both of which are within the AQMA. These locations will be included in the Air Quality Action Plan. Site H14 was identified in 2009 as a site that was breaching the Air Quality Objective, and had done so in the previous three calendar years. Site H51 The Royal Oak was identified, in 2009, as likely to breach the objective of 40µg.m³ based on the annualised mean, as only a part year dataset was available. The 2010 monitoring results have confirmed that the levels at H51 The Royal Oak are breaching the Air Quality Objective.
The 2010 monitoring data, has not identified any other sites breaching the Air Quality Objective in 2010, however site H22 14 York Place has remained close to 40µg/m³ with a level of 37.01µg/m³, with the two years results previous to this being 38.9µg/m³ and 41.0µg/m³.
There has been a decrease in the mean Nitrogen Dioxide concentration at all locations within the Knaresborough monitoring survey, where more than one years results exist. This may be due to the extended cold periods at the beginning and end of the survey year.
The survey concludes that work should continue on the Further Assessment and Air Quality Action Plan for the area. It is proposed to carry out triplicate measurements in locations within the AQMA to make sure the most accurate monitoring results are collected. Monitoring will carry on at locations on High Street, York Place and further down Bond End.
Progress Report 27

Site ID. Location Within AQMA
Data Capture for full calendar year %
AQ Obj Level (µg/m³)
2010
April 2011 Harrogate Borough Council
Air Quality Objective 40µµµµg/m3
Figure 2.2 Trends in Annual Mean Nitrogen Dioxide Concentration Measured at Diffusion Tube Monitoring Sites – Knaresborough Town Centre.
The Knaresborough Survey has shown a general downward trend since 2008. Location H21, Barbers, High Street, is the exception this has only seen a decrease since 2009, however with a capture rate of 58% for the 2010 monitoring year the results cannot be considered accurate.
2.2.1.3 Wetherby Road/Hookstone Drive Junction Harrogate Survey
The monitoring data for the Wetherby Rd/Hookstone Drive nitrogen dioxide diffusion survey for 2010 is shown at Table 2.7.
Table 2.4 Results of Nitrogen Dioxide Diffusion Tubes – Wetherby Road/Hookstone Chase Junction Harrogate Survey
Annual Mean Concentrations (µg/m³)
2009 2008 2007
H24 Hookstone Drive (Pub) N 100 40 32.02 29.9 38.2 32.6
H26 Wetherby Road (Pub) N 100 40 39.18 36.9 55.6 45.1
H34 Wetherby Road (Pub/Lamppost) N 100 40 35.77 31.8 37.5 29.0
* Bias adjustment factor for 2010 = 0.78; 2009 = 0.85; 2008 = 0.88; 2007 = 0.84; 2006 = 0.67
Progress Report 28

Harrogate Borough Council April 2011
Data capture of 100% has been achieved at all locations in the 2010 survey.
All locations within the survey are considered to be representative of public exposure. Two of the tubes are located on the facade of the Woodlands Public House at first floor level, which is the residential floor for the pub. Therefore all results are compared to the nitrogen dioxide Annual Mean Objective level of 40µg/m³. H34 is located on a lamppost adjacent to the car park of the public house on Wetherby Road it was added as an additional monitoring location due to the continuing high concentrations of nitrogen dioxide measured at the nearby façade of the public house.
Previous years monitoring have identified that the annual mean Air Quality Objective for nitrogen dioxide was being breached, but this was recorded at ground level. A Detailed Assessment for the area, completed in March 2009, identified that at the first floor level the Air Quality Objective would not be breached. It also made the recommendation that the diffusion tubes be relocated to the first floor. The results for the 2010 monitoring year show an increase in all tube locations from the 2009 monitoring results, with tube H26 moving above 39µg/m³, but remaining below the annual mean Air Quality Objective. It is recommended that another years monitoring is carried out before a final conclusion is reached.
2.2.1.4 General District Survey
The data of the diffusion tube monitoring for the reminder of the district (i.e. not targeted around recognised “hot-spots” in connection with the possible declaration of an AQMA.) are shown in Table 2.5.
Progress Report 29
April 2011 Harrogate Borough Council
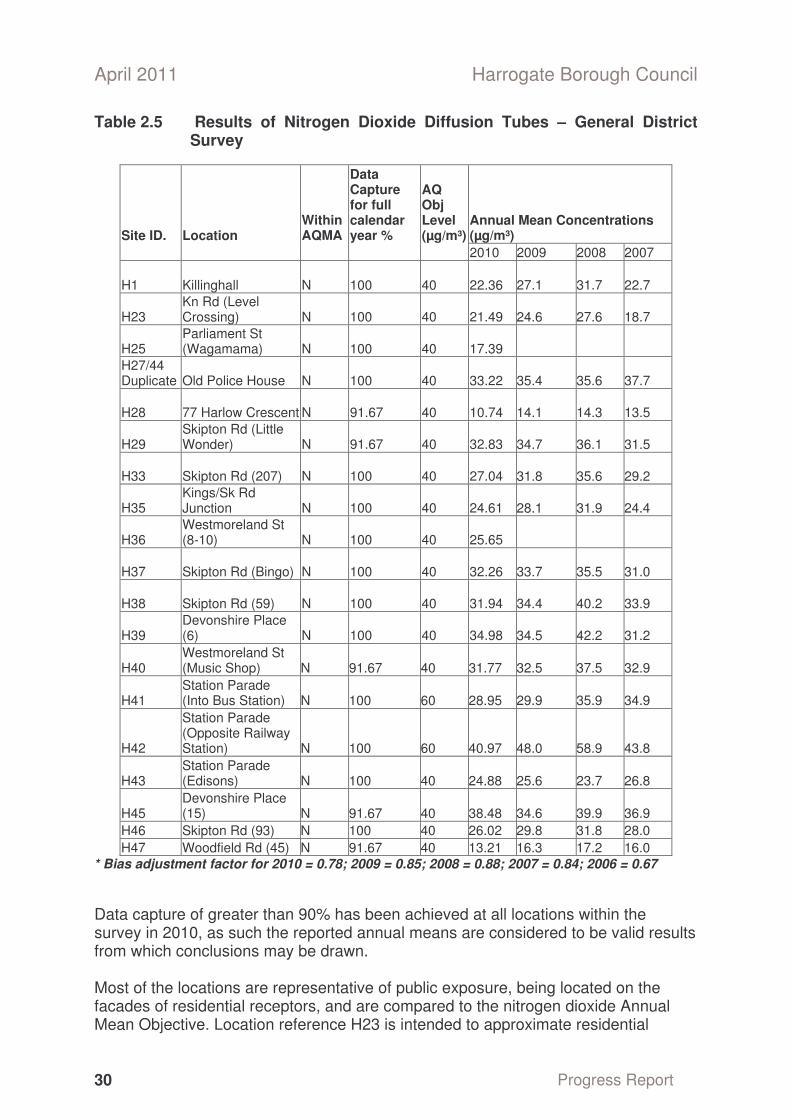
Table 2.5 Results of Nitrogen Dioxide Diffusion Tubes – General District Survey
Site ID. Location Within AQMA
Data Capture for full calendar year %
AQ Obj Level (µg/m³)
Annual Mean Concentrations (µg/m³) 2010 2009 2008 2007
H1 Killinghall N 100 40 22.36 27.1 31.7 22.7
H23 Kn Rd (Level Crossing) N 100 40 21.49 24.6 27.6 18.7
H25 Parliament St (Wagamama) N 100 40 17.39
H27/44 Duplicate Old Police House N 100 40 33.22 35.4 35.6 37.7
H28 77 Harlow Crescent N 91.67 40 10.74 14.1 14.3 13.5
H29 Skipton Rd (Little Wonder) N 91.67 40 32.83 34.7 36.1 31.5
H33 Skipton Rd (207) N 100 40 27.04 31.8 35.6 29.2
H35 Kings/Sk Rd Junction N 100 40 24.61 28.1 31.9 24.4
H36 Westmoreland St (8-10) N 100 40 25.65
H37 Skipton Rd (Bingo) N 100 40 32.26 33.7 35.5 31.0
H38 Skipton Rd (59) N 100 40 31.94 34.4 40.2 33.9
H39 Devonshire Place (6) N 100 40 34.98 34.5 42.2 31.2
H40 Westmoreland St (Music Shop) N 91.67 40 31.77 32.5 37.5 32.9
H41 Station Parade (Into Bus Station) N 100 60 28.95 29.9 35.9 34.9
H42
Station Parade (Opposite Railway Station) N 100 60 40.97 48.0 58.9 43.8
H43 Station Parade (Edisons) N 100 40 24.88 25.6 23.7 26.8
H45 Devonshire Place (15) N 91.67 40 38.48 34.6 39.9 36.9
H46 Skipton Rd (93) N 100 40 26.02 29.8 31.8 28.0 H47 Woodfield Rd (45) N 91.67 40 13.21 16.3 17.2 16.0
* Bias adjustment factor for 2010 = 0.78; 2009 = 0.85; 2008 = 0.88; 2007 = 0.84; 2006 = 0.67
Data capture of greater than 90% has been achieved at all locations within the survey in 2010, as such the reported annual means are considered to be valid results from which conclusions may be drawn.
Most of the locations are representative of public exposure, being located on the facades of residential receptors, and are compared to the nitrogen dioxide Annual Mean Objective. Location reference H23 is intended to approximate residential
Progress Report 30

Harrogate Borough Council April 2011
exposure to standing traffic on High Street, Starbeck caused by the Starbeck level crossing, but is not representative of relevant exposure.
Location references H41 and H42 are places where members of the public may spend an hour or more, and so are compared against the short-term nitrogen dioxide objective level. Research undertaken on behalf of DEFRA and the Devolved Administration suggested that local authorities could reliably base decisions on likely exceedences of the 1-hour objective for nitrogen dioxide alongside busy streets using an annual mean of 60µg/m3 and above. This concentration has been adopted for the assessment criteria at these sites. Both sites have an annual mean nitrogen dioxide concentration lower than this, with location H42 being significantly lower than results from previous years, with a value of 40.97µg/m³ compared with a 2009 figure of 48.0µg/m³ and a 2008 figure of 58.9 µg/m³. There is currently a proposal, undergoing public consultation, to re-route the A61, which runs through Harrogate town centre and along Station Parade, this would remove all vehicles apart from taxis and buses from this road. Should this occur it is proposed to add additional tubes down the new proposed route.
Location references H28 and H47 are urban background locations, which had reported annual mean nitrogen dioxide concentrations of 10.74µg/m3 and 13.21µg/m3
respectively. These figures show a reduction in previous years results with H28 previously remaining constant between 13.5 and 14.3µg/m3 and H47 between 16.0 and 17.2µg/m3. This appears to support other results, which have shown a large decrease in comparison with other years. The trend in the annual mean nitrogen dioxide concentration at the two background sites between 2000 and 2010 is shown in Figure 2.3.
As the nitrogen dioxide Annual Mean Objective has not been exceeded in the past none of the monitoring locations fall within an AQMA. As stated above whilst location references H41 and H42, are above the Annual Mean Objective, they are not representative of residential exposure and are therefore compared to the short-term objective only.
The 2010 monitoring data shows a borderline level of 38.48µg/m³ at location H45 15 Devonshire Place, Harrogate. It is recommended that further data is gathered at this location before any final conclusions are made.
The 2010 monitoring data for the Old Police House at Walshford (locations H27 and H44) has shown a decrease from the previous year’s figure of 35.4µg/m³ to 33.22µg/m3. The figures for 2008 and 2009 also show a downward trend from the 2007 figure of 37.7µg/m³ Monitoring will continue at this location due to the close proximity of the A1 motorway network to residential properties.
Progress Report 31

April 2011 Harrogate Borough Council
Figure 2.3 Trends in Annual Mean Nitrogen Dioxide Concentration Measured at Diffusion Tube Monitoring Sites – Urban Background.
0
5
10
15
20
25
30
35
40
45
2000 2001 2003 2004 2005 2006 2007 2008 2009 2010
Year
Ann
ual m
ean
nitr
ogen
dio
xide
con
c ug
/m3
Air Quality Objective 40µg/m³
H47 Woodfield Road H28 77 Harlow Crescent
Figure 2.3 shows that the annual mean background concentration of nitrogen dioxide has remained stable, between 14µg/m3 and 16µg/m3, over the past five years until the 2010 results.
Progress Report 32
Harrogate District Council has examined the results from monitoring in the borough. Concentrations outside of the current AQMA locations are all below the objectives at relevant locations, therefore there is no need to proceed to a further Detailed Assessment. Monitoring will continue across the district.
Harrogate Borough Council April 2011
2.2.2 Summary of Compliance with AQS Objectives
Progress Report 33

Harrogate Borough Council confirms that there are no new or newly identified local developments, which may have an impact on air quality within the Local Authority area. Harrogate Borough Council confirms that all the following have been considered –
• Road traffic sources • Other transport sources • Industrial sources • Commercial and domestic sources • New developments with fugitive or uncontrolled sources.
3
April 2011 Harrogate Borough Council
New Local Developments
Progress Report 34
4
Harrogate Borough Council April 2011
Local / Regional Air Quality Strategy There are no regional or local air quality strategies specifically relating to Air Quality
Progress Report 35
5
April 2011 Harrogate Borough Council
Planning Applications The following is a list of potentially significant planning applications, which have been determined, or are in the process of being determined by Harrogate Borough Council. None are considered to have the potential for a seriously detrimental effect of air quality. Air quality issues were considered at the planning stage where appropriate and will be kept under review where necessary.
• Proposed Tesco store, Harrogate • Change of use of ammunition store to composting of green waste, land at
Hutton Hall • Outline application for residential development at Irongate Bridge Reservoir
Depot and former Harlow Hill Depot (Site Area 5.5ha)
Progress Report 36
6
Harrogate Borough Council April 2011
Air Quality Planning Policies Harrogate Borough Council is in the process of drawing up a Development Control Policy specifically covering Air Quality. This will be discussed further in the next round of assessment.
Progress Report 37

7
April 2011 Harrogate Borough Council
Local Transport Plans and Strategies Regional Transport Strategy – sets a strategy for transport in the Yorkshire and Humber region. Whilst it does specifically address transport and air quality, the two are clearly linked.
The Strategy deals with the following key areas:
° Reduce the need to travel wherever possible by both positive interventions such as improved public transport or by demand restraint and promote modal shift from the car (T1)
° Seek a consistent approach to parking strategies (T2)
° Promote improved public transport (T3)
° Promote the movement of goods by water and rail whilst recognising the key role road has to play in moving freight (T4)
° Encourage access to tourist locations by public transport and promote the journey component to be considered as part of the tourism offer (T5)
° Seek to improve surface access to its airports (T6)
° Support expansion of its ports and waterways and improve surface access to them (T7)
° Seek to improve access to services in rural areas by improving transport provision but also by innovative means (T8)
° Support a range of transport and investment priorities that underpin the wider spatial strategy (T9)
Local Transport Plan - sets out our plans and strategies for maintaining and improving all aspects of the local transport system over the next five years.
The third Local Transport Plan (LTP), prepared by North Yorkshire County Council, came into effect on 1 April 2011. LTP3 contains the following objectives:
1. Local economies 2. Environment and Climate Change 3. Safety and healthier travel 4. Access to services 5. Quality of life
The expanded objective for Environment and Climate Change is “reducing the impact of transport on the natural and built environment and tackling Climate Change. The key issues with the objective are:
• Local contribution to greenhouse gas emissions • The impact of traffic related air quality on health at key areas of concern
Progress Report 38

Harrogate Borough Council April 2011
• Need to adapt the transport network to mitigate the impact of climate change
• The impact of transport on the high quality and built environment
Car Share Scheme
Harrogate Borough Council supports the Harrogate Car Sharing Scheme initiative and promotes this service amongst its employees and the public.
Further details of the scheme are available on the following website:
www.harrogatecarshare.com
Progress Report 39

8
April 2011 Harrogate Borough Council
Climate Change Strategies Action for the Environment - The Harrogate District Local Agenda 21 Plan (2003)
The Harrogate District Agenda 21 process seeks to achieve the following:
° an improved and integrated transport system with greater use of walking, cycling and public transport, with less dependency on cars;
° better resource management, in order to reduce consumption and pollution and to encourage the reuse or recycling of materials wherever possible;
° less fear of crime and improved community safety
° local control with greater community involvement
° greater understanding and implementation of the conservation of the local landscape and the environment
° a thriving local economy with more basic needs met locally and more opportunities to work in a diverse local economy;
° a healthy and safe environment supported by preventative public health policies and the “polluter pays” principle;
° quality housing available to everyone
° more leisure facilities with local accessibility;
° more widespread education on local and global sustainability issues.
The document focuses on the following broad areas:
° energy efficiency
° waste & recycling
° water conservation
° the local surroundings/biodiversity
° transport
° getting the message across
Progress Report 40

Harrogate Borough Council April 2011
9 Conclusions and Proposed Actions
9.1 Conclusions from New Monitoring Data
The monitoring data for 2010 has shown that the only relevant breaches of the annual mean Air Quality Objective for nitrogen dioxide have been within the areas that were declared Air Quality Management Areas in November 2010. The full years monitoring for the Royal Oak at Bond End (tube H51) has confirmed the results from the annualised calculated mean presented in the 2010 Progress Report, by exceeding the annual mean Air Quality Objective. No other new locations within the Ripon and Knaresborough studies have exceeded the objective.
The results for the Woodlands public house at the Wetherby Road/Hookstone Drive junction have shown that whilst the Air Quality Objective for nitrogen dioxide has not been breached, there is a borderline figure, monitoring will carry on at this location and a further assessment of the results shall be made at the next round.
The tubes forming the general district survey did not exceed the annual mean or the 1-hour mean. Tube H45 reached a level of 38.48µg/m³, this will be considered at the next round of assessment. It was highlighted that there is currently a plan going through public consultation to reduce the traffic on Station Parade, where results are recorded for the 1-hour mean, to taxi’s and buses only.
The background nitrogen dioxide concentration in the Harrogate district has reduced when compared with the past five years, which had remained constant.
9.2 Conclusions relating to New Local Developments
There are no new developments identified that are likely to have significant impact on air quality in the area.
9.3 Proposed Actions
The following actions arising from the conclusions in this report are proposed:
• Continue with developing the Further Assessment and Air Quality Action Plan • Continue monitoring those locations close to the limits • Carry out triplicate tube monitoring within the Air Quality Management Areas • Continue to monitor the nitrogen dioxide concentration at the Woodlands
public house at the 1st floor level, which is the relevant exposure
Progress Report 41

April 2011 Harrogate Borough Council
10 References
Local Air Quality Management, Technical Guidance LAQM TG (09) Department for Environment, Food and Rural Affairs, February 2009
Local Air Quality Management, Policy Guidance LAQM PG (09) Department for Environment, Food and Rural Affairs, February 2009
2010 Annual Progress Report Harrogate Borough Council, June 2010 http://www.harrogate.gov.uk/Pages/harrogate-917.aspx
2009 Air Quality Updating and Screening Assessment Report, September 2009
2009 Detailed Assessment of Air Quality Harrogate Borough Council Air Quality Consultants, February 2009 http://www.harrogate.gov.uk/harrogate-917
2008 Interim Annual Progress Report Harrogate Borough Council June 2008 http://www.harrogate.gov.uk/harrogate-917
2007 Annual Progress Report Harrogate Borough Council, July 2007 http://www.harrogate.gov.uk/harrogate-917
2006 Updating and Screening Assessment Report, September 2006 http://www.harrogate.gov.uk/harrogate-917
North Yorkshire County Council Local Transport Plan 3, December 2010 http://www.northyorks.gov.uk/index.aspx?articleid=3256
Progress Report 42

Harrogate Borough Council April 2011
Appendix A:
Plans Showing The Locations Of The Nitrogen Dioxide Diffusion
Tube Sites
Progress Report 43

B 6161
A 6
1
CAUTLEY GR
The
Squa
re
Lealhulme
7
4
5
15
1
2
86
33
72
78
20
76
41
11
3
13
1
11
1
3
B 6161
A 6
1
CAUTLEY GR
The
Squa
re
Lealhulme
7
4
5
15
1
2
86
33
72
78
20
76
41
11
3
13
1 1
3
Wks
36.5m
32.8m
SKELLBANK
Bel
levu
e Te
rrac
e
Ripon C
omm
unity
Spa Baths
Hospi tal
Tow
n
Bla
ck
PH
YM
CA
Church
Ban
k Sw
an Yar d
Hall
WESTGATE
KIRKGATE
B 6265
LOW
SKELL
GATE
WATER SKELLGATE
SKEL
LGAT
E
CLOSE
WIL
LIA
MS
ON
DR
IVE
SKELLGAR
THS
SOMERSET ROW
MA
LLAR
D C
L
FIRB
Y LA
NE
2 1a
DU
CK
HIL
L
Bedern Court
Club
Skel
l Gar
dens
Garag
e
Ripon C
ity Club
Surgery
HIG
H
Heath's Court
Crow
n Court
WILLIAMSON CLOSE
El S
ub S
ta
to
1 to
1 to 3
1 to 8
1 to 4
Wellington C
ott
2 to 10
Mill H
ou se
14 to 16
14 to 26
26 to 38
12 to
14
28 to
34
16
2
6
9
17
7
37
27
2a
24
26
21
23
10
59
28
54
20
6a
11
60
3a
30 29
12
18
21b
32
43
44
11a
14
25
31
22
5a 5
28a
34
40 39
13
3
1
4a
8a
42
33
53
19
15
8
4
30a
23 to 26
24
22
4
27
17
B 6265
1
18
1 to 8
5
2
2
32
31
11
17
2
PH
SK
ELL
GA
TE
4
3
33
39
22
1
17
Hal
l
Ban
k
4
1
21
21
PH
7
Ban
k
2
18
34
34
16
37
5
15
5
9
40
1
11
4
4
1
5
4
5
1
15
20
3
3
8a
Surgery
8
19
6
2
19
37
28
13
6
B 6265
2
11
PH
23
20
1
16
2
27
14
11
1
6
6
22
7
10
3
3
19
Wks
36.5m
Bel
levu
e Te
rrac
e
Ripon C
omm
unity
Spa Baths
Hosp ita l
Tow
n
Bla
ck
PH
YM
CA
Church
Ban
k
WESTGATE
KIRKGATE
LOW
SKELL
GATE
WATER SKELLGATE
CLOSE
SKELLGAR
THS
SOMERSET ROW
FIRB
Y LA
NE
21a
DU
CK
HIL
L
Club
Ske
ll G
arde
ns
Garag
e
Ripon C
ity Club
Surgery
HIG
H
Heath's Court
Crow
n Court
1 to
1 to 3
1 to 8
1 to 4
2 to 10
Mill H
ou se
14 to 16
14 to 26
26 to 38
16
2
6
9
17
7
37
27
2a
24
26
21
23
10
28
54
20
6a
11
60
3a
30
18
21b
32
44
11a
14
25
31
22
5a 5
34
40 39
13
3
1
8a
42
33
53
19
15
8
4
24
27
Ban
k
4
28
34
1
17
2
3
19
6
2
1
2
10
9
3
18
B 6265
21
20
6
4
37
4
B 6265
5
5
19
1
1
1
3
8a
11
11
PH
PH
11
22
Hal
l
34
1
39
31
1
15
Surgery
2
1 to 8
5
2
37
3
40
22
5
27
7
4
4
4
2
8
Ban
k
11
15
7
1
6
14
22
13
2
18
5
April 2011 Harrogate Borough Council
Locations of NO2 Tubes within the Harrogate District from March 2009
MastMast ""
NurseryNursery
PHPH
91.4m91.4m
ElEl Rowan GarthRowan Garth
Sub StaSub Sta EE
Cricket Ground
1ThreeThree
HorseshoesHorseshoes
(PH)(PH)
EssexEssex
CottCott
Pavilion
2323
HallHall
Otley Road, Killinghall.
LLEE EE
LL10 ""TCBsTCBs ""
""
""
EE 37.4m37.4m
HotelHotelPCPC LBLB JacksonsJacksons
""
CourtCourt Youngs Court
War
8Meml ClubClub
9 GeorgiasGeorgias
MewsMews
Ripon & District
Fisher'sFisher's 32EE.8m
6 22
58PHPH Hall 57
56 7
EE B 6265
29.7m29.7m
St Margaret's
CourtCourt55HallHall
4 PH
53
54
17
1919
2 Skellgate, Ripon.
44 Progress Report

RC Church
Church Mews
CH
UR
CH
LA
NE
BOND E
ND
BOROUGHBRIDGE ROAD
BY
AR
DS
PA
RK
ST MARGARET'S GARDENS
St Mary's
Presbytery
Stead's Yard
Ward
Bdy
7
2 to 8
121
55
50
138
6 to 9
31
3 to
9
17 to
20
118
16 to 22
2
1 to 4
1 to 5
11 to
17
15
116
115
1 to
16
57
10b
33
104
23
40
19
26
4
27
29
21a
12
6
1
116a
114 25a
25
14
10
9a
120
17
10a
132
35
21
9
5
High C
ourt
59.2
m
Path
CR
PU
MP
HILL
39
Ward Bdy
CR
BOND END
1
El Sub Sta
1
10
10
2 to 8
1 to
4
4
2
10
1
1
BO
ND
EN
D
55
5
RC Church
CH
UR
CH
LA
NE
BOND E
ND
BYA
RD
S P
AR
K
Presbytery
Stead's Yard
Ward
Bdy
7
2 to 8
121
55
50
138
6 to 9
3 to
9
17 to
20
16 to 22
2
1 to
4
1 to 5
11 to
17
15
115
1 to
16
57
10b
33
104
23
40
19
26
27
29
21a
12
6
1
116a
25a
25
14
10
120
10a
132
35
21
9
5
High C
ourt
59.2
m
Path
CR
10
CR
5
1
55
10
2
4
1
BOND END
El Sub Sta
1
1
Ward B
dy
MAR
KET
PLAC
E
Child Care Centre
Horse
mill
Marsh
all's
Court
Bank Court
Thea
tre
PINFOLD CLOSE
CHEAPSIDE
CHAPEL STREET
FISHER S
TREET
HIGH STREET
PAR
K C
RES
T
GRACIOUS S
TREET
PARK PLA
CE
PARK
SQUAR
E
CHARLTO
N MAN
OR D
RIVE
PARK
RO
W
YORK PLACE
PAR
K PA
RA
DE
CA
ST
LEG
ATE
MANOR ROAD
Yard
Library
Berry
s Pas
sage
Bowling Green
Ward Bdy
Green Dragon Yd
24
8
56
42
8a
23
1 to 6
9
Garage
5
34
48
1 to 7
60
37 to 41
50
1 to 5
1 to 16
13
31b
27b
31 to
33
59
44
46
20
28
1 to
9
38
12a
40
12b
2 to 10
32b
12
16 to 28
35
19
6
31
10
25a
11a
18
24b
29b
38a
47
16 22
5a
51
14
2a
6a
15
2
30b
11
43
17
36
57
21 27
30
25
70
7
26
32
52 33
69
1
4
75.6m
77.0
m
El Sub Sta
l4
Club
Trou
ghs
Meml G
dn
Casson House
JOCKE
Y LA
NE
Cottage
Butter L
ane
1to6 10t011
3
Bungalow
MANOR COURT
BERRY'S
3
12
1
1
21
4
El Sub
Sta
12
8 9
10
14
2
12
11
3
9
17
21
2
3
12
11
19
MAR
KET
PLAC
E
10
23
8
9
22
9
2
9
PCs
19
5
12
10
3
10
7
27
6
PAR
K R
OW
12
26
1
22
16
4
14
1
11
18
17
8
10
6
2
9
2
1
23
2
Bank 1
4
7
9
15
5
5
2
1
3
25
19
6
17
1
22
10
2
4
13
18
2
13
4
14
CASTLEGATE 1
7
24
5
2
38
11
8
4
31
Bank
21
3
13
Bank
7
3
17
9
11
15
3
12a
10
5
12
8
14
1 to 6
8
8
6
2
32
12
1
MANOR ROAD
2
7
19
30
4
12
24
3
Bank
1 to 7
El Sub
Sta
HIGH STREET
10
7
9
9
10
16
1
6
10
8
42
44
6
2
1
5
46
11
19
18
1
23
1
3
Harrogate Borough Council April 2011
3a
88
Courtyard
4
Car Park
ThornfieldThornfield
New Row CottageNew Row Cottage RectoryRectory
North StarNorth Star EE 64.0m64.0m
El Sub StaEl Sub Sta
EE 60.5m
17 51Henshaws Arts & Craft Centre PHPH
57.1m TheThe Vale CourtVale CourtEE 16Dower House HotelDower House Hotel 12 60.9m60.9m
EE 14
ShelterShelter 1113
15 9a
EE Shelter
PCPC
Church Mews55.9m55.9m 52 ForestForest
EE Collins Court
ParishParish49
Miniature Golf Course
WorksWorks
EE64.0m64.0m
Car ParkCar Park
El Sub StaEl Sub Sta ""FSFS Knaresborough HouseKnaresborough House50
Conyngham View
Bond End, Knaresborough.
"
PO 68.6m
E E 74.9m Bank Coach House
Bowling
Manor GardensFINKLE KEEP !Well
KNARESBOROUGH 5
1918E
75.6m
PH
Pinfold Court" TCBs"
"
PINFOLD FS " "
"
LBs HILL
Cliff Courtyard
Bowling Green 3 to 9Yard Market 20Cross PH
Lodge "
SILVER STREET 76.8mE
PH PH 21E
Bus Station76.5m Tel Ex
Police PH Station
Wintringham PHHouse
PH Car Park ECastle Yard 76.6m
E HotelE77.3m Church
HallE 76.2m Tannery Ct 2277.4m
StationE Castle
E53PCs
E 73.8m Putting Green
PH
Moat House 76.8mE
High Street, Knaresborough.
Progress Report 45

Star Beck
Hote
l
Prin
ce o
f Wal
es
HIGH STREET
BELM
ONT
TER
RACE
AVENUE TERRACE
SPA TERRACE
FORE
ST M
OUN
T
SPA
STRE
ET
FOREST AVENUE
BELMONT AVENUE
BRO
UG
HTO
N W
AY BE
LMO
NT G
ROVE
SPA LANE
SPA ROAD
STATION
VIEW
Subway
2c
33c
Issues
Gas Gov
3
Posts
a
6
1412
1 to
25
1 to 25
29
31
4
2b
54
56
60 to
64
34a
13
12b
58
1917
11 51
1 to 14
2
26
32
21
66
108a
55
67
33b
16
2a
1a
1b
34b
36a
54a
20 1
45
43
37
35
8078
104102
36
52
18
50
34
7
8
10
33
22
Starbeck Station
Sulphur
Shelter
Sinks
FOREST AV
AV
EN
UE
RO
AD
1
1
1
SPA LANE
33
HIG
H STR
EET
1
1
34
1
8
56
2
SPA ROAD
2
34
2a
8
1
36
12
13
1
14
50
33
4
2
11
54
13
14
6
2
2
7
4
4
13
2
20
2
18
4
4
1
13
2
1
3
1
33
WOODLANDS COURT
HOOKSTONE CHASE
ELEANO
R D
RIVE
WO
OD
LAN
DS
DR
IVE
WOOD PARK CLOSE
COACHMAN'S COURT
WETHERBY ROAD
2
7
1
12
8
23
123
22
147
169
154
152
140a
16
2a
157
18a
140
128a
133
137 110 65
3
91
59
61
158
130
162
164
160
105
99
21 121
55
68
144
138
32
7a
5
10
97
132
52
35
37
82
13 11
6
9
ED & Ward Bdy
Drain
ED Bdy
HOOKSTONE DRIVE
WO
OD
LAN
DS
AVEN
UE
ED Bdy
2
6
1
1
1
El Sub Sta
3
3
2
1
2
5
1
7
5
1
8
2
2
11
April 2011 Harrogate Borough Council E
Garage
!
Church PO St Andrew's
TCB "LB Playground "
Sunday Pennine Range
!
Stone
Allotment Gardens
El Sub Sta
82.0m EWorks
Starbeck Club Station Club
Club 84.0m E
Allotment Gardens
SL # Bank The 23Crossing Mission
!
SB
Pavilion PH
Bowling Green
E Allotment Gardens 84.1m
Swimming Baths PCs Works
Works
92.1m
House Spa Mews
FB " LB
SP #
Sub Sta High Street, Starbeck.
WOODLANDS
99.6m E 99.7m E "
E 101.3m E101.6m
E95.6m
E 102.0m TCBs WOODLANDS
26"
"
24
34 102.3m E
E 94.8m
Factory
E99.4m
Garage
97.1m EEl Sub Sta
!
!
!
!
! !!
Woodlands junction, Harrogate.
46 Progress Report

E
Bui
ldin
gs
Richmond
Nid
derd
ale
Hou
se
Cam
bridge Place
Copthall Bridge House
Esplanade Court
Parade
Baptist C
hurch
Westminster Arcade
Garrick B
uilding
Montpellier
CR
ES
CRESCENT
John Street
Bower Street
Royal B
aths II
PR
INC
ES
ST
RE
ET
MONTPELLIER HILL
Oxford P
lace
GA
RD
EN
S
TER
RA
CE
CHELTENHAM
MONTPELLIER GARDENS
MO
NTP
ELLIE
R S
TR
EE
T
BOWER STREET
MO
NT
PE
LLIER
SQ
UA
RE
MO
NT
PE
LLIE
R R
OA
D
CHELTENHAM ROAD
ESPLANADE
Oxford Street
RO
AD
OXFORD STREET
CAMBRIDGE
STATION BRIDGE
CA
MB
RID
GE
RO
AD
PARLIAMENT TERRACE
PARADE
JAMES STREET
STA
TIO
N P
AR
AD
E
EAS
T PA
RA
DE
EA
ST
HAY
WR
A
(subway)
3A 4A
One Arch
Crescent
Warehouse
Baths
Ward B
dy
Cro
ss J
ames
Str
eet
48
3
35 37
20
53
8a
to
2b
2 to 4
59
15
55
1 to 7
22 to 30
32
36
16
1
28 to 32
8
51
36 to 40
42
7 to 10
7 to 11
6 to 2
7
2
21 to 27
10 to 14
22a
18 to 21
31 34
64 to 68
13a
11a
4b
22b
29
27 to 31
4a
63
12a
18a
13
44
52
10
23 62a
16a
47
50a 50
18
19
9 11
40
49
54
22
6a
4 5
58b
30
33
14
58
46
38
68
70
1a
24
45
28
24a
60
36a
12
56
41
21
26
25
17
27
6
Beulah S
treet
Sub Sta
Montpellier Parade
Market P
lace
Car Park
Information Centre
Northum
berland Court
Sloane Cottage
Parliament
PARLIAM
ENT
CR
THE GINNEL
GP
STREET
PH
PR
OS
PE
CT
PLA
CE
El
HA
YW
RA
STR
EE
T
MO
NTP
ELL
IER
48
1
38
8
21
25 8
28
15
3
7
9
2
24
5
37
9
22
22
7
1
10
18
PH
10
1
12a
1
2
5
CR
ES
CE
NT
3
12
3
1
17
46 50
3
4
10
3
2
16
23
20
FB
1
26
46 42
7
10
8
1
51
6
37
13
47
9
2
3
15
5
42
24
7
26
55
45
21
19
2
3
9
3
58 6
5
4
20
1
8
1
CR
ES
CE
NT
4
28
1
19
26
7
2
14
3
10
15
34
20 14
4
9
6
9
18
13
15
9 47
4
1
6
45
1
26
4
37
12
11
37
4
MONTPELLIER HILL
38
19
3
16
8
18
2
TCBs
2
9
Oxford
23 2
8
1
5
21
4
Baths
18
7
10
20
11
1
10
2
1
17
5
11
1 16
36
CH
ELTEN
HA
M
19
34
12
4
8
35
49
Car P
ark
23
6
12
13
3
14
12
3
4
9
2
11
Buildings
EAST PARAD
E
8
33
3
11
12
16
31
13
3
6
4
12
17
26
9
17
17
40
TCBs
9
6
59
34
1
2
7
2
8
6
18
1 10
5
3
19
THE GINNEL
5
13
10
4
26
Prospect
6
32
6
BOWER STREET
4
35
2
Harrogate
Parade
7
34
17
3
1
7
19
23
12
1
1
11
7
13
38
Syke Dike
A 1
68
Def 1.22m RH
Def
Def
A 168
1.22m RH
Harrogate Borough Council April 2011
Multistorey Car Park 117.6m
1 VIC
TO
IR
RO
AA
D
115.5m
25 PH
1
Pteer
gate
122.2m
E
Sub Sta Hotel Baines
House99.7m E
Multistorey 106.8mE OxfordCar Park Buildings 115.8mEE110.9mE 115.3mE 41114.5m
E
E112.6m Town Centre
#SPEl "
"Sub Sta Harrogate Theatre SB ClubE103.3m
SP # Car Park
E
ChapelEl Sub Sta
Hall"
Posts 109.0m El PostsEE"" "
Victoria Car Park
114.9m E
"PH HPO "
PC
E SurgeryClub
E Car Park Sub Sta 121.6m
E E102.9m 119.8mESt Peter's Church
CamEbridge Street TCBs
" "
PH 42Bank HARROGATE Arthington"
BankTCB E118.3mBank "TCPs "
5 Victoria GardensPosts 116.7m BankE HarrogateCAMBRIDGE CRESCENT SubSta
ProspectE115.2m The Exchange
WarMemorial "
E"
"
TCB's"
Jubilee
123.2m Cinema
STATION SQUARELOW E Monument""
TCBs Roof120.4mPC Car Park" LBThe Stray Shelter Bank Bank 23HotelTwo Hundred Acre Bank 1a 1 11 9
3 1PC 124.4mEFB PH
432a
HotelHotel
ALBEERT STREET
PHEl Sub Sta Victoria House
E L
Harrogate Town Centre, Harrogate.
Water
The Old Police House
2744
Corner Cottage
North Road
The A1 at Walshford.
Progress Report 47

CR
ES
CE
NT
HA
RLO
W C
RE
SC
EN
T
PA
NN
AL
AS
H C
RE
SC
EN
T
HA
RLO
W
HA
RLO
W P
AR
K D
RIV
E
HA
RLO
W P
AR
K R
OA
D
PANNAL ASH DRIVE
PA
NN
AL
AS
H R
OA
D
PA
NN
AL A
SH
GR
OV
E
9
2 10
13
50
86
99
37
29
85
73
64
76
61
40
103
14
24 21
48
54 60
55
42
39
18
46
44
81
32
27
15
102
25
104
43
52
34
28
38
22
26
35
12
49 20
100
23
96
62
1
11
8
6
21
11
5 2
53
24
26
23
28
8
2
PA
NN
AL
AS
H D
RIV
E
1
2
48
39
26
1
2
42
PANNAL ASH DRIVE
14
25
28
26
38
1
27
15
38
15
52
49
40 49
11
Station Gas Distribution
Little Wonder
PARK HOUSE GREEN RIPO
N R
OAD
WE
ST
STR
EE
T
NE
W P
AR
K R
OW
QUARRY LANE
OMEGA STREET
300 a to f
1
46
24
1 to 5
19
62
359
43
22
308
302
10
377
23
220
363
210
44
306
296
29
204
4
18
60
21
32
74
298
12
16
314
68
13
20
17
212
7
5
33
6 6
2
3
QUARRY
Eastville
TCB
Southville Terrace
(PH)
Terrace
4
2
1
12
1
2
2
1
1
Terrace
April 2011 Harrogate Borough Council
LB
Blue Cottage
795
673
51
119
1
90
E 159.2m
" 28
LB "
E 163.4m
TCB "
Club
Urban background, Harlow Crescent, Harrogate.
EE
TT
PA
KS
RR
Close
Posts
6 to 19
Park House Ct
Memorial Garden
North View
Prospect Cotts
69.3m E West
ViewOld Beck Bridge
29FB E
79.1m
El Sub Sta
E 84.0m Gas
Holder Gas Holder
88.8mE
"
Harrogate,
New ParkPipeline
Community
Primary School
FB
Radio E
Little Wonder roundabout, Harrogate
48 Progress Report
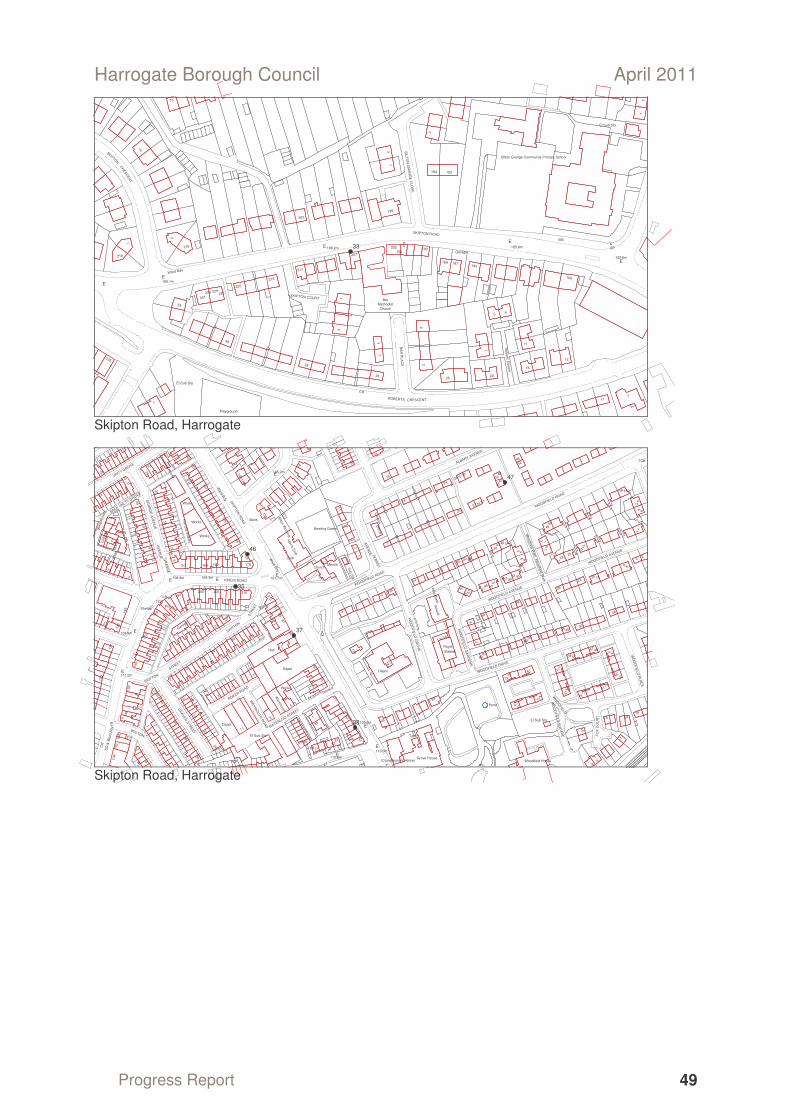
CRESCENT ROBERTS
SKIPTON COURT
BILT
ON
GR
AN
GE
CLO
SE
SKIPTON
SKIPTON ROAD
BA
R P
LAC
E
Ward Bdy
Roberts S
quare
8 4
203201
6
26
2
193
190
217
18
231 229
225
233 227
199
5
187 189
12
202
183
11
73
216
7
48
1 3
169
218
14
235
207
219
28
58
38
20
CR
1
1 3
CRESCEN
T
1
1
2
1
1
2
2
3
Gospel
Woodfield
Men's C
lub
Bilton Working W
oodfield Walk
BOLTON
STREET
ROKER ROAD
WO
ODFIELD
WO
OD
FIELD
GA
RD
EN
S
WO
OD
FIELD
PLA
CE
SKIPTON
WO
OD
FIELD
SQ
UA
RE
WOODFIELD DRIVE
WOODFIELD ROAD
CRAVEN
STREET
SKIPTON
RO
AD
WOODFIELD AVENUE
GR
AN
GE
WATERLOO STREET
WO
OD
FIELD
GR
OV
E
KING'S ROAD
BACK UNLTY GROVE
GR
AN
GE
AV
EN
UE
A
VE
NU
E
WEYM
OU
TH R
OAD
UNITY GROVE
ALBA
NY
Office
Terrace
Warehouse
Ward Bdy
Chadw
ick House
Uni
ty
5
1
a
Garage
82 84
78 76
12 13
41
38
37 39
42
40
4 2
7375
27 to 33
26 to 32
1 to 20
57
60
51
49 12b 53
6
46 44
81 83
138
21
136
95
14
79
25
28
59
30
182
142
91b
8
36
85
29 19
52
31 33
131
139
34
172
140
146
22
121
24
47
20
63
109
87
206
165 157
125
149
71 69
192
133
91a
105
137
26
11
23
110
9
7
93
27
18
32
35
61
158
58
138a
10
89
160
6a 16
4a
2a
43
45
15
4850
3 St John's
Sub Sta
The Old S
tables
ED
& W
ard
Bdy
Council
Win
sley
C
otta
ge
FO
X C
OU
RT
CR
Gra
nge
17
ALBANY AVENUE
4
146
STR
EET
44
7 6
2
28
5
Cot
tage
10
4
26
9 105
1
WOODFIELD ROAD
8
6
14
34
29
10
14
24
1
18
2
93
28
18
14
1
40
48
14
23
45
33
81
18
11
18
2
5
71
43
1
1
2
73
26
2
11
6
1
Ward Bdy
4 3
38
2
28
4
2
2
4
11
Woodfield W
alk
17
26
AVE
NU
E
3
2
6
19
8
8
7 29
1
1
8
47
44
45
31
57 24
Bank
1
29
19
23
3
5
1
11
16
60
2
15
1
3
3
2
46
11
42
13
WOODFIELD AVENUE
25
9
6
14 16
1
SKIPTON
2
53
36
8
2
31
4
14
23
1
7
3
Harrogate Borough Council April 2011
El Sub Sta
Bilton Grange Community Primary School
184 182
"
MSE E 106.2m 33 105.8m GP
Garage
105.6m E
E 106.1mE
Bar Methodist Church
El Sub Sta
Playground Skipton Road, Harrogate
TCB
105.2mE 47
Works
Works Bank
Bowling Green
Works
46 Club
179 Manse169 Church
E108.9m 108.3m 107.7mEE
35 200 216
LB TCB
" "
POShelter
37E109.9m
Royal StablesHall
DepotE Depot 111.0m
Works
Pond
El Sub Sta38109.6mE Depot E
El Sub Sta Tank
E 110.0m
E110.6m Grove House
(Convalescent Home) Woodfield House
E
Skipton Road, Harrogate
Progress Report 49

DEVONSHIREPLACE
ESTMORELANDSTREET
REGENT
PARADE
SKIPTON
ROAD
Thompsons Yard
1a
Passage
4
21
22
23
24
11
13 to19
12
18
3
2
115
30 1 to7
27
25
10
10a
8a
7b
8
10b
5 5a
14
20
33
42
104 31
7
35
13
11a
20a
6
9
15
1
Westmoreland
LB
Byron
Cottage
Coach
LIM
EG
RO
VE
25
18
12a
15
5
14
9
3
10
18
22
21
1
12
4
23
2
23
8
7
22
9 11
2
20
2 10
6
6
House
April 2011 Harrogate Borough Council
E
12a
12b
Club
1 to 16
Ashmore
House
E 39118.6m Bowling Green
Mornington
Mews Pavilion
PH"
TCB Garage
E 118.6m
40 El
45 PHSub Sta
E
36 "
118.2m
PC
Warehouse El
Sub E W Garage
Sta
The Stray 119.2mTrades Hall or
Two(Club) Hundred
Skipton Road, Harrogate
These maps are based upon Ordnance Survey material with the permission of Ordnance Survey on behalf of the Controller of Her Majesty’s Stationery Office © Crown copyright.
Unauthorised reproduction infringes Crown copyright and may lead to prosecution or civil proceedings. (100019628) (2010).
Progress Report 50

Harrogate Borough Council April 2011
Appendix B: QA:QC Data
The details of the nitrogen dioxide diffusion tube preparation and analysis and QA/QC information are as follows:
Preparation Method
The laboratory prepares the tubes by dosing with Triethalanamine/Acetone 50/50 on to the grids before assembly. The exposed tubes are desorbed using distilled water and the extract analysed using 0.14% N.E.D.A., 2% Sulphanilamide, 5% Orthophosphoric Acid combined reagent and a DR2800 spectrophotometer.
The Laboratory follows the procedures set out in the Harmonisation Practical Guidance.
Bias-adjustment factor and co-location study
Harrogate Borough Council have conducted a co-location survey of nitrogen dioxide diffusion tubes since 2002, allowing the concentrations of nitrogen dioxide obtained from the diffusion tubes to be compared with the concentrations of nitrogen dioxide measured by the continuous chemiluminescent analyser housed in the council’s air quality monitoring station (AQMS).
As the council has not conducted any automatic monitoring of nitrogen dioxide since the start of 2007 this has no longer been possible, and an alternative means of obtaining a co-location factor has been required.
For this reason since July 2007 triplicate tubes have been sent to Hambleton District Council forming an in-house co-location study. However, in the past the results of this study have been poor and, following guidance in TGN.09 and advice from Review and Assessment Helpdesk operated by Air Quality Consultants Ltd, the published bias adjustment factors of the laboratory on the University of the West of England (UWE) website (http://www.uwe.ac.uk/aqm/review/) is preferred.
Using this spreadsheet, (as reproduced in Appendix D) the bias adjustment factor based on other local authorities that use the same tube supplier and preparation method (Kirklees MBC Scientific Services) for 2010 is 0.78. This bias adjustment factor is the product of only one study, and therefore should be used with caution.
Progress Report 51

April 2011 Harrogate Borough Council
Diffusion Tube Bias Adjustment Factors
The bias adjustment factor as published on the website is produced below.
The bias adjustment factor used for the monitoring throughout the report is 0.78
Results of laboratory precision and WASP scheme
Kirklees MDC Scientific Services take part in the Workplace Analysis Scheme for Proficiency (WASP) inter comparison scheme. The laboratory performance in the latest round of testing (Apr 2009 – Apr 2010) it was ranked as ‘good’ under the old criteria and are “acceptable” under the new criteria.
Progress Report 52

Harrogate Borough Council April 2011
Appendix C:
Nitrogen Dioxide Diffusion Tube Monitoring Data For 2010
Progress Report 53

April 2011 Harrogate Borough Council Results micrograms/m3 National Bias Factor = 0.78
Jan Feb Mar Apr May Jun Jul Aug Sep Oct Nov Dec Average
Corrected for lab bias
Data Capture %
1. Killinghall, Res 28.80 39.30 28.45 31.13 28.27 27.42 44.72 19.40 16.24 15.48 25.03 39.75 28.67 22.36 100 2. Rip, Low Skellgate, Res (24) 32.46 46.52 21.64 31.44 30.24 24.76 37.33 23.89 30.17 ND ND 43.56 32.20 25.12 83 3. Rip, Low Skellgate, Res (8a) 44.12 92.95 40.15 54.32 39.69 58.37 68.48 47.02 57.17 34.74 20.61 109.42 55.59 43.36 100 4. Rip, Low Skellgate, Res (5A) 47.40 78.52 37.11 64.82 57.63 60.62 73.10 52.31 34.05 33.07 45.36 70.36 54.53 42.53 100 5. Rip, Low Skellgate, Res (5A) 62.45 71.14 52.29 70.48 64.03 59.27 74.46 53.16 54.76 44.98 0.48 92.10 58.30 45.47 100 6. Rip, Waterskellgate, Res (26) 37.35 40.79 47.40 33.73 25.60 26.59 24.44 26.98 16.92 10.92 47.54 50.76 32.42 25.29 100 7. Rip, Low Skellgate, Res (1) 40.49 45.74 24.29 44.12 34.55 34.88 41.27 29.17 17.85 20.30 39.98 67.28 36.66 28.60 100 8. Rip, High Skellgate, Res (24) 46.43 56.31 37.51 58.81 50.46 47.08 55.51 43.91 52.15 ND ND 85.13 53.33 41.60 83 9. Rip, High Skellgate, Res (9) 37.78 57.02 49.01 51.29 29.41 45.96 45.56 47.34 46.60 22.28 55.65 47.68 44.63 34.81 100 10.Rip, Westgate, Res (3a) 49.82 62.52 35.98 48.39 25.29 38.60 37.17 35.02 28.67 30.44 47.93 76.47 43.02 33.56 100 11. H3 X ND ND 52.37 42.82 26.79 31.02 31.36 34.70 31.10 ND 45.87 84.47 42.28 32.98 75 12. Kn, VC, Bond End, Res 28.29 52.87 33.82 34.83 41.06 36.45 41.94 35.21 38.42 24.45 46.91 71.99 40.52 31.61 100 13. Kn, Bond End, Res (21a) 30.57 56.64 34.31 58.47 50.86 53.73 58.45 46.15 52.03 43.07 39.55 89.02 51.07 39.83 100 14. Kn, Bond End, Res (9) 51.20 67.47 38.76 68.66 53.65 57.43 61.29 54.66 30.12 40.69 64.50 82.53 55.91 43.61 100 15. Kn, Bond End, Res (117) 21.81 41.84 54.59 54.94 39.96 42.89 52.43 44.14 46.52 24.59 39.20 66.70 44.13 34.42 100 16. Kn, Bond End, Res (HHJ) 42.54 59.57 34.91 46.88 22.03 46.09 31.71 37.10 36.13 8.40 15.90 69.25 37.54 29.28 100 17. Kn, Bond End, Res (22) 22.80 51.82 25.13 43.63 28.43 43.42 63.05 33.89 15.33 25.60 39.85 51.06 37.00 28.86 100 18. Kn, High Street, Res/1hr (Dry Cleaners) 55.55 58.14 25.53 40.38 25.13 33.69 39.09 29.48 30.93 17.67 41.89 62.61 38.34 29.91 100 19. Kn, High Street, Res/1hr (Gift Shop) 36.57 30.62 33.63 44.94 33.47 37.49 37.67 35.56 34.43 18.25 11.19 58.64 34.37 26.81 100 20. Kn, High Street, Res/1hr (Music Shop) 40.85 55.65 42.60 41.62 41.12 36.94 38.12 35.86 39.62 21.27 34.26 60.27 40.68 31.73 100 21. Kn, High Street, Res (Barbers) 42.25 68.97 24.89 ND 45.18 ND ND 49.92 ND 31.66 46.62 ND 44.21 34.49 58 22. Kn, York Place, Res (14) 50.42 45.97 43.40 47.29 37.98 42.40 53.84 39.97 43.79 31.69 52.93 79.71 47.45 37.01 100 23. Starbeck, Kn Rd, Res (Level Crossing) 34.60 41.32 0.24 32.41 21.57 24.26 35.28 22.47 22.16 14.04 35.69 46.60 27.55 21.49 100 24. Harr, Hookstone Chase, Res (Pub) 38.84 53.98 13.33 36.96 30.84 34.03 74.08 37.95 24.92 19.96 51.86 75.91 41.05 32.02 100 25. Harr, Parliament St (Wagamama) 24.51 40.80 11.05 26.96 22.07 15.67 21.12 18.82 9.28 8.30 28.56 40.36 22.29 17.39 100 26. Harr, Wetherby Rd, Res (Pub) 30.89 57.99 25.30 55.55 45.03 44.22 76.70 52.52 47.37 28.55 64.04 74.64 50.23 39.18 100 27. Whalsford, Old Police House. 25.99 46.75 28.04 54.85 41.62 44.60 52.66 48.16 30.31 28.15 28.24 76.12 42.13 32.86 100 28. Harr, 77 Harlow Cresecent, Res, Urban 16.24 24.77 12.66 10.76 9.66 8.95 22.20 7.48 12.15 -4.44 24.03 ND 13.13 10.24 92 29. Harr, Little Wonder, Res. 36.37 47.63 29.13 46.12 30.81 40.13 47.29 43.10 47.83 28.11 ND 66.44 42.09 32.83 92
Progress Report 54

Harrogate Borough Council April 2011 33. Harr, Skipton Rd, Res (207) 35.10 27.87 16.10 40.53 31.98 34.34 62.83 31.54 31.69 18.69 39.64 45.75 34.67 27.04 100 34. Harr, Wetherby Rd, (Pub Lamppost) 40.88 69.07 39.83 36.34 48.73 30.75 50.58 18.56 40.82 20.98 63.40 90.44 45.86 35.77 100 35. Harr, Kings/Sk Rd Jun, Res (208) 28.72 42.90 24.76 22.71 26.59 30.62 27.60 27.70 32.37 20.52 37.80 56.40 31.56 24.61 100 36. Harr, Westmoreland St, Res (8-10) 52.52 40.76 29.14 37.10 32.15 28.62 35.38 25.86 28.18 16.22 11.67 57.05 32.89 25.65 100 37. Harr, Skipton Rd, Res (87/Bingo) 52.51 46.93 34.96 42.78 29.91 37.70 44.56 38.23 29.74 21.78 45.16 72.05 41.36 32.26 100 38. Harr, Skipton Rd, Res (59) 50.25 48.93 35.89 44.76 31.83 35.71 54.88 38.93 33.99 20.32 47.78 48.08 40.95 31.94 100 39. Harr, Devonshire Place, Res (6) 15.56 61.62 44.68 50.64 40.30 45.05 46.66 38.87 37.37 29.32 51.83 76.22 44.84 34.98 100 40. Harr, Westmoreland St, Res (Music Shop) 46.26 56.93 42.35 40.30 36.49 34.35 43.04 37.28 ND 7.10 44.38 59.59 40.73 31.77 92 41. Harr, In to Bus Station, 1hr 33.37 41.48 34.29 32.55 25.76 29.45 48.25 40.09 31.98 24.37 38.24 65.52 37.11 28.95 100 42. Harr, Opposite Railway St, 1 hr 45.83 73.63 48.61 71.90 54.92 47.97 70.50 39.60 29.71 33.82 58.11 55.71 52.53 40.97 100 43. Harr, Edisons, Station Parade, Res 35.75 50.22 27.19 28.86 27.58 28.46 32.14 26.42 31.53 11.36 43.31 39.94 31.90 24.88 100 44. Walshford, Residential, Old Police House. 29.32 58.28 32.36 43.96 32.02 41.67 53.35 51.76 36.68 20.81 48.28 68.13 43.05 33.58 100 45. Harr, Devonshire Pl res. (15) 13.09 64.23 53.06 54.98 ND 44.77 39.13 42.71 46.53 32.74 60.11 91.26 49.33 38.48 92 46. Harr, Skipton Rd res. (93) 36.95 33.36 28.41 35.65 28.35 30.30 30.88 27.11 36.46 13.81 21.49 77.57 33.36 26.02 100 47. Harr, Woodfield Road (43) 14.05 25.94 22.81 17.98 11.91 11.19 13.70 14.44 14.68 -2.13 ND 41.77 16.94 13.21 92 49. Kn, Bond End (29) 44.00 43.40 44.93 35.51 34.59 0.00 56.28 31.10 32.81 17.21 35.96 52.16 35.66 27.82 100 50. Kn, Bond End (55) 38.90 41.11 35.59 41.72 38.58 41.63 73.68 39.49 40.02 23.94 41.12 53.96 42.48 33.13 100 51. Kn, The Royal Oak 49.80 89.29 60.92 48.55 49.14 43.32 36.01 47.30 46.53 32.40 72.18 104.09 56.63 44.17 100 52. Kn, High St (120) 31.94 55.52 38.88 56.72 48.73 20.04 43.92 33.37 43.95 32.53 44.55 57.51 42.31 33.00 100 53. Kn, The Royal Tannery, York Pl 36.68 47.10 25.61 41.19 32.68 41.82 52.20 46.70 40.49 18.07 37.76 64.45 40.39 31.51 100 54. Rip, Low Skellgate (30) 28.40 52.37 3.81 50.98 18.60 41.43 57.89 34.50 42.38 22.39 41.22 58.18 37.68 29.39 100 55. Rip, Turks Head Low Skellgate 35.63 50.54 34.22 41.24 33.96 41.44 66.79 31.00 19.39 18.15 26.74 59.87 38.25 29.83 100 56. Rip, Crown Ct, Waterskellgate 37.19 39.51 34.54 38.81 16.89 35.38 30.67 32.94 26.92 13.68 32.93 59.94 33.28 25.96 100 57. Rip, Waterskellgate (6/6a) 53.57 48.01 43.32 40.71 40.51 38.53 43.79 ND 31.21 24.19 44.15 62.94 42.81 33.39 92 58. Rip, Waterskellgate (17) 29.88 40.87 33.58 36.37 23.72 31.21 65.11 34.02 30.59 21.36 52.93 59.53 38.26 29.84 100
Progress Report 55

April 2011 Harrogate Borough Council
Progress Report 56