2011 annual report to · pdf file(millions — except per share amounts) 2011 2010 ... net...
TRANSCRIPT

2011 Annual Report to Shareholders
The Progressive Corporation

The Progressive Corporation and SubsidiariesConsolidated Statements of Comprehensive Income
For the years ended December 31,
(millions — except per share amounts) 2011 2010 2009
Revenues
Net premiums earned $14,902.8 $14,314.8 $14,012.8Investment income 480.0 520.1 507.0Net realized gains (losses) on securities:
Other-than-temporary impairment (OTTI) losses:Total OTTI losses (6.0) (19.1) (80.9)Non-credit losses, net of credit losses recognized on previously recorded
non-credit OTTI losses .5 5.2 40.1
Net impairment losses recognized in earnings (5.5) (13.9) (40.8)Net realized gains (losses) on securities 108.1 110.0 67.9
Total net realized gains (losses) on securities 102.6 96.1 27.1Service revenues 22.8 25.9 16.7Net gains (losses) on extinguishment of debt (.1) 6.4 0
Total revenues 15,508.1 14,963.3 14,563.6
Expenses
Losses and loss adjustment expenses 10,634.8 10,131.3 9,904.9Policy acquisition costs 1,399.2 1,359.9 1,364.6Other underwriting expenses 1,821.5 1,740.1 1,567.7Investment expenses 13.5 11.9 11.1Service expenses 19.4 21.4 19.4Interest expense 132.7 133.5 139.0
Total expenses 14,021.1 13,398.1 13,006.7
Net Income
Income before income taxes 1,487.0 1,565.2 1,556.9Provision for income taxes 471.5 496.9 499.4
Net income 1,015.5 1,068.3 1,057.5
Other Comprehensive Income (Loss), Net of Tax
Net unrealized gains (losses) on securities:Net non-credit related OTTI losses, adjusted for valuation changes (3.6) 13.9 (15.7)Other net unrealized gains (losses) on securities (80.9) 323.2 712.3
Total net unrealized gains (losses) on securities (84.5) 337.1 696.6Net unrealized gains on forecasted transactions (6.8) (6.9) (3.3)Foreign currency translation adjustment .1 .3 1.4
Other comprehensive income (loss) (91.2) 330.5 694.7
Comprehensive income $ 924.3 $ 1,398.8 $ 1,752.2
Computation of Net Income Per Share
Average shares outstanding — Basic 632.3 657.9 666.8Net effect of dilutive stock-based compensation 4.6 5.4 5.4
Total equivalent shares — Diluted 636.9 663.3 672.2
Basic: Net income per share $ 1.61 $ 1.62 $ 1.59
Diluted: Net income per share $ 1.59 $ 1.61 $ 1.57
See notes to consolidated financial statements.
App.-A-2
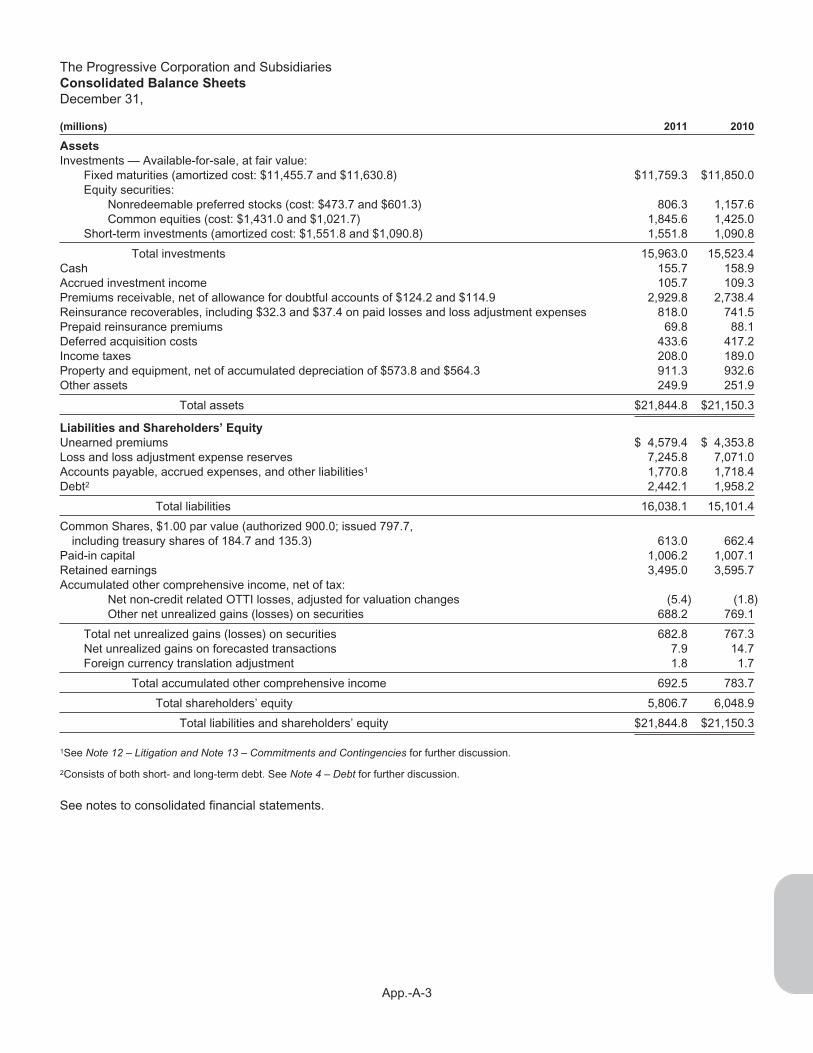
The Progressive Corporation and SubsidiariesConsolidated Balance Sheets
December 31,
(millions) 2011 2010
Assets
Investments — Available-for-sale, at fair value:Fixed maturities (amortized cost: $11,455.7 and $11,630.8) $11,759.3 $11,850.0Equity securities:
Nonredeemable preferred stocks (cost: $473.7 and $601.3) 806.3 1,157.6Common equities (cost: $1,431.0 and $1,021.7) 1,845.6 1,425.0
Short-term investments (amortized cost: $1,551.8 and $1,090.8) 1,551.8 1,090.8
Total investments 15,963.0 15,523.4Cash 155.7 158.9Accrued investment income 105.7 109.3Premiums receivable, net of allowance for doubtful accounts of $124.2 and $114.9 2,929.8 2,738.4Reinsurance recoverables, including $32.3 and $37.4 on paid losses and loss adjustment expenses 818.0 741.5Prepaid reinsurance premiums 69.8 88.1Deferred acquisition costs 433.6 417.2Income taxes 208.0 189.0Property and equipment, net of accumulated depreciation of $573.8 and $564.3 911.3 932.6Other assets 249.9 251.9
Total assets $21,844.8 $21,150.3
Liabilities and Shareholders’ Equity
Unearned premiums $ 4,579.4 $ 4,353.8Loss and loss adjustment expense reserves 7,245.8 7,071.0Accounts payable, accrued expenses, and other liabilities1 1,770.8 1,718.4Debt2 2,442.1 1,958.2
Total liabilities 16,038.1 15,101.4
Common Shares, $1.00 par value (authorized 900.0; issued 797.7,including treasury shares of 184.7 and 135.3) 613.0 662.4
Paid-in capital 1,006.2 1,007.1Retained earnings 3,495.0 3,595.7Accumulated other comprehensive income, net of tax:
Net non-credit related OTTI losses, adjusted for valuation changes (5.4) (1.8)Other net unrealized gains (losses) on securities 688.2 769.1
Total net unrealized gains (losses) on securities 682.8 767.3Net unrealized gains on forecasted transactions 7.9 14.7Foreign currency translation adjustment 1.8 1.7
Total accumulated other comprehensive income 692.5 783.7
Total shareholders’ equity 5,806.7 6,048.9
Total liabilities and shareholders’ equity $21,844.8 $21,150.3
1See Note 12 – Litigation and Note 13 – Commitments and Contingencies for further discussion.
2Consists of both short- and long-term debt. See Note 4 – Debt for further discussion.
See notes to consolidated financial statements.
App.-A-3

The Progressive Corporation and SubsidiariesConsolidated Statements of Changes in Shareholders’ Equity
For the years ended December 31,
(millions — except per share amounts) 2011 2010 2009
Common Shares, $1.00 Par Value
Balance, Beginning of year $ 662.4 $ 672.6 $ 676.5Stock options exercised 2.0 3.4 3.5Treasury shares purchased (51.3) (13.3) (11.1)Net restricted stock awards issued (forfeited) (.1) (.3) 3.7
Balance, End of year $ 613.0 $ 662.4 $ 672.6
Paid-In Capital
Balance, Beginning of year $1,007.1 $ 939.7 $ 892.9Stock options exercised 20.4 23.8 15.3Tax benefit from exercise/vesting of stock-based compensation 6.4 14.0 9.7Treasury shares purchased (80.7) (19.3) (15.0)Net restricted stock awards (issued) forfeited .1 .3 (3.7)Amortization of stock-based compensation 50.3 44.8 39.2Other 2.6 3.8 1.3
Balance, End of year $1,006.2 $1,007.1 $ 939.7
Retained Earnings
Balance, Beginning of year $3,595.7 $3,683.1 $2,697.8Cumulative effect of change in accounting principle 0 0 189.6Net income 1,015.5 1,068.3 1,057.5Cash dividends declared on common shares ($.4072, $1.3987,
and $.1613 per share) (248.1) (924.8) (108.5)Treasury shares purchased (865.8) (226.0) (154.5)Other, net (2.3) (4.9) 1.2
Balance, End of year $3,495.0 $3,595.7 $3,683.1
Accumulated Other Comprehensive Income, Net of Tax
Balance, Beginning of year $ 783.7 $ 453.2 $ (51.9)Cumulative effect of change in accounting principle 0 0 (189.6)Other comprehensive income (loss) (91.2) 330.5 694.7
Balance, End of year $ 692.5 $ 783.7 $ 453.2
Total Shareholders’ Equity $5,806.7 $6,048.9 $5,748.6
There are 20.0 million Serial Preferred Shares authorized; no such shares are issued or outstanding.There are 5.0 million Voting Preference Shares authorized; no such shares have been issued.
See notes to consolidated financial statements.
App.-A-4

The Progressive Corporation and SubsidiariesConsolidated Statements of Cash Flows
For the years ended December 31,
(millions) 2011 2010 2009
Cash Flows From Operating Activities
Net income $ 1,015.5 $ 1,068.3 $ 1,057.5Adjustments to reconcile net income to net cash provided by operating activities:
Depreciation 88.5 83.1 87.3Amortization of fixed-income securities 233.0 229.2 230.8Amortization of stock-based compensation 50.5 45.9 40.3Net realized (gains) losses on securities (102.6) (96.1) (27.1)Net (gains) losses on disposition of property and equipment 8.7 2.3 13.3Net (gains) losses on extinguishment of debt .1 (6.4) 0Changes in:
Premiums receivable (191.4) (283.6) (46.2)Reinsurance recoverables (76.5) (176.7) (276.3)Prepaid reinsurance premiums 18.3 (18.8) (6.9)Deferred acquisition costs (16.4) (15.0) 11.8Income taxes 28.4 48.1 29.7Unearned premiums 225.6 180.8 (3.0)Loss and loss adjustment expense reserves 174.8 418.0 475.6Accounts payable, accrued expenses, and other liabilities 35.5 210.2 (71.8)Other, net 5.9 (10.0) (28.2)
Net cash provided by operating activities 1,497.9 1,679.3 1,486.8
Cash Flows From Investing Activities
Purchases:Fixed maturities (6,032.4) (4,491.7) (10,046.3)Equity securities (582.0) (511.4) (624.2)
Sales:Fixed maturities 4,442.6 3,055.8 7,950.0Equity securities 423.5 241.9 919.4
Maturities, paydowns, calls, and other:Fixed maturities 1,540.9 1,341.1 842.5Equity securities 0 0 15.7
Net sales (purchases) of short-term investments – other (461.0) (11.5) 75.6Net unsettled security transactions (.6) (54.0) (246.5)Purchases of property and equipment (78.9) (64.7) (66.6)Sales of property and equipment 3.0 8.0 1.8
Net cash used in investing activities (744.9) (486.5) (1,178.6)
Cash Flows From Financing Activities
Proceeds from exercise of stock options 22.4 27.2 18.8Tax benefit from exercise/vesting of stock-based compensation 6.4 14.0 9.7Proceeds from debt issuance 491.9 0 0Reacquisition of debt (15.0) (214.3) 0Dividends paid to shareholders (263.6) (763.7) 0Acquisition of treasury shares (997.8) (258.6) (180.6)
Net cash used in financing activities (755.7) (1,195.4) (152.1)
Effect of exchange rate changes on cash (.5) .8 1.7
Increase (decrease) in cash (3.2) (1.8) 157.8Cash, Beginning of year 158.9 160.7 2.9
Cash, End of year $ 155.7 $ 158.9 $ 160.7
See notes to consolidated financial statements.
App.-A-5

The Progressive Corporation and SubsidiariesNotes to Consolidated Financial Statements
December 31, 2011, 2010, and 2009
1. REPORTING AND ACCOUNTING POLICIES
Nature of Operations The Progressive Corporation, an insurance holding company formed in 1965, owned 54 subsidiariesand had 1 mutual insurance company affiliate (collectively the “subsidiaries”) as of December 31, 2011. Our insurancesubsidiaries provide personal and commercial automobile insurance and other specialty property-casualty insurance andrelated services. Our Personal Lines segment writes insurance for personal autos and recreational vehicles through both anindependent insurance agency channel and a direct channel. Our Commercial Auto segment writes primary liability andphysical damage insurance for automobiles and trucks owned by small businesses through both the independent agencyand direct channels. We operate our businesses throughout the United States; we also sell personal auto physical damageinsurance via the Internet in Australia.
Basis of Consolidation and Reporting The accompanying consolidated financial statements include the accounts of TheProgressive Corporation, its subsidiaries, which are wholly owned, and a mutual company affiliate, for which we have acontrolling financial interest. All intercompany accounts and transactions are eliminated in consolidation.
Estimates We are required to make estimates and assumptions when preparing our financial statements andaccompanying notes in conformity with accounting principles generally accepted in the United States of America (GAAP).As estimates develop into fact (e.g., losses are paid), results may, and will likely, differ from those estimates.
Investments Progressive’s fixed-maturity securities, equity securities, and short-term investments are accounted for on anavailable-for-sale basis. See Note 2 – Investments for details regarding the composition of our investment portfolio.
Fixed-maturity securities include debt securities and redeemable preferred stocks, which may have fixed or variableprincipal payment schedules, may be held for indefinite periods of time, and may be used as a part of our asset/liabilitystrategy or sold in response to changes in interest rates, anticipated prepayments, risk/reward characteristics, liquidityneeds, or other economic factors. These securities are carried at fair value with the corresponding unrealized gains (losses),net of deferred income taxes, reported in accumulated other comprehensive income. Fair values are obtained fromrecognized pricing services or are quoted by market makers and dealers, with limited exceptions discussed in Note 3 – FairValue.
Included in the fixed-maturity portfolio are asset-backed securities. The asset-backed securities are generally accounted forunder the retrospective method. The retrospective method recalculates yield assumptions (based on changes in interestrates or cash flow expectations) historically to the inception of the investment holding period, and applies the requiredadjustment, if any, to the cost basis, with the offset recorded to investment income. The prospective method is usedprimarily for interest-only securities, non-investment-grade asset-backed securities, and certain asset-backed securities withsub-prime loan exposure or where there is a greater risk of non-performance and where it is possible the initial investmentmay not be substantially recovered. The prospective method requires a calculation of future expected repayments andresets the yield to allow for future period adjustments; no current period impact to investment income or the security’s cost ismade based on the cash flow update. Prepayment assumptions are based on market expectations and are updatedquarterly.
Equity securities include common stocks, nonredeemable preferred stocks, and other risk investments and are reported atquoted fair values. Changes in fair value of these securities, net of deferred income taxes, are reflected as unrealized gains(losses) in accumulated other comprehensive income. To the extent we hold any foreign equities or foreign currencyhedges, any change in value due to exchange rate fluctuations would be limited by foreign currency hedges, if any, andwould be recognized in income in the current period.
Short-term investments may include Eurodollar deposits, commercial paper, reverse repurchase transactions, and othersecurities expected to mature within one year. In addition, short-term investments can include auction rate securities (i.e.,certain municipal bonds and preferred stocks). Due to the nature of auction rate securities, these securities are classified asshort-term based upon their expected auction date (generally 7-49 days) rather than on their contractual maturity date
App.-A-6

(which is greater than one year at original issuance). In the event that an auction fails, the security may need to bereclassified from short-term. Changes in fair value of these securities, net of deferred income taxes, are reflected asunrealized gains (losses) in accumulated other comprehensive income.
Trading securities are securities bought principally for the purpose of sale in the near term. To the extent we have tradingsecurities, changes in fair value would be recognized in income in the current period. Derivative instruments, which may beused for trading purposes or classified as trading derivatives due to the characteristics of the transaction, are discussedbelow.
Derivative instruments may include futures, options, forward positions, foreign currency forwards, interest rate swapagreements, and credit default swaps and may be used in the portfolio for general investment purposes or to hedge theexposure to:
• Changes in fair value of an asset or liability (fair value hedge)• Foreign currency of an investment in a foreign operation (foreign currency hedge), or• Variable cash flows of a forecasted transaction (cash flow hedge).
To the extent we have derivatives held or issued for general investment purposes, these derivative instruments arerecognized as either assets or liabilities and measured at fair value, with changes in fair value recognized in income as acomponent of net realized gains (losses) on securities during the period of change.
Derivatives designated as hedges are required to be evaluated on established criteria to determine the effectiveness of theircorrelation to, and ability to reduce the designated risk of, specific securities or transactions. Effectiveness is required to bereassessed regularly. Hedges that are deemed to be effective would be accounted for as follows:
• Fair value hedge: changes in fair value of the hedge, as well as the hedged item, would be recognized inincome in the period of change while the hedge is in effect.
• Foreign currency hedge: changes in fair value of the hedge, as well as the hedged item, would be reflectedas a change in translation adjustment as part of accumulated other comprehensive income. Gains andlosses on the foreign currency hedge would offset the foreign exchange gains and losses on the foreigninvestment as they are recognized into income.
• Cash flow hedge: changes in fair value of the hedge would be reported as a component of accumulatedother comprehensive income and subsequently amortized into earnings over the life of the hedgedtransaction.
If a hedge is deemed to become ineffective and discontinued, the following accounting treatment would be applied:
• Fair value hedge: the derivative instrument would continue to be adjusted through income, while theadjustment in the change in value of the hedged item would be reflected as a change in unrealized gains(losses) as part of accumulated other comprehensive income.
• Foreign currency hedge: changes in the value of the hedged item would continue to be reflected as achange in translation adjustment as part of accumulated other comprehensive income, but the derivativeinstrument would be adjusted through income for the current period.
• Cash flow hedge: changes in fair value of the derivative instrument would be reported in income for thecurrent period.
For all derivative positions, net cash requirements are limited to changes in fair values, which may vary based uponchanges in interest rates, currency exchange rates, and other factors. Exposure to credit risk is limited to the carrying value;collateral may be required to limit credit risk. We have elected not to offset fair value amounts that arise from derivativepositions with the same counterparty under a master netting arrangement.
Investment securities are exposed to various risks such as interest rate, market, credit, and liquidity risk. Fair values ofsecurities fluctuate based on the nature and magnitude of changing market conditions; significant changes in marketconditions could materially affect the portfolio’s value in the near term. We regularly monitor our portfolio for price changes,which might indicate potential impairments, and perform detailed reviews of securities with unrealized losses. In such cases,changes in fair value are evaluated to determine the extent to which such changes are attributable to (i) fundamental factorsspecific to the issuer, such as financial condition, business prospects, or other factors, (ii) market-related factors, such as
App.-A-7

interest rates or equity market declines, or (iii) credit-related losses, where the present value of cash flows expected to becollected are lower than the amortized cost basis of the security.
We analyze our debt securities to determine if we intend to sell, or if it is more likely than not that we will be required to sell,the security prior to recovery and, if so, we write down the security to its current fair value, with the entire amount of thewrite-down recorded to earnings. To the extent that it is more likely than not that we will hold the debt security until recovery(which could be maturity), we determine if any of the decline in value is due to a credit loss (i.e., where the present value offuture cash flows expected to be collected is lower than the amortized cost basis of the security) and, if so, we recognizethat portion of the impairment in the comprehensive income statement, with the difference (i.e., non-credit relatedimpairment) recognized as part of our net unrealized gains (losses) in accumulated other comprehensive income. When anequity security (common equity and nonredeemable preferred stock) in our investment portfolio has an unrealized loss infair value that is deemed to be other-than-temporary, we reduce the book value of such security to its current fair value,recognizing the decline as a realized loss in the comprehensive income statement. Any future changes in fair value, eitherincreases or decreases, are reflected as changes in unrealized gains (losses) as part of accumulated other comprehensiveincome.
Realized gains (losses) on securities are computed based on the first-in first-out method and include write-downs onavailable-for-sale securities considered to have other-than-temporary declines in fair value (excluding non-credit relatedimpairments), as well as holding period valuation changes on derivatives, trading securities, and hybrid instruments(securities with embedded call options, where the call option is a feature of the overall change in the value of the instrument).
Insurance Premiums and Receivables Insurance premiums written are earned into income on a pro rata basis over theperiod of risk, based on a daily earnings convention. Accordingly, unearned premiums represent the portion of premiumswritten that is applicable to the unexpired risk. We provide insurance and related services to individuals and smallcommercial accounts and offer a variety of payment plans. Generally, premiums are collected prior to providing riskcoverage, minimizing our exposure to credit risk. We perform a policy level evaluation to determine the extent to which thepremiums receivable balance exceeds the unearned premiums balance. We then age this exposure to establish anallowance for doubtful accounts based on prior experience.
Deferred Acquisition Costs Deferred acquisition costs include commissions, premium taxes, and other variableunderwriting and direct sales costs incurred in connection with writing business. These costs are deferred and amortizedover the policy period in which the related premiums are earned. We consider anticipated investment income in determiningthe recoverability of these costs. Management believes that these costs will be fully recoverable in the near term. We do notdefer any advertising costs.
Loss and Loss Adjustment Expense Reserves Loss reserves represent the estimated liability on claims reported to us,plus reserves for losses incurred but not recorded (IBNR). These estimates are reported net of amounts estimated to berecoverable from salvage and subrogation. Loss adjustment expense reserves represent the estimated expenses requiredto settle these claims and losses. The methods of making estimates and establishing these reserves are reviewed regularly,and resulting adjustments are reflected in income currently. Such loss and loss adjustment expense reserves aresusceptible to change in the near term.
Reinsurance Our reinsurance transactions primarily include premiums ceded to state-provided reinsurance facilities (e.g.,Michigan Catastrophic Claims Association and North Carolina Reinsurance Facility) and premiums written under state-mandated involuntary plans for commercial vehicles (Commercial Auto Insurance Procedures/Plans – “CAIP”) (collectively,“State Plans”) (see Note 7 – Reinsurance for further discussion). We cede 100% of the premiums written in our professionalliability insurance businesses as we continue our exit of these markets. Prepaid reinsurance premiums are earned on a prorata basis over the period of risk, based on a daily earnings convention, which is consistent with premiums written.
Income Taxes The income tax provision is calculated under the balance sheet approach. Deferred tax assets and liabilitiesare recorded based on the difference between the financial statement and tax bases of assets and liabilities at the enactedtax rates. The principal items giving rise to such differences are investment securities (e.g., net unrealized gains (losses),write-downs, and derivative instruments), loss and loss adjustment expense reserves, unearned premiums reserves,deferred acquisition costs, property and equipment, and non-deductible accruals. We review our deferred tax assetsregularly for recoverability. See Note 5 – Income Taxes for further discussion.
App.-A-8

Property and Equipment Property and equipment are recorded at cost, less accumulated depreciation, and includescapitalized software developed or acquired for internal use. Depreciation is recognized over the estimated useful lives of theassets using accelerated methods for most computer equipment and the straight-line method for certain computerequipment and all other fixed assets. The useful lives range from 2 to 4 years for computer equipment and laptopcomputers, 10 to 40 years for buildings and improvements, and 3 to 10 years for all other property and equipment. Landand buildings comprised 75% and 76% of total property and equipment at December 31, 2011 and 2010, respectively.
Total capitalized interest, which primarily relates to capitalized software projects, for the years ended December 31, was:
(millions)Capitalized
Interest
2011 $ .42010 1.12009 2.6
Guaranty Fund Assessments We are subject to state guaranty fund assessments, which provide for the payment ofcovered claims or other insurance obligations of insurance companies deemed insolvent. These assessments are accruedafter a formal determination of insolvency has occurred, and we have written the premiums on which the assessments willbe based.
Service Revenues and Expenses Our service businesses provide insurance-related services. Service revenuesgenerated from processing business for involuntary CAIP plans are earned on a pro rata basis over the term of the relatedpolicies. Service expenses related to these CAIP plans include acquisition expenses, which are deferred and amortizedover the period in which the related revenues are earned. Other service business revenues and expenses are recorded inthe period in which they are earned or incurred.
Stock-Based Compensation We currently issue time-based and performance-based restricted stock unit awards to keymembers of management as our form of equity compensation, and time-based restricted stock awards to non-employeedirectors. Prior to 2010, we issued restricted stock awards, instead of restricted stock unit awards, to employees.Collectively, we refer to these awards as “restricted equity awards.” We currently do not issue stock options as a form ofequity compensation. Compensation expense for time-based restricted equity awards with installment vesting is recognizedover each respective vesting period. For performance-based restricted equity awards, compensation expense is recognizedover the respective vesting periods.
We record an estimate for expected forfeitures of restricted equity awards based on our historical forfeiture rates. Inaddition, we shorten the vesting periods of certain restricted equity awards based on the “qualified retirement” provisions inour incentive compensation plans, under which (among other provisions) the vesting of 50% of outstanding time-basedrestricted equity awards will accelerate upon retirement if the participant is 55 years of age or older and satisfies certainyears-of-service requirements.
The total compensation expense recognized for our stock-based compensation for the years ended December 31, was:
(millions) 2011 2010 2009
Pretax expense $50.5 $45.9 $40.3Tax benefit 17.7 16.1 14.1
Net Income Per Share Basic net income per share is computed using the weighted average number of common sharesoutstanding during the reporting period, excluding unvested time-based and performance-based restricted equity awardsthat are subject to forfeiture. Diluted net income per share includes common stock equivalents assumed outstanding duringthe period. Our common stock equivalents include the incremental shares assumed to be issued for:
• stock option exercises (all employee stock options expired December 31, 2011)• time-based restricted equity awards, and• certain performance-based restricted equity awards that satisfied contingency conditions during the period.
App.-A-9

Supplemental Cash Flow Information Cash includes only bank demand deposits. Non-cash activity includes declared butunpaid dividends. For the years ended December 31, we paid the following:
(millions) 2011 2010 2009
Income taxes, net of refunds $435.0 $434.0 $461.7Interest 129.5 138.4 144.7
New Accounting Standards During 2010, the Financial Accounting Standards Board (FASB) issued an accountingstandard update related to the accounting for the deferral of costs associated with the successful acquisition or renewal ofinsurance contracts. This standard is intended to help reduce diversity in practice and is effective for fiscal years beginningafter December 15, 2011 (January 2012 for calendar-year companies). Upon adoption, we will defer less acquisition costsunder this new standard. At December 31, 2011, we had approximately $23 million of deferred acquisition costs that nolonger met the criteria for deferral as of January 1, 2012. Pursuant to the guidance, we elected to adopt this standard on aprospective basis and, therefore, will recognize the effect of this accounting change into income primarily over the first sixmonths of 2012, consistent with our insurance policy terms.
For the year ended December 31, 2011, we elected to early adopt the accounting standard update for the presentation ofother comprehensive income that was issued by the FASB during 2011. This standard, which is effective for fiscal periodsthat begin after December 15, 2011 (January 2012 for calendar-year companies), requires entities to present items of netincome and other comprehensive income in two separate, but consecutive, statements or, as we elected, together in onecontinuous statement, which we refer to as the Consolidated Statements of Comprehensive Income. There were nochanges to the calculation of the components of net income or other comprehensive income as a result of this standard.
Reclassifications Certain amounts in the Notes to Consolidated Financial Statements were reclassified for 2010 and 2009in order to conform to current-year presentation requirements.
App.-A-10

2. INVESTMENTS
The following tables present the composition of our investment portfolio by major security type, consistent with our internalclassification of how we manage, monitor, and measure the portfolio:
($ in millions) Cost
GrossUnrealized
Gains
GrossUnrealized
Losses
NetRealized
Gains(Losses)1
FairValue
% ofTotalFair
Value
December 31, 2011Fixed maturities:
U.S. government obligations $ 2,842.7 $ 120.3 $ 0 $ 0 $ 2,963.0 18.6%State and local government obligations 1,938.6 64.1 (.6) 0 2,002.1 12.5Corporate debt securities 2,801.5 94.3 (6.5) 6.9 2,896.2 18.1Residential mortgage-backed securities 452.9 9.3 (35.3) 0 426.9 2.7Commercial mortgage-backed securities 1,829.8 52.3 (5.5) 0 1,876.6 11.8Other asset-backed securities 1,210.9 11.3 (1.3) (.3) 1,220.6 7.6Redeemable preferred stocks 379.3 18.6 (24.0) 0 373.9 2.3
Total fixed maturities 11,455.7 370.2 (73.2) 6.6 11,759.3 73.6Equity securities:
Nonredeemable preferred stocks 473.7 342.6 (3.7) (6.3) 806.3 5.1Common equities 1,431.0 440.0 (25.4) 0 1,845.6 11.6
Short-term investments:Other short-term investments 1,551.8 0 0 0 1,551.8 9.7
Total portfolio2,3 $14,912.2 $1,152.8 $(102.3) $ .3 $15,963.0 100.0%
($ in millions) Cost
GrossUnrealized
Gains
GrossUnrealized
Losses
NetRealized
Gains(Losses)1
FairValue
% ofTotalFair
Value
December 31, 2010Fixed maturities:
U.S. government obligations $ 3,203.2 $ 56.3 $ (16.9) $ 0 $ 3,242.6 20.9%State and local government obligations 1,955.5 43.0 (9.4) 0 1,989.1 12.8Corporate debt securities 2,579.0 78.1 (13.3) 2.3 2,646.1 17.0Residential mortgage-backed securities 567.1 17.8 (21.3) 0 563.6 3.6Commercial mortgage-backed securities 1,772.1 66.9 (6.9) 0 1,832.1 11.8Other asset-backed securities 1,063.9 12.4 (2.2) (.1) 1,074.0 6.9Redeemable preferred stocks 490.0 29.6 (17.1) 0 502.5 3.3
Total fixed maturities 11,630.8 304.1 (87.1) 2.2 11,850.0 76.3Equity securities:
Nonredeemable preferred stocks 601.3 560.2 0 (3.9) 1,157.6 7.5Common equities 1,021.7 406.5 (3.2) 0 1,425.0 9.2
Short-term investments:Other short-term investments 1,090.8 0 0 0 1,090.8 7.0
Total portfolio2,3 $14,344.6 $1,270.8 $ (90.3) $(1.7) $15,523.4 100.0%
1Represents net holding period gains (losses) on certain hybrid securities (discussed below).
2Excludes $46.9 million and $46.3 million at December 31, 2011 and 2010, respectively, of net unsettled security transactions included in otherassets.
3The total fair value of the portfolio includes $2.0 billion and $2.2 billion at December 31, 2011 and 2010, respectively, of securities held in aconsolidated, non-insurance subsidiary of the holding company, net of any unsettled security transactions.
Our other short-term investments include Eurodollar deposits, commercial paper, reverse repurchase transactions, andother investments that are expected to mature within one year. At December 31, 2011 and 2010, we had $10.0 million and$0, respectively, in treasury bills issued by the Australian government, included in other short-term investments.
App.-A-11

Included in our fixed-maturity and equity securities are hybrid securities, which are reported at fair value at December 31:
(millions) 2011 2010
Fixed maturities:Corporate debt securities $234.9 $176.4Other asset-backed securities 15.5 14.9
Total fixed maturities 250.4 191.3Equity securities:
Nonredeemable preferred stocks 14.2 52.8
Total hybrid securities $264.6 $244.1
Certain corporate debt securities are accounted for as hybrid securities since they were acquired at a substantial premiumand contain a change-in-control put option (derivative) that permits the investor, at its sole option once the change of controlis triggered, to put the security back to the issuer at a 1% premium to par. Due to this change-in-control put option and themarket premium paid to acquire these securities, there is the potential that the election to put, upon the change-in-control,could result in an acceleration of the remaining premium paid on these securities, which would result in a loss of $17.4million as of December 31, 2011, if all of the bonds experienced a simultaneous change-in-control and we elected toexercise all of our put options. We are under no obligation to exercise the put option we hold if a change-in-control occurs.The put feature limits the potential loss in value that could be experienced in the event a corporate action occurs that resultsin a change-in-control which materially diminishes the credit quality of the issuer.
In our asset-backed portfolio, we hold one hybrid security that was acquired at a deep discount to par due to a failingauction, and contains a put option that allows the investor to put that security back to the auction at par. If the auction isrestored, this embedded derivative has the potential to more than double our initial investment yield.
The hybrid securities in our nonredeemable preferred stock portfolio are perpetual preferred stocks that have call featureswith fixed-rate coupons, whereby the change in value of the call features is a component of the overall change in the valueof the preferred stocks.
Our securities are reported at fair value, with the changes in fair value of these securities (other than hybrid securities andderivative instruments) reported as a component of accumulated other comprehensive income, net of deferred incometaxes. The changes in fair value of the hybrid securities and derivative instruments are recorded as a component of netrealized gains (losses) on securities.
At December 31, 2011, bonds and certificates of deposit in the principal amount of $150.7 million were on deposit to meetstate insurance regulatory and/or rating agency requirements. We did not have any securities of any one issuer, excludingU.S. government obligations, with an aggregate cost or fair value exceeding 10% of total shareholders’ equity atDecember 31, 2011 or 2010. At December 31, 2011, we did not have any debt securities that were non-income producingduring the preceding 12 months.
Fixed Maturities The composition of fixed maturities by maturity at December 31, 2011, was:
(millions) Cost Fair Value
Less than one year $ 1,399.0 $ 1,418.8One to five years 8,582.6 8,850.9Five to ten years 1,380.9 1,398.0Ten years or greater 92.5 90.9
Total1 $11,455.0 $11,758.6
1 Excludes $0.7 million of gains on the open credit default swap positions.
Asset-backed securities are classified in the maturity distribution table based upon their projected cash flows. All othersecurities which do not have a single maturity date are reported at expected average maturity. Contractual maturities maydiffer from expected maturities because the issuers of the securities may have the right to call or prepay obligations.
App.-A-12

Gross Unrealized Losses As of December 31, 2011, we had $76.9 million of gross unrealized losses in our fixed-incomesecurities and $25.4 million in our common equities. We currently do not intend to sell the fixed-income securities anddetermined that it is more likely than not that we will not be required to sell these securities for the period of time necessaryto recover their cost bases. A review of our fixed-income securities indicated that the issuers were current with respect totheir interest obligations and that there was no evidence of any deterioration of the current cash flow projections that wouldindicate we would not receive the remaining principal at maturity. In addition, 97% of our common stock portfolio wasindexed to the Russell 1000, as such this portfolio may contain securities in a loss position for an extended period of time aslong as there is no evidence of an issuer-specific impairment, and we may retain these securities as long as the portfolioand index correlation remain similar. The remaining 3% of our common stocks are part of a managed equity strategy,selected by an external investment advisor. If our strategy were to change and these securities were determined to beother-than-temporarily impaired, we would recognize a write-down in accordance with our stated policy.
The following tables show the composition of gross unrealized losses by major security type and by the length of time thatindividual securities have been in a continuous unrealized loss position:
TotalFair
Value
GrossUnrealized
Losses
Less than 12 Months 12 Months or Greater
(millions)Fair
ValueUnrealized
LossesFair
ValueUnrealized
Losses
December 31, 2011Fixed maturities:
U.S. government obligations $ 0 $ 0 $ 0 $ 0 $ 0 $ 0State and local government obligations 93.6 (.6) 79.5 (.5) 14.1 (.1)Corporate debt securities 262.7 (6.5) 137.3 (4.6) 125.4 (1.9)Residential mortgage-backed securities 308.7 (35.3) 34.4 (2.0) 274.3 (33.3)Commercial mortgage-backed securities 203.7 (5.5) 161.4 (3.5) 42.3 (2.0)Other asset-backed securities 284.2 (1.3) 259.7 (1.0) 24.5 (.3)Redeemable preferred stocks 191.4 (24.0) 43.5 (1.5) 147.9 (22.5)
Total fixed maturities 1,344.3 (73.2) 715.8 (13.1) 628.5 (60.1)Equity securities:
Nonredeemable preferred stocks 19.5 (3.7) 19.5 (3.7) 0 0Common equities 214.6 (25.4) 196.7 (23.1) 17.9 (2.3)
Total equity securities 234.1 (29.1) 216.2 (26.8) 17.9 (2.3)
Total portfolio $1,578.4 $(102.3) $ 932.0 $(39.9) $646.4 $(62.4)
TotalFair
Value
GrossUnrealized
Losses
Less than 12 Months 12 Months or Greater
(millions)Fair
ValueUnrealized
LossesFair
ValueUnrealized
Losses
December 31, 2010Fixed maturities:
U.S. government obligations $ 495.3 $ (16.9) $ 495.3 $(16.9) $ 0 $ 0State and local government obligations 461.9 (9.4) 454.0 (8.7) 7.9 (.7)Corporate debt securities 589.3 (13.3) 541.3 (11.6) 48.0 (1.7)Residential mortgage-backed securities 314.1 (21.3) 74.0 (1.0) 240.1 (20.3)Commercial mortgage-backed securities 332.0 (6.9) 269.7 (3.1) 62.3 (3.8)Other asset-backed securities 214.8 (2.2) 209.8 (1.1) 5.0 (1.1)Redeemable preferred stocks 216.7 (17.1) 0 0 216.7 (17.1)
Total fixed maturities 2,624.1 (87.1) 2,044.1 (42.4) 580.0 (44.7)Equity securities:
Nonredeemable preferred stocks 0 0 0 0 0 0Common equities 60.5 (3.2) 57.3 (3.1) 3.2 (.1)
Total equity securities 60.5 (3.2) 57.3 (3.1) 3.2 (.1)
Total portfolio $2,684.6 $ (90.3) $2,101.4 $(45.5) $583.2 $(44.8)
App.-A-13

Other-Than-Temporary Impairment (OTTI) The following table shows the total non-credit portion of the OTTI recorded inaccumulated other comprehensive income, reflecting the original non-credit loss at the time the credit impairment wasdetermined:
December 31,
(millions) 2011 2010
Fixed maturities:Residential mortgage-backed securities $(44.8) $(44.3)Commercial mortgage-backed securities (1.0) (1.0)
Total fixed maturities $(45.8) $(45.3)
The following tables provide rollforwards of the amounts related to credit losses recognized in earnings for the periodsended December 31, 2011 and 2010, for which a portion of the OTTI losses were also recognized in accumulated othercomprehensive income at the time the credit impairments were determined and recognized:
(millions)
ResidentialMortgage-
Backed
CommercialMortgage-
BackedCorporate
Debt Total
Beginning balance at January 1, 2011 $32.3 $1.0 $ 6.5 $39.8Credit losses for which an OTTI was previously recognized 1.4 0 0 1.4Credit losses for which an OTTI was not previously recognized 1.1 .4 0 1.5Change in recoveries of future cash flows expected to be collected1,2 .8 .3 (6.5) (5.4)Reductions for previously recognized credit impairments
written down to fair value3 (1.1) (.4) 0 (1.5)
Ending balance at December 31, 2011 $34.5 $1.3 $ 0 $35.8
(millions)
ResidentialMortgage-
Backed
CommercialMortgage-
BackedCorporate
Debt Total
Beginning balance at January 1, 2010 $41.1 $ .9 $6.5 $48.5Credit losses for which an OTTI was previously recognized 3.0 .3 0 3.3Credit losses for which an OTTI was not previously recognized 2.4 1.0 0 3.4Change in recoveries of future cash flows expected to be collected1 (5.3) (.4) 0 (5.7)Reductions for previously recognized credit impairments
written down to fair value3 (8.9) (.8) 0 (9.7)
Ending balance at December 31, 2010 $32.3 $1.0 $6.5 $39.8
1Reflects expected recovery of prior period impairments that will be accreted into income over the remaining life of the security.
2Includes $2.0 million received on a residential mortgage-backed security in excess of the cash flows expected to be collected at the time of thewrite-down.
3Reflects reductions of prior credit impairments where the current credit impairment requires writing securities down to fair value (i.e., no remainingnon-credit loss).
Since we determined that it is more likely than not that we will not be required to sell the securities prior to the recovery oftheir respective cost bases (which could be maturity), in order to measure the amount of credit losses on the securities thatwere determined to be other-than-temporarily impaired, we considered a number of factors and inputs related to theindividual securities. The methodology and significant inputs used to measure the amount of credit losses in our portfolioincluded: current performance indicators on the underlying assets (e.g., delinquency rates, foreclosure rates, and defaultrates), credit support (via current levels of subordination), and historical credit ratings. Updated cash flow expectations werealso generated by our portfolio managers based upon these performance indicators. In order to determine the amount ofcredit loss, if any, the net present value of the cash flows expected (i.e., expected recovery value) was calculated using thecurrent book yield for each security, and was compared to its current amortized value. In the event that the net presentvalue was below the amortized value, a credit loss was deemed to exist, and the security was written down.
App.-A-14

Net Realized Gains (Losses) The components of net realized gains (losses) for the years ended December 31, were:
(millions) 2011 2010 2009
Gross realized gains on security salesFixed maturities:
U.S. government obligations $ 59.1 $ 39.8 $ 103.1State and local government obligations 3.5 10.0 35.2Corporate and other debt securities 23.0 30.9 20.5Residential mortgage-backed securities 2.0 0 0Commercial mortgage-backed securities .3 1.0 .8Other asset-backed securities 2.1 .8 0Redeemable preferred stocks 4.6 8.5 0
Total fixed maturities 94.6 91.0 159.6Equity securities:
Nonredeemable preferred stocks 148.9 83.6 32.6Common equities 11.9 13.8 148.5
Subtotal gross realized gains on security sales 255.4 188.4 340.7
Gross realized losses on security salesFixed maturities:
U.S. government obligations (9.3) (12.9) (2.1)State and local government obligations 0 0 (7.6)Corporate and other debt securities (3.5) (.5) (.5)Residential mortgage-backed securities 0 0 (3.2)Commercial mortgage-backed securities 0 0 (9.9)Other asset-backed securities 0 0 (.7)Redeemable preferred stocks (2.2) (5.2) 0
Total fixed maturities (15.0) (18.6) (24.0)Equity securities:
Nonredeemable preferred stocks 0 0 (57.3)Common equities (36.5) (7.2) (40.0)
Subtotal gross realized losses on security sales (51.5) (25.8) (121.3)Net realized gains (losses) on security sales
Fixed maturities:U.S. government obligations 49.8 26.9 101.0State and local government obligations 3.5 10.0 27.6Corporate and other debt securities 19.5 30.4 20.0Residential mortgage-backed securities 2.0 0 (3.2)Commercial mortgage-backed securities .3 1.0 (9.1)Other asset-backed securities 2.1 .8 (.7)Redeemable preferred stocks 2.4 3.3 0
Total fixed maturities 79.6 72.4 135.6Equity securities:
Nonredeemable preferred stocks 148.9 83.6 (24.7)Common equities (24.6) 6.6 108.5
Subtotal net realized gains (losses) on security sales 203.9 162.6 219.4
Other-than-temporary impairment lossesFixed maturities:
Residential mortgage-backed securities (3.3) (11.1) (32.0)Commercial mortgage-backed securities (.6) (1.9) (.9)Redeemable preferred stocks 0 0 (6.1)
Total fixed maturities (3.9) (13.0) (39.0)Equity securities:
Nonredeemable preferred stocks 0 0 (158.8)Common equities (.2) (.5) (10.3)
Subtotal other-than-temporary impairment losses (4.1) (13.5) (208.1)Net holding period gains (losses)
Hybrid securities 1.7 5.5 14.5Derivative instruments (98.9) (58.5) 1.3
Subtotal net holding period gains (losses) (97.2) (53.0) 15.8
Total net realized gains (losses) on securities $102.6 $ 96.1 $ 27.1
App.-A-15

Gross realized gains and losses were the result of sales transactions in our fixed-income portfolio, affected by movementsin credit spreads and interest rates, rebalancing of our equity-indexed portfolio, tax management, and holding periodvaluation changes on hybrids and derivatives. Also included are write-downs for securities determined to be other-than-temporarily impaired in our fixed-maturity and/or equity portfolios.
Net Investment Income The components of net investment income for the years ended December 31, were:
(millions) 2011 2010 2009
Fixed maturities:U.S. government obligations $ 58.0 $ 80.8 $ 79.6State and local government obligations 60.0 65.4 91.9Corporate debt securities 106.7 84.3 48.2Residential mortgage-backed securities 18.6 21.7 33.4Commercial mortgage-backed securities 83.4 99.1 90.7Other asset-backed securities 24.5 21.8 9.7Redeemable preferred stocks 33.0 45.5 47.5Other debt obligations 0 0 .3
Total fixed maturities 384.2 418.6 401.3Equity securities:
Nonredeemable preferred stocks 57.7 70.6 89.7Common equities 35.7 27.3 13.3
Short-term investments:Other short-term investments 2.4 3.6 2.7
Investment income 480.0 520.1 507.0Investment expenses (13.5) (11.9) (11.1)
Net investment income $466.5 $508.2 $495.9
Trading Securities At December 31, 2011 and 2010, we did not hold any trading securities and we did not have any netrealized gains (losses) on trading securities for the years ended December 31, 2011, 2010, and 2009.
Derivative Instruments We have invested in the following derivative exposures at various times: interest rate swaps,asset-backed credit default swaps, U.S. corporate debt credit default swaps, cash flow hedges, and equity options.
For all derivative positions discussed below, realized holding period gains and losses are netted with any upfront cash thatmay be exchanged under the contract to determine if the net position should be classified either as an asset or liability. Tobe reported as an asset and a component of the available-for-sale portfolio, the inception-to-date realized gain on thederivative position at period end would have to exceed any upfront cash received (net derivative asset). On the other hand,a net derivative liability would include any inception-to-date realized loss plus the amount of upfront cash received (ornetted, if upfront cash was paid) and would be reported as a component of other liabilities. These net derivative assets/liabilities are not separately disclosed on the balance sheet due to their immaterial effect on our financial condition, cashflows, and results of operations.
App.-A-16

The following table shows the status of our derivative instruments at December 31, 2011 and 2010, and for the years endedDecember 31, 2011, 2010, and 2009; amounts are on a pretax basis:
(millions) Balance Sheet Income Statement
Notional Value1Assets (Liabilities)
Fair ValueNet Realized
Gains (Losses) on Securities
December 31, December 31, Years ended December 31,
Derivativesdesignated as: 2011 2010 2009 Purpose Classification 2011 2010 2011 2010 2009
Hedging instruments
Closed:
Foreign currency cashflow hedge $ 0 $ 0 $ 8
Forecastedtransaction
Accumulatedothercomprehensiveincome $ 0 $ 0 $ 0 $ 0 $ 0
Ineffective cash flowhedge 15 223 0
Manageinterestrate risk NA 0 0 .3 5.8 0
Non-hedging
instruments
Assets:
Interest rate swaps 0 0 713
Manageportfolioduration
Investments -fixed maturities 0 0 0 0 .1
Corporate credit defaultswaps 25 35 0
Managecredit risk
Investments -fixed maturities .7 1.3 (.2) 2.5 0
Liabilities:
Interest rate swaps 1,263 713 0
Manageportfolioduration Other liabilities (76.1) (41.7) (74.0) (66.6) 0
Corporate credit defaultswaps 0 0 25
Managecredit risk Other liabilities 0 0 0 0 (.6)
Closed:
Interest rate swaps 350 0 4,186
Manageportfolioduration NA 0 0 (25.5) 0 10.4
Corporate credit defaultswaps 10 25 7
Managecredit risk NA 0 0 .5 (.2) (.4)
Equity options2
(177,190 contracts) NA NA NAManageprice risk NA 0 0 0 0 (9.1)
Foreign currency trade 0 0 8
Managecurrencyrisk NA 0 0 0 0 .9
Total NA NA NA $(75.4) $(40.4) $(98.9) $(58.5) $ 1.3
1The amounts represent the value held at year-end for open positions and the maximum amount held during the year for closed positions.2Each contract is equivalent to 100 shares of common stock of the issuer; we had no option activity in 2011 or 2010.
NA = Not Applicable
CASH FLOW HEDGESDuring the year ended December 31, 2011, we repurchased $15.0 million principal amount of our 6.70% JuniorSubordinated Debentures due 2067 (the “6.70% Debentures”) at or near par in the open market (see Note 4 – Debt forfurther discussion). We reclassified $0.3 million (pretax) from accumulated other comprehensive income on the balancesheet to net realized gains (losses) on securities on the comprehensive income statement, reflecting the portion of theunrealized gain on forecasted transactions that was related to the repurchased 6.70% Debentures.
During 2010, we finalized our tender offer for, and repurchased $222.9 million principal amount of, the 6.70% Debentures.We reclassified $5.8 million (pretax) from accumulated other comprehensive income on the balance sheet to net realized
App.-A-17

gains (losses) on securities on the comprehensive income statement, reflecting the portion of the unrealized gain onforecasted transactions that was related to the 6.70% Debentures that were repurchased pursuant to the tender offer.
In anticipation of issuing the 6.70% Debentures in 2007, we entered into a forecasted debt issuance hedge (cash flowhedge) against a possible rise in interest rates. Upon issuance of the 6.70% Debentures, the hedge was closed, and werecognized a pretax gain of $34.4 million, which was recorded as part of accumulated other comprehensive income. The$34.4 million gain, less the $0.3 million and $5.8 million reclassifications mentioned above, was deferred and is beingrecognized as a decrease to interest expense over the 10-year fixed interest rate term of the 6.70% Debentures.
During 2011, we issued $500 million of 3.75% Senior Notes due 2021 (the “3.75% Senior Notes”) and entered into aforecasted debt issuance hedge (cash flow hedge) against a possible rise in interest rates (see Note 4 – Debt for furtherdiscussion). Upon issuance of the 3.75% Senior Notes in August 2011, the hedge was closed and we recognized, as part ofaccumulated other comprehensive income, a pretax unrealized loss of $5.1 million. The $5.1 million loss was deferred andis being recognized as an increase to interest expense over the life of the 3.75% Senior Notes.
During 2011, 2010, and 2009, we recognized $2.6 million, $2.7 million, and $2.8 million, respectively, as net decreases tointerest expense on our closed debt issuance cash flow hedges.
In 2009, we realized a foreign currency trade gain of $0.9 million, reflecting the previously deferred gain on our foreigncurrency cash flow hedge, which was opened during 2008 and closed in 2009.
INTEREST RATE SWAPSAt December 31, 2011, 2010, and 2009, we invested in interest rate swap positions primarily to manage the fixed-incomeportfolio duration. During the year ended December 31, 2011, we held a 9-year interest rate swap position (opened in 2009)and two 5-year interest rate swap positions (opened in 2011); in each case, we are paying a fixed rate and receiving avariable rate, effectively shortening the duration of our fixed-income portfolio. We closed a portion of the 9-year positionduring 2011. The combined open positions have generated an aggregate realized loss, as interest rates have fallen sincethe inception of these positions. As of December 31, 2011, 2010, and 2009, we delivered $81.7 million, $52.2 million, and$0, respectively, in cash collateral to the applicable counterparty on these positions.
CORPORATE CREDIT DEFAULT SWAPSFinancial Services Sector – At December 31, 2011, 2010, and 2009, we held a position, which was opened during 2008, onone corporate issuer within the financial services sector where we bought credit default protection in the form of a creditdefault swap for a 5-year time horizon. We hold this protection to reduce some of our exposure to additional valuationdeclines on a preferred stock position of the same issuer. As of December 31, 2011 and 2010, we received $0.7 million and$0.5 million, respectively, in cash collateral from the counterparty on this corporate credit default swap position. As ofDecember 31, 2009, we delivered $0.6 million in cash collateral to the counterparty on this corporate credit default swapposition.
Automotive Sector – During 2011, we closed a position that was opened during 2010 where we sold credit protection in theform of a corporate credit default swap on one issuer in the automotive sector for a 5-year time horizon. We acquired anequal par value amount of U.S. Treasury Notes with a similar maturity to cover the credit default swap’s notional exposure.As of December 31, 2010, we received $1.1 million in cash collateral from the counterparty on this position.
Technology Sector – During 2010, we opened and closed two positions on one corporate issuer within the technologysector for which we bought credit default protection in the form of credit default swaps for 2-year and 4-year time horizons.We paid $0.2 million in upfront cash when we entered into the 4-year exposure position. We held this protection to reduceour exposure to additional valuation declines on a corporate position of the same issuer due to potential future creditimpairment. We also opened and closed a position during 2009, for which we bought credit default protection in the form ofcredit default swaps for a 2-year time horizon on one corporate issuer within the technology sector. We paid $0.6 million inupfront cash when we entered this position.
EQUITY OPTIONSWe held no equity option positions during the years ended December 31, 2011 or 2010. During the year endedDecember 31, 2009, we opened and closed positions pursuant to which we simultaneously sold and purchased asubstantially equivalent amount of call and put options, respectively, on Citigroup common stock, which related to our
App.-A-18

preferred stock holding. The purpose of this transaction was to effect a forward sale of a portion of the common stock weexpected to receive from Citigroup resulting from the conversion of our preferred stock holding into common stock pursuantto Citigroup’s exchange that occurred during 2009. This was achieved through matching the strike price and term of theoption contracts and was meant to offset the downside price risk of the common stock during the time period pending theexchange. All of the common stock we received from the preferred stock conversion was sold by the end of 2009.
3. FAIR VALUE
We have categorized our financial instruments, based on the degree of subjectivity inherent in the method by which they arevalued, into a fair value hierarchy of three levels, as follows:
• Level 1: Inputs are unadjusted, quoted prices in active markets for identical instruments at the measurementdate (e.g., U.S. government obligations and active exchange-traded equity securities).
• Level 2: Inputs (other than quoted prices included within Level 1) that are observable for the instrumenteither directly or indirectly (e.g., certain corporate and municipal bonds and certain preferred stocks). Thisincludes: (i) quoted prices for similar instruments in active markets, (ii) quoted prices for identical or similarinstruments in markets that are not active, (iii) inputs other than quoted prices that are observable for theinstruments, and (iv) inputs that are derived principally from or corroborated by observable market data bycorrelation or other means.
• Level 3: Inputs that are unobservable. Unobservable inputs reflect our subjective evaluation about theassumptions market participants would use in pricing the financial instrument (e.g., certain structuredsecurities and privately held investments).
Pursuant to generally accepted accounting principles, which require us to evaluate whether a market is distressed orinactive in determining the fair value for our portfolio, we review certain market level inputs to evaluate whether sufficientactivity, volume, and new issuances existed to create an active market. Based on this evaluation, we concluded that therewas sufficient activity related to the sectors and securities for which we obtained valuations.
App.-A-19

The composition of the investment portfolio by major security type was:
Fair Value
(millions) Level 1 Level 2 Level 3 Total Cost
December 31, 2011
Fixed maturities:U.S. government obligations $2,963.0 $ 0 $ 0 $ 2,963.0 $ 2,842.7State and local government obligations 0 2,002.1 0 2,002.1 1,938.6Corporate debt securities 0 2,896.2 0 2,896.2 2,801.5
Subtotal 2,963.0 4,898.3 0 7,861.3 7,582.8
Asset-backed securities:Residential mortgage-backed 0 364.6 62.3 426.9 452.9Commercial mortgage-backed 0 1,855.3 21.3 1,876.6 1,829.8Other asset-backed 0 1,218.0 2.6 1,220.6 1,210.9
Subtotal asset-backed securities 0 3,437.9 86.2 3,524.1 3,493.6
Redeemable preferred stocks:Financials 24.1 107.2 0 131.3 124.3Utilities 0 68.1 0 68.1 70.8Industrials 0 174.5 0 174.5 184.2
Subtotal redeemable preferred stocks 24.1 349.8 0 373.9 379.3
Total fixed maturities 2,987.1 8,686.0 86.2 11,759.3 11,455.7
Equity securities:Nonredeemable preferred stocks:
Financials 227.9 525.4 0 753.3 433.7Utilities 0 53.0 0 53.0 40.0Industrials 0 0 0 0 0
Subtotal nonredeemable preferred stocks 227.9 578.4 0 806.3 473.7
Common equities:Common stocks 1,834.1 0 0 1,834.1 1,427.3Other equity-like investments 0 0 11.5 11.5 3.7
Subtotal common equities 1,834.1 0 11.5 1,845.6 1,431.0
Total fixed maturities and equity securities $5,049.1 $9,264.4 $97.7 14,411.2 13,360.4
Short-term investments:Other short-term investments1 1,551.8 1,551.8
Total portfolio $15,963.0 $14,912.2
Debt2 $ 2,664.7 $ 2,442.1
App.-A-20

Fair Value
(millions) Level 1 Level 2 Level 3 Total Cost
December 31, 2010Fixed maturities:
U.S. government obligations $3,242.6 $ 0 $ 0 $ 3,242.6 $ 3,203.2State and local government obligations 0 1,989.1 0 1,989.1 1,955.5Corporate debt securities 0 2,616.6 29.5 2,646.1 2,579.0
Subtotal 3,242.6 4,605.7 29.5 7,877.8 7,737.7
Asset-backed securities:Residential mortgage-backed 0 466.9 96.7 563.6 567.1Commercial mortgage-backed 0 1,804.6 27.5 1,832.1 1,772.1Other asset-backed 0 1,069.0 5.0 1,074.0 1,063.9
Subtotal asset-backed securities 0 3,340.5 129.2 3,469.7 3,403.1
Redeemable preferred stocks:Financials 23.4 172.4 0 195.8 183.8Utilities 0 71.4 0 71.4 70.2Industrials 0 235.3 0 235.3 236.0
Subtotal redeemable preferred stocks 23.4 479.1 0 502.5 490.0
Total fixed maturities 3,266.0 8,425.3 158.7 11,850.0 11,630.8
Equity securities:Nonredeemable preferred stocks:
Financials 490.2 565.1 0 1,055.3 514.3Utilities 0 67.9 0 67.9 50.8Industrials 0 34.4 0 34.4 36.2
Subtotal nonredeemable preferred stocks 490.2 667.4 0 1,157.6 601.3
Common equities:Common stocks 1,413.2 0 0 1,413.2 1,017.6Other equity-like investments 0 0 11.8 11.8 4.1
Subtotal common equities 1,413.2 0 11.8 1,425.0 1,021.7
Total fixed maturities and equity securities $5,169.4 $9,092.7 $170.5 14,432.6 13,253.8
Short-term investments:Other short-term investments1 1,090.8 1,090.8
Total portfolio $15,523.4 $14,344.6
Debt2 $ 2,105.7 $ 1,958.2
1Due to the underlying nature of these securities, cost approximates fair value.
2Debt is not subject to measurement at fair value in the Consolidated Balance Sheets. Therefore, it is not broken out by hierarchy level; fair valuesare obtained from external sources.
Our portfolio valuations classified as either Level 1 or Level 2 in the above tables are priced exclusively by external sources,including: pricing vendors, dealers/market makers, and exchange-quoted prices. During 2011, we had one nonredeemablepreferred security with a value of $44.2 million that was transferred from Level 1 to Level 2 due to the lack of an exchange-quoted price at year-end. The exchange price was not available due to illiquidity in the market place that is expected to betemporary. A consistent exchange-quoted price was previously available for this security, and we will continue to monitorthe security for future exchange trading volume. We recognize transfers between levels at the end of the reporting period.We did not have any transfers between Level 1 and Level 2 for the year ended December 31, 2010.
With limited exceptions, our Level 3 securities are also priced externally; however, due to several factors (e.g., nature of thesecurities, level of activity, and lack of similar securities trading to obtain observable market level inputs), these valuationsare more subjective in nature. Certain private equity investments and fixed-income investments included in the Level 3category are valued using external pricing supplemented by internal review and analysis.
At December 31, 2011, vendor-quoted prices represented 59% of our Level 1 classifications, compared to 63% atDecember 31, 2010. The securities quoted by vendors in Level 1 represent our holdings in U.S. Treasury Notes,
App.-A-21

which are frequently traded and the quotes are considered similar to exchange-traded quotes. The balance of our Level 1pricing comes from quotes obtained directly from trades made on an active exchange.
At December 31, 2011, vendor-quoted prices comprised 96% of our Level 2 classifications, while dealer-quoted pricesrepresented 4%, compared to 94% and 6%, respectively, at December 31, 2010. In our process for selecting a source (e.g.,dealer, pricing service) to provide pricing for securities in our portfolio, we reviewed documentation from the sources thatdetailed the pricing techniques and methodologies used by these sources and determined if their policies adequatelyconsidered market activity, either based on specific transactions for the particular security type or based on modeling ofsecurities with similar credit quality, duration, yield, and structure that were recently transacted. Once a source is chosen,we continue to monitor any changes or modifications to their processes by reviewing their documentation on internalcontrols for pricing and market reviews.
Our internal pricing policy is to consistently use a single source in order to maintain the integrity established when selectingthe source initially. From time to time, we will obtain a quote from more than one source to help us further evaluate themarket price of a security. Quotes obtained from the sources are not considered binding offers to transact a trade. Underour policy, when a review of the valuation received from our selected source appears outside what is considered marketlevel activity (which is defined as trading at spreads or yields significantly different than comparable securities or outside thegeneral sector level movement without a reasonable explanation), we may use an alternate source’s price. To the extent wedetermine that it is prudent to substitute one source’s price for another, we will contact the initial source to obtain anunderstanding of the factors that may be contributing to the significant price variance, which often leads the source to adjusttheir pricing input data for future pricing.
To allow us to determine if our initial source is providing a price that is outside of a reasonable range, we review ourportfolio pricing on a weekly basis. We frequently challenge prices from our sources when a price provided does not matchour expectations based on our evaluation of market trends/activity. Initially, we perform a global review of our portfolio bysector to identify securities whose prices appear outside of a reasonable range. We refine our review to analyze prices byspecific criteria, such as whether the security is investment or non-investment-grade, prime or sub-prime, or a consumerproduct (e.g., auto, credit card). Through this review, we try to determine what contributed to the price variances amongsources by analyzing spread movement, comparable security trades, if available, or industry or specific issuerfundamentals. We review quality control measures of our sources as they become available to determine if any significantchanges have occurred from period to period that might indicate issues/concerns regarding their evaluation or marketcoverage. We also review data assumptions as supplied by our sources to determine if that data is relevant to currentmarket conditions. In addition, we independently review each sector for transaction volumes, new issuances, and changesin spreads, as well as the overall movement of interest rates along the yield curve to determine if sufficient activity andliquidity exists to provide a credible source for our market valuations.
During each valuation period, we create internal estimations of portfolio valuation (performance returns), based on currentmarket-related activity (i.e., interest rate and credit spread movements and other credit-related factors) within each majorsector of our portfolio. We compare our internally generated portfolio results with those generated based on quotes wereceived externally and research material valuation differences. In addition, we compare our results to index returns foreach major sector adjusting for duration and credit quality differences to better understand our portfolio’s results.Additionally, we review on a monthly basis our external sales transactions and compare the actual final market sales priceto a previous market valuation price. This review provides us further validation that our pricing sources are providing marketlevel prices, since we are able to explain significant price changes (i.e., greater than 2%) as known events occur in themarket place and affect a particular security’s price at sale.
This analysis provides us additional comfort regarding the source’s process, the quality of their review, and their willingnessto improve their analysis based on feedback from clients. We believe this collaborative effort helps ensure that we arereporting the most representative fair values of our securities.
After all the valuations are received and our review is complete, to the extent the inputs used by vendors are determined tonot contain sufficient observable market information, we will reclassify the affected security valuations to Level 3. AtDecember 31, 2011 and 2010, securities in our fixed-maturity portfolio listed as Level 3 were comprised substantially ofsecurities that were either: (i) private placement deals, (ii) thinly held and/or traded securities, or (iii) non-investment-gradesecurities with little liquidity. Based on these factors, it was difficult to independently verify observable market inputs thatwere used to generate the external valuations we received. At December 31, 2011 and 2010, we had one private common
App.-A-22

equity security with a value of $10.2 million that was priced internally. Additionally, at December 31, 2011 and 2010, we hadtwo fixed-maturity securities with an aggregate value of $0.5 million that were priced internally. Despite the lack of sufficientobservable market information, based on the valuations received in conjunction with our procedures for evaluating third-party prices, we believe the fair values reported in the financial statements accurately reflect market prices.
The following tables provide a summary of changes in fair value associated with Level 3 assets for the years endedDecember 31, 2011 and 2010:
Level 3 Fair Value
(millions)
Fair Valueat Dec. 31,
2010
Calls/Maturities/Paydowns Purchases Sales
NetRealized
(Gain)/LossChange inValuation
NetTransfersIn (Out)1
Fair valueat Dec. 31,
2011
Fixed maturities:Asset-backed securities:
Residential mortgage-backed $ 96.7 $(19.5) $0 $ 0 $ 0 $ .5 $(15.4) $62.3Commercial mortgage-backed 27.5 (.3) 0 0 0 (5.9) 0 21.3Other asset-backed 5.0 (2.6) 0 0 0 .2 0 2.6
Total asset-backed securities 129.2 (22.4) 0 0 0 (5.2) (15.4) 86.2Corporate debt securities 29.5 0 0 (27.9) (.6) (1.0) 0 0Other debt obligations 0 0 0 0 0 0 0 0Redeemable preferred stocks:
Industrials 0 0 0 0 0 0 0 0
Total fixed maturities 158.7 (22.4) 0 (27.9) (.6) (6.2) (15.4) 86.2
Equity securities:Common equities:
Other equity-like investments 11.8 0 0 0 0 (.3) 0 11.5
Total Level 3 securities $170.5 $(22.4) $0 $(27.9) $(.6) $(6.5) $(15.4) $97.7
1The $(15.4) million was transferred out of Level 3 into Level 2 due to the availability of vendor pricing on a residential mortgage-backed security.
Level 3 Fair Value
(millions)
Fair Valueat Dec. 31,
2009
Calls/Maturities/Paydowns Purchases Sales
NetRealized
(Gain)/LossChange inValuation
NetTransfersIn (Out)1
Fair valueat Dec. 31,
2010
Fixed maturities:Asset-backed securities:
Residential mortgage-backed $ 46.1 $(20.9) $55.6 $ 0 $ 0 $ 4.8 $11.1 $ 96.7Commercial mortgage-backed 21.6 0 0 0 0 5.4 .5 27.5Other asset-backed 7.8 (2.6) 0 0 0 (.2) 0 5.0
Total asset-backed securities 75.5 (23.5) 55.6 0 0 10.0 11.6 129.2Corporate debt securities 28.2 0 0 0 0 1.3 0 29.5Other debt obligations 1.1 0 0 0 0 (1.1) 0 0Redeemable preferred stocks:
Industrials 53.1 0 0 0 0 0 (53.1) 0
Total fixed maturities 157.9 (23.5) 55.6 0 0 10.2 (41.5) 158.7
Equity securities:Common equities:
Other equity-like investments 12.9 (2.1) 0 (.3) .3 1.0 0 11.8
Total Level 3 securities $170.8 $(25.6) $55.6 $(.3) $.3 $11.2 $(41.5) $170.5
1The net $(41.5) million of transfers out of Level 3 included: a $12.1 million transfer into Level 3 and subsequent transfer out of Level 3 at $(15.1)million due to sufficient trade volume, a $(53.1) million transfer out of Level 3 due to the availability of vendor pricing on a redeemable preferredstock, and $14.6 million of transfers into Level 3 due to the lack of trade volume.
App.-A-23

4. DEBT
Debt at December 31 consisted of:
2011 2010
(millions)Carrying
ValueFair
ValueCarrying
ValueFair
Value
6.375% Senior Notes due 2012 (issued: $350.0, December 2001) $ 350.0 $ 350.5 $ 349.6 $ 369.37% Notes due 2013 (issued: $150.0, October 1993) 149.7 162.4 149.6 165.03.75% Senior Notes due 2021 (issued: $500.0, August 2011) 497.0 525.3 0 06 5/8% Senior Notes due 2029 (issued: $300.0, March 1999) 295.0 364.4 294.8 329.96.25% Senior Notes due 2032 (issued: $400.0, November 2002) 394.4 492.4 394.2 433.36.70% Fixed-to-Floating Rate Junior Subordinated Debentures due 2067
(issued: $1,000.0, June 2007; outstanding: $762.1 and $777.1) 756.0 769.7 770.0 808.2
Total $2,442.1 $2,664.7 $1,958.2 $2,105.7
All of the outstanding debt was issued by The Progressive Corporation. Debt includes amounts we have borrowed andcontributed to the capital of our insurance subsidiaries or used, or have available for use, for other business purposes. Fairvalues are obtained from external sources. There are no restrictive financial covenants or credit rating triggers on our debt.
Interest on all debt is payable semiannually at the stated rates. However, the 6.70% Fixed-to-Floating Rate JuniorSubordinated Debentures due 2067 (the “6.70% Debentures”) will only bear interest at this fixed annual rate through, butexcluding, June 15, 2017. Thereafter, the 6.70% Debentures will bear interest at an annual rate equal to the three-monthLIBOR plus 2.0175%, and the interest will be payable quarterly.
In September 2011, we entered into an agreement with The Bank of New York Mellon Trust Company, N.A., as trustee,modifying the terms of the 6.70% Debentures. Pursuant to that agreement, among other changes, we surrendered our rightto temporarily defer the payment of interest on the 6.70% Debentures and terminated a related obligation to reserve250 million of our unissued common shares as a source of potential funding to pay any such deferred interest. The changeswere effective immediately upon execution of the agreement. Prior to this time, and subject to certain conditions, we had theright to defer the payment of interest on the 6.70% Debentures for one or more periods not exceeding ten consecutive yearseach.
Except for the 6.70% Debentures, all principal is due at the maturity stated in the table above. The 6.70% Debentures willbecome due on June 15, 2037, the scheduled maturity date, but only to the extent that we have received sufficient netproceeds from the sale of certain qualifying capital securities. We must use our commercially reasonable efforts, subject tocertain market disruption events, to sell enough qualifying capital securities to permit repayment of the 6.70% Debentures infull on the scheduled maturity date or, if sufficient proceeds are not realized from the sale of such qualifying capitalsecurities by such date, on each interest payment date thereafter. Any remaining outstanding principal will be due onJune 15, 2067, the final maturity date.
The 7% Notes are noncallable. The 6.375% Senior Notes, the 3.75% Senior Notes, the 6 5/8% Senior Notes, and the6.25% Senior Notes (collectively, “Senior Notes”) may be redeemed in whole or in part at any time, at our option, subject toa “make-whole” provision. The 6.70% Debentures may be redeemed, in whole or in part, at any time: (a) prior to June 15,2017, at a redemption price equal to the greater of (i) 100% of the principal amount of the 6.70% Debentures beingredeemed, or (ii) a “make-whole” amount, in each case plus any accrued and unpaid interest; or (b) on or after June 15,2017, at a redemption price equal to 100% of the principal amount of the 6.70% Debentures being redeemed, plus anyaccrued and unpaid interest.
During 2011, we repurchased $15.0 million in aggregate principal amount of our 6.70% Debentures at or near par in theopen market. As a result, our debt under these Debentures was extinguished and we incurred a net loss of $0.1 million.
In June 2010, we commenced an offer to purchase for cash (the “Tender Offer”) up to $350 million in aggregate principalamount of our 6.70% Debentures. The Tender Offer expired on July 8, 2010. We received valid tenders from holders of the6.70% Debentures in the aggregate principal amount of $222.9 million. All of the tendering holders validly tendered by theearly tender date of June 23, 2010, and received consideration of $950 per $1,000 principal amount of the 6.70%
App.-A-24

Debentures accepted for purchase, which included an early tender payment of $50 per $1,000 principal amount of 6.70%Debentures accepted. We recognized a net gain on this debt extinguishment of $6.4 million, after deducting expenses andfees associated with the Tender Offer and related Consent Solicitation discussed below.
As a condition of the Tender Offer, we solicited consents (the “Consent Solicitation”) from the holders of our 6.25% SeniorNotes to terminate the Replacement Capital Covenant (the “RCC”) relating to the 6.25% Senior Notes. The RCC wasoriginally entered into by Progressive in June 2007 for the benefit of the holders of the 6.25% Senior Notes in connectionwith the issuance of the 6.70% Debentures. Under the RCC, we agreed that we would not repay, redeem, defease, orpurchase all or any part of the 6.70% Debentures before June 15, 2047, unless Progressive was to obtain a specifiedportion of the funds used in the transaction through the sale of its common shares or certain other equity or equity-likesecurities. The RCC was terminated on June 23, 2010, the expiration date of the Consent Solicitation, at which time we hadreceived the consent of holders of a majority of the outstanding aggregate principal amount of the 6.25% Senior Notes.Those holders who validly delivered their consent by the expiration date received a consent fee of $5.00 for each $1,000principal amount of their 6.25% Senior Notes.
Prior to issuance of the Senior Notes and 6.70% Debentures, we entered into forecasted debt issuance hedges againstpossible rises in interest rates. Upon issuance of the applicable debt securities, the hedges were closed and we recognizedunrealized gains (losses) as part of accumulated other comprehensive income. The original unrealized gain (loss) and theunamortized balance at December 31, 2011, on a pretax basis, of these hedges, were as follows:
(millions)Original
Unrealized Gain (Loss)Unamortized Balanceat December 31, 2011
6.375% Senior Notes $18.4 $ .23.75% Senior Notes (5.1) (5.0)6 5/8% Senior Notes (4.2) (3.5)6.25% Senior Notes 5.1 4.46.70% Debentures 34.4 16.1
The gains (losses) on these hedges are deferred and are being amortized as adjustments to interest expense over the lifeof the related Senior Notes, and over the 10-year fixed interest rate term for the 6.70% Debentures. In addition to thisamortization, during 2011 and 2010, we reclassified $0.3 million and $5.8 million, respectively, on a pretax basis, fromaccumulated other comprehensive income on the balance sheet to net realized gains (losses) on securities on thecomprehensive income statement, reflecting the portion of the unrealized gain on forecasted transactions that was relatedto the portion of the 6.70% Debentures repurchased during the periods.
On December 31, 2011, we entered into an amendment to the 364-Day Secured Liquidity Credit Facility Agreement (“CreditFacility Agreement”) with PNC Bank, National Association (PNC), which extended the expiration date of our outstandingcredit facility agreement until December 31, 2012, unless earlier terminated pursuant to the terms of the agreement. Underthis agreement, we may borrow up to $125 million, which may be increased to $150 million at our request but subject toPNC’s discretion. The purpose of the credit facility is to provide liquidity in the event of disruptions in our cash managementoperations, such as disruptions in the financial markets or related facilities that affect our ability to transfer or receive funds.Under this credit facility, we may borrow funds, on a revolving basis, either in the form of Eurodollar Loans or Base RateLoans. Eurodollar Loans will bear interest at one-, two-, three-, or six-month LIBOR (as selected by us) plus 50 basis pointsfor the selected period. Base Rate Loans will bear daily interest at the greater of (a) PNC’s prime rate for such day, (b) thefederal funds effective rate for such day plus 1/2% per annum, or (c) one-month LIBOR plus 2% per annum. Any borrowingsunder this agreement will be secured by a lien on certain marketable securities held in our investment portfolio. Facility feesof $25,000 and $62,500 in 2011 and 2010, respectively, were paid as consideration for this revolving agreement. Inaddition, in 2011 and 2010, we had $125 million on deposit in an interest-bearing account at PNC, which was transferred toan FDIC-insured, non-interest bearing account in January 2012, to provide us with additional cash availability in the event ofsuch disruption to our cash management operations. Our access to these funds is unrestricted. However, if we withdrawfunds from this account for any reason other than in connection with a disruption in our cash management operations, theavailability of borrowings under the PNC credit facility will be reduced on a dollar-for-dollar basis until such time as wereplenish the funds to the deposit account. There are no rating triggers under the credit agreement. We had no borrowingsunder this arrangement in 2011 or 2010.
App.-A-25

Aggregate principal payments on debt outstanding at December 31, 2011, is as follows:
(millions)Year Payments
2012 $ 350.02013 150.02014 02015 02016 0Thereafter 1,962.1
Total $2,462.1
In January 2012, we retired the entire $350.0 million of our 6.375% Senior Notes at maturity.
5. INCOME TAXES
The components of our income tax provision were as follows:
(millions) 2011 2010 2009
Current tax provision $440.2 $433.9 $491.0Deferred tax expense 31.3 63.0 8.4
Total income tax provision $471.5 $496.9 $499.4
The provision for income taxes in the accompanying consolidated statements of comprehensive income differed from thestatutory rate as follows:
($ in millions) 2011 2010 2009
Income before income taxes $1,487.0 $1,565.2 $1,556.9
Tax at statutory rate $ 520.5 35% $ 547.8 35% $ 544.9 35%Tax effect of:
Exempt interest income (17.5) (1) (19.4) (1) (26.7) (2)Dividends received deduction (18.2) (1) (17.2) (1) (17.9) (1)Tax credits (9.1) (1) 0 0 0 0Tax-deductible dividends (3.8) 0 (13.0) (1) 0 0Other items, net (.4) 0 (1.3) 0 (.9) 0
Total income tax provision $ 471.5 32% $ 496.9 32% $ 499.4 32%
App.-A-26

Deferred income taxes reflect the effect for financial statement reporting purposes of temporary differences between thefinancial statement carrying amounts and the tax bases of assets and liabilities. At December 31, 2011 and 2010, thecomponents of the net deferred tax asset were as follows:
(millions) 2011 2010
Deferred tax assets:Unearned premiums reserve $ 319.1 $ 302.3Investment basis differences 246.1 286.3Non-deductible accruals 172.1 158.9Loss and loss adjustment expense reserves 113.6 120.4Other 5.2 5.0
Deferred tax liabilities:Net unrealized gains on securities (367.7) (413.2)Hedges on forecasted transactions (4.3) (7.9)Deferred acquisition costs (151.8) (146.0)Property and equipment (109.9) (105.4)Prepaid expenses (16.1) (12.6)Deferred gain on extinguishment of debt (5.8) (5.8)Other (4.5) (3.8)
Net deferred tax asset 196.0 178.2Net income taxes recoverable (payable) 12.0 10.8
Income taxes $ 208.0 $ 189.0
Although realization of the deferred tax asset is not assured, management believes that it is more likely than not that thedeferred tax asset will be realized based on our expectation that we will be able to fully utilize the deductions that areultimately recognized for tax purposes and, therefore, no valuation allowance was needed at December 31, 2011.
We have been a participant in the Compliance Assurance Program (CAP) since 2007. Under CAP, the Internal RevenueService (IRS) begins its examination process for the tax year before the tax return is filed, by examining significanttransactions and events as they occur. The goal of the CAP program is to expedite the exam process and to reduce thelevel of uncertainty regarding a taxpayer’s tax filing positions.
All federal income tax years prior to 2007 are closed. The IRS exams for 2007-2010 have been completed. We consider2007 to be effectively settled. For the 2008, 2009, and 2010 tax years, we have received partial acceptance letters. Weagreed to extend the statute of limitations for the 2007 and 2008 tax years to September 30, 2012, at the request of IRSAppeals.
One issue remains open for the 2008, 2009, and 2010 tax years relating to partial worthlessness deductions on certain debtinstruments; we have reached settlements with IRS Appeals on this issue for 2008 and 2009, but they are pending reviewby the Congressional Joint Committee on Taxation. For the 2010 tax year, there is one additional unresolved issue thatrelates to our 2010 debt Tender Offer (see Note 4 – Debt for further discussion) and the appropriate timing of when torecognize the tax on the gain that we recorded in net income that related to the previously unrealized gain on forecastedtransactions. We expect all open issues to be resolved by the end of 2012 and believe that none of these issues will have amaterial effect on our financial condition, results of operations, or cash flows. In addition to these unresolved issues, we filedrefund claims for the 2007-2009 tax years relating to the research and experimentation tax credit; these claims have beenaccepted by the IRS, but, as of December 31, 2011, were pending review by the Congressional Joint Committee onTaxation.
We recognize interest and penalties, if any, related to unrecognized tax benefits as a component of income tax expense.We have not recorded any unrecognized tax benefits, or any related interest and penalties, as of December 31, 2011 and2010. For the years ended December 31, 2011, 2010, and 2009, only the 2009 tax provision includes an interest benefit(net of tax) of $0.3 million related to the settlement of the 2004-2007 IRS exams.
App.-A-27

6. LOSS AND LOSS ADJUSTMENT EXPENSE RESERVES
Activity in the loss and loss adjustment expense reserves is summarized as follows:
(millions) 2011 2010 2009
Balance at January 1 $ 7,071.0 $ 6,653.0 $ 6,177.4Less reinsurance recoverables on unpaid losses 704.1 529.4 244.5
Net balance at January 1 6,366.9 6,123.6 5,932.9
Incurred related to:Current year 10,876.8 10,451.7 10,040.9Prior years (242.0) (320.4) (136.0)
Total incurred 10,634.8 10,131.3 9,904.9
Paid related to:Current year 7,289.3 6,841.0 6,542.2Prior years 3,252.3 3,047.0 3,172.0
Total paid 10,541.6 9,888.0 9,714.2
Net balance at December 31 6,460.1 6,366.9 6,123.6Plus reinsurance recoverables on unpaid losses 785.7 704.1 529.4
Balance at December 31 $ 7,245.8 $ 7,071.0 $ 6,653.0
We experienced favorable reserve development in each of the last three years, which is reflected as “Incurred related toprior years” in the table above.
2011• About half of the favorable reserve development was attributable to accident years 2008 and prior, while the
balance was primarily due to claims from accident year 2010.• Approximately 70% of the favorable reserve development was attributable to our Personal Lines business,
with our Agency and Direct channels contributing 25% and 75%, respectively; the balance was primarily inour Commercial Auto business.
2010• Approximately 70% of the favorable reserve development was attributable to accident year 2009, while the
balance was mostly due to claims from accident years 2007 and 2006.• About 70% of the favorable reserve development was in our Personal Lines business, with our Agency and
Direct channels contributing almost equal amounts; the balance was in our Commercial Auto business.
2009
• About 60% of the favorable reserve development was due to favorable development for accident years 2006and prior, while the balance was mostly due to claims from accident year 2008.
• Approximately 55% of the favorable reserve development was attributable to our Personal Lines business,with our Agency and Direct channels contributing 25% and 75%, respectively; the balance was primarily inour Commercial Auto business.
The favorable reserve development reflected the settlement of larger losses for amounts less than we originally reserved inour Personal Lines business (primarily in our personal auto product) for 2011 and 2010, and in our Commercial Autobusiness for each of the last three years. During the last three years, we also experienced lower than expected defense andcost containment costs, reflecting a combination of fewer claims being litigated, as well as the fact that a greater percentageof these cases are now being handled by our in-house counsel, which is a cost-effective alternative to using external lawfirms. In addition, for 2010, our incurred but not recorded (IBNR) reserves developed favorably due to lower severity andfrequency of late emerging claims. However, in 2011, the number of late emerging claims increased over 2010 and wasgreater than anticipated by our carried IBNR, thus we recognized unfavorable development on our total IBNR reserves.
Because we are primarily an insurer of motor vehicles, we have limited exposure to environmental, asbestos, and generalliability claims. We have established reserves for such exposures, in amounts that we believe to be adequate based oninformation currently known. These claims are not expected to have a material effect on our liquidity, financial condition,cash flows, or results of operations.
App.-A-28
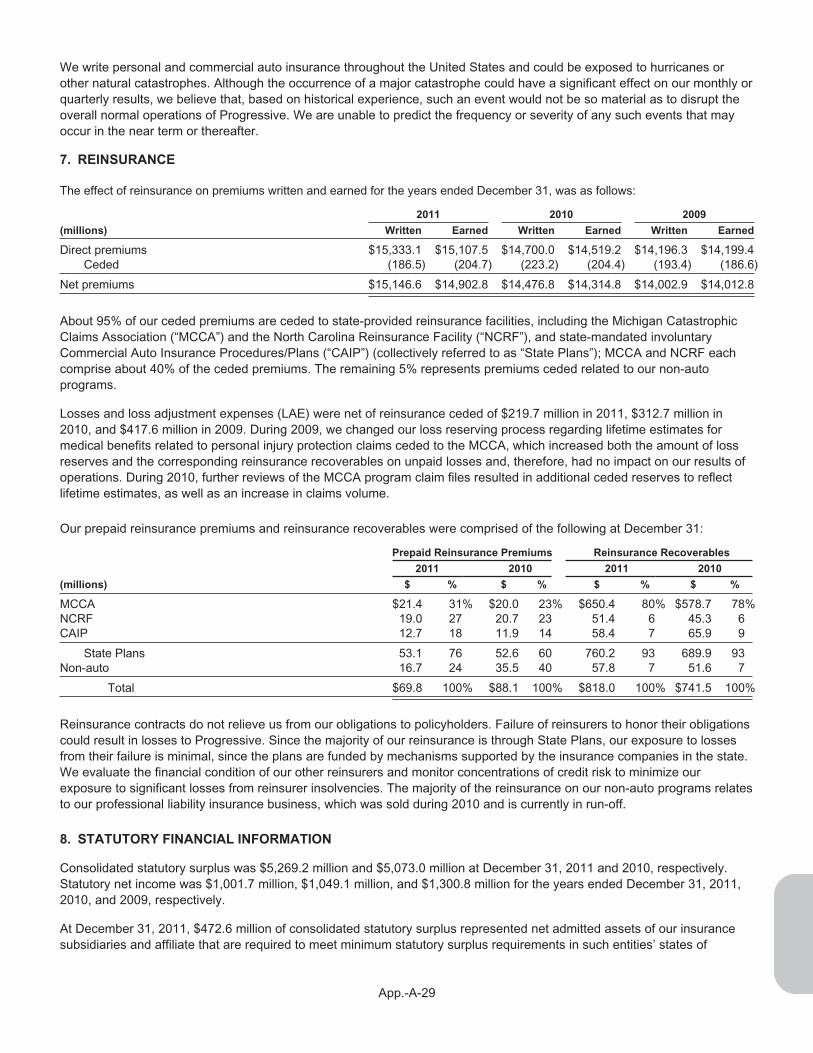
We write personal and commercial auto insurance throughout the United States and could be exposed to hurricanes orother natural catastrophes. Although the occurrence of a major catastrophe could have a significant effect on our monthly orquarterly results, we believe that, based on historical experience, such an event would not be so material as to disrupt theoverall normal operations of Progressive. We are unable to predict the frequency or severity of any such events that mayoccur in the near term or thereafter.
7. REINSURANCE
The effect of reinsurance on premiums written and earned for the years ended December 31, was as follows:
2011 2010 2009
(millions) Written Earned Written Earned Written Earned
Direct premiums $15,333.1 $15,107.5 $14,700.0 $14,519.2 $14,196.3 $14,199.4Ceded (186.5) (204.7) (223.2) (204.4) (193.4) (186.6)
Net premiums $15,146.6 $14,902.8 $14,476.8 $14,314.8 $14,002.9 $14,012.8
About 95% of our ceded premiums are ceded to state-provided reinsurance facilities, including the Michigan CatastrophicClaims Association (“MCCA”) and the North Carolina Reinsurance Facility (“NCRF”), and state-mandated involuntaryCommercial Auto Insurance Procedures/Plans (“CAIP”) (collectively referred to as “State Plans”); MCCA and NCRF eachcomprise about 40% of the ceded premiums. The remaining 5% represents premiums ceded related to our non-autoprograms.
Losses and loss adjustment expenses (LAE) were net of reinsurance ceded of $219.7 million in 2011, $312.7 million in2010, and $417.6 million in 2009. During 2009, we changed our loss reserving process regarding lifetime estimates formedical benefits related to personal injury protection claims ceded to the MCCA, which increased both the amount of lossreserves and the corresponding reinsurance recoverables on unpaid losses and, therefore, had no impact on our results ofoperations. During 2010, further reviews of the MCCA program claim files resulted in additional ceded reserves to reflectlifetime estimates, as well as an increase in claims volume.
Our prepaid reinsurance premiums and reinsurance recoverables were comprised of the following at December 31:
Prepaid Reinsurance Premiums Reinsurance Recoverables
2011 2010 2011 2010
(millions) $ % $ % $ % $ %
MCCA $21.4 31% $20.0 23% $650.4 80% $578.7 78%NCRF 19.0 27 20.7 23 51.4 6 45.3 6CAIP 12.7 18 11.9 14 58.4 7 65.9 9
State Plans 53.1 76 52.6 60 760.2 93 689.9 93Non-auto 16.7 24 35.5 40 57.8 7 51.6 7
Total $69.8 100% $88.1 100% $818.0 100% $741.5 100%
Reinsurance contracts do not relieve us from our obligations to policyholders. Failure of reinsurers to honor their obligationscould result in losses to Progressive. Since the majority of our reinsurance is through State Plans, our exposure to lossesfrom their failure is minimal, since the plans are funded by mechanisms supported by the insurance companies in the state.We evaluate the financial condition of our other reinsurers and monitor concentrations of credit risk to minimize ourexposure to significant losses from reinsurer insolvencies. The majority of the reinsurance on our non-auto programs relatesto our professional liability insurance business, which was sold during 2010 and is currently in run-off.
8. STATUTORY FINANCIAL INFORMATION
Consolidated statutory surplus was $5,269.2 million and $5,073.0 million at December 31, 2011 and 2010, respectively.Statutory net income was $1,001.7 million, $1,049.1 million, and $1,300.8 million for the years ended December 31, 2011,2010, and 2009, respectively.
At December 31, 2011, $472.6 million of consolidated statutory surplus represented net admitted assets of our insurancesubsidiaries and affiliate that are required to meet minimum statutory surplus requirements in such entities’ states of
App.-A-29

domicile. The companies may be licensed in states other than their states of domicile, which may have higher minimumstatutory surplus requirements. Generally, the net admitted assets of insurance companies that, subject to other applicableinsurance laws and regulations, are available for transfer to the parent company cannot include the net admitted assetsrequired to meet the minimum statutory surplus requirements of the states where the companies are licensed.
During 2011, the insurance subsidiaries paid aggregate cash dividends of $874.9 million to the parent company. Based onthe dividend laws currently in effect, the insurance subsidiaries could pay aggregate dividends of $1,195.8 million in 2012without prior approval from regulatory authorities, provided the dividend payments are not made within 12 months ofprevious dividends paid by the applicable subsidiary.
9. EMPLOYEE BENEFIT PLANS
Retirement Plans Progressive has a defined contribution pension plan (“401(k) Plan”) that covers all United Statesemployees who are 18 years of age or older and have been employed with the company for at least 30 days. Under thisplan, Progressive matches up to a maximum of 6% of an employee’s eligible compensation contributed to the plan.Employee and company matching contributions are invested, at the direction of the employee, in a number of investmentoptions available under the plan, including various mutual funds and a Progressive common stock fund. As of December 3,2010, the Progressive common stock fund was converted to an employee stock ownership program (“ESOP”) within the401(k) Plan. At December 31, 2011, the ESOP held 26.9 million of our common shares, all of which are included in sharesoutstanding. Dividends on these shares are reinvested in common shares or paid out in cash at the election of theparticipant and the related tax benefit is recorded as part of our tax provision.
Matching contributions made by the company for the 401(k) Plan were $64.1 million, $61.3 million, and $60.7 million for theyears ended December 31, 2011, 2010, and 2009, respectively.
Postemployment Benefits Progressive provides various postemployment benefits to former or inactive employees whomeet eligibility requirements, and to their beneficiaries and covered dependents. Postemployment benefits include salarycontinuation and disability-related benefits, including workers’ compensation and, if elected, continuation of health-carebenefits for specified limited periods. The liability for these benefits was $20.8 million at both December 31, 2011 and 2010.
Postretirement Benefits We provide postretirement health and life insurance benefits to all employees who metrequirements as to age and length of service at December 31, 1988. There are approximately 130 people who are eligiblefor these postretirement benefits. Our funding policy for these benefits is to contribute annually, to a 501(c)(9) trust, themaximum amount that can be deducted for federal income tax purposes.
Incentive Compensation Plans – Employees Our incentive compensation includes both non-equity incentive plans (cash)and equity incentive plans. Cash incentive compensation includes a cash bonus program for a limited number of seniorexecutives and our Gainsharing program for other employees; the bases of these programs are similar in nature. Equityincentive compensation plans provide for the granting of restricted stock awards and restricted stock unit awards(collectively, “restricted equity awards”) to key members of management. Prior to 2003, we granted non-qualified stockoptions (NQSOs) as equity-based incentive compensation (see below). The amounts charged to income for the incentivecompensation plans for the years ended December 31, were:
2011 2010 2009
(millions) Pretax After Tax Pretax After Tax Pretax After Tax
Cash $196.1 $127.5 $257.3 $167.2 $120.4 $78.3Equity 50.5 32.8 45.9 29.8 40.3 26.2
Our 2003 Incentive Plan, which provides for the granting of equity-based awards to key members of management, has18.7 million shares currently authorized, net of restricted equity awards cancelled; 2.5 million shares remain available forfuture awards. In addition, our 2010 Equity Incentive Plan, approved by shareholders in April 2010, had 18.0 million sharesauthorized as of December 31, 2011, and 15.6 million shares remain available for future awards.
In 2003, we began issuing restricted equity awards in lieu of NQSOs. In March 2010, we began issuing restricted stock unitsin lieu of restricted stock as the basis for our equity awards. The restricted equity awards were issued as either time-basedor performance-based awards. The time-based awards vest in equal installments upon the lapse of specified periods of
App.-A-30

time, typically three, four, and five years. All restricted stock unit conversions at vesting and option exercises are settled inProgressive common shares from existing treasury shares on a one-to-one basis.
The performance-based awards were granted to our Chief Executive Officer as his sole equity award for 2011, and toapproximately 40 executives and senior managers in addition to their time-based awards (including the CEO for 2010 andprior), to provide additional incentive to achieve pre-established profitability and growth targets. Vesting for all awards isbased upon the achievement of predetermined performance goals within specified time periods. The targets for theperformance-based awards, as well as the ultimate number of shares or units that may vest, vary by grant. Theperformance-based awards granted in 2010 and 2011 may vest from 0% to 200% of the award amount, and have a targetvalue of 100%. Performance awards made in March 2009, may vest from 0% to 100% of the award amount and have atarget value of 100%. Performance-based awards made prior to March 2009 would either vest or be forfeited in full (i.e., nopartial vesting).
Generally, time-based and performance-based equity awards are expensed pro rata over their respective vesting periodsbased on the market value of the awards at the time of grant. Performance-based equity awards that contain variablevesting criteria are expensed based on management’s expected vesting percentage. These estimates can changeperiodically throughout the measurement period. However, the restricted stock awards granted in 2004 that were deferredpursuant to our deferred compensation plan are accounted for as liability awards, since distributions from the deferredcompensation plan for these awards will be made in cash; accordingly, we record expense on a pro rata basis based on thecurrent market value of our common shares at the end of each reporting period. Only performance-based awards remainunvested from this grant.
A summary of all employee restricted equity award activity during the years ended December 31, follows:
2011 2010 2009
Restricted Equity AwardsNumber of
Shares1
WeightedAverage
GrantDate Fair
ValueNumber of
Shares1
WeightedAverage
GrantDate Fair
ValueNumber of
Shares1
WeightedAverage
GrantDate Fair
Value
Beginning of year 11,681,826 $16.55 10,614,016 $17.04 8,260,696 $20.39Add (deduct):
Granted2 2,483,461 20.03 2,841,400 17.50 4,072,152 12.08Vested (1,571,237) 19.88 (1,337,647) 22.72 (1,239,281) 23.14Forfeited (297,203) 15.41 (435,943) 15.58 (479,551) 16.98
End of year3,4 12,296,847 $16.86 11,681,826 $16.55 10,614,016 $17.04
Available, end of year 18,141,922 20,328,180 4,753,038
1Includes both restricted stock units and restricted stock. Upon vesting, all units will be converted on a one-for-one basis into Progressive commonshares. All performance-based awards are included at their target amounts.
2In 2010, we began reinvesting dividend equivalents on restricted stock units. For 2011 and 2010, the number granted includes 55,288 and 134,644units, respectively, at a weighted average grant date fair value of $0, since the dividends were factored into the grant date fair value of the originalgrant.
3At December 31, 2011, the number of shares included 3,667,204 performance-based awards at their target amounts. We expect 3,791,224performance-based awards to vest, based upon our current estimate of the achievement of pre-determined performance goals.
4At December 31, 2011, the total unrecognized compensation cost related to unvested equity awards was $82.1 million, which includesperformance-based awards at their currently estimated vesting value. This compensation expense will be recognized into the income statementover the weighted average vesting period of 2.44 years.
The aggregate fair value of the restricted equity awards that vested during the years ended December 31, 2011, 2010, and2009, was $31.3 million, $24.3 million, and $16.8 million, respectively, based on the actual stock price on the vesting date.In 2009, we also had 91,856 deferred liability awards vest with no intrinsic value since, as previously discussed, theseawards were expensed based on the current market value at the end of each reporting period.
Prior to 2003, we granted NQSOs. These options became exercisable at various dates not earlier than six months after thedate of grant, and remained exercisable for up to ten years from the date of the award. All NQSOs vested on or before
App.-A-31
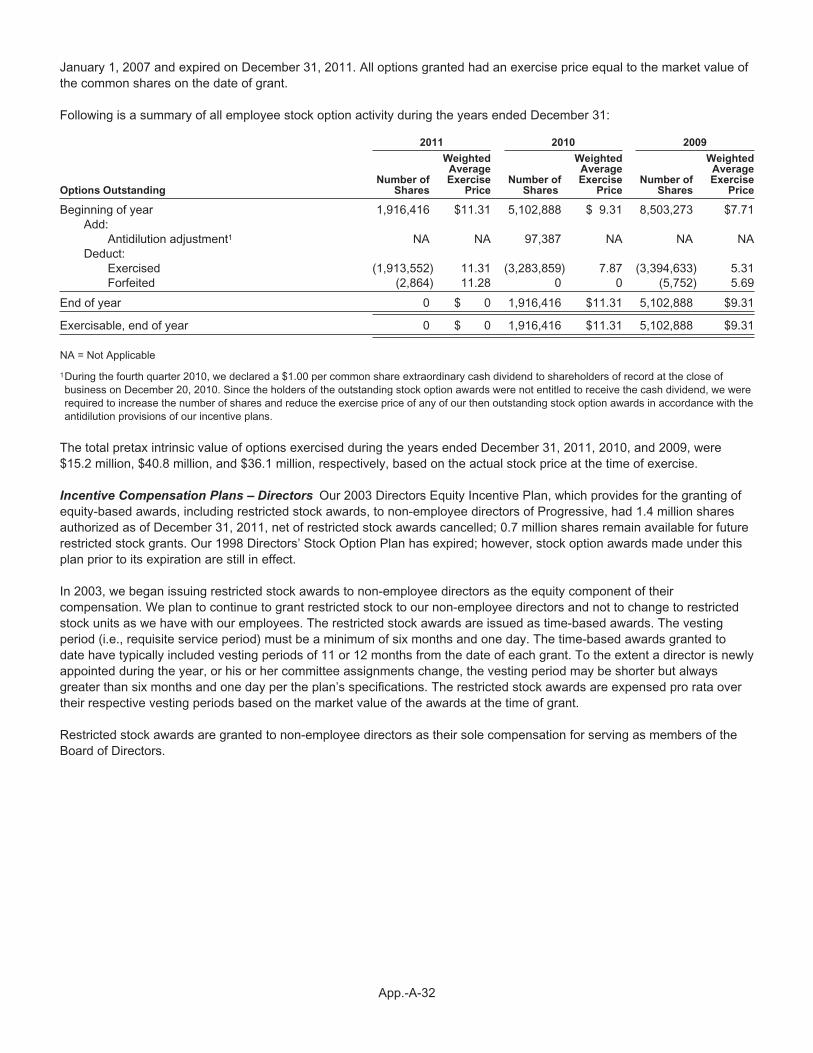
January 1, 2007 and expired on December 31, 2011. All options granted had an exercise price equal to the market value ofthe common shares on the date of grant.
Following is a summary of all employee stock option activity during the years ended December 31:
2011 2010 2009
Options OutstandingNumber of
Shares
WeightedAverageExercise
PriceNumber of
Shares
WeightedAverageExercise
PriceNumber of
Shares
WeightedAverageExercise
Price
Beginning of year 1,916,416 $11.31 5,102,888 $ 9.31 8,503,273 $7.71Add:
Antidilution adjustment1 NA NA 97,387 NA NA NADeduct:
Exercised (1,913,552) 11.31 (3,283,859) 7.87 (3,394,633) 5.31Forfeited (2,864) 11.28 0 0 (5,752) 5.69
End of year 0 $ 0 1,916,416 $11.31 5,102,888 $9.31
Exercisable, end of year 0 $ 0 1,916,416 $11.31 5,102,888 $9.31
NA = Not Applicable
1During the fourth quarter 2010, we declared a $1.00 per common share extraordinary cash dividend to shareholders of record at the close ofbusiness on December 20, 2010. Since the holders of the outstanding stock option awards were not entitled to receive the cash dividend, we wererequired to increase the number of shares and reduce the exercise price of any of our then outstanding stock option awards in accordance with theantidilution provisions of our incentive plans.
The total pretax intrinsic value of options exercised during the years ended December 31, 2011, 2010, and 2009, were$15.2 million, $40.8 million, and $36.1 million, respectively, based on the actual stock price at the time of exercise.
Incentive Compensation Plans – Directors Our 2003 Directors Equity Incentive Plan, which provides for the granting ofequity-based awards, including restricted stock awards, to non-employee directors of Progressive, had 1.4 million sharesauthorized as of December 31, 2011, net of restricted stock awards cancelled; 0.7 million shares remain available for futurerestricted stock grants. Our 1998 Directors’ Stock Option Plan has expired; however, stock option awards made under thisplan prior to its expiration are still in effect.
In 2003, we began issuing restricted stock awards to non-employee directors as the equity component of theircompensation. We plan to continue to grant restricted stock to our non-employee directors and not to change to restrictedstock units as we have with our employees. The restricted stock awards are issued as time-based awards. The vestingperiod (i.e., requisite service period) must be a minimum of six months and one day. The time-based awards granted todate have typically included vesting periods of 11 or 12 months from the date of each grant. To the extent a director is newlyappointed during the year, or his or her committee assignments change, the vesting period may be shorter but alwaysgreater than six months and one day per the plan’s specifications. The restricted stock awards are expensed pro rata overtheir respective vesting periods based on the market value of the awards at the time of grant.
Restricted stock awards are granted to non-employee directors as their sole compensation for serving as members of theBoard of Directors.
App.-A-32

A summary of all directors’ restricted stock activity during the years ended December 31, follows:
2011 2010 2009
Restricted StockNumber of
Shares
WeightedAverage
GrantDate Fair
ValueNumber of
Shares
WeightedAverage
GrantDate Fair
ValueNumber of
Shares
WeightedAverage
GrantDate Fair
Value
Beginning of year 109,545 $20.86 118,984 $15.79 105,420 $17.96Add (deduct):
Granted 94,106 21.80 112,670 20.75 129,467 15.78Vested (109,545) 20.86 (122,109) 15.82 (105,420) 17.96Forfeited 0 0 0 0 (10,483) 15.74
End of year 94,106 $21.80 109,545 $20.86 118,984 $15.79
Available, end of year1 663,095 757,201 869,871
1 Represents shares available under the 2003 Directors Equity Incentive Plan.
Prior to 2003, we granted nonqualified stock options as the equity component of the directors’ compensation. These optionsbecame exercisable at various dates not earlier than six months, and remain exercisable for up to ten years from the date ofgrant. All options granted had an exercise price equal to the market value of the common shares on the date of grant and,under the then applicable accounting guidance, no compensation expense was recorded. All option exercises are settled inProgressive common shares from existing treasury shares.
A summary of all stock option activity for both current and former directors during the years ended December 31, follows:
2011 2010 2009
Options OutstandingNumber of
Shares
WeightedAverageExercise
PriceNumber of
Shares
WeightedAverageExercise
PriceNumber of
Shares
WeightedAverageExercise
Price
Beginning of year 120,125 $10.34 312,545 $ 8.46 401,357 $8.60Add:
Antidilution adjustment1 NA NA 5,787 NA NA NADeduct:
Exercised (83,888) 9.41 (198,207) 7.07 (88,812) 9.10
End of year 36,237 $12.51 120,125 $10.34 312,545 $8.46
Exercisable, end of year2 36,237 $12.51 120,125 $10.34 312,545 $8.46
NA = Not Applicable
1During the fourth quarter 2010, we declared a $1.00 per common share extraordinary cash dividend to shareholders of record at the close ofbusiness on December 20, 2010. Since the holders of the outstanding stock option awards were not entitled to receive the cash dividend, we wererequired to increase the number of shares and reduce the exercise price of any of our then outstanding stock option awards in accordance with theantidilution provisions of our incentive plans.
2 The 1998 Directors’ Stock Option Plan has expired.
The total pretax intrinsic value of options exercised, and the fair value of the restricted stock vested, during the years endedDecember 31, 2011, 2010, and 2009, was $3.3 million, $5.1 million, and $1.9 million, respectively, based on the actualstock price at time of exercise/vesting.
The following director stock options were outstanding and exercisable as of December 31, 2011:
Number of Shares
WeightedAverage Exercise
Price
AggregateIntrinsic
Value
Weighted AverageRemaining
Contractual Life
ClosingStockPrice
36,237 $12.51 $0.3 million 0.3 years $19.51
App.-A-33

The aggregate intrinsic value in the preceding table represents the total pretax intrinsic value, based on the differencebetween our closing stock price and the exercise price of the options, which is the amount that would have been receivedby the option holders, before taxes, had all option holders exercised their options as of that date. All of the exercisableoptions at December 31, 2011, were “in-the-money.”
Deferred Compensation We maintain The Progressive Corporation Executive Deferred Compensation Plan (“DeferralPlan”) that permits eligible executives to defer receipt of some or all of their annual bonuses and all of their annual equityawards. Deferred cash compensation is deemed invested in one or more investment funds, including common shares ofProgressive, offered under the Deferral Plan and elected by the participant. All Deferral Plan distributions attributable todeferred cash compensation will be paid in cash.
For all equity awards granted on or after March 17, 2005, and deferred pursuant to the Deferral Plan, the deferred amountsare deemed invested in common shares and are ineligible for transfer to other investment funds in the Deferral Plan;distributions of these deferred awards will be made in common shares. For all restricted stock awards granted prior to thatdate, the deferred amounts are eligible to be transferred to any of the investment funds in the Deferral Plan; distributions ofthese deferred awards will be made in cash.
We reserved 3.6 million common shares for issuance under the Deferral Plan. An irrevocable grantor trust has beenestablished to provide a source of funds to assist us in meeting our liabilities under the Deferral Plan.
The Deferral Plan Irrevocable Grantor Trust account held the following assets at December 31:
(millions) 2011 2010
Progressive common shares1 $ 35.2 $31.1Other investment funds 66.2 67.3
Total $101.4 $98.4
1Includes 0.7 million and 0.5 million common shares as of December 31, 2011 and 2010, respectively, to be distributed in common shares.
10. SEGMENT INFORMATION
We write personal auto and other specialty property-casualty insurance and provide related services throughout the UnitedStates. Our Personal Lines segment writes insurance for personal autos and recreational vehicles. The Personal Linessegment is comprised of both the Agency and Direct businesses. The Agency business includes business written by ournetwork of more than 35,000 independent insurance agencies, including brokerages in New York and California, andstrategic alliance business relationships (other insurance companies, financial institutions, and national agencies). TheDirect business includes business written directly by us online and by phone.
Our Commercial Auto segment writes primary liability and physical damage insurance for automobiles and trucks owned bysmall businesses in the business auto, contractor, tow, for-hire specialty, and for-hire transportation markets. This segmentis distributed through both the independent agency and direct channels.
Our other indemnity businesses manage our run-off businesses, including the run-off of our professional liability insurancefor community banks, which was sold in 2010.
Our service businesses provide insurance-related services, including processing CAIP business and serving as an agent forhomeowners, general liability, and workers’ compensation insurance through our programs with unaffiliated insurancecompanies.
All segment revenues are generated from external customers and we do not have a reliance on any major customer.
We evaluate profitability based on pretax underwriting profit (loss) for the Personal Lines and Commercial Auto segmentsand for the other indemnity businesses. Pretax underwriting profit (loss) is calculated as net premiums earned less each of(i) losses and loss adjustment expenses, (ii) policy acquisition costs, and (iii) other underwriting expenses. Service businesspretax profit (loss) is the difference between service business revenues and service business expenses.
App.-A-34

Expense allocations are based on certain assumptions and estimates primarily related to revenue and volume; statedsegment operating results would change if different methods were applied. We do not allocate assets or income taxes tooperating segments. In addition, we do not separately identify depreciation and amortization expense by segment, and suchallocation would be impractical. Companywide depreciation expense was $88.5 million in 2011, $83.1 million in 2010, and$87.3 million in 2009. The accounting policies of the operating segments are the same as those described inNote 1 – Reporting and Accounting Policies.
Following are the operating results for the years ended December 31:
2011 2010 2009
(millions) Revenues
PretaxProfit
(Loss) Revenues
PretaxProfit
(Loss) Revenues
PretaxProfit
(Loss)
Personal LinesAgency $ 7,627.4 $ 564.9 $ 7,419.7 $ 601.0 $ 7,414.8 $ 579.2Direct 5,803.7 354.4 5,407.2 291.1 4,951.1 357.9
Total Personal Lines1 13,431.1 919.3 12,826.9 892.1 12,365.9 937.1Commercial Auto 1,467.1 133.5 1,474.2 185.0 1,623.3 229.8Other indemnity 4.6 (5.5) 13.7 6.4 23.6 8.7
Total underwriting operations 14,902.8 1,047.3 14,314.8 1,083.5 14,012.8 1,175.6
Service businesses 22.8 3.4 25.9 4.5 16.7 (2.7)Investments2 582.6 569.1 616.2 604.3 534.1 523.0Net gains (losses) on extinguishment of debt (.1) (.1) 6.4 6.4 0 0Interest expense NA (132.7) NA (133.5) NA (139.0)
Consolidated total $15,508.1 $1,487.0 $14,963.3 $1,565.2 $14,563.6 $1,556.9
1Personal auto insurance accounted for 91% of the total Personal Lines segment net premiums earned in 2011, and 90% in both 2010 and 2009;insurance for our special lines products (e.g., motorcycles, ATVs, RVs, mobile homes, watercraft, and snowmobiles) accounted for the balance ofthe Personal Lines net premiums earned.
2Revenues represent recurring investment income and total net realized gains (losses) on securities; pretax profit is net of investment expenses.
NA = Not Applicable
Progressive’s management uses underwriting margin and combined ratio as primary measures of underwriting profitability.The underwriting margin is the pretax underwriting profit (loss) expressed as a percentage of net premiums earned (i.e.,revenues from insurance operations). Combined ratio is the complement of the underwriting margin. Following are theunderwriting margins/combined ratios for our underwriting operations for the years ended December 31:
2011 2010 2009
UnderwritingMargin
CombinedRatio
UnderwritingMargin
CombinedRatio
UnderwritingMargin
CombinedRatio
Personal LinesAgency 7.4% 92.6 8.1% 91.9 7.8% 92.2Direct 6.1 93.9 5.4 94.6 7.2 92.8
Total Personal Lines 6.8 93.2 7.0 93.0 7.6 92.4Commercial Auto 9.1 90.9 12.5 87.5 14.2 85.8Other indemnity1 NM NM NM NM NM NM
Total underwriting operations 7.0 93.0 7.6 92.4 8.4 91.6
1Underwriting margins/combined ratios are not meaningful (NM) for our other indemnity businesses due to the low level of premiums earned by,and the variability of loss costs in, such businesses.
App.-A-35

11. OTHER COMPREHENSIVE INCOME (LOSS)
The components of other comprehensive income (loss) for the years ended December 31, were as follows:
2011 2010 2009
(millions) Pretax
Tax(Provision)
BenefitAfter
Tax Pretax
Tax(Provision)
BenefitAfter
Tax Pretax
Tax(Provision)
BenefitAfter
Tax
Net unrealized gains (losses) onsecurities:Arising during period:
Fixed maturities $ 132.9 $(46.5) $ 86.4 $302.9 $(106.0) $196.9 $ 519.4 $(181.8) $337.6Equity securities (57.5) 20.1 (37.4) 241.7 (84.6) 157.1 671.7 (235.1) 436.6Net non-credit related OTTI losses,
adjusted for valuation changes (5.5) 1.9 (3.6) 21.4 (7.5) 13.9 (24.1) 8.4 (15.7)Reclassification adjustment for (gains)
losses realized in net income:Fixed maturities (47.4) 16.6 (30.8) 46.3 (16.2) 30.1 (8.5) 3.0 (5.5)Equity securities (152.5) 53.4 (99.1) (93.7) 32.8 (60.9) (86.7) 30.3 (56.4)
Change in net unrealized gains (losses)on securities1 (130.0) 45.5 (84.5) 518.6 (181.5) 337.1 1,071.8 (375.2) 696.6
Net unrealized gains (losses) onforecasted transactions:2
Arising during period (5.1) 1.8 (3.3) 0 0 0 0 0 0Reclassification adjustment for amounts
realized in net income3 (5.3) 1.8 (3.5) (10.6) 3.7 (6.9) (5.1) 1.8 (3.3)
Change in net unrealized gains onforecasted transactions (10.4) 3.6 (6.8) (10.6) 3.7 (6.9) (5.1) 1.8 (3.3)
Foreign currency translation adjustment .2 (.1) .1 1.2 (.9) .3 1.4 0 1.4
Other comprehensive income (loss) $(140.2) $ 49.0 $(91.2) $509.2 $(178.7) $330.5 $1,068.1 $(373.4) $694.7
1December 31, 2009 excludes the $189.6 million ($291.8 million pretax) cumulative effect of change in accounting principle we recorded in June2009 in accordance with the new accounting guidance for other-than-temporary impairments we adopted during the second quarter 2009.
2Entered into for the purpose of managing interest rate risk associated with our debt issuances, and managing foreign currency risk associated withour forecasted foreign currency transaction, which was closed in 2009.
3We expect to reclassify $2.3 million (pretax) into income during the next 12 months. During 2011 and 2010, we reclassified $0.3 million and $5.8million, respectively, on a pretax basis, from accumulated other comprehensive income on the balance sheet to net realized gains (losses) onsecurities on the comprehensive income statement, reflecting the portion of the unrealized gain on forecasted transactions that was related to theportion of the 6.70% Debentures repurchased during the periods (see Note 4 – Debt for further discussion).
12. LITIGATION
The Progressive Corporation and/or its insurance subsidiaries are named as defendants in various lawsuits arising out ofclaims made under insurance policies in the ordinary course of our business. We consider all legal actions relating to suchclaims in establishing our loss and loss adjustment expense reserves.
In addition, The Progressive Corporation and/or its insurance subsidiaries are named as defendants in a number of classaction or individual lawsuits arising out of the operations of the insurance subsidiaries. Other insurance companies facemany of these same issues. The lawsuits discussed below are in various stages of development. We plan to contest thesesuits vigorously, but may pursue settlement negotiations in some cases, if appropriate. The outcomes of these cases areuncertain at this time.
We establish accruals for lawsuits when it is probable that a loss has been incurred and we can reasonably estimate itspotential exposure, which may include a range of loss (referred to as a loss that is both “probable and estimable” in thediscussion below). As to lawsuits in which the loss is not considered both probable and estimable, we have not establisheda liability at this time. It is generally not possible to determine the exposure associated with our lawsuits for a number ofreasons, including, without limitation, one or more of the following: liability appears to be remote; putative class actionlawsuits generally pose immaterial exposure until a class is actually certified, which, historically, has not been granted by
App.-A-36

the courts in the vast majority of our cases in which certification has been sought; class definitions are often indefinite andpreclude detailed exposure analysis; and, complaints rarely state an amount sought as relief, and when such amount isstated, it is often a function of pleading requirements and may be unrelated to the potential exposure.
The following is a discussion of potentially significant pending class action cases at December 31, 2011, and certain casesresolved during the three-year period then ended. For cases that have settled, but for which settlement is not complete, anaccrual has been established at our best estimate of the exposure. Settlements that are complete are fully reflected in ourfinancial statements. The amounts accrued or paid for these settlements were not material to our consolidated financialcondition, cash flows, or results of operations.
As to the pending cases, although their outcomes are uncertain, in each case we do not believe that the outcome will havea material impact on our consolidated financial condition, cash flows, or results of operations. In addition, we do notconsider the losses from the pending cases to be both probable and estimable, and we are unable to estimate a range ofloss, if any, at this time, due to the factors discussed above. In the event that any one or more of these cases results in asubstantial judgment against, or settlement by, Progressive, the resulting liability could have a material effect on ourconsolidated financial condition, cash flows, and/or results of operations.
Pending cases at December 31, 2011, include:
• One certified class action lawsuit seeking interest on personal injury protection (PIP) payments that allegedlywere late.
• Two putative class action lawsuits alleging that we violate the “make-whole” and “common-fund” doctrines.Specifically, it is alleged that we may obtain reimbursement of medical payments made on behalf of aninsured only when the insured has been made whole by the person who caused the insured’s injuries andthat we further must deduct from the reimbursement amount a proportionate share of the insured’s legal feesfor pursuing the person who caused the insured’s injuries.
• Two putative class action lawsuits challenging the labor rates our insurance subsidiaries pay to auto bodyrepair shops.
• Four putative class action lawsuits challenging Progressive’s insurance subsidiaries’ practice in Florida ofadjusting PIP and first-party medical payments.
• One certified and one putative class action lawsuit, each that challenges our insurance subsidiaries’ use ofcertain automated database vendors or software to assist in the adjustment of bodily injury claims where theplaintiffs allege that these databases or software systematically undervalue the claims.
• One putative class action lawsuit challenging our policy form with regard to rejecting uninsured motoristcoverage.
• One putative class action lawsuit challenging Progressive’s evaluation of physical damage claims regardingdiminution of value.
• Two putative class action lawsuits challenging the manner in which Progressive grants a discount for anti-theft devices.
• One putative class action lawsuit alleging that Progressive charged insureds for illusory uninsured motorist/underinsured motorist coverage on multiple vehicle policies.
• One putative class action lawsuit alleging that Progressive improperly applies a preferred provider discountto medical payment claims.
• One putative class action lawsuit alleging that Progressive undervalues total loss claims through the use ofcertain valuation tools.
• One putative class action lawsuit challenging the manner in which Progressive charges premium andassesses total loss claims for commercial vehicle stated amount policies.
Cases settled during 2011, include:
• One putative class action lawsuit that challenged the labor rates our insurance subsidiaries pay to auto bodyrepair shops; settlement was completed in 2011.
• One class action lawsuit certified for settlement that alleged Progressive charged insureds for illusoryuninsured motorist/underinsured motorist coverage on multiple vehicle policies; an accrual has beenestablished.
App.-A-37

Cases settled during 2010, include:
• One putative class action lawsuit challenging our notice of cancellation form for nonpayment of premium andsubsequent denial of automobile coverage; an accrual has been established.
Cases settled during 2009, include:
• One certified class action lawsuit that challenged our insurance subsidiaries’ use of certain automateddatabase vendors or software to assist in the adjustment of bodily injury claims; settlement was completed in2010.
• Eight class action lawsuits, which were consolidated in one settlement agreement, and six individuallawsuits, which challenged certain aspects of our insurance subsidiaries use of credit information andcompliance with notice requirements under the federal Fair Credit Reporting Act; payments were madeduring 2009 and the administration of this class action settlement was completed in 2010.
• One certified nationwide class action lawsuit challenging our insurance subsidiaries’ practice of takingbetterment on boat repairs; settlement was completed in 2009.
• One putative class action lawsuit alleging that Progressive’s insurance subsidiaries used non-conformingunderinsured motorist rejection forms; settlement was completed in 2009.
• One certified class action lawsuit alleging that Progressive’s insurance subsidiaries failed to offer certainenhanced PIP benefits; an accrual has been established.
• Three state class action lawsuits related to over-charging municipal tax to policyholders; an accrual has beenestablished.
13. COMMITMENTS AND CONTINGENCIES
We have certain noncancelable operating lease commitments with lease terms greater than one year for property andcomputer equipment. The minimum commitments under these agreements at December 31, 2011, were as follows:
(millions)Year Commitments
2012 $ 53.02013 42.12014 26.02015 15.32016 7.8Thereafter 13.8
Total $158.0
Some of the leases have options to renew at the end of the lease periods. The expense we incurred for the leases disclosedabove, as well as other operating leases that may be cancelable or have terms less than one year, was:
(millions)Year Expense
2011 $ 80.82010 96.72009 109.0
We also have certain noncancelable purchase obligations. The minimum commitment under these agreements atDecember 31, 2011, was $174.3 million.
As of December 31, 2011, we had no open investment funding commitments; we had no uncollateralized lines or letters ofcredit as of December 31, 2011 or 2010.
App.-A-38

Report of Independent Registered Public Accounting Firm
To the Board of Directors and Shareholders of The Progressive Corporation:
In our opinion, the accompanying consolidated balance sheets and the related consolidated statements of comprehensiveincome, changes in shareholders’ equity and cash flows present fairly, in all material respects, the financial position of TheProgressive Corporation and its subsidiaries at December 31, 2011 and 2010, and the results of their operations and theircash flows for each of the three years in the period ended December 31, 2011 in conformity with accounting principlesgenerally accepted in the United States of America. Also in our opinion, the Company maintained, in all material respects,effective internal control over financial reporting as of December 31, 2011, based on criteria established in InternalControl – Integrated Framework issued by the Committee of Sponsoring Organizations of the Treadway Commission(COSO). The Company’s management is responsible for these financial statements, for maintaining effective internalcontrol over financial reporting and for its assessment of the effectiveness of internal control over financial reporting,included in the accompanying Management’s Report on Internal Control over Financial Reporting. Our responsibility is toexpress opinions on these financial statements and on the Company’s internal control over financial reporting based on ourintegrated audits. We conducted our audits in accordance with the standards of the Public Company Accounting OversightBoard (United States). Those standards require that we plan and perform the audits to obtain reasonable assurance aboutwhether the financial statements are free of material misstatement and whether effective internal control over financialreporting was maintained in all material respects. Our audits of the financial statements included examining, on a test basis,evidence supporting the amounts and disclosures in the financial statements, assessing the accounting principles used andsignificant estimates made by management, and evaluating the overall financial statement presentation. Our audit ofinternal control over financial reporting included obtaining an understanding of internal control over financial reporting,assessing the risk that a material weakness exists, and testing and evaluating the design and operating effectiveness ofinternal control based on the assessed risk. Our audits also included performing such other procedures as we considerednecessary in the circumstances. We believe that our audits provide a reasonable basis for our opinions.
A company’s internal control over financial reporting is a process designed to provide reasonable assurance regarding thereliability of financial reporting and the preparation of financial statements for external purposes in accordance withgenerally accepted accounting principles. A company’s internal control over financial reporting includes those policies andprocedures that (i) pertain to the maintenance of records that, in reasonable detail, accurately and fairly reflect thetransactions and dispositions of the assets of the company; (ii) provide reasonable assurance that transactions are recordedas necessary to permit preparation of financial statements in accordance with generally accepted accounting principles, andthat receipts and expenditures of the company are being made only in accordance with authorizations of management anddirectors of the company; and (iii) provide reasonable assurance regarding prevention or timely detection of unauthorizedacquisition, use, or disposition of the company’s assets that could have a material effect on the financial statements.
Because of its inherent limitations, internal control over financial reporting may not prevent or detect misstatements. Also,projections of any evaluation of effectiveness to future periods are subject to the risk that controls may become inadequatebecause of changes in conditions, or that the degree of compliance with the policies or procedures may deteriorate.
/s/ PricewaterhouseCoopers LLPCleveland, OhioFebruary 28, 2012
App.-A-39
Management’s Report on Internal Control over Financial Reporting
Progressive’s management is responsible for establishing and maintaining adequate internal control over financial reporting,as such term is defined in Rule 13a-15(f) under the Securities Exchange Act of 1934. Our internal control structure wasdesigned under the supervision of our Chief Executive Officer and Chief Financial Officer to provide reasonable assuranceregarding the reliability of financial reporting and the preparation of financial statements for external purposes in accordancewith accounting principles generally accepted in the United States of America.
Our internal control over financial reporting includes policies and procedures that pertain to the maintenance of records that,in reasonable detail, accurately and fairly reflect our transactions and dispositions of assets; provide reasonable assurancethat transactions are recorded as necessary to permit preparation of financial statements in accordance with generallyaccepted accounting principles, and that our receipts and expenditures are being made only in accordance withauthorizations of our management and our directors; and provide reasonable assurance regarding prevention or timelydetection of unauthorized acquisition, use, or disposition of our assets that could have a material effect on our financialstatements.
Under the supervision and with the participation of our management, including our Chief Executive Officer and ChiefFinancial Officer, we conducted an evaluation of the effectiveness of our internal control over financial reporting based onthe framework in Internal Control – Integrated Framework issued by the Committee of Sponsoring Organizations of theTreadway Commission (COSO). Based on our evaluation under the framework in Internal Control – Integrated Framework,management concluded that our internal control over financial reporting was effective as of December 31, 2011.
During the fourth quarter 2011, there were no changes in our internal control over financial reporting identified in the internalcontrol review process that materially affected, or are reasonably likely to materially affect, our internal control over financialreporting.
PricewaterhouseCoopers LLP, an independent registered public accounting firm that audited the financial statementsincluded in this Annual Report, has audited, and issued an attestation report on the effectiveness of, our internal controlover financial reporting as of December 31, 2011; such report appears herein.
CEO and CFO Certifications
Glenn M. Renwick, President and Chief Executive Officer of The Progressive Corporation, and Brian C. Domeck, VicePresident and Chief Financial Officer of The Progressive Corporation, have issued the certifications required by Sections302 and 906 of The Sarbanes-Oxley Act of 2002 and applicable SEC regulations with respect to Progressive’s 2011 AnnualReport on Form 10-K, including the financial statements provided in this Report. Among other matters required to beincluded in those certifications, Mr. Renwick and Mr. Domeck have each certified that, to the best of his knowledge, thefinancial statements, and other financial information included in the Annual Report on Form 10-K, fairly present in allmaterial respects the financial condition, results of operations, and cash flows of Progressive as of, and for, the periodspresented. See Exhibits 31 and 32 to Progressive’s Annual Report on Form 10-K for the complete Section 302 and 906certifications, respectively.
App.-A-40

The Progressive Corporation and SubsidiariesManagement’s Discussion and Analysis of Financial Condition and Results of Operations
Our consolidated financial statements and the related notes, together with the supplemental information, should be read inconjunction with the following discussion and analysis of our consolidated financial condition and results of operations.
I. OVERVIEW
The Progressive Corporation is a holding company that does not have any revenue producing operations, physical property,or employees of its own. The Progressive Group of Insurance Companies, together with our holding company andnon-insurance subsidiaries, comprise what we refer to as Progressive. Since 1937, Progressive has been offering insuranceto consumers and is estimated to be the country’s fourth largest private passenger auto insurer based on net premiumswritten during 2011. Our insurance companies offer personal and commercial automobile insurance and other specialtyproperty-casualty insurance and related services throughout the United States, as well as personal auto insurance on anInternet-only basis in Australia. Our Personal Lines segment writes insurance for private passenger automobiles andrecreational vehicles through more than 35,000 independent insurance agencies and directly to consumers online and overthe phone. Our Commercial Auto segment offers insurance for cars and trucks owned by small businesses through both theindependent agency and direct channels; this business is estimated to be in the top four in its industry. Our underwritingoperations, combined with our service and investment operations, make up the consolidated group.
The Progressive Corporation receives cash through subsidiary dividends, security sales, borrowings, and othertransactions, and uses these funds to contribute to its subsidiaries (e.g., to support growth), to make payments toshareholders and debt holders (e.g., dividends and interest, respectively), to repurchase its debt and common shares, andfor other business purposes that might arise. The holding company’s funds are generally held in a non-insurance subsidiary,which at year-end 2011, had $2.0 billion of marketable securities available for use by the holding company. In 2011, TheProgressive Corporation received $0.9 billion from its subsidiaries, net of capital contributions. In addition, during the thirdquarter 2011, we saw an opportunity to enhance the holding company’s capital position and, in light of low yields, issued$500 million of 3.75% Senior Notes due 2021.
With our strong capital position and consistent with our long-standing policy of returning underleveraged capital to ourinvestors, we took several actions during 2011, returning $1.3 billion to our shareholders and investors. We accelerated ourcommon stock repurchases in light of the existing market conditions and our view of the value of our stock. During the year,we repurchased a total of 51.3 million of our common shares at a total cost of $997.8 million. We also saw an opportunity torepurchase some of our outstanding debt in the open market. During the year, we retired $15.0 million of our 6.70%Fixed-to-Floating Rate Junior Subordinated Debentures due 2067 at or near par. Lastly, in December 2011, we declaredour annual variable dividend, based on 2011 underwriting results. Using our variable dividend formula, which included aGainshare factor of 1.10, after-tax underwriting income of $680.7 million, and the 33 1/3% target factor established by theBoard of Directors, the Board declared a dividend of $.4072 per share, or $249.4 million in the aggregate; the dividend waspaid to shareholders in February 2012.
We ended 2011 with $8.2 billion of total capital (debt and equity), $0.2 billion more than at the start of the year, inclusive ofthe actions discussed above. We continue to manage our investing and financing activities in order to maintain sufficientcapital to support all the insurance we can profitably underwrite and service, while returning underleveraged capital toshareholders.
During 2011, we hit a milestone by generating over $15 billion of net premiums written, an increase of 5% from last year.Policies in force also increased 5% on a companywide basis, which represented almost 580,000 new policies, or about amillion new customers. The national rollout of Snapshot®, our usage-based insurance product, along with other productinitiatives discussed below, helped contribute to this increase. Our Commercial Auto business, which has been affected bythe downturn of the economy over the last few years, saw premiums increase during 2011, reflecting both price increasesand an increase in new applications in the second half of the year. Although new policies are necessary to maintain agrowing book of business, we continue to focus on the retention of current customers as a critical component of our ongoinggrowth. During the year, policy life expectancy, our measure for retention, increased about 2% in personal auto andremained flat in Commercial Auto.
We reported net income of $1.0 billion, or $1.59 per share, for 2011, driven by strong underwriting profitability and modestinvestment returns. Our insurance operations produced a 7.0% underwriting profit margin, despite 2011 having been anactive year for catastrophes. Our investment portfolio generated investment income of $480.0 million, plus net realizedgains of $102.6 million.
App.-A-41

A. Operations
In 2011, our insurance subsidiaries generated underwriting profitability of 7.0%, which exceeded our targeted profitabilityobjective of 4%. Both our Personal Lines and Commercial Auto businesses contributed to our strong profitability. In ourPersonal Lines business, 39 states plus the District of Columbia met or exceeded their profitability target, including 8 out ofour top 10 volume states; only three states generated an underwriting loss for 2011. In our Commercial Auto business, 35states generated an underwriting profit during the year.
During the year, we realized $242.0 million, or 1.6 combined ratio points, of favorable prior accident year reservedevelopment. About 70% of the favorable development was in our Personal Lines business, with the remainder in ourCommercial Auto business. We also recognized about 1.4 points of catastrophe losses, primarily relating to hurricane Ireneand the active spring storm season. For the year, our overall incurred auto accident frequency decreased about 2% andseverity was up about 0.5%, compared to the prior year. The decline in auto frequency was experienced in each of ourinsurance coverages, while the slight increase in total severity was primarily due to higher severity in our bodily injury andproperty coverages.
On a year-over-year basis, net premiums written and earned increased 5% and 4%, respectively. Changes in net premiumswritten are a function of new business applications (i.e., issued policies), premium per policy, and retention.
During 2011, new auto applications decreased 2% on a year-over-year basis, reflecting a 2% decrease in both our Agencyand Direct businesses. New auto applications increased during the fourth quarter, following three quarters of year-over-yeardeclines. On a state-by-state basis, we experienced year-over-year growth in 13 states in our Agency auto business and in17 states in our Direct auto business. Florida was a significant contributor to new application growth in both channels,reflecting our efforts to make our rates more competitive. Our special lines products (e.g., motorcycles, ATVs, RVs, mobilehomes, watercraft, and snowmobiles) generated an increase in new applications of about 5%. New applications in ourCommercial Auto business declined about 2% for the year, despite new applications beginning to increase mid-year.
Our efforts remain focused on several initiatives we have put in place that are designed to help stimulate growth andprovide consumers with distinctive new insurance options. These initiatives include:
• the national advertising and continued expansion of Snapshot®, our usage-based insurance product• new product models in both our Personal Lines and Commercial Auto businesses, which are designed to
improve competitiveness with advanced segmentation and product features• efforts to further penetrate customer households through cross-selling products, and• additional functionality in the mobile device space, including:
• a feature that enables customers in certain states to purchase insurance directly from their mobiledevices after receiving a quote
• the nationwide rollout of a mobile quoting application for our Commercial Auto business, and• a prototype application with the ability to use the camera in a mobile device to send a photo of a driver’s
license and insurance card, along with some additional information, to get an instantaneous quote.
In addition, Name Your Price® remains a key initiative. This program is available countrywide and provides our Direct autocustomers a tool that allows them to name or select the price they would like to pay for auto insurance and match it to arange of coverage combinations.
During 2011, on a year-over-year basis, our written premium per policy for our Agency auto business remained flat, whileour Direct auto business was 1% lower than the prior year. Commercial Auto experienced a 5% increase in written premiumper policy, compared to decreases the last few years, primarily reflecting rate increases taken during the year and shifts inour mix of business to higher average premium policies. The special lines products written premium per policy declined 4%year-over-year, driven largely by older average model years of motorcycles insured.
Companywide policies in force increased 5% on a year-over-year basis since December 31, 2010. This increase reflectsabout 581,000 additional Personal Lines policies, partially offset by a decrease of about 1,000 Commercial Auto policies.The biggest contributor to the Personal Lines growth was our Direct auto business where policies in force grew 6%, or234,000 policies. In our Agency auto business, policies in force reached an all-time high during the year and ended 2011with 4.6 million policies, an increase of 168,000 policies, or 4%; our previous high-water mark was in April 2006. Our speciallines products increased about 179,000 policies, or 5%.
App.-A-42

To further grow policies in force, it is critical that we retain our customers for longer periods, which is why increasingretention remains one of our most important priorities and why we have stepped up our efforts to increase the number ofmulti-product households. In 2011, we continued to increase customer retention, as measured by policy life expectancy.Total personal auto policy life expectancy increased 2% on a year-over-year basis, with our Agency auto businessincreasing 6%, while our Direct auto business decreased 3%. Our policy life expectancy is now similar in both channels.Actions taken during 2011, including our efforts to stabilize rates at renewal and the greater penetration of the multi-productofferings, contributed to the policy life expectancy lengthening and allowed our Agency business to reach another all-timehigh in retention. The policy life expectancy for our Commercial Auto business remained relatively unchanged, while we sawa slight decrease for our special lines products from the prior year. We realize the importance that retention has on ourability to continue to grow profitably and will maintain our focus on providing customers with other insurance-relatedproducts and services they may need over time in our ongoing efforts to increase retention.
B. Investments and Capital Management
The fair value of our investment portfolio was $16.0 billion at December 31, 2011. During 2011, we continued diligently tomanage our credit exposure and added to our common equity position. Our asset allocation strategy is to maintain 0-25% ofour portfolio in Group I securities, with the balance (75%-100%) of our portfolio in Group II securities. We define Group Isecurities to include:
• common equities• nonredeemable preferred stocks• redeemable preferred stocks, except for 50% of investment-grade redeemable preferred stocks with
cumulative dividends, and• all other non-investment-grade fixed-maturity securities.
Group II securities include:
• short-term securities• all other fixed-maturity securities.
At December 31, 2011, 21% of our portfolio was allocated to Group I and 79% to Group II securities. We use the creditratings from models provided by the National Association of Insurance Commissioners (NAIC) for classifying our residentialand commercial mortgage-backed securities, while all other debt securities derive their credit ratings from external vendorsin determining whether securities should be classified as Group I or II.
At December 31, 2011, we held $10.0 million in Australian Treasury Bills to support our Australian operations; we held noother foreign sovereign debt. At year-end 2011, we held $622.7 million of U.S. dollar-denominated corporate bonds issuedby companies that are domiciled, or whose parent companies are domiciled, in foreign countries. Of these securities,$385.9 million are from U.K. and other European companies in the consumer, industrial, energy, and communicationsindustries. In addition, at year-end 2011, we held $6.0 million of foreign-domiciled other asset-backed securities and$131.9 million of foreign-domiciled preferred stocks (redeemable and nonredeemable). Included in the preferred stockswere $70.3 million issued by U.K.-based financial institutions and $26.5 million issued by a European bank. We also held$0.7 million ($25 million notional value) of credit protection on the one European financial institution at December 31, 2011.In total, these securities represent approximately 5% of our portfolio at year-end 2011.
Our investment portfolio produced a fully taxable equivalent (FTE) total return of 3.2% for 2011. Our common stock andfixed-income portfolios contributed to this positive total return with FTE returns of 2.5% and 3.4%, respectively. We continueto maintain our fixed-income portfolio strategy of investing in high-quality securities and maintaining our duration near thelow end of our range. At December 31, 2011, the fixed-income portfolio had a weighted average credit quality of AA-. Ourfixed-income portfolio’s duration at December 31, 2011 was 1.9 years, a measure which reflects the portfolio’s exposure tochanges in interest rates. We positioned our portfolio duration at the lower end of our duration guidelines with the view that,with interest rates extraordinarily low, the risk of higher rates exceeded the gain potential from a decrease in rates. Ourpreference is for credit and reinvestment risk over interest rate risk at this time.
App.-A-43

At December 31, 2011, our total capital (debt plus equity) was $8.2 billion, up from $8.0 billion held at December 31, 2010.Our debt-to-total capital ratio was 29.6% at year-end 2011, although this ratio was reduced to 25.9% in January 2012 whenour $350 million 6.375% Senior Notes were retired at maturity. We continue to manage our investing and financing activitiesin order to maintain sufficient capital to support all of the insurance we can profitably underwrite and service.
II. FINANCIAL CONDITION
A. Holding Company
In 2011, The Progressive Corporation, the holding company, received $0.9 billion of dividends, net of capital contributions,from its subsidiaries. For the three-year period ended December 31, 2011, The Progressive Corporation received $3.2billion of dividends from its subsidiaries, net of capital contributions. Regulatory restrictions on subsidiary dividends aredescribed in Note 8 – Statutory Financial Information.
Progressive’s debt-to-total capital (debt plus equity) ratios at December 31, 2011, 2010, and 2009 were 29.6%, 24.5%, and27.5%, respectively. In August 2011, we issued $500 million of our 3.75% Senior Notes due 2021 (the “3.75% SeniorNotes”); no debt was issued in 2010 or 2009. During the last three years, we repurchased $237.9 million, in aggregateprincipal amount, of our 6.70% Fixed-to-Floating Rate Junior Subordinated Debentures due 2067 (the “6.70% Debentures”),including $15.0 million in 2011 and $222.9 million pursuant to a Tender Offer in 2010. See Note 4 – Debt and the Liquidityand Capital Resources section below for a further discussion of our debt activity. In January 2012, we retired all $350 millionof our 6.375% Senior Notes at maturity.
We repurchased 51.3 million of our common shares in 2011. The total cost to repurchase these shares was $997.8 million,with an average cost of $19.45 per share. After we issued the debt in August 2011, we accelerated our repurchases,reflecting our strong capital position, well-structured portfolio, solid operations, and our view of the value of our stock. Duringthe three-year period ended December 31, 2011, we repurchased 75.7 million of our common shares at a total cost of$1.4 billion (average cost of $18.99 per share).
Progressive maintains a policy of paying an annual variable dividend that, if declared, would be payable shortly after theclose of the year. The annual variable dividend is based on a target percentage of after-tax underwriting income multipliedby a companywide performance factor (“Gainshare factor”), subject to the limitations discussed below. The targetpercentage is determined by our Board of Directors on an annual basis and announced to shareholders and the public. TheBoard determined the target percentage to be 33 1/3% for 2011, 25% for 2010, and 20% for 2009, of annual after-taxunderwriting income. For 2012, the Board has maintained the target percentage at 33 1/3% of annual after-tax underwritingincome.
The Gainshare factor can range from zero to two and is determined by comparing our operating performance for the year tocertain predetermined profitability and growth objectives approved by the Compensation Committee of the Board. ThisGainshare factor is also used in the variable cash incentive program currently in place for our employees (referred to as our“Gainsharing program”). Although recalibrated every year, the structure of the Gainsharing program generally remains thesame. For 2011, the Gainshare factor was 1.10, compared to 1.50 in 2010 and 0.71 in 2009.
Our annual variable dividend program is subject to certain limitations. If the Gainshare factor is zero or if our after-taxcomprehensive income (net income plus the after-tax change in net unrealized gains (losses) on securities, among otherfactors) is less than after-tax underwriting income, no dividend will be paid. Nevertheless, the declaration and amount of thedividend remains within the Board’s discretion.
Following is a summary of our shareholder dividends that were either declared or paid in the last three years:
(millions, except per share amounts) Amount
Year Dividend Type Declared PaidPer
Share Total1
2011 Annual December 2011 February 2012 $ .4072 $249.42010 Annual December 2010 February 2011 .3987 263.82010 Extraordinary October 2010 December 2010 1.0000 663.22009 Annual December 2009 February 2010 .1613 108.420082 Annual — — — —1Based on shares outstanding as of the record date.
2No annual variable dividend was declared based on 2008 results, reflecting the fact that we had an after-tax comprehensive loss of $614.7 million,despite reporting $477.7 million of after-tax underwriting income for the same period.
App.-A-44

B. Liquidity and Capital Resources
Progressive’s insurance operations create liquidity by collecting and investing premiums from new and renewal business inadvance of paying claims. As an auto insurer, our claims liabilities are generally short in duration. Generally, at any point intime, approximately 50% of our outstanding reserves are paid within the following twelve months and less than 15% are stilloutstanding after three years. See Claims Payment Patterns, a supplemental disclosure provided in this Annual Report, forfurther discussion of the timing of claims payments.
As of December 31, 2011, our consolidated statutory surplus was $5.3 billion, compared to $5.1 billion at December 31,2010. Our net premiums written-to-surplus ratio was 2.9 to 1 both at year-end 2011 and 2010, compared to 2.8 at year-end2009. We also have access to $2.0 billion in a non-insurance subsidiary, portions of which could be contributed to thecapital of our insurance subsidiaries to support growth as needed. In addition, our risk-based capital ratios, which are aseries of dynamic surplus-related formulas that contain a variety of factors that are applied to financial balances based onthe degree of certain risks (e.g., asset, credit, and underwriting), are well in excess of minimum regulatory requirements.Nonetheless, the payment of dividends by our subsidiaries may be subject to certain limitations. See Note 8 – StatutoryFinancial Information for additional information on subsidiary dividends.
For the three years ended December 31, 2011, operations generated positive cash flows of $4.7 billion, and cash flows areexpected to remain positive in both the short-term and reasonably foreseeable future. In 2011, our operating cash flowsdecreased $181 million, compared to 2010, primarily due to higher advertising expenditures, commissions paid, salariespaid, and timing differences of cash payments.
As of December 31, 2011, 79% of our portfolio was invested in Group II securities, as defined above. In addition, our fixed-income portfolio duration was 1.9 years, with a weighted average credit quality of AA-. At year end, we held $4.5 billion inshort-term investments and U.S. Treasury securities. Based on our portfolio allocation and investment strategies, we believethat we have sufficient readily available marketable securities to cover our claims payments without having a negative effecton our cash flows from operations. See Item 1A, “Risk Factors,” in our Form 10-K filed with the SEC for a discussion ofcertain matters that may affect our portfolio and capital position.
As noted above, during the year we issued $500 million of our 3.75% Senior Notes. We received proceeds of $497 million,after deducting underwriting discounts and commissions, and incurred an additional $1.0 million of expenses related to theissuance. In addition, upon issuance of the 3.75% Senior Notes, we closed a forecasted debt issuance hedge, which wasentered into to hedge against a possible rise in interest rates, and recognized a $5.1 million pretax loss as part ofaccumulated other comprehensive income (loss); the loss will be recognized as an increase to interest expense andamortized over the life of the 3.75% Senior Notes. In addition to this debt issuance, in January 2012, we retired all $350million of our 6.375% Senior Notes at maturity. Our next scheduled debt maturity will be in October 2013 of $150 million ofour 7% Senior Notes.
In September 2011, we entered into an agreement with The Bank of New York Mellon Trust Company, N.A., as trustee,modifying the terms of our 6.70% Debentures. Pursuant to that agreement, we surrendered our right to temporarily defer thepayment of interest on the Debentures, which had been an unexercised feature of the 6.70% Debentures since they wereissued in 2007. By surrendering that right, we were able to terminate the related obligation to set aside 250 million of ourunissued common shares by June 2012; we were required to reserve these shares as a source of potential funding to paydeferred interest in the event we were ever to exercise our right to defer temporarily the payment of interest under the6.70% Debentures. As a result of this agreement, we surrendered a right that we had no intention to use and preservedflexibility over a significant amount of our unissued shares, which we determined to be in the best interests of the companyand its shareholders. These changes were effective immediately upon execution of the agreement.
Based upon our capital planning and forecasting efforts, we believe that we have sufficient capital resources, cash flowsfrom operations, and borrowing capacity to support our current and anticipated business, scheduled principal and interestpayments on our debt, and expected capital requirements. The covenants on our existing debt securities do not include anyrating or credit triggers that would require an adjustment of the interest rate or an acceleration of principal payments in theevent our securities are downgraded by a rating agency.
App.-A-45

We seek to deploy and use capital in a prudent manner and use multiple data sources and modeling tools to estimate thefrequency, severity, and correlation of identified exposures, including, but not limited to, catastrophic losses, naturaldisasters, and other significant business interruptions, to estimate our potential capital needs.
Management views our capital position as consisting of the following three layers, each with a specific size and purpose:
• The first layer of capital, which we refer to as “regulatory capital,” is the amount of capital we need to satisfystate insurance regulatory requirements and support our objective of writing all the business we can writeand service, consistent with our underwriting discipline of achieving a 96 combined ratio. This capital is heldby our various insurance entities.
• The second layer of capital we call “extreme contingency.” While our regulatory capital is, by definition, acushion for absorbing financial consequences of adverse events, such as loss reserve development,litigation, weather catastrophes, or investment market corrections, we view that as a base and hold additionalcapital for even more extreme conditions. The modeling used to quantify capital needs for these conditions isquite extensive, including tens of thousands of simulations, representing our best estimates of suchcontingencies based on historical experience. This capital is held either at a non-insurance subsidiary of theholding company or in our insurance entities, where it is potentially eligible for a dividend up to the holdingcompany.
• The third layer of capital is capital in excess of the sum of the first two layers and provides maximumflexibility to repurchase stock or other securities, consider acquisitions, and pay dividends to shareholders,among other purposes. This capital is largely held at a non-insurance subsidiary of the holding company.
At all times during the last two years, our total capital exceeded the sum of our regulatory capital layer plus our self-constructed extreme contingency load. At December 31, 2011, we held total capital (debt plus equity) of $8.2 billion at bookvalue, compared to $8.0 billion at book value at December 31, 2010.
The combination of strong operating and modest investment results increased the amount of capital in our third layer to alevel that allowed our Board of Directors to take several actions to return underleveraged capital to our investors during thelast three years, including:
• Repurchases of our outstanding debt securities. From time to time, we may elect to repurchase ouroutstanding debt securities in the open market or in privately negotiated transactions, when managementbelieves that such securities are attractively priced and capital is available for such a purpose.
• During 2011, we repurchased $15.0 million in aggregate principal amount of our 6.70% Debentures at ornear par in the open market, resulting in a net loss on these debt extinguishments of $0.1 million.
• In June 2010, we commenced an offer to purchase for cash (the “Tender Offer”) up to $350 million inaggregate principal amount of our 6.70% Debentures. The Tender Offer expired in July 2010. Wereceived valid tenders from holders of the 6.70% Debentures in the aggregate principal amount of$222.9 million. All of the tendering holders validly tendered by the early tender date and receivedconsideration of $950 per $1,000 principal amount of the 6.70% Debentures accepted for purchase,which included an early tender payment of $50 per $1,000 principal amount of 6.70% Debenturesaccepted. The total cost of the Tender Offer, including the related Consent Solicitation and allassociated fees, was $214.3 million, resulting in a net gain of $6.4 million on the debt extinguishment.See Note 4 – Debt for additional information, including details of the Consent Solicitation to holders ofour 6.25% Senior Notes due 2032, which allowed us to terminate the Replacement Capital Covenantand proceed with the Tender Offer.
App.-A-46

• Repurchases of our common shares. We continued our practice of repurchasing our common shares whenwe deem it appropriate. During 2011, we repurchased 51.3 million shares at a total cost of $997.8 million. InJune 2011, the Board of Directors approved a new authorization to repurchase up to 75 million commonshares, to be used in addition to, and after completion of, the remaining repurchases available under theJune 2009 authorization; repurchases of the remaining shares under the 2009 authorization were completedduring the third quarter 2011. As of December 31, 2011, we had 50.7 million shares remaining under our2011 authorization. During 2010 and 2009, we repurchased 13.3 million shares and 11.1 million shares,respectively, at a total cost of $258.6 million and $180.6 million, respectively.
• Declaration of dividends. As part of our capital strategy, in December 2011, 2010, and 2009, we declared ourannual variable dividends of $.4072 per share, $.3987 per share, and $.1613 per share, respectively. Inaddition, in October 2010, we declared a $1.00 per share extraordinary dividend, reflecting our additionalaction to return underleveraged capital to shareholders.
Short-Term Borrowings
During the last three years, we did not engage in short-term borrowings to fund our operations. As discussed above, ourinsurance operations create liquidity by collecting and investing insurance premiums in advance of paying claims.Information concerning our insurance operations can be found below under Results of Operations – Underwriting, anddetails about our investment portfolio can be found below under Results of Operations – Investments.
In order to provide liquidity in the event of disruptions in our cash management operations, such as disruptions in thefinancial markets or related facilities, that could affect our ability to transfer or receive funds, we currently have a 364-DaySecured Liquidity Credit Facility Agreement with PNC Bank, National Association (PNC). Under this agreement, we mayborrow up to $125 million, which may be increased to $150 million at our request but subject to PNC’s discretion. Anyborrowings under this agreement would be secured by a lien on certain marketable securities held in our investmentportfolio. We had no borrowings under this arrangement in 2011 or 2010. See Note 4 – Debt for further discussion of ourcredit facility.
C. Commitments and Contingencies
Contractual Obligations
A summary of our noncancelable contractual obligations as of December 31, 2011, follows:
Payments due by period
(millions) TotalLess than
1 year1-3
years3-5
yearsMore than
5 years
Debt1 $ 2,462.1 $ 350.0 $ 150.0 $ 0 $1,962.1Interest payments on debt2 1,371.0 136.3 239.9 229.4 765.4Operating leases 158.0 53.0 68.1 23.1 13.8Purchase obligations 174.3 97.7 67.0 9.6 0Loss and loss adjustment expense reserves 7,245.8 3,721.6 2,550.5 580.1 393.6
Total $11,411.2 $4,358.6 $3,075.5 $842.2 $3,134.9
1In January 2012, we retired $350 million of our 6.375% Senior Notes at maturity.
2Includes interest on the 6.70% Debentures at the fixed annual rate through, but excluding, June 15, 2017. See Note 4 – Debt for further discussionon the interest rate and maturity dates for these Debentures.
Purchase obligations represent our noncancelable commitments for goods and services (e.g., software licenses andmaintenance on information technology equipment). Unlike many other forms of contractual obligations, loss and lossadjustment expense (LAE) reserves do not have definitive due dates and the ultimate payment dates are subject to anumber of variables and uncertainties. As a result, the total loss and LAE reserve payments to be made by period, asshown above, are estimates based on our recent payment patterns. To further understand our claims payments, see ClaimsPayment Patterns, a supplemental disclosure provided in this Annual Report. In addition, we annually publish acomprehensive Report on Loss Reserving Practices, which was most recently filed with the SEC on a Form 8-K on June 30,2011, that further discusses our claims payment development patterns.
App.-A-47

In 2011, we issued $500 million of 3.75% Senior Notes. We did not enter into any other significant new contractualcommitments outside the ordinary course of business during 2011 or 2010.
As discussed in the Liquidity and Capital Resources section above, we believe that we have sufficient borrowing capacity,cash flows, and other capital resources to satisfy these contractual obligations.
Off-Balance-Sheet Arrangements
Our off-balance-sheet leverage includes derivative positions (as disclosed in Note 2 – Investments and the DerivativeInstruments section of this Management’s Discussion and Analysis), operating leases, and purchase obligations (disclosedin the table above).
Other
We currently have no significant construction underway.
We maintain insurance on our real property and other physical assets, including coverage for losses due to businessinterruptions caused by covered property damage. However, the insurance will not compensate us for losses that mayoccur due to disruptions in service as a result of a computer, data processing, or telecommunications systems failure, cyberattack, or other event that is unrelated to covered property damage, nor will the insurance necessarily compensate us for alllosses resulting from covered events. To help maintain functionality and reduce the risk of significant interruptions of ouroperations, we maintain back-up systems or facilities for certain of our principal systems and services. We still may beexposed, however, should these measures prove to be unsuccessful or inadequate to protect against severe, multiple, orprolonged service interruptions or against interruptions of systems where no back-up currently exists. We have establishedemergency management teams, which are responsible for responding to business disruptions and other risk events. Theteams’ ability to respond successfully may be limited depending on the nature of the event, the completeness andeffectiveness of our plans to maintain business continuity upon the occurrence of such an event, and other factors beyondour control.
App.-A-48

III. RESULTS OF OPERATIONS —UNDERWRITING
A. Growth
(millions) 2011 2010 2009
NET PREMIUMS WRITTENPersonal Lines
Agency $ 7,705.8 $ 7,490.2 $ 7,391.2Direct 5,906.4 5,534.2 5,061.9
Total Personal Lines 13,612.2 13,024.4 12,453.1Commercial Auto 1,534.3 1,449.5 1,533.9Other indemnity .1 2.9 15.9
Total underwriting operations $15,146.6 $14,476.8 $14,002.9
Growth over prior year 5% 3% 3%
NET PREMIUMS EARNEDPersonal Lines
Agency $ 7,627.4 $ 7,419.7 $ 7,414.8Direct 5,803.7 5,407.2 4,951.1
Total Personal Lines 13,431.1 12,826.9 12,365.9Commercial Auto 1,467.1 1,474.2 1,623.3Other indemnity 4.6 13.7 23.6
Total underwriting operations $14,902.8 $14,314.8 $14,012.8
Growth over prior year 4% 2% 3%
Net premiums written represent the premiums generated from policies written during the period less any premiums ceded toreinsurers. Net premiums earned, which are a function of the premiums written in the current and prior periods, are earnedas revenue over the life of the policy using a daily earnings convention.
We generated an increase in total written and earned premiums during each of the last three years. The increase inpremiums reflects our efforts to increase retention, as well as continued work on several initiatives aimed at providingconsumers with distinctive new insurance options (discussed below). The Commercial Auto business generated an increasein written premium for 2011, reflecting both rate increases taken during the year and an increase in new applications in thesecond half of the year, compared to declines in both written and earned premium during 2010 and 2009.
Policies in force, our preferred measure of growth, represents all policies under which coverage was in effect as of the endof the period specified. As of December 31, our policies in force were:
(thousands) 2011 2010 2009
POLICIES IN FORCEPersonal Lines
Agency auto 4,648.5 4,480.1 4,299.2Direct auto 3,844.5 3,610.4 3,201.1
Total auto 8,493.0 8,090.5 7,500.3Special lines1 3,790.8 3,612.2 3,440.3
Total Personal Lines 12,283.8 11,702.7 10,940.6
Growth over prior year 5% 7% 5%
POLICIES IN FORCECommercial Auto 509.1 510.4 512.8
Growth over prior year 0% 0% (5)%
1Includes insurance for motorcycles, ATVs, RVs, mobile homes, watercraft, snowmobiles, and similar items, as well as a personal umbrella product.
App.-A-49

To analyze growth, we review new policies, rate levels, and the retention characteristics of our books of business. Thefollowing table shows our year-over-year changes in new and renewal applications (i.e., issued policies):
Growth Over Prior Year
2011 2010 2009
APPLICATIONSPersonal Lines
New (1)% 7% 6%Renewal 7% 5% 6%
Commercial AutoNew (2)% (1)% (9)%Renewal (1)% (4)% 2%
Our Personal Lines business had a slight decline in new applications in 2011, compared to last year, in both our Agencyand Direct auto businesses. We generated an increase in new applications for both our Agency and Direct auto businessesin the fourth quarter of 2011, primarily due to significant growth in several large states (see further discussion in the Agencyand Direct business sections below). Our Commercial Auto business continued to experience a decline in new and renewalbusiness applications, although we are beginning to see some positive signs in this business with new application growthreturning in the second half of 2011.
We pursue initiatives aimed at providing consumers with distinctive new auto insurance options. During 2011, we continuedthe rollout of new personal auto product models, which further refine our segmentation and incorporate the best designelements of the Agency and Direct auto products. We introduced these models to 21 jurisdictions during 2011, bringing thetotal number of markets to 40 at the end of the year. We plan to extend the rollout to about 5 to 7 additional states in 2012,which will substantially complete the rollout of these products.
During 2011, we launched the national advertising of Snapshot®, our usage-based insurance product. Snapshot was madeavailable in 12 additional states and the District of Columbia in 2011, bringing the total number of Direct markets to 40.Agency auto customers have access to Snapshot in 33 of those 40 jurisdictions. We plan to expand Snapshot into about 3to 4 additional states, depending on regulatory approval and business results, during 2012. We currently have four patents,and additional patent applications pending, with respect to usage-based insurance.
We are also continuing with our efforts to further penetrate customer households through cross-selling products.Progressive Home Advantage®, the program in which we “bundle” our auto product with property insurance provided by oneof three unaffiliated insurance carriers, is becoming an integral part of our consumer offerings. The program is currentlyavailable to Agency customers in 44 states, Direct customers in 48 states, and is available to both Agency and Directcustomers in the District of Columbia. Progressive Home Advantage is not available to customers in Florida and Alaska.These multi-product customers are an important part of our strategic agenda, since they tend to stay with us longer, havebetter loss experience, and represent a sizable segment of the market. In addition, we continue to focus on selling autopolicies to our special lines customers and vice versa.
In 2011, we worked on improving our offerings in the mobile space. Customers now have the ability to obtain a quote andbuy an auto insurance policy on our mobile website in 41 states and the District of Columbia. In addition, policyholders areable to make payments and certain endorsements from their mobile device, as well as receive identification cards andsevere weather text alerts. We also recently expanded our mobile offerings for agents by making our agency-dedicatedwebsite accessible from an application designed for a tablet computer, and have developed a prototype application thatallows consumers to use the camera from their mobile device to send a picture of their driver’s license and currentinsurance card to get an instantaneous quote. We will continue to add new functionality to our mobile site and mobileapplications, such as quoting for multi-vehicle households, additional policy servicing capabilities, and other agent-facingsolutions during 2012.
We also began the national rollout of a new product model in our Commercial Auto business during 2011. This new model,which expands our coverage offerings, simplifies the quoting and claims experience, and provides incentives for customersto stay with us longer, is available in 14 states. We plan to continue the rollout to our remaining 35 Commercial Autobusiness states during 2012. We also offer our Commercial Auto customers general liability coverage in 19 states andworkers’ compensation coverage in 14 states through our Progressive Commercial AdvantageSM program; these productsare underwritten by three unaffiliated insurance companies.
App.-A-50

We experienced the following changes in written premium per policy:
Change Over Prior Year
2011 2010 2009
WRITTEN PREMIUM PER POLICYPersonal Lines — auto (1)% (1)% (2)%Commercial Auto 5% (6)% (7)%
In each of the last three years, our personal auto business experienced a decline in written premium per policy, primarily theresult of shifts in our mix of business. Our Commercial Auto business experienced an increase in written premium per policyin 2011, compared to decreases in the last two years, primarily reflecting rate increases taken during the year, as well as ashift in the mix of our business. Adjusting rates is a continuous process and we will continue to evaluate future rate needsand react quickly as we recognize changing trends. See below for additional discussion on written premium per policy forour Agency and Direct auto channels and our Commercial Auto business.
Another important element affecting growth is customer retention. One measure of retention is policy life expectancy, whichis our actuarial estimate of the average length of time that a policy (including any renewals) will remain in force beforecancellation or lapse in coverage. The following table shows our year-over-year changes in policy life expectancy:
Change Over Prior Year
2011 2010 2009
POLICY LIFE EXPECTANCYPersonal Lines:
Auto 2% 5% 3%Special lines (1)% (1)% (3)%
Commercial Auto 0% (1)% 0%
The lengthening policy life expectancies in our personal auto business, in part reflects our efforts to stabilize rates atrenewal and the greater penetration of multi-product offerings. Our special lines and Commercial Auto businesses haveseen little change in policy life expectancy over the last several years. Realizing the importance that retention has on ourability to continue to grow profitably, we continue to emphasize competitive pricing, quality service, and other retentioninitiatives for our customers.
B. Profitability
Profitability for our underwriting operations is defined by pretax underwriting profit, which is calculated as net premiumsearned less losses and loss adjustment expenses, policy acquisition costs, and other underwriting expenses. We also useunderwriting profit margin, which is underwriting profit expressed as a percentage of net premiums earned, to analyze ourresults. For the three years ended December 31, our underwriting profitability results were as follows:
($ in millions)
2011 2010 2009
UnderwritingProfit (Loss)
UnderwritingProfit (Loss)
UnderwritingProfit (Loss)
$ Margin $ Margin $ Margin
Personal LinesAgency $ 564.9 7.4% $ 601.0 8.1% $ 579.2 7.8%Direct 354.4 6.1 291.1 5.4 357.9 7.2
Total Personal Lines 919.3 6.8 892.1 7.0 937.1 7.6Commercial Auto 133.5 9.1 185.0 12.5 229.8 14.2Other indemnity1 (5.5) NM 6.4 NM 8.7 NM
Total underwriting operations $1,047.3 7.0% $1,083.5 7.6% $1,175.6 8.4%
1Underwriting margins for our other indemnity businesses are not meaningful (NM) due to the low level of premiums earned by, and the variability ofloss costs in, such businesses.
App.-A-51

Our underwriting margins for the last three years exceeded our long-term profitability target of 4%, but have decreased eachyear since 2009. Pricing and market conditions are always significant drivers of underwriting margins over any definedperiod. In addition, the lower underwriting margin in 2011 reflects higher catastrophe losses and less favorable loss reservedevelopment than we experienced during 2010. The lower underwriting margin in 2010, compared to 2009, was due toincreased advertising expenditures and higher payment for employees under our Gainshare program.
Further underwriting results for our Personal Lines business, including its channel components, the Commercial Autobusiness, and our underwriting operations in total, as defined in Note 10 – Segment Information, were as follows:
Underwriting Performance1 2011 2010 2009
Personal Lines – AgencyLoss & loss adjustment expense ratio 71.8 70.6 71.1Underwriting expense ratio 20.8 21.3 21.1
Combined ratio 92.6 91.9 92.2
Personal Lines – DirectLoss & loss adjustment expense ratio 71.4 72.6 72.3Underwriting expense ratio 22.5 22.0 20.5
Combined ratio 93.9 94.6 92.8
Total Personal LinesLoss & loss adjustment expense ratio 71.6 71.4 71.5Underwriting expense ratio 21.6 21.6 20.9
Combined ratio 93.2 93.0 92.4
Commercial AutoLoss & loss adjustment expense ratio 68.9 65.1 64.7Underwriting expense ratio 22.0 22.4 21.1
Combined ratio 90.9 87.5 85.8
Total Underwriting Operations2
Loss & loss adjustment expense ratio 71.4 70.8 70.7Underwriting expense ratio 21.6 21.6 20.9
Combined ratio 93.0 92.4 91.6
Accident year-Loss & loss adjustment expense ratio3 73.0 73.0 71.7
1Ratios are expressed as a percentage of net premiums earned.
2Combined ratios for the other indemnity businesses are not presented separately due to the low level of premiums earned by, and the variability ofloss costs in, such businesses. For the years ended December 31, 2011, 2010, and 2009, these businesses generated an underwriting profit (loss)of $(5.5) million, $6.4 million, and $8.7 million, respectively.
3The accident year ratios include only the losses that occurred during the period noted. As a result, accident period results will change over time,either favorably or unfavorably, as we revise our estimates of loss costs when payments are made or reserves for that accident period arereviewed.
Losses and Loss Adjustment Expenses (LAE)
(millions) 2011 2010 2009
Change in net loss and LAE reserves $ 93.2 $ 243.3 $ 190.7Paid losses and LAE 10,541.6 9,888.0 9,714.2
Total incurred losses and LAE $10,634.8 $10,131.3 $9,904.9
Claims costs, our most significant expense, represent payments made, and estimated future payments to be made, to or onbehalf of our policyholders, including expenses needed to adjust or settle claims. Claims costs are a function of loss severityand frequency and are influenced by inflation and driving patterns, among other factors. Accordingly, anticipated changes inthese factors are taken into account when we establish premium rates and loss reserves. Our estimated needed reservesare adjusted as these underlying assumptions change. See Critical Accounting Policies for a discussion of the effect ofchanging estimates.
App.-A-52
Our total loss and loss adjustment expense ratio increased 0.6 points in 2011 and was relatively flat in 2010, compared tothe prior year. Catastrophe losses contributed 1.4 points in 2011 to our loss and loss adjustment expense ratio, comparedto 0.8 points in 2010 and 0.7 points in 2009. The large amount of catastrophe losses in 2011 primarily related to hurricaneIrene and significant spring storms, including hail and tornadoes. We recognized favorable prior accident year developmentin 2011, 2010, and 2009, which decreased the calendar year loss and loss adjustment expense ratio by 1.6 points, 2.2points, and 1.0 points, respectively. The combination of higher catastrophe losses and less favorable reserve developmentin 2011 was partially offset by a decrease in frequency for each of our auto coverages, excluding comprehensive. On anaccident year basis, our 2009 loss and loss adjustment expense ratio was 1.3 points lower than both 2011 and 2010,primarily reflecting lower frequency in our Commercial Auto business in 2009, compared to the other two years.
The following discussion of our severity and frequency trends excludes comprehensive coverage because of its inherentvolatility, as it is typically linked to catastrophic losses generally resulting from adverse weather. Comprehensive coverageinsures against damage to a customer’s vehicle due to various causes (other than collision), such as windstorm, hail, theft,falling objects, and glass breakage.
Total personal auto incurred severity (i.e., average cost per claim, including both paid losses and the change in reserves)was up about 0.5% in 2011, down about 1.5% in 2010, and was relatively flat in 2009, over the prior-year periods.
• 2011 – Severity in our bodily injury and property coverages increased, while our personal injury protection(PIP) severity was down about 3%.
• 2010 – We experienced a decrease in severity for our bodily injury coverage and the property coverages,while PIP severity increased about 3%.
• 2009 – Severity in our property coverages decreased and PIP severity increased, while bodily injury severityremained relatively flat.
It is difficult to estimate future severity, especially for bodily injury and PIP claims, but we continue to monitor changes in theunderlying costs, such as medical costs, health care reform, jury verdicts, auto parts, and used car prices, along withregulatory changes, which may affect severity. The severity we experience also will vary with changes in our mix ofbusiness by policy limits and coverages.
Our incurred frequency of auto accidents, on a calendar-year basis, was down about 2% in 2011 and was relatively flat inboth 2010 and 2009, compared to the prior-year periods.
• 2011 – Each of our coverages experienced a decline in frequency, with bodily injury and PIP having slightlymore of a decrease than the property coverages.
• 2010 – We experienced a slight increase in frequency in bodily injury and PIP coverages, while thefrequency in the property coverages remained flat.
• 2009 – Increases in frequency for our bodily injury and PIP coverages were offset by decreases in theproperty coverages.
The degree or direction of frequency change that we will experience in the future is not something that we are able topredict with any certainty. We continue to analyze trends to distinguish changes in our experience from external factors,such as changes in the number of vehicles per household, miles driven, gasoline prices, greater vehicle safety, andunemployment rates, versus those resulting from shifts in the mix of our business, to allow us to reserve more accurately forour loss exposure.
App.-A-53

The table below presents the actuarial adjustments implemented and the loss reserve development experienced in theyears ended December 31:
($ in millions) 2011 2010 2009
Actuarial AdjustmentsReserve decrease/(increase)
Prior accident years $ 151.7 $ 124.6 $ 3.9Current accident year 91.7 71.0 (51.5)
Calendar year actuarial adjustments $ 243.4 $ 195.6 $ (47.6)
Prior Accident Years DevelopmentFavorable/(Unfavorable)
Actuarial adjustments $ 151.7 $ 124.6 $ 3.9All other development 90.3 195.8 132.1
Total development $ 242.0 $ 320.4 $ 136.0
(Increase) decrease to calendar year combined ratio 1.6 pts. 2.2 pts. 1.0 pts.
Total development consists both of actuarial adjustments and “all other development.” The actuarial adjustments representthe net changes made by our actuarial department to both current and prior accident year reserves based on regularlyscheduled reviews. Through these reviews, the actuaries identify and measure variances in the projected frequency andseverity trends, which allows them to adjust the reserves to reflect the current costs. We report these actuarial adjustmentsseparately for the current and prior accident years to reflect these adjustments as part of the total prior accident years’reserve development.
“All other development” represents claims settling for more or less than reserved, emergence of unrecorded claims at ratesdifferent than anticipated in our incurred but not recorded (IBNR) reserves, and changes in reserve estimates on specificclaims. Although we believe that the development from both the actuarial adjustments and “all other development” generallyresults from the same factors, as discussed below, we are unable to quantify the portion of the reserve development thatmight be applicable to any one or more of those underlying factors.
Our objective is to establish case and IBNR reserves that are adequate to cover all loss costs, while sustaining minimalvariation from the date that the reserves are initially established until losses are fully developed. As reflected in the tableabove, we experienced favorable reserve development in each of the last three years.
2011• About half of the favorable reserve development was attributable to accident years 2008 and prior, while the
balance was primarily due to claims from accident year 2010.• Approximately 70% of the favorable reserve development was attributable to our Personal Lines business,
with our Agency and Direct channels contributing 25% and 75%, respectively; the balance was primarily inour Commercial Auto business.
2010• Approximately 70% of the favorable reserve development was attributable to accident year 2009, while the
balance was mostly due to claims from accident years 2007 and 2006.• About 70% of the favorable reserve development was in our Personal Lines business, with our Agency and
Direct channels contributing almost equal amounts; the balance was in our Commercial Auto business.
2009• About 60% of the favorable reserve development was due to favorable development for accident years 2006
and prior, while the balance was mostly due to claims from accident year 2008.• Approximately 55% of the favorable reserve development was attributable to our Personal Lines business,
with our Agency and Direct channels contributing 25% and 75%, respectively; the balance was primarily inour Commercial Auto business.
App.-A-54

The favorable reserve development reflected the settlement of larger losses for amounts less than we originally reserved inour Personal Lines business (primarily in our personal auto product) for 2011 and 2010, and in our Commercial Autobusiness for each of the last three years. During the last three years, we also experienced lower than expected defense andcost containment costs, reflecting a combination of fewer claims being litigated, as well as the fact that a greater percentageof these cases are now being handled by our in-house counsel, which is a cost-effective alternative to using external lawfirms. In addition, for 2010, our IBNR reserves developed favorably due to lower severity and frequency of late emergingclaims. However, in 2011, the number of late emerging claims increased over 2010 and was greater than anticipated by ourcarried IBNR, thus we recognized unfavorable development on our total IBNR reserves.
We continue to focus on our loss reserve analysis, attempting to enhance accuracy and to further our understanding of ourloss costs. A detailed discussion of our loss reserving practices can be found in our Report on Loss Reserving Practices,which was filed in a Form 8-K on June 30, 2011.
Because we are primarily an insurer of motor vehicles, our exposure as an insurer of environmental, asbestos, and generalliability claims is limited. We have established reserves for these exposures in amounts that we believe to be adequatebased on information currently known. These exposures do not have a material effect on our liquidity, financial condition,cash flows, or results of operations.
Underwriting Expenses
Progressive’s other underwriting expenses and policy acquisition costs as a percentage of premiums earned were relativelyunchanged for 2011 and increased 0.7 points in 2010 over 2009. In 2011, increased advertising expenses and informationtechnology costs were offset by lower Gainsharing expenses. The increase in 2010 primarily reflects higher advertising andGainsharing expenditures, partially offset by a solid increase in productivity, reflected by an increase in companywidepolicies in force per full-time equivalent employee. In accordance with GAAP, policy acquisition costs are amortized over thepolicy period in which the related premiums are earned (see Note 1—Reporting and Accounting Policies). We do not deferany advertising costs.
C. Personal Lines
Growth Over Prior Year
2011 2010 2009
Net premiums written 5% 5% 5%Net premiums earned 5% 4% 4%Policies in force 5% 7% 5%
Progressive’s Personal Lines business writes insurance for personal autos and recreational vehicles and represented 90%of our total net premiums written in both 2011 and 2010, compared to 89% for 2009. We currently write our Personal Linesproducts in all 50 states. We also offer our personal auto product (not special lines products) in the District of Columbia andon an Internet-only basis in Australia.
Personal auto represented slightly more than 90% of our total Personal Lines net premiums written in each of the last threeyears. These auto policies are primarily written for 6-month terms. The remaining Personal Lines business is comprised ofspecial lines products (e.g., motorcycles, watercraft, and RVs), which are written for 12-month terms. Personal auto policiesin force increased 5% for 2011, 8% for 2010, and 5% for 2009; policies in force for the special lines products increased 5%in both 2011 and 2010 and 3% in 2009. Net premiums written for personal auto increased 5% in each of the last threeyears; special lines net premiums written grew 1% in both 2011 and 2010 and 4% in 2009.
Our total Personal Lines business generated strong underwriting results in 2011, which were widely distributed by productand state. In 2011, 47 states and the District of Columbia were profitable, including 9 of our 10 largest states. The speciallines products had a favorable effect on the total Personal Lines combined ratio of approximately 1.0 points in both 2011and 2009, and 1.5 points in 2010.
Even though our Agency and Direct businesses are managed under one Personal Lines organization, we will continue toreport our Agency and Direct business results separately as components of our Personal Lines segment to provide furtherunderstanding of our products by channel.
App.-A-55

The Agency Business
Growth Over Prior Year
2011 2010 2009
Net premiums written 3% 1% 1%Net premiums earned 3% 0% 1%Auto: policies in force 4% 4% 0%
new applications (2)% 4% 3%renewal applications 5% 1% 0%written premium per policy 0% 0% 0%policy life expectancy 6% 8% 2%
The Agency business includes business written by more than 35,000 independent insurance agencies that representProgressive, as well as brokerages in New York and California. In 2011, our Agency auto business experienced a decreasein new applications, compared to increases in the last two years. The decrease in 2011 reflects, in large part, the stronggrowth in new applications we experienced in the first half of 2010, and an apparent decline of consumers shopping for autoinsurance, which began toward the end of 2010 and carried into 2011. Despite the decline in new applications for the year,our Agency auto business did see an increase in new applications in the fourth quarter 2011, compared to the same quarterin 2010. Significant increases in several large states, including Florida, New York, California, and New Jersey, reflectingprevious actions to make our rates more competitive in those states, contributed to the fourth quarter growth. Over the lastthree years, written premium per policy on total Agency auto business has remained steady, but in 2011 written premiumper policy was up modestly for new business. Retention in our Agency auto business (measured by policy life expectancy)has improved in each of the last three years.
On a year-over-year basis, Agency auto quotes were relatively flat, compared to increases in both 2010 and 2009. Quotingon third-party comparative rating systems continues to increase and our presentation on these systems continues toimprove. We are continuing to identify opportunities to ensure our prices are available for our agents, including efforts tomake agent quoting and servicing available on tablet computers. Our Agency auto rate of conversion (i.e., converting aquote to a sale) decreased in both 2011 and 2009 and was relatively flat in 2010.
The underwriting expense ratio in our Agency business was down 0.5 points in 2011 and was relatively unchanged theprevious two years. Improved customer retention and cost saving efforts helped keep expenses in line during all threeyears.
The Direct Business
Growth Over Prior Year
2011 2010 2009
Net premiums written 7% 9% 11%Net premiums earned 7% 9% 10%Auto: policies in force 6% 13% 13%
new applications (2)% 9% 20%renewal applications 11% 13% 13%written premium per policy (1)% (3)% (4)%policy life expectancy (3)% 2% 3%
The Direct business includes business written directly by Progressive online and over the phone. Similar to the Agencychannel, we were unable to generate new business growth in our Direct channel for the full year 2011, but we did see asolid increase in new applications in the fourth quarter 2011, compared to last year; Florida and New Jersey had the largestyear-over-year increases for both the year and the fourth quarter. Out of our top 10 Direct auto states, four statesexperienced an increase in new auto applications in 2011, compared to eight states in 2010 and nine states in 2009.
Written premium per policy for total Direct auto was down in each of the last three years, as compared to the prior year,although the rate of decline slowed in 2011. Written premium per policy on Direct auto new business increased slightly in2011. The decreases in each year primarily reflect shifts in our mix of business (e.g., older age vehicles, state mix in ourrenewal business, and drivers with proof of prior insurance). We believe the decline in policy life expectancy for 2011reflects rate increases taken in Florida and Massachusetts, as well as changes in bill plan presentation, which has led tomore customers paying in installments and, historically, these customers tend to retain for shorter periods.
App.-A-56

On a year-over-year basis, the total number of quotes in the Direct business decreased in 2011, reflecting decreases inboth Internet quotes and quotes generated via the phone, compared to increases in both 2010 and 2009. Significantquoting activity in the first half of 2010 and an apparent decline in the level of consumer shopping, which began towards theend of 2010 and carried into 2011, adversely affected the comparisons in 2011. The total Direct business conversion ratewas relatively flat in 2011 and had solid increases in both 2010 and 2009, compared to the prior years.
We increased our total advertising expenditures on a year-over-year basis in each of the last three years. We continue towork toward achieving our key objective of having our efforts in marketing and other brand-building activities match ourcompetency in other technical skills, such as pricing and claims handling. We remain focused on establishing a well-respected brand and added to our inventory of television commercials and Internet advertising. We continue to use “Flo” toprovide fresh and engaging messages, and during 2011, we increased the use of a complementary campaign with the“Messenger.” In addition, during 2011, we have invested in the infrastructure of both our mobile capabilities and our usage-based insurance products.
D. Commercial Auto
Growth Over Prior Year
2011 2010 2009
Net premiums written 6% (6)% (10)%Net premiums earned 0% (9)% (8)%Policies in force 0% 0% (5)%New applications (2)% (1)% (9)%Renewal applications (1)% (4)% 2%Written premium per policy 5% (6)% (7)%Policy life expectancy 0% (1)% 0%
Progressive’s Commercial Auto business writes primary liability, physical damage, and other auto-related insurance forautomobiles and trucks owned by small businesses, with the majority of our customers insuring three or fewer vehicles. OurCommercial Auto business represented 10% of our total net premiums written in both 2011 and 2010 and 11% in 2009. Thisbusiness is primarily distributed through independent agents and operates in the following business market targets:
• Business auto – autos, vans, and pick-up trucks used by small businesses, such as retailing, farming,services, and private trucking
• Contractor – vans, pick-up trucks, and dump trucks used by small businesses, such as artisan contractors,heavy construction, and landscapers/snowplowers
• For-hire transportation – tractors, trailers, and straight trucks primarily used by regional general freight andexpeditor-type businesses and non-fleet long-haul operators
• For-hire specialty – dump trucks, log trucks, and garbage trucks used by dirt, sand and gravel, logging, andcoal-type businesses, and
• Tow – tow trucks and wreckers used in towing services and gas/service station businesses.
Business auto and contractor are the two largest business market targets, and together, account for approximately 60% ofour total Commercial Auto premiums and approximately 75% of the vehicles we insure in this business. We currently writeour Commercial Auto business in 49 states; we do not write Commercial Auto in Hawaii or the District of Columbia. Themajority of our policies in this business are written for 12-month terms.
The economic downturn during the last three years has had a significant effect on our Commercial Auto business’s newapplication growth. Although our Commercial Auto business experienced an overall decrease in new applications in each ofthe last three years, both 2011 and 2010 had some quarters with positive growth in new applications, showing some sign ofpossible recovery. Policies in force remained relatively unchanged since the end of 2009.
App.-A-57

We have been increasing rates in our Commercial Auto business for the past three years, but 2011 was the first year wehave seen those rate increases translate into a year-over-year increase in written premium per policy. In addition, during2011, we experienced shifts in our mix of business toward business market targets with higher average written premium.The decline in written premium per policy in 2010 and 2009 was due to shifts in our mix of business (e.g., greaterpercentage of liability-only policies, changes in geographical mix, and more policies qualifying for discounts). The change inpolicy life expectancy for our Commercial Auto business was flat or slightly negative over the last three years.
Commercial Auto’s expense ratio decreased 0.4 points in 2011, and increased 1.3 points in 2010, over the prior year. Theincrease in 2010 was due to increased information technology costs and an increase in Gainsharing expense.
Although Commercial Auto differs from Personal Lines auto in its customer base and products written, both businessesrequire the same fundamental skills, including disciplined underwriting and pricing, as well as excellent claims service. Sincethe Commercial Auto policies have higher limits than Personal Lines auto, we analyze the large loss trends and reserving inmore detail to allow us to react quickly to changes in this exposure.
E. Other Indemnity
Our other indemnity businesses represented less than 1% of our net premiums written in each of the last three years andconsist of managing our run-off businesses, which include the run-off of our professional liability businesses that we sold in2010. Pursuant to our agreement with the purchaser of this business, we will continue to write these policies, principallydirectors and officers liability insurance for community banks, for an agreed upon period after the closing of the sale. As ofDecember 31, 2011, we continued to write business in only two states and will stop writing all business as of April 30, 2012.Beginning in July 2010, all such new and renewal business is 100% reinsured. From August 1, 2009 through June 30, 2010,the substantial majority of the business written for these policies was 100% reinsured. Prior to August 1, 2009, we reinsuredthe majority of the risk on these coverages with a small mutual reinsurer controlled by its bank customers and various otherreinsurance entities. The sale of these businesses did not have a material effect on our financial condition, results ofoperations, or cash flows.
F. Service Businesses
Our service businesses, which represent less than 1% of our total revenues and do not have a material effect on our overalloperations, primarily include:
• Commercial Auto Insurance Procedures/Plans (CAIP) – We are the only servicing carrier on a nationwidebasis for CAIP, which are state-supervised plans servicing the involuntary market in 42 states and the Districtof Columbia. As a service provider, we provide policy issuance and claims adjusting services and collect feerevenue that is earned on a pro rata basis over the terms of the related policies. In 2010, we reached anagreement with AIPSO (the national organization responsible for administering the involuntary insurancemarket) under which we will receive a supplemental fee, when necessary, to satisfy a minimum servicing feerequirement; this agreement is scheduled to expire on August 31, 2013. We cede 100% of the premiums andlosses to the plans. Reimbursements to us from the CAIP plans are required by state laws and regulations.Material violations of contractual service standards can result in ceding restrictions for the affected business.We have maintained, and plan to continue to maintain, compliance with these standards. Any changes in ourparticipation as a CAIP service provider would not materially affect our financial condition, results ofoperations, or cash flows.
• Progressive Home Advantage® – Through Progressive Home Advantage, we offer, either directly or throughour network of independent agents, new and existing Agency and Direct customers home, condominium,and renters insurance underwritten by unaffiliated homeowner’s insurance companies. Progressive HomeAdvantage is not available to customers in Florida and Alaska. For the policies written under this program inour Direct business, we receive commissions, which are used to mitigate the expenses associated withmaintaining this program.
• Progressive Commercial AdvantageSM – We currently offer our Commercial Auto customers the ability topackage their auto coverage with other commercial coverages that are underwritten by three unaffiliatedinsurance companies. This program offers general liability coverage in 19 states and workers’ compensationcoverage in 14 states as of December 31, 2011. We receive commissions for the policies written under thisprogram, which are used to mitigate the expenses associated with maintaining this program.
App.-A-58

Our service businesses generated an operating profit in both 2011 and 2010, reflecting the recognition of the minimumservicing fee for CAIP discussed above, compared to an operating loss in 2009, which resulted from the downturn in theinvoluntary commercial auto market.
G. Litigation
The Progressive Corporation and/or its insurance subsidiaries are named as defendants in various lawsuits arising out ofclaims made under insurance policies in the ordinary course of business. We consider all legal actions relating to suchclaims in establishing our loss and loss adjustment expense reserves.
In addition, various Progressive entities are named as defendants in a number of class action or individual lawsuits arisingout of the operations of the insurance subsidiaries. These cases include those alleging damages as a result of our practicesin evaluating or paying medical or injury claims or benefits, including, but not limited to, personal injury protection, medicalpayments, uninsured motorist/underinsured motorist (UM/UIM), and bodily injury benefits; rating practices at policy renewal;the utilization, content, or appearance of UM/UIM rejection forms; labor rates paid to auto body repair shops; and caseschallenging other aspects of our claims or marketing practices or other business operations. Other insurance companiesface many of these same issues. During the last three years, we have settled several class action lawsuits. Thesesettlements did not have a material effect on our financial condition, cash flows, or results of operations. See Note 12 –Litigation for a more detailed discussion.
H. Income Taxes
As reported in the balance sheets, income taxes are comprised of net current income taxes payable/recoverable and netdeferred tax assets and liabilities. A deferred tax asset/liability is a tax benefit/expense that is expected to be realized in afuture tax return. At both December 31, 2011 and 2010, our income taxes were in a net asset position.
Our net deferred tax asset was $196.0 million at December 31, 2011, compared to $178.2 million at December 31, 2010.The increase in our net deferred tax asset since December 31, 2010, is primarily due to the net unrealized losses thatoccurred in our investment portfolio and increases in both the unearned premium reserve and accruals that are notdeductible for income tax purposes. This increase is partially offset by the recognition of tax losses on sales of securities forwhich we had previously recorded other-than-temporary impairments. At both December 31, 2011 and 2010, we determinedthat we did not need a valuation allowance on our deferred tax asset. Although realization of the deferred tax asset is notassured, management believes it is more likely than not that the gross deferred tax asset will be realized based on ourexpectation that we will be able to fully utilize the deductions that are ultimately recognized for tax purposes.
There were no material changes in our uncertain tax positions during 2011.
See Note 5 – Income Taxes for further information.
App.-A-59

IV. RESULTS OF OPERATIONS—INVESTMENTS
A. Portfolio Allocation
At year-end 2011, the fair value of our investment portfolio was $16.0 billion, 3% greater than at year-end 2010. Thecombination of our debt issuance and operating and investment returns more than offset our capital transactions during theyear, such as share repurchases and shareholder dividends. Our investment income (interest and dividends) decreased 8%in 2011, as compared to 2010, reflecting lower yields in the portfolio, and increased 3% in 2010, as compared to 2009,reflecting an increase in average assets, partially offset by lower yields in the portfolio.
In 2011, we recognized $102.6 million in net realized gains, compared to $96.1 million and $27.1 million in 2010 and 2009,respectively. The net realized gains for all three periods were primarily the result of security sales, partially offset bychanges in valuation of our derivative positions and write-downs of securities determined to have had other-than-temporarydeclines in fair value. The composition of the investment portfolio at December 31, was:
($ in millions) Cost
GrossUnrealized
Gains
GrossUnrealized
Losses
NetRealized
Gains(Losses)1 Fair Value
% ofTotal
PortfolioDuration
(years) Rating2
2011Fixed maturities $11,455.7 $ 370.2 $ (73.2) $ 6.6 $11,759.3 73.6% 2.1 AA-Nonredeemable preferred stocks 473.7 342.6 (3.7) (6.3) 806.3 5.1 1.1 BBB-Short-term investments – other 1,551.8 0 0 0 1,551.8 9.7 <1 AA+
Total fixed-income securities 13,481.2 712.8 (76.9) .3 14,117.4 88.4 1.9 AA-Common equities 1,431.0 440.0 (25.4) 0 1,845.6 11.6 na na
Total portfolio3,4 $14,912.2 $1,152.8 $(102.3) $ .3 $15,963.0 100.0% 1.9 AA-
2010Fixed maturities $11,630.8 $ 304.1 $ (87.1) $ 2.2 $11,850.0 76.3% 2.3 AANonredeemable preferred stocks 601.3 560.2 0 (3.9) 1,157.6 7.5 1.2 BBB-Short-term investments – other 1,090.8 0 0 0 1,090.8 7.0 <1 AAA-
Total fixed-income securities 13,322.9 864.3 (87.1) (1.7) 14,098.4 90.8 2.0 AA-Common equities 1,021.7 406.5 (3.2) 0 1,425.0 9.2 na na
Total portfolio3,4 $14,344.6 $1,270.8 $ (90.3) $(1.7) $15,523.4 100.0% 2.0 AA-
na = not applicable
1Represents net holding period gains (losses) on certain hybrid securities.
2Represents ratings at December 31, 2011 and 2010. Credit quality ratings are assigned by nationally recognized securities rating organizations.To calculate the weighted average credit quality ratings, we weight individual securities based on fair value and assign a numeric score of 0-5, withnon-investment-grade and non-rated securities assigned a score of 0-1. To the extent the weighted average of the ratings falls between AAA andAA+, we assign an internal rating of AAA-.
3Excludes $46.9 million and $46.3 million at December 31, 2011 and 2010, respectively, of net unsettled security transactions included in otherassets.
4The total fair value of the portfolio includes $2.0 billion and $2.2 billion at December 31, 2011 and 2010, respectively, of securities in the portfolio ofa consolidated, non-insurance subsidiary of the holding company, net of any unsettled security transactions.
App.-A-60

Our asset allocation strategy is to maintain 0-25% of our portfolio in Group I securities, with the balance (75%-100%) of ourportfolio in Group II securities, as defined in the Overview – Investments and Capital Management section and as reflectedin the following table. We believe this asset allocation strategy allows us to more accurately assess the risks associated withthese securities for capital purposes and is in line with our primary regulator’s treatment.
The following tables show the composition of our Group I and Group II securities at December 31, 2011 and December 31,2010:
($ in millions)Fair
Value
% ofTotal
Portfolio
2011Group I securities:
Non-investment-grade fixed maturities $ 384.4 2.4%Redeemable preferred stocks1 287.8 1.8Non-redeemable preferred stocks 806.3 5.1Common equities 1,845.6 11.6
Total Group I securities 3,324.1 20.9Group II securities:
Other fixed maturities2 11,087.1 69.4Short-term investments – other 1,551.8 9.7
Total Group II securities 12,638.9 79.1
Total portfolio $15,963.0 100.0%
2010Group I securities:
Non-investment-grade fixed maturities $ 421.1 2.7%Redeemable preferred stocks1 367.9 2.3Non-redeemable preferred stocks 1,157.6 7.5Common equities 1,425.0 9.2
Total Group I securities 3,371.6 21.7Group II securities:
Other fixed maturities2 11,061.0 71.3Short-term investments – other 1,090.8 7.0
Total Group II securities 12,151.8 78.3
Total portfolio $15,523.4 100.0%
1Includes non-investment-grade redeemable preferred stocks of $201.7 million at December 31, 2011 and $233.3 million at December 31, 2010.
2Includes investment-grade redeemable preferred stocks, with cumulative dividends, of $86.1 million at December 31, 2011 and $134.6 million atDecember 31, 2010.
Unrealized Gains and Losses
As of December 31, 2011, our portfolio had pretax net unrealized gains, recorded as part of accumulated othercomprehensive income, of $1,050.5 million, compared to $1,180.5 million at December 31, 2010. During the year, our fixed-income portfolio’s valuation decreased $141.3 million, primarily due to spread widening (i.e., the risk premium paid abovethe comparable Treasury rate) in some fixed-income sectors. The net unrealized gains in our common equity portfolioincreased $11.3 million over the same time period, reflecting positive returns in the broad equity market.
See Note 2 – Investments for a further break-out of our gross unrealized gains and losses.
App.-A-61

Fixed-Income Securities
The fixed-income portfolio is managed internally and includes fixed-maturity securities, short-term investments, andnonredeemable preferred stocks. The fixed-maturity securities and short-term investments, as reported on the balancesheets at December 31, were comprised of the following:
($ in millions) 2011 2010
Investment-grade fixed maturities:1
Short/intermediate term $12,539.3 94.2% $12,037.2 93.0%Long term 55.7 .4 38.4 .3
Non-investment-grade fixed maturities2 716.1 5.4 865.2 6.7
Total $13,311.1 100.0% $12,940.8 100.0%
1Long term includes securities with expected liquidation dates of 10 years or greater. Asset-backed securities are reported at their weightedaverage maturity based upon their projected cash flows. All other securities that do not have a single expected maturity date are reported ataverage maturity.
2Non-investment-grade fixed-maturity securities are non-rated or have a quality rating of an equivalent BB+ or lower, classified by the lowest ratingfrom a nationally recognized rating agency.
The year-over-year decrease in dollar amount of our non-investment-grade fixed maturities primarily resulted frommaturities, calls, paydowns, and sales.
A primary exposure for the fixed-income portfolio is interest rate risk, which is managed by maintaining the portfolio’sduration between 1.5 and 5 years. Interest rate risk includes the change in value resulting from movements in theunderlying market rates of debt securities held. The fixed-income portfolio had a duration of 1.9 years at December 31,2011, compared to 2.0 years at December 31, 2010. The distribution of duration and convexity (i.e., a measure of the speedat which the duration of a security is expected to change based on a rise or fall in interest rates) are monitored on a regularbasis.
The duration distribution of our fixed-income portfolio, represented by the interest rate sensitivity of the comparablebenchmark U.S. Treasury Notes, was:
Duration Distribution 2011 2010
1 year 22.6% 34.6%2 years 22.3 15.53 years 31.5 23.45 years 20.8 22.610 years 2.8 3.9
Total fixed-income portfolio 100.0% 100.0%
The shift in duration distribution reflects our decision to further reduce our exposure to longer-duration bonds, whilemaintaining our overall portfolio duration at a similar level.
Another primary exposure related to the fixed-income portfolio is credit risk. This risk is managed by maintaining an A+minimum average portfolio credit quality rating, as defined by nationally recognized rating agencies.
The credit quality distribution of the fixed-income portfolio was:
Rating 2011 2010
AAA 53.6% 54.8%AA 13.4 11.6A 5.1 6.8BBB 21.3 18.2Non-rated/other 6.6 8.6
Total fixed-income portfolio 100.0% 100.0%
App.-A-62

Our portfolio is also exposed to concentration and credit risk. Our investment constraints limit investment in a single issuer,other than U.S. Treasury Notes or a state’s general obligation bonds, to 2.5% of shareholders’ equity, while the single issuerlimitation on preferred stocks and/or non-investment-grade debt is 1.25% of shareholders’ equity. Additionally, the guidelineapplicable to any state’s general obligation bonds is 6% of shareholders’ equity. Our credit risk guidelines limit single issuerexposure; however, we also consider sector concentration a risk, and we frequently evaluate the portfolio’s sector allocationwith regard to internal requirements and external market factors. Additionally, we consider concentration risk in the contextof asset classes, including but not limited to common equities, residential and commercial mortgage securities, municipalbonds, and high-yield bonds.
We also monitor prepayment and extension risk, especially in our structured product and preferred stock portfolios.Prepayment risk includes the risk of early redemption of security principal that may need to be reinvested at less attractiverates. Extension risk includes the risk that a security will not be redeemed when anticipated, and that the security that isextended has a lower yield than a security we might be able to obtain by reinvesting the expected redemption principal. Thedifferent types of structured debt and preferred securities, which are discussed in more detail below, help minimize this risk.During 2011, we did not experience significant prepayment or extension of principal relative to our cash flow expectations inthe portfolio.
The pricing on the majority of our preferred stocks continues to reflect expectations that many issuers will not call suchsecurities on the first call date, and hence reflects an assumption that the securities will remain outstanding for a period oftime beyond such initial call date (extension risk). Of the seven preferred stocks that had their first call date during 2011,only one of these securities was called. Extension risk on holding these securities is limited because they either convertfrom a fixed-rate coupon instrument to a variable rate coupon after the call date, or were variable rate coupon securitiesprior to the call date. Reinvestment risk is limited to the difference in the credit spread received above the benchmark rate(e.g., LIBOR) and the current market credit spread for that issuer.
We also face the risk that our preferred stock dividend payments could be deferred for one or more periods. As ofDecember 31, 2011, all of our preferred securities continued to pay their dividends in full and on time.
Liquidity risk is another risk factor we monitor. Our overall portfolio remains very liquid and sufficient to meet expectedliquidity requirements. As of December 31, 2011, we held $4.5 billion of U.S. Treasury and short-term securities, comparedto $4.3 billion at December 31, 2010. The short-to-intermediate duration of our portfolio provides an additional source ofliquidity, as we expect approximately $1.4 billion, or 16%, of our fixed-income portfolio, excluding U.S. Treasury and short-term securities, to repay principal during 2012. Cash from interest and dividend payments provide an additional source ofrecurring liquidity.
Included in the fixed-income portfolio are U.S. government obligations, which include U.S. Treasury Notes and interest rateswaps. Although the interest rate swaps are not obligations of the U.S. government, they are recorded in this portfolio as thechange in fair value is correlated to movements in the U.S. Treasury market. The duration of these securities wascomprised of the following at December 31, 2011:
($ in millions)Fair
ValueDuration
(years)
U.S. Treasury NotesLess than two years $ 334.0 1.4Two to five years 2,629.0 3.3
Total U.S. Treasury Notes 2,963.0 3.1
Interest Rate SwapsTwo to five years ($900 notional value) 0 (4.5)Five to nine years ($363 notional value) 0 (6.5)
Total interest rate swaps ($1,263 notional value) 0 (5.0)
Total U.S. government obligations $2,963.0 1.1
App.-A-63

The interest rate swap shows a fair value of zero as it is in an overall liability position, and the fair value is reported in the“other liabilities” section of the Consolidated Balance Sheets. The negative duration of the interest rate swap is due to theposition being short interest-rate exposure (i.e., receiving a variable-rate coupon). In determining duration, we add theinterest rate sensitivity of our interest rate swap positions to that of our Treasury holdings, but do not add the notional valueof the swaps to our Treasury holdings in order to calculate an unlevered duration for the portfolio.
ASSET-BACKED SECURITIESIncluded in the fixed-income portfolio are asset-backed securities, which were comprised of the following at December 31:
($ in millions)Fair
Value
Net UnrealizedGains
(Losses)
% of Asset-Backed
SecuritiesDuration
(years)Rating
(at period end)
2011Prime collateralized mortgage obligations $ 228.6 $ (9.6) 6.5% 1.2 AAlt-A collateralized mortgage obligations 43.2 .9 1.2 2.1 A-
Collateralized mortgage obligations 271.8 (8.7) 7.7 1.3 A-
Commercial mortgage-backed obligations 1,595.7 39.8 45.3 2.4 AA+Commercial mortgage-backed obligations: interest only 280.9 7.0 8.0 1.6 AAA-
Commercial mortgage-backed obligations 1,876.6 46.8 53.3 2.2 AA+
Other asset-backed securities:Automobile 682.6 5.1 19.4 1.3 AAACredit card 157.2 4.0 4.4 1.4 AAAHome equity (sub-prime bonds) 155.1 (17.3) 4.4 <.1 A-Other1 380.8 .9 10.8 1.1 AAA-
Other asset-backed securities 1,375.7 (7.3) 39.0 1.1 AAA-
Total asset-backed securities $3,524.1 $ 30.8 100.0% 1.7 AA+
2010Prime collateralized mortgage obligations $ 344.7 $ (3.1) 9.9% 1.7 AAlt-A collateralized mortgage obligations 44.7 2.2 1.3 2.5 A-
Collateralized mortgage obligations 389.4 (.9) 11.2 1.8 A
Commercial mortgage-backed obligations 1,440.3 46.0 41.5 2.1 AA+Commercial mortgage-backed obligations: interest only 391.8 14.0 11.3 1.2 AAA-
Commercial mortgage-backed obligations 1,832.1 60.0 52.8 1.9 AA+
Other asset-backed securities:Automobile 636.9 7.9 18.4 1.3 AAACredit card 185.7 2.4 5.4 1.6 AAA-Home equity (sub-prime bonds) 174.2 (2.6) 5.0 .3 A-Other1 251.4 (.1) 7.2 .9 AAA-
Other asset-backed securities 1,248.2 7.6 36.0 1.1 AA+
Total asset-backed securities $3,469.7 $ 66.7 100.0% 1.6 AA+
1Includes equipment leases, manufactured housing, and other types of structured debt.
At December 31, 2011 and 2010, our asset-backed securities had net unrealized gains of $30.8 million and $66.7 million,respectively. Substantially all of the asset-backed securities have widely available market quotes. As of December 31, 2011,approximately 6% of our asset-backed securities were exposed to non-prime mortgage loans (home equity and Alt-A).Consistent with our plan to add high-quality, short-maturity, fixed-income securities, during 2011, we continued to purchaseinvestment-grade structured securities, primarily in the commercial mortgage-backed and consumer asset-backed markets.These investments typically have a maturity profile of five years or less, and have substantial structural credit support (i.e.,the amount of underlying principal balance that is available to absorb losses before our position begins to recognize lossesdue to further defaults). We reviewed all of our asset-backed securities for other-than-temporary impairment and yield or
App.-A-64

asset valuation adjustments under current accounting guidance, and we realized $3.9 million, $13.0 million, and $33.6million in write-downs on these securities during the years ended December 31, 2011, 2010, and 2009, respectively. Thesewrite-downs occurred primarily in the residential mortgage sectors of our asset-backed portfolio as detailed below.
Collateralized Mortgage Obligations At December 31, 2011, 7.7% of our asset-backed securities were collateralizedmortgage obligations (CMO), which are a component of our residential mortgage-backed securities. During the year endedDecember 31, 2011, we recorded $3.1 million in credit loss write-downs on our CMO portfolio due to estimated principallosses in the security’s most recent cash flow projections. We did not have any write-downs on Alt-A securities during 2011.During the years ended December 31, 2010 and 2009, we recorded $1.7 million and $8.3 million in write-downs on ourCMO portfolio, respectively, including $0.4 million and $4.0 million on Alt-A securities. The following table details the creditquality rating and fair value of our collateralized mortgage obligations, along with the loan classification and a comparison ofthe fair value at December 31, 2011, to our original investment value (adjusted for returns of principal, amortization, andwrite-downs):
Collateralized Mortgage Obligations (at December 31, 2011)
($ in millions)Category AAA AA A BBB
Non-InvestmentGrade Total
% ofTotal
Non-agency prime1 $80.2 $ 9.9 $15.1 $23.7 $78.0 $206.9 76.1%Alt-A .8 24.3 0 0 18.1 43.2 15.9Government/GSE2 9.7 2.2 6.7 0 3.1 21.7 8.0
Total fair value $90.7 $36.4 $21.8 $23.7 $99.2 $271.8 100.0%
Increase (decrease) in value .6% (2.3)% (4.1)% (7.0)% (5.4)% (3.1)%
1Includes $9.2 million of securities with mandatory redemption dates.
2The securities in this category are insured by a Government Sponsored Entity (GSE) and/or collateralized by mortgage loans insured by theFederal Housing Administration (FHA) or the U.S. Department of Veteran Affairs (VA).
Commercial Mortgage-Backed Securities At December 31, 2011, 45.3% of our asset-backed securities were commercialmortgage-backed securities (CMBS) and 8.0% were CMBS interest only securities (IO). We recorded $0.6 million, $1.9million, and $0.9 million in write-downs on our IO portfolio during the years ended December 31, 2011, 2010, and 2009,respectively. No write-downs were recorded on our CMBS portfolio during the same periods. The following table details thecredit quality rating and fair value of our CMBS and IO portfolios:
Commercial Mortgage-Backed Securities (at December 31, 2011)
($ in millions)Category AAA AA A BBB
Non-InvestmentGrade Total
% ofTotal
CMBS $1,246.0 $84.0 $100.0 $137.7 $28.0 $1,595.7 85.0%IO 277.1 0 0 1.8 2.0 280.9 15.0
Total fair value $1,523.1 $84.0 $100.0 $139.5 $30.0 $1,876.6 100.0%
% of Total fair value 81.2% 4.5% 5.3% 7.4% 1.6% 100.0%
The CMBS portfolio contained 10.4% of securities that are rated BBB or lower, with a net unrealized gain of $6.4 million atDecember 31, 2011, and an average duration of 1.9 years, compared to 2.4 years for the entire CMBS portfolio.Approximately 26% of our CMBS portfolio was originated from 2005 to 2007, a period in which the CMBS market saw moreaggressive underwriting. The BBB and non-investment-grade exposure includes $80.3 million of cell tower securitizations.All of these bonds have a single borrower, are backed by a cross-collateralized pool of cell towers throughout the UnitedStates, and have significant net cash flow relative to their interest payments.
Planned amortization class IOs comprised 62% of our IO portfolio. This is a class that is structured to provide bondholderswith greater protection against loan prepayment, default, or extension risk. The bonds are at the top of the payment orderfor interest distributions and benefit from increased structural support over time as they repay. We have no 2007 to 2009origination vintage exposure; securities issued in that time frame are viewed as having a higher risk profile due tounderwriting criteria in place at that time.
App.-A-65

Home-Equity Securities At December 31, 2011, 4.4% of our asset-backed securities were home-equity securities, which area component of our residential mortgage-backed securities. We recorded $0.2 million, $9.4 million, and $23.7 million inwrite-downs for the years ended December 31, 2011, 2010, and 2009, respectively. The following table shows the creditquality rating of our home-equity securities, by deal origination year, along with a comparison of the fair value atDecember 31, 2011, to our original investment value (adjusted for returns of principal, amortization, and write-downs):
Home-Equity Securities (at December 31, 2011)
($ in millions) Deal Origination Year
Total% ofTotalRating (date acquired) 2007 2006 2005 2004
AAA (January 2008-February 2011) $ 0 $ 0 $ 41.2 $ 0 $ 41.2 26.6%AA (February 2008-April 2010) 0 0 9.9 3.9 13.8 8.9A (March 2008-December 2011) 0 10.3 20.5 0 30.8 19.8BBB (April 2008) 0 0 3.2 0 3.2 2.1Non-investment grade (March 2007-May 2008) .3 21.0 35.1 9.7 66.1 42.6
Total $ .3 $31.3 $109.9 $13.6 $155.1 100.0%
Increase (decrease) in value (22.9)% (2.4)% (13.1)% .5% (10.0)%
MUNICIPAL SECURITIESIncluded in the fixed-income portfolio at December 31, 2011 and 2010, were $2,002.1 million and $1,989.1 million,respectively, of state and local government obligations. These securities had a duration of 2.6 years and 2.3 years, atDecember 31, 2011 and 2010, respectively, with an overall credit quality of AA+ (excluding the benefit of credit support frombond insurance) for both years. These securities had net unrealized gains of $63.5 million and $33.6 million atDecember 31, 2011 and 2010, respectively. During the years ended December 31, 2011, 2010, and 2009, we did not recordany write-downs on our municipal portfolio. The following table details the credit quality rating of our municipal securities atDecember 31, 2011, without the benefit of credit or bond insurance:
Municipal Securities (at December 31, 2011)
(millions)Rating
GeneralObligations
RevenueBonds Total
AAA $316.9 $ 444.8 $ 761.7AA 500.8 660.5 1,161.3A 19.4 44.3 63.7BBB 1.5 6.7 8.2Other1 0 7.2 7.2
Total $838.6 $1,163.5 $2,002.1
1Includes non-investment-grade and non-rated securities.
Included in revenue bonds were $885.1 million of single family housing revenue bonds issued by state housing financeagencies, of which $371.7 million were supported by individual mortgages held by the state housing finance agencies and$513.4 million were supported by mortgage-backed securities. Of the programs supported by mortgage-backed securities,approximately 30% were collateralized by Fannie Mae and Freddie Mac mortgages; the remaining 70% were collateralizedby Ginnie Mae loans, which are fully guaranteed by the U.S. government. Of the programs supported by individualmortgages held by the state housing finance agencies, the overall credit quality rating was AA. Most of these mortgageswere supported by FHA, VA, or private mortgage insurance providers.
Approximately 11%, or $223.3 million, of our total municipal securities were insured general obligation ($154.4 million) orrevenue ($68.9 million) bonds with an overall credit quality rating of AA- at December 31, 2011, excluding the benefit ofcredit insurance provided by monoline insurers. These securities had a net unrealized gain of $9.2 million at December 31,2011, compared to $10.9 million at December 31, 2010. We buy and hold these securities based on our evaluation of theunderlying credit without reliance on the monoline insurance. Our investment policy does not require us to liquidatesecurities should the insurance provided by the monoline insurers cease to exist.
App.-A-66

CORPORATE SECURITIESIncluded in our fixed-income securities at December 31, 2011 and 2010, were $2,896.2 million and $2,646.1 million,respectively, of fixed-rate corporate securities. These securities had a duration of 3.2 years at December 31, 2011,compared to 3.3 years at December 31, 2010, with an overall credit quality rating of BBB for both years. These securitieshad net unrealized gains of $87.8 million and $64.8 million at December 31, 2011 and 2010, respectively. During the yearsended December 31, 2011, 2010, and 2009, we did not record any write-downs on our corporate debt portfolio. The tablebelow shows the exposure break-down by sector and rating, reflecting any changes in ratings since acquisition:
Corporate Securities (at December 31, 2011)
Sector AAA AA A BBBNon-Investment
Grade% of
Portfolio
Consumer 0% 0% 4.4% 19.0% 3.8% 27.2%Industrial 0 1.5 1.9 19.4 3.6 26.4Communications 0 0 4.1 13.7 .3 18.1Financial Services 0 3.5 3.4 3.8 3.3 14.0Technology 0 0 0 2.7 0 2.7Basic Materials 0 0 0 4.8 0 4.8Energy 1.4 0 1.8 3.4 0 6.6Other 0 0 0 .2 0 .2
Total 1.4% 5.0% 15.6% 67.0% 11.0% 100.0%
PREFERRED STOCKS – REDEEMABLE AND NONREDEEMABLEWe hold both redeemable (i.e., mandatory redemption dates) and nonredeemable (i.e., perpetual with call dates) preferredstocks. At December 31, 2011, we held $373.9 million in redeemable preferred stocks and $806.3 million in nonredeemablepreferred stocks, compared to $502.5 million and $1,157.6 million, respectively, at December 31, 2010.
Our preferred stock portfolio had net unrealized gains of $333.5 million and $572.7 million at December 31, 2011 and 2010,respectively. We did not record any write-downs on our preferred stock portfolio during the years ended December 31, 2011or 2010, compared to $213.2 million in write-downs during the year ended December 31, 2009.
Our preferred stock portfolio had a duration of 1.6 years, which reflects the portfolio’s exposure to changes in interest rates,at December 31, 2011, compared to 1.8 years at December 31, 2010. The overall credit quality rating was BBB- atDecember 31, 2011 and 2010. Approximately 45% of our preferred stock securities are fixed-rate securities, and 55% arefloating-rate securities. All of our preferred securities have call or mandatory redemption features. Most of the securities arestructured to provide some protection against extension risk in the event the issuer elects not to call such securities at theirinitial call date, by either paying a higher dividend amount or by paying floating-rate coupons. Of our fixed-rate securities,approximately 90% will convert to floating-rate dividend payments if not called at their initial call date. The interest rateduration of our preferred securities is calculated to reflect both the call and floating rate features. Although a preferredsecurity may remain outstanding if not called, its interest rate duration will reflect the variable nature of the dividend. Thetable below shows the exposure break-down by sector and rating, reflecting any changes in ratings since acquisition:
Preferred Stocks (at December 31, 2011)
Sector A BBBNon-Investment
Grade% of Preferred
Stock Portfolio
Financial ServicesU.S. banks 4.7% 37.3% 12.6% 54.6%Foreign banks 0 2.2 1.2 3.4Insurance 0 8.0 7.1 15.1Other 0 0 2.0 2.0
Total financial services 4.7 47.5 22.9 75.1Industrials 0 3.0 11.8 14.8Utilities 0 10.1 0 10.1
Total 4.7% 60.6% 34.7% 100.0%
Approximately 55% of our preferred stock securities pay dividends that have tax preferential characteristics, while thebalance pay dividends that are fully taxable. In addition, all of our non-investment-grade preferred stocks were with issuersthat maintain investment-grade senior debt ratings.
App.-A-67

Common Equities
Common equities, as reported on the balance sheets at December 31, were comprised of the following:
($ in millions) 2011 2010
Common stocks $1,834.1 99.4% $1,413.2 99.2%Other equity-like investments 11.5 .6 11.8 .8
Total common equities $1,845.6 100.0% $1,425.0 100.0%
At December 31, 2011, 11.6% of the portfolio was in common equities, compared to 9.2% at the same time last year. Ourindexed common stock portfolio, which makes up 97% of our December 31, 2011 common stock holdings, is managedexternally to track the Russell 1000 Index with an anticipated annual tracking error of +/- 50 basis points. Our individualholdings are selected based on their contribution to the correlation with the index. For 2011 and 2010, the GAAP basis totalreturn was within the desired tracking error when compared to the Russell 1000 Index. We held 748 out of 981, or 76%, ofthe common stocks comprising the Russell 1000 Index at December 31, 2011, which made up 93% of the total marketcapitalization of the index.
The remaining 3% reflects our decision to invest in common stocks outside of the index. During the fourth quarter 2011, weselected an external investment manager to invest up to $150 million in such common stocks; at year-end 2011,$59.0 million was invested in such securities.
The year-over-year increase in our common stock portfolio reflects our efforts to increase our exposure during the year.During 2011, we recorded $1.6 million in write-downs on our common equities, compared to $0.9 million and $17.4 millionfor the years ended December 31, 2010 and 2009, respectively.
The following is a summary of our indexed common stock portfolio holdings by sector compared to the Russell 1000 Indexcomposition:
Sector
Equity PortfolioAllocation at
December 31, 2011
Russell 1000Allocation at
December 31, 2011
Russell 1000Sector Return
in 2011
Consumer discretionary 13.6% 14.1% 5.5%Consumer staple 8.9 9.1 14.5Financial service 14.9 15.5 (12.9)Health care 11.5 11.2 11.8Materials and processing 4.6 4.5 (6.9)Other energy 11.5 11.5 3.5Producer durable 10.2 11.0 (1.9)Technology 16.6 16.5 .3Utility 6.6 6.6 12.6Other equity 1.6 NA NA
Total common stocks 100.0% 100.0% 1.5%
NA = Not Applicable
Trading Securities
At December 31, 2011 and 2010, we did not hold any trading securities and we did not have any net realized gains (losses)on trading securities for the years ended December 31, 2011, 2010, and 2009.
App.-A-68

Derivative Instruments
We have invested in the following derivative exposures at various times: interest rate swaps, asset-backed credit defaultswaps, U.S. corporate debt credit default swaps, cash flow hedges, and equity options. See Note 2—Investments for furtherdiscussion of our derivative positions.
For all derivative positions discussed below, realized holding period gains and losses are netted with any upfront cash thatmay be exchanged under the contract to determine if the net position should be classified either as an asset or liability. Tobe reported as a component of the available-for-sale portfolio, the inception-to-date realized gain on the derivative positionat period end would have to exceed any upfront cash received (net derivative asset). On the other hand, a net derivativeliability would include any inception-to-date realized loss plus the amount of upfront cash received (or netted, if upfront cashwas paid) and would be reported as a component of other liabilities. These net derivative assets/liabilities are not separatelydisclosed on the balance sheet due to their immaterial effect on our financial condition, cash flows, and results ofoperations.
INTEREST RATE SWAPSWe invest in interest rate swaps primarily to manage the fixed-income portfolio duration. The following table summarizes ourinterest rate swap activity classified by the status (open vs. closed) of the swap position as of December 31, 2011:
Net RealizedGains (Losses)
(millions) Date Notional ValueYears endedDecember 31,
Term Effective Maturity Coupon 2011 2010 2009 2011 2010 2009
Open:5-year 05/2011 05/2016 Receive variable $ 400 $ 0 $ 0 $(20.0) $ 0 $ 05-year 08/2011 08/2016 Receive variable 500 0 0 (9.2) 0 09-year 12/2009 01/2019 Receive variable 363 363 363 (44.8) (33.9) .1
Total open positions $1,263 $363 $ 363 $(74.0) $(33.9) $ .1
Closed:2-year NA NA Receive fixed $ 0 $ 0 $2,300 $ 0 $ 0 $ 3.83-year NA NA Receive fixed 0 0 880 0 0 8.35-year NA NA Receive fixed 0 0 1,006 0 0 (1.7)9-year NA NA Receive variable 350 350 350 (25.5) (32.7) 0
Total closed positions $ 350 $350 $4,536 $(25.5) $(32.7) $10.4
Total interest rate swaps $(99.5) $(66.6) $10.5
NA = Not Applicable
CORPORATE CREDIT DEFAULT SWAPSWe invest in corporate credit default swaps primarily to manage the fixed-income portfolio credit risk. The following tablesummarizes our corporate credit default swap activity classified by the status of the swap position as of December 31, 2011:
(millions)Date
Boughtor SoldProtection
Notional Value
Net RealizedGains (Losses)
Years endedDecember 31,
Term Effective Maturity 2011 2010 2009 2011 2010 2009
Open:5-year 09/2008 09/2013 Bought $25 $25 $25 $(.2) $ .9 $ (.6)
Closed:2-year NA NA Bought $ 0 $10 $ 7 $ 0 $ 0 $ (.4)4-year NA NA Bought 0 15 0 0 (.2) 0Corporate swap NA NA Sold 10 10 0 .2 1.2 0Treasury Note1 NA NA Sold 10 10 0 .3 .4 0
Total closed positions $ .5 $1.4 $ (.4)
Total corporate swaps $ .3 $2.3 $(1.0)
1Used to replicate a long corporate bond position.
NA = Not Applicable
App.-A-69

CASH FLOW HEDGESDuring 2011, we issued $500 million of 3.75% Senior Notes and entered into a forecasted debt issuance hedge (cash flowhedge) against a possible rise in interest rates (see Note 4 – Debt for further discussion). Upon issuance of the 3.75%Senior Notes, the hedge was closed and we recognized, as part of accumulated other comprehensive income, a pretaxunrealized loss of $5.1 million. The $5.1 million loss was deferred and is being recognized as an increase to interestexpense over the life of the 3.75% Senior Notes.
We repurchased $15.0 million and $222.9 million principal amount of our 6.70% Debentures at or near par in the openmarket at December 31, 2011 and 2010, respectively (see Note 4 – Debt for further discussion). We reclassified $0.3 millionand $5.8 million (pretax) from accumulated other comprehensive income on the balance sheet to net realized gains (losses)on securities on the comprehensive income statement, reflecting the portion of the unrealized gain on forecastedtransactions that was related to the repurchased 6.70% Debentures.
During 2011, 2010, and 2009, we recognized $2.6 million, $2.7 million, and $2.8 million, respectively, as a net decrease tointerest expense on our closed debt issuance cash flow hedges.
In 2009, we realized a foreign currency trade gain of $0.9 million, reflecting the previously deferred gain on our foreigncurrency cash flow hedge, which was opened during 2008 and closed in 2009.
B. Investment Results
Investment income (interest and dividends, before investment and interest expenses) decreased 8% for 2011, compared toan increase of 3% for 2010 and a decrease of 20% for 2009. The reduction in 2011 was primarily the result of a decrease ininvestment yields during the period. The increase in 2010 was the result of an increase in average invested assets, partiallyoffset by a reduction in the portfolio yield. The reduction in 2009 was primarily the result of investing new cash and proceedsfrom security sales, redemptions, and maturities into lower-yielding U.S. Treasury Notes and short-term investments as ameans to protect the portfolio from additional valuation declines and the historically low rate environment.
We report total return to reflect more accurately the management philosophy governing the portfolio and our evaluation ofinvestment results. The fully taxable equivalent (FTE) total return includes investment income, net realized gains (losses) onsecurities, and changes in unrealized gains (losses) on investments.
The following summarizes investment results for the years ended December 31:
2011 2010 2009
Pretax investment book yield 3.2% 3.5% 3.7%Weighted average FTE book yield 3.6% 3.9% 4.2%FTE total return:
Fixed-income securities 3.4% 6.9% 12.2%Common stocks 2.5% 17.0% 29.5%
Total portfolio 3.2% 7.8% 12.5%
App.-A-70

A further break-down of our total returns for our fixed-income securities, including the net gains (losses) on our derivativepositions, for the years ended December 31, follows:
2011 2010 2009
Fixed-income securities:U.S. Treasury Notes 3.0% 4.7% (1.7)%Municipal bonds 6.9% 5.4% 10.7%Corporate bonds 5.6% 8.4% 23.6%Commercial mortgage-backed securities 3.8% 8.2% 26.0%Collateralized mortgage obligations .7% 10.7% 26.2%Asset-backed securities 1.3% 7.0% .7%Preferred stocks 0% 15.2% 60.1%
Investment expenses were $13.5 million in 2011, compared to $11.9 million in 2010 and $11.1 million in 2009. The increasein 2011 was the result of $1.0 million in expenses related to the issuance of our 3.75% Senior Notes during the year (seeNote 4 – Debt for further discussion).
Interest expense in 2011 was $132.7 million, compared to $133.5 million in 2010 and $139.0 million in 2009. The decreasein 2011 and 2010 reflects the 2010 repurchase of $222.9 million of our 6.70% Debentures; in 2011, the decrease waspartially offset by the issuance of our 3.75% Senior Notes (see Note 4 – Debt for further discussion).
Other-Than-Temporary Impairment (OTTI)
Realized losses may include write-downs of securities determined to have had an other-than-temporary decline in fair value.The write-down activity recorded in the comprehensive income statements for the years ended December 31, was asfollows:
(millions)Total
Write-downs
Write-downson Securities
Sold
Write-downson Securities
Held atPeriod End
2011Residential mortgage-backed securities $ 3.3 $ 0 $ 3.3Commercial mortgage-backed securities .6 0 .6
Total fixed income 3.9 0 3.9Common equities 1.6 (1.4) .2
Total portfolio $ 5.5 $ (1.4) $ 4.1
2010Residential mortgage-backed securities $ 11.1 $ 0 $ 11.1Commercial mortgage-backed securities 1.9 0 1.9
Total fixed income 13.0 0 13.0Common equities .9 (.4) .5
Total portfolio $ 13.9 $ (.4) $ 13.5
2009Residential mortgage-backed securities $ 32.0 $ 0 $ 32.0Commercial mortgage-backed securities .9 0 .9Other asset-backed securities .7 (.7) 0Preferred stocks 213.2 (48.3) 164.9
Total fixed income 246.8 (49.0) 197.8Common equities 17.4 (7.1) 10.3
Total portfolio $264.2 $(56.1) $208.1
See Critical Accounting Policies, Other-Than-Temporary Impairment for a complete discussion on our analysis regardingour treatment of OTTI.
App.-A-71

C. Repurchase Transactions
From time to time, we enter into reverse repurchase commitment transactions. In these transactions, we loan cash tointernally approved counterparties and receive U.S. Treasury Notes pledged as collateral against the cash borrowed. Wechoose to enter into these transactions as rates and credit quality are more attractive than other short-term rates availablein the market. Our exposure to credit risk is limited due to the characteristics of the collateral (i.e., U.S. Treasury Notes)received. The income generated on these transactions is calculated at the then applicable general collateral rates on thevalue of U.S. Treasury securities received. We have counterparty exposure on reverse repurchase agreements in the eventof a counterparty default to the extent the general collateral security’s value is below the cash we delivered to acquire thecollateral. The short-term duration of the transactions (primarily overnight investing) reduces that default exposure.
We earned income of $0.4 million, $1.2 million, and $0.9 million on reverse repurchase agreements for the years endedDecember 31, 2011, 2010, and 2009, respectively. We had $384.2 million of open reverse repurchase commitments withtwo counterparties at December 31, 2011, compared to $705.8 million open with two counterparties at December 31, 2010.During 2011, our largest single outstanding balance of reverse repurchase commitments was $975.0 million, which wasopen for four days; the average daily balance of reverse repurchase commitments was $618.7 million. During 2010, ourlargest single outstanding balance of reverse repurchase commitments was $1,131.3 million, which was open for one day;the average daily balance of reverse repurchase commitments was $744.9 million.
Additionally, during the second quarter 2011, we entered into repurchase commitment transactions during a period of tendays. In these transactions, we loaned U.S. Treasury securities to internally approved counterparties in exchange for cashequal to the fair value of the securities. The cash proceeds were invested in unsecured commercial paper issued by large,high-quality institutions. These transactions were entered into as overnight arrangements, and we had no open repurchasecommitments at December 31, 2011. During the period we invested in repurchase transactions, the largest singleoutstanding balance was $43.6 million, which was open for one day; the average daily balance of repurchase commitmentswas $43.5 million. We earned income of less than $0.1 million during the period these transactions were open; we did notenter into any repurchase commitment transactions during 2010.
App.-A-72

V. CRITICAL ACCOUNTING POLICIES
Progressive is required to make certain estimates and assumptions when preparing its financial statements andaccompanying notes in conformity with GAAP. Actual results could differ from those estimates in a variety of areas. The twoareas that we view as most critical with respect to the application of estimates and assumptions are the establishment of ourloss reserves and the method of determining impairments in our investment portfolio.
A. Loss and LAE Reserves
Loss and loss adjustment expense (LAE) reserves represent our best estimate of our ultimate liability for losses and LAErelating to events that occurred prior to the end of any given accounting period but have not yet been paid. At December 31,2011, we had $6.5 billion of net loss and LAE reserves, which included $5.1 billion of case reserves and $1.4 billion ofincurred but not recorded (IBNR) reserves.
Progressive’s actuarial staff reviews over 400 subsets of business data, which are at a combined state, product, and linecoverage level (the “products”), to calculate the needed loss and LAE reserves. We begin our review of a set of data byproducing multiple estimates of needed reserves, using both paid and incurred data, to determine if a reserve change isrequired. In the event of a wide variation among results generated by the different projections, our actuarial group willfurther analyze the data using additional techniques. Each review develops a point estimate for a relatively small subset ofthe business, which allows us to establish meaningful reserve levels for that subset. In addition, the actuarial staffcompletes separate projections of needed case and IBNR reserves.
We review a large majority of our reserves by product/state combination on a quarterly time frame, with the remainingreserves generally reviewed on a semiannual basis. A change in our scheduled reviews of a particular subset of thebusiness depends on the size of the subset or emerging issues relating to the product or state. By reviewing the reserves atsuch a detailed level, we have the ability to identify and measure variances in the trends by state, product, and linecoverage that otherwise would not be seen on a consolidated basis. Our intricate process of reviewing the aforementionedsubsets makes compiling a companywide roll up to generate a range of needed loss reserves not meaningful. We do notreview loss reserves on a macro level and, therefore, do not derive a companywide range of reserves to compare to astandard deviation.
In analyzing the ultimate accident year loss experience, our actuarial staff reviews in detail, at the subset level, frequency(number of losses per earned car year), severity (dollars of loss per each claim), and average premium (dollars of premiumper earned car year). The loss ratio, a primary measure of loss experience, is equal to the product of frequency timesseverity divided by the average premium. The average premium for personal and commercial auto businesses is notestimated. The actual frequency experienced will vary depending on the change in mix of class of drivers insured byProgressive, but the frequency projections for these lines of business is generally stable in the short term, because a largemajority of the parties involved in an accident report their claims within a short time period after the occurrence. The severityexperienced by Progressive is much more difficult to estimate, especially for injury claims, since severity is affected bychanges in underlying costs, such as medical costs, jury verdicts, and regulatory changes. In addition, severity will varyrelative to the change in our mix of business by limit.
Assumptions regarding needed reserve levels made by the actuarial staff take into consideration influences on availablehistorical data that reduce the predictiveness of our projected future loss costs. Internal considerations that are process-related, which generally result from changes in our claims organization’s activities, include claim closure rates, the numberof claims that are closed without payment, and the level of the claims representatives’ estimates of the needed case reservefor each claim. These changes and their effect on the historical data are studied at the state level versus on a larger, lessindicative, countrywide basis.
External items considered include the litigation atmosphere, state-by-state changes in medical costs, and the availability ofservices to resolve claims. These also are better understood at the state level versus at a more macro, countrywide level.
The manner in which we consider and analyze the multitude of influences on the historical data, as well as how lossreserves affect our financial results, is discussed in more detail in our Report on Loss Reserving Practices, which was filedon June 30, 2011 via Form 8-K.
App.-A-73

At December 31, 2011, Progressive had $7.2 billion of carried gross reserves and $6.5 billion of net reserves (net ofreinsurance recoverables on unpaid losses). Our net reserve balance implicitly assumes that the loss and LAE severity foraccident year 2011 over accident year 2010 will decrease by 0.2% for personal auto liability and increase 8.4% forcommercial auto liability. Personal auto liability and commercial auto liability reserves represent approximately 98% of ourtotal carried net reserves. As discussed above, the severity estimates are influenced by many variables that are difficult toprecisely quantify and which influence the final amount of claims settlement. That, coupled with changes in internal claimspractices, the legal environment, and state regulatory requirements, requires significant judgment in the estimate of theneeded reserves to be carried.
The following table highlights what the effect would be to our carried loss and LAE reserves, on a net basis, as ofDecember 31, 2011, if during 2012 we were to experience the indicated change in our estimate of severity for the 2011accident year (i.e., claims that occurred in 2011):
Estimated Changes in Severity for Accident Year 2011
(millions) -4% -2% As Reported +2% +4%
Personal auto liability $4,872.1 $4,993.3 $5,114.5 $5,235.7 $5,356.9Commercial auto liability 1,173.6 1,190.2 1,206.8 1,223.4 1,240.0Other1 138.8 138.8 138.8 138.8 138.8
Total $6,184.5 $6,322.3 $6,460.1 $6,597.9 $6,735.7
1Includes reserves for personal and commercial auto physical damage claims and our non-auto lines of business; no change in estimates ispresented due to the immaterial level of these reserves.
Note: Every percentage point change in our estimate of severity for the 2011 accident years would affect our personal auto liability reserves by$60.6 million and our commercial auto reserves by $8.3 million.
Our 2011 year-end loss and LAE reserve balance also includes claims from prior years. Claims that occurred in 2011, 2010,and 2009, in the aggregate, accounted for approximately 92% of our reserve balance. If during 2012 we were to experiencethe indicated change in our estimate of severity for the total of the prior three accident years (i.e., 2011, 2010, and 2009),the effect to our year-end 2011 reserve balances would be as follows:
Estimated Changes in Severity for Accident Years 2011, 2010, and 2009
(millions) -4% -2% As Reported +2% +4%
Personal auto liability $4,413.7 $4,764.1 $5,114.5 $5,464.9 $5,815.3Commercial auto liability 1,111.6 1,159.2 1,206.8 1,254.4 1,302.0Other1 138.8 138.8 138.8 138.8 138.8
Total $5,664.1 $6,062.1 $6,460.1 $6,858.1 $7,256.1
1Includes reserves for personal and commercial auto physical damage claims and our non-auto lines of business; no change in estimates ispresented due to the immaterial level of these reserves.
Note: Every percentage point change in our estimate of severity for the 2011, 2010, and 2009 accident years would affect our personal auto liabilityreserves by $175.2 million and our commercial auto reserves by $23.8 million.
App.-A-74

Our best estimate of the appropriate amount for our reserves as of year-end 2011 is included in our financial statements forthe year. Our goal is to ensure that total reserves are adequate to cover all loss costs, while sustaining minimal variationfrom the time reserves are initially established until losses are fully developed. At the point in time when reserves are set,we have no way of knowing whether our reserve estimates will prove to be high or low, or whether one of the alternativescenarios discussed above is “reasonably likely” to occur. The above tables show the possible favorable or unfavorabledevelopment we will realize if our estimates miss by 2% or 4%. During 2011, our estimate of the needed reserves at the endof 2010 decreased 3.8%. The following table shows how we have performed against this goal over the last ten years:
($ in millions)For the years endedDecember 31, 2001 2002 2003 2004 2005 2006 2007 2008 2009 2010 2011
Loss and LAEReserves - net1 $3,069.7 $3,632.1 $4,346.4 $4,948.5 $5,313.1 $5,363.6 $5,655.2 $5,932.9 $6,123.6 $6,366.9 $6,460.1
Re-estimated reservesas of:
One year later 3,073.2 3,576.0 4,237.3 4,592.6 5,066.2 5,443.9 5,688.4 5,796.9 5,803.2 6,124.9Two years later 3,024.2 3,520.7 4,103.3 4,485.2 5,130.5 5,469.8 5,593.8 5,702.1 5,647.7 —Three years later 2,988.7 3,459.2 4,048.0 4,501.6 5,093.6 5,381.9 5,508.0 5,573.8 — —Four years later 2,982.7 3,457.8 4,070.0 4,471.0 5,046.7 5,336.5 5,442.1 — — —Five years later 2,993.7 3,475.4 4,073.7 4,475.5 5,054.6 5,342.8 — — — —Six years later 3,002.5 3,472.5 4,072.4 4,486.4 5,060.8 — — — — —Seven years later 3,000.6 3,470.1 4,080.5 4,486.3 — — — — — —Eight years later 2,995.8 3,477.3 4,077.8 — — — — — — —Nine years later 3,000.9 3,475.9 — — — — — — — —Ten years later 3,000.0 — — — — — — — — —
Cumulative Development:Favorable(Unfavorable) $ 69.7 $ 156.2 $ 268.6 $ 462.2 $ 252.3 $ 20.8 $ 213.1 $ 359.1 $ 475.9 $ 242.0
Percentage2 2.3 4.3 6.2 9.3 4.7 0.4 3.8 6.1 7.8 3.8
1Represents loss and LAE reserves net of reinsurance recoverables on net unpaid losses at the balance sheet date.
2Cumulative development ÷ loss and LAE reserves.
Note: The chart above represents the development of the property casualty loss and LAE reserves for 2001 through 2010. The last line in thetriangle for each year represents the following:
Re-estimated reserves = Total amount paid to-date + Re-estimated liability for unpaid losses and LAE-net
Changes in the estimated severity and the actual number of late reported claims are the cause of the change in our re-estimated reserves from yearto year. The cumulative development represents the aggregate change in our estimates over all years.
For 2001, while we experienced an increase in bodily injury severity, our developed reserves were within 2.5% of ouroriginal estimates. Our bodily injury severity change was much lower than we expected between 2002 and 2005; thus, thereserve run-off for these years was very favorable following the end of each year, or about 4% to 9% of our original carriedamounts. The reserve development for 2006 and 2007 was less than 4% of our original carried reserves. For both 2008 and2009, we experienced favorable reserve development of more than 6% of our original estimates, which reflects thedecreases in severity we experienced in both our personal auto (about 3.5%) and Commercial Auto (about 5%) businessesthrough 2011. The favorable development of approximately 4% for 2010 also reflects lower severity estimates for bothpersonal auto and Commercial Auto, but to a lesser extent than the previous two years.
Because Progressive is primarily an insurer of motor vehicles, we have minimal exposure as an insurer of environmental,asbestos, and general liability claims.
App.-A-75

B. Other-Than-Temporary Impairment (OTTI)
Realized losses may include write-downs of securities determined to have had an other-than-temporary decline in fair value.We routinely monitor our portfolio for pricing changes that might indicate potential impairments and perform detailed reviewsof securities with unrealized losses based on predetermined guidelines. In such cases, changes in fair value are evaluatedto determine the extent to which such changes are attributable to (i) fundamental factors specific to the issuer, such asfinancial conditions, business prospects, or other factors, (ii) market-related factors, such as interest rates or equity marketdeclines (e.g., negative return at either a sector index level or at the broader market level), or (iii) credit-related losses,where the present value of cash flows expected to be collected is lower than the amortized cost basis of the security.
Fixed-income securities and common equities with declines attributable to issuer-specific fundamentals are reviewed toidentify all available evidence, circumstances, and influences to estimate the potential for, and timing of, recovery of theinvestment’s impairment. An other-than-temporary impairment loss is deemed to have occurred when the potential forrecovery does not satisfy the criteria set forth in the current accounting guidance.
For fixed-income investments with unrealized losses due to market- or sector-related declines, the losses are not deemed toqualify as other-than-temporary if we do not have the intent to sell the investments, and it is more likely than not that we willnot be required to sell the investments, prior to the period of time that we anticipate to be necessary for the investments torecover their cost bases. In general, our policy for common equity securities with market- or sector-related declines is torecognize impairment losses on individual securities with losses we cannot reasonably conclude will recover in the nearterm under historical conditions by the earlier of (i) when we are able to objectively determine that the loss is other-than-temporary, or (ii) when the security has been in such a loss position for three consecutive quarters.
When a security in our fixed-maturity portfolio has an unrealized loss and we intend to sell the security, or it is more likelythan not that we will be required to sell the security, we write-down the security to its current fair value and recognize theentire unrealized loss through the comprehensive income statement as a realized loss. If a fixed-maturity security has anunrealized loss and it is more likely than not that we will hold the debt security until recovery (which could be maturity), thenwe determine if any of the decline in value is due to a credit loss (i.e., where the present value of cash flows expected to becollected is lower than the amortized cost basis of the security) and, if so, we will recognize that portion of the impairment inthe comprehensive income statement as a realized loss; any remaining unrealized loss on the security is considered to bedue to other factors (e.g., interest rate and credit spread movements) and is reflected in shareholders’ equity, along withunrealized gains or losses on securities that are not deemed to be other-than-temporarily impaired.
The following table stratifies the gross unrealized losses in our fixed-income and common equity portfolios at December 31,2011, by the duration in a loss position and magnitude of the loss as a percentage of the cost of the security:
(millions)Fair
Value
Total GrossUnrealized
Losses
Decline of Investment Value
>15% >25% >35% >45%
Fixed Income:Unrealized loss for less than 12 months $ 735.3 $16.8 $ 3.9 $ 0 $ 0 $ 0Unrealized loss for 12 months or greater 628.5 60.1 29.2 24.3 13.2 4.2
Total $1,363.8 $76.9 $33.1 $24.3 $13.2 $4.2
Common Equity:Unrealized loss for less than 12 months $ 196.7 $23.1 $14.7 $ 5.1 $ 0 $ 0Unrealized loss for 12 months or greater 17.9 2.3 .5 0 0 0
Total $ 214.6 $25.4 $15.2 $ 5.1 $ 0 $ 0
We completed a thorough review of the existing securities in these loss categories and determined that, applying theprocedures and criteria discussed above, these securities were not other-than-temporarily impaired. We do not intend to sellthese securities. We also determined that it is more likely than not that we will not be required to sell these securities, for theperiods of time necessary to recover the cost bases of these securities, and that there is no additional credit-relatedimpairment on our debt securities.
Since total unrealized losses are already a component of our shareholders’ equity in the comprehensive income statement,any recognition of these losses as additional OTTI losses would have no effect on our total comprehensive income, bookvalue, or reported investment total return.
App.-A-76

Safe Harbor Statement Under the Private Securities Litigation Reform Act of 1995: Statements in this report that arenot historical fact are forward-looking statements that are subject to certain risks and uncertainties that could cause actualevents and results to differ materially from those discussed herein. These risks and uncertainties include, without limitation,uncertainties related to estimates, assumptions, and projections generally; inflation and changes in economic conditions(including changes in interest rates and financial markets); the possible failure of one or more governmental entities to makescheduled debt payments or satisfy other obligations; the potential or actual downgrading of governmental, corporate, orother securities by a rating agency; the financial condition of, and other issues relating to the strength of and liquidityavailable to, issuers of securities held in our investment portfolios and other companies with which we have ongoingbusiness relationships, including counterparties to certain financial transactions; the accuracy and adequacy of our pricingand loss reserving methodologies; the competitiveness of our pricing and the effectiveness of our initiatives to retain morecustomers; initiatives by competitors and the effectiveness of our response; our ability to obtain regulatory approval forrequested rate changes and the timing thereof; the effectiveness of our brand strategy and advertising campaigns relative tothose of competitors; legislative and regulatory developments, including, but not limited to, health care reform and tax lawchanges; disputes relating to intellectual property rights; the outcome of litigation pending or that may be filed against us;weather conditions (including the severity and frequency of storms, hurricanes, snowfalls, hail, and winter conditions);changes in driving patterns and loss trends; acts of war and terrorist activities; our ability to maintain the uninterruptedoperation of our facilities, systems (including information technology systems), and business functions; court decisions andtrends in litigation and health care and auto repair costs; and other matters described from time to time in our releases andpublications, and in our periodic reports and other documents filed with the United States Securities and ExchangeCommission. In addition, investors should be aware that generally accepted accounting principles prescribe when acompany may reserve for particular risks, including litigation exposures. Accordingly, results for a given reporting periodcould be significantly affected if and when a reserve is established for one or more contingencies. Also, our regular reservereviews may result in adjustments of varying magnitude as additional information regarding claims activity becomes known.Reported results, therefore, may be volatile in certain accounting periods.
App.-A-77

The Progressive Corporation and SubsidiariesTen Year Summary – Selected Financial Information
(unaudited)
(millions - except ratios, policies in force, per shareamounts, and number of people employed) 2011 2010 2009 2008 2007
Net premiums written $15,146.6 $14,476.8 $14,002.9 $13,604.3 $13,772.5Growth 5% 3% 3% (1)% (3)%
Net premiums earned $14,902.8 $14,314.8 $14,012.8 $13,631.4 $13,877.4Growth 4% 2% 3% (2)% (2)%
Policies in force (thousands):Personal Lines 12,283.8 11,702.7 10,940.6 10,464.9 10,115.6
Growth 5% 7% 5% 3% 4%Commercial Auto 509.1 510.4 512.8 539.4 539.2
Growth 0% 0% (5)% 0% 7%Total revenues $15,508.1 $14,963.3 $14,563.6 $12,840.1 $14,686.8Underwriting margins:1
Personal Lines 6.8% 7.0% 7.6% 5.4% 7.0%Commercial Auto 9.1% 12.5% 14.2% 5.3% 10.1%Total underwriting operations 7.0% 7.6% 8.4% 5.4% 7.4%
Net income (loss) $ 1,015.5 $ 1,068.3 $ 1,057.5 $ (70.0) $ 1,182.5Per share2 1.59 1.61 1.57 (.10) 1.65Average equivalent shares2 636.9 663.3 672.2 668.0 718.5
Comprehensive income (loss) $ 924.3 $ 1,398.8 $ 1,752.2 $ (614.7) $ 1,071.0Total assets $21,844.8 $21,150.3 $20,049.3 $18,250.5 $18,843.1Debt outstanding 2,442.1 1,958.2 2,177.2 2,175.5 2,173.9Total shareholders’ equity 5,806.7 6,048.9 5,748.6 4,215.3 4,935.5Statutory surplus 5,269.2 5,073.0 4,953.6 4,470.6 4,587.3Common shares outstanding 613.0 662.4 672.6 676.5 680.2Common share price:
High $ 22.08 $ 22.13 $ 18.10 $ 21.31 $ 25.16Low 16.88 16.18 9.76 10.29 17.26Close (at December 31) 19.51 19.87 17.99 14.81 19.16
Market capitalization $11,959.6 $13,161.9 $12,100.1 $10,019.0 $13,032.6Book value per common share 9.47 9.13 8.55 6.23 7.26Ratios:
Return on average shareholders’ equityNet income 16.5% 17.1% 21.4% (1.5)% 19.5%Comprehensive income 15.0% 22.3% 35.5% (13.3)% 17.7%
Debt to total capital 29.6% 24.5% 27.5% 34.0% 30.6%Price to earnings3 12.3 12.3 11.5 NA 11.6Price to book 2.1 2.2 2.1 2.4 2.6Earnings to fixed charges3 11.6x 11.9x 11.3x NA 13.5xNet premiums written to statutory surplus 2.9 2.9 2.8 3.0 3.0Statutory combined ratio 92.9 92.5 91.6 94.6 92.7
Dividends declared per share4 $ .4072 $ 1.3987 $ .1613 $ 0 $ 2.1450Number of people employed 25,007 24,638 24,661 25,929 26,851
All share and per share amounts were adjusted for the May 18, 2006, 4-for-1 stock split.
1Underwriting margins are calculated as pretax underwriting profit (loss), as defined in Note 10 — Segment Information, as a percentage of netpremiums earned.
2Amounts reflect basic net income per share and basic average equivalent shares for 2008 since we reported a net loss; all other periods arepresented on a diluted basis.
App.-A-78

(millions – except ratios, policies in force, per shareamounts, and number of people employed) 2006 2005 2004 2003 2002
Net premiums written $14,132.0 $14,007.6 $13,378.1 $11,913.4 $ 9,452.0Growth 1% 5% 12% 26% 30%
Net premiums earned $14,117.9 $13,764.4 $13,169.9 $11,341.0 $ 8,883.5Growth 3% 5% 16% 28% 24%
Policies in force (thousands):Personal Lines 9,741.1 9,494.0 8,680.3 7,807.9 6,569.1
Growth 3% 9% 11% 19% 22%Commercial Auto 503.2 468.2 420.2 365.1 288.9
Growth 7% 11% 15% 26% 38%Total revenues $14,786.4 $14,303.4 $13,782.1 $11,892.0 $ 9,294.4Underwriting margins:1
Personal Lines 12.3% 11.0% 14.1% 12.1% 7.5%Commercial Auto 19.8% 17.9% 21.1% 17.5% 9.1%Total underwriting operations 13.3% 11.9% 14.9% 12.7% 7.6%
Net income (loss) $ 1,647.5 $ 1,393.9 $ 1,648.7 $ 1,255.4 $ 667.3Per share2 2.10 1.74 1.91 1.42 .75Average equivalent shares2 783.8 799.3 864.8 882.1 892.8
Comprehensive income (loss) $ 1,853.1 $ 1,347.8 $ 1,668.5 $ 1,511.1 $ 710.7Total assets $19,482.1 $18,898.6 $17,184.3 $16,281.5 $13,564.4Debt outstanding 1,185.5 1,284.9 1,284.3 1,489.8 1,489.0Total shareholders’ equity 6,846.6 6,107.5 5,155.4 5,030.6 3,768.0Statutory surplus 4,963.7 4,674.1 4,671.0 4,538.3 3,370.2Common shares outstanding 748.0 789.3 801.6 865.8 871.8Common share price:
High $ 30.09 $ 31.23 $ 24.32 $ 21.17 $ 15.12Low 22.18 20.35 18.28 11.56 11.19Close (at December 31) 24.22 29.20 21.21 20.90 12.41
Market capitalization $18,116.6 $23,040.7 $17,001.9 $18,088.9 $10,819.3Book value per common share 9.15 7.74 6.43 5.81 4.32Ratios:
Return on average shareholders’ equityNet income 25.3% 25.0% 30.0% 29.1% 19.3%Comprehensive income 28.4% 24.1% 30.4% 35.0% 20.5%
Debt to total capital 14.8% 17.4% 19.9% 22.8% 28.3%Price to earnings3 11.5 16.7 11.1 14.7 16.6Price to book 2.6 3.8 3.3 3.6 2.9Earnings to fixed charges3 24.7x 21.3x 27.1x 18.8x 13.2xNet premiums written to statutory surplus 2.8 3.0 2.9 2.6 2.8Statutory combined ratio 86.5 87.4 84.6 86.2 91.3
Dividends declared per share4 $ .0325 $ .0300 $ .0275 $ .0250 $ .0240Number of people employed 27,778 28,336 27,085 25,834 22,974
3Ratios are not applicable (NA) for 2008 since we reported a net loss for the year.
4Progressive transitioned to an annual variable dividend policy beginning in 2007. In accordance with this policy, no dividend was declared in 2008since our comprehensive income was less than after-tax underwriting income. In addition to the annual variable dividend, Progressive’s Boarddeclared extraordinary cash dividends of $1.00 per common share in 2010 and $2.00 per common share in 2007. Progressive paid quarterlydividends prior to 2007.
App.-A-79

The Progressive Corporation and SubsidiariesQuarterly Financial and Common Share Data
(unaudited)
(millions – except per share amounts)Net Income Stock Price1
QuarterTotal
Revenues TotalPer
Share2 High Low CloseRate ofReturn3
DividendsDeclared
Per Share4
20111 $ 3,893.5 $ 362.9 $ .55 $21.24 $19.12 $21.13 $ 02 3,872.7 245.2 .38 22.08 19.79 21.38 03 3,811.0 150.7 .24 21.66 16.88 17.76 04 3,930.9 256.7 .42 19.74 16.97 19.51 .4072
$15,508.1 $1,015.5 $1.59 $22.08 $16.88 $19.51 .2% $ .4072
20101 $ 3,665.9 $ 295.6 $ .44 $19.69 $16.18 $19.09 $ 02 3,686.3 211.9 .32 20.94 18.67 18.72 03 3,769.5 261.6 .40 21.59 18.41 20.87 04 3,841.6 299.2 .45 22.13 19.54 19.87 1.3987
$14,963.3 $1,068.3 $1.61 $22.13 $16.18 $19.87 16.9% $1.3987
20091 $ 3,468.2 $ 232.5 $ .35 $15.24 $ 9.76 $13.44 $ 02 3,583.5 250.1 .37 17.00 13.00 15.11 03 3,611.3 269.9 .40 17.50 14.12 16.58 04 3,900.6 305.0 .46 18.10 15.90 17.99 .1613
$14,563.6 $1,057.5 $1.57 $18.10 $ 9.76 $17.99 21.5% $ .1613
1Prices are as reported on the consolidated transaction reporting system. Progressive’s common shares are listed on the New York StockExchange under the symbol PGR.
2The sum may not equal the total because the average equivalent shares differ in the quarterly and annual periods.
3Represents annual rate of return, assuming dividend reinvestment.
4Progressive maintains an annual variable dividend policy which is typically declared each December and paid early the following year. In additionto the annual variable dividend, in October 2010, Progressive’s Board declared an extraordinary cash dividend of $1.00 per common share thatwas paid in December 2010.
App.-A-80

The Progressive Corporation and SubsidiariesPerformance Graph
(unaudited)
The following performance graph compares the performance of Progressive’s Common Shares (“PGR”) to the Standard &Poor’s Index (“S&P Index”) and the Value Line Property/Casualty Industry Group (“P/C Group”) for the last five years.
Cumulative Five-Year Total Return*
PGR, S&P Index, P/C Group (Performance Results through 12/31/11)
$0
$100
$200
2006 2007 2008 2009 2010 2011
PGR
S&P Index
P/C Group
(Assumes $100 was invested at the close of trading on December 31, 2006)
2007 2008 2009 2010 2011
PGR $ 87.37 $68.24 $ 82.90 $ 96.91 $ 97.06S&P Index 105.49 67.02 84.75 97.51 99.57P/C Group 121.77 86.79 106.88 129.03 138.42
* Assumes reinvestment of dividends
Source: Value Line Publishing LLC
App.-A-81

The Progressive Corporation and SubsidiariesClaims Payment Patterns
(unaudited)
The Progressive Group of Insurance Companies is primarily an insurer of automobiles and recreational vehicles owned byindividuals, and cars and trucks owned by small businesses. As such, our claims liabilities are generally short in duration.Since our incurred losses consist of both payments and changes in the reserve estimates, it is important to understand ourpaid development patterns. The charts below show our claims payment patterns, reflecting both dollars and claims countspaid, for personal auto physical damage and bodily injury claims, as well as on a total personal auto basis, in each casecalculated from the date of loss. Since physical damage claims pay out so quickly, the chart is calibrated on a monthlybasis, as compared to a quarterly basis for the bodily injury and total auto payments.
Physical Damage
50%
60%
70%
80%
90%
100%
0 1 2 3 4 5 6 7 8 9 10 11 12
Months
Perc
en
t P
aid
Counts Dollars
Bodily Injury
Quarters
Pe
rce
nt
Pa
id
Counts Dollars
0%
20%
40%
60%
80%
100%
1612840
App.-A-82

Total Personal Auto
Quarters
Pe
rce
nt
Pa
id
Counts Dollars
50%
60%
70%
80%
90%
100%
1612840
Note: The above graphs are presented for our personal auto products on an accident period basis and are based on three years of actualexperience for physical damage and nine years for bodily injury and total personal auto.
App.-A-83

The Progressive Corporation and SubsidiariesQuantitative Market Risk Disclosures
(unaudited)
Quantitative market risk disclosures are only presented for market risk categories when risk is considered material.Materiality is determined based on the fair value of the financial instruments at December 31, 2011, and the potential fornear-term losses from reasonably possible near-term changes in market rates or prices. We had no trading financialinstruments at December 31, 2011. See Management’s Discussion and Analysis of Financial Condition and Results ofOperations for our discussion of the qualitative information about market risk.
OTHER-THAN-TRADING FINANCIAL INSTRUMENTS
Financial instruments subject to interest rate risk were:
Fair Value
(millions)-200 bpsChange1
-100 bpsChange1 Actual
+100 bpsChange
+200 bpsChange
U.S. government obligations2 $ 2,943.2 $ 2,964.2 $ 2,963.0 $ 2,930.4 $ 2,902.0State and local government obligations 2,057.6 2,040.4 2,002.1 1,951.3 1,904.2Asset-backed securities 3,557.3 3,551.7 3,524.1 3,465.0 3,409.2Corporate securities 2,973.8 2,955.0 2,896.2 2,805.6 2,719.6Nonredeemable preferred stocks 813.7 813.1 806.3 793.6 781.0Redeemable preferred stocks 377.3 377.0 373.9 368.0 362.2Short-term investments 1,551.8 1,551.8 1,551.8 1,551.8 1,551.8
Balance as of December 31, 2011 $14,274.7 $14,253.2 $14,117.4 $13,865.7 $13,630.0
Balance as of December 31, 2010 $14,539.6 $14,416.6 $14,098.4 $13,799.3 $13,516.3
1The amounts reflect an interest rate of 1 basis point when the hypothetical decline in interest rates would have pushed yields to a negative level.
2Due to the low interest rate environment and our portfolio containing no U.S. Treasury Notes at the longer end of the yield curve, the loss in valueassociated with the interest rate swap derivative positions with a short exposure (i.e., paying fixed, receiving variable) to interest rates wouldexceed the increase in value of our long U.S. Treasury Notes, resulting in an overall decline in value of these securities at the -200 bps movement.
Exposure to risk is represented in terms of changes in fair value due to selected hypothetical movements in market rates.Bonds and preferred stocks are individually priced to yield to the worst case scenario, which includes any issuer-specificfeatures, such as a call option. Asset-backed securities, including state and local government housing securities, are pricedassuming deal specific prepayment scenarios, considering the deal structure, prepayment penalties, yield maintenanceagreements, and the underlying collateral.
Financial instruments subject to equity market risk were:
Fair Value
(millions) -10% Actual +10%
Common equities as of December 31, 2011 $1,659.2 $1,845.6 $2,032.0Common equities as of December 31, 2010 $1,271.1 $1,425.0 $1,578.9
The model represents the estimated value of our common equity portfolio given a +/-10% change in the market, based onthe common stock portfolio’s weighted average beta of 1.01 for 2011 and 1.08 for 2010. The beta is derived from recenthistorical experience, using the S&P 500 as the market surrogate. The historical relationship of the common stock portfolio’sbeta to the S&P 500 is not necessarily indicative of future correlation, as individual company or industry factors may affectprice movement. Betas are not available for all securities. In such cases, the change in fair value reflects a direct +/-10%change; the portion of securities without betas is approximately 2%.
App.-A-84

The Progressive Corporation and SubsidiariesNet Premiums Written by State
(unaudited)
($ in millions) 2011 2010 2009 2008 2007
Florida $ 1,683.1 11.1% $ 1,603.2 11.1% $ 1,667.0 11.9% $ 1,631.0 12.0% $ 1,656.9 12.0%Texas 1,403.8 9.3 1,321.4 9.1 1,228.9 8.8 1,151.3 8.5 1,072.0 7.8California 935.8 6.2 914.1 6.3 951.9 6.8 1,016.3 7.5 1,106.4 8.0Georgia 738.2 4.9 714.6 4.9 682.9 4.9 699.7 5.1 748.9 5.4New York 713.4 4.7 685.3 4.7 704.1 5.0 738.8 5.4 847.9 6.2Ohio 689.0 4.5 652.5 4.5 623.9 4.5 632.4 4.7 655.9 4.8Pennsylvania 623.1 4.1 608.5 4.2 580.7 4.1 563.7 4.1 610.5 4.4New Jersey 496.3 3.3 440.6 3.1 405.9 2.9 341.0 2.5 279.1 2.0Louisiana 496.1 3.3 465.9 3.2 414.5 3.0 373.7 2.7 359.4 2.6Michigan 471.7 3.1 448.4 3.1 455.3 3.2 461.8 3.4 443.5 3.2All other 6,896.1 45.5 6,622.3 45.8 6,287.8 44.9 5,994.6 44.1 5,992.0 43.6
Total $15,146.6 100.0% $14,476.8 100.0% $14,002.9 100.0% $13,604.3 100.0% $13,772.5 100.0%
App.-A-85

Principal Office
The Progressive Corporation6300 Wilson Mills RoadMayfield Village, Ohio 44143440-461-5000progressive.com
24-Hour Insurance Quotes, Claims Reporting, and Customer Service
Personal autos, motorcycles, and recreationalvehicles Commercial autos/trucks
To receive a quote 1-800-PROGRESSIVE (1-800-776-4737)progressive.com
1-888-806-9598progressivecommercial.com
To report a claim 1-800-274-4499progressive.com1
1-800-274-4499
For customer service:
If you bought your policy through anindependent agent or broker
1-800-925-2886(1-800-300-3693 in California)progressiveagent.com
1-800-444-4487progressivecommercial.com
If you bought your policy directlythrough Progressive online or byphone
1-800-PROGRESSIVE (1-800-776-4737)progressive.com
1-800-444-4487progressivecommercial.com
If you have a complaint or concernregarding any claim handling orother claims-related issue2
1-800-274-4641email: [email protected]
1-800-274-4641email: [email protected]
1Claims reporting via the website is currently only available for personal auto policies.
2Any policyholder, claimant, or other interested party who has any complaint or concern regarding any claim handling or other claims-related issuemay report such claim using the contact information above. The complaint or concern will be promptly forwarded to the appropriate managementpersonnel in our claims organization for review and response.
Annual Meeting The Annual Meeting of Shareholders will be held at the offices of The Progressive Corporation, 6671 BetaDrive, Mayfield Village, Ohio 44143 on April 20, 2012, at 10 a.m. eastern time. There were 3,273 shareholders of record onDecember 31, 2011.
Common Shares and Dividends The Progressive Corporation’s common shares are traded on the New York StockExchange (symbol PGR). Progressive currently has an annual variable dividend policy. We expect the Board to declare thenext annual variable dividend, subject to policy limitations, in December 2012, with a record date in January 2013 andpayment shortly thereafter. A complete description of our annual variable dividend policy can be found at:progressive.com/dividend.
Shareholder/Investor Relations Progressive does not maintain a mailing list for distribution of shareholders’ reports. Toview Progressive’s publicly filed documents, shareholders can access our website: progressive.com/sec. To view ourearnings and other releases, access progressive.com/investors.
For financial-related information or to request copies of Progressive’s publicly filed documents free of charge, write to: TheProgressive Corporation, Investor Relations, 6300 Wilson Mills Road, Box W33, Mayfield Village, Ohio 44143, email:[email protected] or call: 440-395-2222.
For all other company information, call: 440-461-5000 or access our website at progressive.com/contactus.
Transfer Agent and Registrar
Registered Shareholders: If you have questions or changes to your account and your Progressive shares are registered inyour name, write to: American Stock Transfer & Trust Company, Attn: Operations Center, 6201 15th Avenue, Brooklyn, NY11219; phone: 1-866-709-7695; email: [email protected]; or visit their website at: www.amstock.com.
Beneficial Shareholders: If your Progressive shares are held in a brokerage or other financial institution account, contactyour broker or financial institution directly regarding questions or changes to your account.
App.-A-86

Contact Non-Management Directors Interested parties have the ability to contact the non-management directors as agroup by sending a written communication clearly addressed to the non-management directors to either of the following:
Peter B. Lewis, Chairman of the Board, The Progressive Corporation, 6300 Wilson Mills Road, Mayfield Village, Ohio 44143or email: [email protected].
Charles E. Jarrett, Secretary, The Progressive Corporation, 6300 Wilson Mills Road, Mayfield Village, Ohio 44143 or email:[email protected].
The recipient will forward communications so received to the non-management directors.
Accounting Complaint Procedure Any employee or other interested party with a complaint or concern regardingaccounting, internal accounting controls, or auditing matters relating to Progressive may report such complaint or concerndirectly to the Chairman of the Audit Committee, as follows: Patrick H. Nettles, Ph.D., Chairman of the Audit Committee,[email protected].
Any such complaint or concern also may be reported anonymously over the following toll-free Alert Line: 1-800-683-3604 oronline at www.progressivealertline.com. Progressive will not retaliate against any individual by reason of his or her havingmade such a complaint or reported such a concern in good faith. View the complete procedures at:progressive.com/governance.
Whistleblower Protections Progressive will not retaliate against any officer or employee of Progressive because of anylawful act done by the employee to provide information or otherwise assist in investigations regarding conduct that theemployee reasonably believes to be a violation of federal securities laws or of any rule or regulation of the Securities andExchange Commission or federal securities laws relating to fraud against shareholders. View the complete WhistleblowerProtections at progressive.com/governance.
Corporate Governance Progressive’s Corporate Governance Guidelines and Board Committee Charters are available at:progressive.com/governance.
Counsel Baker & Hostetler LLP, Cleveland, Ohio
Charitable Contributions Progressive contributes annually to The Progressive Insurance Foundation, which provides:(i) financial support to the Insurance Institute for Highway Safety to further its work in reducing the human trauma andeconomic costs of auto accidents; and (ii) matching funds to eligible 501(c)(3) charitable organizations to which Progressiveemployees contribute.
Social Responsibility Progressive uses an interactive online format to communicate our social responsibility efforts. Thisreport can be found at: progressive.com/socialresponsibility.
Online Annual Report and Proxy Statement Our 2011 Annual Report to Shareholders can be found at:progressive.com/annualreport.
We have also posted copies of our 2012 Proxy Statement and 2011 Annual Report to Shareholders, in a “PDF” format, at:progressiveproxy.com.
©2012 The Progressive Corporation
App.-A-87

Directors
Stuart B. Burgdoerfer1,6 * Norman S. Matthews3,5,6 1 Audit Committee MemberExecutive Vice President and Consultant, 2 Executive Committee MemberChief Financial Officer, Former President, 3 Compensation Committee MemberLimited Brands, Inc. Federated Department Stores, Inc. 4 Investment and Capital Committee(retailing) (retailing) Member
5 Nominating and GovernanceCharles A. Davis4,5,6 Heidi G. Miller, Ph.D.1,6 Committee MemberChief Executive Officer, Retired President of International, 6 Independent DirectorStone Point Capital LLC JPMorgan Chase & Co.(private equity investing) (financial services)
Roger N. Farah3,6 Patrick H. Nettles, Ph.D.1,6
President and Chief Operating Officer, Executive Chairman, * In April 2012, Norman S. Matthewswill retire after 31 years of service onour Board. Progressive would like tothank Mr. Matthews for his dedicatedservice and the many contributionshe made during his tenure on theBoard.
Ralph Lauren Corporation Ciena Corporation(lifestyle products) (telecommunications)
Lawton W. Fitt4,6 Glenn M. Renwick2
Retired Partner, President and Chief Executive Officer,Goldman Sachs Group The Progressive Corporation(financial services)
Stephen R. Hardis2,4,5,6 Bradley T. Sheares, Ph.D.3,6
Retired Chairman of the Board and Former Chief Executive Officer,Chief Executive Officer, Reliant Pharmaceuticals, Inc.Eaton Corporation (pharmaceuticals)(manufacturing)
Peter B. Lewis2,4,6
Chairman of the Board,The Progressive Corporation(non-executive)
Corporate Officers Other Executive Officers
Glenn M. Renwick John A. BarbagalloPresident and Chief Executive Officer Commercial Lines Group President
Brian C. Domeck M. Jeffrey CharneyVice President and Chief Financial Officer Chief Marketing Officer
Charles E. Jarrett William M. CodyVice President, Secretary, Chief Investment Officerand Chief Legal Officer
Susan Patricia GriffithThomas A. King Claims Group PresidentVice President and Treasurer
Valerie KrasowskiJeffrey W. Basch Chief Human Resource OfficerVice President andChief Accounting Officer John P. Sauerland
Personal Lines Group PresidentMariann Wojtkun MarshallAssistant Secretary Raymond M. Voelker
Chief Information OfficerPeter B. LewisChairman of the Board(non-executive)
App.-A-88