2011 centuria results presentation
DESCRIPTION
Diversified funds management group Centuria Capital announced an underlying net profit after tax of $6.4 million for the full year ended 30 June 2011. Representing profit after tax, adjusted for non-recurring items and excluding the consolidated financial affairs of the benefit funds – the underlying NPAT of $6.4 million is equivalent to 8.0 cents per share. Underlying earning before tax was $10.5 million.TRANSCRIPT

Result Announcement for the full year ending 30 June 2011
Centuria Capital Limited
Presentation to Investors and Analysts updated 13 September 2011
Property FUM increase by 40% during financial year$1 billion property FUM milestone achieved Total group FUM increased by 16% to $1.93 billion
Rebranding to Centuria completed - core divisions now share common branding
Underlying FY11 - EBIT $10.5 million, NPAT $6.4 millionCenturia Life underlying Net Profit steady (+2.4%)
Full year dividends of 6.0 cents per share partly franked to 30% representing a 20% increase over 2009/10 financial year
Corporate gearing remains low at 8.9% (excluding non recourse debt and convertible notes)
Centuria Capital Limited
Presentation to Investors and Analysts 2Information in this presentation is general information only. Before you make any decision in relation to your investment, we recommend that you obtain financial advice from a licensed financial adviser.
2011 Financial Year Highlights
Realising our Growth Strategy
Brand Consolidation
Underlying Earnings
Increased Dividends
Strong Financial Position
Centuria Capital Limited
Presentation to Investors and Analysts 3Information in this presentation is general information only. Before you make any decision in relation to your investment, we recommend that you obtain financial advice from a licensed financial adviser.
2011 Key Business Highlights
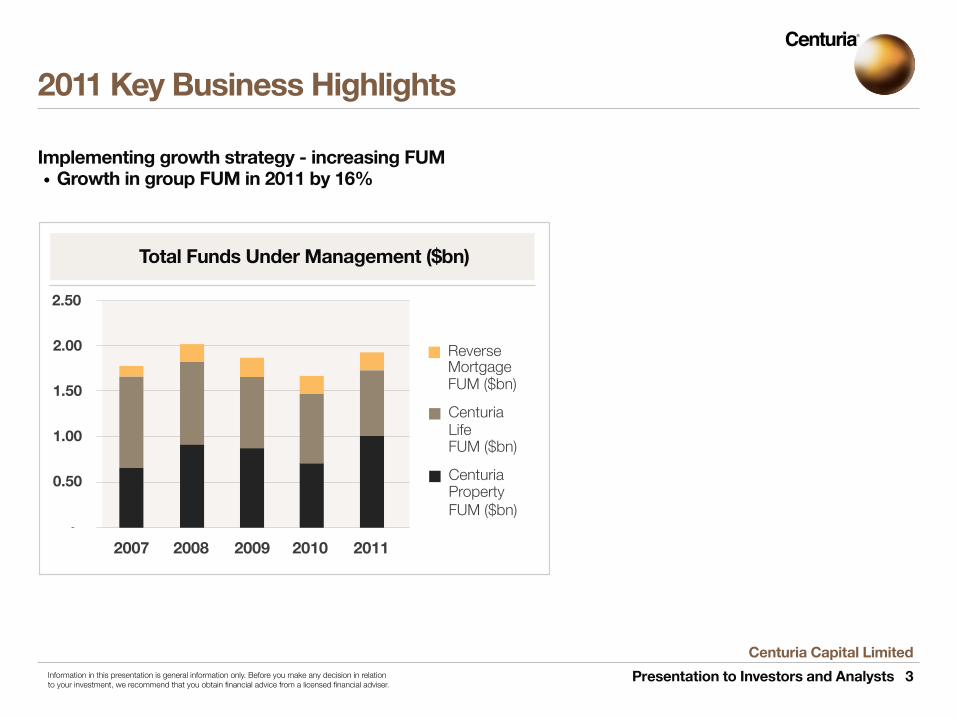
Implementing growth strategy - increasing FUM Growth in group FUM in 2011 by 16%
Reverse Mortgage FUM ($bn)
Centuria LifeFUM ($bn)
CenturiaPropertyFUM ($bn)
Total Funds Under Management ($bn)
2.00
1.50
1.00
0.50
-
2.50
2007 2008 2009 2010 2011
Centuria Capital Limited
Presentation to Investors and Analysts 4Information in this presentation is general information only. Before you make any decision in relation to your investment, we recommend that you obtain financial advice from a licensed financial adviser.
2011 Key Business Highlights
Successful brand consolidation to Centuria – taking us from a collection of companies, to a single diversified funds manager.
Centuria Property Funds successfully completed two major property funds and was awarded the management rights for a major national portfolio of former Becton property funds.
These transactions generated over $300 million of growth in FUM.
Launch of an industry-leading investor rights campaign in the Property Funds division to transfer rights back to the investor.
Significant investments in infrastructure / people – appointments of key senior personnel – distributions, operational property and funds management, finance and tax.
These investments have impacted profitability but are essential to service the new business and build a platform for growth.
Centuria Capital Limited
Presentation to Investors and Analysts 5Information in this presentation is general information only. Before you make any decision in relation to your investment, we recommend that you obtain financial advice from a licensed financial adviser.
2011 Key Business Highlights
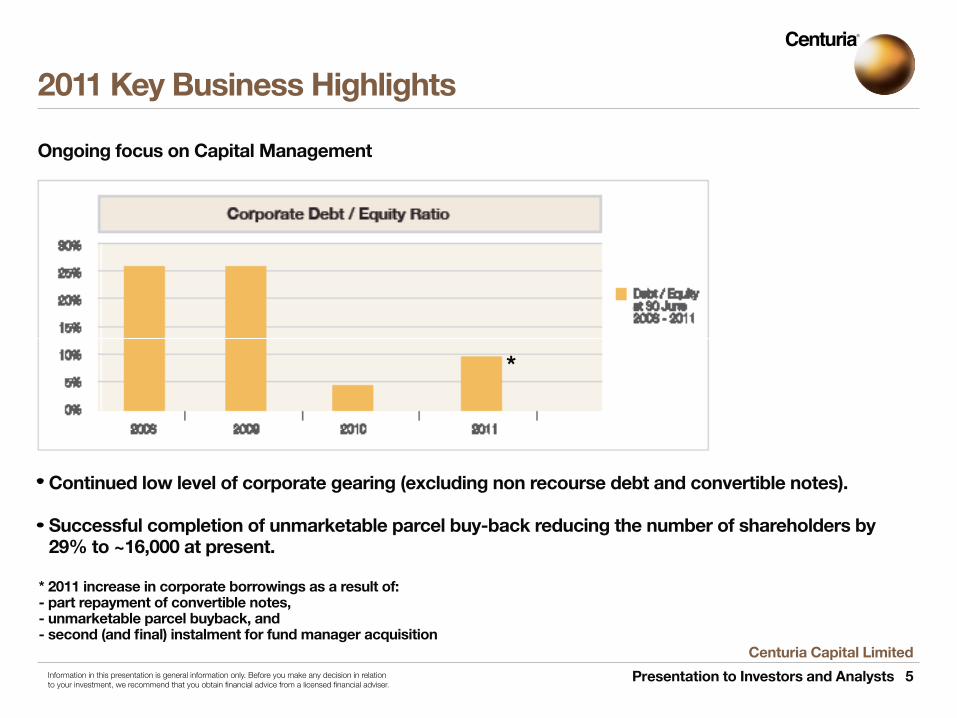
Ongoing focus on Capital Management
Continued low level of corporate gearing (excluding non recourse debt and convertible notes).
Successful completion of unmarketable parcel buy-back reducing the number of shareholders by 29% to ~16,000 at present.
* 2011 increase in corporate borrowings as a result of: - part repayment of convertible notes,- unmarketable parcel buyback, and - second (and final) instalment for fund manager acquisition
*
Centuria Capital Limited
Presentation to Investors and Analysts 6Information in this presentation is general information only. Before you make any decision in relation to your investment, we recommend that you obtain financial advice from a licensed financial adviser.
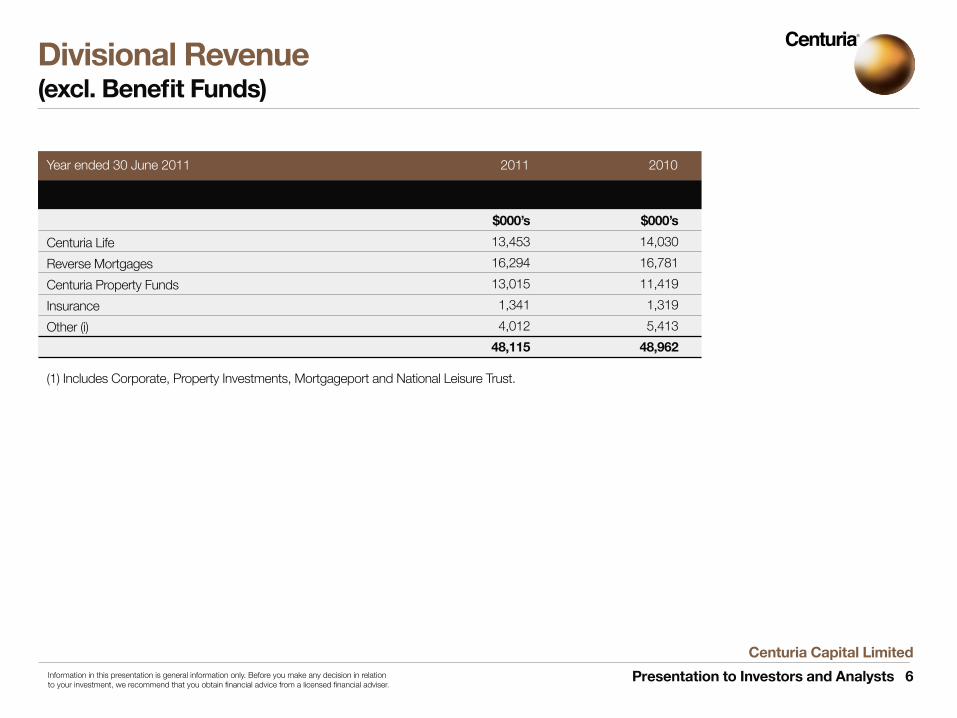
,
Centuria Life
Reverse Mortgages
Centuria Property Funds
Insurance
Other (i)
(1) Includes Corporate, Property Investments, Mortgageport and National Leisure Trust.
$000’s
14,030
16,781
11,419
1,319
5,413
48,962
2010
$000’s
13,453
16,294
13,015
1,341
4,012
48,115
2011Year ended 30 June 2011
Divisional Revenue (excl. Benefit Funds)
Centuria Capital Limited
Presentation to Investors and Analysts 7Information in this presentation is general information only. Before you make any decision in relation to your investment, we recommend that you obtain financial advice from a licensed financial adviser.
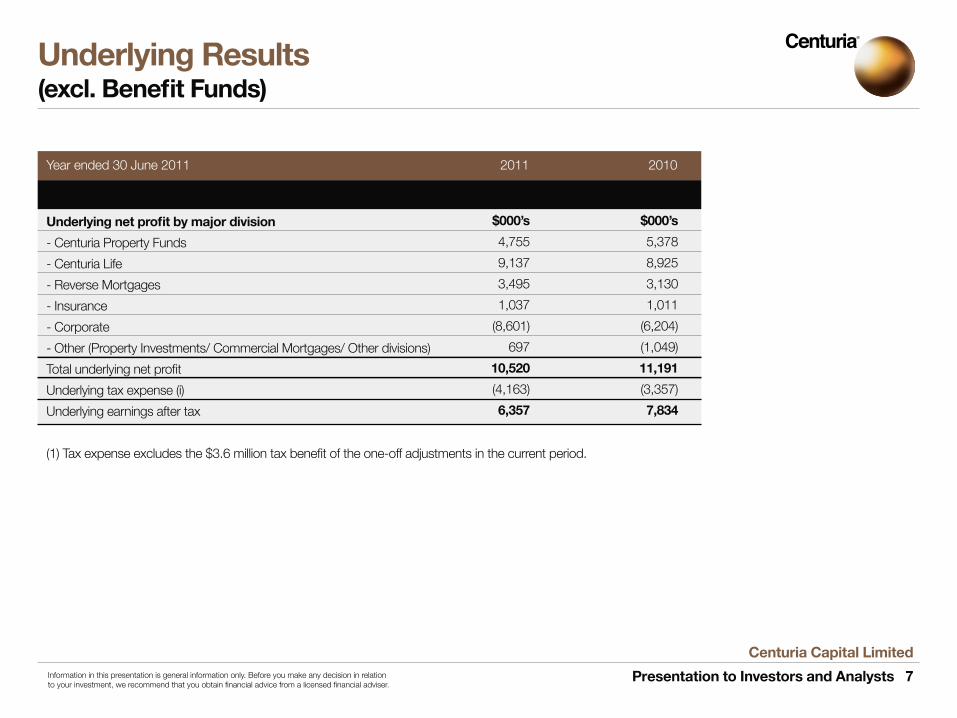
,
Underlying net profit by major division
- Centuria Property Funds
- Centuria Life
- Reverse Mortgages
- Insurance
- Corporate
- Other (Property Investments/ Commercial Mortgages/ Other divisions)
Total underlying net profit
Underlying tax expense (i)
Underlying earnings after tax
(1) Tax expense excludes the $3.6 million tax benefit of the one-off adjustments in the current period.
$000’s
5,378
8,925
3,130
1,011
(6,204)
(1,049)
11,191
(3,357)
7,834
2010
$000’s
4,755
9,137
3,495
1,037
(8,601)
697
10,520
(4,163)
6,357
2011Year ended 30 June 2011
Underlying Results (excl. Benefit Funds)
Centuria Capital Limited
Presentation to Investors and Analysts 8Information in this presentation is general information only. Before you make any decision in relation to your investment, we recommend that you obtain financial advice from a licensed financial adviser.
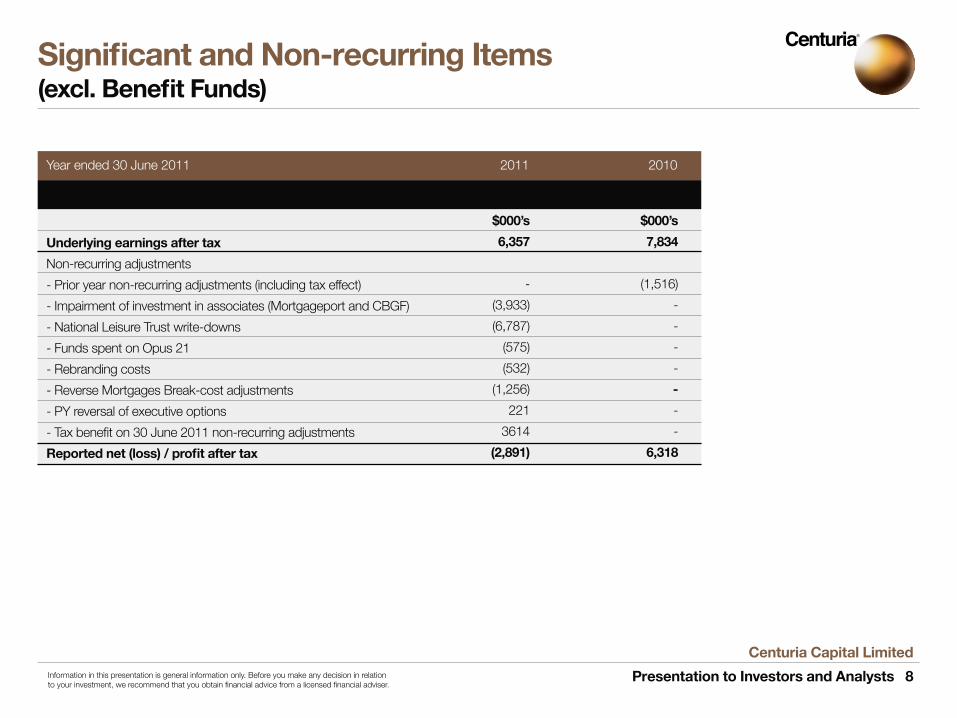
,
Underlying earnings after tax
Non-recurring adjustments
- Prior year non-recurring adjustments (including tax effect)
- Impairment of investment in associates (Mortgageport and CBGF)
- National Leisure Trust write-downs
- Funds spent on Opus 21
- Rebranding costs
- Reverse Mortgages Break-cost adjustments
- PY reversal of executive options
- Tax benefit on 30 June 2011 non-recurring adjustments
Reported net (loss) / profit after tax
$000’s
7,834
(1,516)
-
-
-
-
-
-
-
6,318
2010
$000’s
6,357
-
(3,933)
(6,787)
(575)
(532)
(1,256)
221
3614
(2,891)
2011Year ended 30 June 2011
Significant and Non-recurring Items(excl. Benefit Funds)
Centuria Capital Limited
Presentation to Investors and Analysts 9Information in this presentation is general information only. Before you make any decision in relation to your investment, we recommend that you obtain financial advice from a licensed financial adviser.
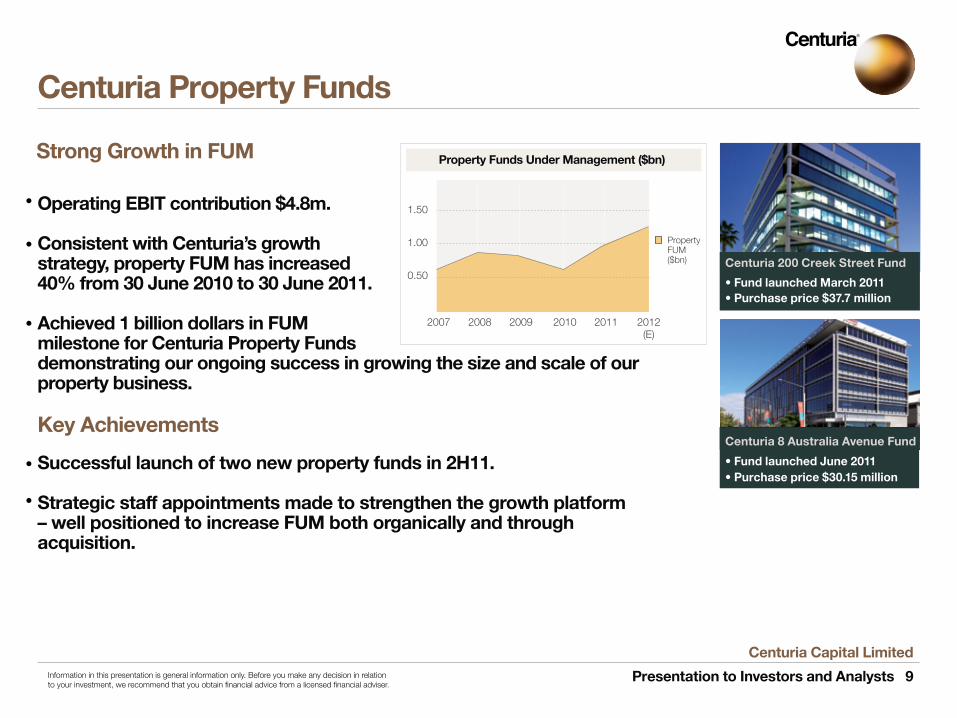
Operating EBIT contribution $4.8m.
Consistent with Centuria’s growth strategy, property FUM has increased 40% from 30 June 2010 to 30 June 2011. Achieved 1 billion dollars in FUMmilestone for Centuria Property Funds demonstrating our ongoing success in growing the size and scale of our property business.
Key Achievements
Successful launch of two new property funds in 2H11.
Strategic staff appointments made to strengthen the growth platform – well positioned to increase FUM both organically and through acquisition.
Strong Growth in FUM
Centuria 8 Australia Avenue Fund
Centuria 200 Creek Street Fund
• Fund launched March 2011 • Purchase price $37.7 million
• Fund launched June 2011 • Purchase price $30.15 million
1.50
1.00
0.50
PropertyFUM($bn)
2007 2008 2009 2010 2011 2012(E)
Property Funds Under Management ($bn)
Centuria Property Funds
Centuria Capital Limited
Presentation to Investors and Analysts 10Information in this presentation is general information only. Before you make any decision in relation to your investment, we recommend that you obtain financial advice from a licensed financial adviser.
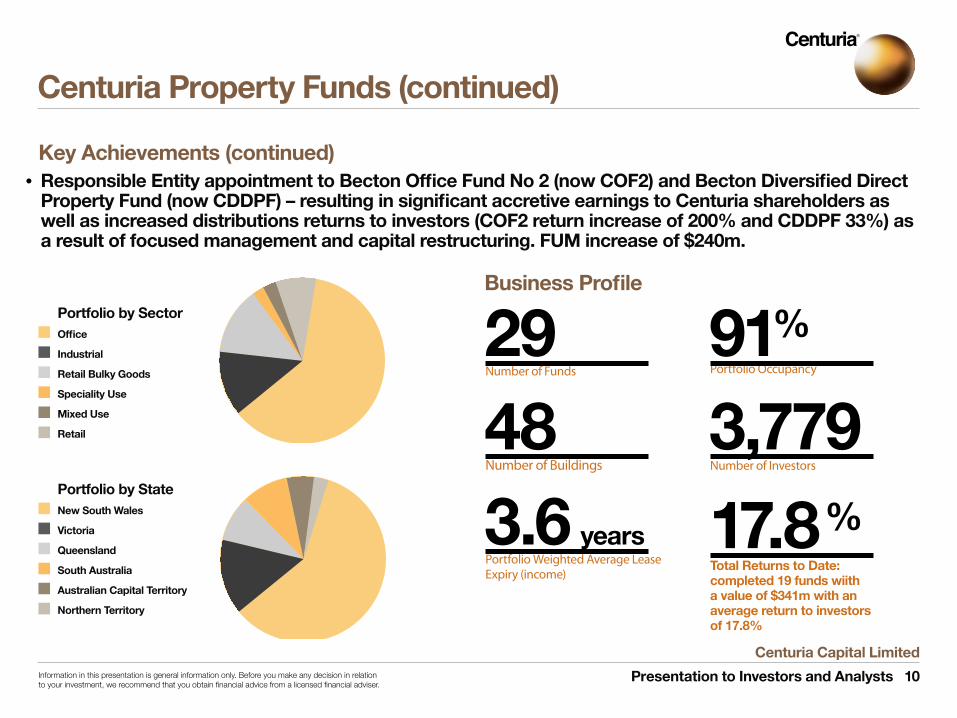
29Number of Funds
48Number of Buildings
3.6 yearsPortfolio Weighted Average Lease Expiry (income)
3,779Number of Investors
91Portfolio Occupancy
%
17.8Total Returns to Date: completed 19 funds wiith a value of $341m with an average return to investors of 17.8%
%
Key Achievements (continued)
Business Profile
Responsible Entity appointment to Becton Office Fund No 2 (now COF2) and Becton Diversified Direct Property Fund (now CDDPF) – resulting in significant accretive earnings to Centuria shareholders as well as increased distributions returns to investors (COF2 return increase of 200% and CDDPF 33%) as a result of focused management and capital restructuring. FUM increase of $240m.
Portfolio by SectorOffice
Industrial
Retail Bulky Goods
Speciality Use
Mixed Use
Retail
Portfolio by StateNew South Wales
Victoria
Queensland
South Australia
Australian Capital Territory
Northern Territory
Centuria Property Funds (continued)
Centuria Capital Limited
Presentation to Investors and Analysts 11Information in this presentation is general information only. Before you make any decision in relation to your investment, we recommend that you obtain financial advice from a licensed financial adviser.
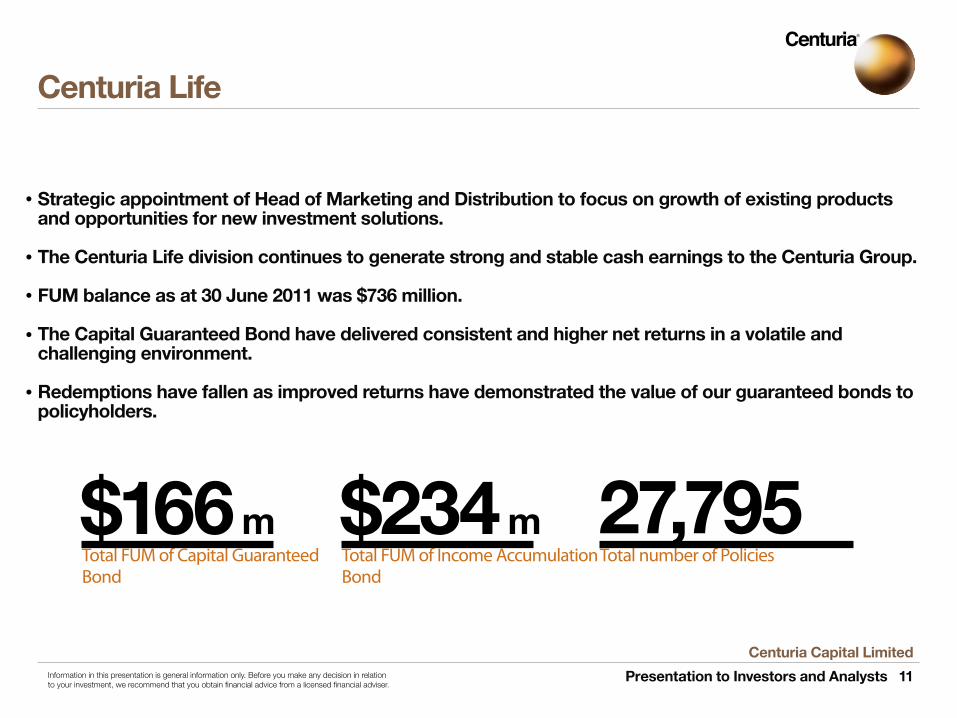
Strategic appointment of Head of Marketing and Distribution to focus on growth of existing products and opportunities for new investment solutions.
The Centuria Life division continues to generate strong and stable cash earnings to the Centuria Group.
FUM balance as at 30 June 2011 was $736 million.
The Capital Guaranteed Bond have delivered consistent and higher net returns in a volatile and challenging environment.
Redemptions have fallen as improved returns have demonstrated the value of our guaranteed bonds to policyholders.
$166 mTotal FUM of Capital Guaranteed Bond
$234 mTotal FUM of Income Accumulation Bond
27,795Total number of Policies
Centuria Life
Centuria Capital Limited
Presentation to Investors and Analysts 12Information in this presentation is general information only. Before you make any decision in relation to your investment, we recommend that you obtain financial advice from a licensed financial adviser.
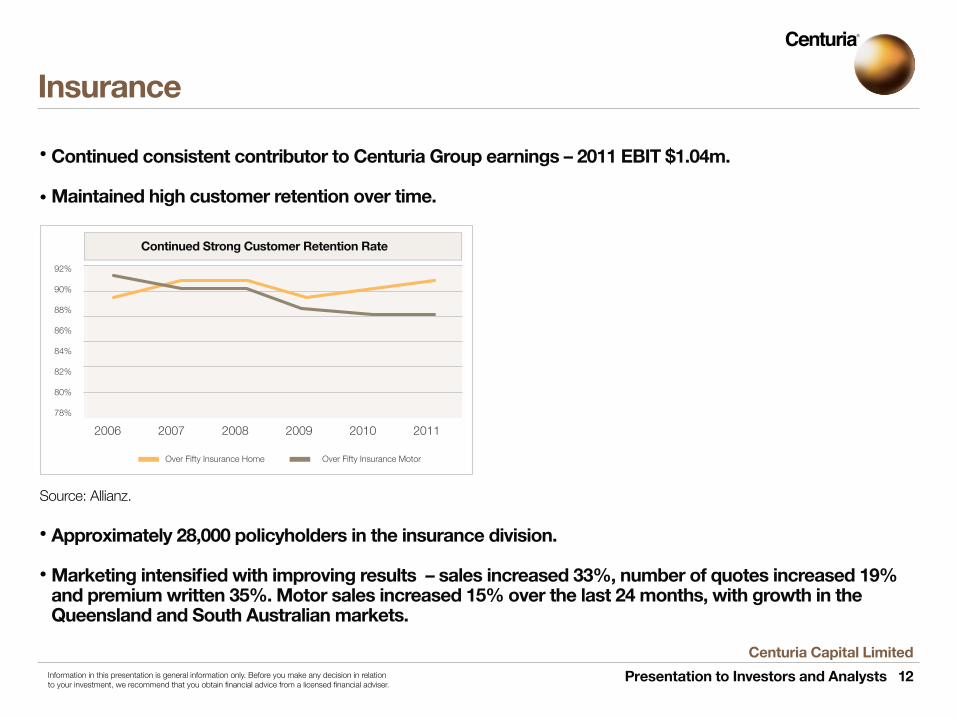
Insurance
92%
90%
88%
86%
84%
82%
80%
78%
Continued Strong Customer Retention Rate
Over Fifty Insurance Home Over Fifty Insurance Motor
2006 2007 2008 2009 2010 2011
Continued consistent contributor to Centuria Group earnings – 2011 EBIT $1.04m.
Maintained high customer retention over time.
Approximately 28,000 policyholders in the insurance division.
Marketing intensified with improving results – sales increased 33%, number of quotes increased 19% and premium written 35%. Motor sales increased 15% over the last 24 months, with growth in the Queensland and South Australian markets.
Source: Allianz.
Centuria Capital Limited
Presentation to Investors and Analysts 13Information in this presentation is general information only. Before you make any decision in relation to your investment, we recommend that you obtain financial advice from a licensed financial adviser.
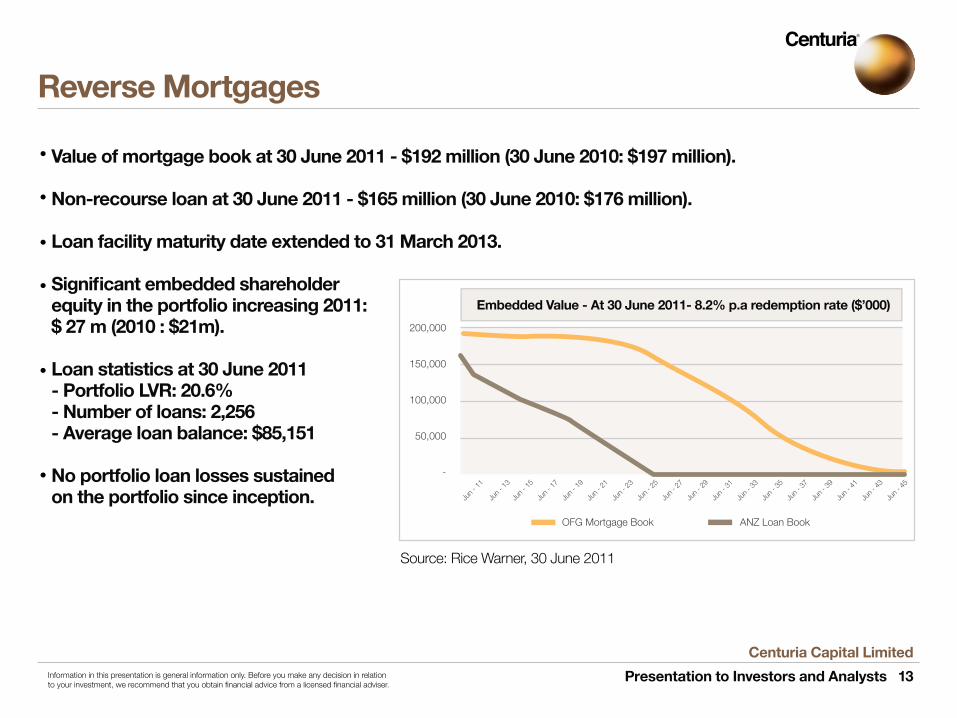
Reverse Mortgages
Value of mortgage book at 30 June 2011 - $192 million (30 June 2010: $197 million).
Non-recourse loan at 30 June 2011 - $165 million (30 June 2010: $176 million).
Loan facility maturity date extended to 31 March 2013.
Significant embedded shareholder equity in the portfolio increasing 2011: $ 27 m (2010 : $21m).
Loan statistics at 30 June 2011- Portfolio LVR: 20.6%- Number of loans: 2,256- Average loan balance: $85,151
No portfolio loan losses sustained on the portfolio since inception.
200,000
150,000
100,000
50,000
-
Jun -
11
Jun -
13
Jun -
15
Jun -
17
Jun -
19
Jun -
21
Jun -
23
Jun -
25
Jun -
27
Jun -
29
Jun -
31
Jun -
33
Jun -
35
Jun -
37
Jun -
39
Jun -
41
Jun -
43
Jun -
45
Embedded Value - At 30 June 2011- 8.2% p.a redemption rate ($’000)
ANZ Loan BookOFG Mortgage Book
Source: Rice Warner, 30 June 2011
Centuria Capital Limited
Presentation to Investors and Analysts 14Information in this presentation is general information only. Before you make any decision in relation to your investment, we recommend that you obtain financial advice from a licensed financial adviser.
12-month Outlook
Centuria businesses are increasingly well positioned to benefit from future growth
Strength in diversity
Balance sheet positioned for growth
Improving market presence
Property specialist
Financial Services
Ongoing volatility in financial markets will create weaker asset prices and further accretive acquisition opportunities.
Core strength in diversification of our income streams.
Low corporate gearing – 8.9% (excluding non recourse debt and convertible notes).
Continue to leverage our PR and marketing investment to attract new equity and distribution channels.
Significant expertise in property investment in a market with fewer competitors.
Continued investment in our people to enable us to expand across new funds.
Expand distribution of existing products.
Centuria Capital Limited
Presentation to Investors and Analysts 15Information in this presentation is general information only. Before you make any decision in relation to your investment, we recommend that you obtain financial advice from a licensed financial adviser.
Future Growth
Centuria Capital is currently implementing an aggressive growth strategy to take advantage of acquisition opportunities in the current market.
Centuria Capital has been, and is currently reviewing a number of potential corporate or funds management acquisition opportunities.
Growth in FUM – target is to grow FUM to $3bn by December 2013 through both organic growth and acquisitions.
Expand our distribution networks.
Rebrand our investment bond products.
Identify financial solutions and product relevancy to increase inflows.
Centuria Property Funds
Centuria Life
Centuria Capital Limited
Presentation to Investors and Analysts 16Information in this presentation is general information only. Before you make any decision in relation to your investment, we recommend that you obtain financial advice from a licensed financial adviser.
The “Statutory Accounts” show the consolidated corporate entities including the Benefit Funds which Centuria is required under AIFRS to consolidate.
The “Benefit Funds” reflect value of stand alone policy holder funds.
The “Corporate Accounts” reflect the value and performance of Centuria shareholder funds.
Numbers in the following reconciliations may differ slightly from the Annual Report however this is due to rounding of numbers.
General comment on statutory account reconciliation
AppendicesStatutory Account Reconciliations
Centuria Capital Limited
Presentation to Investors and Analysts 17Information in this presentation is general information only. Before you make any decision in relation to your investment, we recommend that you obtain financial advice from a licensed financial adviser.
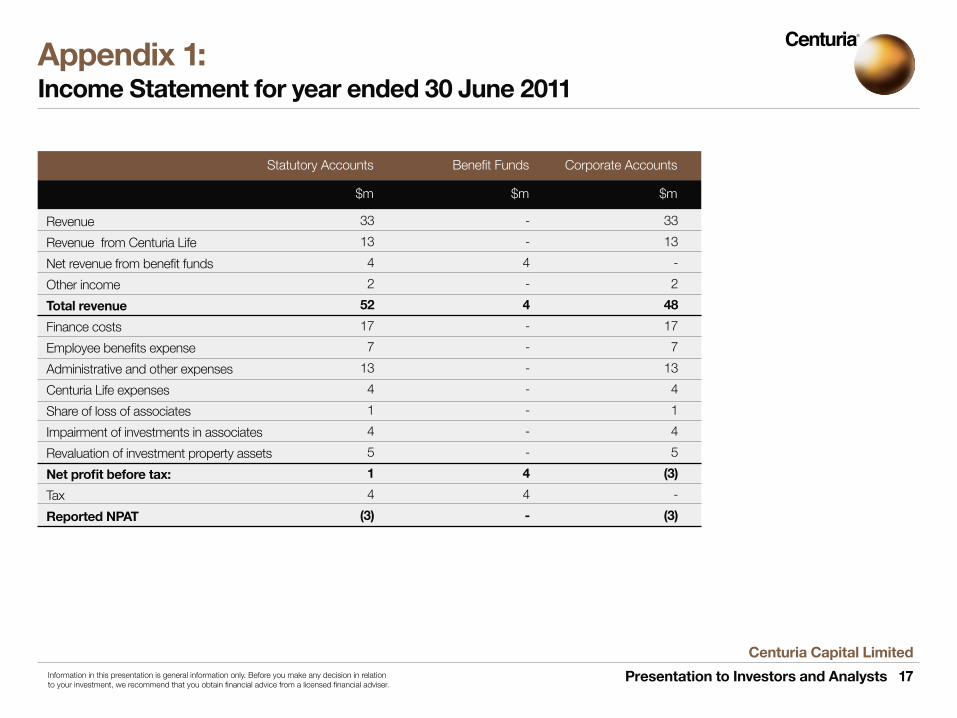
Revenue
Revenue from Centuria Life
Net revenue from benefit funds
Other income
Total revenue
Finance costs
Employee benefits expense
Administrative and other expenses
Centuria Life expenses
Share of loss of associates
Impairment of investments in associates
Revaluation of investment property assets
Net profit before tax:
Tax
Reported NPAT
33
13
-
2
48
17
7
13
4
1
4
5
(3)
-
(3)
Corporate Accounts
$m
-
-
4
-
4
-
-
-
-
-
-
-
4
4
-
Benefit Funds
$m
33
13
4
2
52
17
7
13
4
1
4
5
1
4
(3)
Statutory Accounts
$m
Appendix 1: Income Statement for year ended 30 June 2011
Centuria Capital Limited
Presentation to Investors and Analysts 18Information in this presentation is general information only. Before you make any decision in relation to your investment, we recommend that you obtain financial advice from a licensed financial adviser.
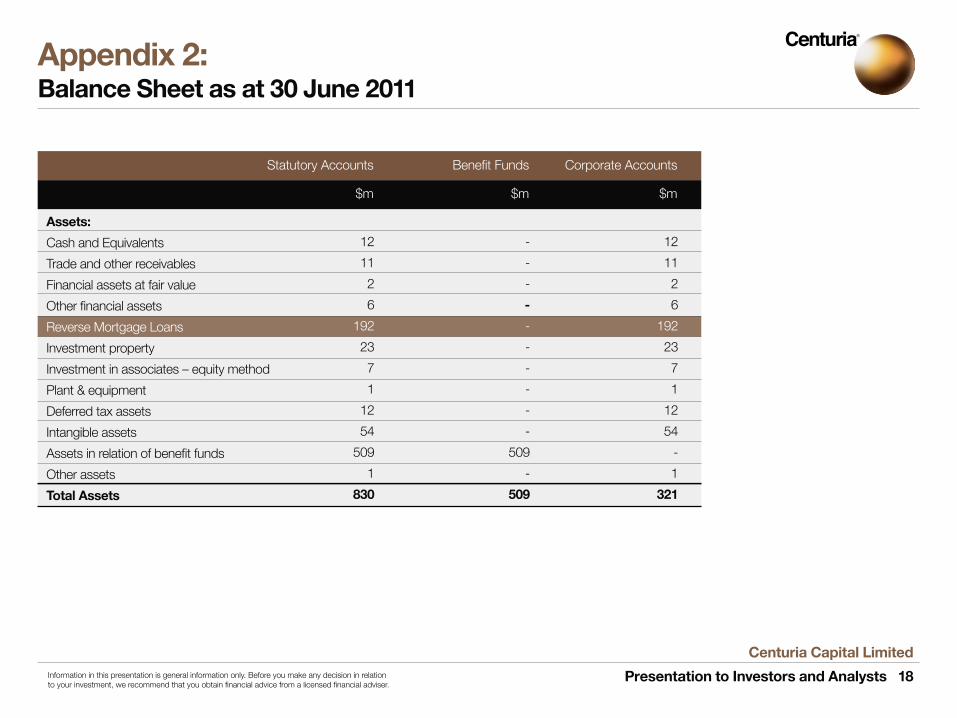
Assets:
Cash and Equivalents
Trade and other receivables
Financial assets at fair value
Other financial assets
Reverse Mortgage Loans
Investment property
Investment in associates – equity method
Plant & equipment
Deferred tax assets
Intangible assets
Assets in relation of benefit funds
Other assets
Total Assets
12
11
2
6
192
23
7
1
12
54
-
1
321
Corporate Accounts
$m
-
-
-
-
-
-
-
-
-
-
509
-
509
Benefit Funds
$m
12
11
2
6
192
23
7
1
12
54
509
1
830
Statutory Accounts
$m
Appendix 2: Balance Sheet as at 30 June 2011
Centuria Capital Limited
Presentation to Investors and Analysts 19Information in this presentation is general information only. Before you make any decision in relation to your investment, we recommend that you obtain financial advice from a licensed financial adviser.
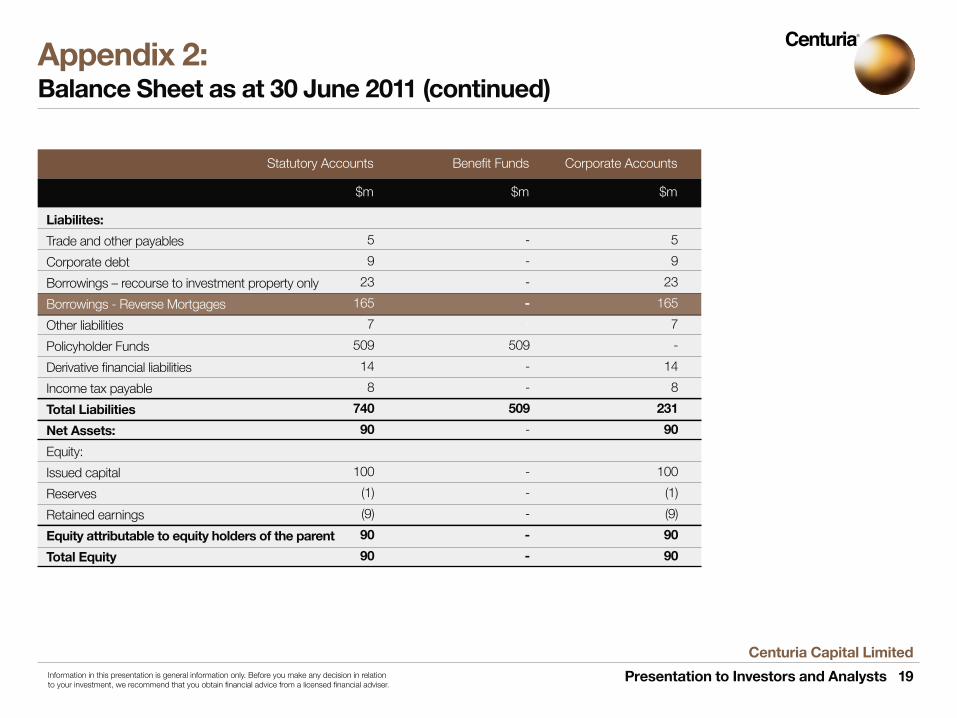
Liabilites:
Trade and other payables
Corporate debt
Borrowings – recourse to investment property only
Borrowings - Reverse Mortgages
Other liabilities
Policyholder Funds
Derivative financial liabilities
Income tax payable
Total Liabilities
Net Assets:
Equity:
Issued capital
Reserves
Retained earnings
Equity attributable to equity holders of the parent
Total Equity
5
9
23
165
7
-
14
8
231
90
100
(1)
(9)
90
90
Corporate Accounts
$m
-
-
-
-
-
509
-
-
509
-
-
-
-
-
-
Benefit Funds
$m
5
9
23
165
7
509
14
8
740
90
100
(1)
(9)
90
90
Statutory Accounts
$m
Appendix 2: Balance Sheet as at 30 June 2011 (continued)
Centuria Capital Limited
Presentation to Investors and Analysts 20Information in this presentation is general information only. Before you make any decision in relation to your investment, we recommend that you obtain financial advice from a licensed financial adviser.
)
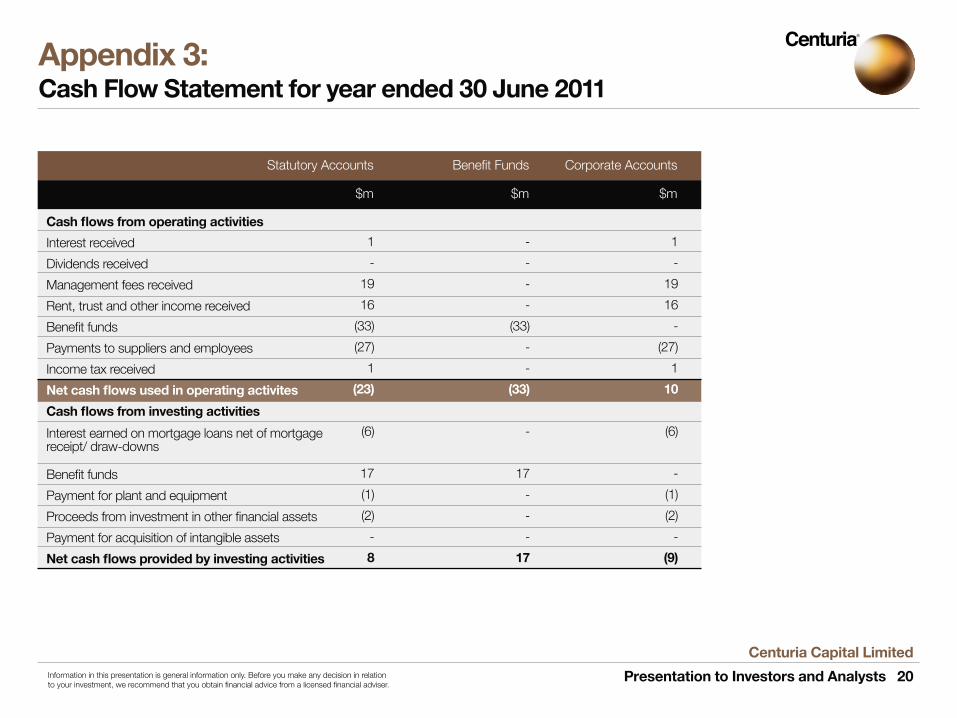
Cash flows from operating activities
Interest received
Dividends received
Management fees received
Rent, trust and other income received
Benefit funds
Payments to suppliers and employees
Income tax received
Net cash flows used in operating activites
Cash flows from investing activities
Benefit funds
Payment for plant and equipment
Proceeds from investment in other financial assets
Payment for acquisition of intangible assets
Net cash flows provided by investing activities
1
-
19
16
-
(27)
1
10
(6)
-
(1)
(2)
-
(9)
Corporate Accounts
$m
-
-
-
-
(33)
-
-
(33)
-
17
-
-
-
17
Benefit Funds
$m
1
-
19
16
(33)
(27)
1
(23)
(6)
17
(1)
(2)
-
8
Statutory Accounts
$m
Interest earned on mortgage loans net of mortgage receipt/ draw-downs
Appendix 3: Cash Flow Statement for year ended 30 June 2011
Centuria Capital Limited
Presentation to Investors and Analysts 21Information in this presentation is general information only. Before you make any decision in relation to your investment, we recommend that you obtain financial advice from a licensed financial adviser.
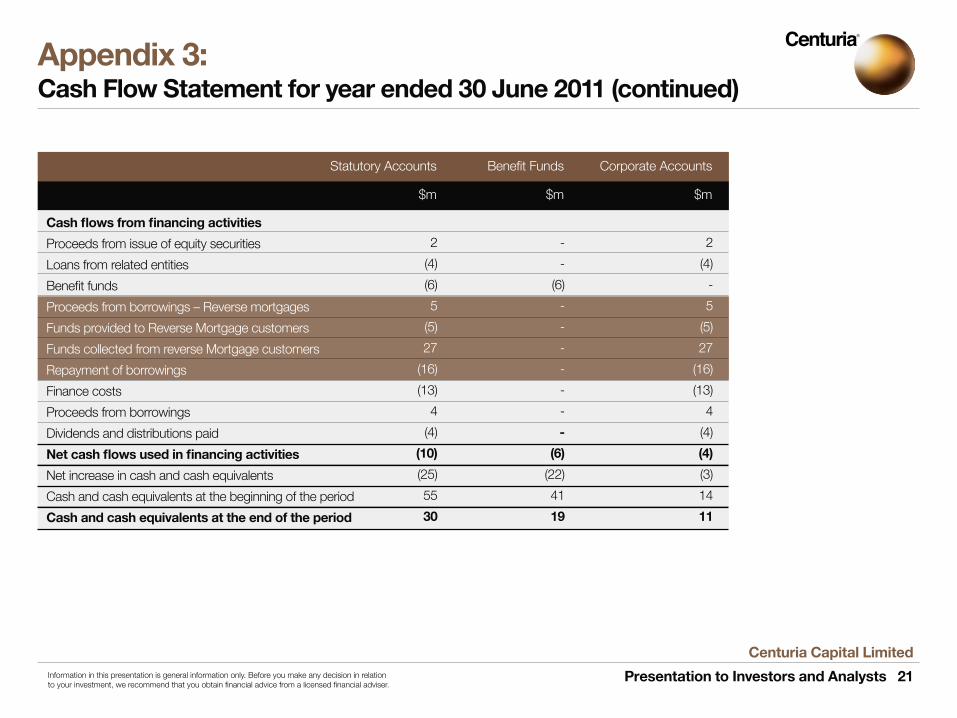
Cash flows from financing activities
Proceeds from issue of equity securities
Loans from related entities
Benefit funds
Proceeds from borrowings – Reverse mortgages
Funds provided to Reverse Mortgage customers
Funds collected from reverse Mortgage customers
Repayment of borrowings
Finance costs
Proceeds from borrowings
Dividends and distributions paid
Net cash flows used in financing activities
Net increase in cash and cash equivalents
Cash and cash equivalents at the beginning of the period
Cash and cash equivalents at the end of the period
2
(4)
-
5
(5)
27
(16)
(13)
4
(4)
(4)
(3)
14
11
Corporate Accounts
$m
-
-
(6)
-
-
-
-
-
-
-
(6)
(22)
41
19
Benefit Funds
$m
2
(4)
(6)
5
(5)
27
(16)
(13)
4
(4)
(10)
(25)
55
30
Statutory Accounts
$m
Appendix 3: Cash Flow Statement for year ended 30 June 2011 (continued)
Centuria Capital Limited
Presentation to Investors and Analysts 22Information in this presentation is general information only. Before you make any decision in relation to your investment, we recommend that you obtain financial advice from a licensed financial adviser.
This document has been issued by Centuria Capital Limited ABN 22 095 454 336 and contains general information about Centuria Capital Limited and its related bodies corporate (“Centuria”) which is current as at 19 August 2011.
The information in this document is in summary form and does not purport to be complete. Due to the impact of rounding, the totals shown for charts, graphs or tables in this document may not equate to the sum of the individual components of the relevant chart, graph or table. Accordingly, it should be read in conjunction with all other information concerning Centuria filed with the Australian Securities Exchange.
The document has been prepared from information believed to be accurate, however, no representation or warranty is made as to the accuracy or adequacy of any information contained in the document. To the extent permitted by law, Centuria, its related bodies corporate and their respective directors, officers and employees, exclude liability for any loss or damage resulting from the issue or use of, or reliance on, anything contained in or omitted from this document.
This document is not a recommendation or personal advice in relation to Centuria or any product or service offered by Centuria and does not take into account the investment objectives, financial situation or needs of any particular person. Past performance is not indicative of future performance.
To the extent this document contains prospective financial information, that information has been based on current expectations about future events and is, however, subject to risks, uncertainties and assumptions that could cause actual results to differ materially from expectations.
Disclaimer